1. Introduction
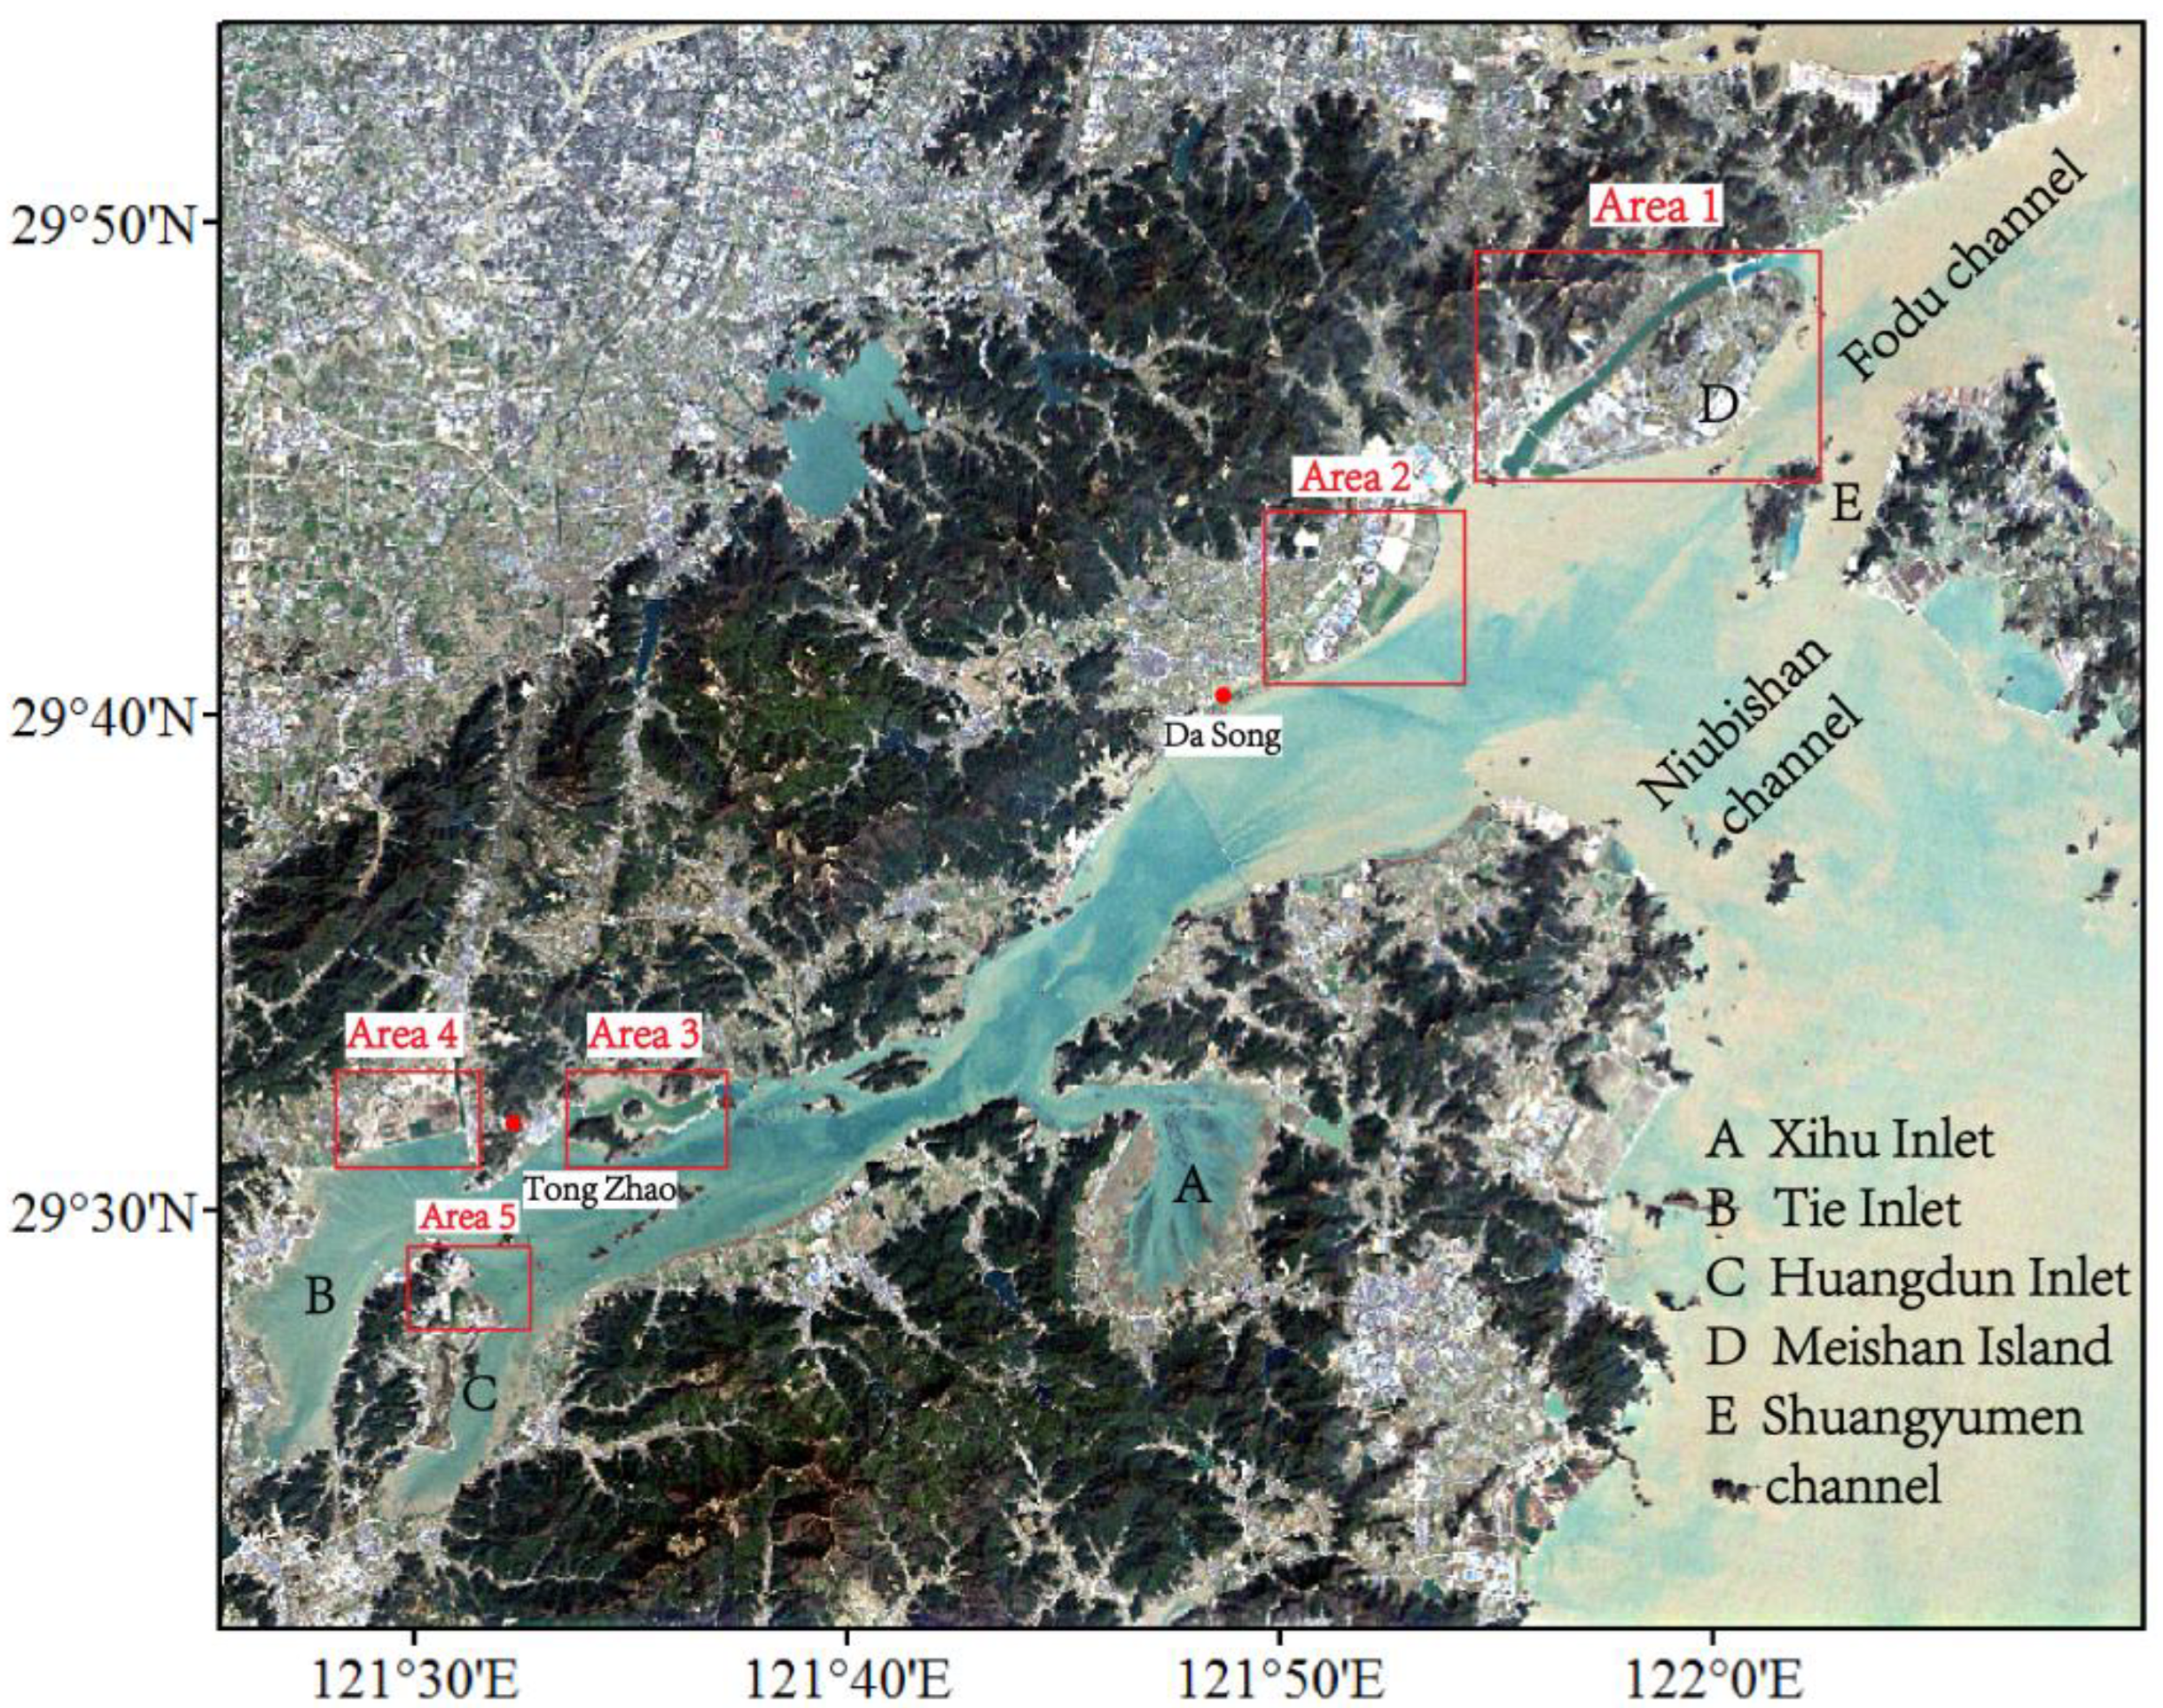
Xiangshan Bay is located on the eastern coast of Zhejiang Province in China, bordered by Sanmen Bay to the south and Hangzhou Bay to the north. It is a long-narrow bay stretching in the northeast–southwest direction, with its narrowest point measuring approximately 4 km. It has three significant channels connected to the open sea. The Fodu and Shuangyumen channels are connected to the Zhoushan Sea, whereas the Niubishan channel connects to the Damuyang Sea. Meanwhile, there are three secondary bays in Xiangshan Bay: the Xihu inlet, Tie inlet, and Huangdun inlet [
1]. The total length of the Xiangshan Bay’s coastline is about 390 km, with a distribution of natural and artificial coastlines.
The dynamic processes of tidal currents in Xiangshan Bay are considerably significant, serving as the primary propelling factors for the conveyances of nutrients and pollutants. The tides observed in Xiangshan Bay are categorized as irregular semi-diurnal shallow tides. Upon the ingress of the tidal wave into the bay inlet, the wave progressively transforms from a propagating wave to a stationary wave. This phenomenon can be attributed to the reflection that occurs as a result of the topographical and boundary features present in the area [
2,
3,
4].
In recent decades, the coastline of Xiangshan Bay has changed dramatically, mainly due to artificial reclamation. The areas with drastic changes are shown in
Figure 1, including Area 1 near Meishan Island, Area 2 on the east side of Dasong, Area 3 on the east side of Tongzhao, Area 4 on the north of Tie inlet, and Area 5 near Qiangjiao [
5].
Coastline changes have significant impacts on coastal hydrodynamics, with direct consequences for sediment transport, pollutant dispersion, and ecological processes [
6,
7,
8,
9]. Coastline change can alter the tidal current velocity [
10], alter the water and sediment transport processes [
11], and result in tidal amplitude variations [
12], e.g., a shift of the M
4 shallow water tidal line towards the shore, a weakening of the flood tide advantage, and a reduction in suspended sediment concentration in Wenzhou Coast, China [
13]. Understanding the complex interactions between coastline changes and hydrodynamics is crucial for effective coastal management and conservation efforts.
The accumulated influences of the coastline changes in Xiangshan Bay have been considered [
14]. However, the variations in small-scale hydrodynamics for each area have not been carefully studied, which have a more direct impact on local sediment erosion and deposition as well as the ecological environment.
In this study, we used the Finite-Volume Community Ocean Model (FVCOM) [
15] to set up a group of control experiments and five groups of comparative experiments corresponding to five areas with drastic changes in the coastline of Xiangshan Bay. We built a three-dimensional hydrodynamic model for Xiangshan Bay before and after the changes and examined the effects of coastline changes on the nearby waters’ hydrodynamic environment. The materials and methods are described in
Section 2. The results are analyzed in
Section 3, with conclusions presented in
Section 4.
2. Materials and Methods
2.1. Model Configuration
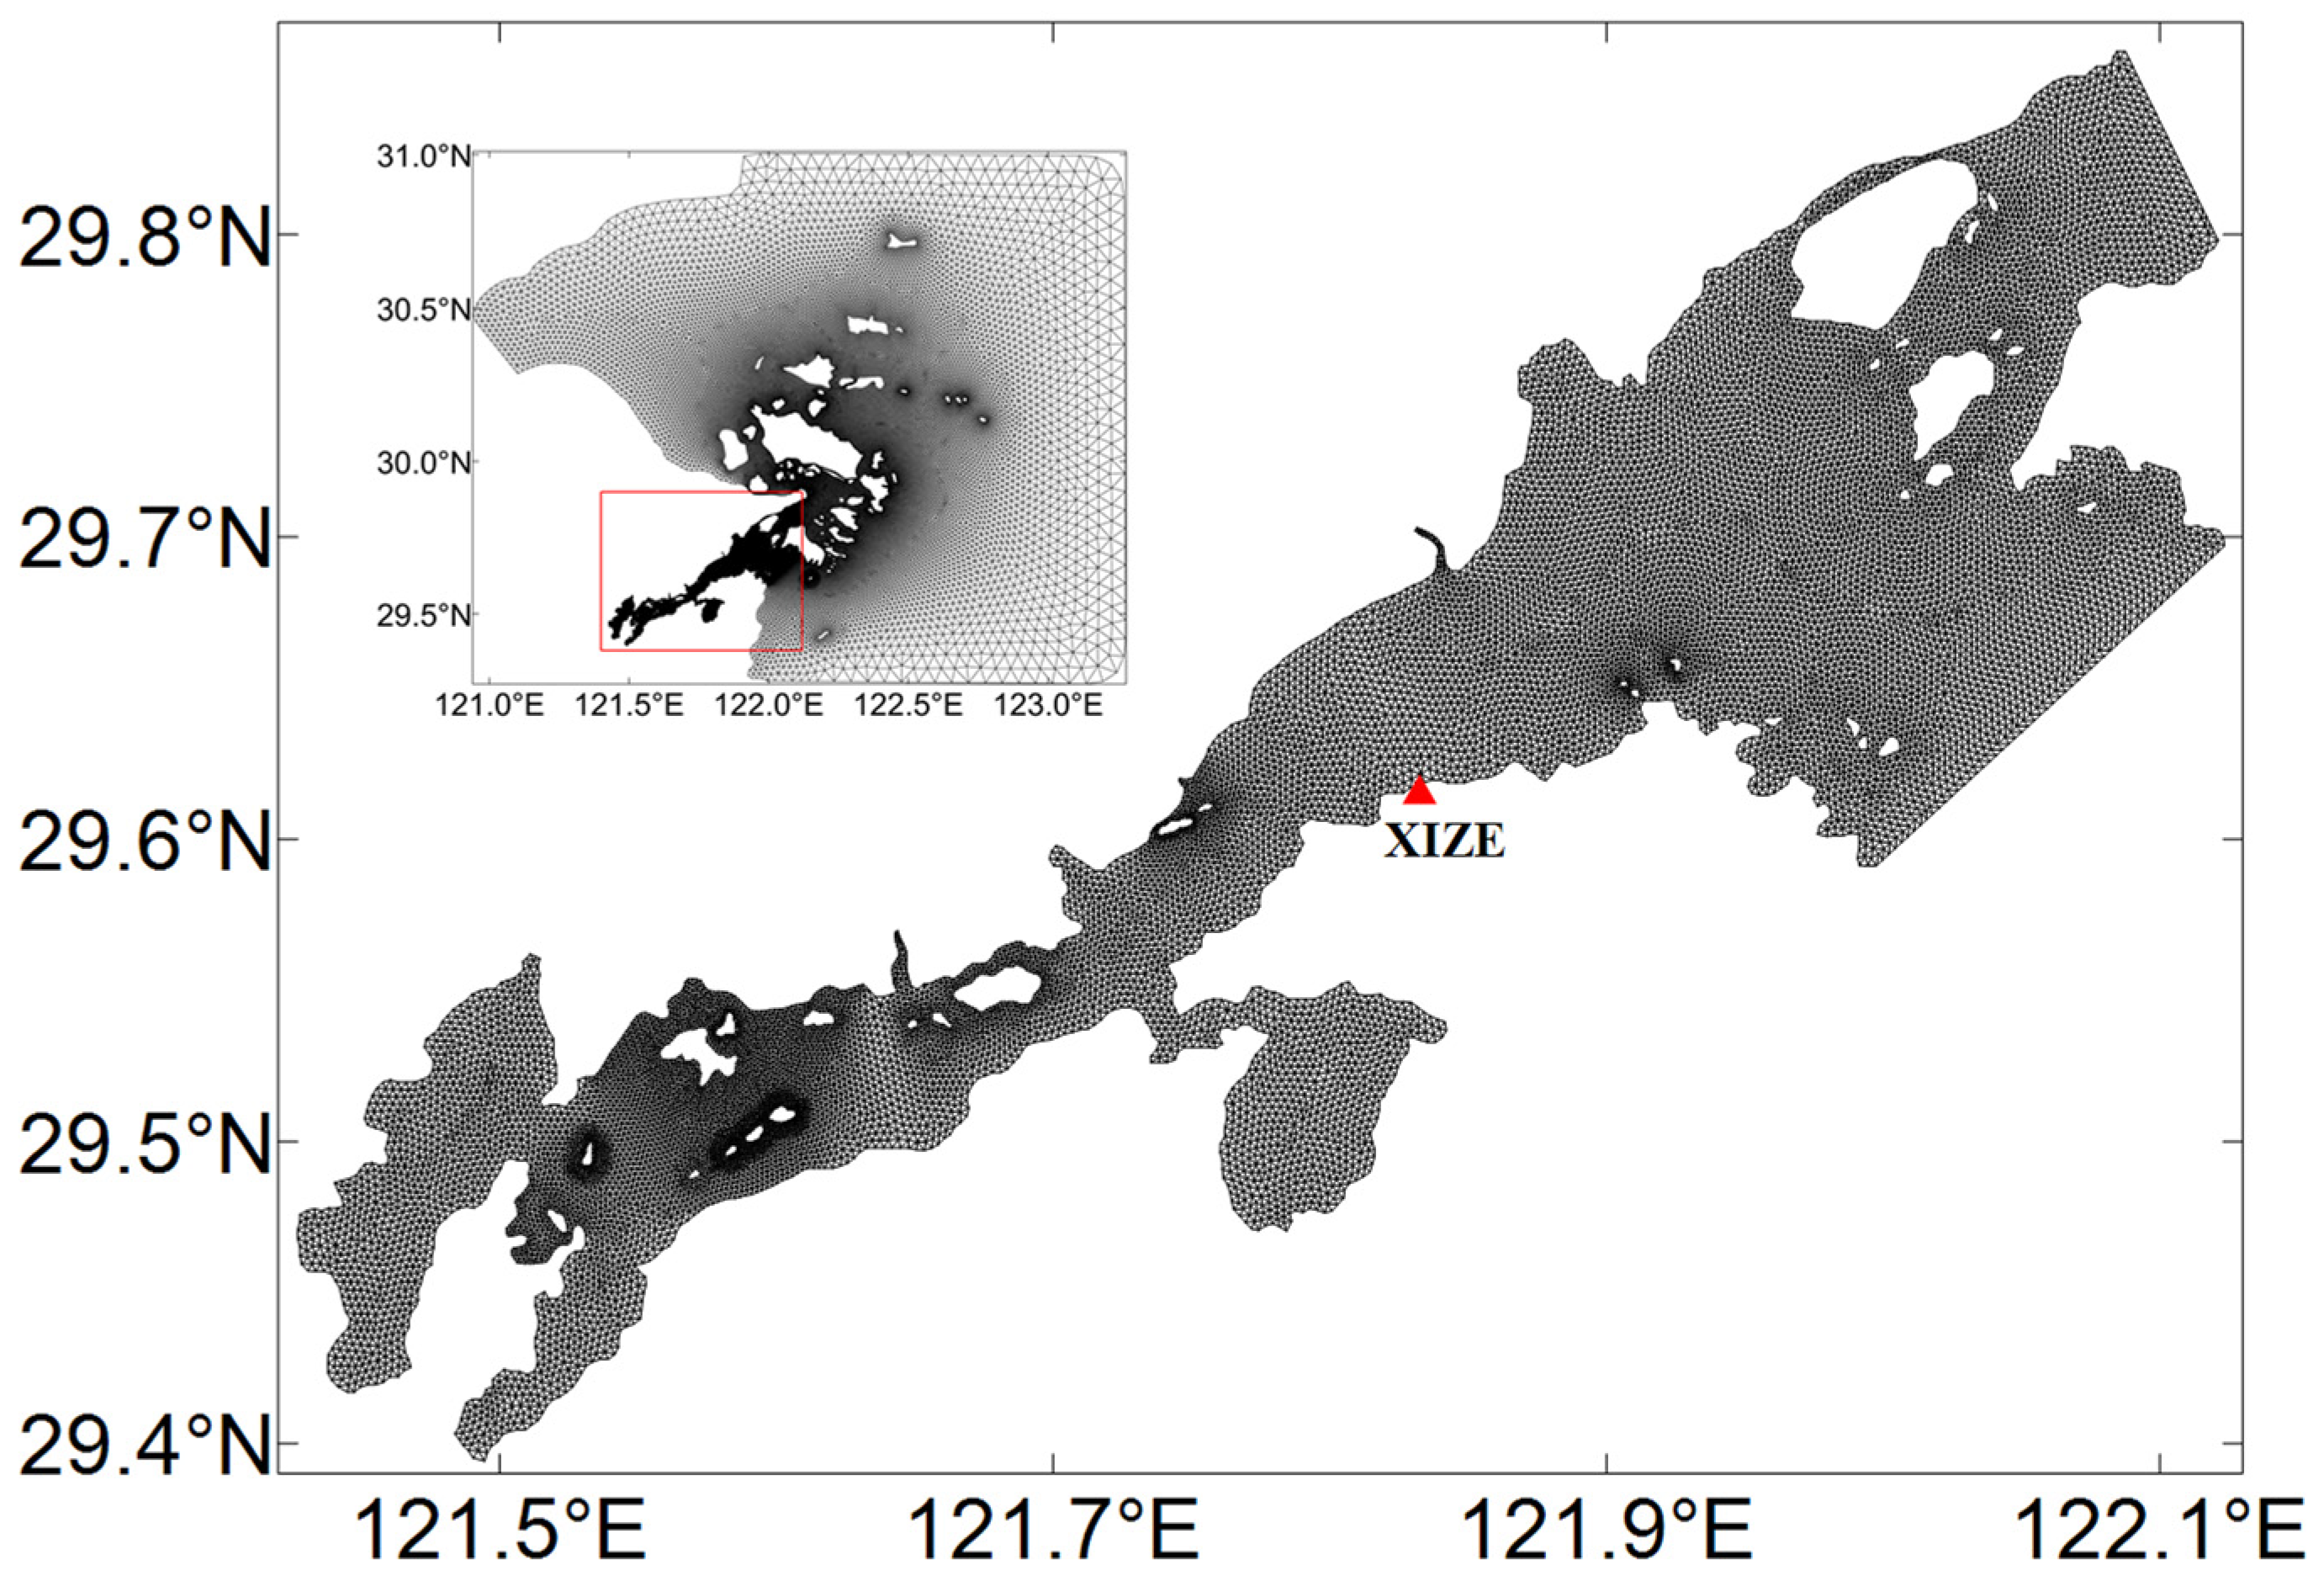
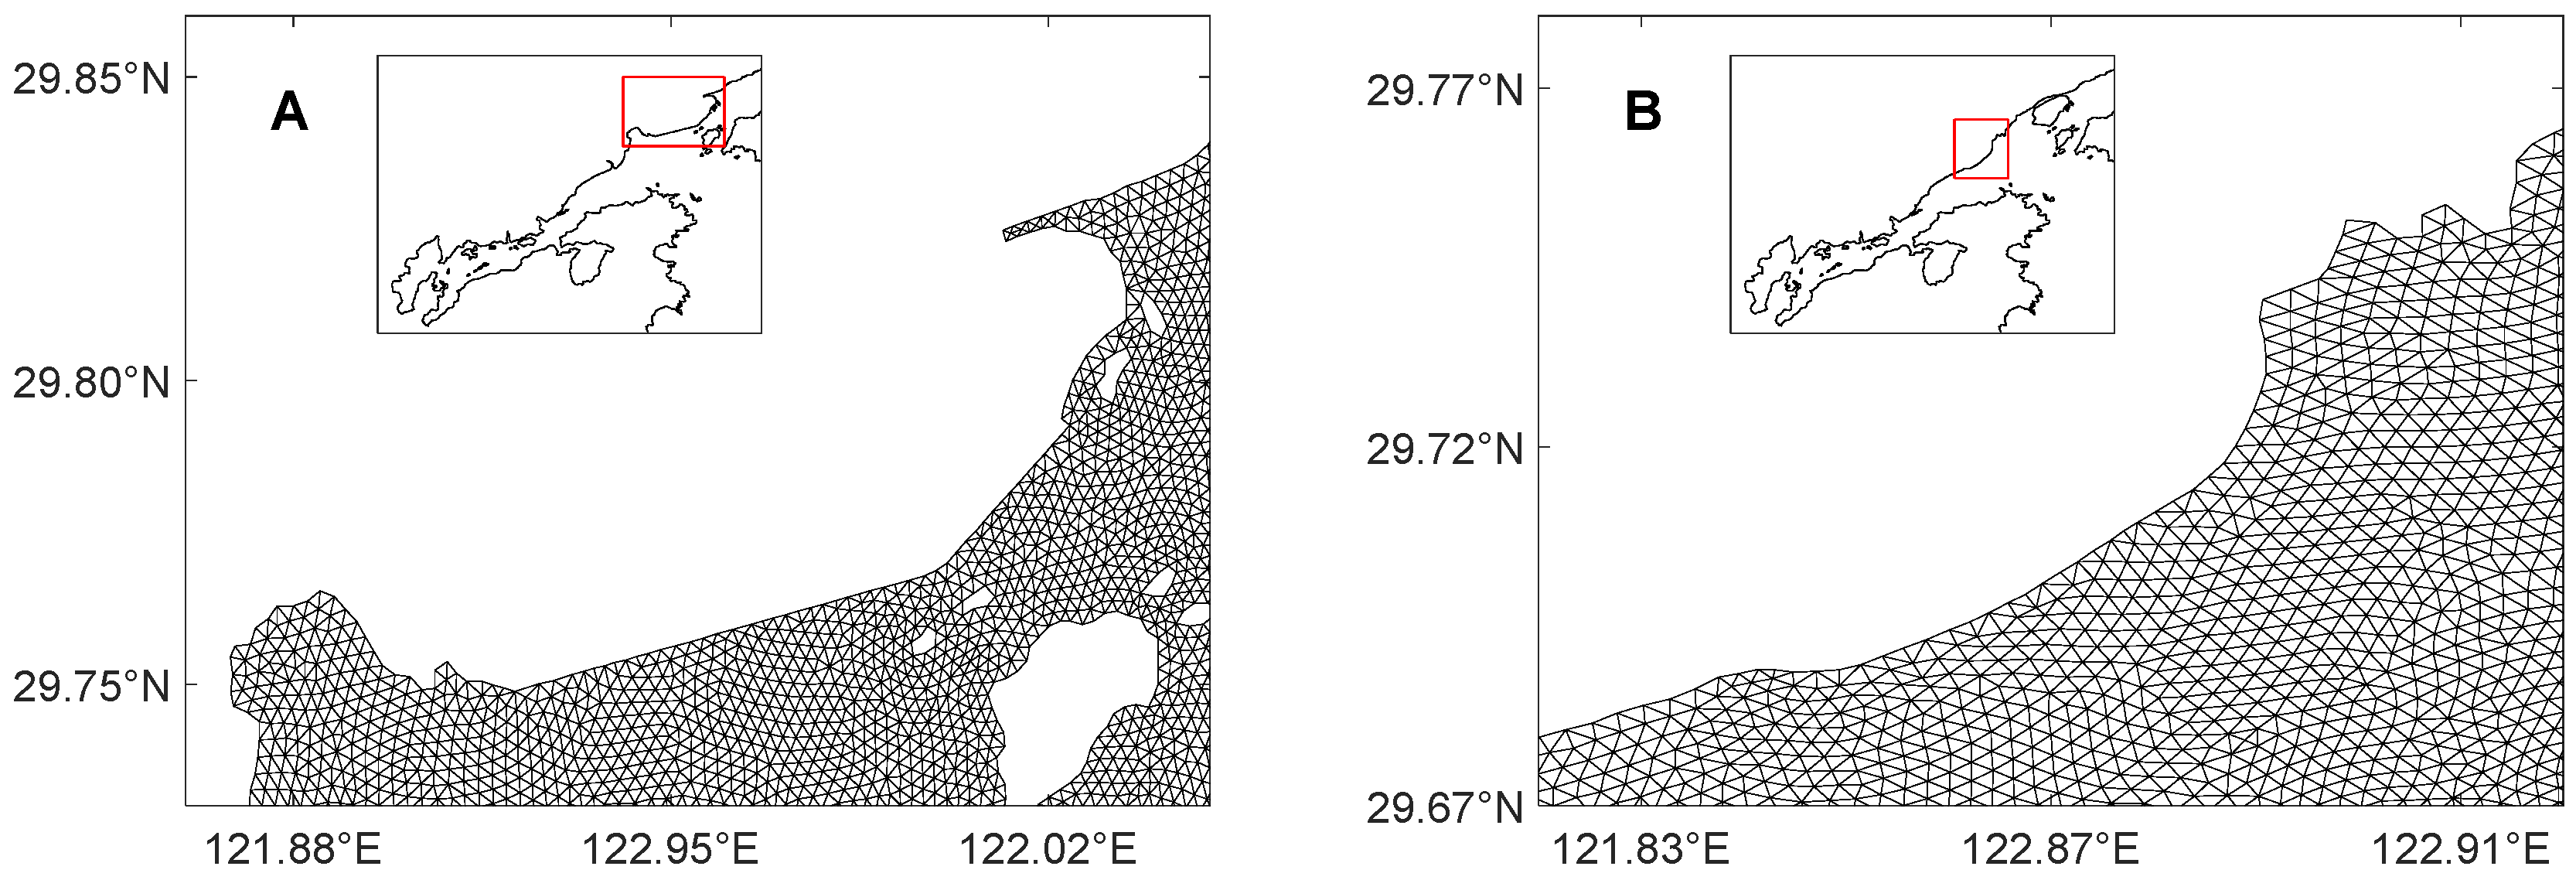
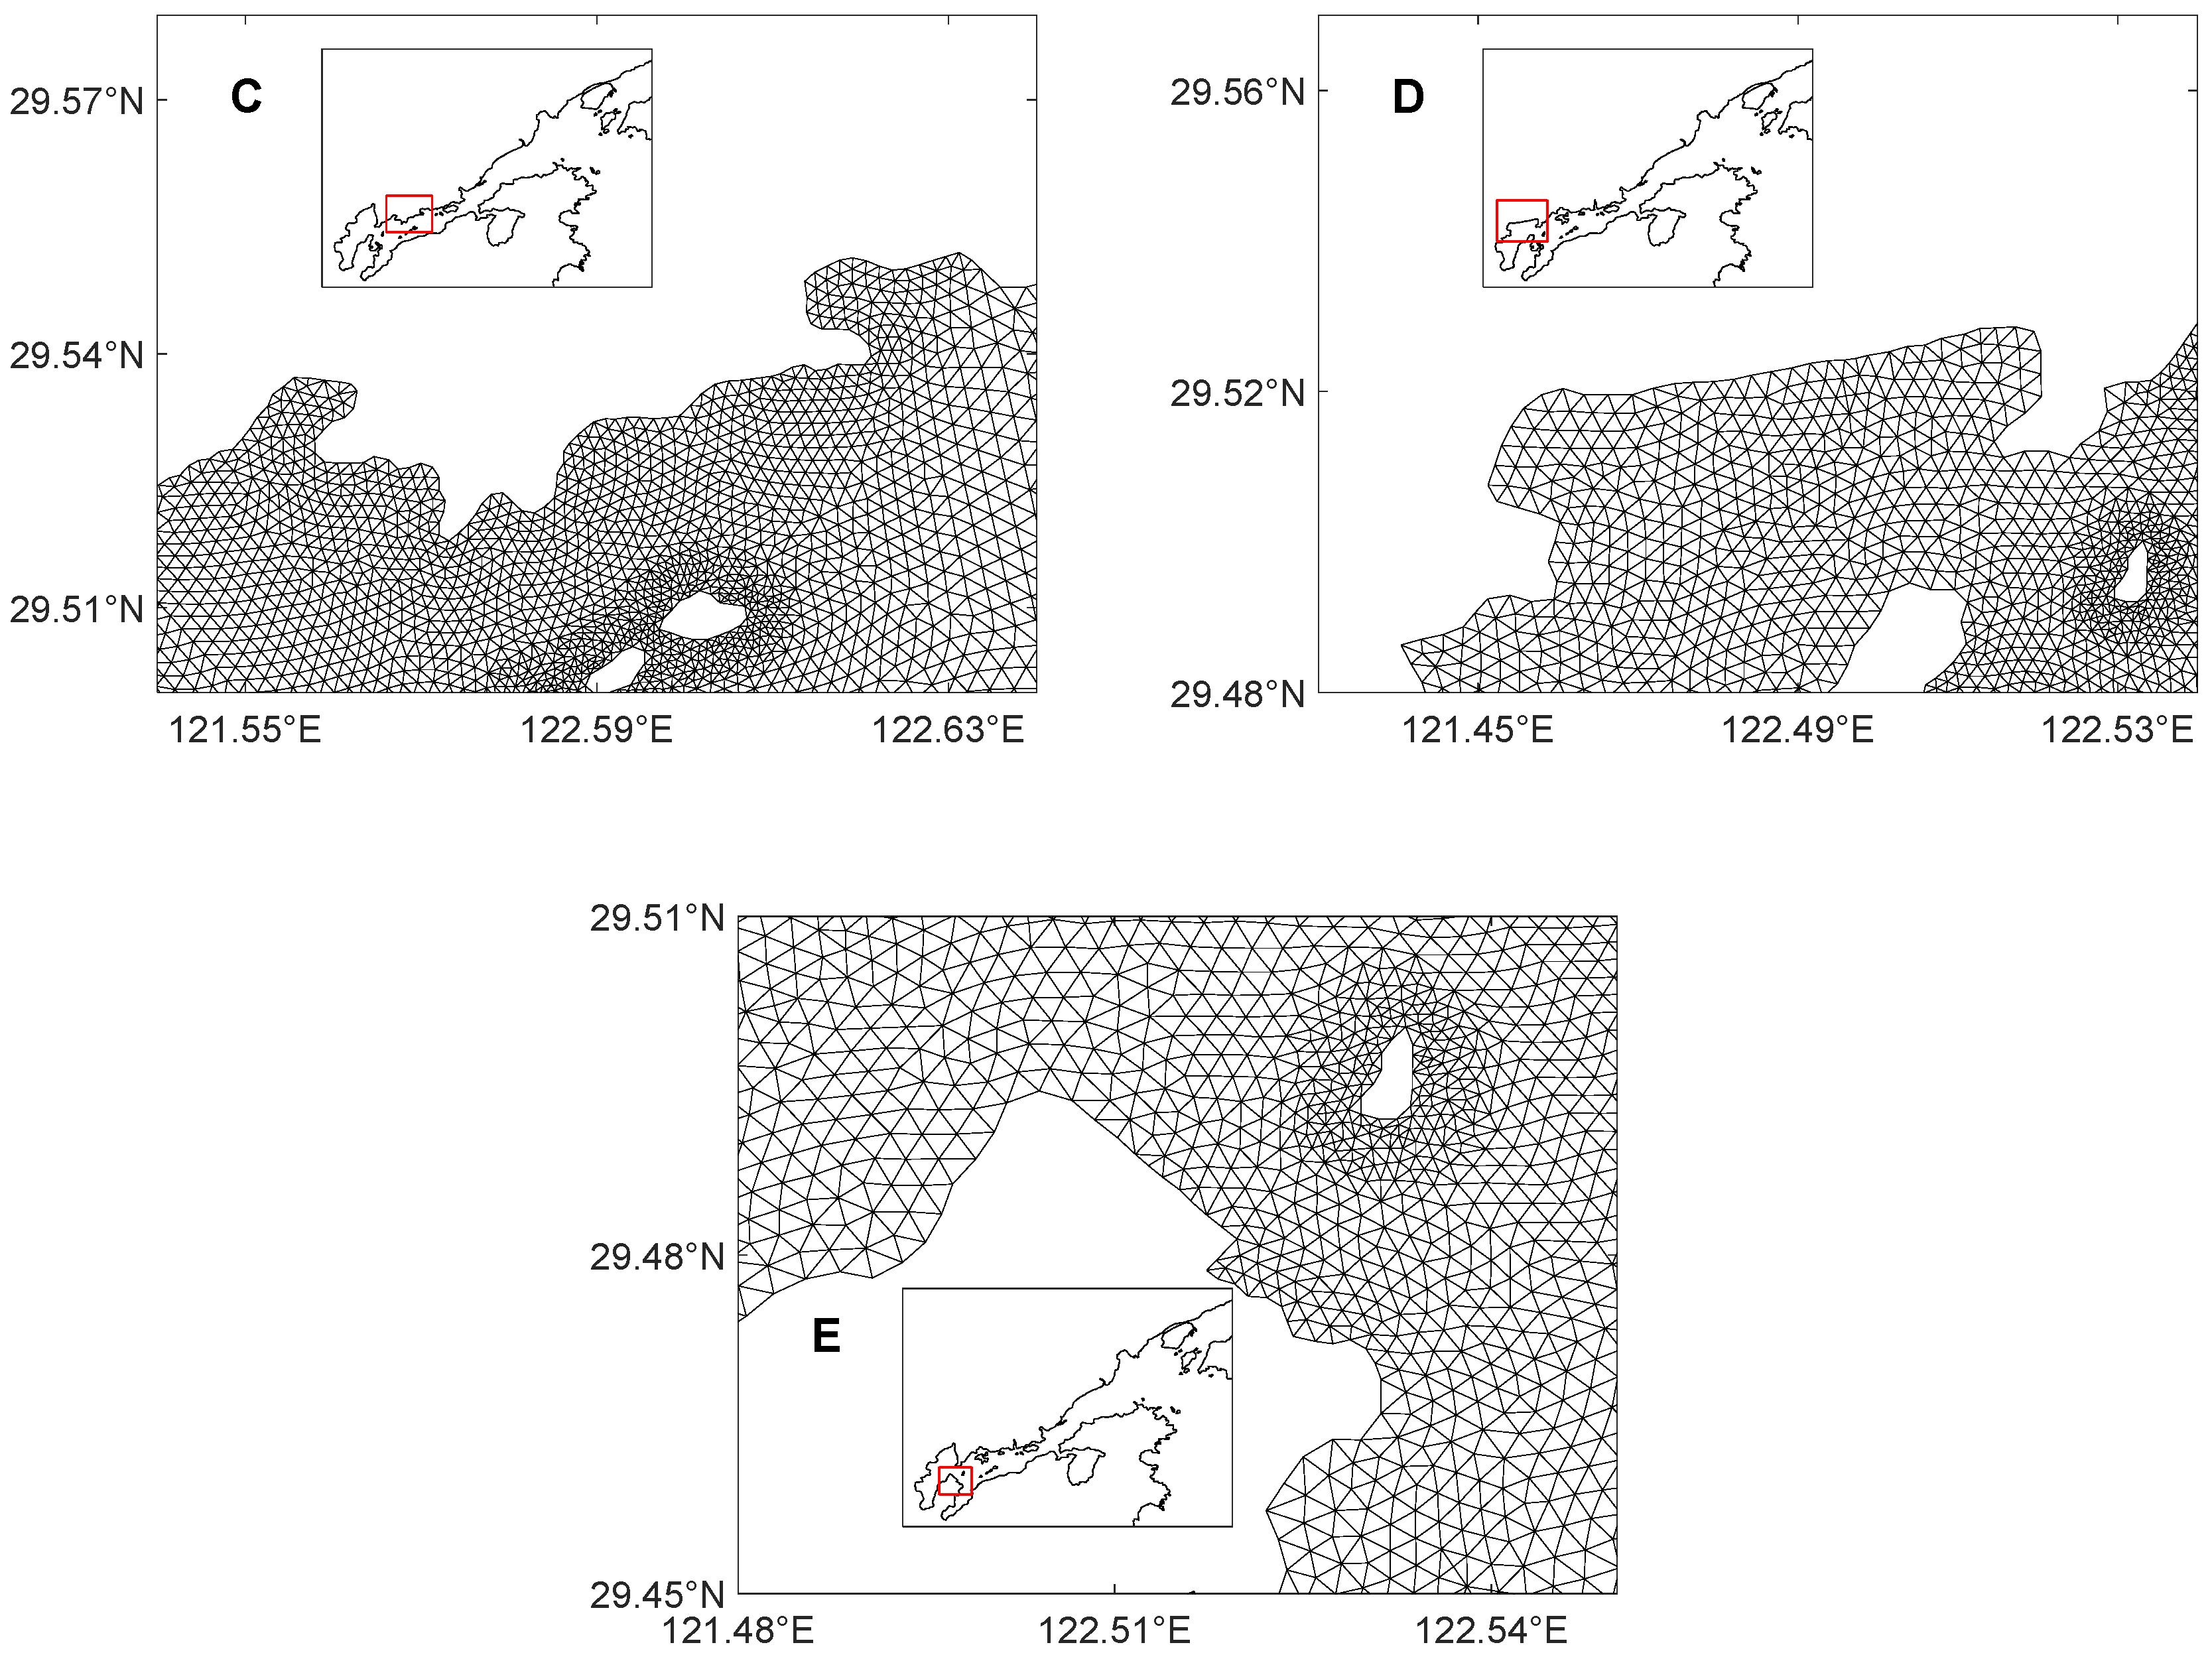
The FVCOM ocean model uses a triangular mesh that can accurately fit complex coastlines and numerous islands of the Xiangshan Bay area, which is conducive to the accurate simulation of real topography. At the same time, FVCOM uses a method to determine dry and wet grids, which can better simulate the situation of tidal flats in the Xiangshan Bay. The hydrodynamic model constructed in this study sets two open boundaries in the Fodu channel and Niubishan channel, respectively. Due to the complex terrains in areas with drastic changes in topographies, the coastline is densified in areas such as islands and coastal boundaries. This study sets up a group of control experiments and five groups of comparative experiments. The above grid of Xiangshan Bay was nested into a larger domain, covering the entire East China Sea (
Figure 2). In terms of experimental design for the control group, each of the comparative experimental groups only added or removed coastlines in different areas. Comparative experiment A targeted Area 1 near Meishan Island (
Figure 3A); Experiment B targeted Area 2 on the east side of Dasong (
Figure 3B); Experiment C targeted Area 3 on the east side of Tongzhao (
Figure 3C); Experiment D targeted Area 4 on the north of Tie inlet (
Figure 3D); and Experiment E targeted Area 5 near Qiangjiao (
Figure 3E). To accurately simulate the horizontal and vertical profiles of the currents, the minimum grid accuracy of the above experiments was within 100 m, and the water column was divided into 11 uniform vertical layers using the σ coordinate system. The detailed descriptions and key parameters of these numerical experiments are shown in
Table 1 and
Table 2.
2.2. Coastline and Bathymetric Data
The control experiment used the coastline of Xiangshan Bay in 2002 extracted by the Canny operator [
16], whereas the bathymetric data came from digital electronic charts.
2.3. Boundary Conditions and Forcing
This study used the TPXO9 model [
17] to provide the open boundary tidal wave for each experimental model, which was driven by the water level calculated based on the harmonic constants of eight major astronomical tides (M
2, S
2, K
1, O
1, N
2, K
2, P
1, Q
1). The water level calculation formula was as follows:
In the formula, represents the tidal height at time , represents the residual water level (set to 0 here), represents the intersection factor, represents the amplitude, represents the angular frequency, represents the intersection correction angle, represents the initial phase angle, and represents the lag angle.
In our models, as Xiangshan Bay had strong tides, small runoffs, and calm winds [
18], both wind and heat flux at the free-surface boundary were neglected.
2.4. Residual Current
The residual current analysis presented in this study used the Eulerian residual current [
19], which was expressed by the following formula:
where
is the velocity of the Eulerian residual current,
is the tidal period,
is the starting time of the last two tidal periods, and
is the current velocity of the tidal flow at a certain time. This study used the last two tidal cycles calculated by the model for the analysis.
3. Results
3.1. Model Calibration
This study calibrated the results of the control experiments using observation data. The observation data were obtained from the study by Zhu [
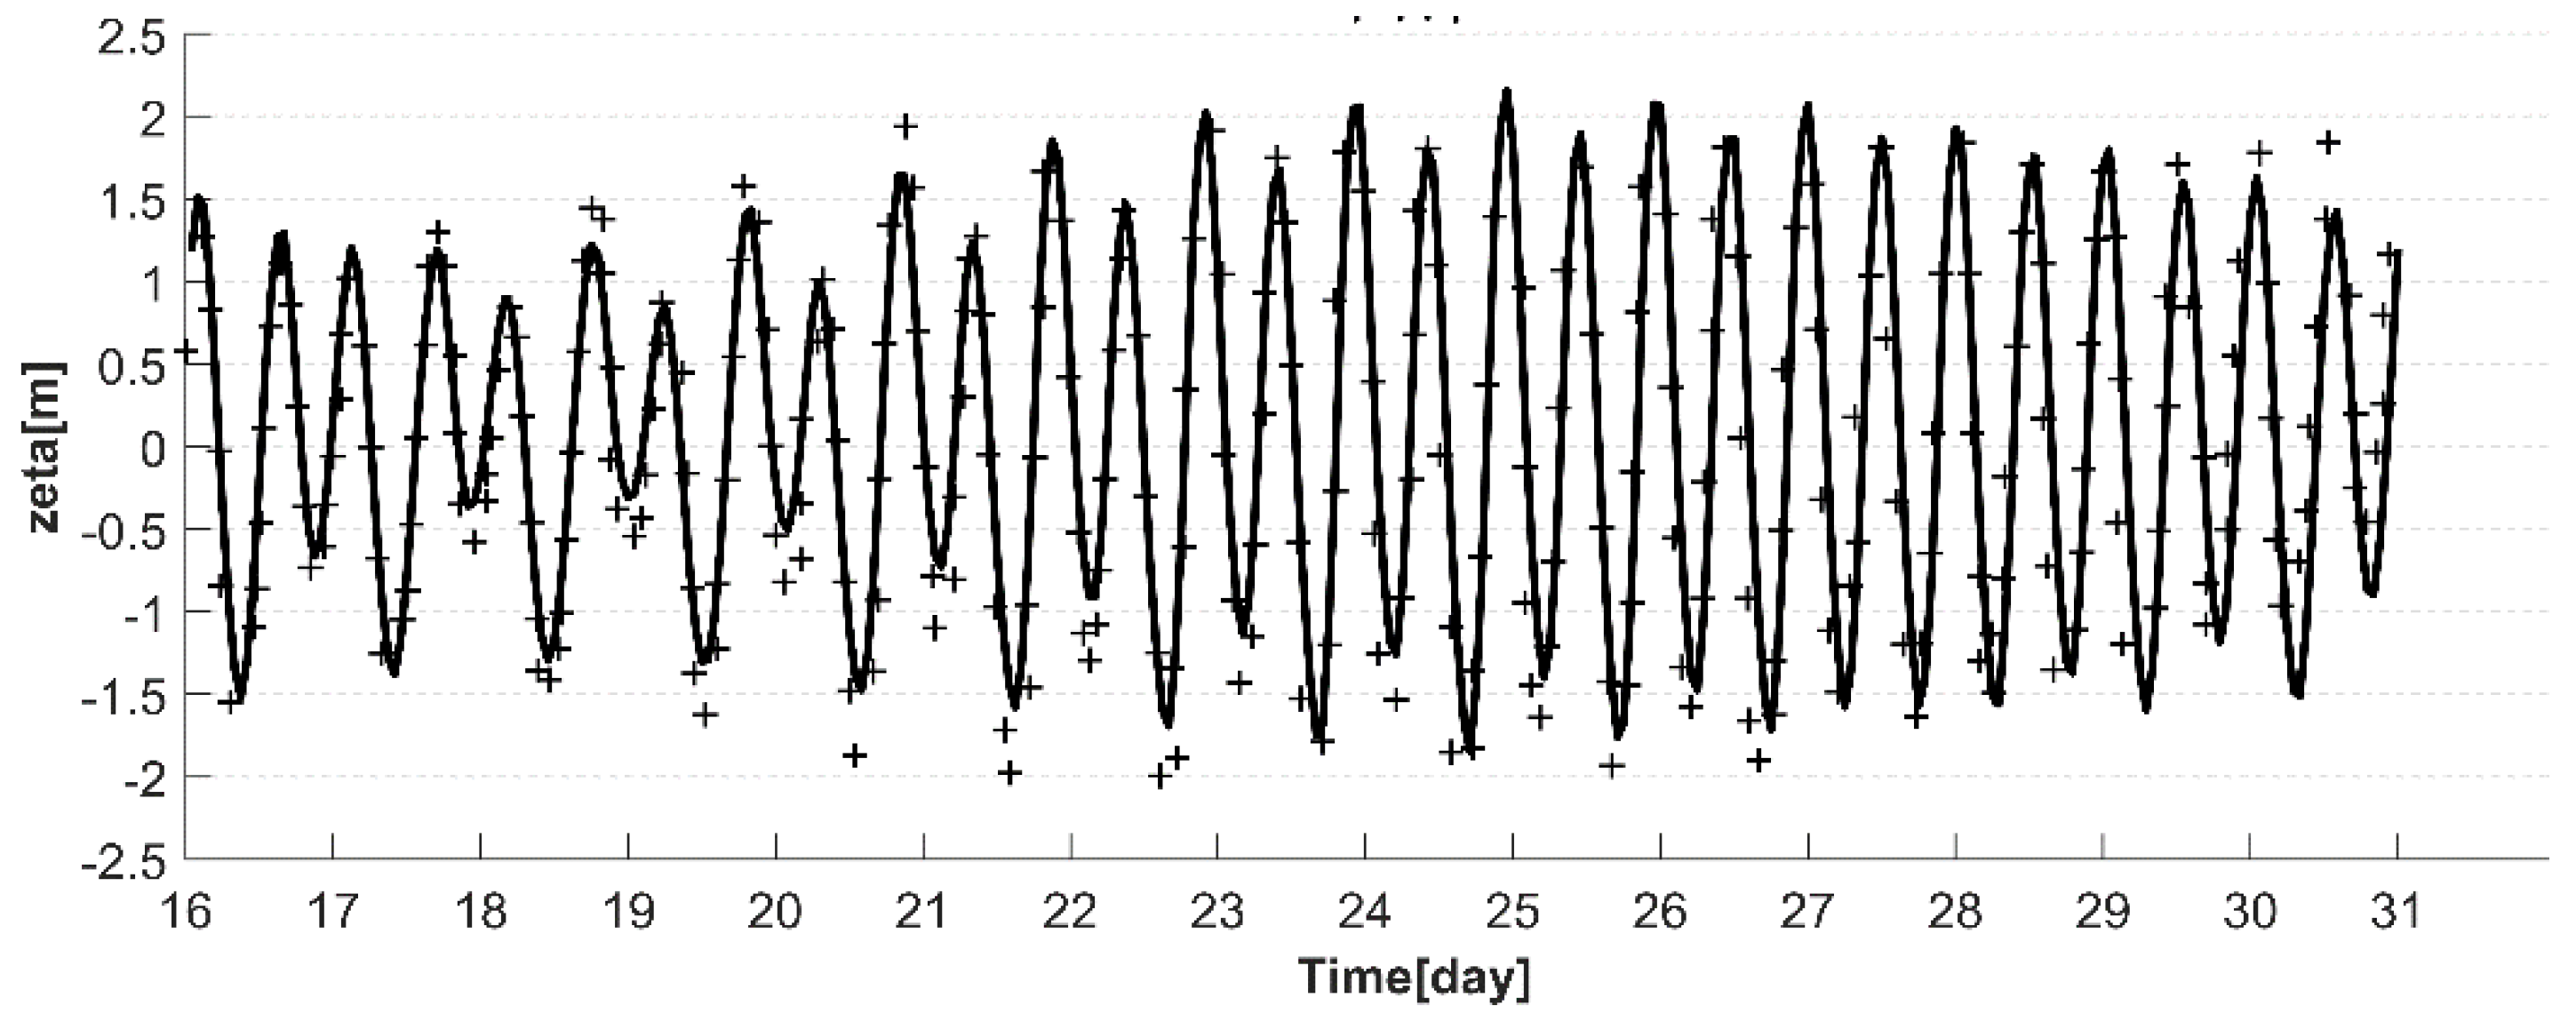
20], which covered the period from 00:00 on 16 August to 23:00 on 30 August 2002 at the Xize station (29°36′34.53″ N, 121°49′56.91″ E), as shown in
Figure 2.
Figure 4 shows the predicted elevation time series, which agreed well with the field data from the Xize station. The evaluation result showed that the relative mean error of the control experiment model results was 3.77%, indicating a good simulation of the real situation.
3.2. Harmonic Analysis Results
3.2.1. Control Experiment Harmonic Analysis Result
The M
2 tide of the simulated results was analyzed using T_TIDE [
21] for tidal harmonic analysis.
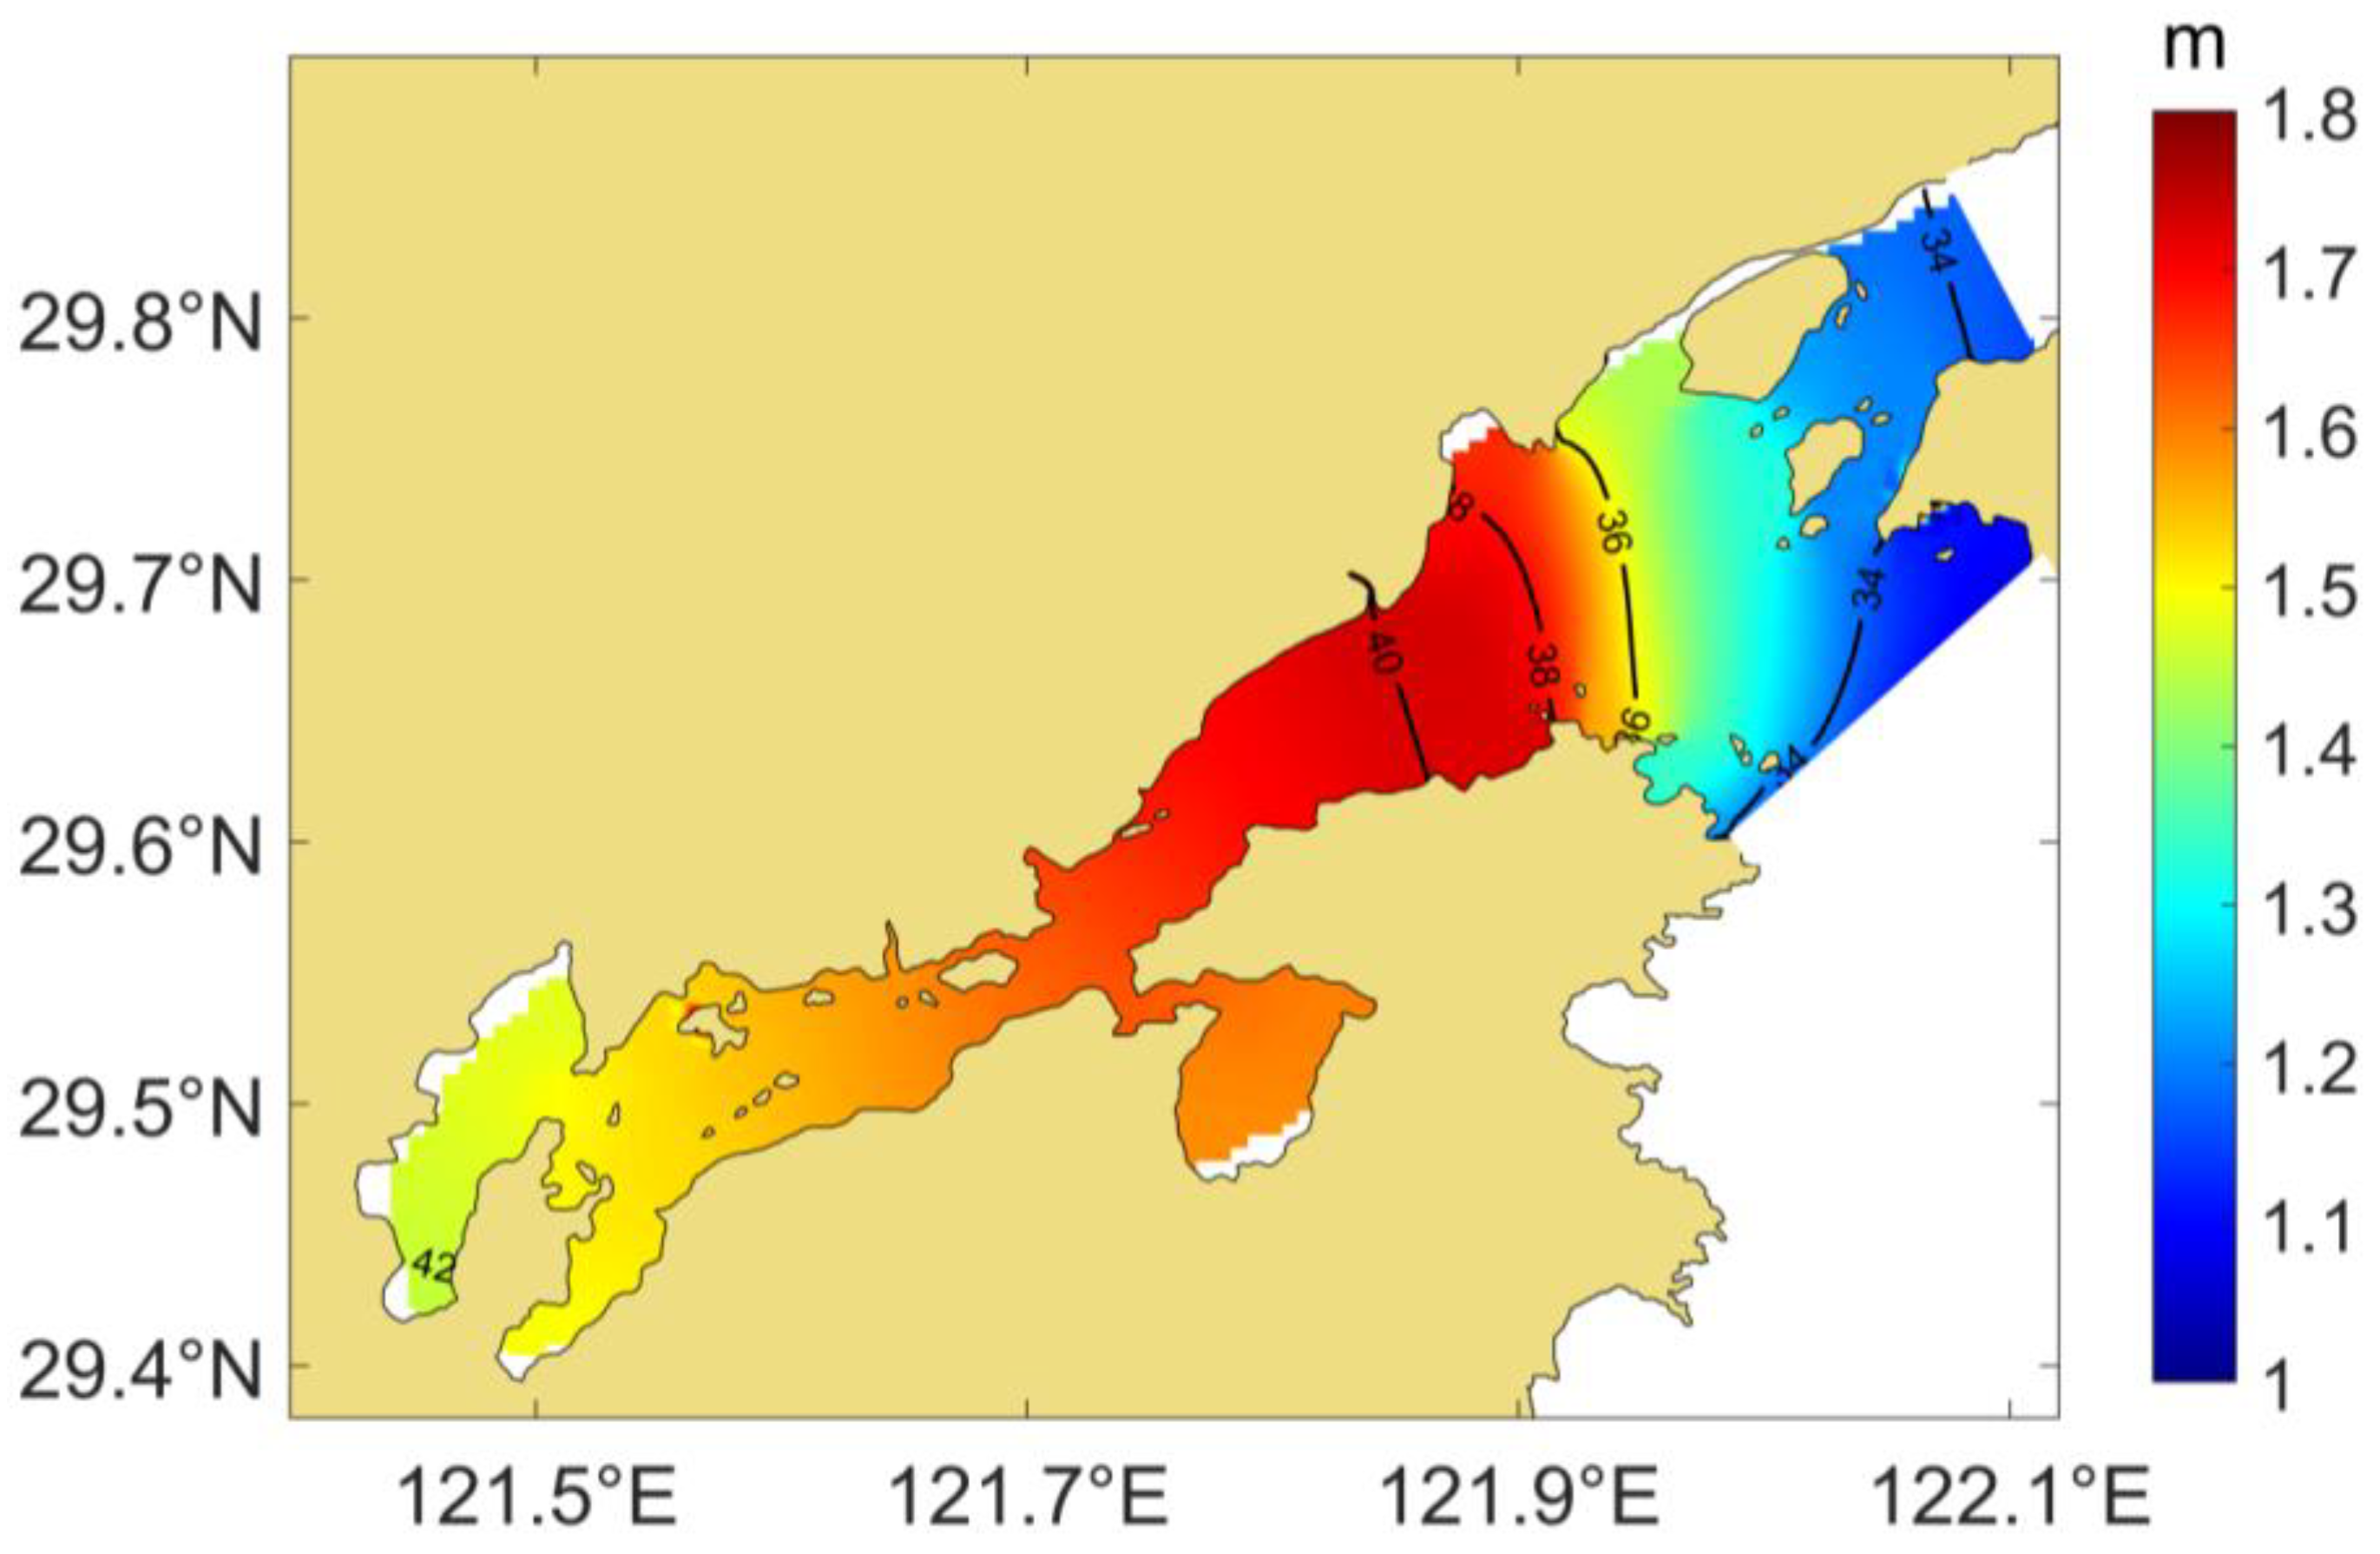
Figure 5 shows the amplitudes and phases of M
2 tide from the control experiment. The M
2 amplitudes in Xiangshan Bay are all above 1.0 m, with the lowest amplitudes in the Fodu channel and the Niubishan channel. From the mouth of the bay to the center of the inner bay, the amplitude increased to 1.7 m, whereas the amplitude decreased and could reach 1.5 m at the Tie inlet further inward towards the head of the bay. The phase in the center of the inner bay was about 10° larger than those in the two channels.
3.2.2. Comparative Experiments Harmonic Analysis Results
The M
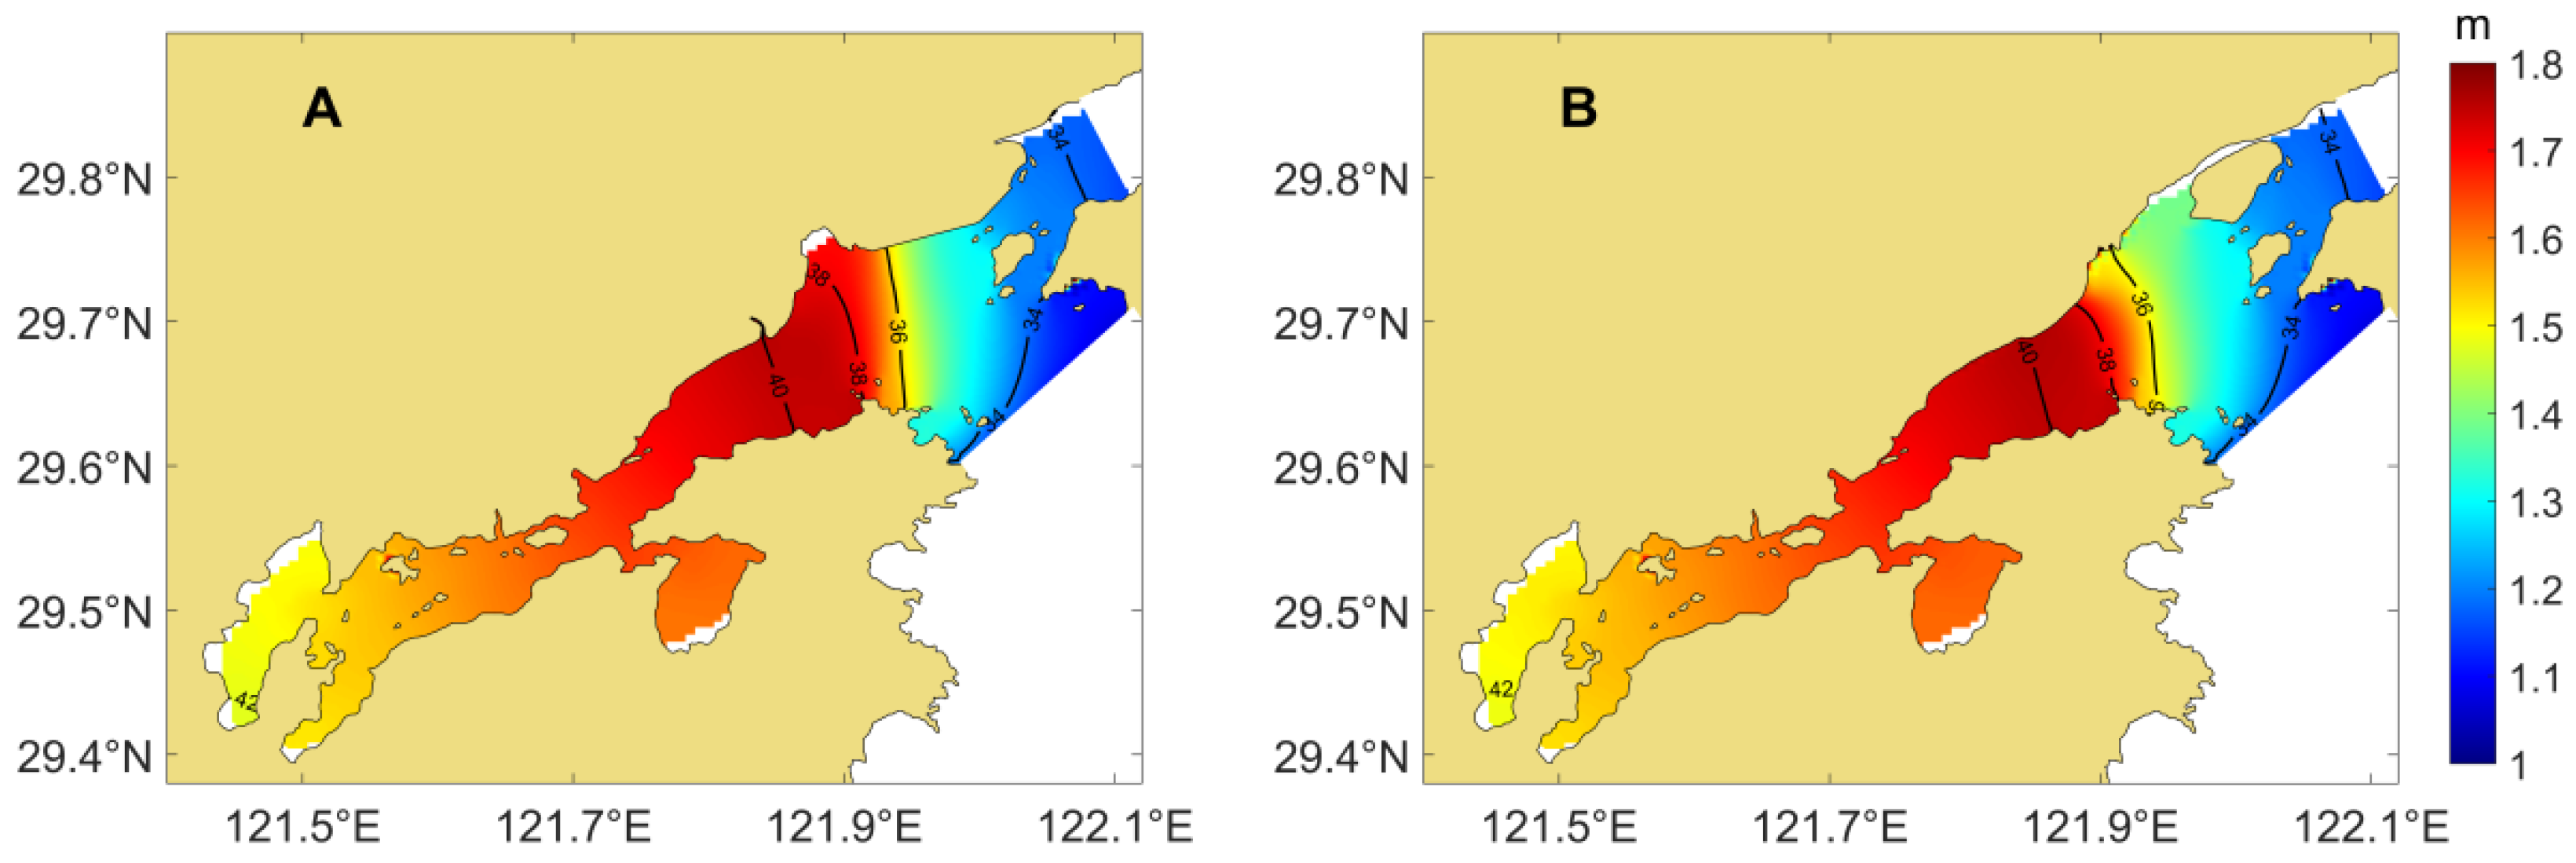
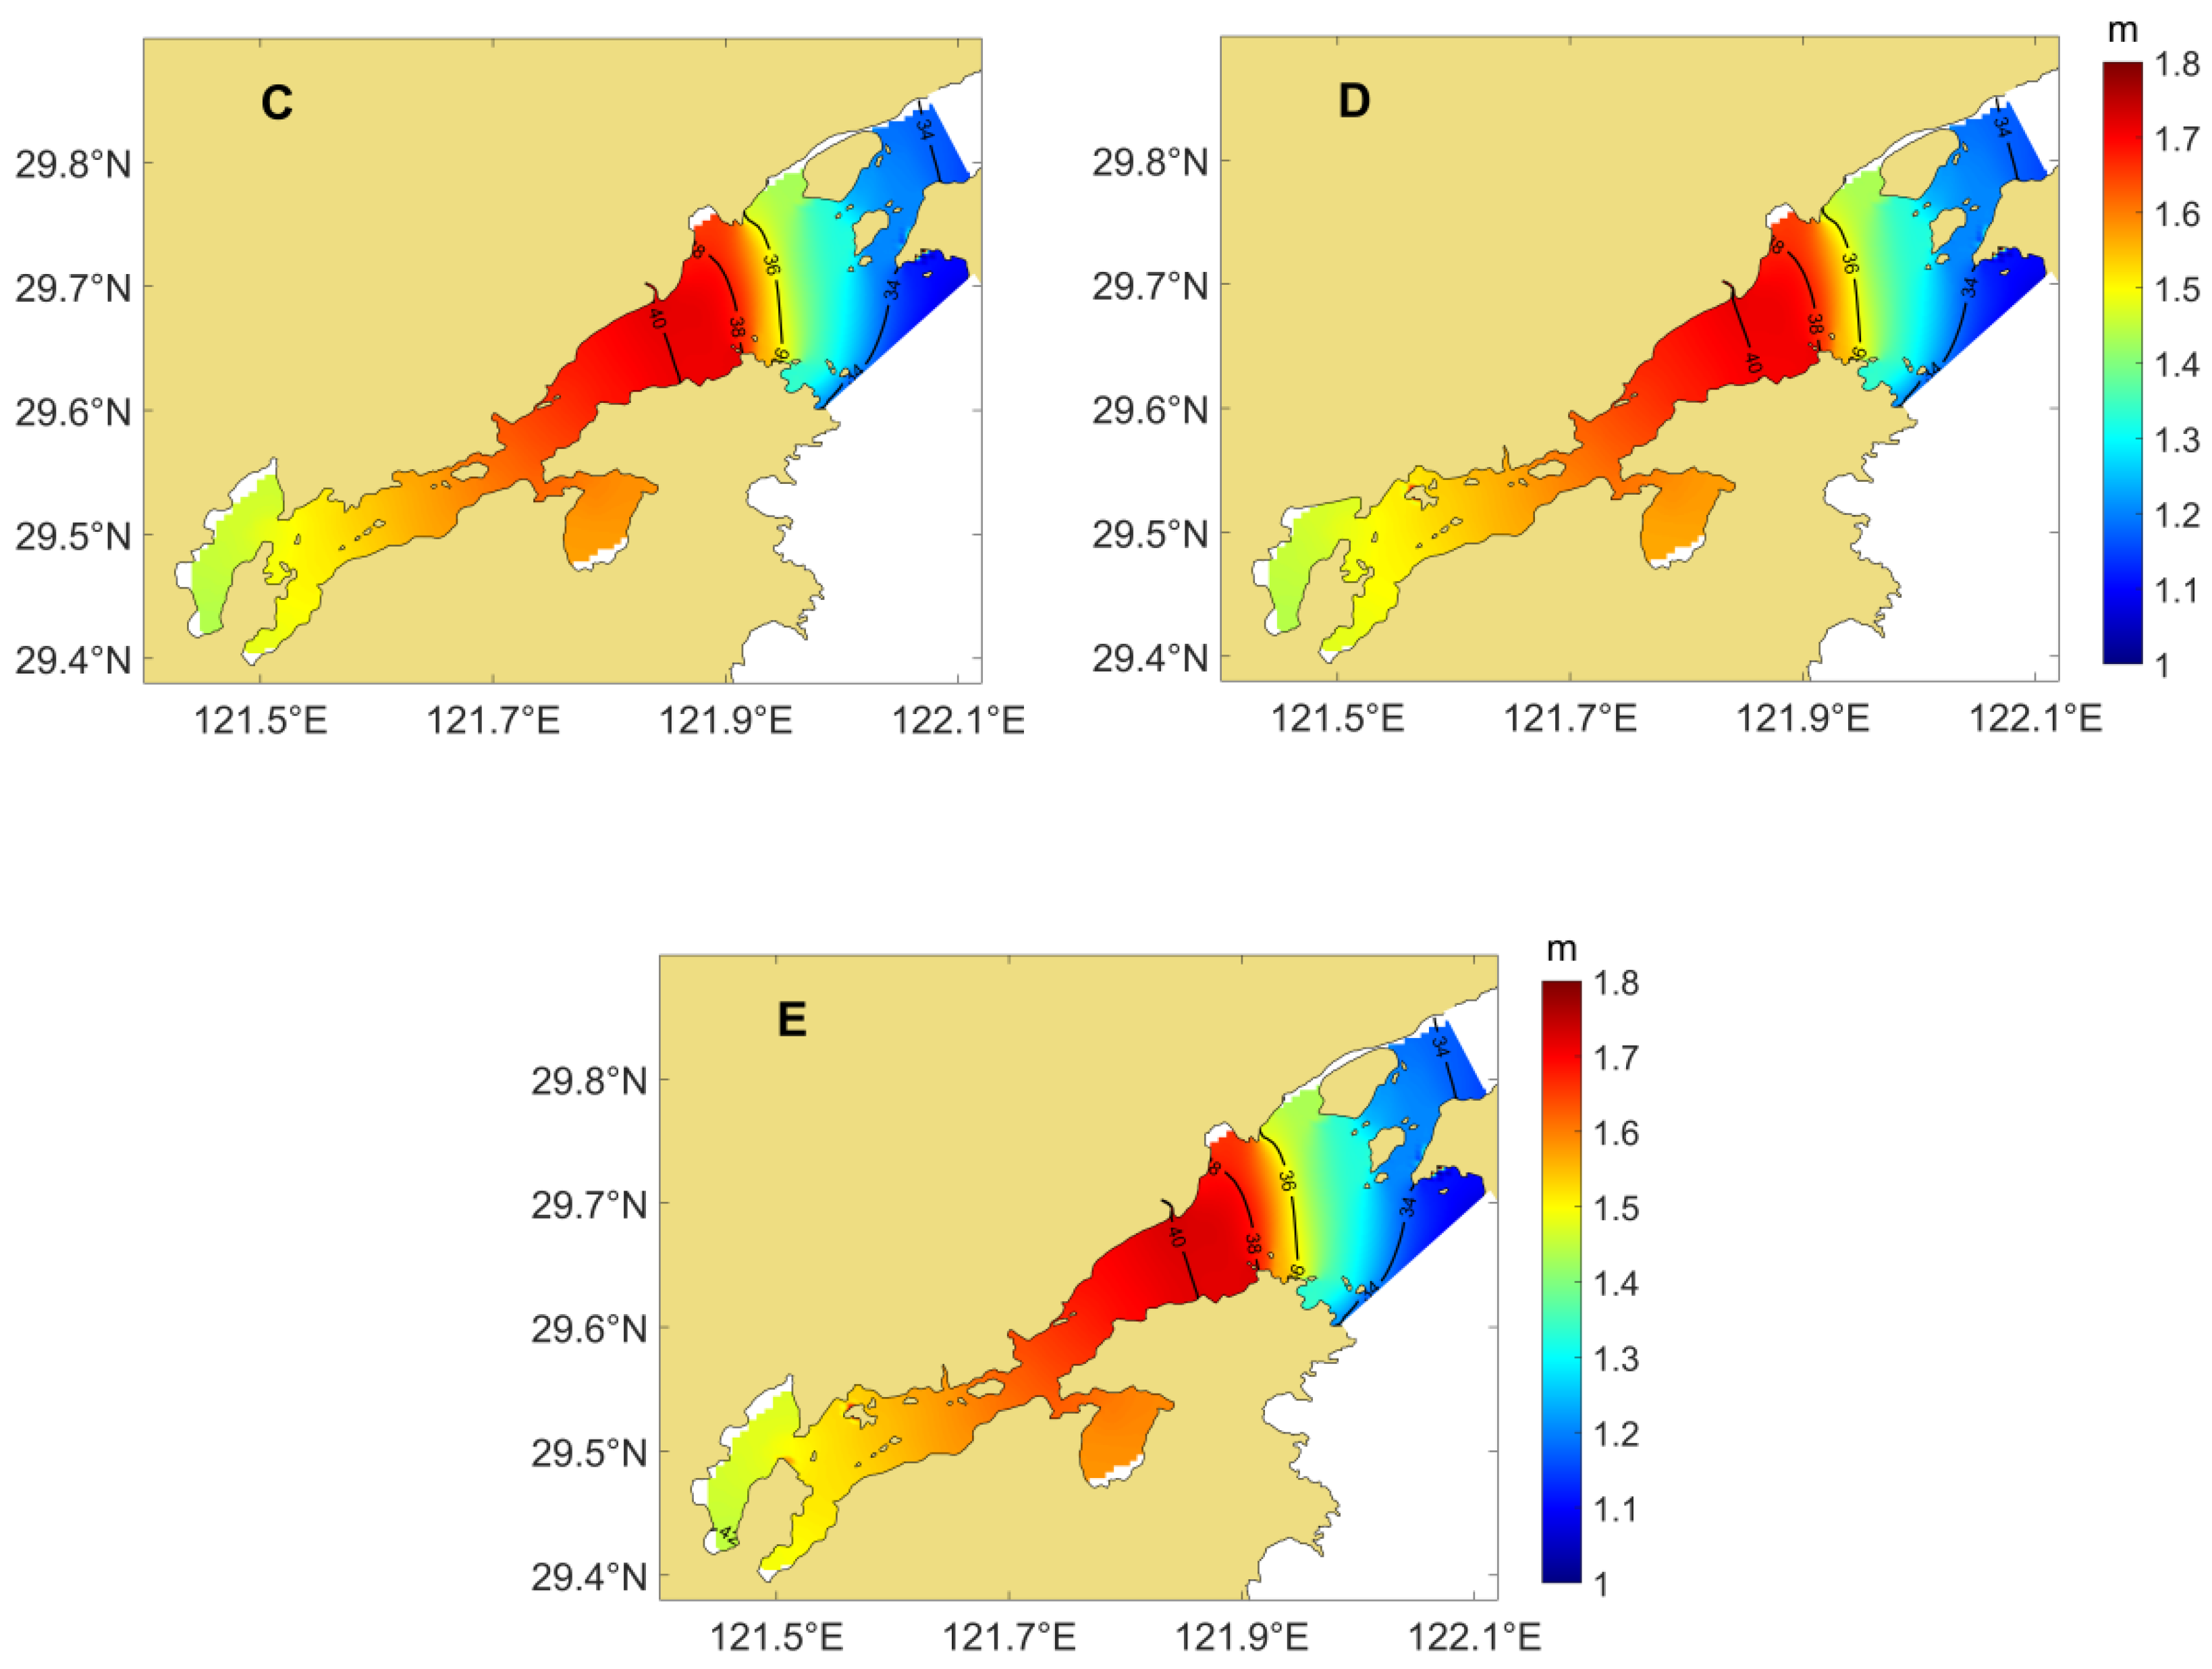
2 tidal amplitudes and phases from experiments A–E are shown in
Figure 6A–E, respectively.
In Experiment A, the main changing area was near Meishan Island, where the phase angle had some variation. Compared to the control experiment, the 36° phase contour line on the west side of Meishan Island, which originally had a slightly northwest–southeast orientation, changed to a mainly north–south orientation. Meanwhile, the amplitude distribution showed a similar trend, with a slight increase on the west side of Meishan Island, approximately 0.1 m.
In Experiment B, the main changing area was near Dasong. Due to coastline changes, there was a significant variation in phases in this area, especially for the 36° phase contour line. This contour line, which was originally roughly parallel to the latitude lines, has now become curved and open towards the mouth of the bay. There was also some variation in the amplitude, with the 1.5 m amplitude contour line approximately coinciding with the 36° phase contour line. Overall, the phases near Dasong showed a slightly decreasing trend, unlike the amplitude, which showed a slightly increasing trend. The above results indicated that the arrival time of the tidal wave at this location advanced, whereas the tidal amplitude at this location decreased.
In Experiment C, the main changing area was near Tongzhao, where the amplitude in the Tie inlet increased. In Experiment D, the main changing area was north of the Tie inlet. After the area was reclaimed, the amplitude in the remaining areas of the Tie inlet decreased slightly, by approximately 0.05 m. In Experiment E, the main changing area was near Qiangjiao. Compared to the control experiment, the overall amplitudes and phase distribution did not change significantly, with only a slight decrease in amplitude in the surrounding sea areas.
In summary, experiments A and B had a greater impact on the amplitudes and phases due to the changing coastline areas located on the outside of Xiangshan Bay, near the mouth of the bay. Experiments C, D, and E showed relatively minor changes, as the changing coastline areas were located closer to the head of the bay, with only a slight decrease in amplitude in the surrounding changed areas.
3.3. Hydrodynamic Analysis
The hydrodynamics in the bay are driven mostly by tidal currents. Hence, the tidal currents have significant effects on the transport of substances, the dispersion and distribution of pollutants, as well as the ecological environment within the bay. We analyzed residual currents and tidal currents before and after the coastline changes in Xiangshan Bay.
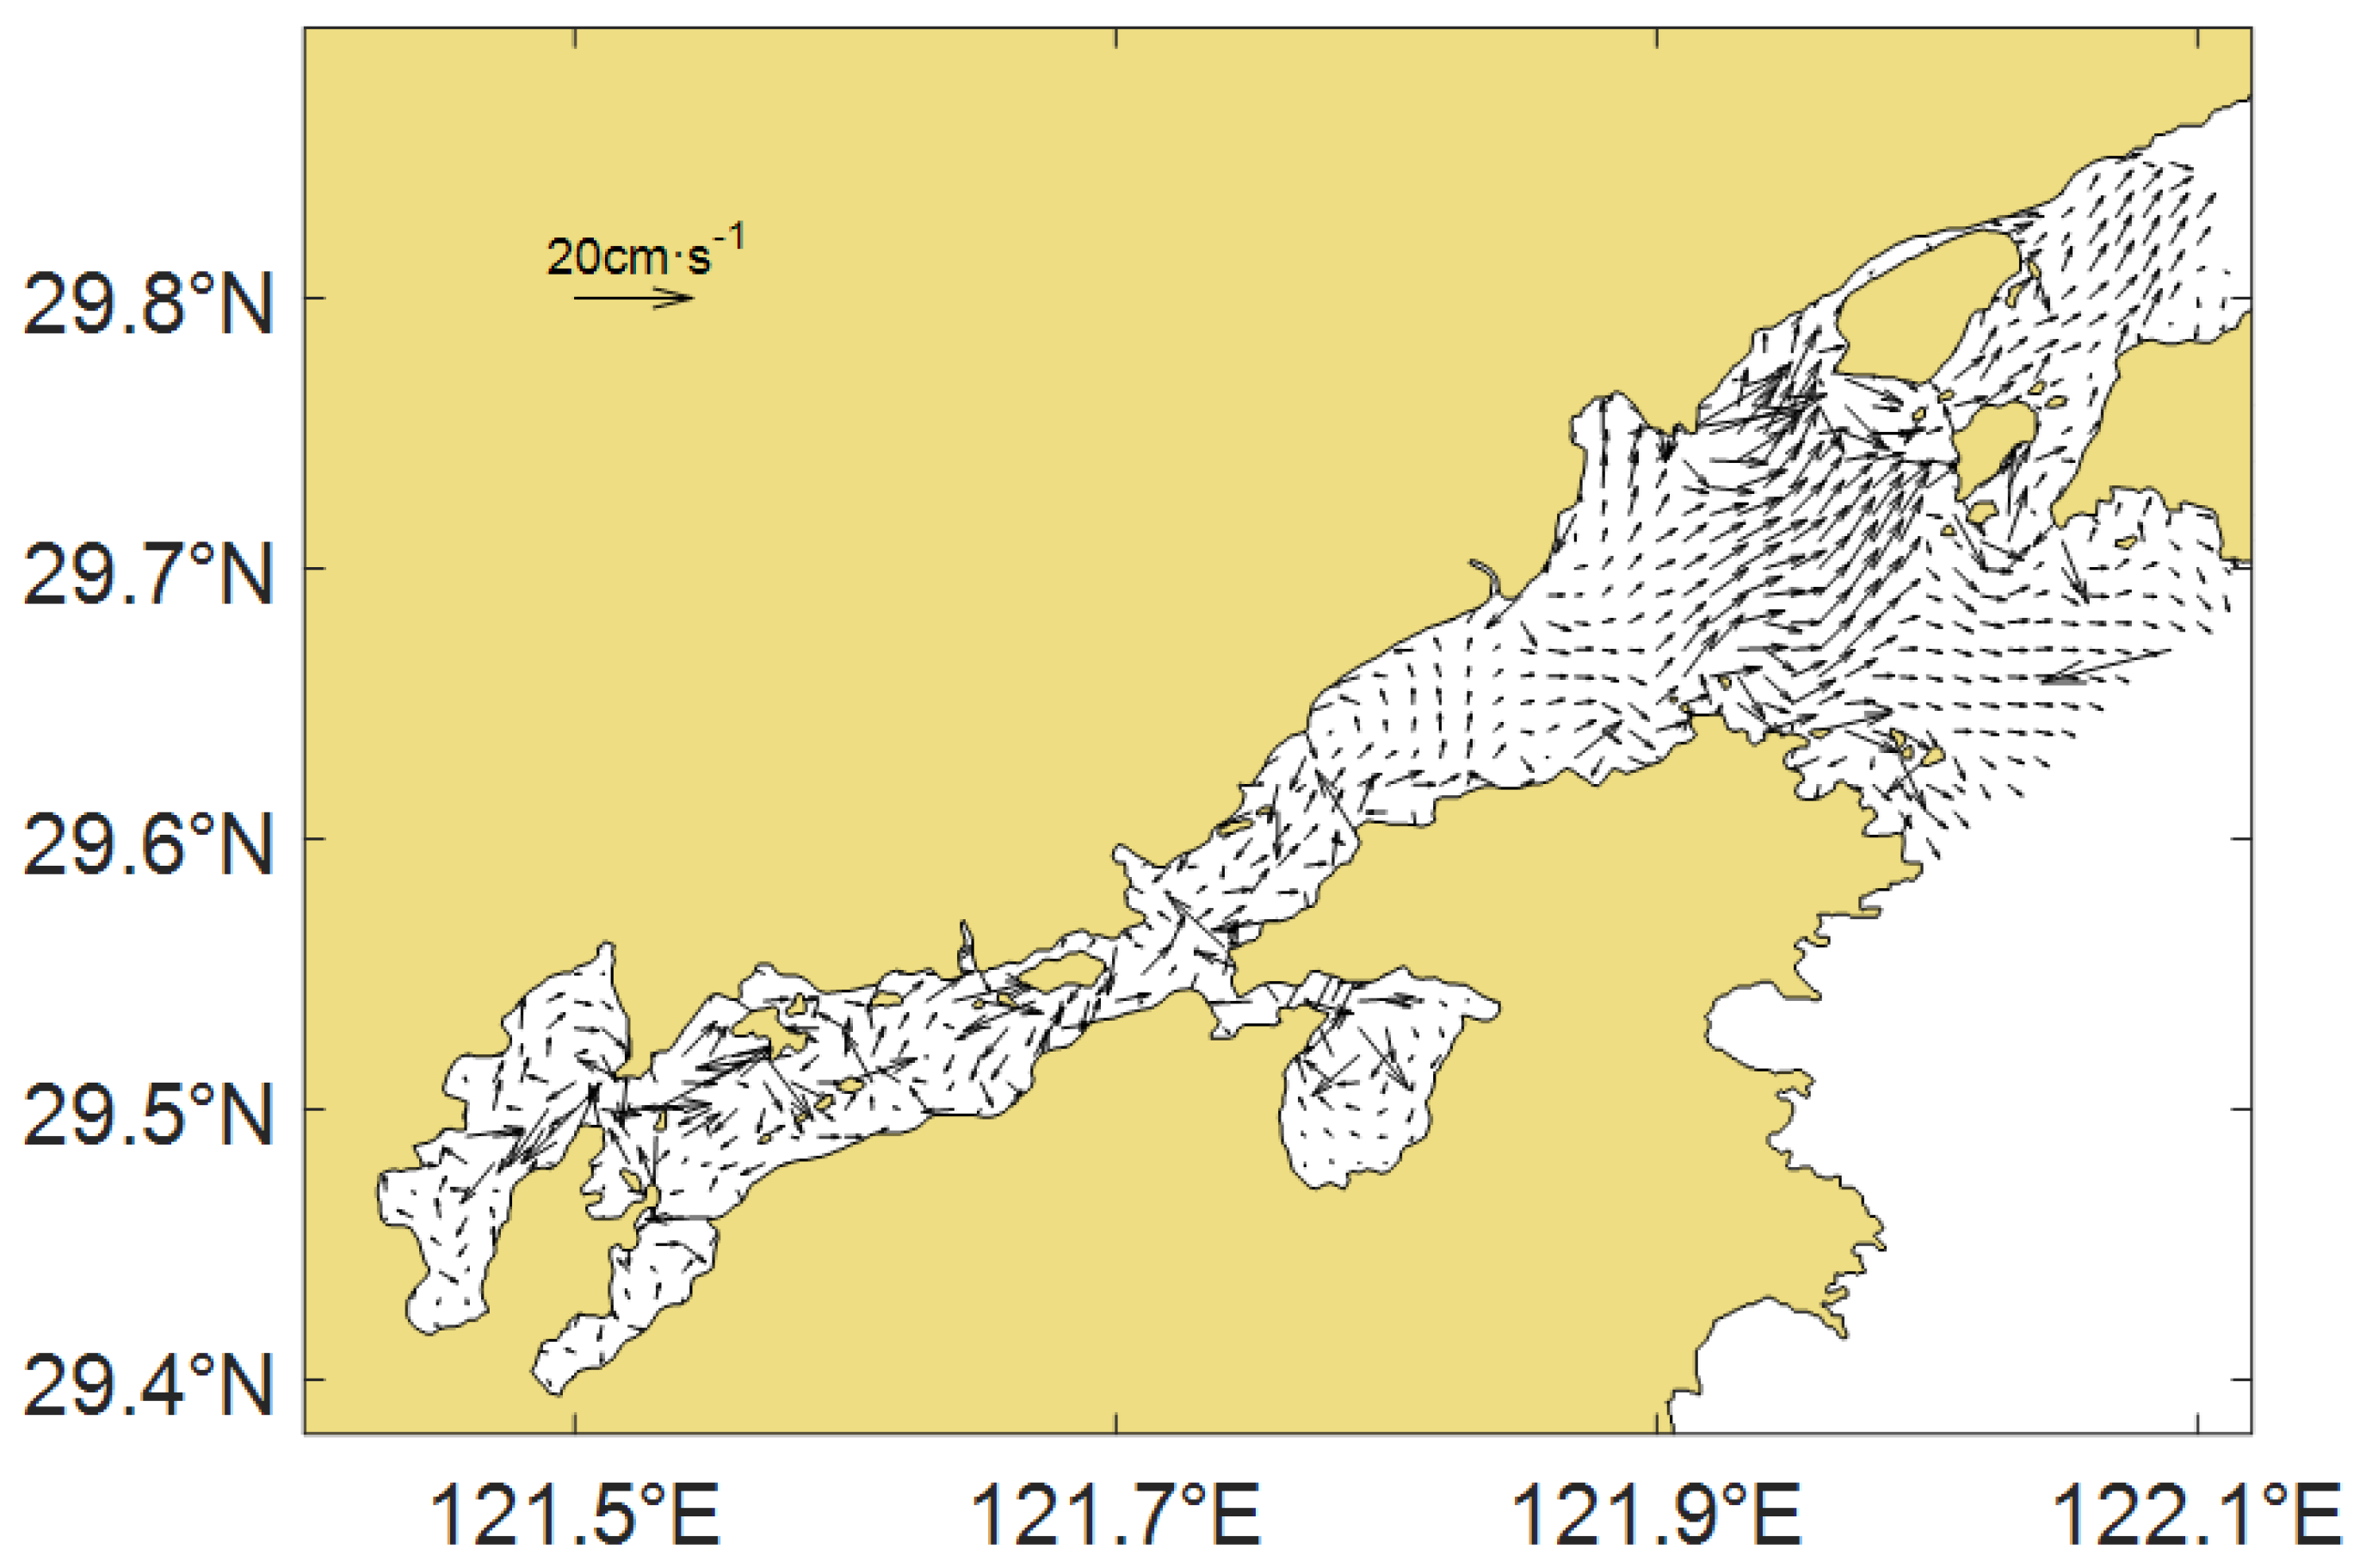
As shown in
Figure 7, the main characteristics of the residual currents in the Xiangshan Bay in the control experiment were as follows: there was a significant correlation between the distribution of residual currents and the coastline orientation of Xiangshan Bay. The residual current was relatively weak inside the three secondary bays, whereas it was strong and chaotic at the entrance of the three secondary bays. The currents in the middle of Xiangshan Bay were relatively fast and chaotic. In contrast, the tidal currents in the eastern part had lower velocities and a more consistent direction, and they gradually transitioned from a southwest–northeast direction initially to a west–east direction. The maximum flow velocity of the residual current throughout the bay was located in the area from the inner bay towards the outer region. The residual current in this area was divided into two branches: one strong branch surged towards the Fodu channel in the southwest–northeast direction with a uniform flow direction, and the average velocity was ~10 cm/s. After passing through the narrow area below Meishan Island, the velocity weakened to ~5 cm/s. Another weaker current flowed along the northwest–southeast direction along the coastline towards the Niubishan channel, with a velocity of ~5 cm/s.
3.3.1. Experimental A
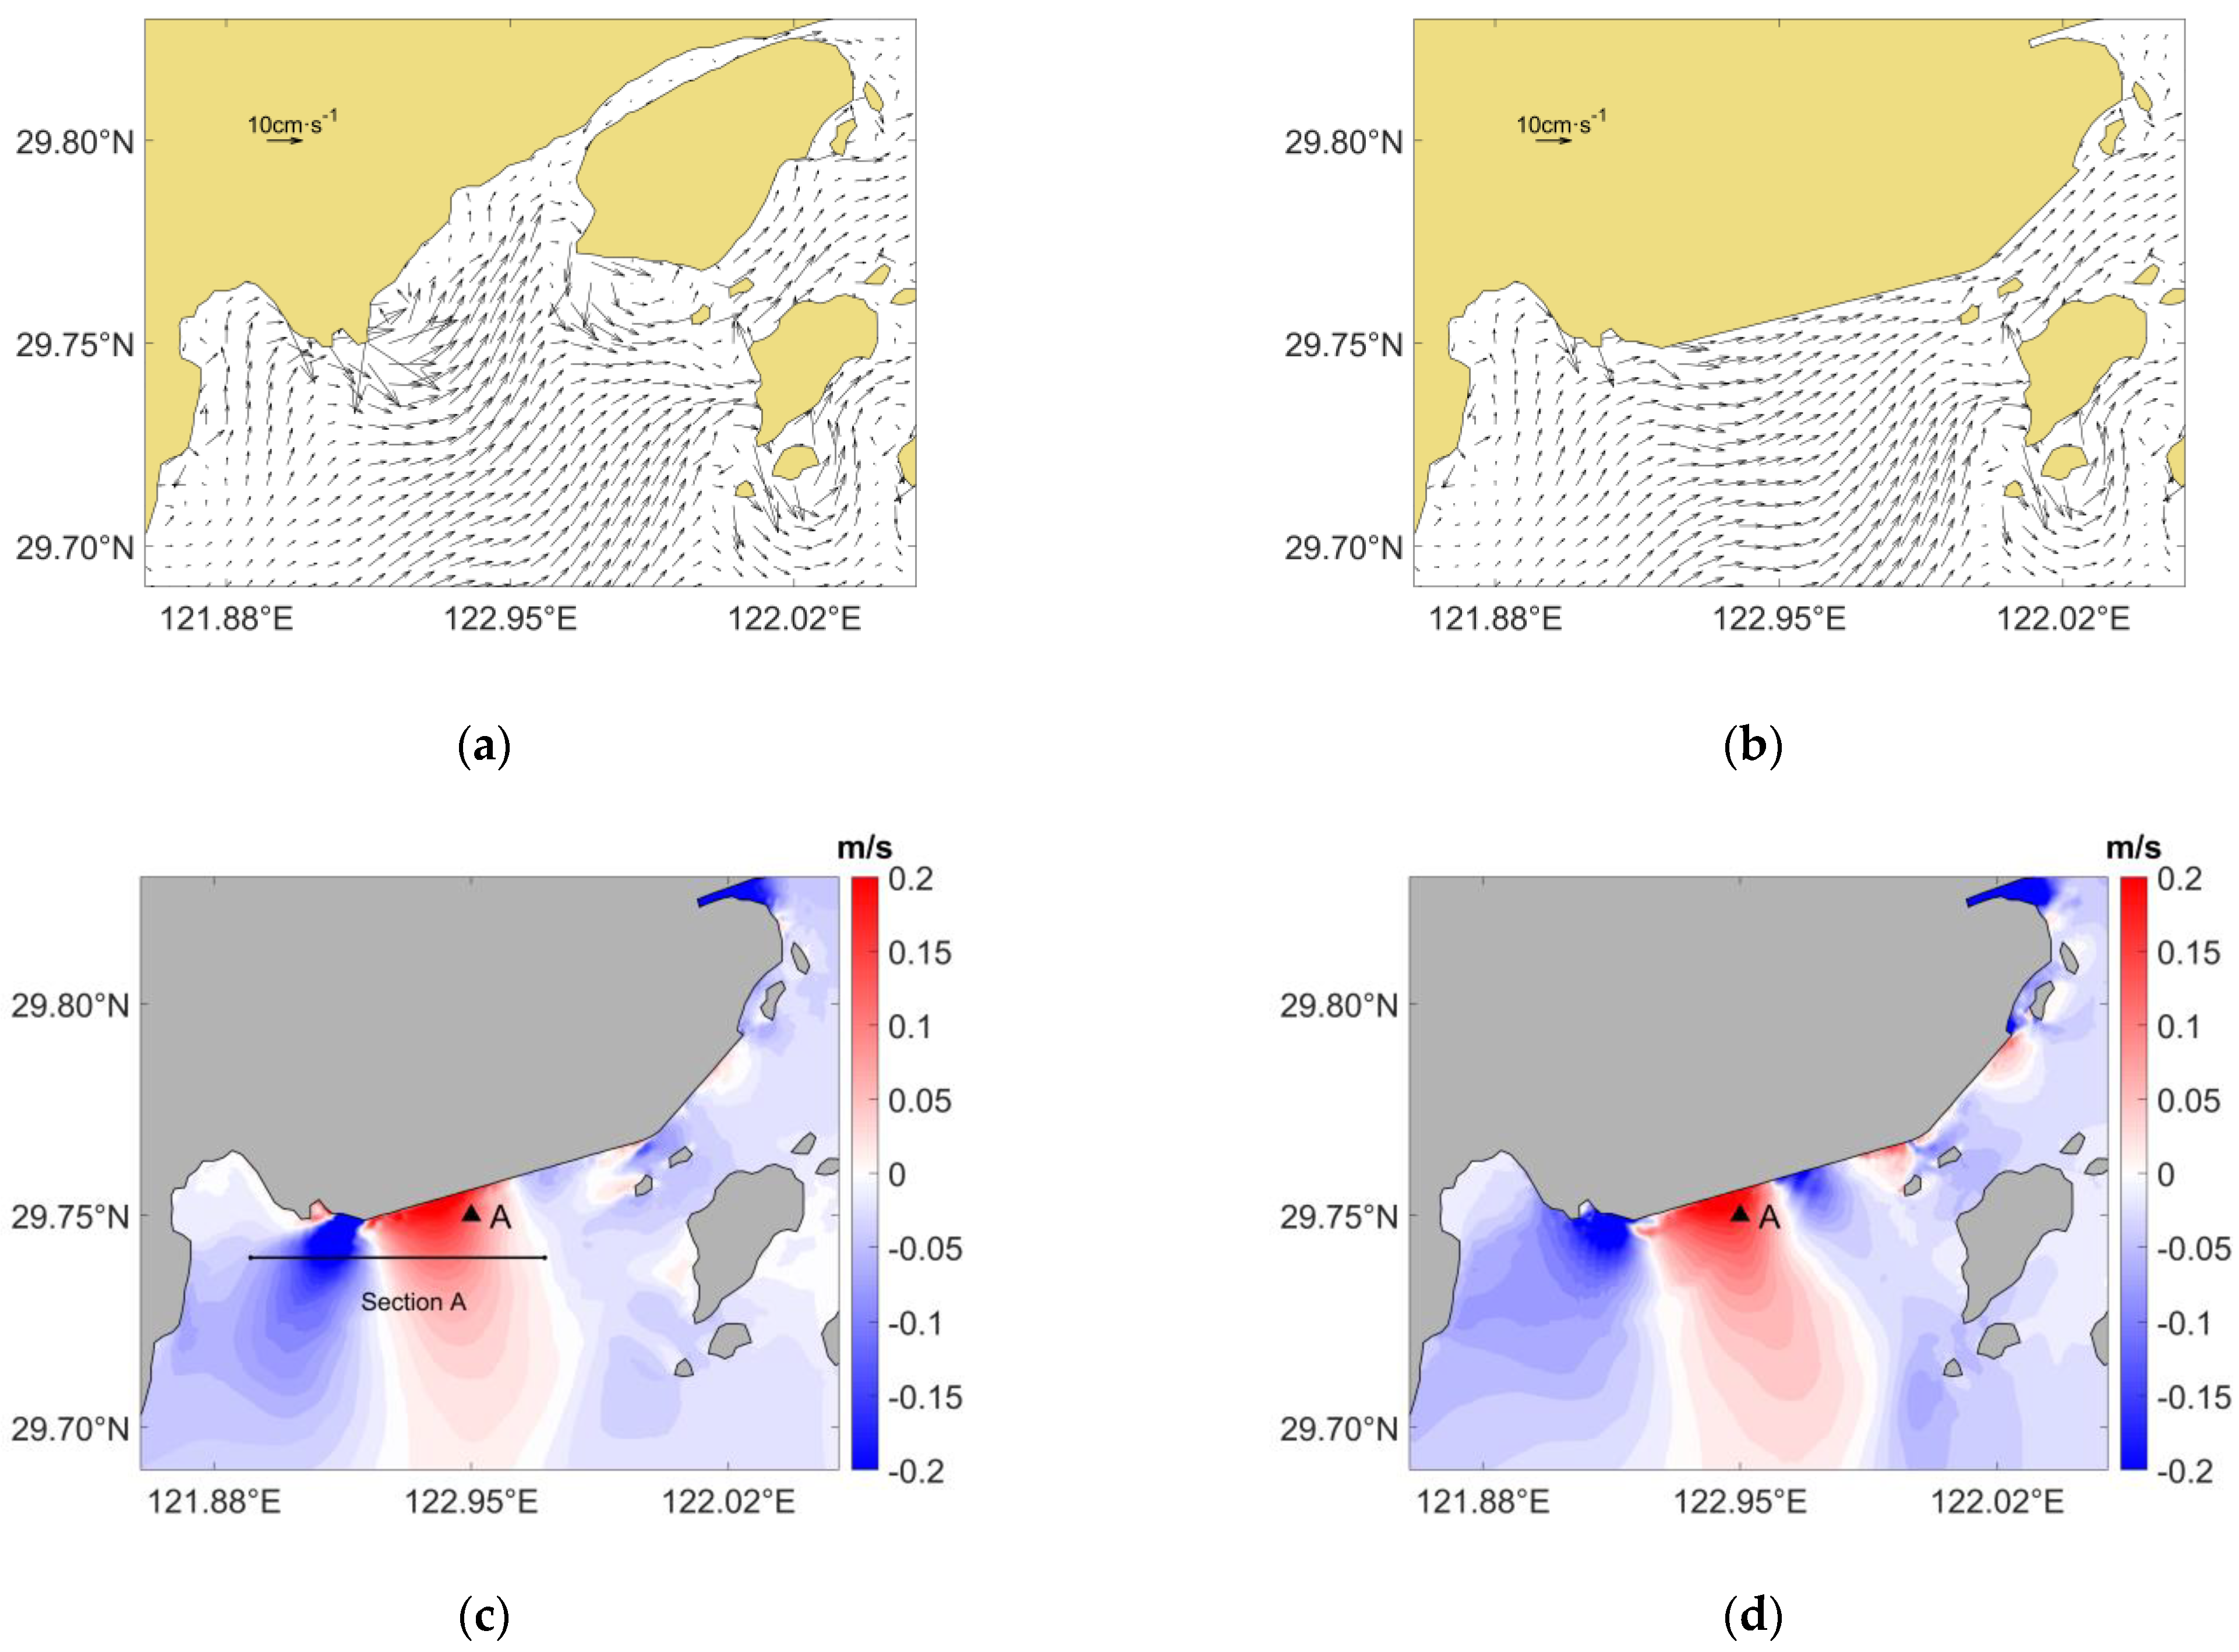
The distributions of surface residual currents in the surrounding before and after the change in the coastline in Area 1 are shown in
Figure 8a,b. In comparison to currents before the coastline changes, one branch channel in that area decreased. Specifically, the narrow channel in the north of Meishan Island was closed off. Thus, the inflow and outflow of seawater could only occur through the Fodu channel below Meishan Island, which induced an increase in current velocity in the Fodu channel.
The changes in flood and ebb surface current velocity before and after the coastline change in Area 1 are shown in
Figure 8c,d. After the coastline changed, the main area of velocity change occurred below Meishan Island. Meanwhile, the changes in flood and ebb current velocity showed an alternating increasing and decreasing trend, with an increasing trend on the east side and a decreasing trend on the west side. In this study, Station A (29.75° N, 121.95° E) was selected to compare the changes in flood and ebb current velocity before and after the coastline change. Before the changes in the coastline, the maximum current velocities for flood tide and ebb tide at Station A were 0.77 m/s and 0.72 m/s, with the average velocities being 0.54 m/s and 0.48 m/s, respectively. After the changes in the coastline, the maximum current velocities were 1.01 m/s for flood tide and 0.92 m/s for ebb tide, with the average velocities being 0.67 m/s and 0.59 m/s, respectively. Compared to currents before the coastline change, the maximum flood and ebb current velocities at this station increased by 0.24 m/s and 0.20 m/s, and the average velocities increased by 24% and 23%, respectively.
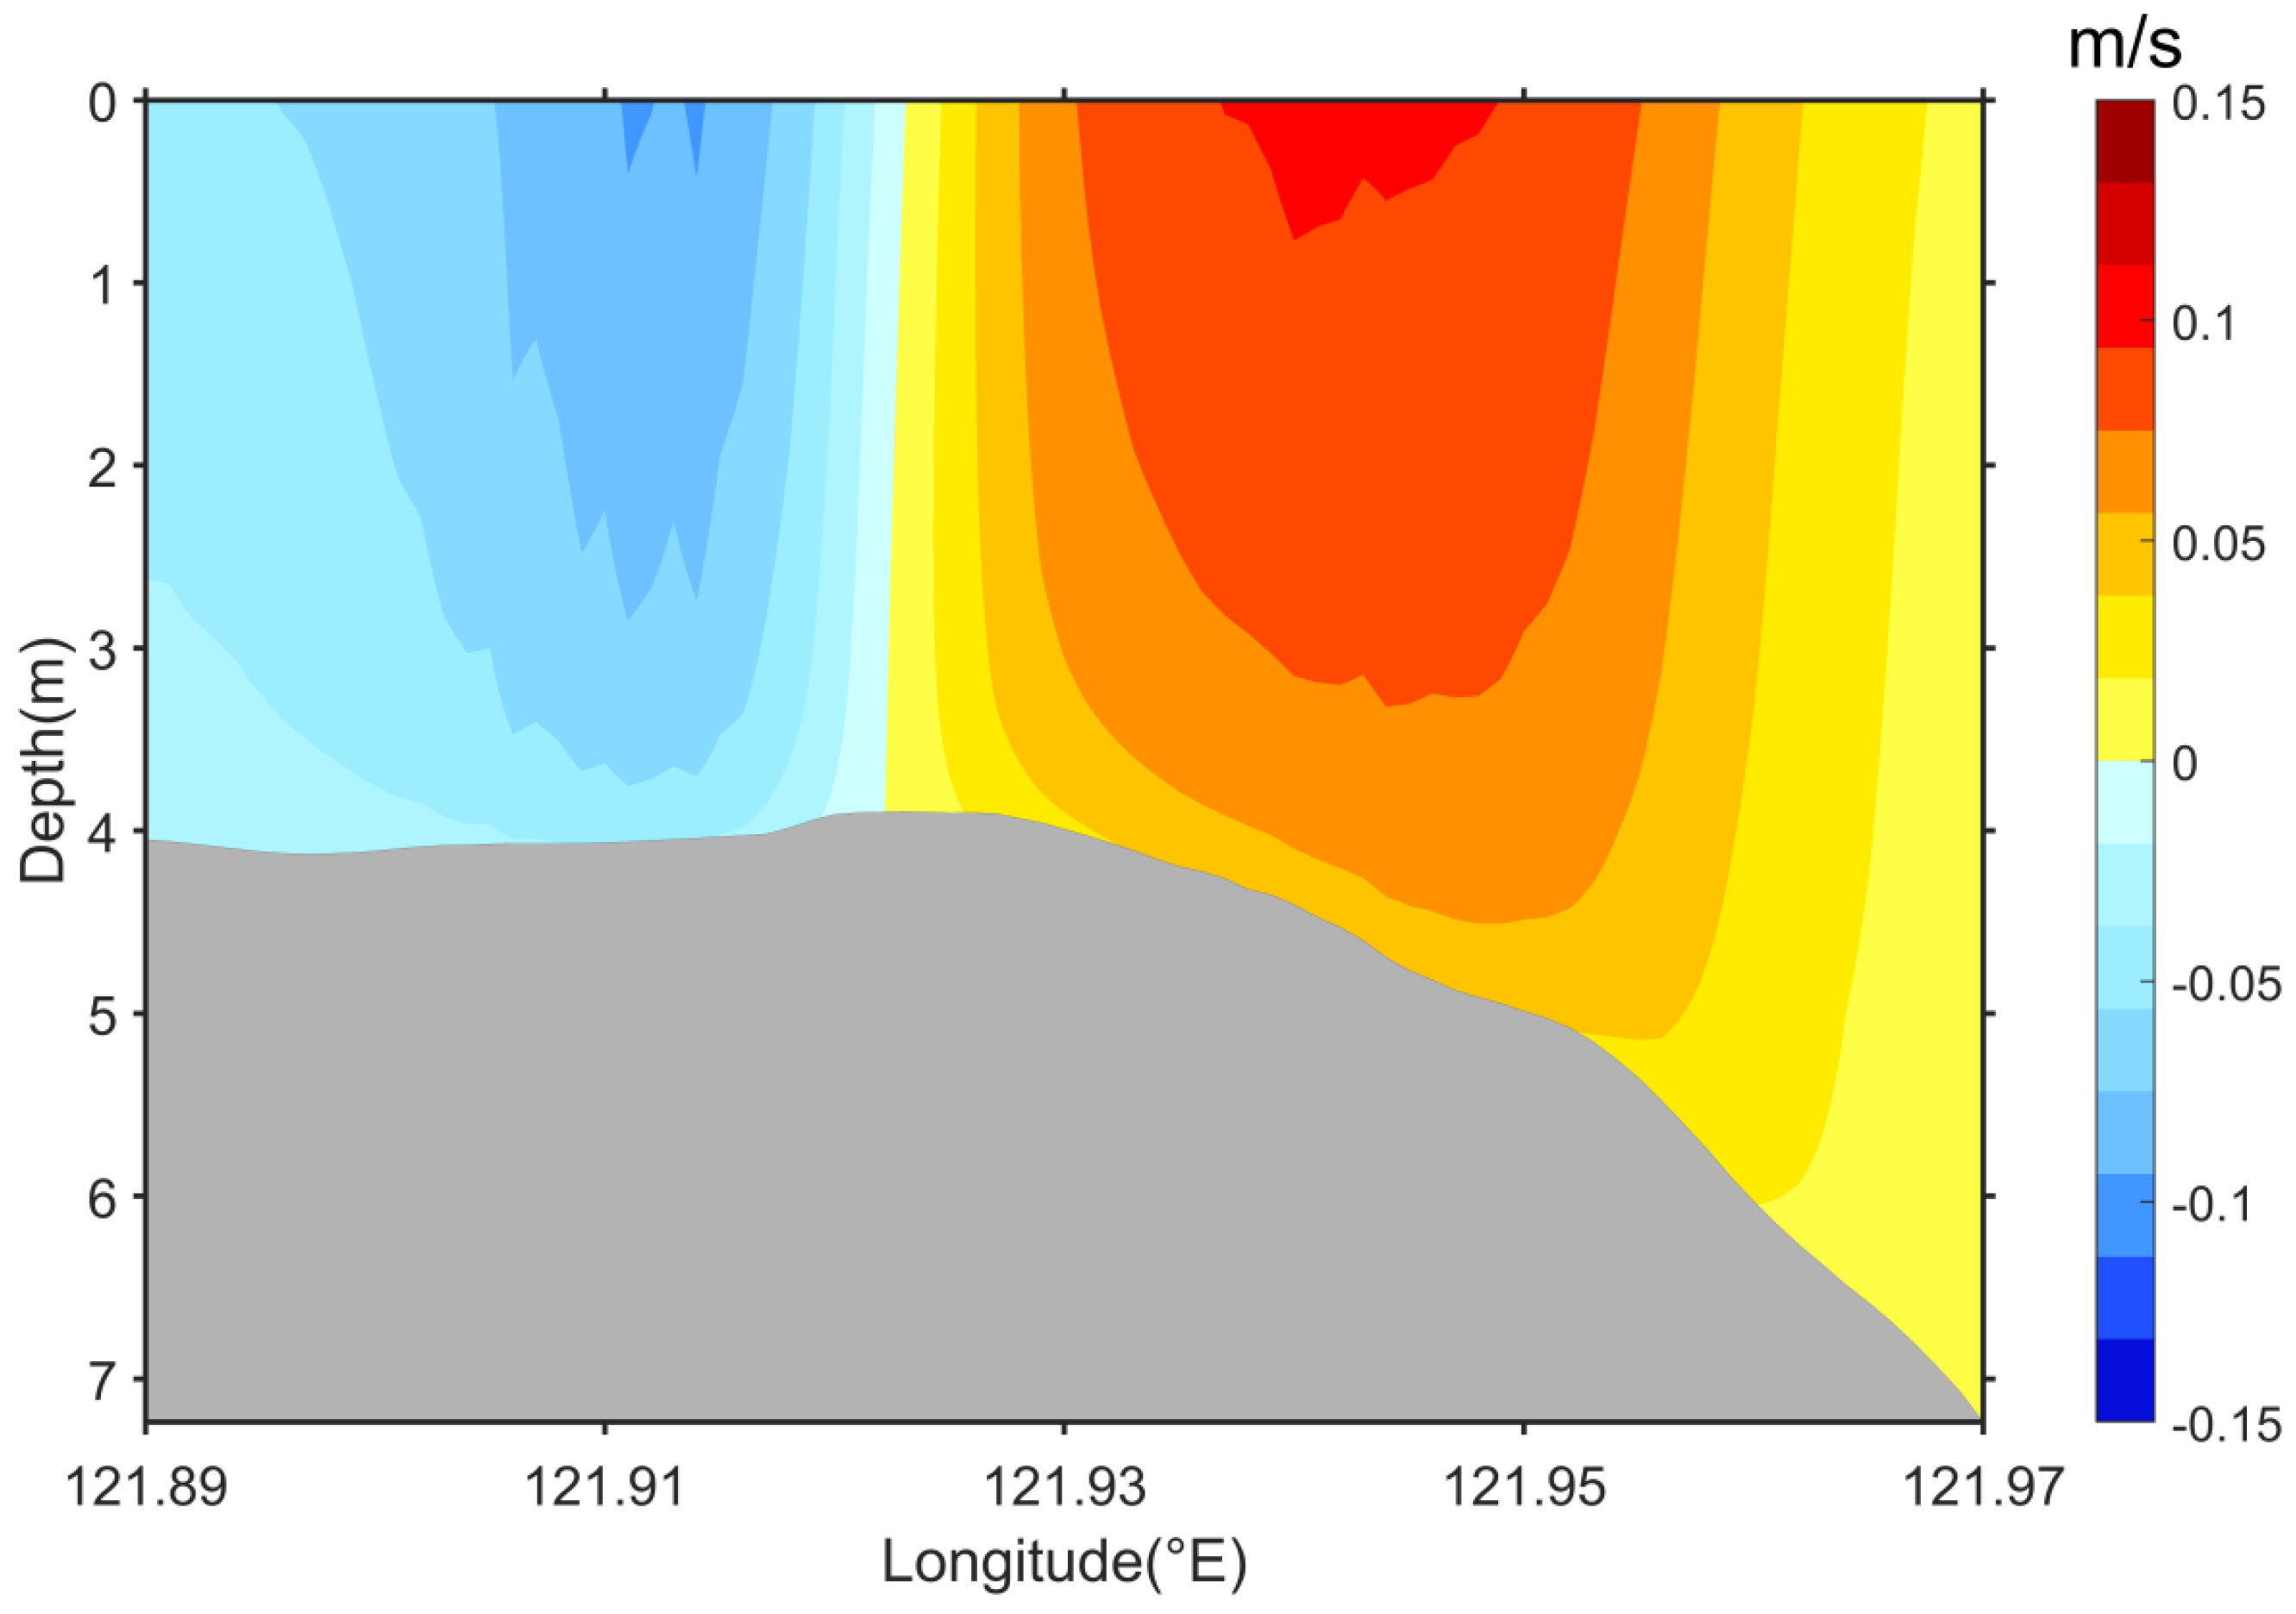
We used Section A (
Figure 8c, 29.74° N, 121.89°–121.97° E) to show the vertical distribution of changes in velocity (
Figure 9). On the western side of the section, velocity showed a decreasing trend, with the most significant changes occurring on the surface, reaching a maximum of 0.1 m/s. On the eastern side of the section, velocity exhibited an increasing trend. The area with the greatest variation was located at the surface around 121.94° E, reaching 0.12 m/s. In summary, the trends in changes in the surface and bottom were generally similar. The maximum changes in velocity occurred on the surface, gradually decreasing from the surface to the bottom.
3.3.2. Experimental B
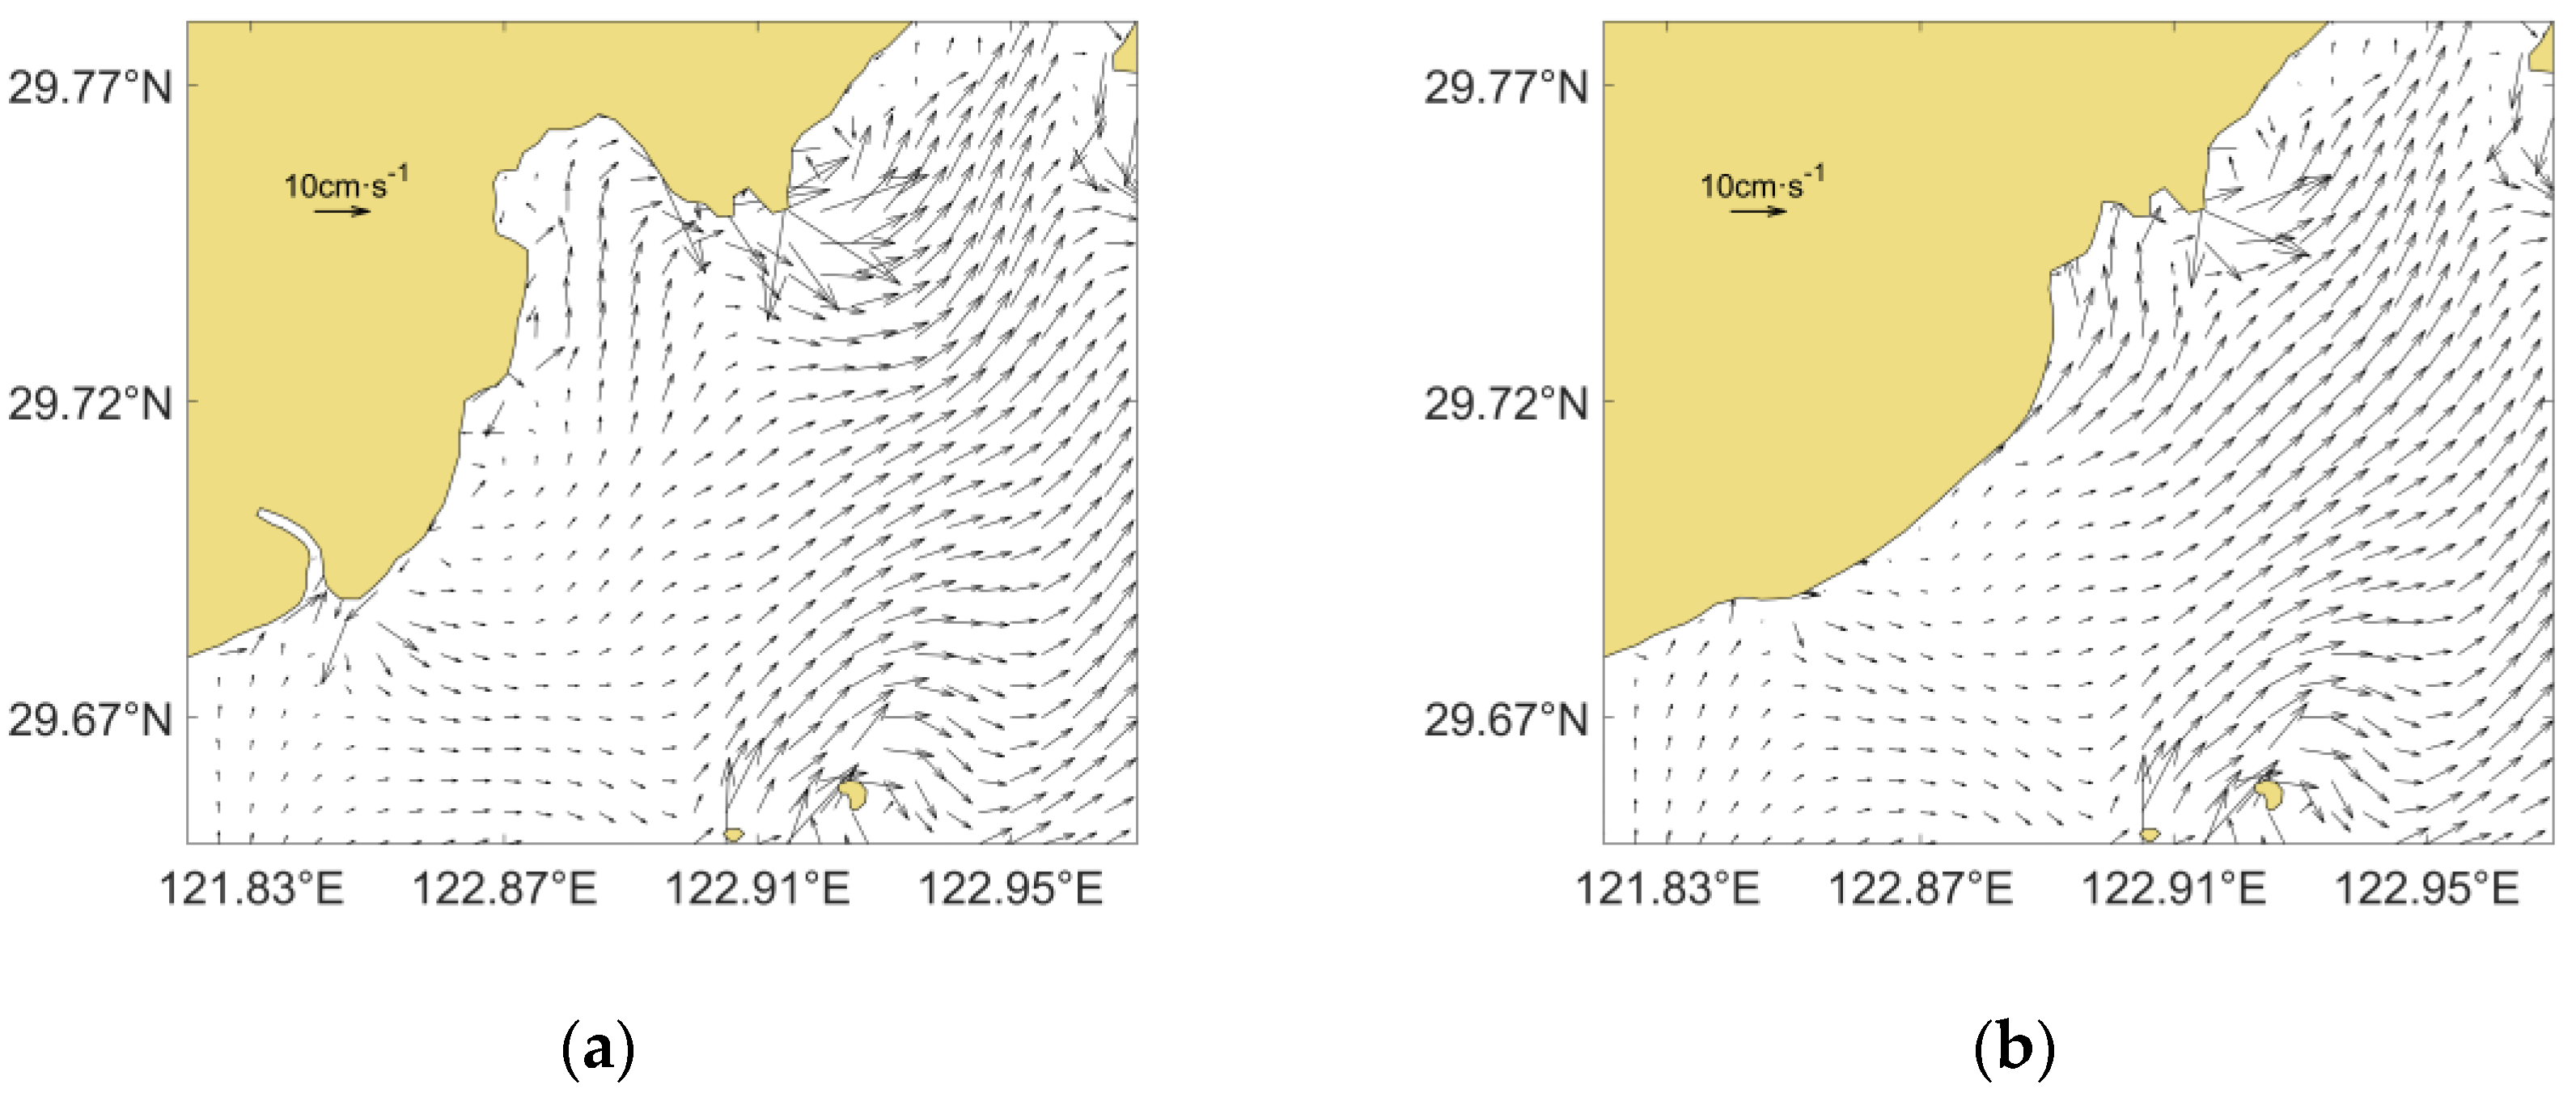
The distributions of surface residual currents in the surrounding sea areas before and after the change in the coastline in Area 2 are shown in
Figure 10a,b. The main changed area was near Dasong, where the direction of residual currents changed from south–north to southwest–northeast, with a slightly increasing tendency in velocity. However, the impact on the distribution of residual currents in distant areas is significant.
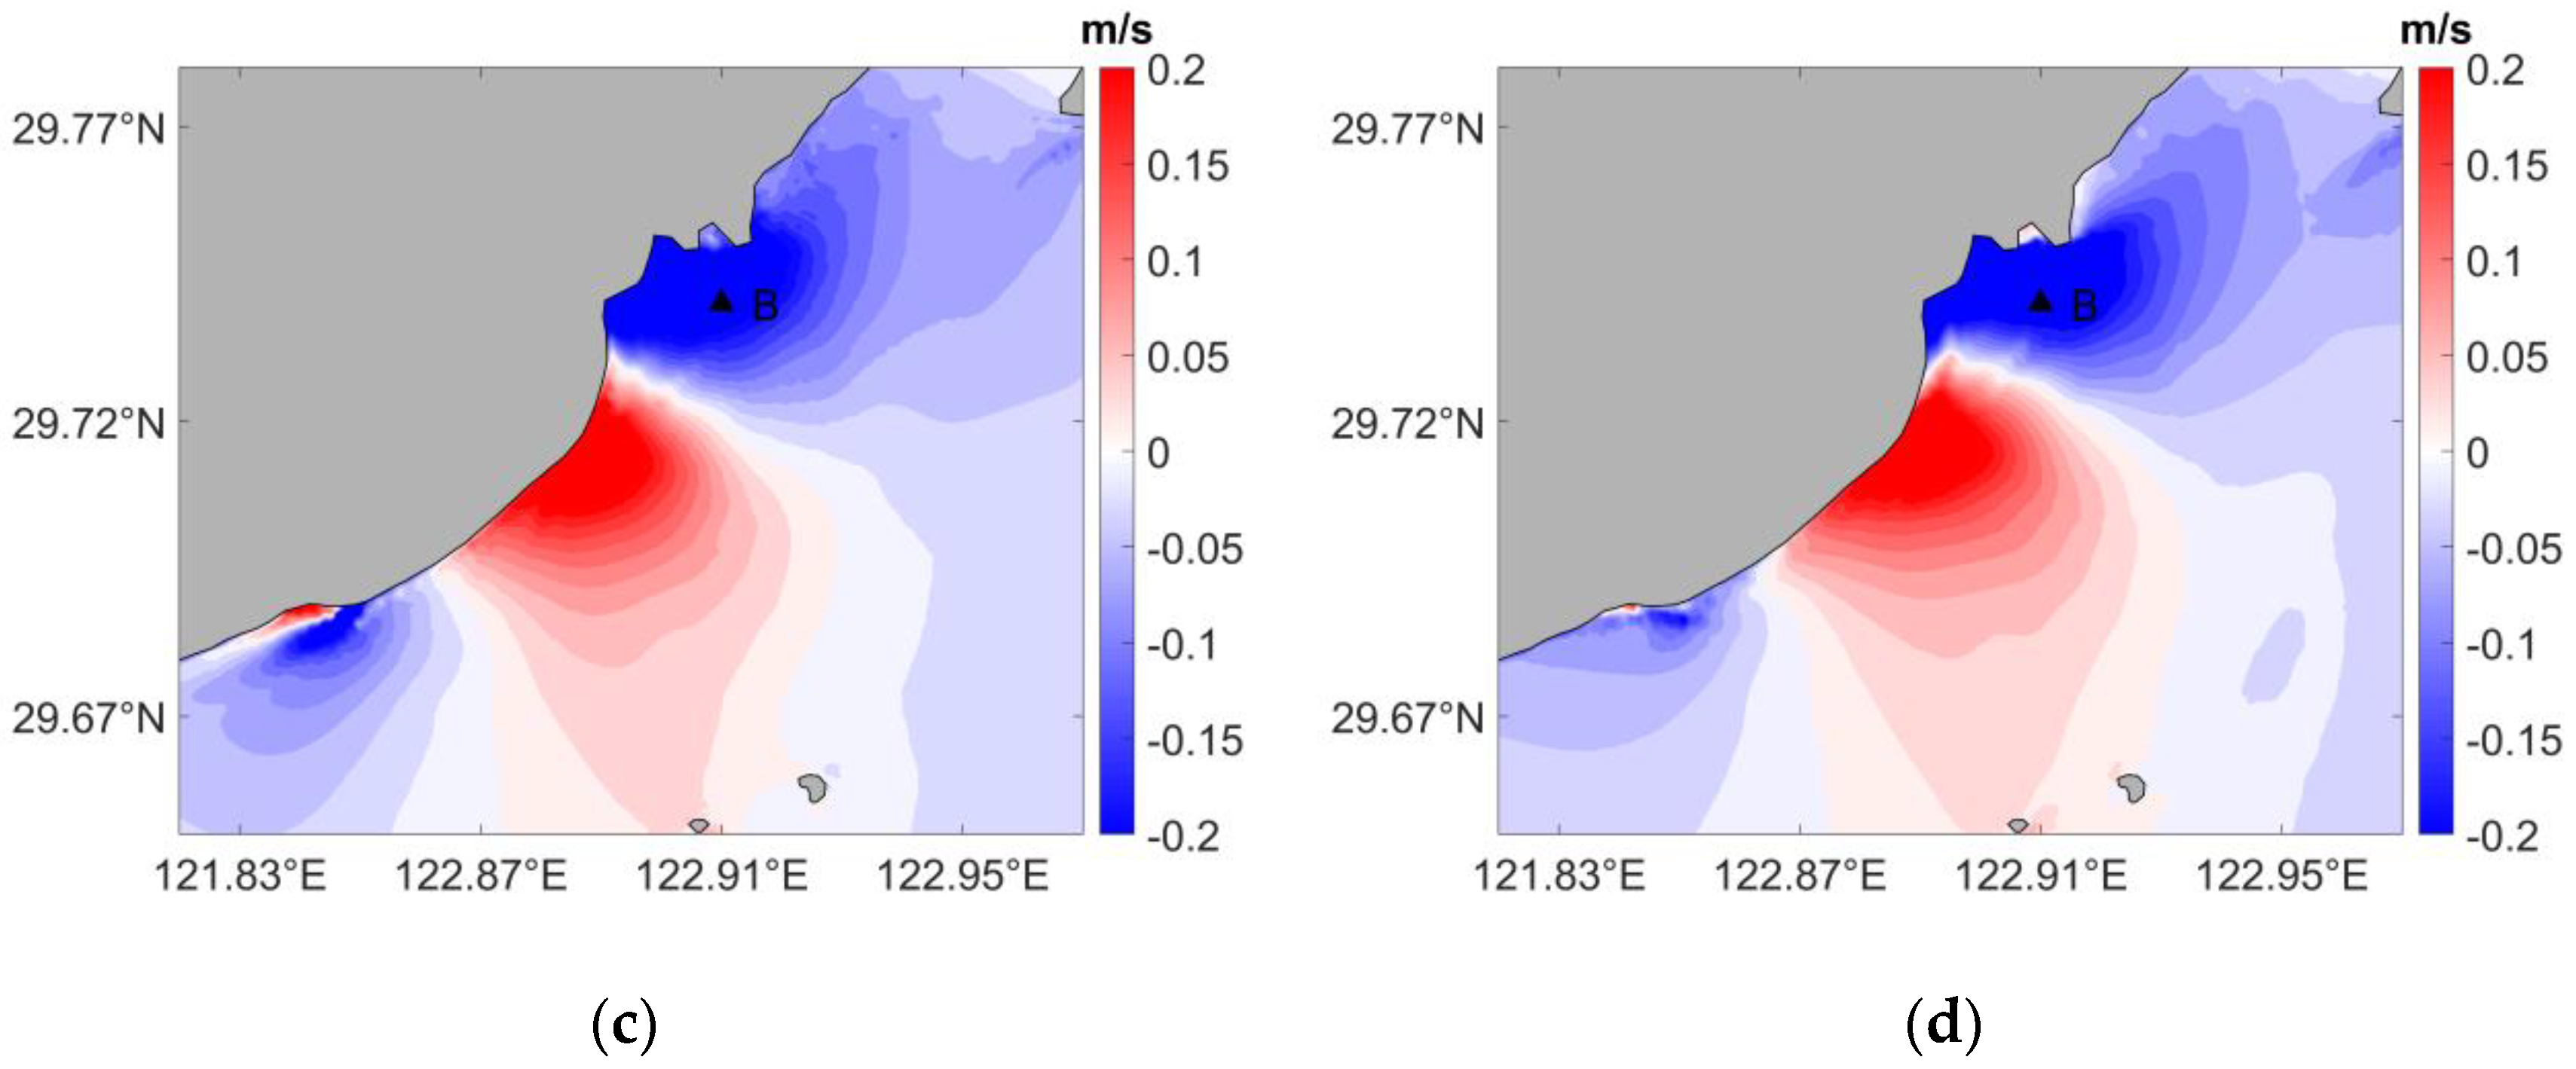
The changes in flood and ebb surface current velocities before and after the change in the coastline in Area 2 are shown in
Figure 10c,d. After the coastline changes, similar to Area 1, the velocity during flood tide and ebb tide in this area also showed an alternating effect (increasing and decreasing). However, the eastern side showed a decreasing trend while the western side showed an increasing trend. In this study, station B (29.74° N, 121.91° E) located at the center of the deceleration water area on the east side was selected to compare the changes in flood and ebb current velocities before and after the coastline change. Before the coastline change, the maximum current velocities for flood tide and ebb tide at Station B were 1.41 m/s and 1.27 m/s, with the average velocities being 0.87 m/s and 0.75 m/s, respectively. After the coastline change, the maximum current velocities for flood tide and ebb tide were 0.99 m/s and 0.90 m/s, with the average velocities being 0.61 m/s and 0.54 m/s, respectively. Compared to currents before the coastline change, the maximum flood and ebb current velocities at this point decreased by 0.42 m/s and 0.26 m/s, and the average velocities decreased by 19% and 28%, respectively.
3.3.3. Experimental C
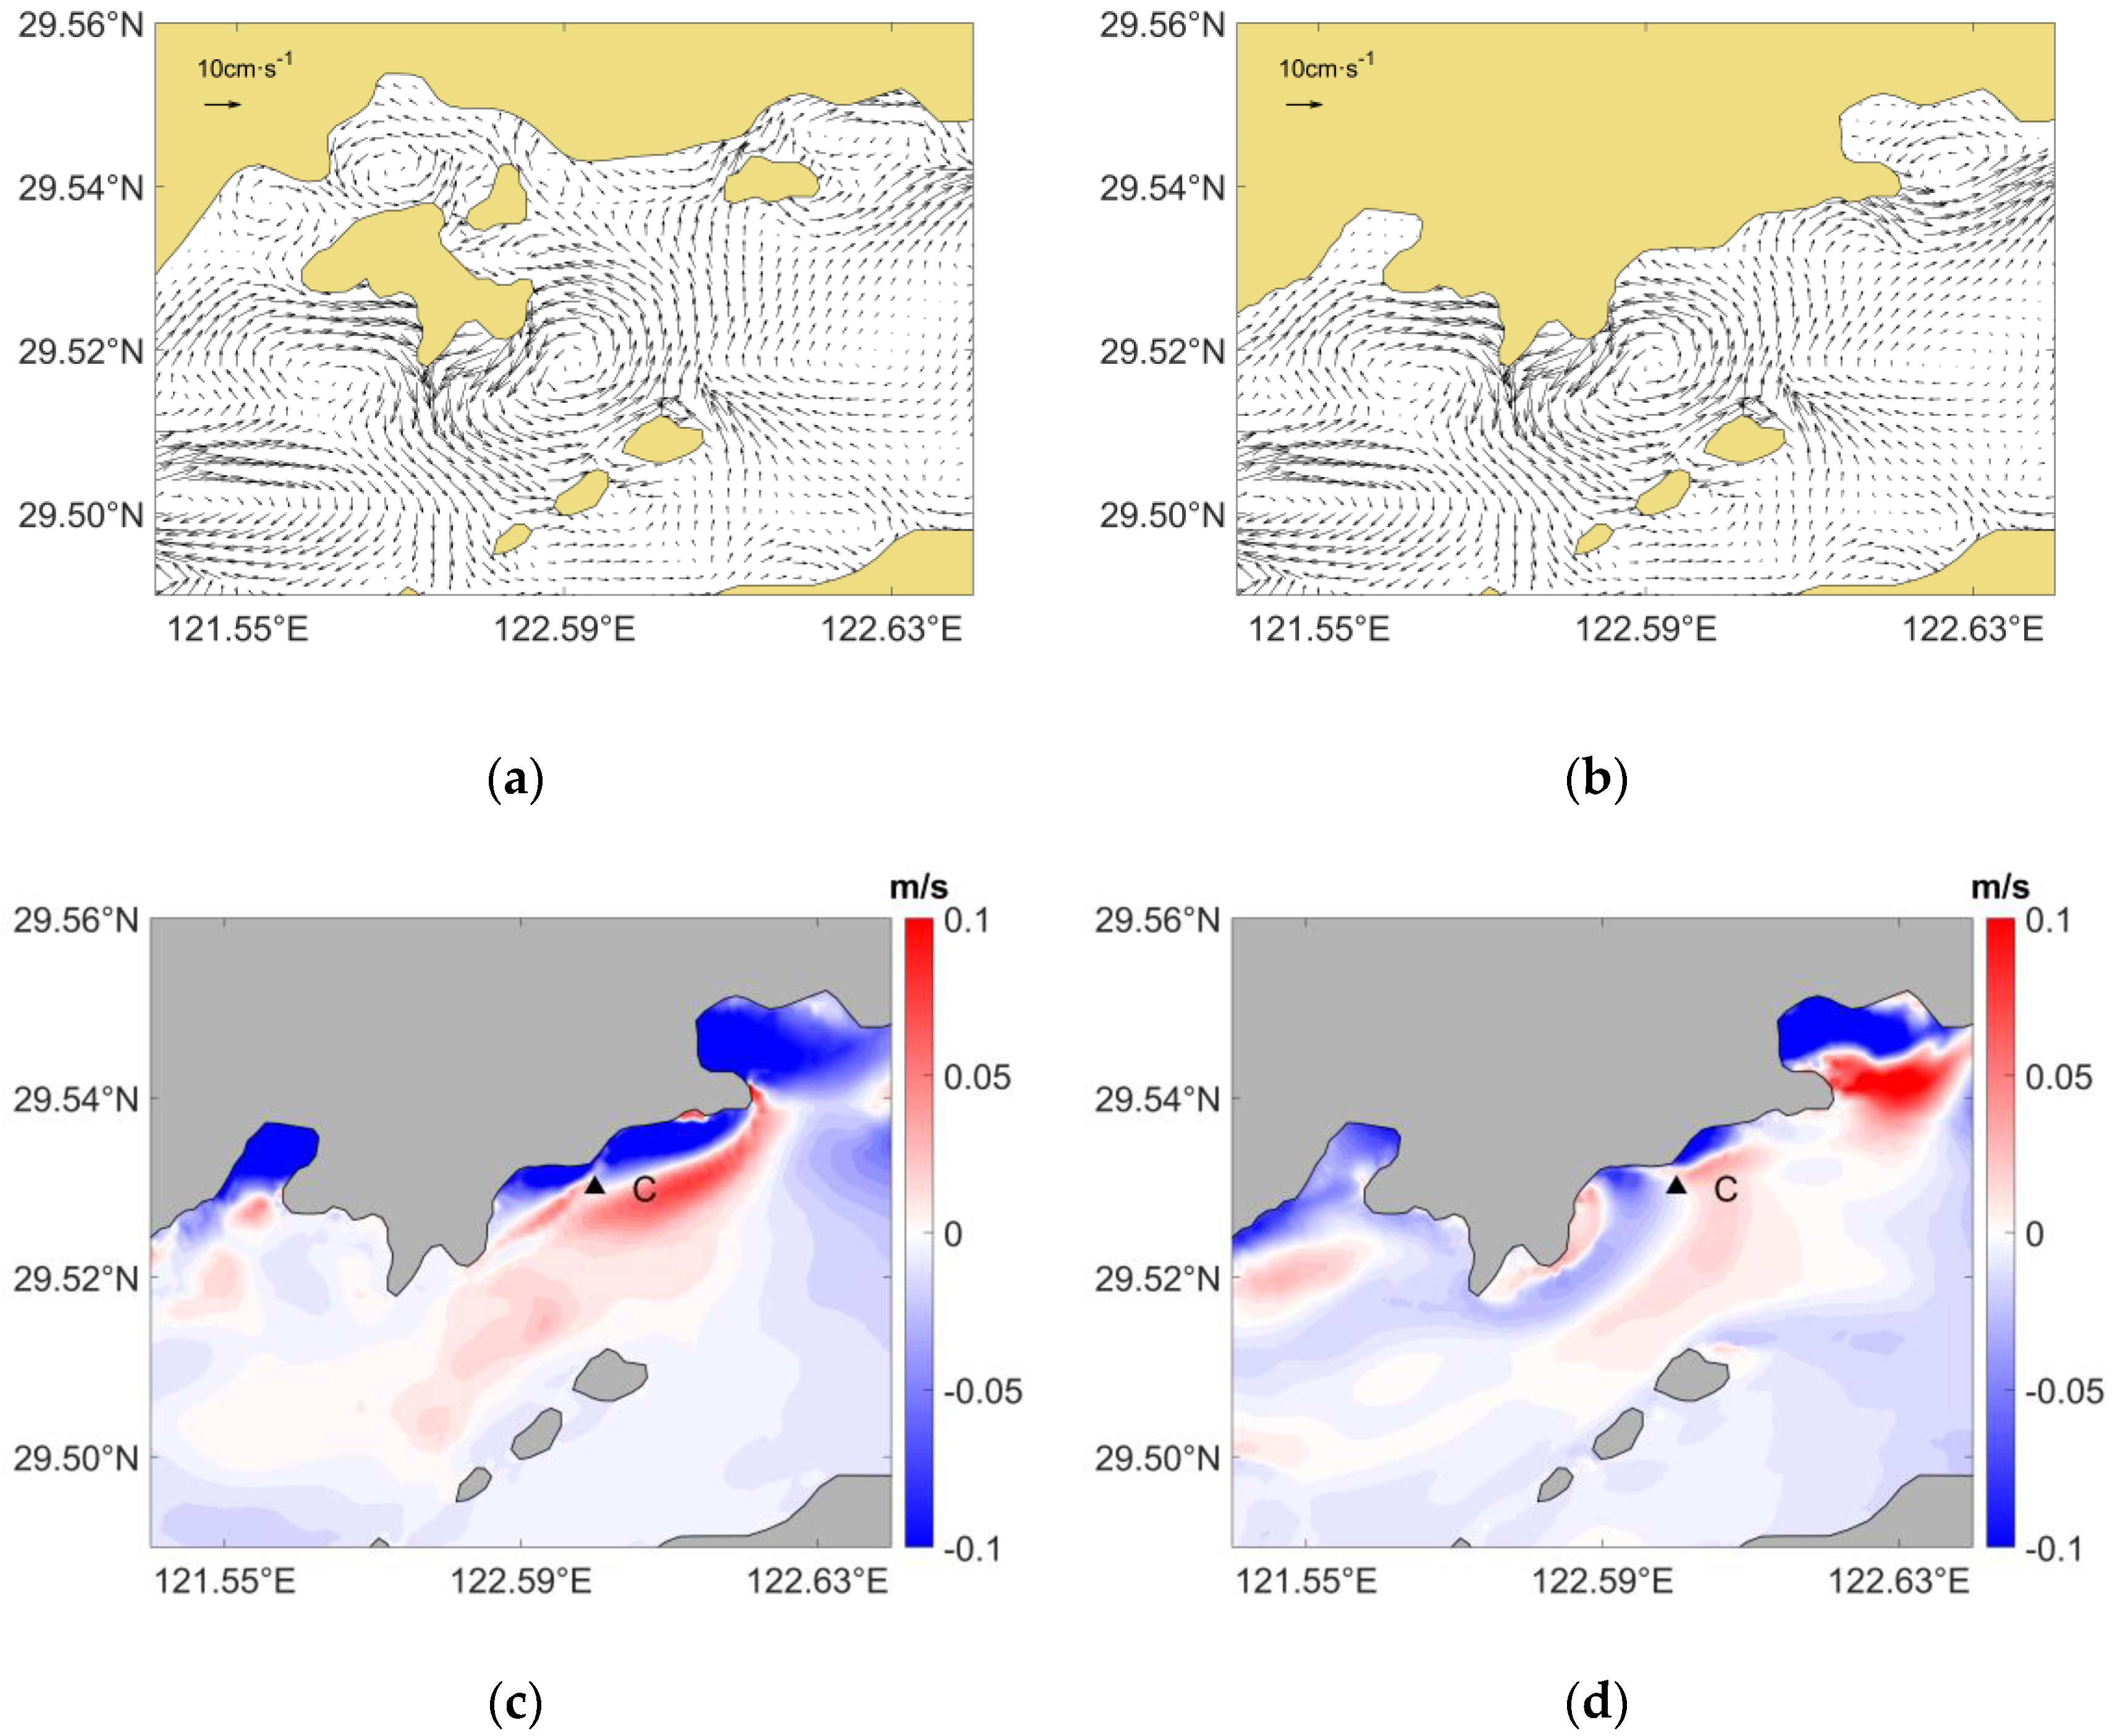
The surface residual current distributions of the surrounding before and after the coastline change in Area 3 are shown in
Figure 11a,b, whereas the changes in flood and ebb currents are shown in
Figure 11c,d. The residual current distribution of Experiment C was similar to that of the control experiment, whereas the tidal current changes were not as significant as in Area 1 and Area 2. The variations in velocities of peak flood and ebb tidal currents were not significant, and they primarily showed a decreasing trend. This study took Station C (29.53° N, 121.60° E) to compare the changes in flood and ebb current velocities before and after the coast changes.
Before the coastline change, the maximum current velocities for flood tide and ebb tide at Station C were 0.62 m/s and 0.63 m/s, with the average velocities being 0.34 m/s and 0.27 m/s, respectively. After the coastline change, the maximum current velocities for flood tide and ebb tide were 0.67 m/s and 0.52 m/s, with the average velocities being 0.35 m/s and 0.26 m/s, respectively. Compared to currents before the coastline change, the maximum flood current velocity increased by 0.05 m/s, whereas the maximum ebb current velocity decreased by 0.09 m/s. The average flood current velocity during flood time increased by 0.01 m/s, and the average ebb current velocity during ebb time decreased by 0.01 m/s at this station. Overall, the flow velocity changes at Station C were not significant, with slightly increased flood current velocity and slightly decreased ebb current velocity, which may have been related to the shortened duration of the flood tide and lengthened the duration of the ebb tide at this station after the coastal boundary changes.
3.3.4. Experimental D
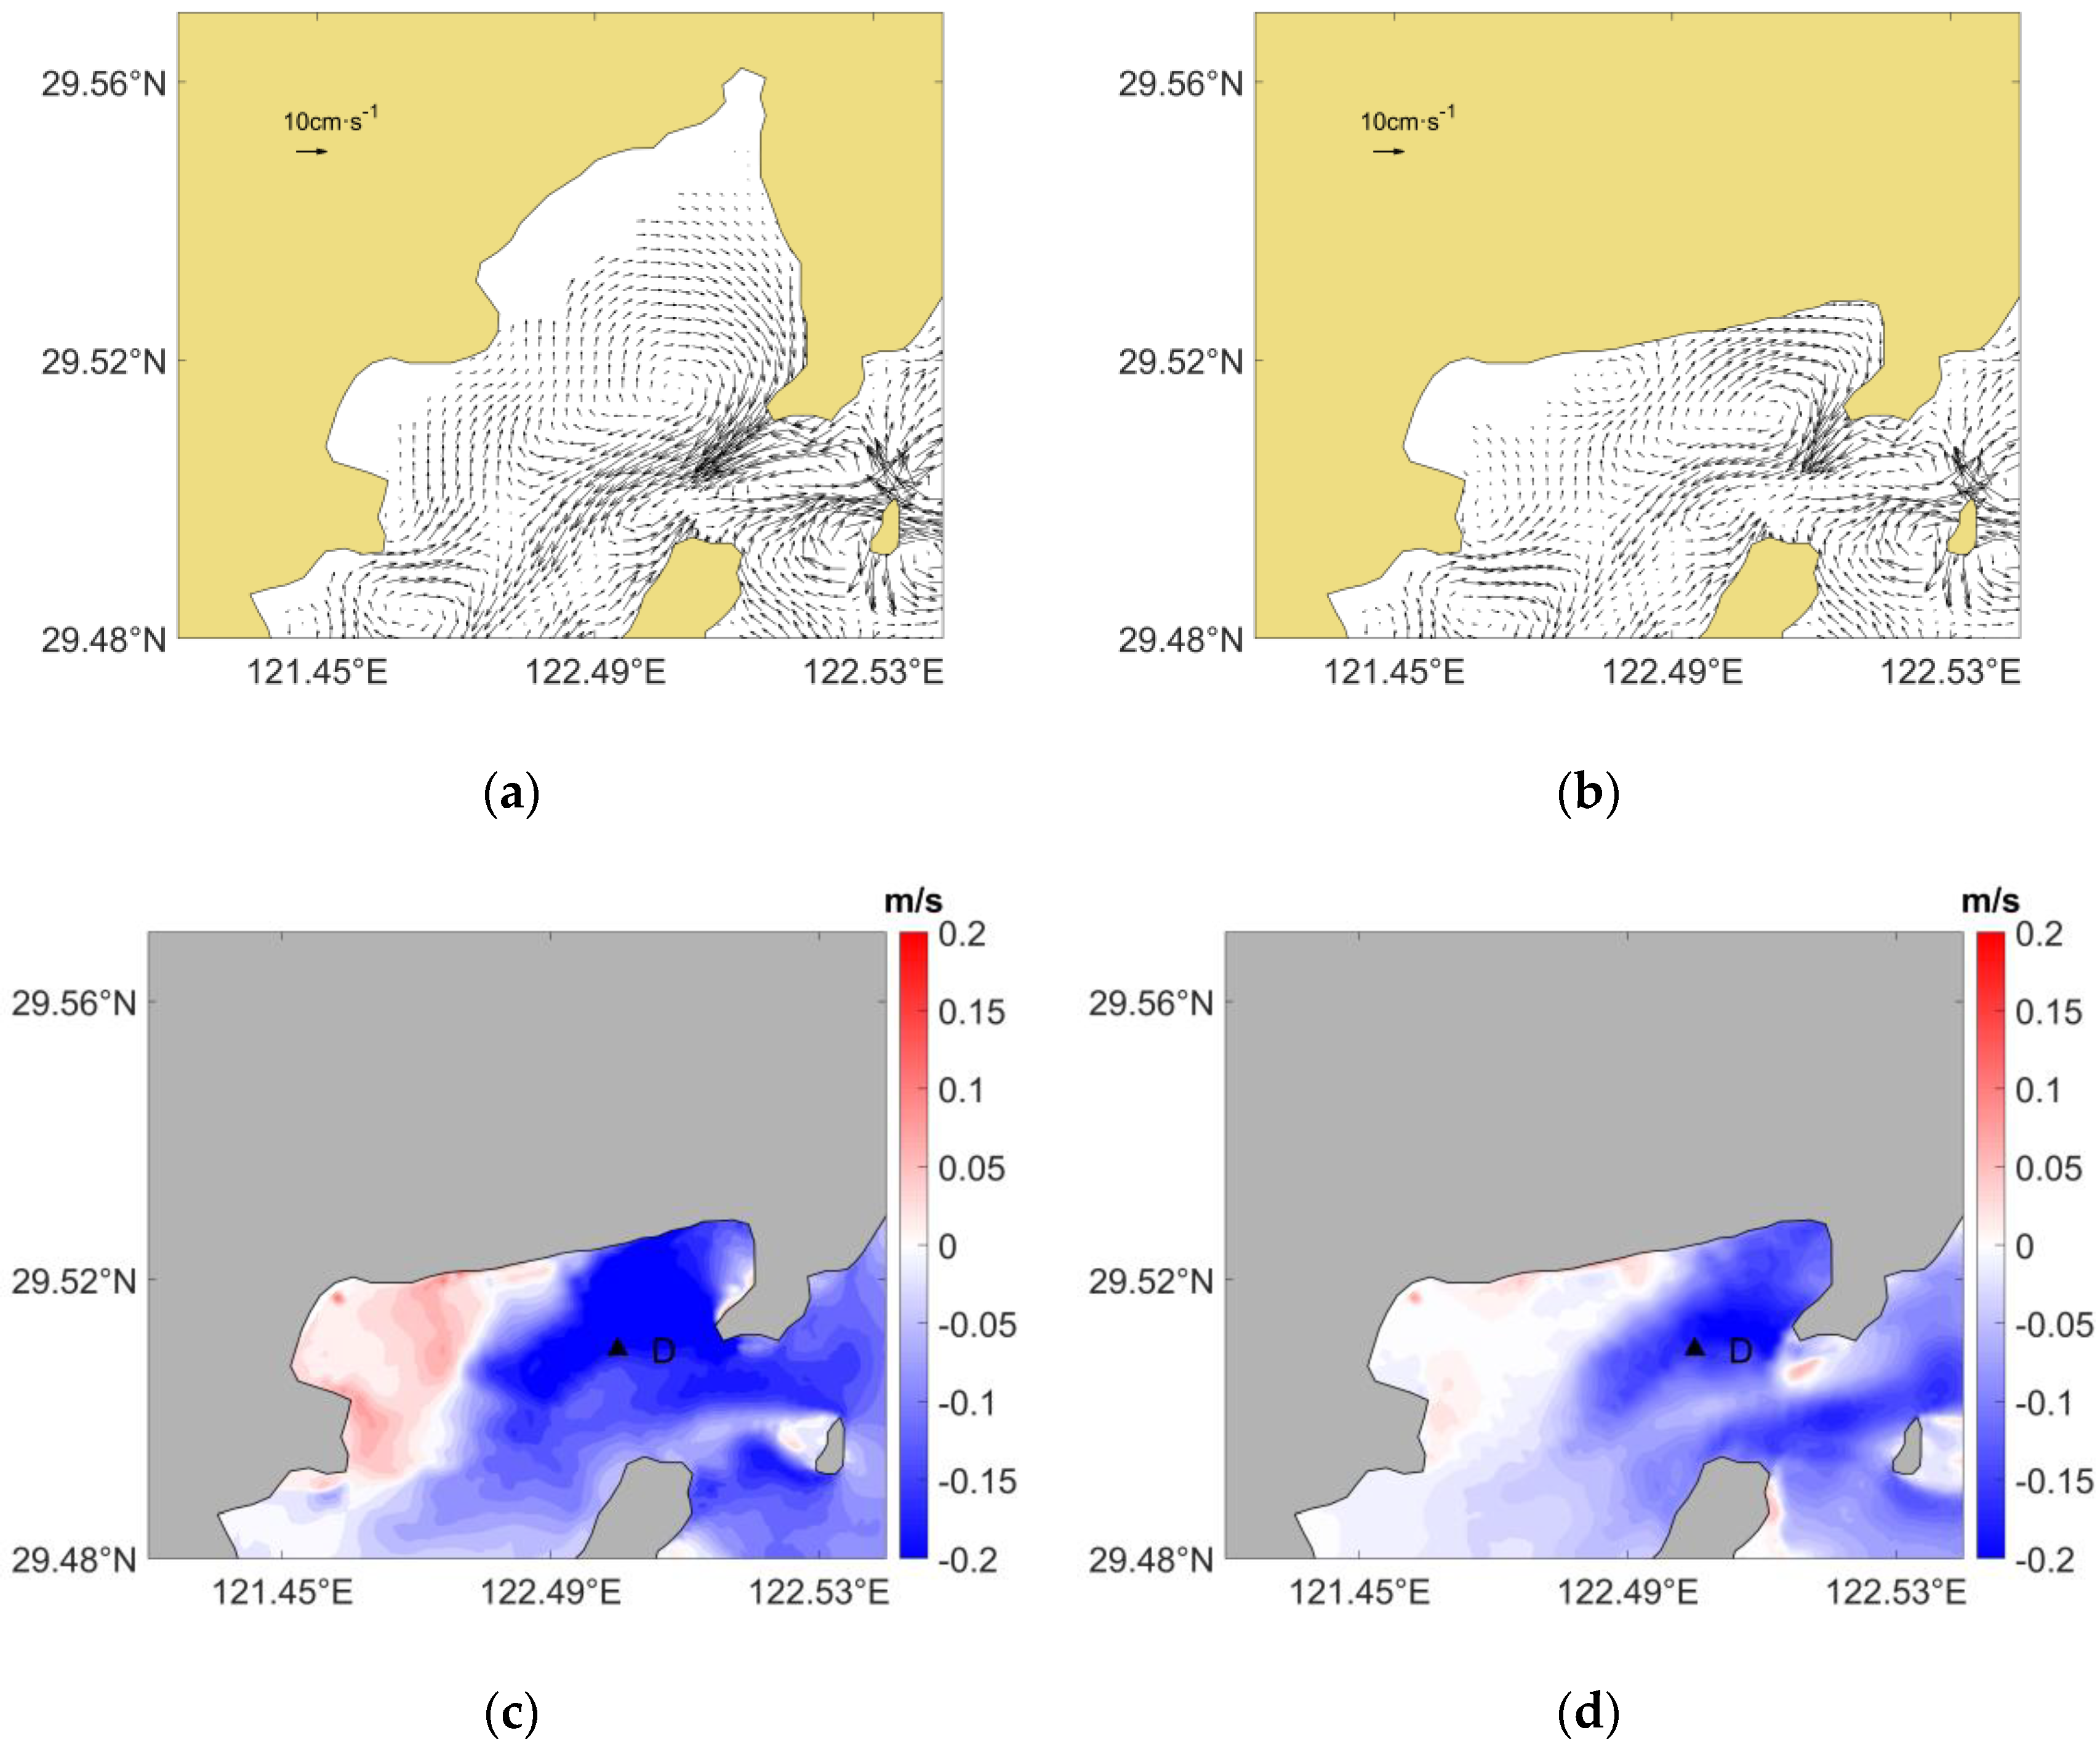
The distributions of surface residual currents in the surrounding before and after the change in the Area 4 coastline are shown in
Figure 12a,b, respectively. The main change occurred in the Tie inlet, where the direction of residual currents changed significantly. Previously, residual currents in the northern part of the Tie inlet exhibited a relatively regular clockwise rotation. However, after the change, residual currents could only rotate within a smaller range. Meanwhile, the velocity of the current in the Tie inlet also decreased noticeably. Especially at the narrow entrance of the Tie inlet, there used to be a strong northeast–southwest residual current. However, this residual current experienced a significant decrease in velocity.
The variations in the flood and ebb surface current velocities in the Tie inlet before and after the change in the Area 4 coastline are shown in
Figure 12c,d. The flood and ebb current velocities in Tie inlet generally decreased, with only a slight increase in the velocity of the flood current on the west side. Therefore, this study took the location of station D (29.51° N, 121.50° E) in the deceleration zone to compare the changes in flood and ebb current velocities before and after the coastline change. Before the coastline change, the maximum current velocities for flood tide and ebb tide at Station D were 0.25 m/s and 0.23 m/s, with the average velocities being 0.15 m/s and 0.13 m/s, respectively. After the coastline change, the maximum current velocities for flood tide and ebb tide were 0.11 m/s and 0.10 m/s, with the average velocities being 0.08 m/s and 0.07 m/s, respectively. Comparing currents before the coastline change, the maximum flood and ebb current velocities at this location decreased by 0.14 m/s and 0.13 m/s, whereas the average flood and ebb current velocities decreased by 0.07 m/s and 0.05 m/s, respectively. Overall, the current velocities at station D were small after the coastline changed, but the flood and ebb current velocities decreased after the change.
3.3.5. Experimental E
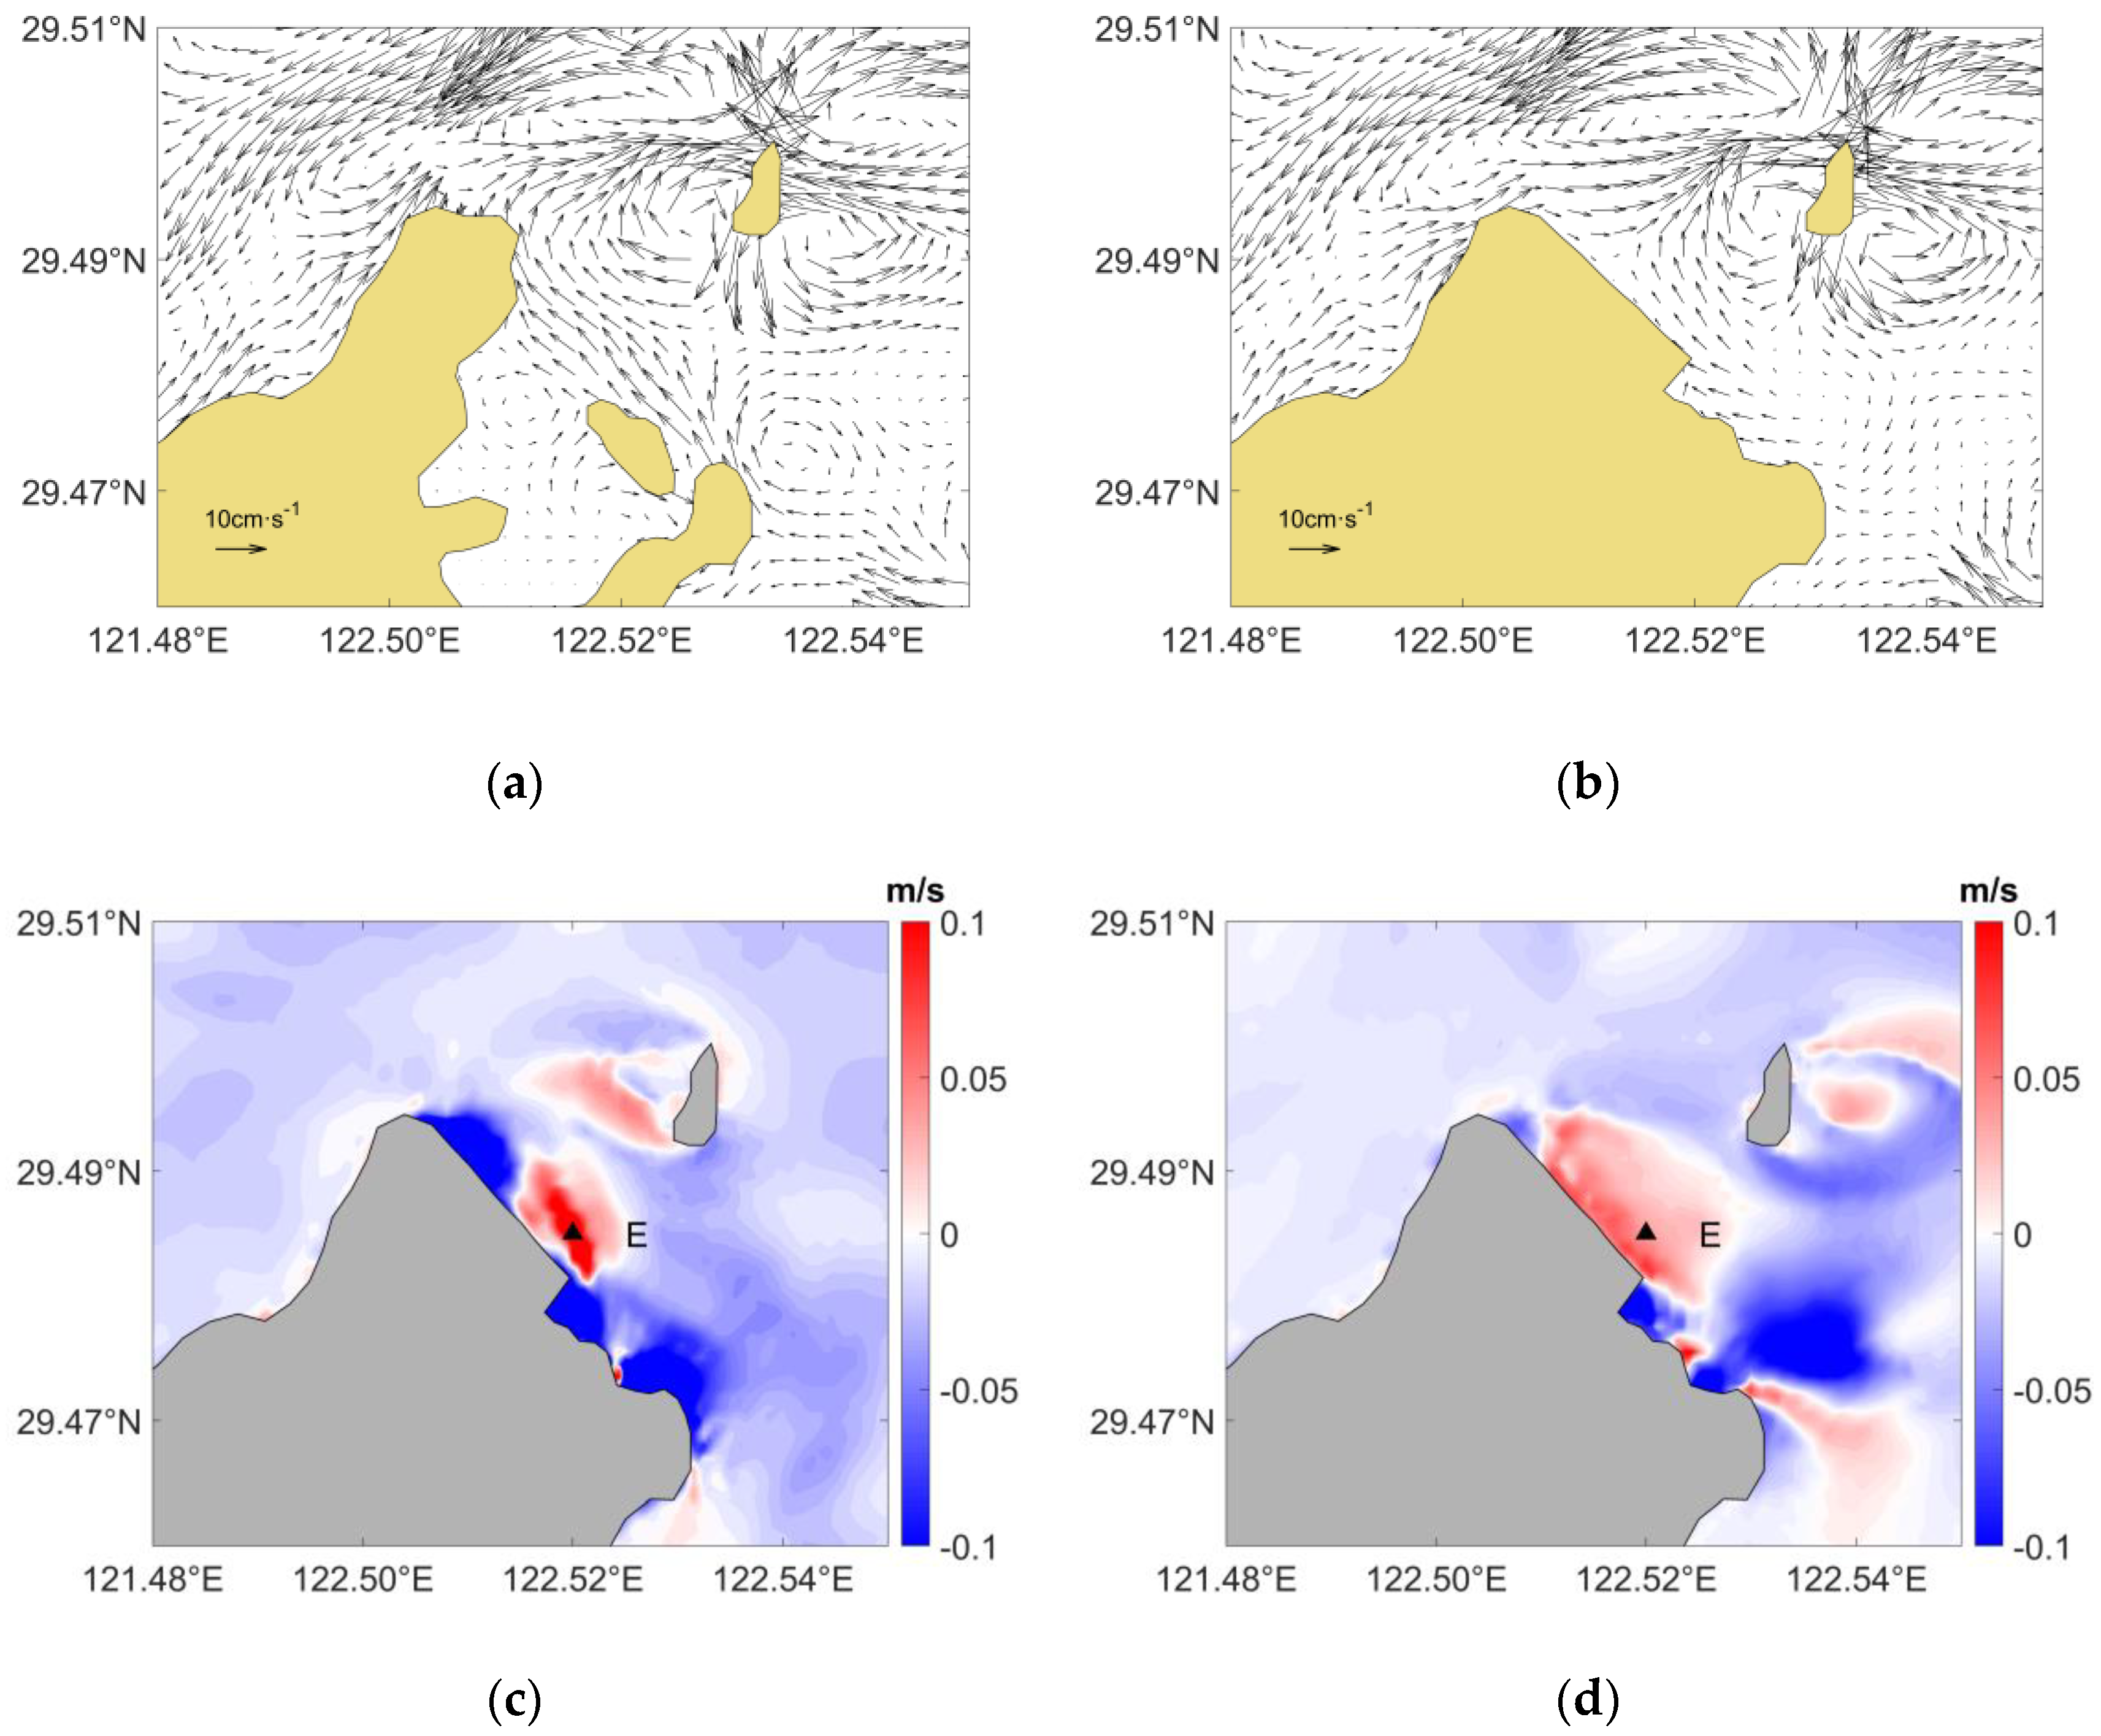
The distributions of surface residual currents in the surrounding before and after the change in the Area 5 coastline are shown in
Figure 13a,b. Overall, compared to the control experiment, the distribution of residual currents in Experiment E changed minimally, except for a small branch of residual current on the east side of the coastline change area, which originally flowed in a southeast–northwest direction but now flows in a southwest–northeast direction.
Figure 13c,d show the changes in the flood and ebb surface current velocities before and after the coastline change in Area 5. After the coastline change, the change in high tide/low tide current speed repeatedly increased and decreased in this area, but the amplitude and range were not as large as in Area 1 and Area 2. In this study, station E (29.485° N, 121.52° E) was selected in the acceleration area to compare the changes in flood and ebb current velocities before and after the coastline change. Before the coastline change, the maximum current velocities for flood tide and ebb tide at Station E were 0.62 m/s and 0.50 m/s, with the average velocities being 0.34 m/s and 0.23 m/s, respectively. After the coastline change, the maximum current velocities for flood tide and ebb tide were 0.87 m/s and 0.67 m/s, with the average velocities being 0.45 m/s and 0.29 m/s, respectively. Compared to currents before the coastline change, the maximum flood and ebb current velocities at this point increased by 0.25 m/s and 0.27 m/s, and the average flood and ebb current velocities increased by 32% and 26%, respectively.
4. Conclusions
Based on the FVCOM ocean numerical model, this study designed a set of control experiments and five sets of comparative experiments targeting the areas with significant coastline changes in Xiangshan Bay over the past 21 years. We analyzed the impact of coastline changes on the hydrodynamics of the Xiangshan Bay in different sections. The results obtained were as follows.
The control experiment showed that Xiangshan Bay was a typical semidiurnal bay, with the amplitude of M2 tide in the bay above 1.0 m. The amplitude increased from the Fodu channel and Niubishan channel to the inner bay, and then gradually decreased towards the head of the bay. The contour lines of M2 tidal phases were constrained by the orientation of Xiangshan Port, transitioning from a southwest–northeast direction near the open sea to a northwest–southeast direction in the inner bay. There was a significant correlation between the distribution of residual current and the distribution of coastline in Xiangshan Bay. The residual current direction and velocity in the inner bay were chaotic, whereas the currents in the mouth of the bay were uniform and faster. They were divided into two flows toward the Fodu channel and Niubishan channel, respectively.
Experiments A and B had a greater impact on the amplitude and phase because the coastline change area was close to the mouth of the bay. However, experiments C, D, and E had less significant changes, as the coastline changes were near the head of the bay, with only a slight decrease in amplitude around the coastline change area.
Through the comparison of tidal currents and residual currents in each experiment, the coastline changes near Meishan Island and the east side of Dasong had a significant impact on both non-periodic residual currents and periodic tidal currents. The coastline changes at these two locations influenced the direction of residual currents over a considerable range. There was a significant variation in the velocity of periodic tidal currents, with regions of increased and decreased velocities alternating. The coastline changes north of the Tie inlet had a certain impact on both the residual current and the periodic tidal current, mainly reducing their velocities. The coastline changes on the east side of Tongzhao and Qiangjiao had little effect on the residual current, whereas the impact scale of the tidal currents was relatively small.
In summary, coastline changes at the mouth of the bay had a greater impact on hydrodynamics, changing the amplitudes and phase distributions of tides. However, coastline changes in the inner bay have lesser impacts on hydrodynamics, mainly affecting surrounding areas, which may accelerate the transport of pollutants and nutrients.
It is worth noting that in this study, the friction coefficient values are assumed to be uniformly consistent. However, in reality, the bottom friction may vary across different regions, which will be taken into consideration in future studies.
Author Contributions
Conceptualization, S.H. and J.Z.(Juncheng Zuo); methodology, Y.X.; validation, Y.X., Y.W. and Y.Z.; formal analysis, Y.X.; data curation, Y.W.; writing—original draft preparation, Y.X.; writing—review and editing, J.Z.(Jiangning Zeng); visualization, Y.X. and Y.W. All authors have read and agreed to the published version of the manuscript.
Funding
This research was funded by National Key Research and Development Program of China, grant number 2021YFC3101702.
Data Availability Statement
No new data were created or analyzed in this study. Data sharing is not applicable to this article.
Conflicts of Interest
The authors declare no conflict of interest.
References
- Sheng, X.; Mao, X.; Yu, J.; Zhang, X.; Jiang, W.; Lu, Y. Modeling Lagrangian residual velocity in a tide-dominated long-narrow bay: Case study of the inner Xiangshan Bay. Estuar. Coast. Shelf Sci. 2022, 278, 108088. [Google Scholar] [CrossRef]
- Yin, M.; Cao, H.; Zhao, W.; Wang, T.; Huang, W.; Cai, M. Tide-driven microplastics transport in an elongated semi-closed bay: A case study in Xiangshan Bay, China. Sci. Total Environ. 2022, 846, 157374. [Google Scholar] [CrossRef] [PubMed]
- Ande, F.; Xisan, J. Tidal effect on nutrient exchange in Xiangshan Bay, China. Mar. Chem. 1989, 27, 259–281. [Google Scholar] [CrossRef]
- Gao, S.; Qin-Chun, X.; Ying-Jun, F. Fine-grained sediment transport and sorting by tidal exchange in Xiangshan Bay, Zhejiang, China. Estuar. Coast. Shelf Sci. 1990, 31, 397–409. [Google Scholar]
- Li, J.; Liu, Y.; Pu, R.; Yuan, Q.; Shi, X.; Guo, Q.; Song, X. Coastline and landscape changes in bay areas caused by human activities: A comparative analysis of Xiangshan Bay, China and Tampa Bay, USA. J. Geogr. Sci. 2018, 28, 1127–1151. [Google Scholar] [CrossRef] [Green Version]
- Hendriyono, W.; Wibowo, M.; Al Hakim, B.; Istiyanto, D.C. Modeling of sediment transport affecting the coastline changes due to infrastructures in Batang-Central Java. Procedia Earth Planet. Sci. 2015, 14, 166–178. [Google Scholar] [CrossRef] [Green Version]
- Almar, R.; Kestenare, E.; Reyns, J.; Jouanno, J.; Anthony, E.J.; Laibi, R.; Ranasinghe, R. Response of the Bight of Benin (Gulf of Guinea, West Africa) coastline to anthropogenic and natural forcing, Part1: Wave climate variability and impacts on the longshore sediment transport. Cont. Shelf Res. 2015, 110, 48–59. [Google Scholar] [CrossRef]
- Pérez-Arlucea, M.; González-Villanueva, R. Applied Sciences: “Coastal Deposits: Environmental Implications, Mathematical Modeling and Technological Development”. Appl. Sci. 2020, 11, 119. [Google Scholar] [CrossRef]
- Ai, B.; Zhang, R.; Zhang, H.; Ma, C.; Gu, F. Dynamic process and artificial mechanism of coastline change in the Pearl River Estuary. Reg. Stud. Mar. Sci. 2019, 30, 100715. [Google Scholar] [CrossRef]
- Lu, J.; Zhang, Y.; Lv, X.; Shi, H. The Temporal Evolution of Coastlines in the Bohai Sea and Its Impact on Hydrodynamics. Remote Sens. 2022, 14, 5549. [Google Scholar] [CrossRef]
- Mason, T.; Coates, T.T. Sediment transport processes on mixed beaches: A review for shoreline management. J. Coast. Res. 2001, 17, 645–657. [Google Scholar]
- Pelling, H.E.; Uehara, K.; Green, J.M. The impact of rapid coastline changes and sea level rise on the tides in the Bohai Sea, China. J. Geophys. Res. Ocean. 2013, 118, 3462–3472. [Google Scholar] [CrossRef] [Green Version]
- Zhang, R.; Chen, Y.; Chen, P.; Zhou, X.; Wu, B.; Kehao, C.; Yao, P. Impacts of tidal flat reclamation on suspended sediment dynamics in the tidal-dominated Wenzhou Coast, China. Front. Mar. Sci. 2023, 10, 24. [Google Scholar] [CrossRef]
- Li, L.; Guan, W.; Hu, J.; Cheng, P.; Wang, X.H. Responses of water environment to tidal flat reduction in Xiangshan Bay: Part I hydrodynamics. Estuar. Coast. Shelf Sci. 2018, 206, 14–26. [Google Scholar] [CrossRef]
- Chen, C.; Beardsley, R.C.; Cowles, G.; Qi, J.; Lai, Z.; Gao, G.; Stuebe, D.; Xu, Q.; Xue, P.; Ge, J.; et al. An Unstructured-Grid, Finite-Volume Community Ocean Model: FVCOM User Manual; Sea Grant College Program, Massachusetts Institute of Technology: Cambridge, MA, USA, 2012. [Google Scholar]
- Xu, Y.; Hu, S.; Li, Y. Extraction and Variation Study of Xiangshan Port Coastline Based on Different Shoreline Types. J. Ocean Technol. 2022, 41, 17–25. [Google Scholar]
- Erofeeva, S.; Egbert, G.D. TPXO9—A new global tidal model in TPXO series. In Proceedings of the 2018 Ocean Sciences Meeting, AGU, Portland, OR, USA, 11–16 February 2018. [Google Scholar]
- Xu, P.; Mao, X.; Jiang, W.; Zhou, L. A numerical study of tidal asymmetry: Preferable asymmetry of nonlinear mechanisms in Xiangshan Bay, East China Sea. J. Ocean Univ. China 2014, 13, 733–741. [Google Scholar] [CrossRef]
- Imasato, N. What is tide-induced residual current? J. Phys. Oceanogr. 1983, 13, 1307–1317. [Google Scholar] [CrossRef]
- Zhu, J.; Cao, Y. Application of FVCOM Model in Three-Dimensional Calculation of Tidal Flow and Salinity in Xiangshan Port. Mar. Environ. Sci. 2010, 29, 899–903. [Google Scholar]
- Pawlowicz, R.; Beardsley, B.; Lentz, S. Classical tidal harmonic analysis including error estimates in MATLAB using T_TIDE. Comput. Geosci. 2002, 28, 929–937. [Google Scholar] [CrossRef]
Figure 1.
Schematic diagram of the changes in the coastline of Xiangshan Bay. The red boxs indicate the main areas of coastline changes.
Figure 1.
Schematic diagram of the changes in the coastline of Xiangshan Bay. The red boxs indicate the main areas of coastline changes.
Figure 2.
Mesh of the control experiment.
Figure 2.
Mesh of the control experiment.
Figure 3.
Mesh of comparative experiments (A–E) changed area. Subfigures (A–E) represent the zoomed-in meshes of coastline changed Areas 1–5, respectively.
Figure 3.
Mesh of comparative experiments (A–E) changed area. Subfigures (A–E) represent the zoomed-in meshes of coastline changed Areas 1–5, respectively.
Figure 4.
Comparison of sea surface elevation at Xize station.
Figure 4.
Comparison of sea surface elevation at Xize station.
Figure 5.
M2 tidal amplitudes and phases from the control experiment.
Figure 5.
M2 tidal amplitudes and phases from the control experiment.
Figure 6.
M2 tidal amplitudes and phases from comparative experiments (A–E).
Figure 6.
M2 tidal amplitudes and phases from comparative experiments (A–E).
Figure 7.
Distribution of Eulerian residual current in the control experiment.
Figure 7.
Distribution of Eulerian residual current in the control experiment.
Figure 8.
Current changes in Area 1. (a) Residual currents distribution before the change in coastline; (b) Residual currents distribution after the change in coastline; (c) Changes in the velocity of the peak flood tidal currents; (d) Changes in the velocity of the peak ebb tidal currents.
Figure 8.
Current changes in Area 1. (a) Residual currents distribution before the change in coastline; (b) Residual currents distribution after the change in coastline; (c) Changes in the velocity of the peak flood tidal currents; (d) Changes in the velocity of the peak ebb tidal currents.
Figure 9.
Velocity changes in the peak flood tidal currents along Section A.
Figure 9.
Velocity changes in the peak flood tidal currents along Section A.
Figure 10.
Current changes in Area 2. (a) Residual currents distribution before the change in coastline; (b) Residual currents distribution after the change in coastline; (c) Changes in the velocity of the peak flood tidal currents; (d) Changes in the velocity of the peak ebb tidal currents.
Figure 10.
Current changes in Area 2. (a) Residual currents distribution before the change in coastline; (b) Residual currents distribution after the change in coastline; (c) Changes in the velocity of the peak flood tidal currents; (d) Changes in the velocity of the peak ebb tidal currents.
Figure 11.
Current changes in Area 3. (a) Residual currents distribution before the change in coastline; (b) Residual currents distribution after the change in coastline; (c) Changes in the velocity of the peak flood tidal currents; (d) Changes in the velocity of the peak ebb tidal currents.
Figure 11.
Current changes in Area 3. (a) Residual currents distribution before the change in coastline; (b) Residual currents distribution after the change in coastline; (c) Changes in the velocity of the peak flood tidal currents; (d) Changes in the velocity of the peak ebb tidal currents.
Figure 12.
Current changes in Area 4. (a) Residual currents distribution before the change in coastline; (b) Residual currents distribution after the change in coastline; (c) Changes in the velocity of the peak flood tidal currents; (d) Changes in the velocity of the peak ebb tidal currents.
Figure 12.
Current changes in Area 4. (a) Residual currents distribution before the change in coastline; (b) Residual currents distribution after the change in coastline; (c) Changes in the velocity of the peak flood tidal currents; (d) Changes in the velocity of the peak ebb tidal currents.
Figure 13.
Current changes in Area 5. (a) Residual currents distribution before the change in coastline; (b) Residual currents distribution after the change in coastline; (c) Changes in the velocity of the peak flood tidal currents; (d) Changes in the velocity of the peak ebb tidal currents.
Figure 13.
Current changes in Area 5. (a) Residual currents distribution before the change in coastline; (b) Residual currents distribution after the change in coastline; (c) Changes in the velocity of the peak flood tidal currents; (d) Changes in the velocity of the peak ebb tidal currents.
Table 1.
Configurations of key model parameters.
Table 1.
Configurations of key model parameters.
| Model Parameter | Value |
|---|
| Model time setup | 1.0 s |
| Bottom friction coefficient | 0.0003 |
| Vertical eddy viscosity | M-Y 2.5 turbulent closure |
| Vertical layers | 11 uniform sigma layers |
| Open boundary condition | Sea surface elevation time series from TPXO9 |
Table 2.
Various experimental model configuration.
Table 2.
Various experimental model configuration.
| Experiments | Descriptions | Nodes | Elements |
|---|
| Control experiment | 2002 coastlines | 15,412 | 29,089 |
| Experiment A | Changed Area 1 (near Meishan Island) | 15,001 | 28,322 |
| Experiment B | Changed Area 2 (the east side of Dasong) | 15,159 | 28,613 |
| Experiment C | Changed Area 3 (the east side of Tongzhao) | 14,905 | 28,160 |
| Experiment D | Changed Area 4 (the north of Tie inlet) | 15,234 | 28,751 |
| Experiment E | Changed Area 5 (near Qiangjiao) | 15,242 | 28,796 |
| Disclaimer/Publisher’s Note: The statements, opinions and data contained in all publications are solely those of the individual author(s) and contributor(s) and not of MDPI and/or the editor(s). MDPI and/or the editor(s) disclaim responsibility for any injury to people or property resulting from any ideas, methods, instructions or products referred to in the content. |
© 2023 by the authors. Licensee MDPI, Basel, Switzerland. This article is an open access article distributed under the terms and conditions of the Creative Commons Attribution (CC BY) license (https://creativecommons.org/licenses/by/4.0/).


