1. Introduction
Accurate tracking of objects in an image scene is of utmost importance in physics and engineering. Cross-correlation is the most frequently used method for establishing the similarity of two images and tracking changes with time, including relative locations. Although other methods are proposed in the bibliography, e.g., centroid calculation [
1] or object recognition and characterization [
2], cross-correlation presents clear advantages over these: on the one side, it is very robust with signals corrupted with Gaussian noise, which is the most typical case in images [
3]. On the other side, correlation does not require a priori knowledge or characterization of a target since it is based on direct comparison, thus widening its applicability. Additionally, it can be expressed in terms of the Fast Fourier Transform, thus allowing efficient computation algorithms, which may be very convenient for large image sequences.
Cross-correlation has been successfully applied in many fields like Geotechnics [
4], Structural Engineering [
5], Material Sciences [
6], or Particle Image Velocimetry [
7]. However, many of these applications require refined correlation results since they are based on tracking displacements or deformations smaller than the maximum system resolution, thus requiring the application of subpixel methods.
In the literature, we can find several strategies for achieving subpixel accuracy with cross-correlation. The simplest approach consists of interpolating the object and the target to obtain intermediate matching positions [
8]. The method is easy and straight, although it is computationally inefficient and not accurate for very small displacements.
A better alternative consists of interpolating neither the scene nor the target, but the cross-correlation peak instead. Under this premise, a small neighborhood around the correlation peak is fitted to a known continuous and derivable function, and the peak position is recalculated with the fitting function [
9]. This approach is commonly used with pseudo-speckle patterns applied to solid materials to measure local deformations [
10], although the technique can also be successfully used with natural textures [
11].
The method is computationally efficient, and, with proper election of the fitting area and the interpolant function, the resolution of the cross-correlation can be increased by more than two orders of magnitude.
Independent of the implemented method, the use of interpolation in the cross-correlation method introduces a systematic error in the target position determination called “peak-locking error”. This error consists of a bias in the peak location with a deviation towards the closest integer [
12]. This effect has been largely analyzed, and different proposals have been made in order to minimize its effect, although none of the proposals have been totally effective in canceling the effect [
9].
Recently, a new method for tracking objects with subpixel accuracy was proposed [
13]. The accuracy of this method does not rely on spatial interpolation but on tracking the luminance changes that a moving object provokes in the sensor. A similar effect was used in [
14] in order to establish a limit to the subpixel accuracy that is achievable with a sequence of images. In [
15,
16], the authors propose using these changes to obtain the vibration frequency of an object in a scene, but none of these proposals were able to quantify the amount and direction of the shifting produced.
In brief, the method introduced by Wan et al. [
13] proposes the calculation of the difference between an image and its displaced version, and this difference is used to derive two parameters that are associated with horizontal and vertical shifting. Assuming a small movement, these parameters are directly proportional to the actual shifting that has occurred. The discrete subtraction method (DSM) has been proposed for the estimation of subpixel motion with its advantages of accuracy, simplicity, and low computational cost compared with correlation. The method was verified using a 4-f imaging system, and the minimum translation was 0.27 pixels [
17]. Since it does not require numerical interpolation, it will not be affected by the peak-locking error, which is a major advantage over the classical correlation approach. On the negative side, it needs precise calibration of the parameters TC and TR, and its robustness against noise and image artifacts has yet to be studied and characterized.
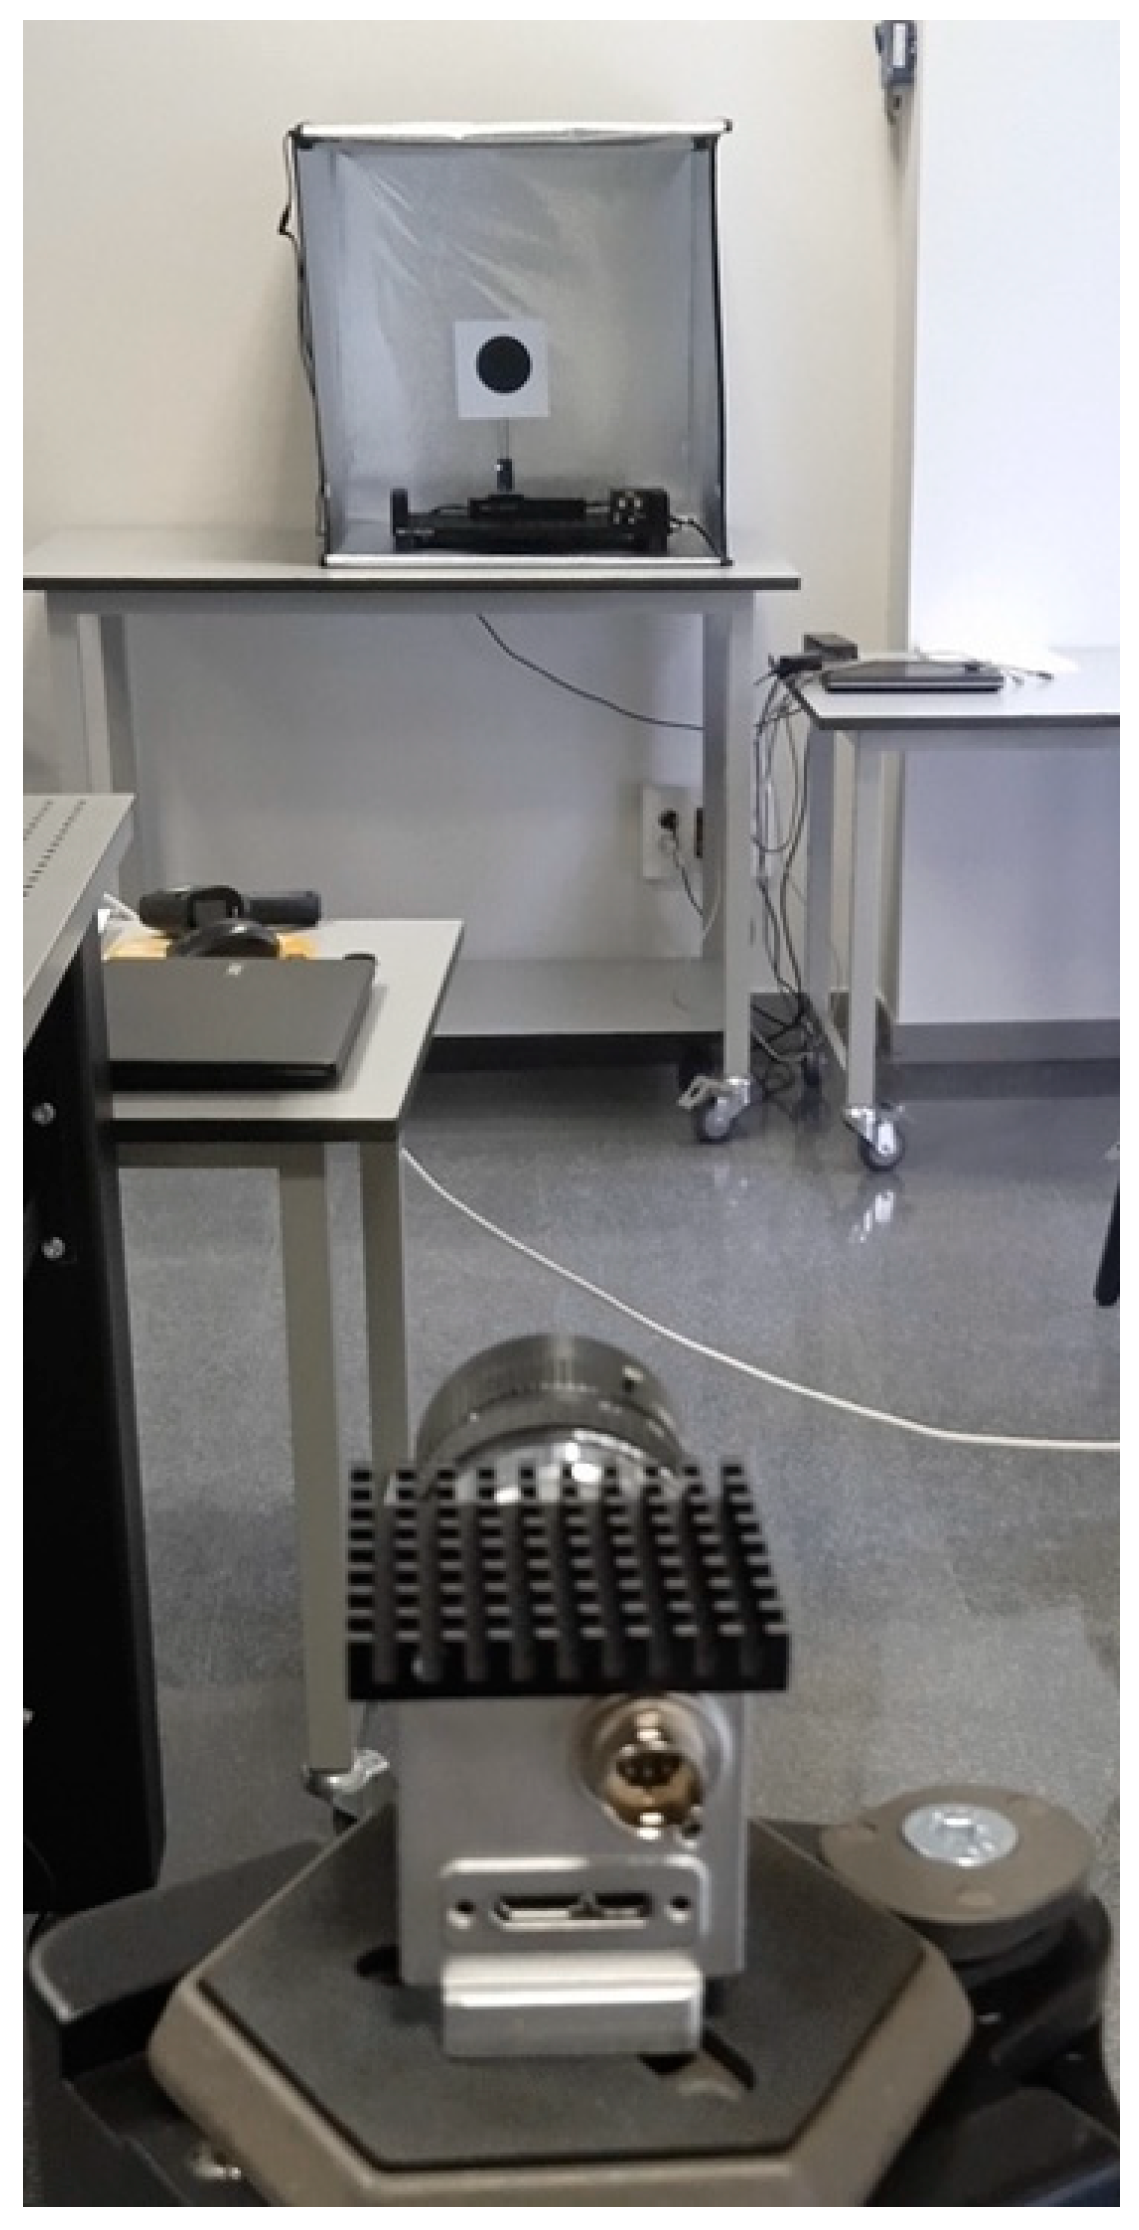
In this manuscript, we propose a validation and evaluation of the DSM technique in comparison to cross-correlation between images, utilizing analytical fitting of the correlation peak. We conducted several sequences with different targets. By employing a micrometric linear motorized stage and a properly calibrated camera, we can achieve apparent displacements of 0.002 pixels on the camera sensor between frames, surpassing the theoretical detection limit for 8-bit images [
18] and being 100 times smaller than the previous test [
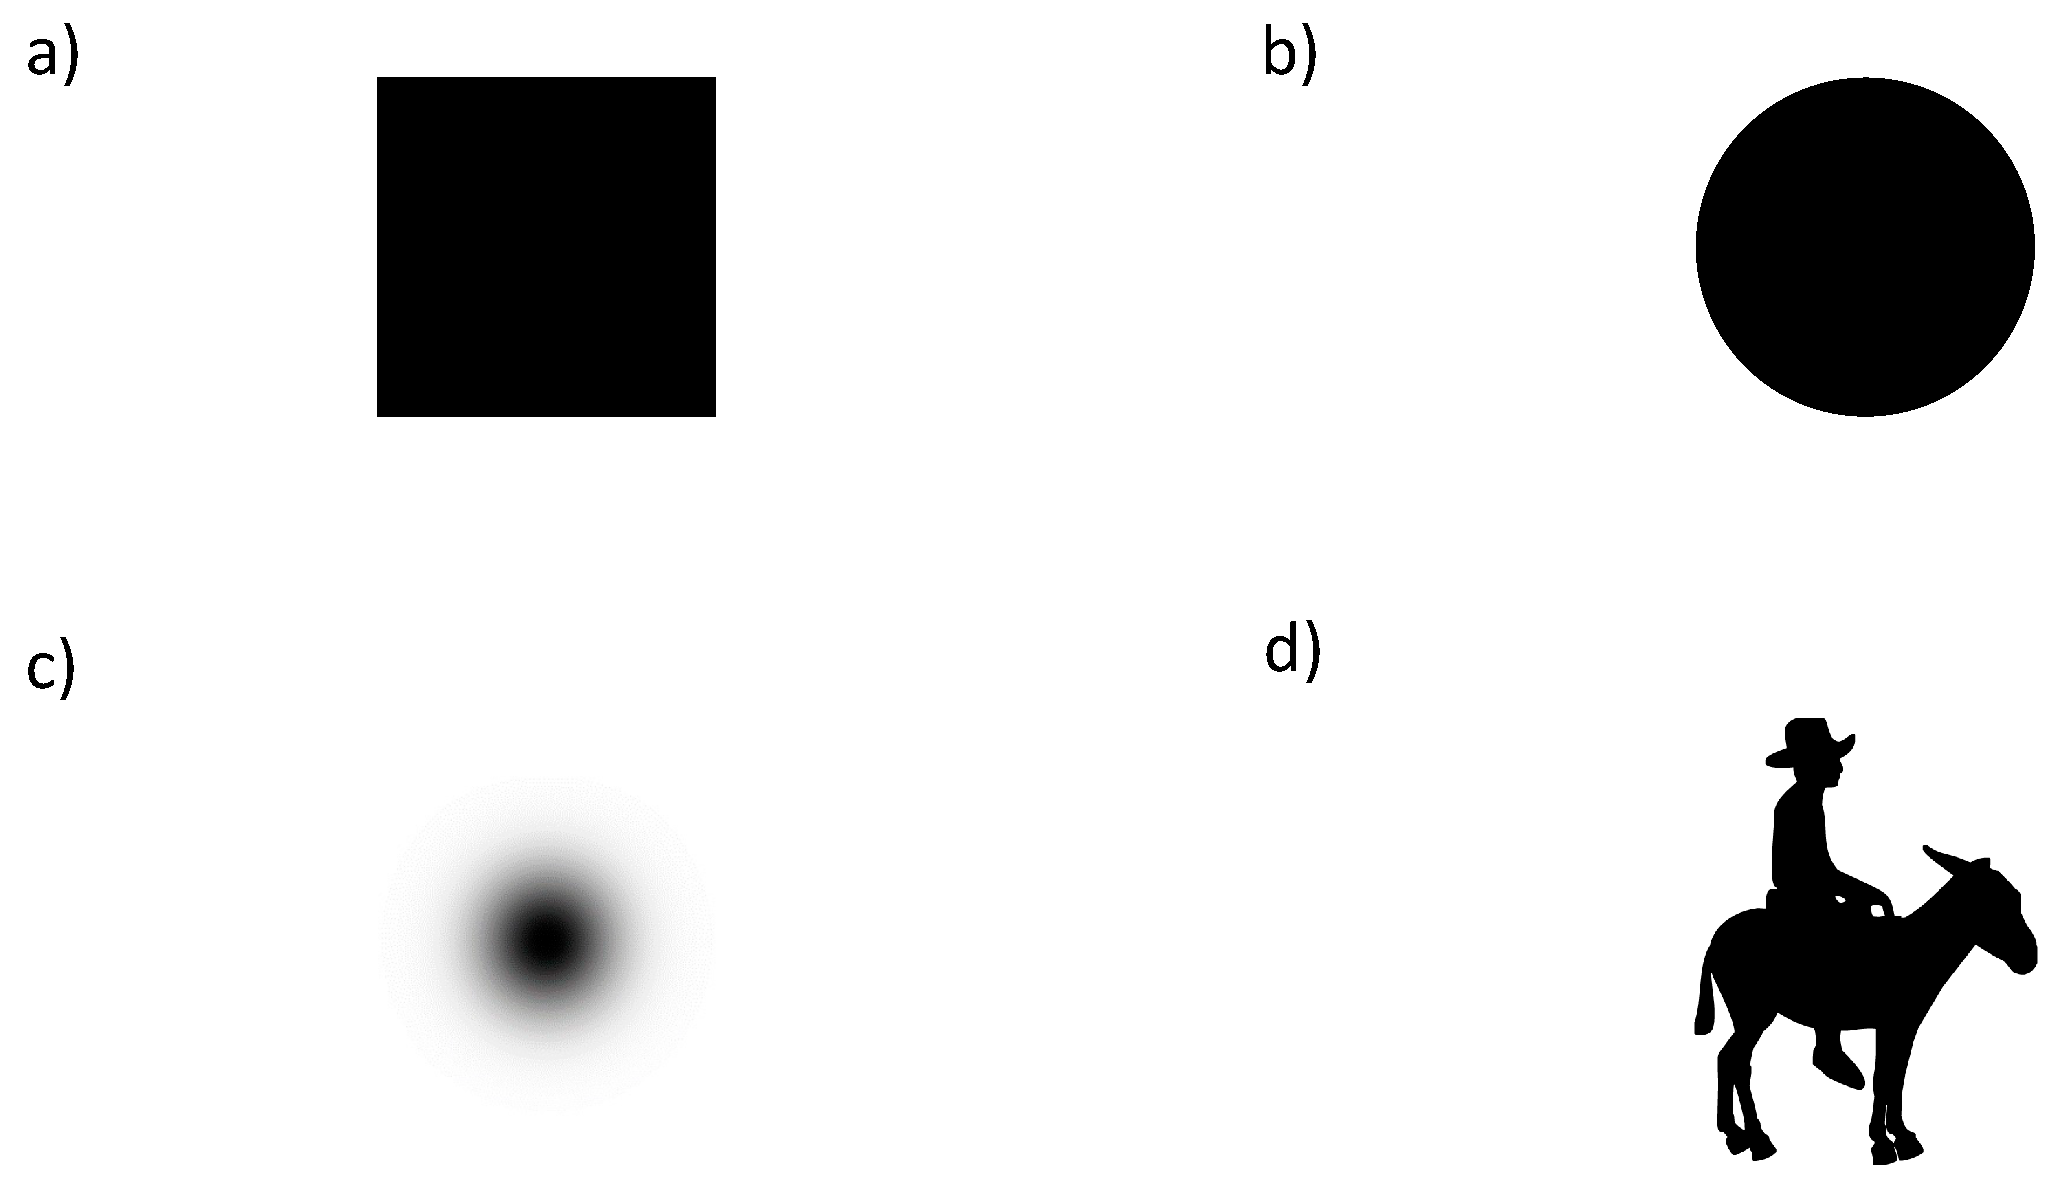
17]. Since our aim is to assess the ideal performance of the methods in the laboratory, we utilized simple target shapes such as a rectangle, a circle, and a Gaussian profile. Additionally, we introduced a more complex target to evaluate the accuracy of both methods for non-symmetrical objects.
Through these tests, we analyzed not only the methods’ ability to register subpixel displacements but also factors such as tracking noise and systematic deviations, including tracking errors. Our findings demonstrate that DSM is a fast and accurate method for tracking objects with subpixel precision, and it may complement the correlation method in some precise tasks.
The manuscript is structured as follows: In
Section 2, the materials and methods for the experiments are described. In
Section 3, the main results are presented and discussed. Finally, in
Section 4, we discuss the main conclusions obtained with our tests.
3. Results and Discussion
Calculations were performed with our own software, which can be freely downloaded from [
20]. We would like to remark that, in general, with our own software, the calculation time for the DSM method was one order of magnitude lower than the time consumed by the correlation method.
In the first place, the real accuracy of the method was checked. To this end, 2000 frames taken in the middle of the trajectory were selected, and the interframe displacement was calculated. Notice that, according to [
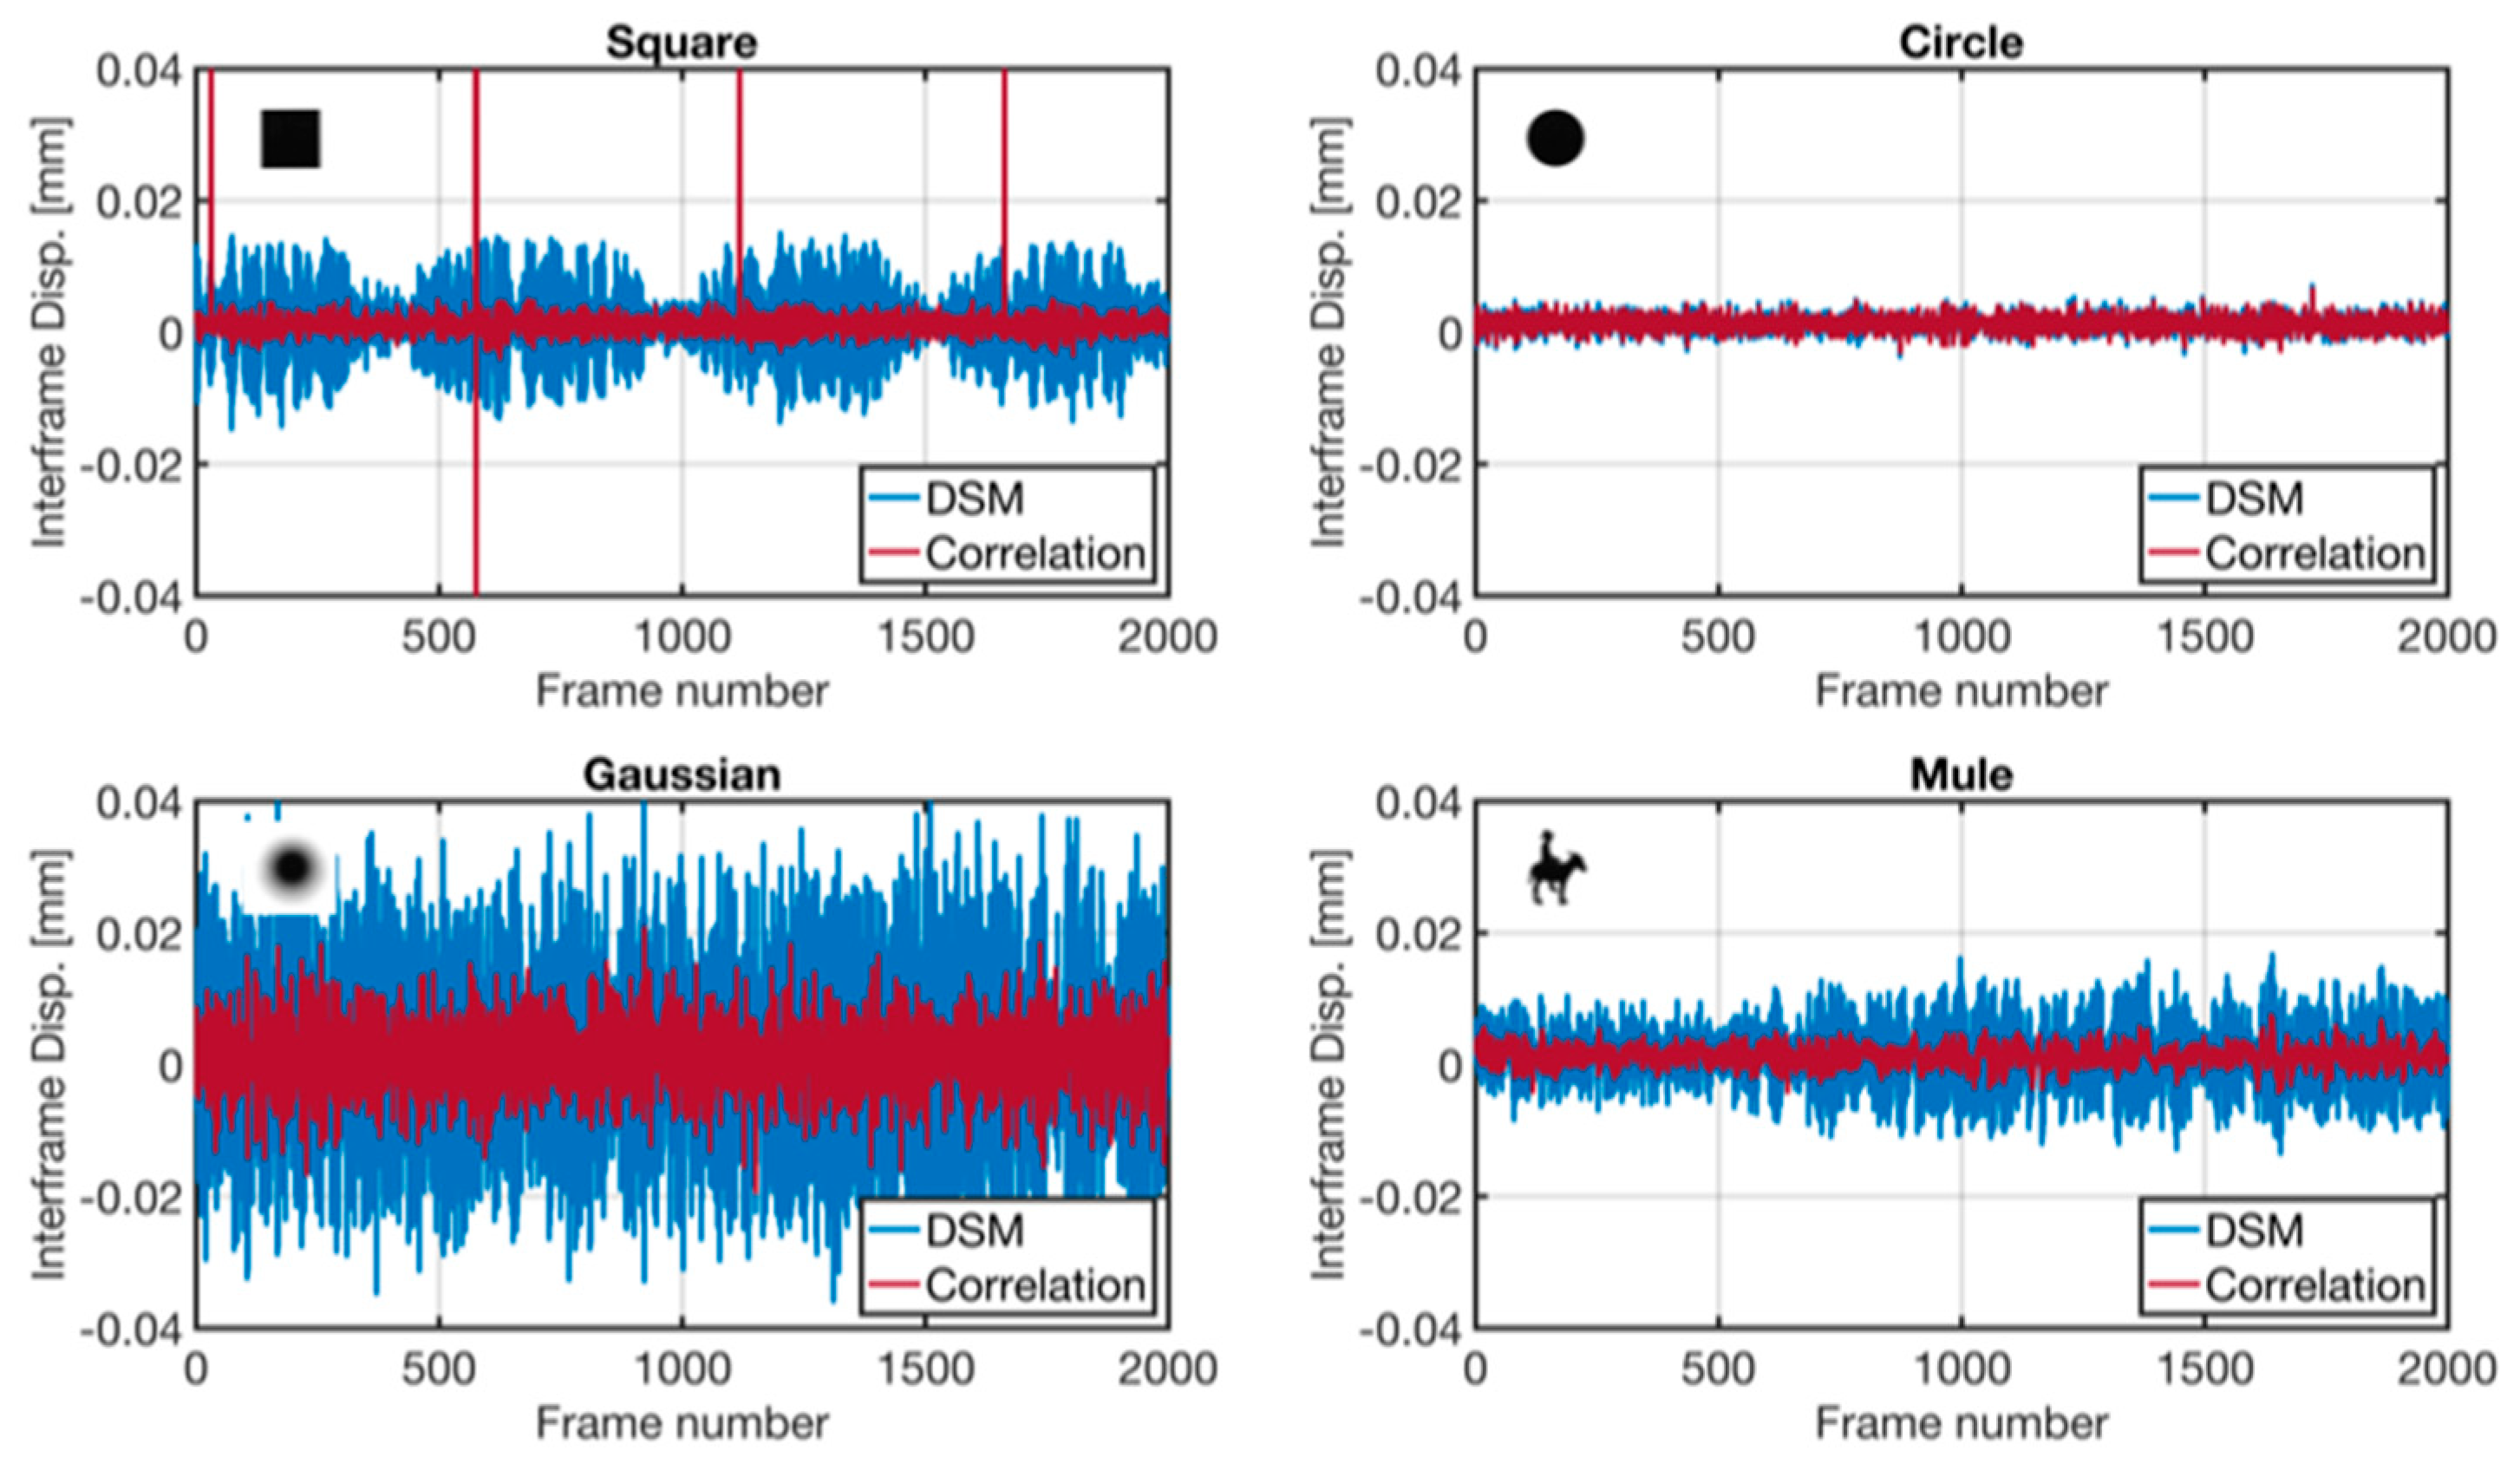
18], the maximum achievable subpixel accuracy of a tracking method relates to the dynamic range of the image, which in this case is 8-bits or, equivalently, 256 gray levels. This results in a maximum theoretical resolution of 1/256 ≈ 0.004 px, or, according to our pixel-to-mm ratio, this is equivalent to 3 μm. Since our experiment is below this limit, it is worth exploring if the method is able to follow the displacement or if there is a succession of underestimations and overcorrections of the target position. Furthermore, we can even wonder if the method is really detecting frame-by-frame changes or if the subpixel effect is just the result of statistics. In
Figure 4, we present the results for the four targets here used. The statistics for these results are summarized in
Table 1.
From the results obtained, we can see that both methods show, on average, the same accuracy since both can correctly reproduce the frame-to-frame displacement. It should be noted that while the mean value remains consistent across all cases, the standard deviation (STD), which accounts for noise and calculation inaccuracies, varies significantly. Dispersion serves as the true measure of accuracy, as values within the range defined by the mean and ±STD should be considered indistinguishable. Consequently, a high STD value indicates that the measurement of interframe displacement lacks precision, potentially leading to small drifts when the total movement is accumulated [
21].
According to the STD parameter, the cross-correlation method seems to introduce less dispersion than the DSM method. This may not be surprising, since correlation is known for minimizing the Mean Square Error [
3], making it less sensitive to noise in the image.
In general, and according to the results in
Table 1, among the four targets proposed, the circular object presents the best results, followed by the mule and the square. These results are in accordance with the conclusions presented in [
14,
22], where it is stated that objects with complex profiles are more suitable for registering subpixel displacements. In the opposite case, the Gaussian target presents the worst performance. Our hypothesis is that the intensity gradient is degraded as the target moves, thus introducing additional noise to the calculation. In any case, both methods can track an object with a resolution at least higher than 20 μm, or equivalently 0.027 px, which is enough for most cases.
If we focus on specific details of
Figure 4, we can see that tracking of the squared target presents a sudden correction every 540 px approximately, which corresponds to a full pixel displacement. Additionally, dispersion in the mule target seems to be higher as the object displaces, meaning that non-compensated displacement errors appear.
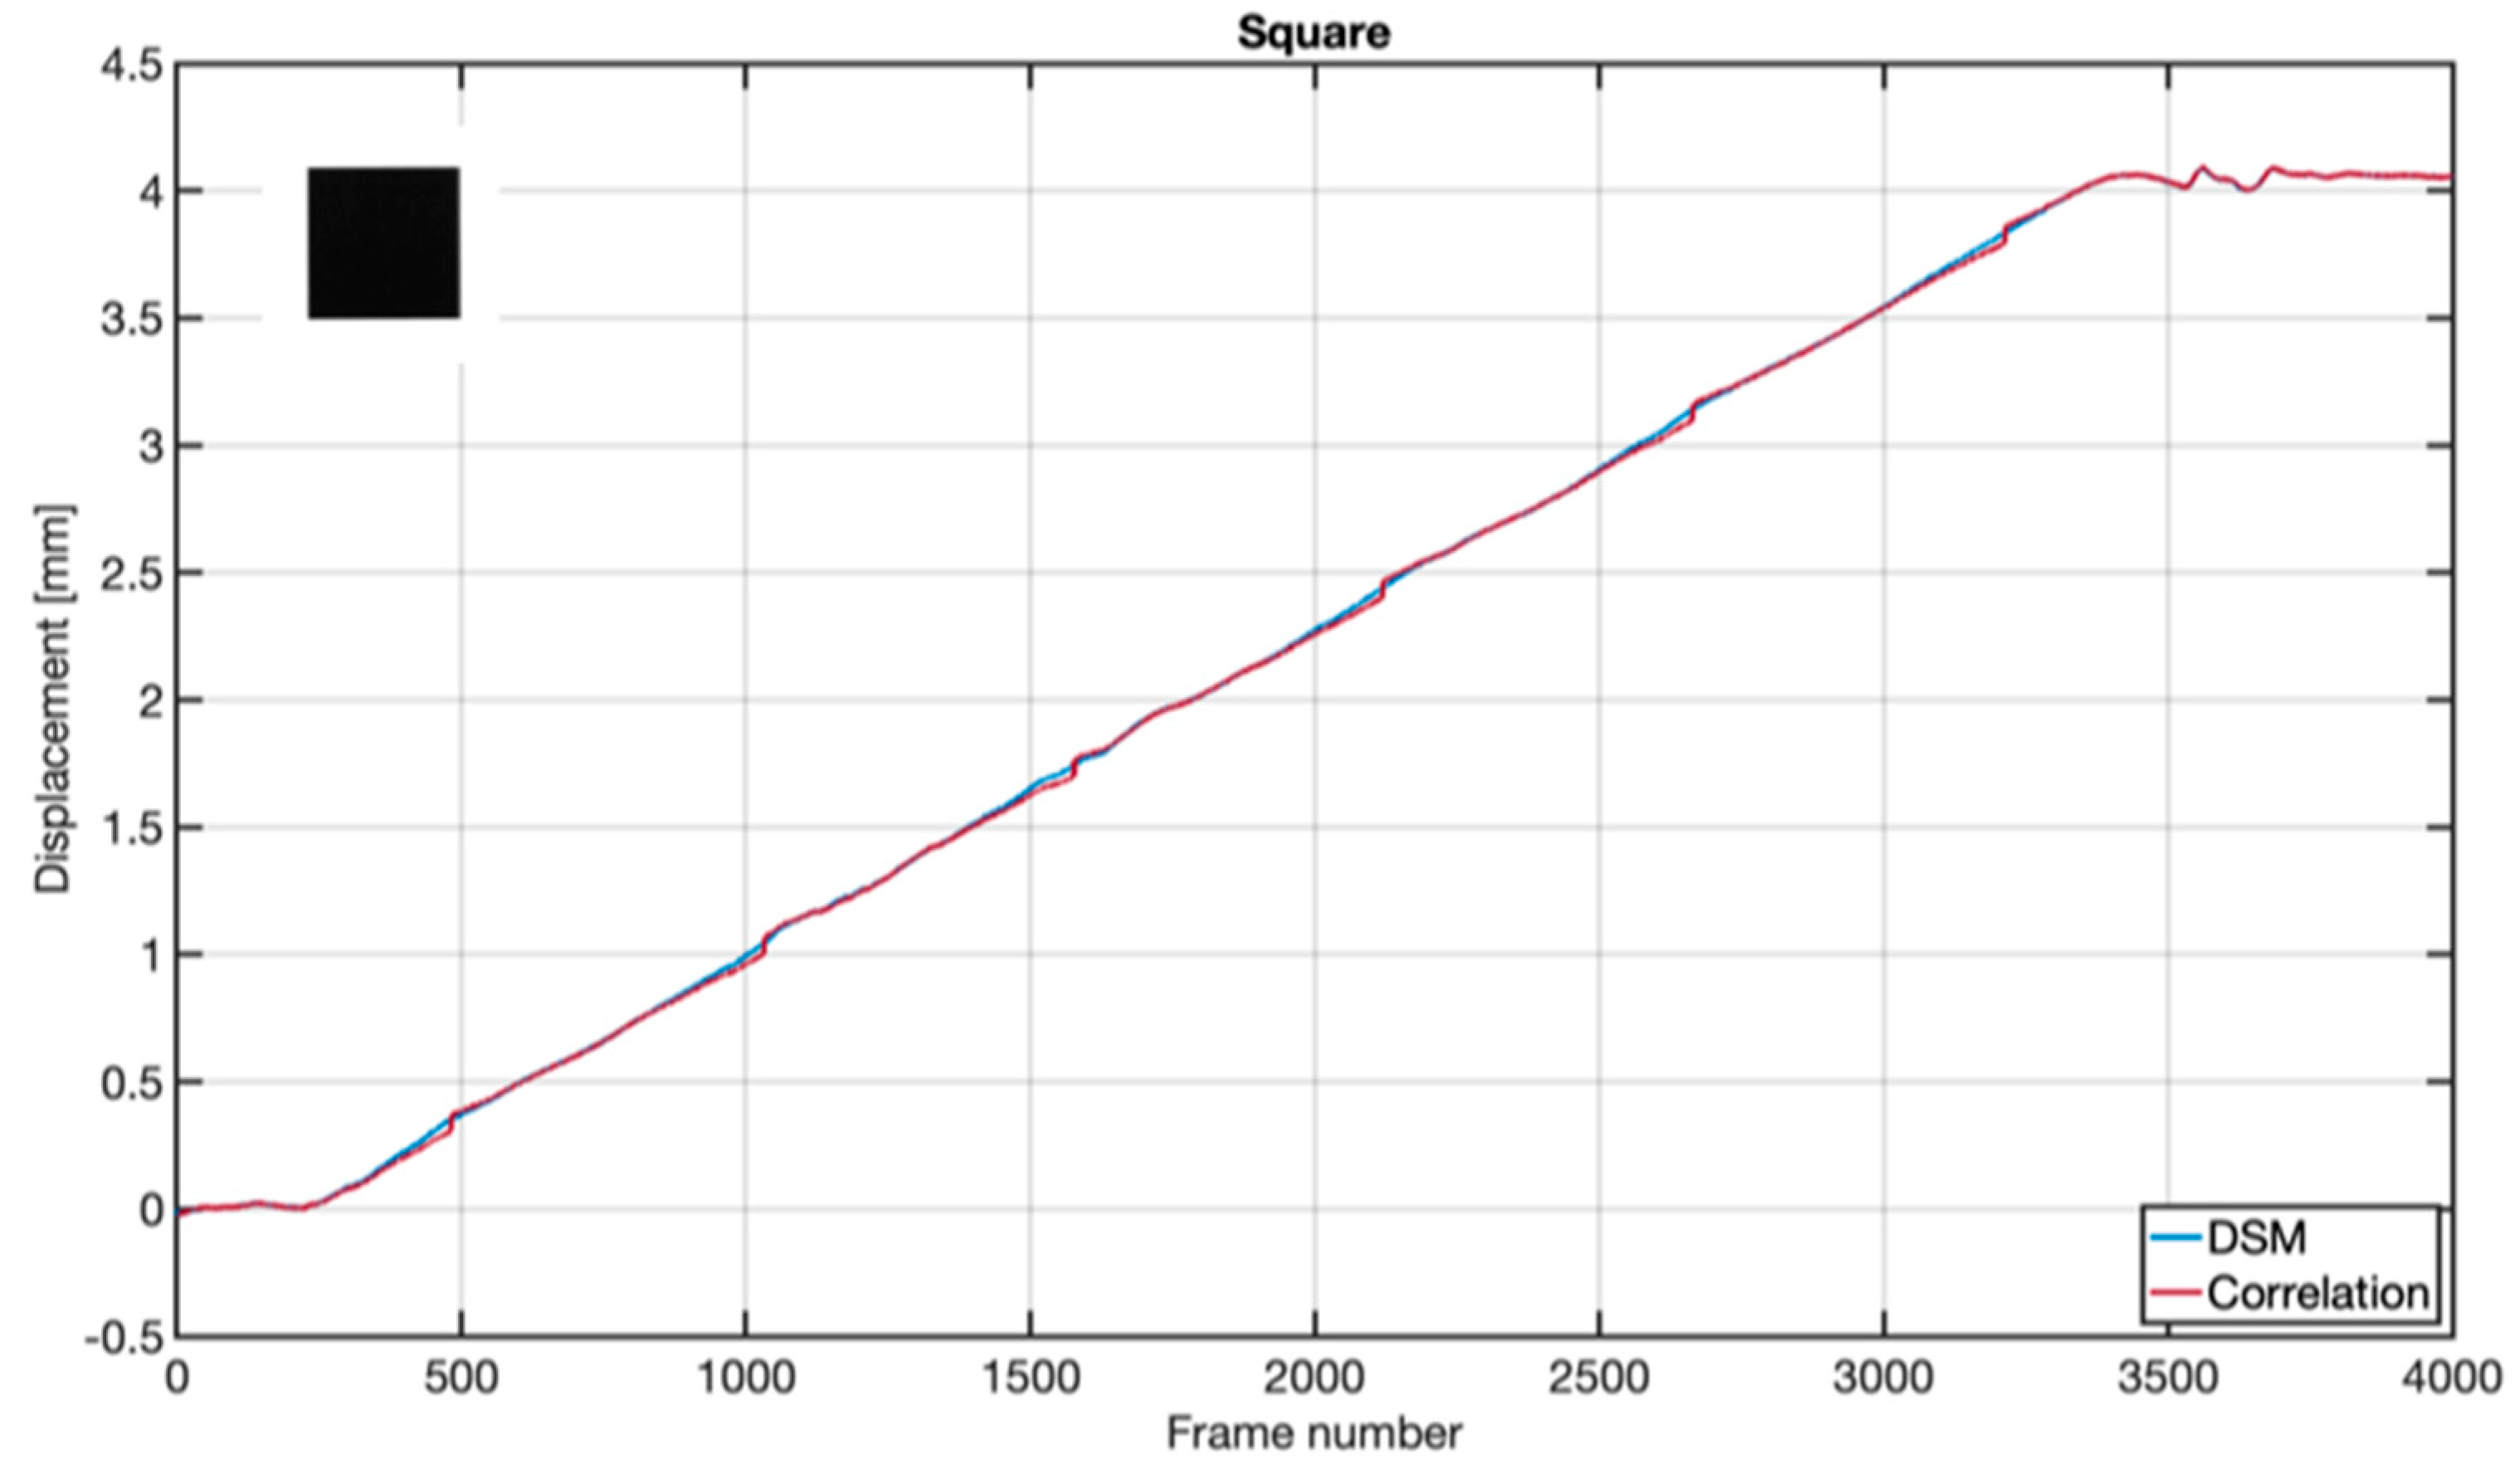
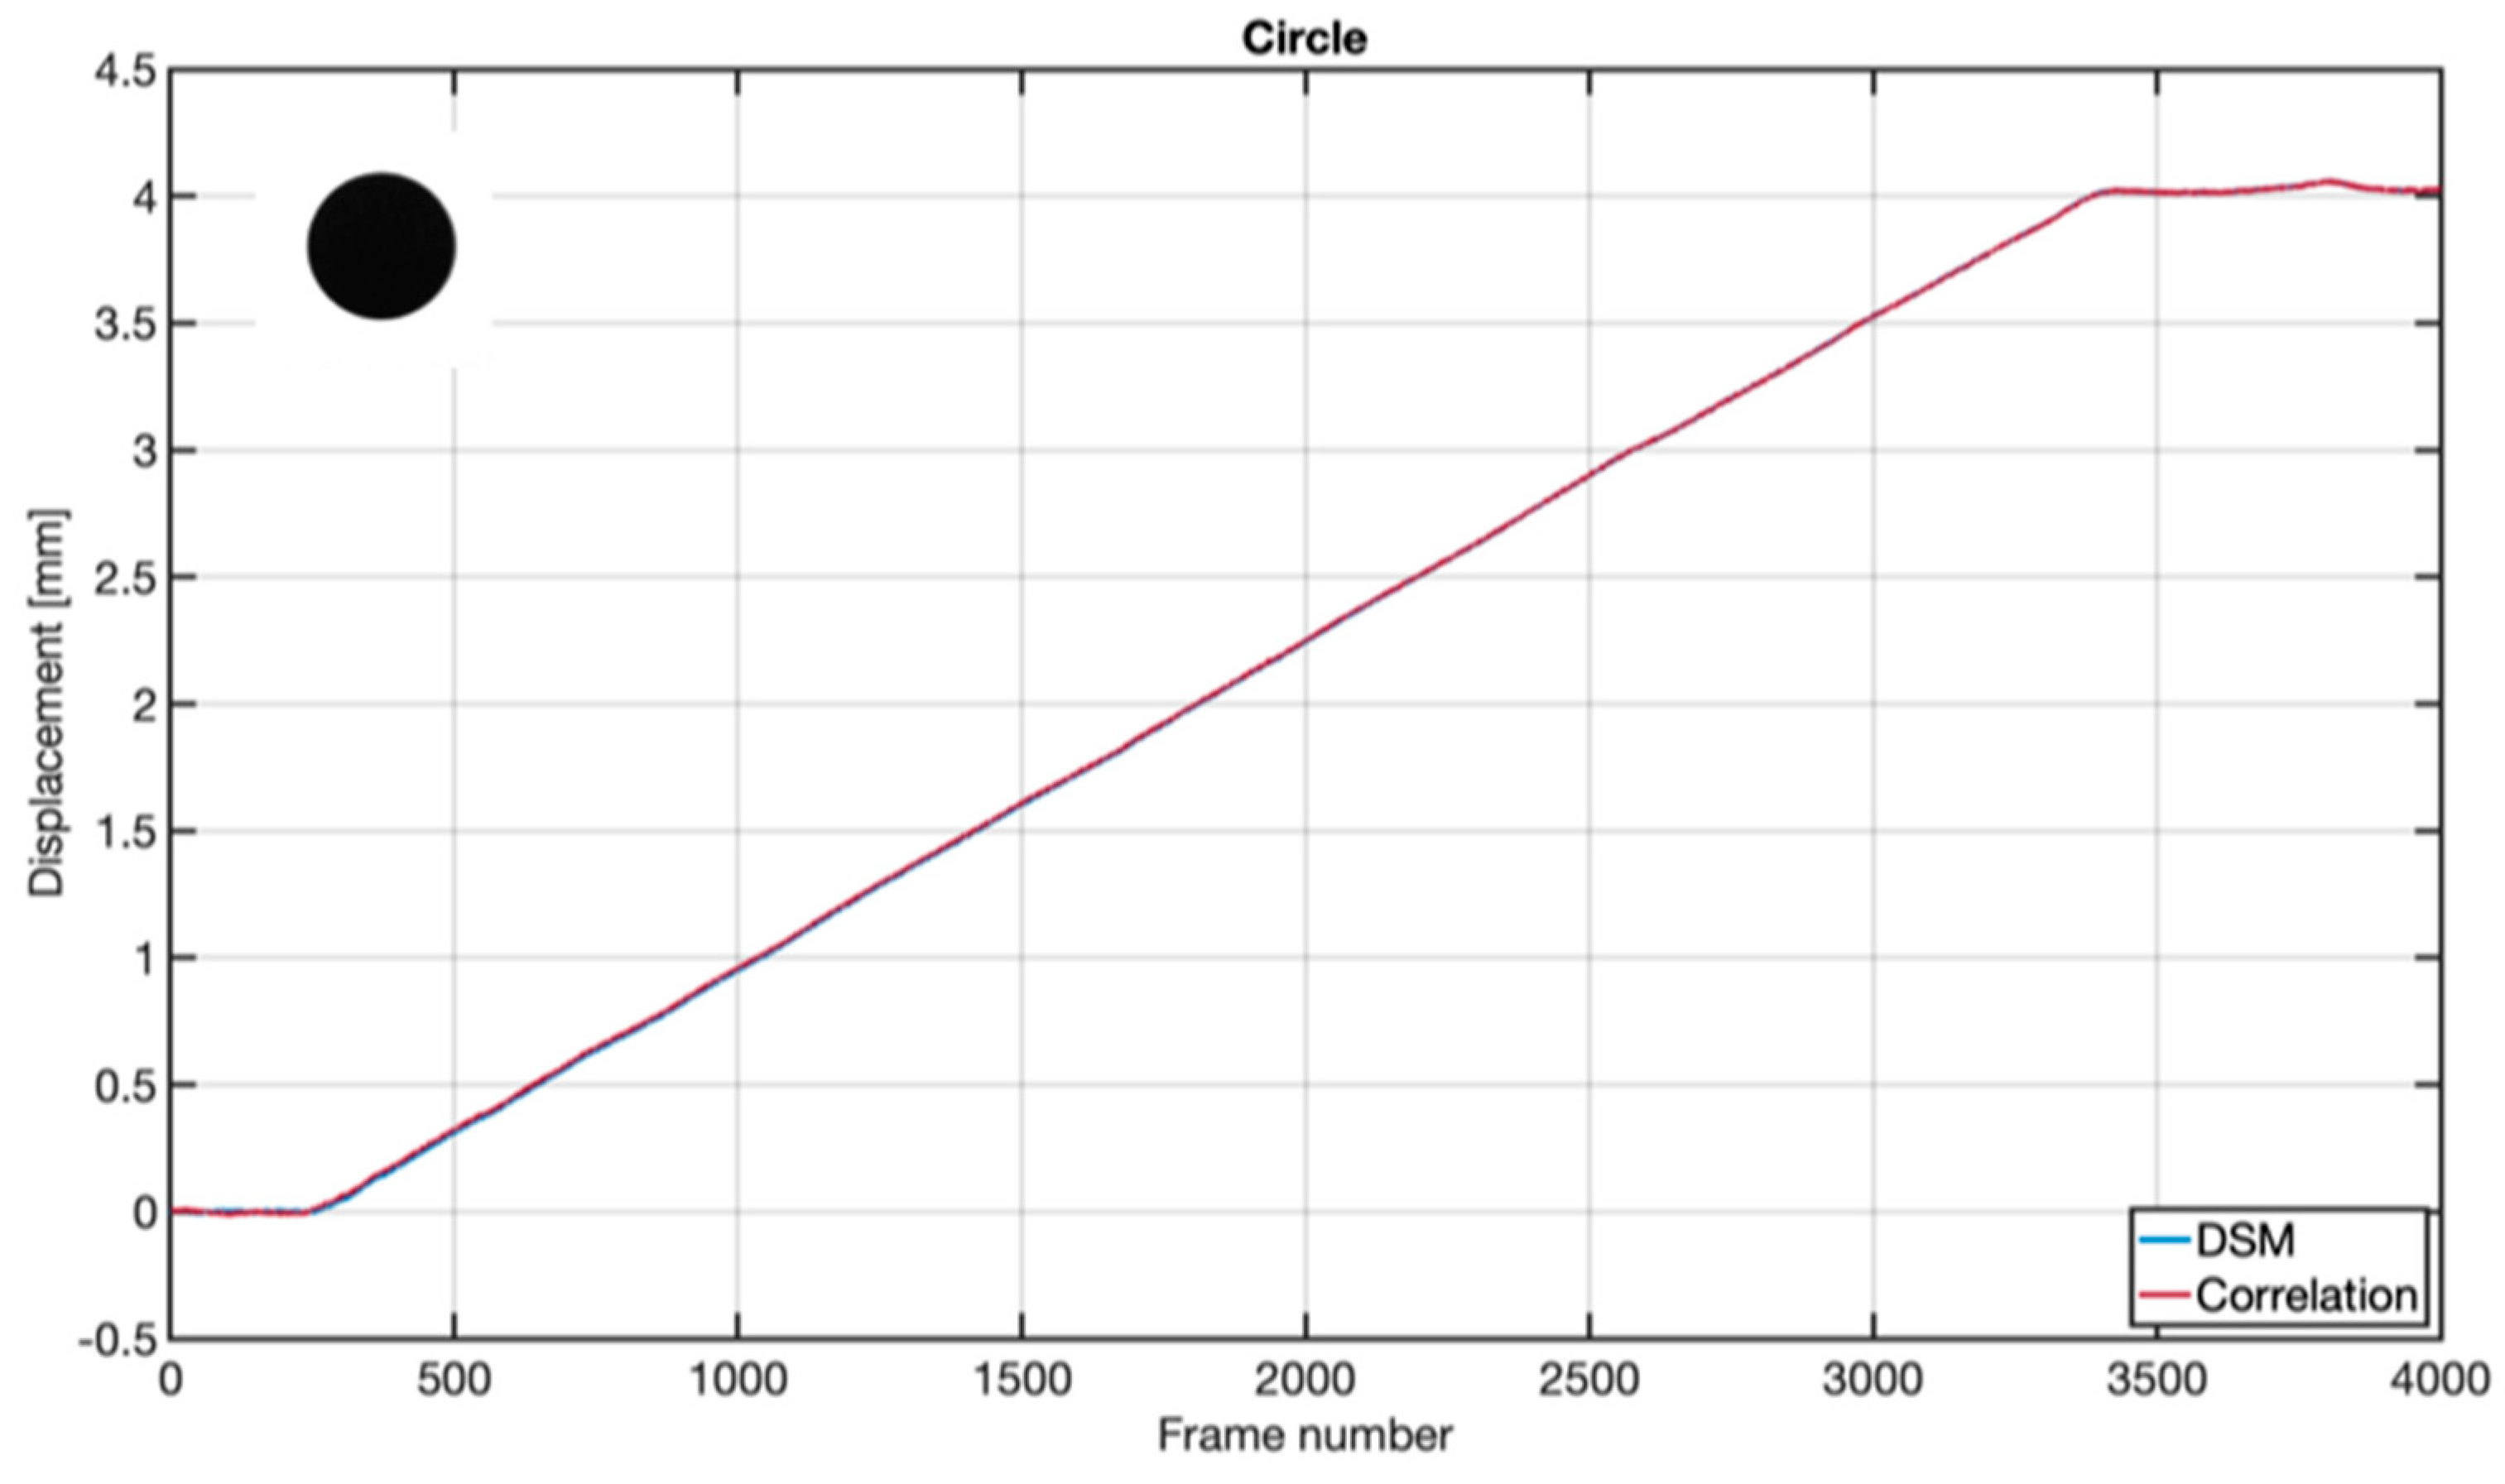
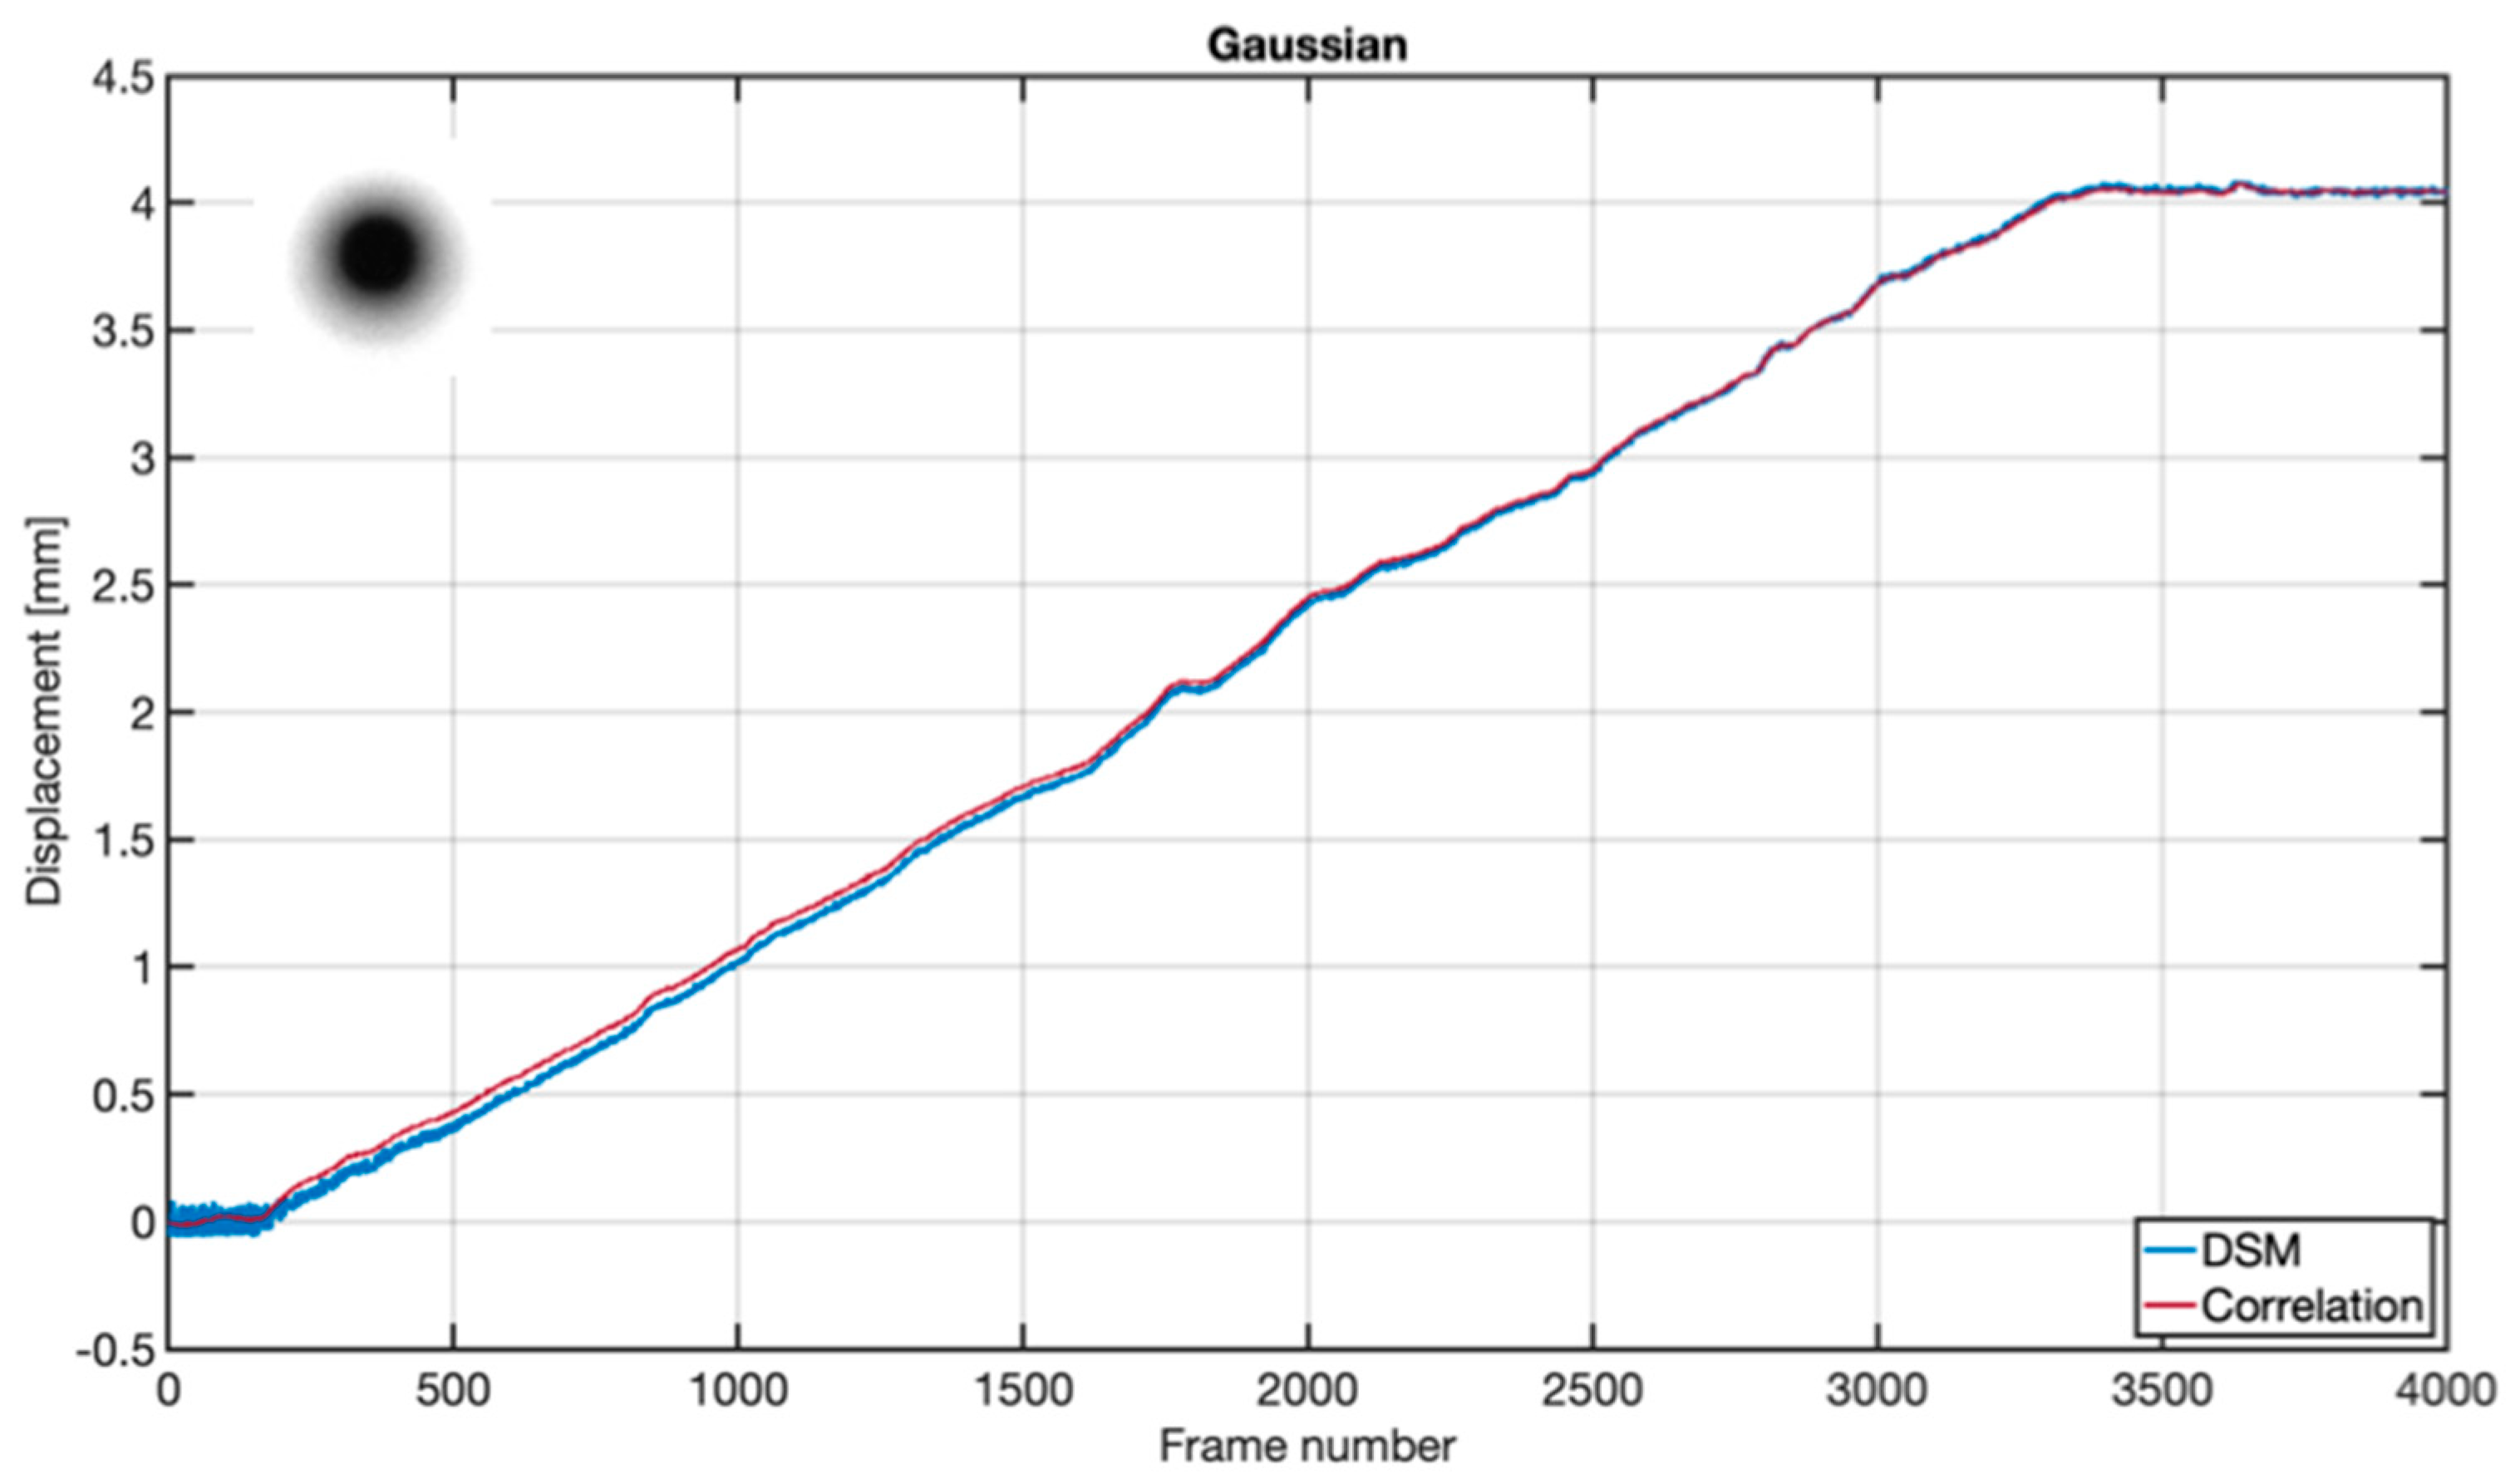
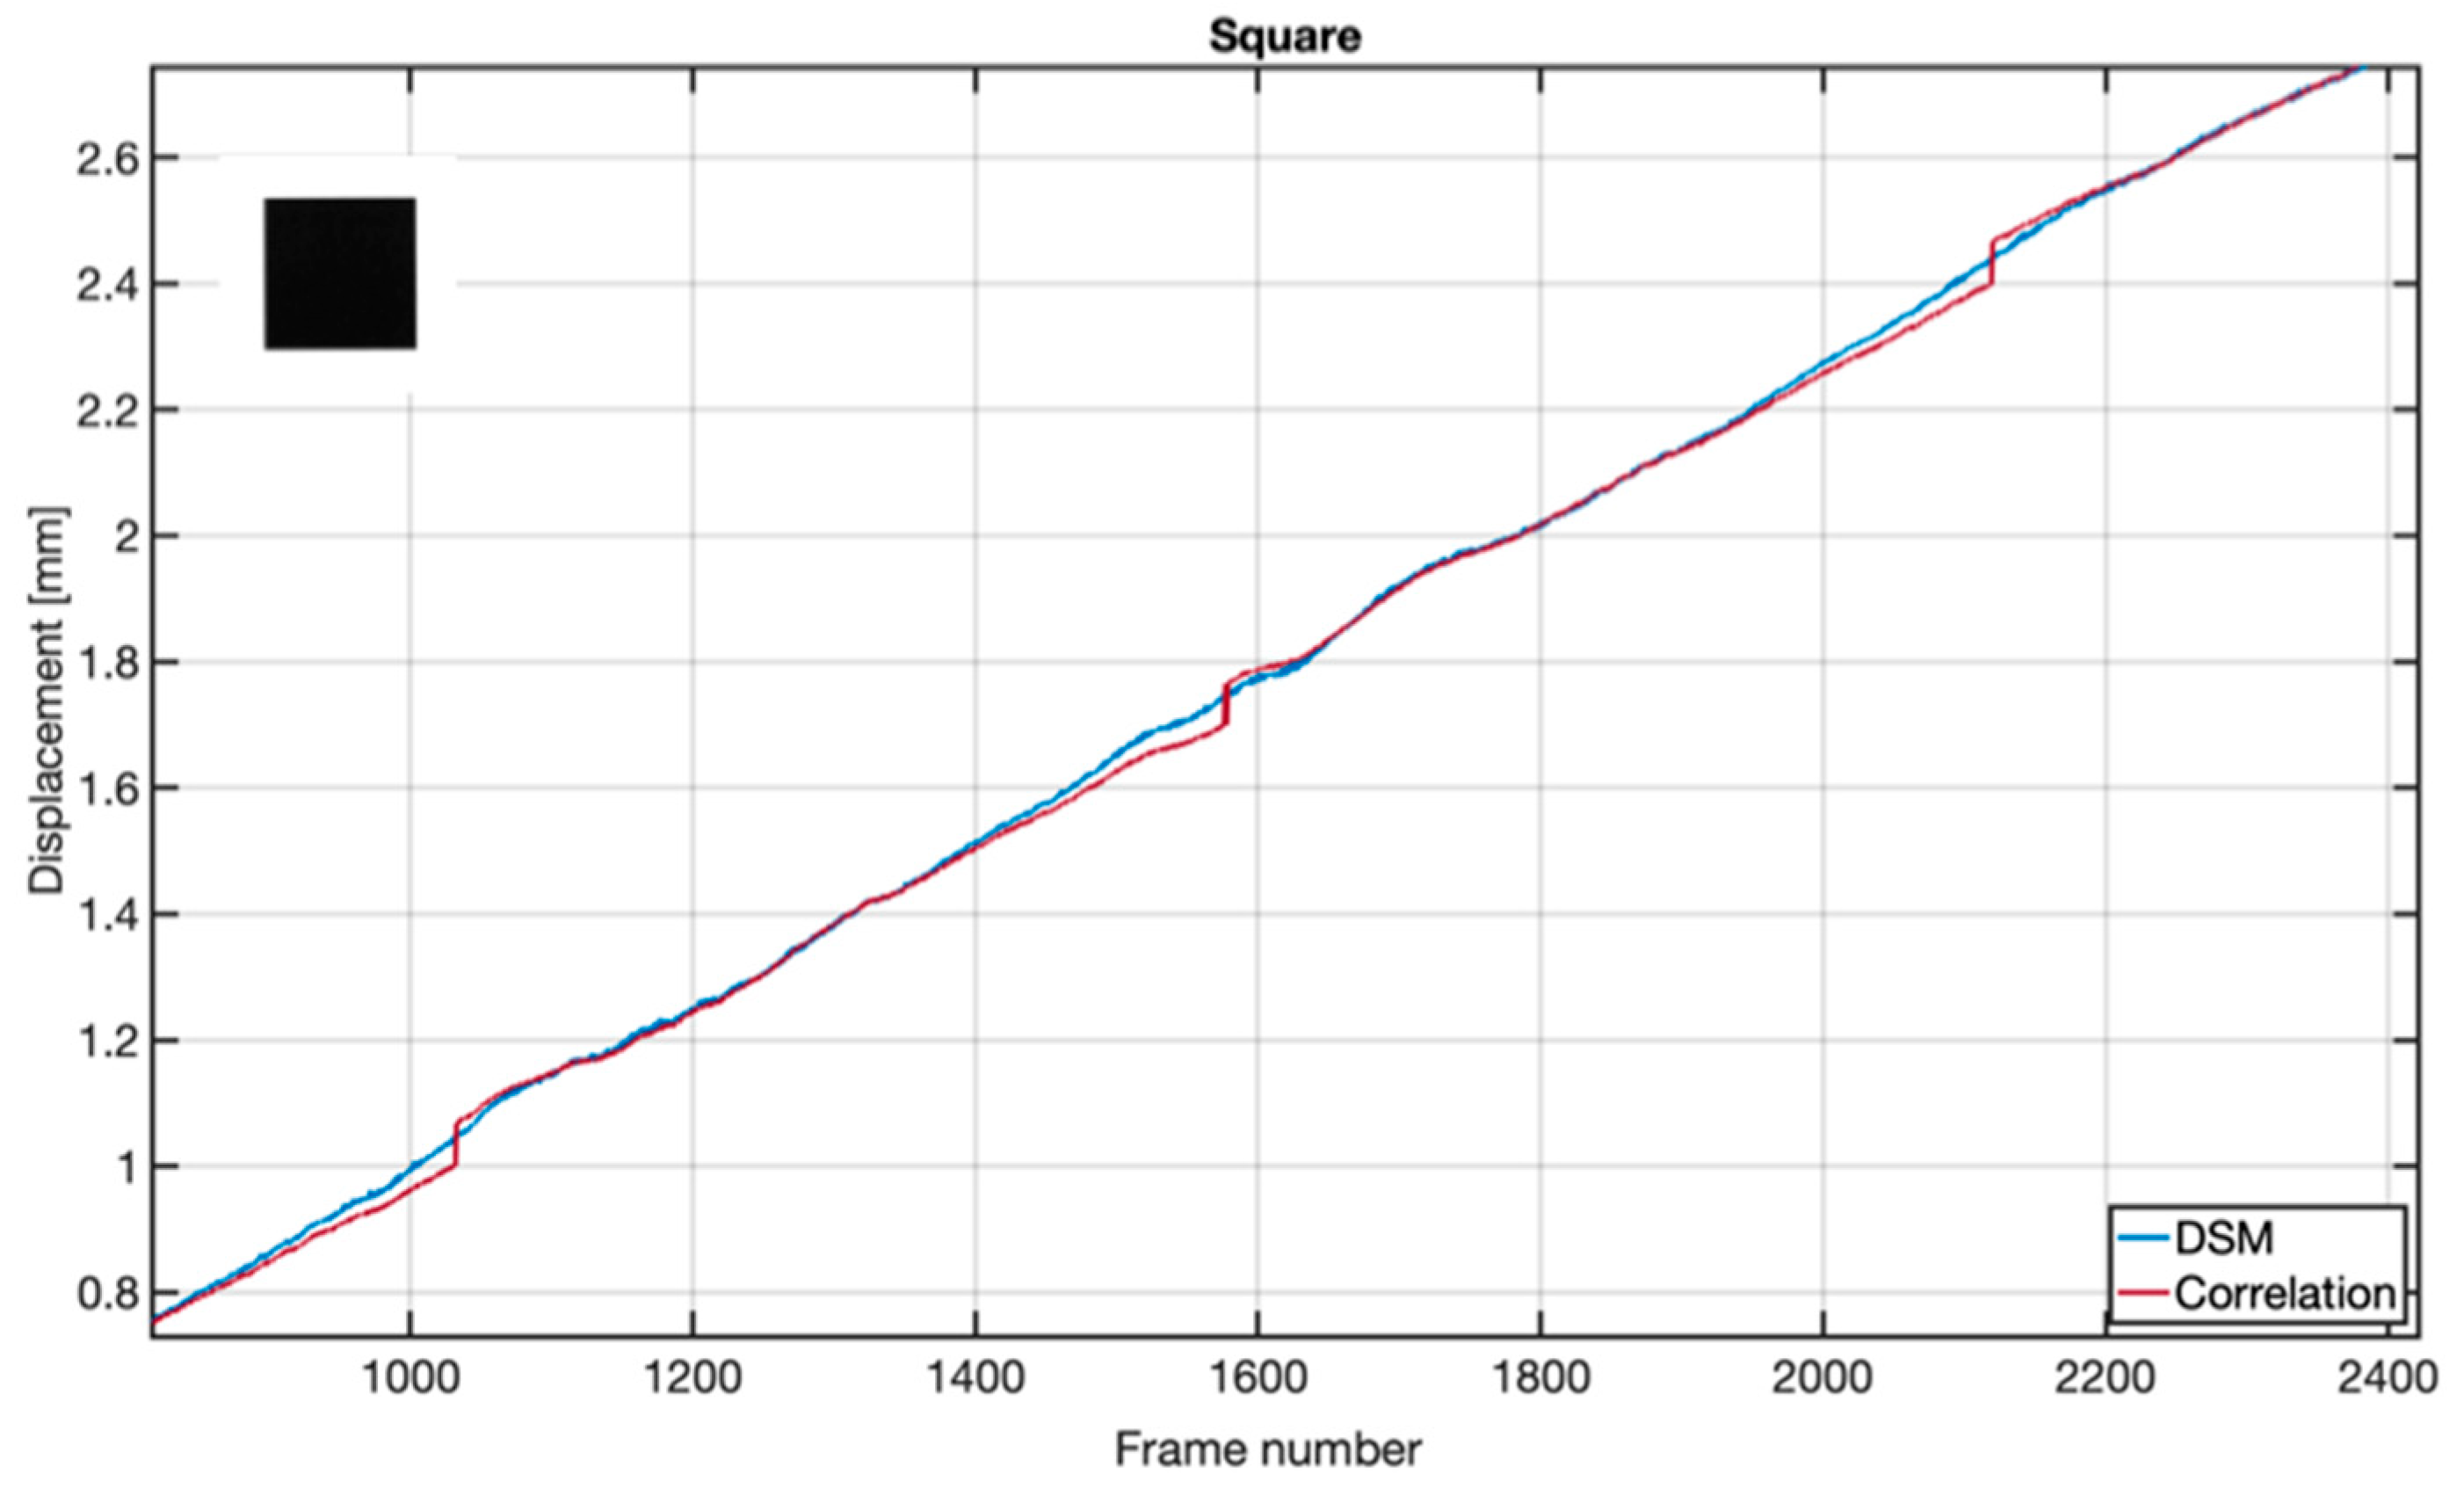
In
Figure 5,
Figure 6,
Figure 7 and
Figure 8, we represent the target position obtained for each frame. One can observe in all figures the presence of a plateau at the beginning and end of the graph. This happened because the acquisition time of the total sequence was a little longer than the total displacement time in all the movement graphs. Thus, it is easier to identify the initial and final positions and the exact duration of the movement phase.
At first sight, one can see that tracking results from both methods are practically overlapped in the three first cases (
Figure 5,
Figure 6 and
Figure 7). In some graphs, one can see some oscillations that are followed by both methods and are probably due to inaccuracies in the carrying stage.
We would like to draw the reader’s attention to the case of the squared target. Contrary to the other three cases, the square target when tracked through correlation does not present a monotonous trend but four small oscillations, which correspond to the sudden jumps already observed in
Figure 4. These oscillations can be better seen in
Figure 9, where a magnification of
Figure 5 is presented. There, one can appreciate that the position of the target is underestimated with respect to the DMS graph, and suddenly, when the target has travelled one there is an overcorrection. This effect of periodical correction can also be observed in the DSM graph for this target in
Figure 4, although it happens at different positions. This effect was also observed in our previous numerical simulations and is a clear example of the peak-locking error that was described in the introduction. Itis also greatly enhanced by the particular structure of the target, which may have its borders aligned with the camera sensors. As was discussed in [
22], squared figures are far from optimum targets for object tracking with subpixel accuracy.
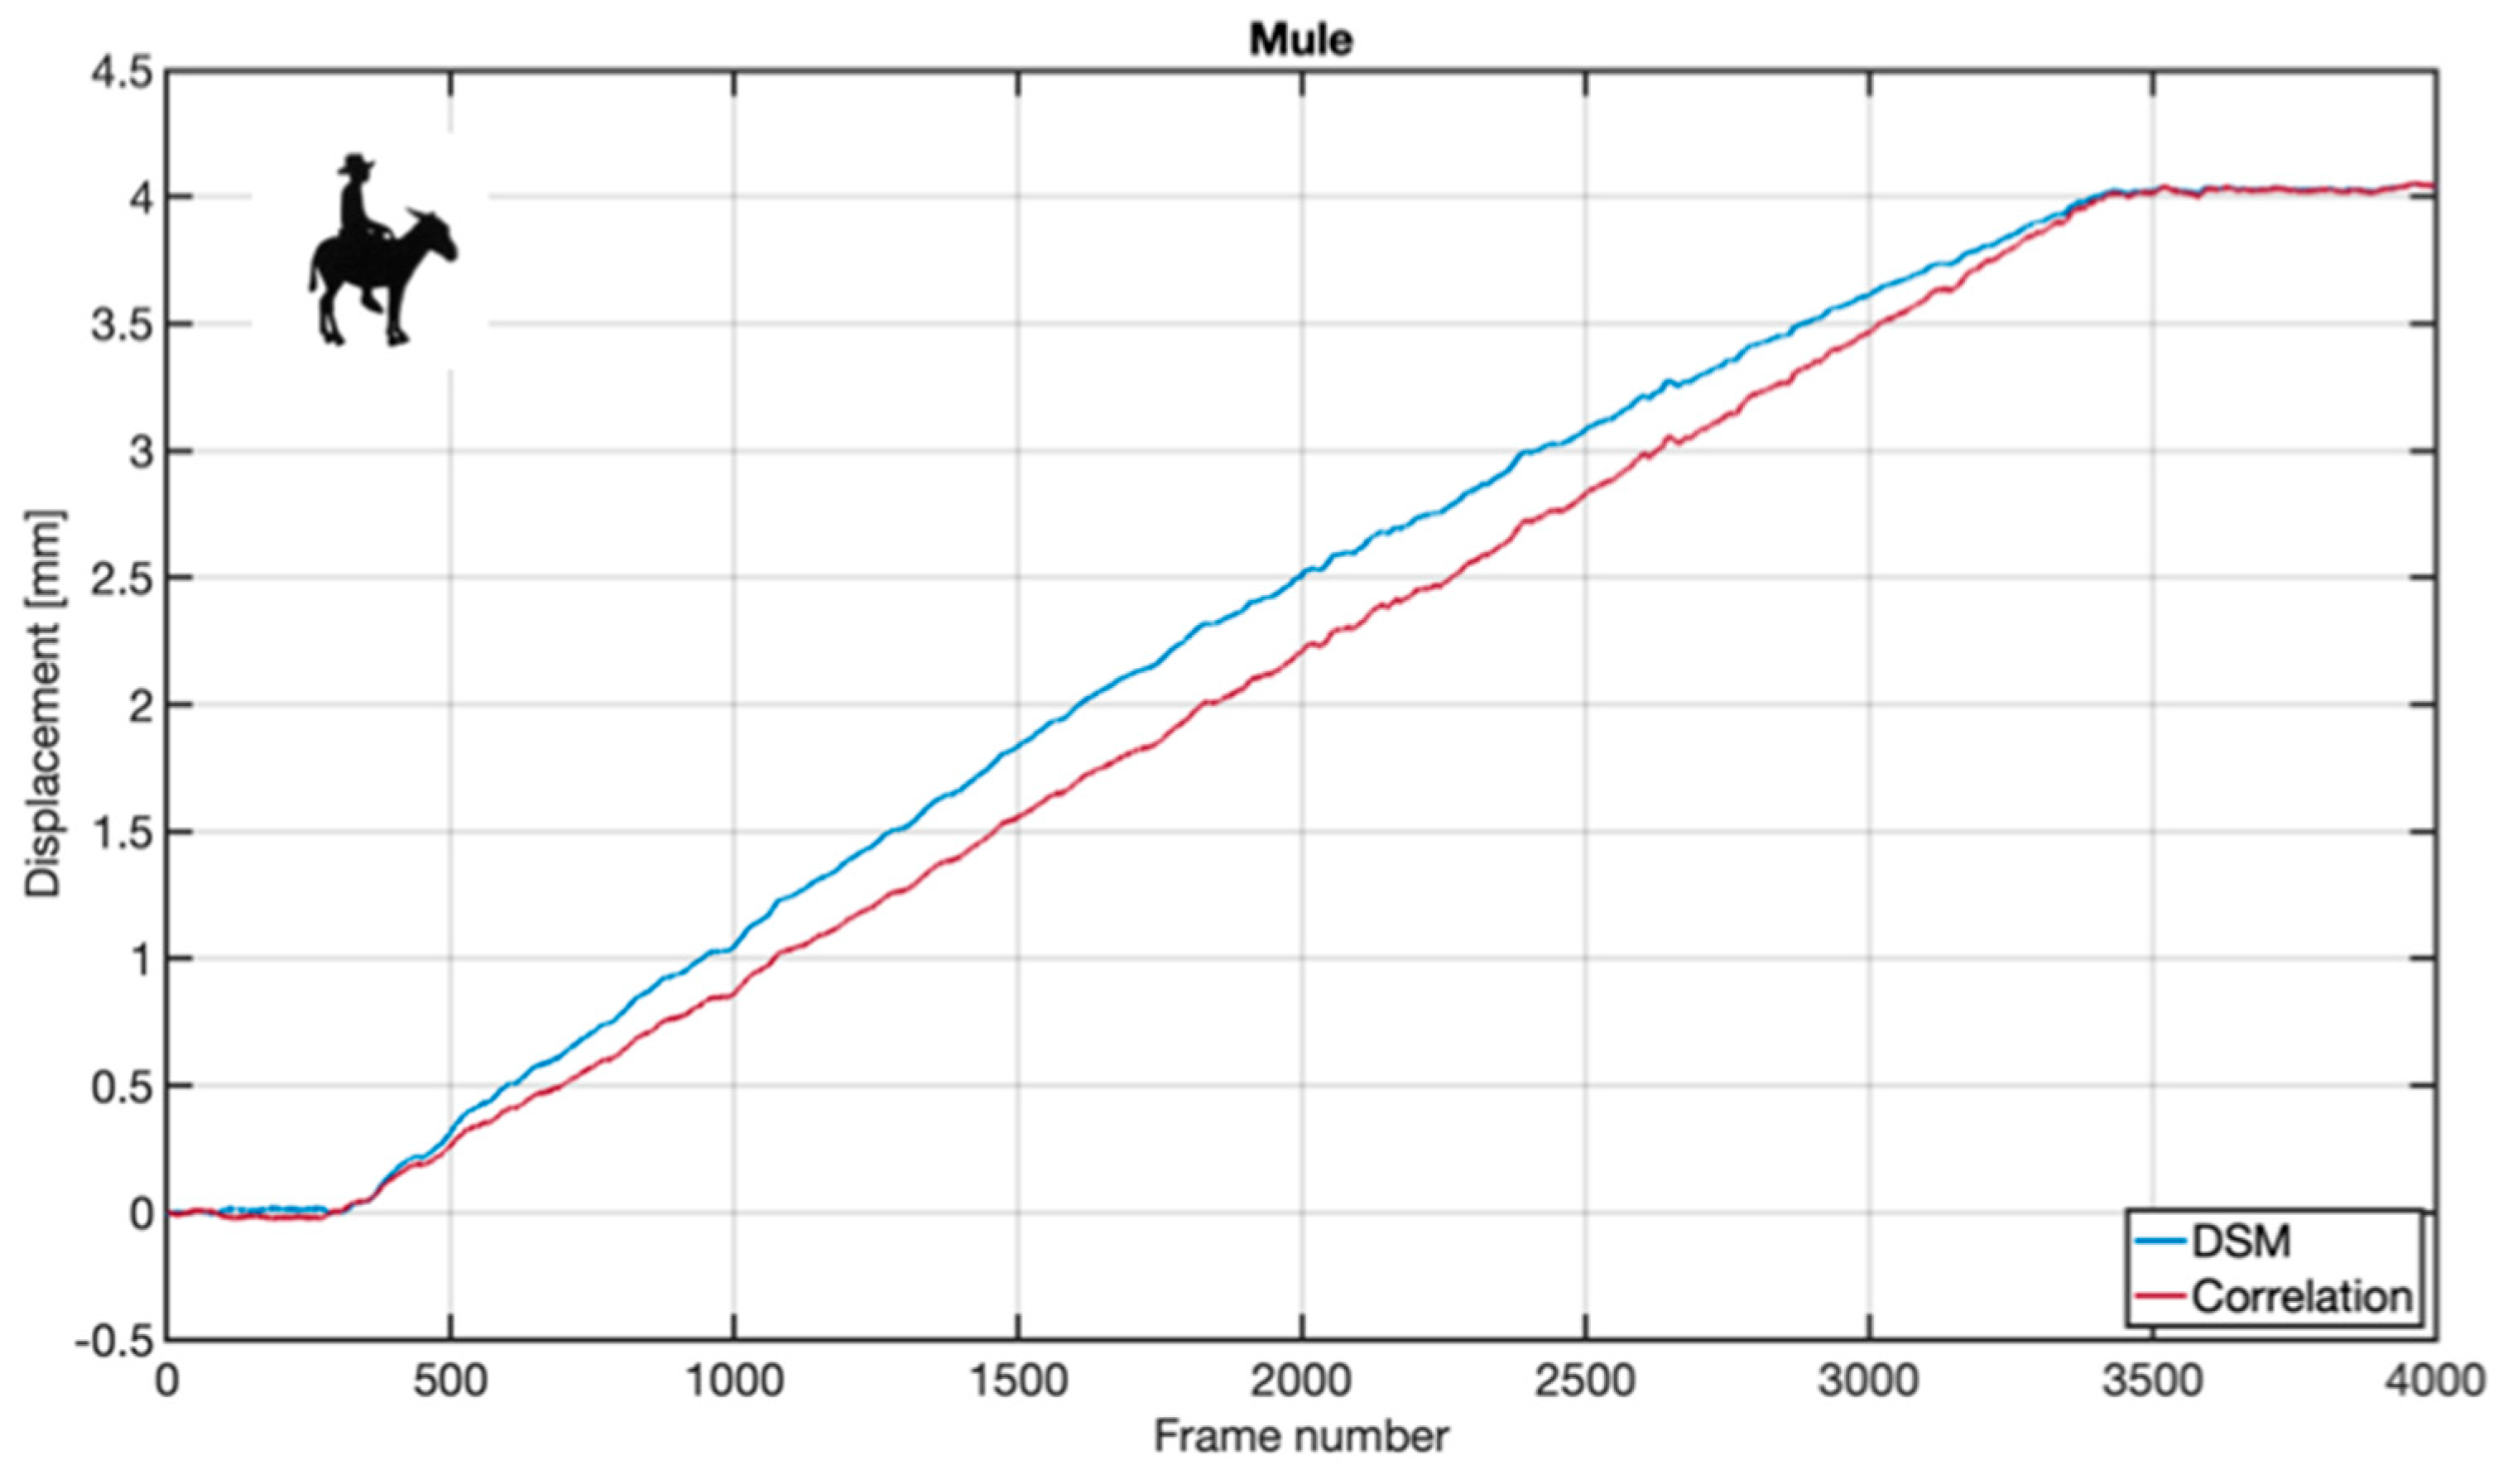
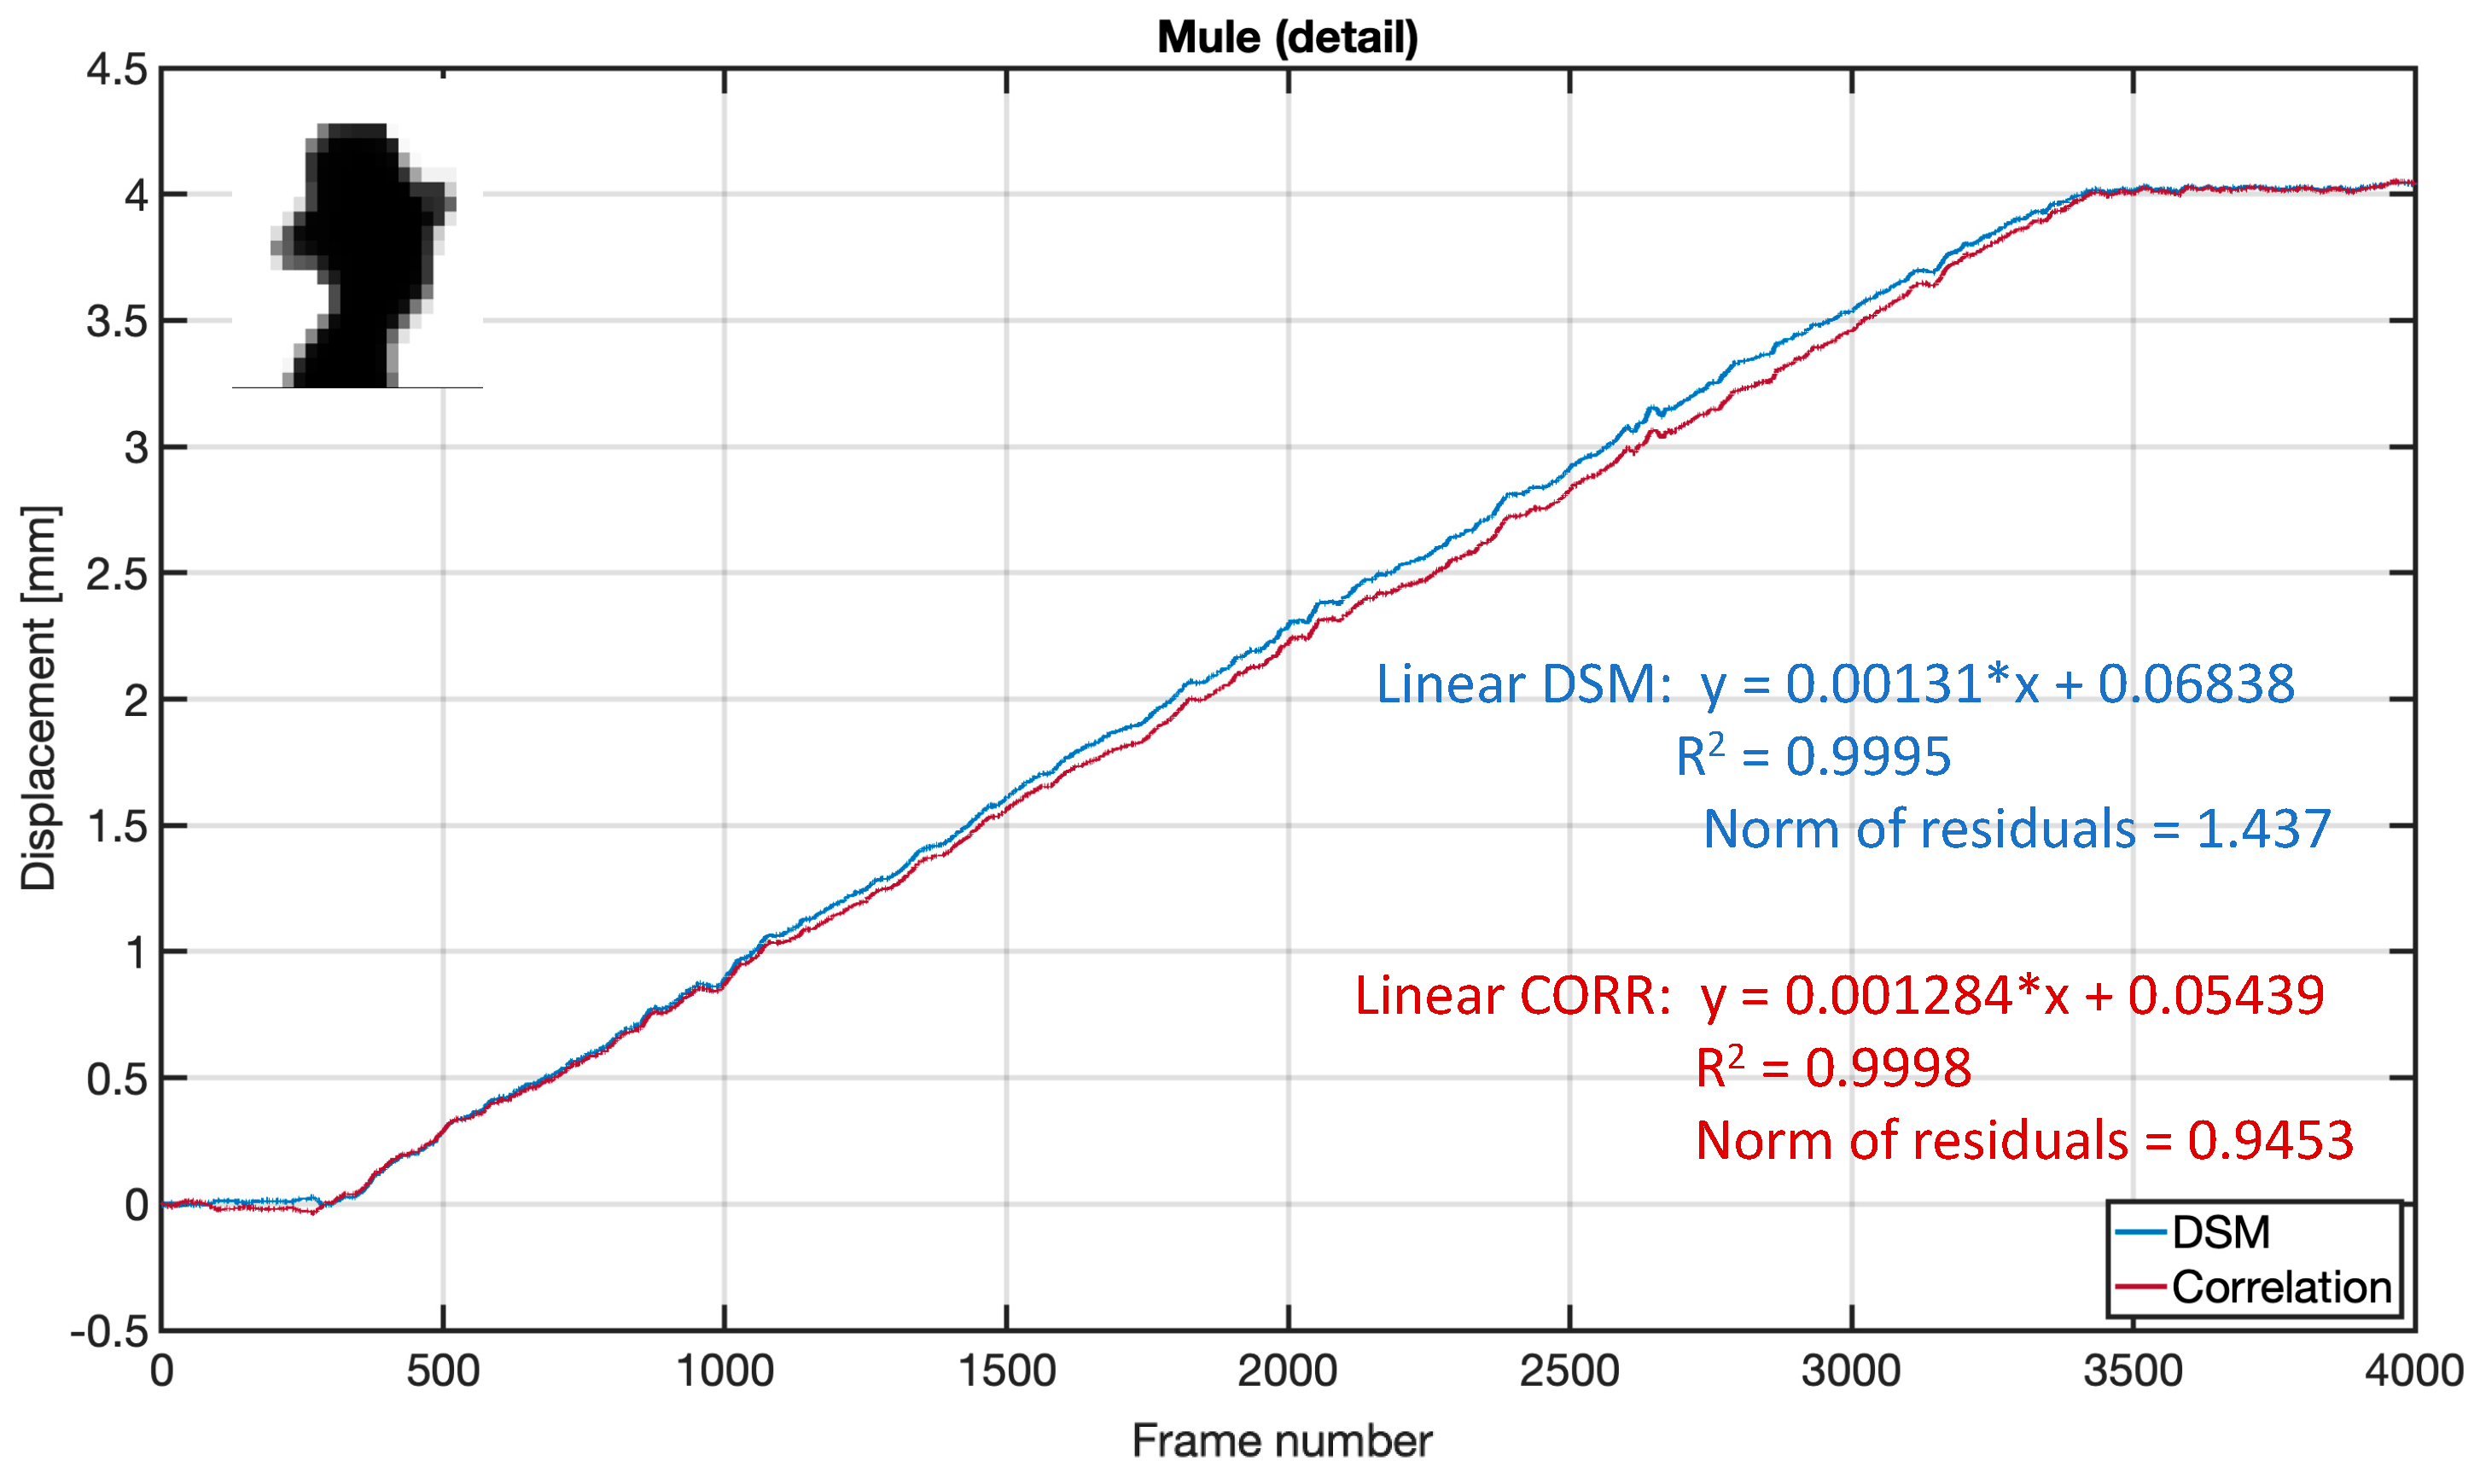
In
Figure 8, it is unexpected to observe that the DSM curve deviates from a straight line, despite the movement being rectilinear and at a constant speed. As mentioned in
Section 2.1, the DSM parameters are typically directly proportional to the displacement, especially for small movements. Considering that the total movement in this case is only 4 pixels, the deviation from a straight line implies that the shifted image from one frame to the next may not accurately replicate the original object, indicating the presence of distortions. It is important to note that the correlation-based method is not affected by these distortions. While the correlation function itself may be impacted by distortions, the tracking task only relies on the peak location, leading to the loss of this information in the final result.
This result may seem contradictory to
Figure 4 and
Table 1, where it was shown that the dispersion of the mule figure was not very high and was certainly lower than that of the Gaussian target. It’s important to note that those figures represented interframe variability, whereas the results in
Figure 8 are the result of cumulative errors over time. These errors may be compensated for, as seen in the case of the Gaussian or square targets, or they may not be compensated for in the case of the mule figure.
Coming back to
Figure 8, the observed deviation is probably due to the small holes in the target that modify the linear counting of luminance differences and are responsible for the increasing interframe error trend observed in
Figure 4. We have tested this hypothesis by implementing the tracking only with the head of the rider, which has a simpler profile than the whole picture, resulting in a correction of the trajectory, as can be seen in
Figure 10. There we include the minimum square fitting results for the central part, between the two plateaus. As can be seen, the results have greatly improved. Observed differences may be due to calculation inaccuracies or noise distortion in any of the two methods, but overall, the small difference observed is not large enough to state that one method is better than the other.
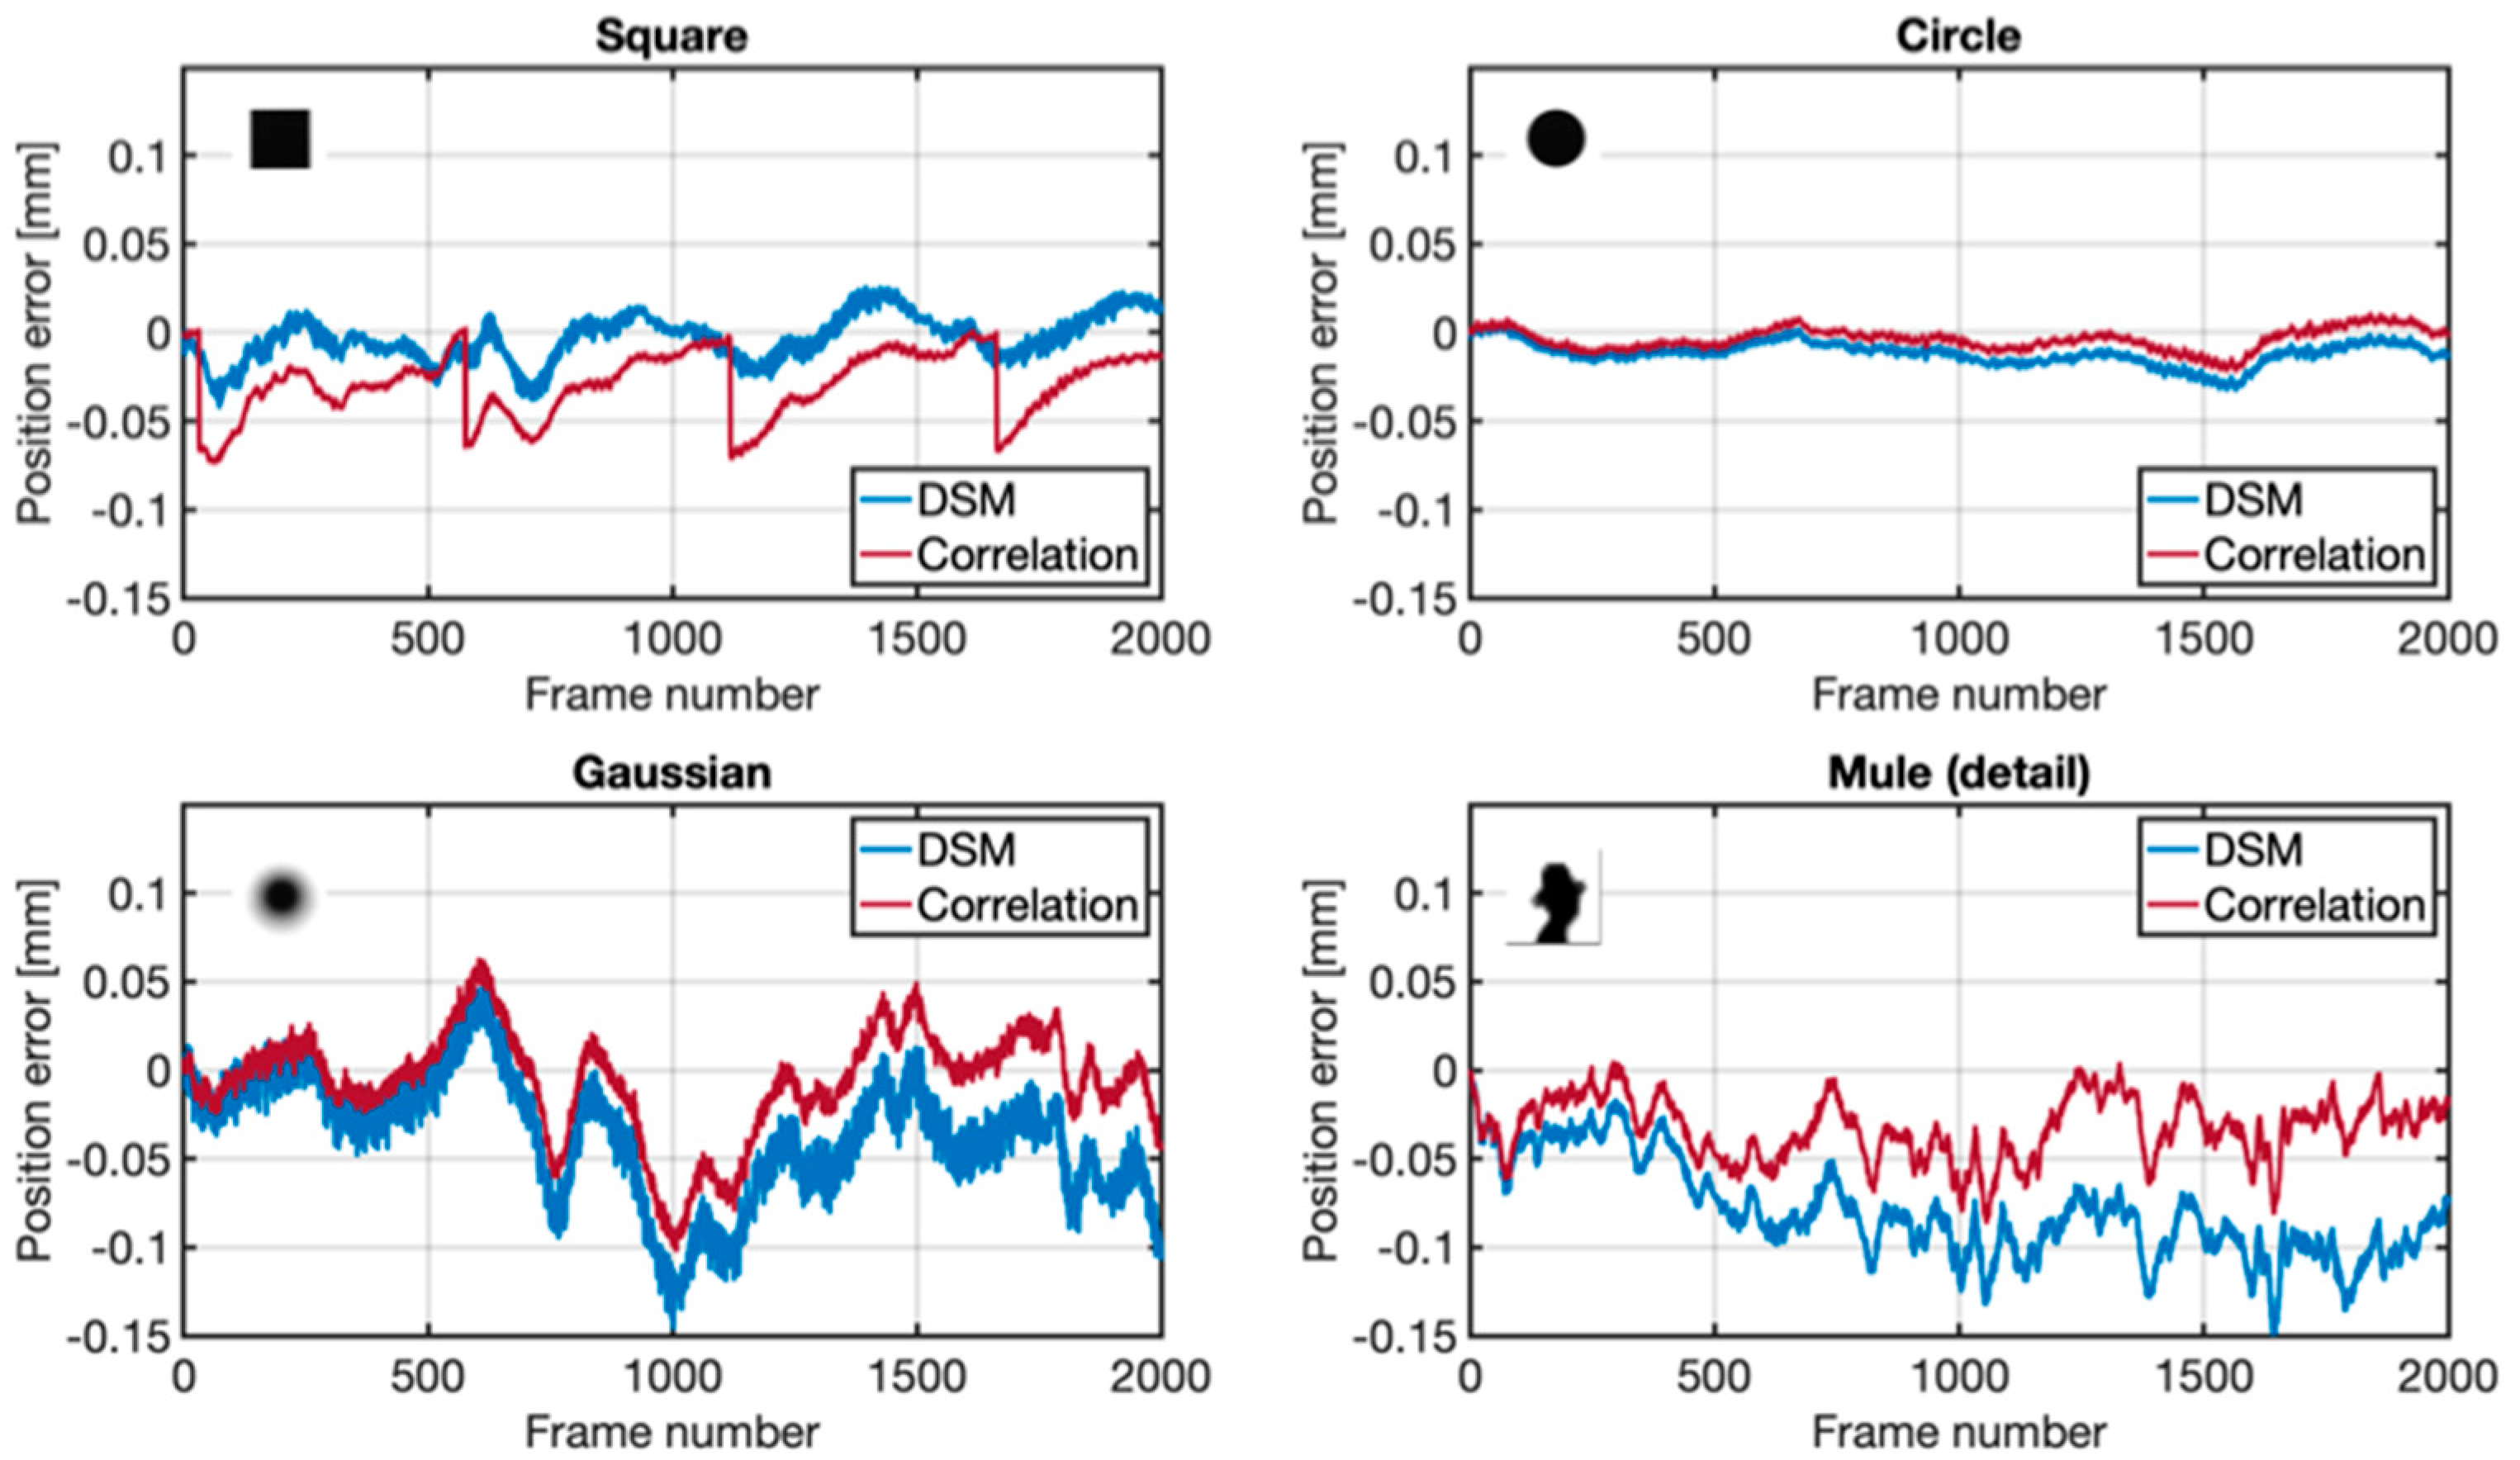
To complete our analysis, the accuracy of DSM and correlation methods has been evaluated by calculating the position errors of the four targets with respect to the theoretical position. We have ignored the starting and ending parts of the graph where the targets are static, so the calculations refer again to the central 2000 frames in the middle of the trajectory. To avoid differences in the initial positions, we have considered relative displacement instead of exact location. Thus, we have compared the theoretical shift between frames (1.3 µm) with the displacement calculated through both methods. In
Figure 11, we plot the displacement error for each target, while in
Table 2, we give the maximum and mean error with the standard deviation obtained for each case.
Errors depicted in
Figure 11 show that both methods, DSM and correlation deviation, provide accurate results with small deviations through all the trajectories. We would like to notice that both correlation and DSM are not calculated incrementally but by comparing each frame with the first one in the sequence. This means that deviations observed are not the result of cumulative errors, but that the error at each frame is independent of the previous one.
One possible source of inaccuracies may come from the motorized stage since the displacements registered are at the limit of the device’s resolution. Although this effect cannot be fully discarded, we would like to point out that the error graphs are different for all the targets, so this component of the error is of a random nature. Another source of error may be the image degradation of the targets as they move, and information in one pixel may be distributed to different sensors. Also, small asymmetries in the printed figure or in the illumination system may contribute to the total error. In any case, all these inaccuracies affect both methods and do not add information about which of the methods has better performance in tracking subpixel displacement.
From
Figure 4 and
Figure 11, we can confirm that both tracking methods work better with compact and symmetric objects like the circle. In the case of the squared target when using the correlation tracking method, clear sudden jumps corresponding to the peak-locking oscillations can be appreciated, but even with these, the tracking errors are relatively low. Notice also that, although the DSM results do not suffer from sudden corrections with the square, a wavy behavior can be appreciated in the graph for the square, making the errors of similar magnitude as those of the correlation method (see
Table 1). This wavy behavior of the error was also observed in
Figure 4, for the interframe displacement calculation. In any case, even with these oscillations, the average error considering the whole trajectory is very good.
The worst performance in terms of maximum error and dispersion (STD) is obtained for the gaussian target. As we explained above, limitations in the printer and the image system to correctly acquire the luminance gradient are probably introducing errors in the reference-to-target comparison, degrading the tracking accuracy. In the mule case, the results are a bit worse for the DSM method than for the correlation method. It can be clearly appreciated that the error graphs for the DSM in both targets are always above the correlation curve. Probably, this effect is due to some background noise that adds some bias to the value calculations in Equation (3). In any case, all the errors are very low, and thus no clear advantage can be derived from using one or another method.
4. Conclusions
In this manuscript, we have analyzed the performance of the Discrete Subtraction method (DSM) for target tracking with subpixel accuracy. The method is based on calculating the difference between the grayscale intensity of a reference image and its displaced version [
13].
The tracking results of this method, tagged as DSM, have been compared to those obtained with the more popular correlation method with local peak interpolation to achieve subpixel resolution. To this end, four different targets have been mounted on a motorized platform and horizontally displaced while a digital camera records all the process. The experiment resulted in different sequences of moving targets with an expected frame-to-frame displacement of 1.3 µm, or equivalently 0.002 px.
The results indicate that the average performance of both DSM (Digital Speckle Method) and correlation-based methods is similar, but DSM is more sensitive to noise compared to correlation. This sensitivity to noise is reflected in a higher dispersion in the calculation of the target position, which can be up to five times worse for complex objects. Thus, the DSM method may be less accurate for complex objects that exhibit small distortions when captured at different positions.
However, one advantage of DSM is that it does not require interpolation, which means it is not affected by peak-locking errors that can be observed in methods using squared targets when tracked with the correlation method.
In terms of target morphology, the circular target is found to be the most suitable artificial target for subpixel tracking. It is easy to draw and yields clean and accurate results. Additionally, circular shapes are commonly found in natural objects such as perforations or bolts, making them suitable for image tracking using natural objects.
Based on these findings, the DSM method can be considered a reliable alternative to the correlation method. It offers the advantages of simpler implementation and lower computational cost, although it requires previous calibration. However, it should be noted that DSM cannot recognize the direction of movement as currently formulated.
Future studies could focus on analyzing the performance of the DSM method with textured targets, such as pseudo-speckled patterns used in Digital Image Correlation. Results obtained with complex targets suggest that the method may not provide optimal results, but the deviation of the curve from linear behavior can provide valuable information about object distortions that is not captured by the correlation method, where only the peak position is used as a parameter.
In summary, the DSM method is a reliable alternative to correlation-based methods, offering simplicity and a lower computational cost. However, it is more sensitive to noise and may not perform optimally with complex targets. According to this, the choice of circular targets is recommended for subpixel tracking due to their ease of use and accuracy.


