Article

Sparse Subgraph Prediction Based on Adaptive Attention

School of Computer Science and Engineering, North Minzu University, Yinchuan 750021, China
*
Author to whom correspondence should be addressed.
Appl. Sci. 2023, 13(14), 8166; https://doi.org/10.3390/app13148166
Submission received: 28 May 2023 / Revised: 21 June 2023 / Accepted: 12 July 2023 / Published: 13 July 2023
(This article belongs to the Special Issue Knowledge Graphs: State-of-the-Art and Applications)

Abstract

:
Link prediction is a crucial problem in the analysis of graph-structured data, and graph neural networks (GNNs) have proven to be effective in addressing this problem. However, the computational and temporal costs associated with large-scale graphs remain a concern. This study introduces a novel method for link prediction called Sparse Subgraph Prediction Based on Adaptive Attention (SSP-AA). The method generates sparse subgraphs and utilizes Graph SAmple and aggreGatE (GraphSAGE) for prediction, aiming to reduce computation and time costs while providing a foundation for future exploration of large-scale graphs. Certain key issues in GraphSAGE are addressed by integrating an adaptive attention mechanism and a jumping knowledge module into the model. To address the issue of adaptive weight distribution in GraphSAGE, an aggregation function is employed, which is based on the attention mechanism. This modification enables the model to distribute weights adaptively among neighboring nodes, significantly improving its ability to capture node relationships. Furthermore, to tackle the common issue of over-smoothing in GNNs, a jumping knowledge module is integrated, enabling information sharing across different layers and providing the model with the flexibility to select the appropriate representation depth based on the specific situation. By enhancing the quality of node representations, SSP-AA further boosts the performance of GraphSAGE in various prediction tasks involving graph-structured data.

1. Introduction

With the advent of the big data era, the Internet has become a major source of information collection in various fields, including social networks [1], shopping networks [2], protein networks [3], and more. The information within these networks often exhibits large-scale and complex topological structures. Notably, graph-structured data pervades in representing the relationships between interacting entities. Moreover, graphs have become an important data form for link prediction tasks [4], which involve predicting the missing relationships between entity pairs across different timelines. As the volume of graph-structured data continues to grow, researchers constantly grapple with issues related to predictive performance and computational cost. Approaches range from simple, easy-to-implement heuristic methods to the use of graph neural networks, which automatically learn complex patterns within the graph structure and manage large-scale graph data. All these methods require extensive sampling and training to enhance model predictive performance. However, as the volume of network data continues to surge, traditional prediction methods face challenges in computation and storage when dealing with large-scale data. To address the difficulties brought about by massive sampling and training, one potential solution lies in the use of subgraph-based methods to reduce computational overhead in large-scale graph structures.
By focusing only on the subgraphs around the target nodes, the complexity of sampling and training can be significantly reduced, which in turn speeds up model training and improves prediction efficiency. For link prediction problems in large-scale recommendation systems, the Pinterest SAGE (PinSage) [5] model employs subgraph sampling and graph neural network models for representation learning. Empirical evidence has shown that subgraph-based methods have achieved commendable performance in link prediction tasks within recommendation systems. Similarly, the Graph WaveNet [6] model uses subgraph-based random walk sampling and convolution operations to model spatiotemporal graph data, capturing complex patterns and dynamic changes effectively, leading to superior performance. Consequently, subgraph-based prediction methods emerge as the optimal solution. In order to further alleviate the challenges associated with processing large-scale graph-structured data, a sparse subgraph sampling approach is employed for prediction tasks. This sampling method retains crucial structural information around the target nodes while reducing computational costs in large-scale graph structures.
GNNs [7,8] have been proven to be an effective method for handling large-scale graph-structured data and are widely used in various tasks, such as node classification [9], graph classification [10], and link prediction. Early GNNs tended to use shallow encoders, where latent nodes were represented through random walks for learning, followed by the assessment of link probabilities based on the latent representations of the two endpoint nodes. However, due to the incompatibility between node features and inductive settings, the ability to train using all nodes was hindered. The advent of message-passing graph neural networks addressed these issues. GraphSAGE [11] serves to learn node representations in graph-structured data, taking better advantage of node features and proving more suitable for inductive settings. Therefore, it partially addresses the limitations of early GNNs. GraphSAGE is detailed in [12], which outlines its basic principles and key components. Firstly, GraphSAGE learns node representations by aggregating over the subgraphs of each node’s neighbors. Secondly, detailed analysis is provided for applications in different domains. Lastly, experiments and results demonstrate the performance and effectiveness of the GraphSAGE model in specific tasks. Therefore, GraphSAGE has facilitated research on various downstream tasks, such as link prediction, node classification, and graph classification. Additionally, in the task of processing graph-structured data, GNNs often encounter the issue of over-smoothing [13] when trying to increase depth. This results in overly similar feature representations between different nodes, reducing the model’s discriminative ability and expressiveness. To tackle this problem, a skip-knowledge module needs to be introduced into the SSP-AA model. This module allows the model to flexibly select and integrate features from different layers, greatly enhancing the expressiveness of node representations. It enables the SSP-AA model to demonstrate higher prediction accuracy and efficiency when handling large-scale graph data tasks, thus bringing about further innovation and development in the field of graph structure prediction.
In the task of handling large-scale graph-structured data, existing methods present numerous challenges and shortcomings. They include the excessive overhead of model training and the inability to assign suitable weights to nodes, resulting in a limited capacity of the model to capture information in the graph structure. Additionally, the issue of over-smoothing arises with the increasing depth of graph neural networks and leads to overly similar node feature representations. All these reduce the efficiency and predictive accuracy of the model, posing significant challenges for prediction tasks oriented toward large-scale graph-structured data. Therefore, this paper proposes an adaptive attention-based method for sparse subgraph prediction based on the GraphSAGE model (SSP-AA), which aims to effectively process sparse subgraph data while maintaining high predictive performance. The contributions of this paper are as follows:
(1)
First of all, the SSP-AA model incorporates an adaptive attention mechanism to enhance its ability to handle graph-structured data. This approach addresses the limitations of the existing model, specifically in terms of adaptive weight allocation when aggregating neighbor node features;
(2)
Moreover, integrating a jumping knowledge module addresses the over-smoothing problem that frequently occurs with increasing depth in GNNs. The jumping knowledge module allows the model to flexibly select and combine features across different layers, enhancing the expressive power of node representations;
(3)
Finally, utilizing sparse subgraphs helps to decrease the complexity of the graph structure, retaining crucial node information in the graph while reducing computational overhead in prediction tasks and classification tasks involving large-scale graph-structured data.

2. Related Work

2.1. Graph Neural Network

In recent years, with the advancement of deep learning technologies, numerous new graph neural network structures have emerged. In the task of link prediction, traditional methods inferring missing links from a global topological perspective have consistently proven ineffective, leading to the development of various graph neural network approaches. The Graph Attention Network (GAT) [14] aggregates neighbor node information by learning the relationship weights between each node and its neighbors, achieving improved results in predicting missing links within various large-scale networks. The Graph Convolutional Recurrent Neural Network (GCRN) [15] combines the structures of convolutional and recurrent neural networks to model neighbor nodes temporally while considering global information. The Graph Variational Autoencoder (GVAE) [16], through mapping graph data to a latent space and introducing the concept of variational autoencoders, can generate new graph data, contributing to graph generation and reconstruction tasks. Additionally, the learning ability of the Graph Recursive Neural Network (GRNN) [17] is combined with the multi-scale characteristics of wavelet decomposition to perform more accurate field strength prediction, assisting in cellular network planning and performance optimization. Experimental results demonstrate the GRNN’s robust capability to capture information in multiple stages. Although each of these structures can be selected according to specific tasks, they have their own disadvantages and limitations. For instance, certain structures might suffer from excessive computational complexity when handling large-scale graph data, experiencing insufficient capturing of complex graph patterns and long-distance dependencies, or a lack of adequate model interpretability. Overcoming these challenges necessitates the design and improvement of new structures. Therefore, in response to the limitations of existing graph neural network models, this paper proposes a method based on Graph Convolutional Networks (GCNs) [18] for tasks such as link prediction and node classification.
GCNs aggregate local neighbor information through convolution operations on adjacency matrices. This enables the model to capture complex inter-node relationships while preserving graph structure information. It conducts weighted aggregation based on the features of neighboring nodes, allowing each node to effectively integrate information from its neighbors, thereby generating context-aware representations. However, GCNs only use first-order neighbor information for aggregation operations, preventing the model from fully capturing relationships between nodes and more distant neighbors. Moreover, during the aggregation process, all neighbor nodes are assigned the same weight, which means the model cannot differentiate the importance of different neighboring nodes. These limitations lead to some constraints in GCNs. Therefore, to address these issues, GraphSAGE has been proposed as an improvement on GCNs.
In medical and pharmaceutical research, Ref. [19] applied the GraphSAGE model to integrate multimodal and complex relationship biomedical networks, effectively predicting adverse drug interactions and impacts between drugs and their targets. This plays a significant role in constructing drug knowledge graphs for Coronavirus Disease 2019 (COVID-19). Experimental results show that the GraphSAGE model can effectively predict drug–disease interactions for COVID-19. In the realm of Internet of Things (IoT) intrusion detection systems, Ref. [20] utilized the GraphSAGE model to capture edge features of graph structure data and topological information for network intrusion detection within IoT networks, conducting extensive experimental evaluations on four Network Intrusion Detection System (NIDS) benchmark datasets with positive results. In industrial Internet attack detection systems, Ref. [21] constructed graph structure data with network ports and IP addresses as nodes, and residual traffic as edge information. They employed the GraphSAGE model for node sampling and feature aggregation, effectively learning local neighborhood features of nodes and accurately predicting attacks in the industrial Internet. This approach effectively addresses attack detection issues in complex networks.

2.2. Link Prediction Method

The task of link prediction is the process of predicting missing relationships between entity pairs within a graph structure. Link prediction methods can be classified into heuristic methods, matrix factorization methods, random walk methods, community detection methods, rule-based methods, feature learning methods, machine learning methods, and GNN methods.
Based on heuristic methods, strategies using metaheuristics [22] are combined with the Particle Swarm Optimization (PSO) [23] approach and the topological properties of social network graphs to locate missing relationships in symbolic social networks. Ref. [24] analyzed the problem of link prediction in complex networks, elucidating the relationship between the degree of clustering of nodes in a network and node degree, and expounded on the existing link prediction methods and technologies as well as the application areas and challenges of heuristic methods. Based on matrix decomposition methods, the SparseMult [25] model employs a matrix decomposition method that breaks down a large matrix into the product of several smaller matrices. This approach significantly reduces computational complexity, allowing the model to handle large-scale data more effectively. Based on random walk methods, the DeepWalk [26] algorithm simulates random walk paths between nodes purely by random walk, capturing the structure of the network and thereby addressing the problem of missing relationships in the network. Ref. [27] summarized the impact of network embedding feature learning methods on link prediction tasks, such as DeepWalk, Large-scale Information Network Embedding (LINE), and node2vec. Network embedding methods generate node embeddings by controlling the random walk process between nodes, thereby capturing the structure and relationships within the network. Based on community discovery methods, some existing approaches do not consider important information such as community features, text information, and growth mechanisms in link prediction tasks. Therefore, Ref. [28] incorporated node features into community detection algorithms based on the characteristics of social networks, further improving the process of community discovery methods in link prediction tasks. Based on rule-based methods, the Anytime Bottom-Up Rule Learning (AnyBURL) [29] model performed well in various general link prediction tasks. However, its aggregation process is affected by the redundancy of multiple rules. Thus, the Scalable and Fast Non-redundant Rule Application (SAFRAN) [30] was used to detect cluster redundant rules before aggregation, thereby improving the effect of the AnyBURL model. Based on feature learning methods, in combat systems, diverse systems and information flows were treated as nodes and edges, using the Representation Learning based Heterogeneous Combat Network (RLHCN) [31] method to predict various link types in the combat network. Based on machine learning methods, in graph-structured data, the popularity of each node is computed and the similarity metric between each pair of nodes in the network is assessed. These two metrics constitute the features of the node pairs, and this feature data is input into a machine learning classifier [32] to identify missing relationships in the network. Ref. [33] improved the water environment by combining machine learning and regional features of artificial immune algorithms to extract images of floating objects in polluted water sources, effectively detecting floating pollutants on the water surface and aiding in water resource management [34]. In medical image segmentation tasks, feature learning regression network models provided a better method for image segmentation, which can effectively solve the problem of retinal layer segmentation bias.
Link prediction methods have evolved from simple heuristic algorithms to complex GNNs, with gradually improving performance. Heuristic algorithms are simple, but their performance is limited. Methods such as matrix factorization and random walks show improved performance but come with high computational costs. Community detection and rule-based methods require manual parameter tuning. Feature learning successfully captures graph structural features but requires additional models and computational overhead. Machine learning methods have enhanced performance, but feature extraction and scalability are limited. GNNs have brought about a significant improvement in link prediction. They can be trained within an end-to-end framework [35,36], capture node features and graph structural information, and exhibit excellent scalability. However, they have high computational costs, especially when dealing with large graphs. Therefore, using GraphSAGE to aggregate node features and expand node representations can effectively solve issues of computational overhead and scalability.

2.3. Sparse Subgraph Generation Method

In order to mitigate the complexity of graph structures, researchers have explored the generation of sparse subgraphs as a means to reduce the scale of graph-structured data. The methods for generating sparse subgraphs [37] primarily involve pruning strategies and graph sampling. Pruning strategies employ approaches such as degree-based pruning and distance-based pruning, which trim the graph based on topological structure or node features. Structural Deep Network Embedding (SDNE) [38] is a technique that can be utilized to learn low-dimensional embeddings of nodes in a network. SDNE achieves this by extracting sparse subgraphs through pruning, targeting the removal of low-weight edges in the network to reduce noise and redundant information, thereby enhancing the quality and effectiveness of the embeddings. The pruning process of SDNE can be seen as a strategy that reduces the complexity of the graph while preserving its structural information. Sampling methods typically involve selecting nodes or edges based on their importance. Random walk sampling [39] simulates random walks between nodes, occasionally restarting at specific nodes, and constructs a probability transition matrix that governs the movement between nodes. By iteratively calculating the transition matrix, the stable distribution of nodes can be obtained. Subsequently, sparse subgraphs with high-probability connections can be extracted based on the stable distribution among nodes. These approaches not only preserve the structural information of the graph but also reduce its complexity, thereby decreasing the computational costs associated with prediction and classification tasks in large-scale graph-structured data. Figure 1 illustrates an example of extracting sparse subgraphs from a large graph using random walk and k-hop neighbor sampling methods.

3. The Proposed SSP-AA Model

In current link prediction tasks, on one hand, most models simply set an appropriate sampling range and then directly aggregate neighbor nodes, without fully considering the features of the nodes, leading to suboptimal model performance. On the other hand, GNN models can suffer from over-smoothing as the model depth increases, resulting in reduced node feature representation.
In response to these issues, we propose a prediction model based on adaptive attention, the SSP-AA model. The symbol definitions of the SSP-AA model are shown in Table 1 as presented.
In mathematics and computer science, a graph G (V, E) is an abstract data type used to represent pairwise relationships among objects. A graph comprises vertices V (or nodes) and edges E (or arcs), where each edge E connects two vertices. For a graph G (V, E), if there is another graph H (V′, E′) where V′ ⊆ V and E′ ⊆ E, and every edge in E′ still connects two vertices in V′, then H is considered a subgraph of G.

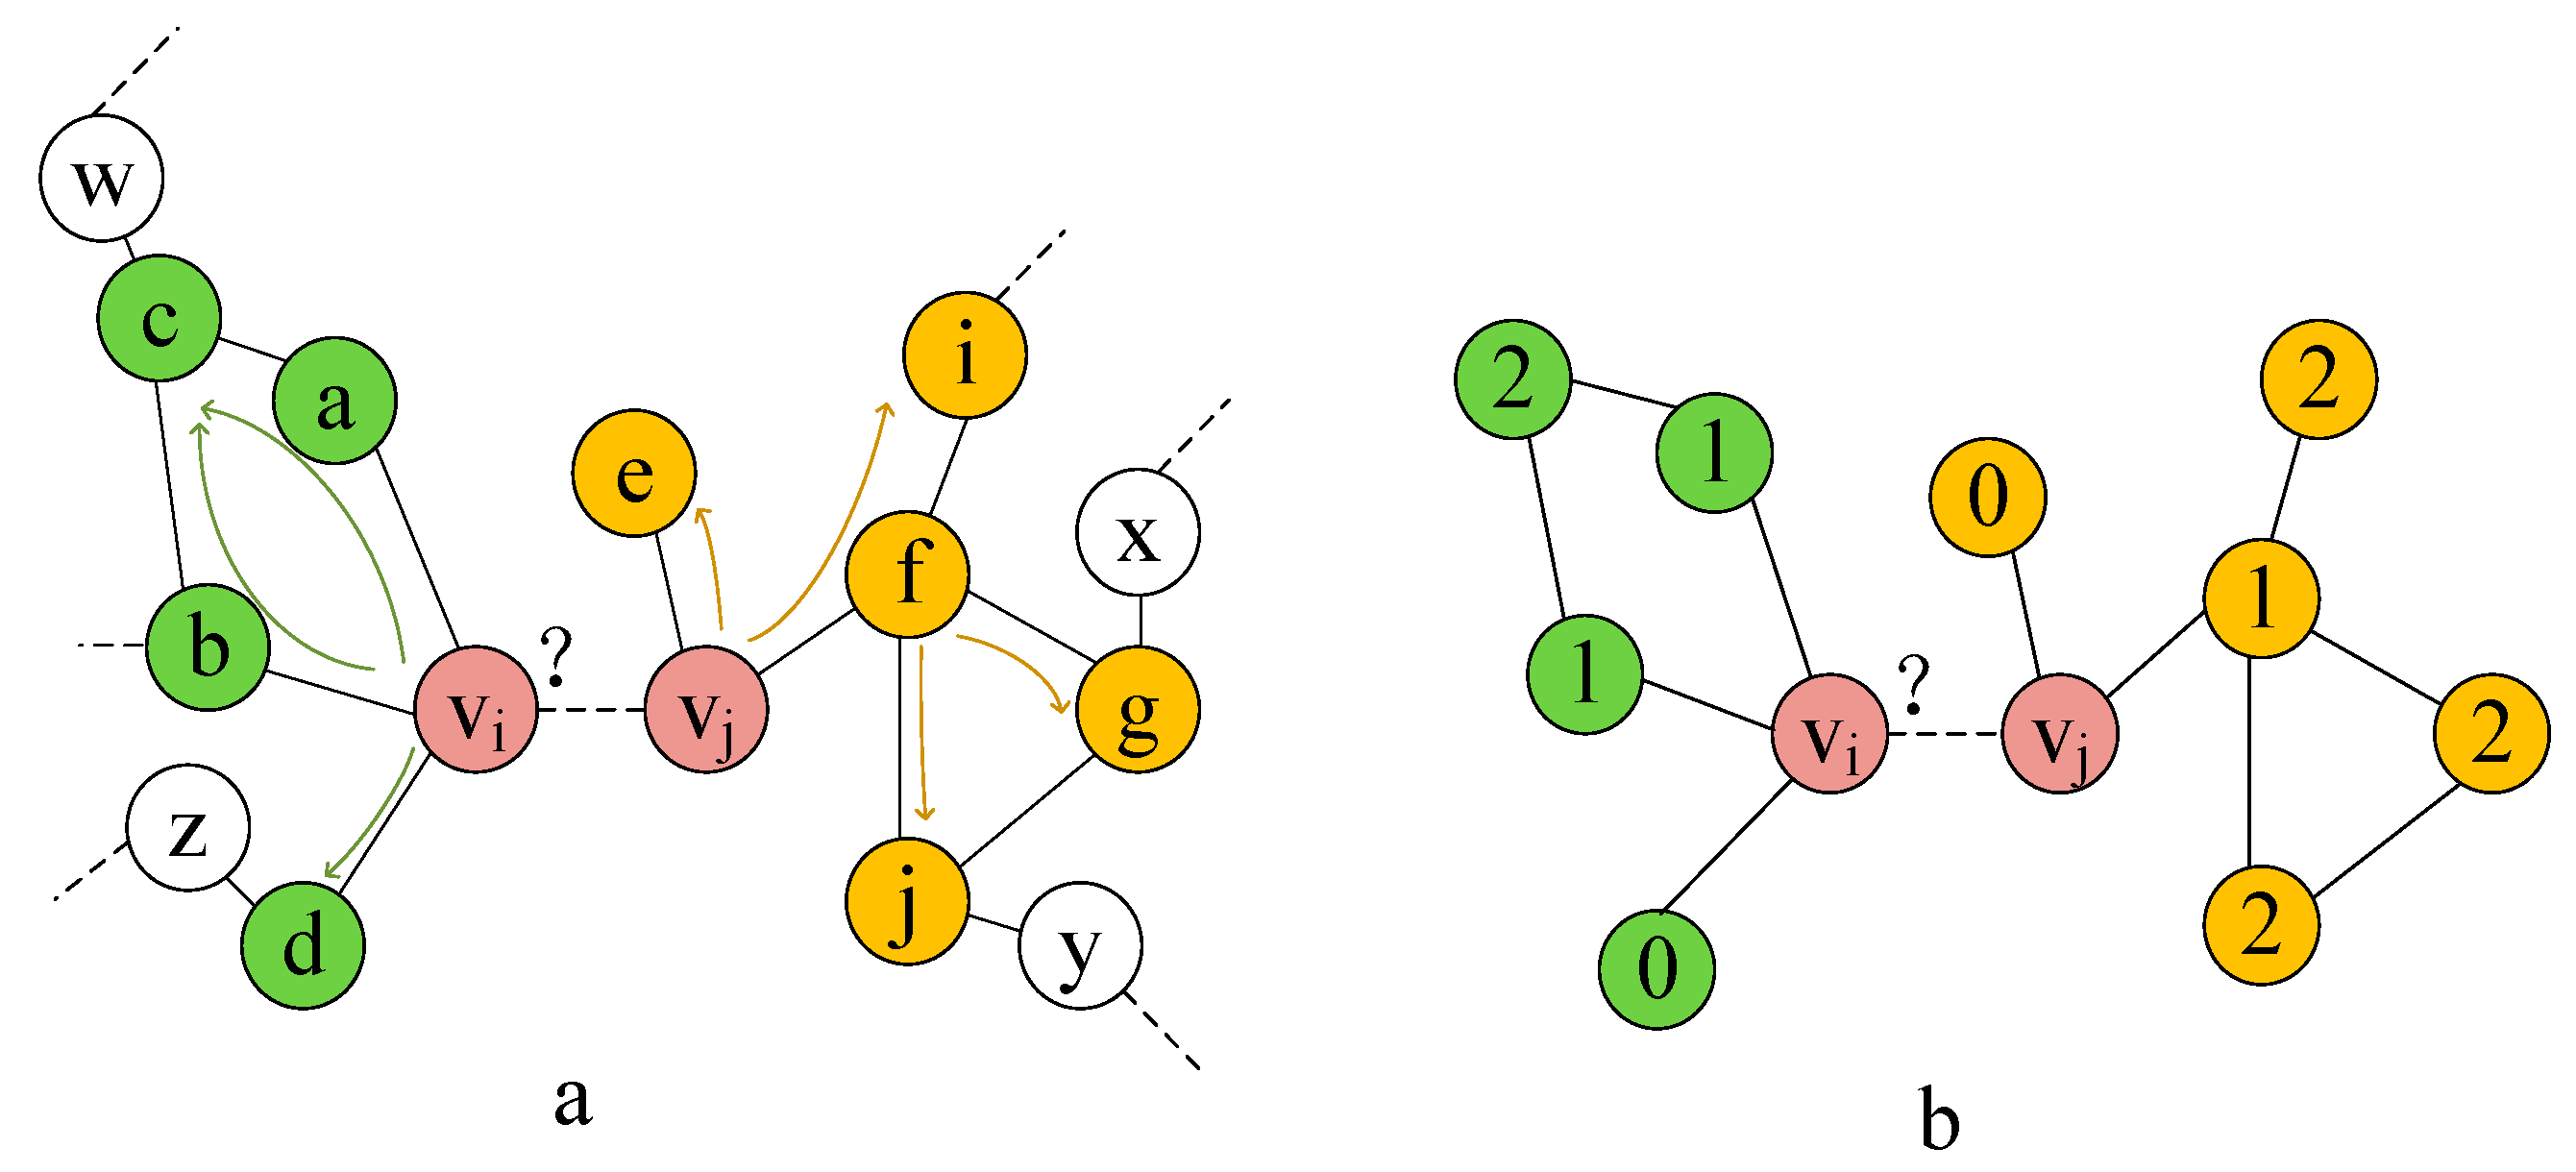
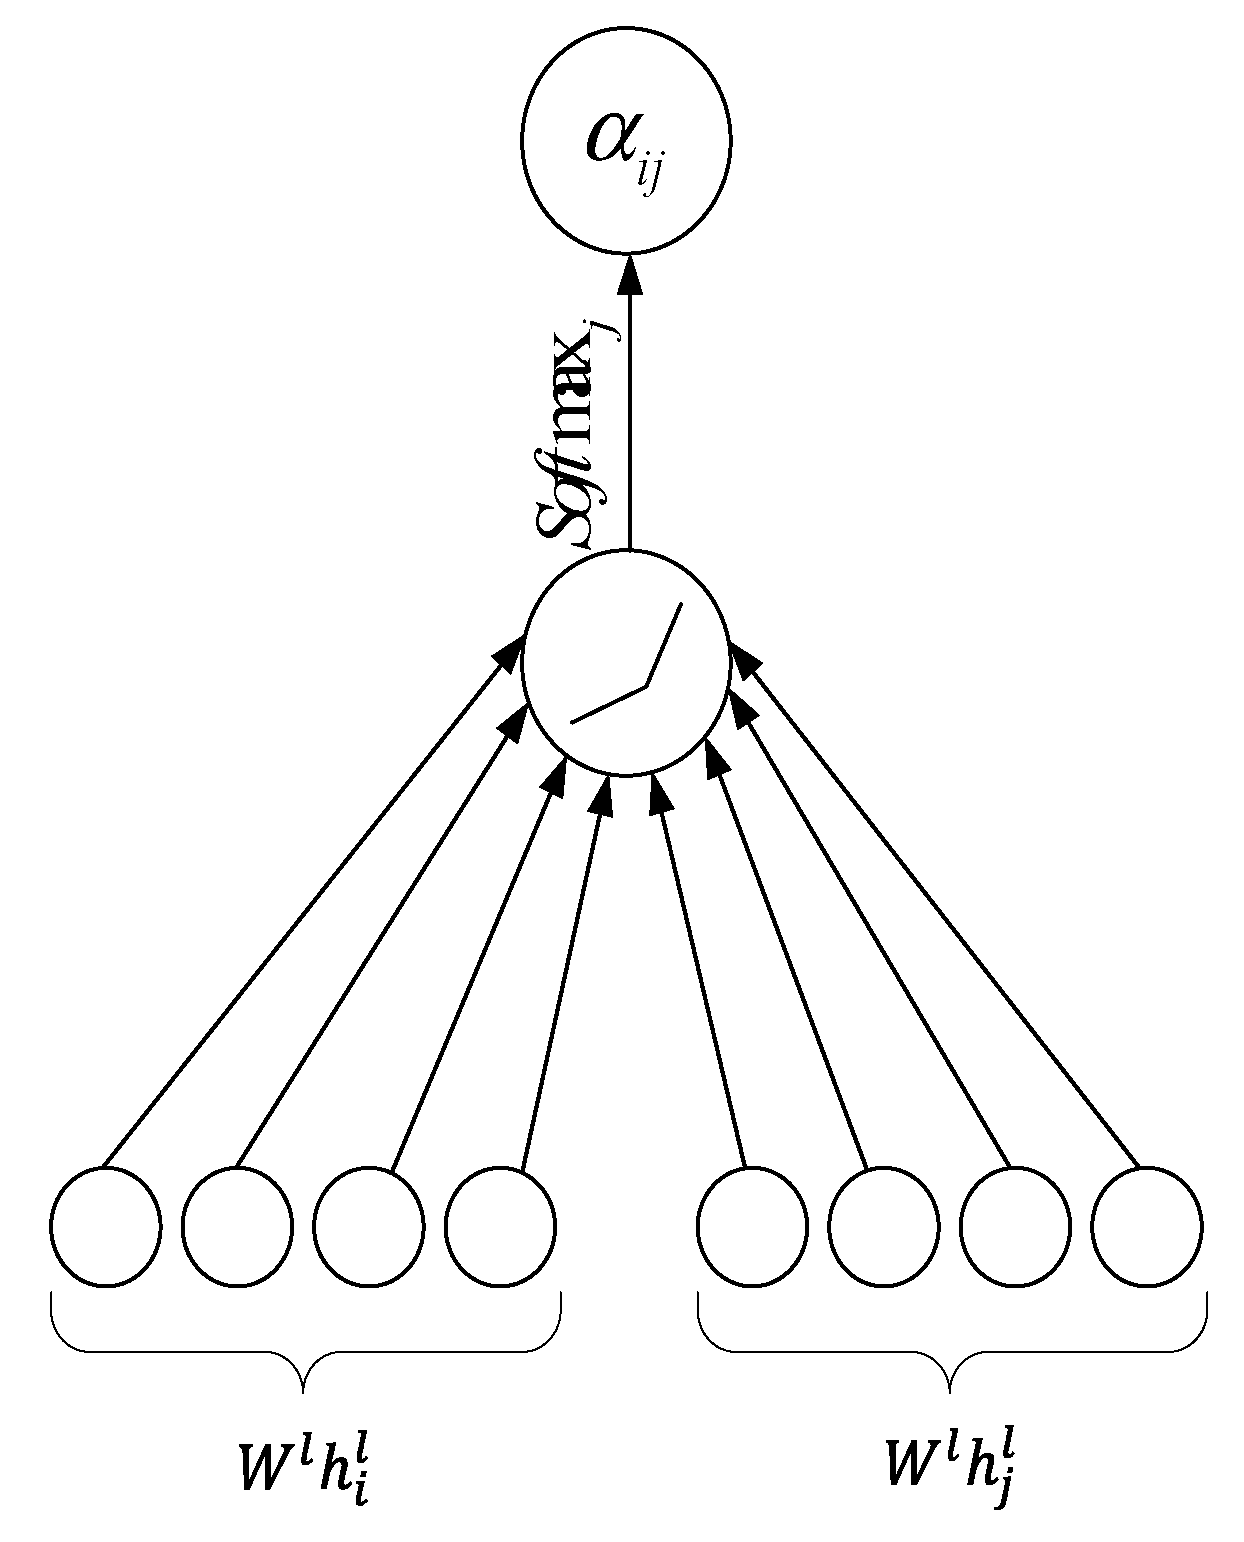
3.1. Adaptive Attention Mechanism

In link prediction tasks, the feature information of most target node pairs originates from the features of neighboring nodes. Effectively learning the neighborhood features of target nodes requires considering the different levels of structural importance and association among neighborhood nodes. Therefore, to learn these vital features, it is necessary to learn attention mechanisms [40] in multi-layer spaces to capture different aspects of latent features. Aggregating neighboring features that have important relevance in different layers through the attention mechanism can construct comprehensive and expressive neighbor features. Consequently, an adaptive attention mechanism is incorporated into the SSP-AA model. By employing this mechanism, the SSP-AA model can dynamically allocate weights among neighboring nodes, allowing for the effective aggregation of neighbor node information to generate target node representations. As a result, the SSP-AA model exhibits a strong capability to express features in prediction tasks. In this section, we first calculate the attention between neighboring nodes in the current layer. Then, the attention weights are normalized. Finally, the feature representation of the current layer is obtained through node aggregation.
(1)
Calculation of the attention mechanism
The attention weights in traditional attention mechanisms are computed by applying a shared attention mechanism to the hidden representations between node pairs. For the representation of node i, the feature of node j plays a crucial role. Every node in the graph is related to all other nodes. Therefore, the formula for calculating attention weights is as follows:
e i j l = L e a k y R e L U ( α T [ W l h i l W l h j l ] + b i j )
The term b i j represents an additional learnable bias term, used to adjust attention weights based on the relationship between nodes i and j. By introducing this additional bias term in the module, the model can more easily adapt the weights between neighboring nodes in sparse subgraphs, thereby capturing the features of the graph structure more effectively. The Leaky Rectified Linear Unit (LeakyReLU) is a nonlinear activation function and a variant of the Rectified Linear Unit (ReLU) activation function. The LeakyReLU allows for a small, nonzero output for negative inputs to solve the dying neuron problem, thus ensuring all neurons in the neural network remain active. This helps to enhance the learning capability and performance of the model.
Based on the output of the graph attention layer, we can obtain the output features H l + 1 from H l . Inspired by the dot product formula, the dot product is applied to the attention calculation of output features. When the dot product of two vectors is large, their angle in space is smaller, implying they have a similar direction and hence a higher similarity. This method allows for a more accurate aggregation of nodes with high similarity during the node aggregation process, thus enhancing the model’s performance. Therefore, this paper proposes using the dot product to measure the similarity between two vectors. Accordingly, the attention to the output features is as follows:
e i j l + 1 = ( W l + 1 h i l ) T W l + 1 h j l
(2)
Normalization of the attention weight
Normalization of the original attention scores into attention weights involves applying the softmax function across all neighboring nodes of a given node i. The formulation for this normalization process is as follows:
α i j = s o f t m a x j ( e i j l ) = exp ( e i j l ) k N i exp ( e i k l )
where α i j denotes the normalized attention weight between nodes i and j, Ni represents the set of neighboring nodes of node i, and e i j l and e i k l are the original attention scores between node i and its neighboring nodes j and k, respectively. The process of weight normalization is shown in Figure 2.
This ensures the sum of the attention weights for all neighboring nodes of node i equals 1 to make the model better balance the importance of different nodes when aggregating neighboring node information. By dynamically adjusting attention weights to capture relationships between nodes, the normalized attention weights also contribute to the stability of the training process. The formula for calculating the adaptive attention weights of the model is as follows:
α i j = exp ( L e a k y R e L U ( α T [ W l h i l W l h j l ] + b i j ) ) k N i exp ( L e a k y R e L U ( α T [ W l h i l W l h k l ] + b i k ) )
(3)
Aggregating Neighbor Node Information
The normalized attention weight α i j is used to weigh the information of neighboring node j, and this information is then aggregated into the target node i. This process updates the representation of node i in the subsequent layer l. The aggregation representation formula is as follows:
h i l + 1 = σ ( j N i α i j ( W l h j l ) )
h i l + 1 is the representation of node i’s features in the l + 1 layer. To stabilize the model’s learning process, it is beneficial to extend the attention mechanism to use multi-head attention. Specifically, K-independent attention mechanisms are used to transform the above formula, and their features are concatenated using the operator . Concatenation preserves the output information of multiple heads K, enabling the model to understand the input information from different perspectives. Each head may focus on different parts of the input, so concatenating the output of these heads can result in a more comprehensive representation. Moreover, the concatenation operation does not change the independence of each head’s output, thus avoiding information confusion between different heads. The representation of node i’s features in the l + 1 layer is as follows:
h i l + 1 = k = 1 K σ ( j N i α i j k W l k h j l )
In this formula, denotes concatenation, σ represents a non-linear activation function, α i j k is the normalized attention coefficient of the Kth attention mechanism, and W l k corresponds to the weight matrix of the respective linear transformation of the input.
(4)
Integrate the attention mechanism into the SSP-AA model
Through the aforementioned steps, the attention mechanism can be effectively integrated into the SSP-AA model, enabling it to adaptively assign weights to each neighboring node and efficiently aggregate neighbor node information to generate representations of the target node. Furthermore, to further improve model performance, a multi-head attention mechanism is adopted, enabling the model to capture various relationships between neighboring nodes. This method not only effectively captures relationships between nodes but also possesses strong interpretability and generalization performance, and thus it has seen widespread application and exploration in the field of GNNs.

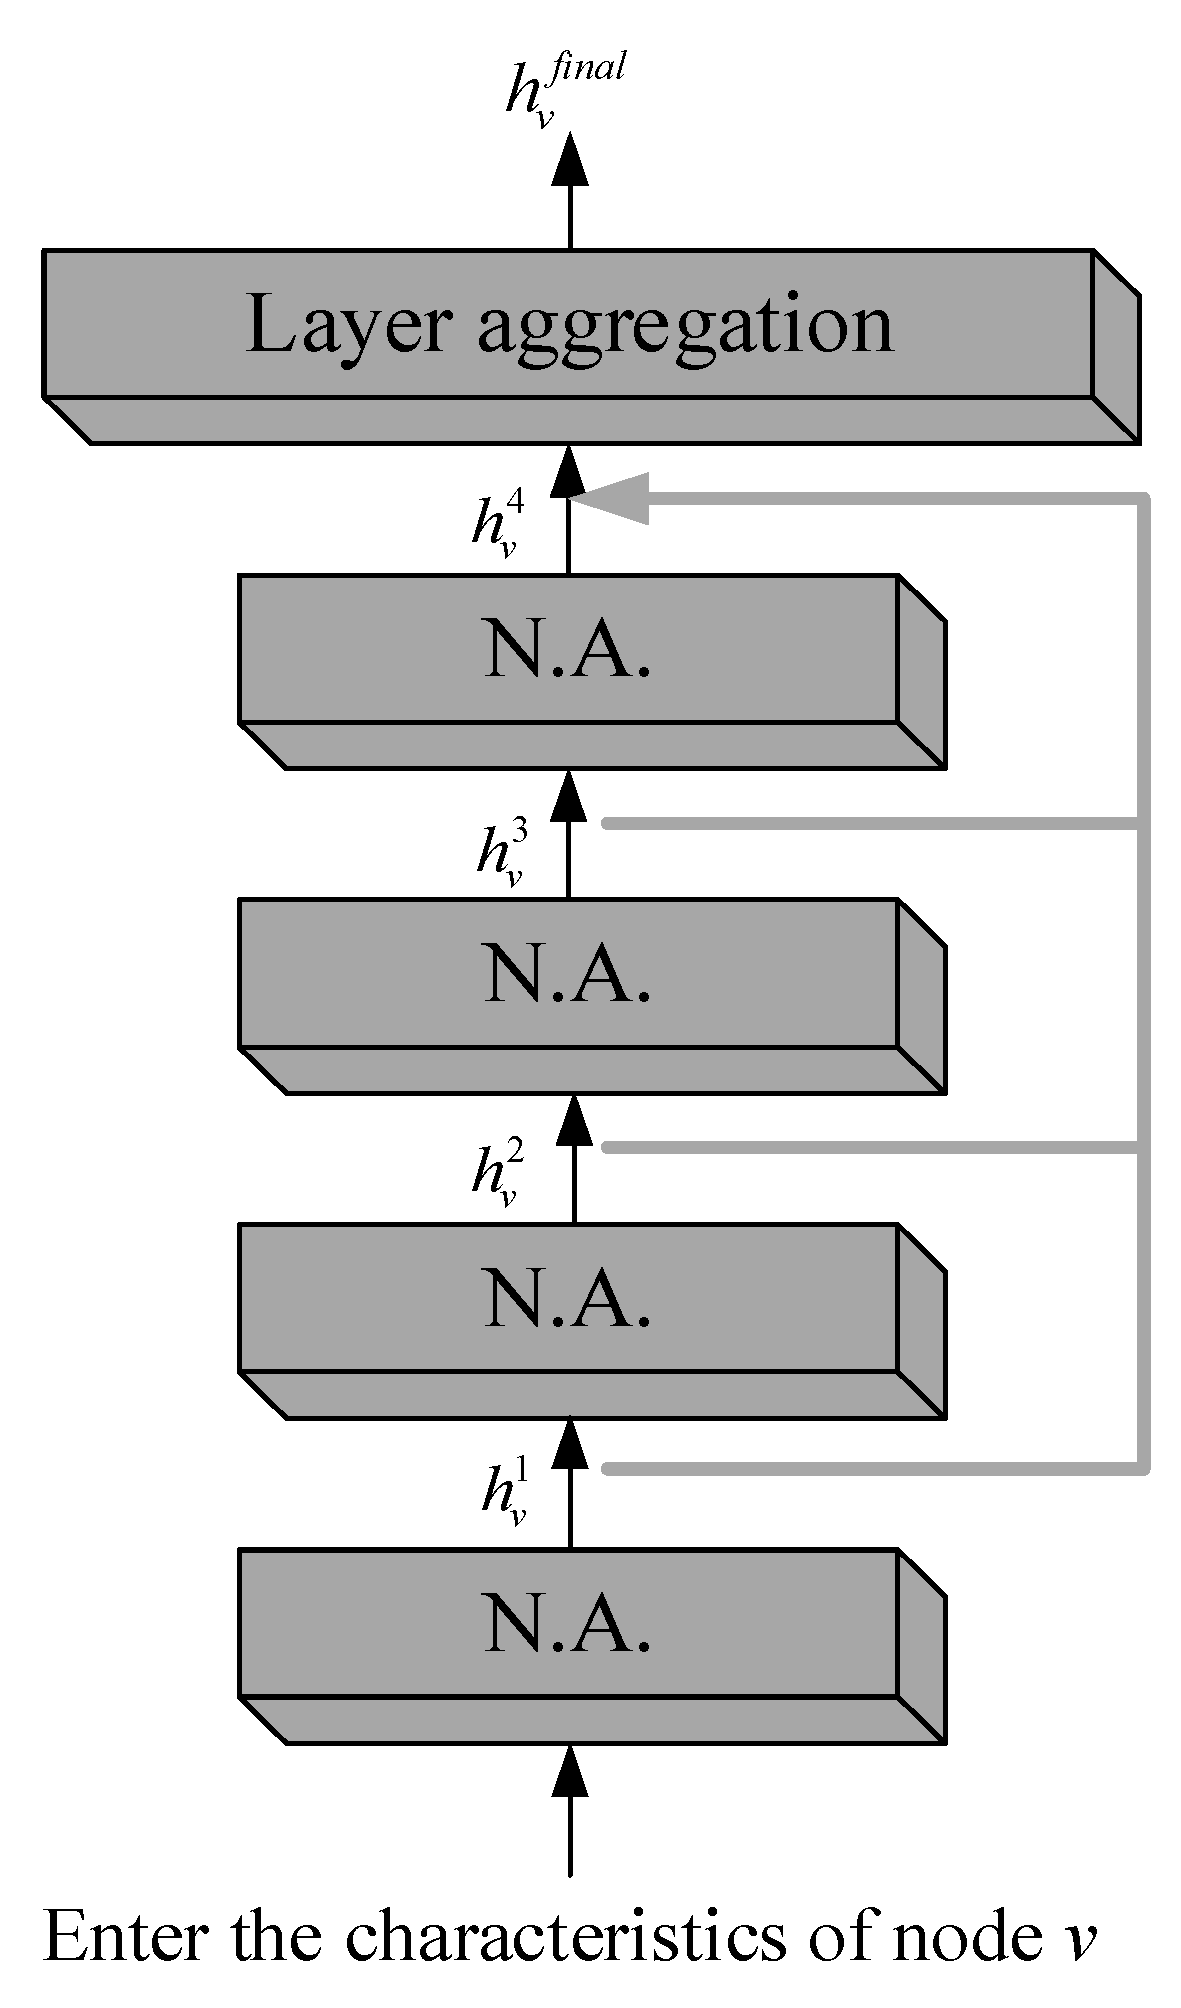
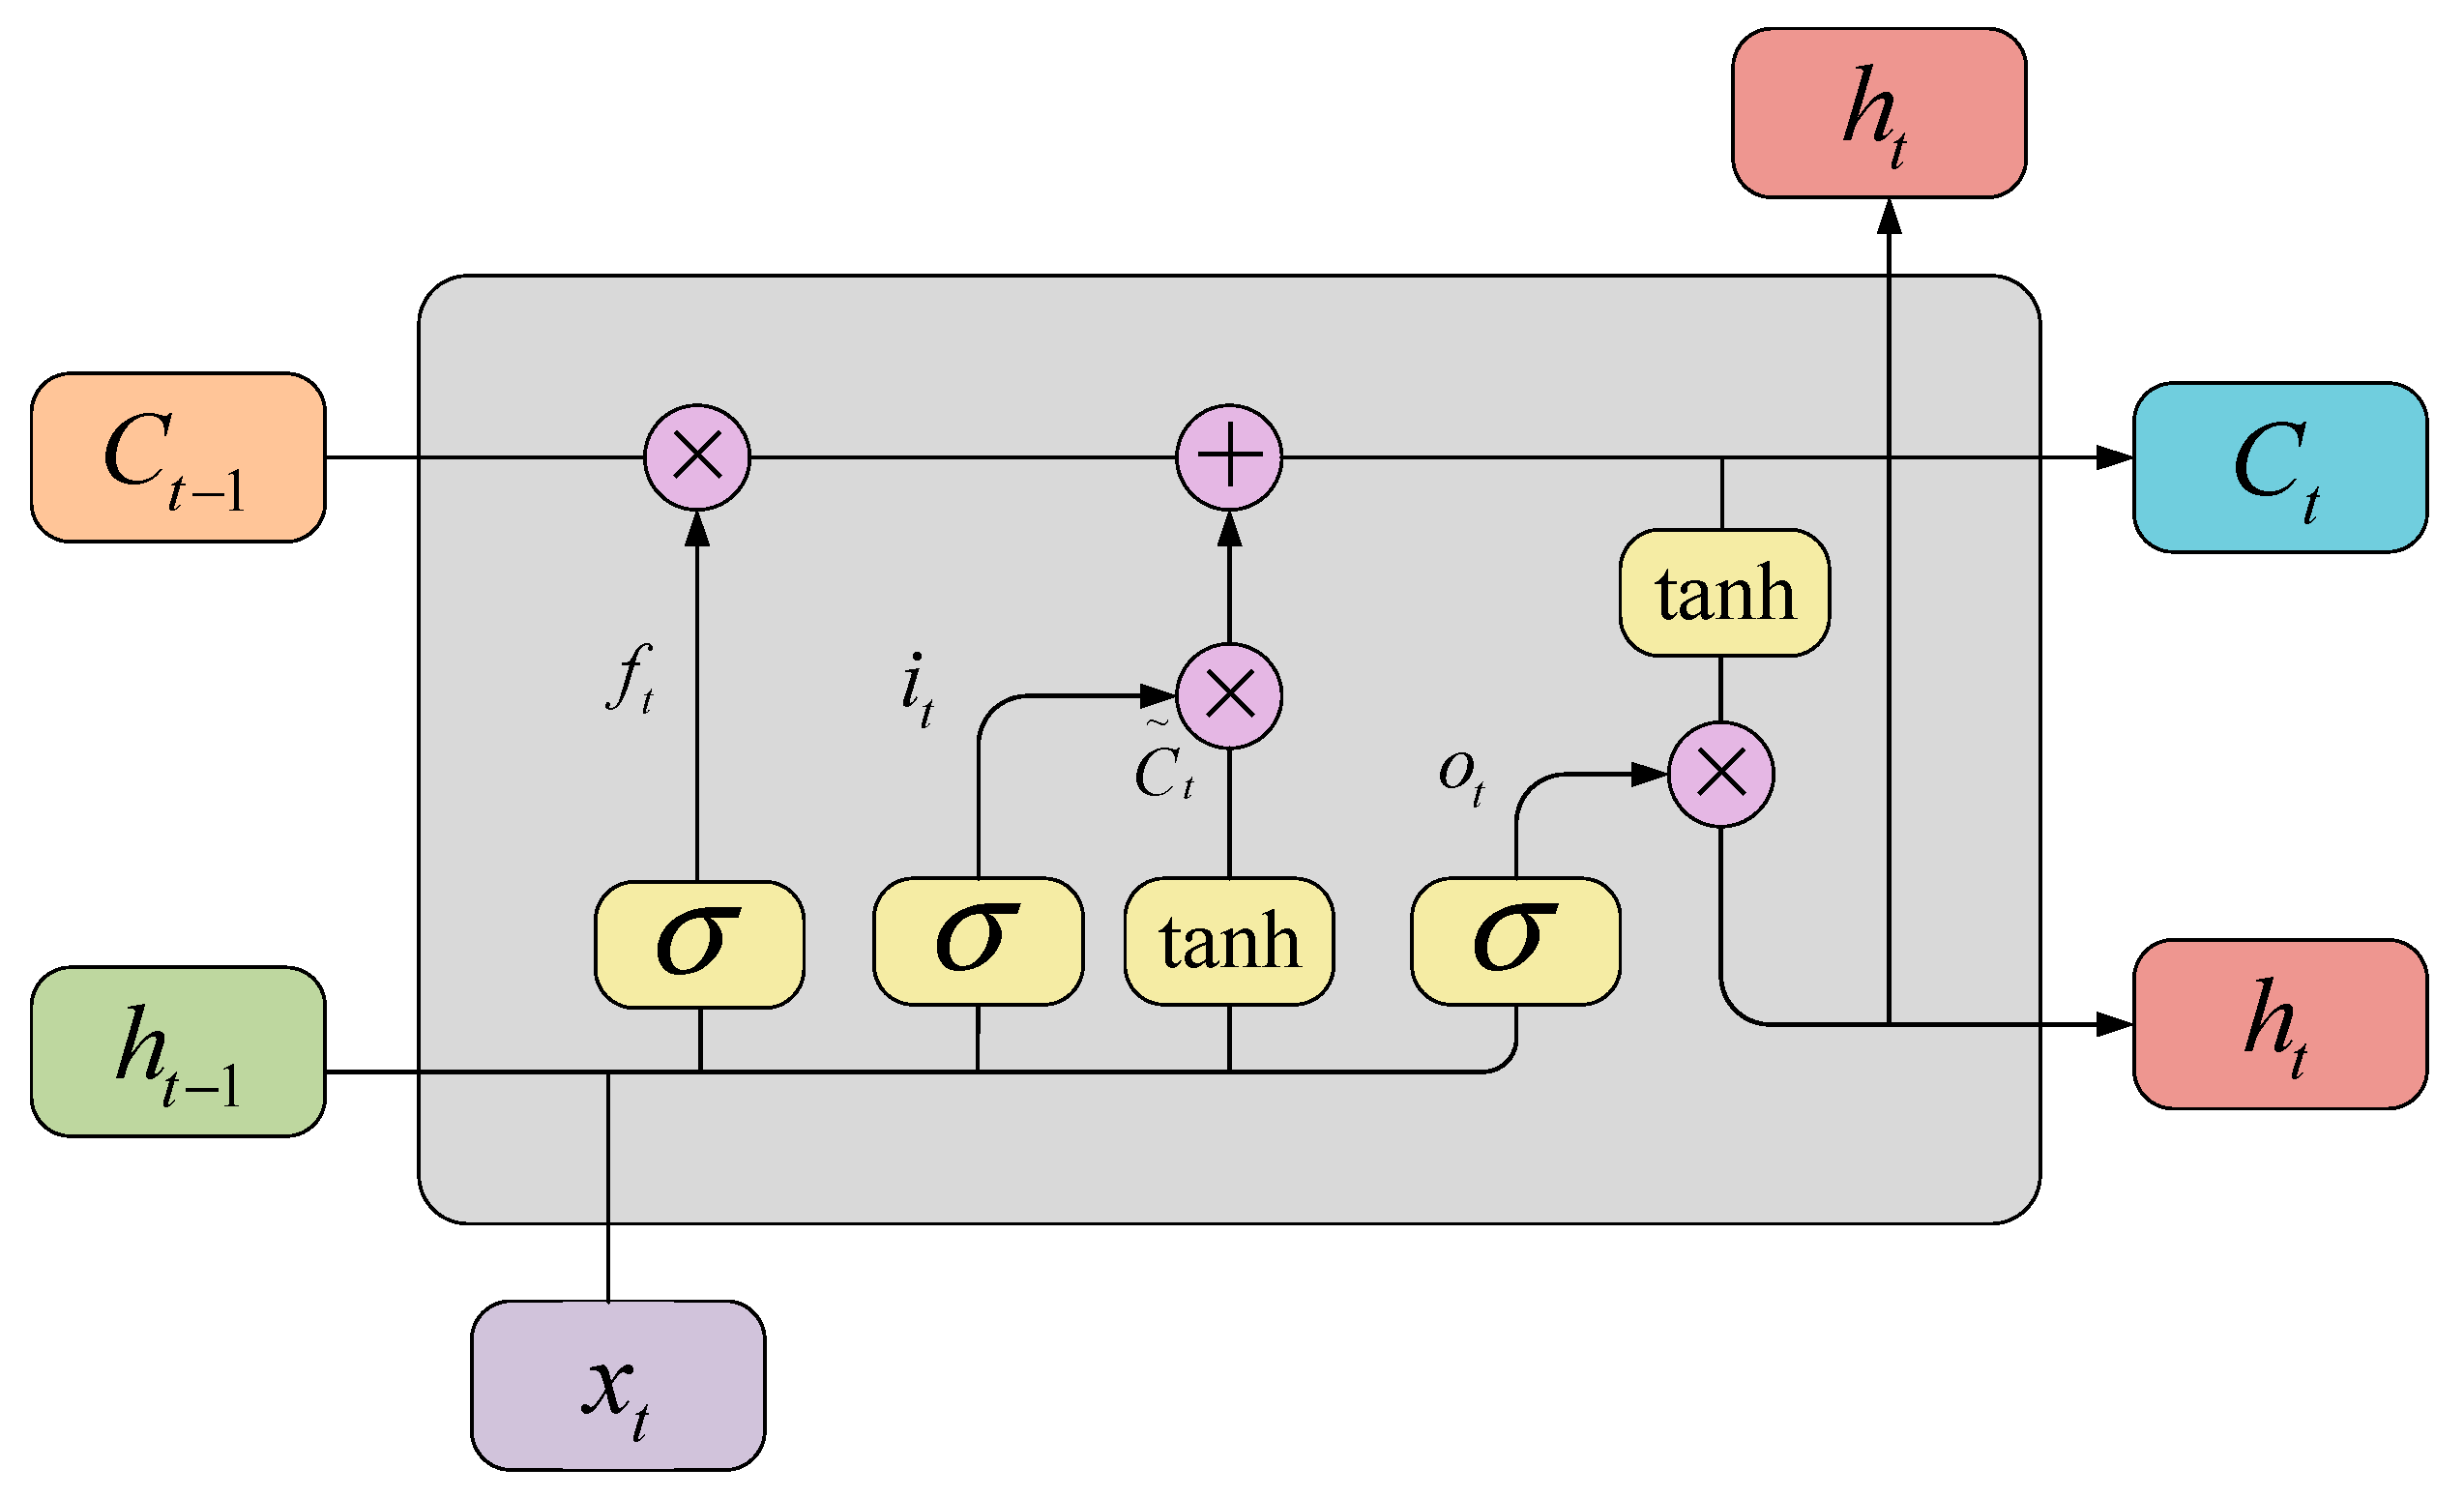
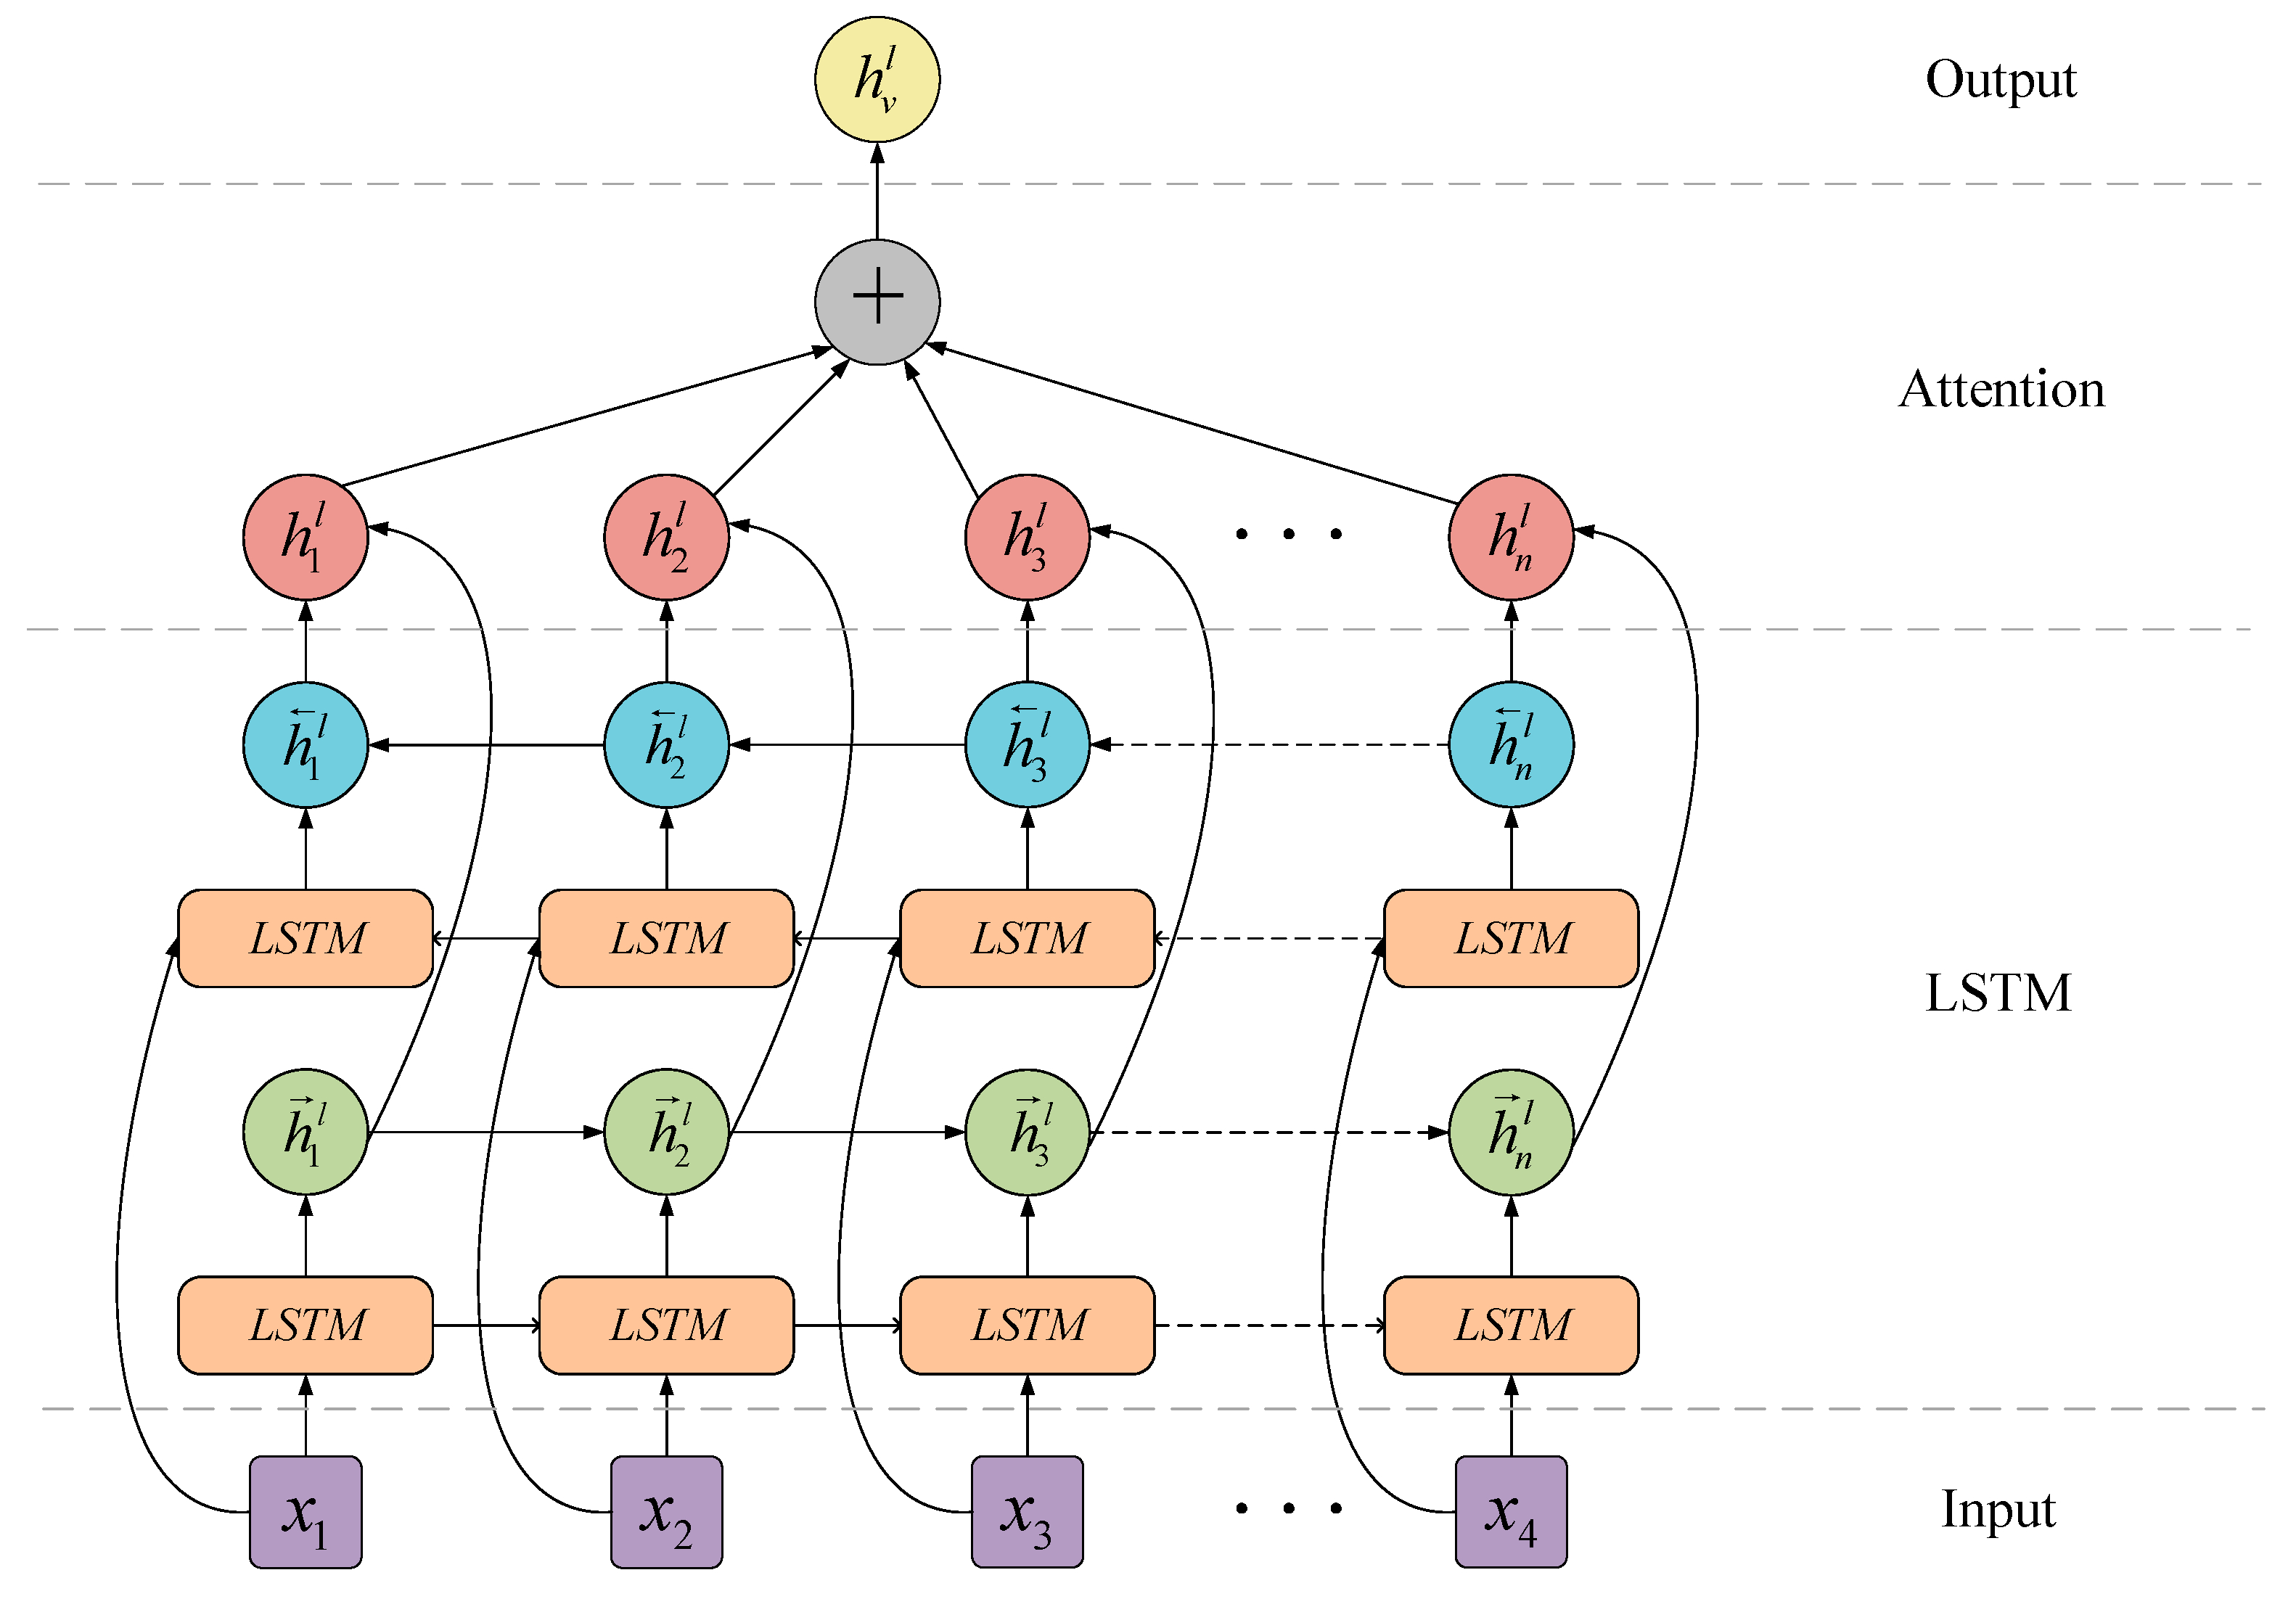
3.2. Jump Knowledge Module

During link prediction tasks using the SSP-AA model, as the layers of the GNNs increase, deep networks may face the issue of over-smoothing. This is particularly prevalent in cases of smaller data volumes. The jumping knowledge [41,42] module mitigates the risk of over-smoothing by adaptively aggregating multi-layer information through cross-layer connections. The primary goal of the jumping knowledge module is to quickly and effectively aggregate the neighborhood information of high-order nodes, combining representations from different neighborhood ranges using jumping connections. If the model directly extracts information from high-order neighbors, noise may be introduced and will lead to a decrease in model performance. Therefore, this paper proposes the integration of the jumping knowledge module into the SSP-AA model as a means to enhance model performance.
The l-th layer of the jumping knowledge module is defined as:
H l = σ ( W l A g g r e g a t e ( H l 1 ) )
where Aggregate() is the model’s defined function, and the definition of the jumping knowledge module between different layers is:
H f i n a l = C o m b i n e ( H 1 , H 2 , , H n )
where Combine() is a symbol describing aggregation methods. Figure 3 shows the connections of a four-layer jumping knowledge network, and N.A. denotes the aggregation of neighboring nodes.
The motivation to use the jumping knowledge module is to efficiently aggregate information from high-order neighbors and use this module to combine representations within different neighbor scopes. As shown in Figure 3, each layer of the model enhances the influence of nodes by aggregating neighborhood information from the previous layer. However, in the final aggregation process, each node selectively filters some information from the previous intermediate representations for merging. This step is independently applied to each node. Thus, the model can adjust the effective neighborhood size for each node as needed, which achieves adaptive selective aggregation.
(1)
Long Short-Term Memory (LSTM) of the polymerization method
Common aggregation strategies include direct concatenation, max-pooling, and mean-pooling, among others. However, each of them has certain drawbacks. Direct concatenation can preserve original information but may lead to information redundancy and increased sensitivity to noise. Max-pooling can highlight the most representative node features and reduce the influence of noise, but it cannot flexibly handle differences in node importance, potentially limiting the model’s expressive ability. Mean-pooling can capture the overall node features, but it is sensitive to noisy nodes and unable to differentiate the importance among nodes, possibly overly focusing on unimportant nodes or neglecting important ones. Therefore, these aggregation schemes exhibit structure dependence. Hence, it is questionable whether the radius size in aggregation strategies can achieve optimal representations for all nodes and tasks. A larger radius may lead to over-smoothing, while a smaller radius may lead to instability or insufficient information aggregation. To address this issue, this section introduces an adaptive aggregation mechanism in the jumping knowledge module, using LSTM to model the dependencies in sequential data. In the jumping knowledge module, LSTM can serve as a node-level aggregation method module, which is used for modeling representations of each node at different layers. Through its memory and forgetting mechanisms, it can capture sequential information of node representations, thereby providing richer node features. The structure of a single LSTM is shown in Figure 4.
As shown in Figure 4, ft, it, ot, and ht represent the forget gate, memory gate, output gate, and hidden layer output, respectively. σ represents the activation function, while tanh denotes the hyperbolic tangent activation function. xt represents the t-th node feature, and ht is obtained through the calculations of the forget gate, memory gate, and output gate, with the specific formula shown below:
f t = σ ( W f [ h t 1 , x t ] + b f )
i t = σ ( W i [ h t 1 , x t ] + b i )
C = tanh ( W c [ h t 1 , x t ] + b c )
C t = f t C t 1 + i t C t ~
o t = σ ( W o [ h t 1 , x t ] + b o )
h t = o t tanh ( C t )
(2)
Attention-based aggregation method
LSTM uses forward and backward LSTMs to capture hidden features h v l and h v l . Additionally, to address the aggregation problem caused by the different importance of nodes in different layers, an attention mechanism is applied to the LSTM module to enhance the attention weighting of node representations, making the aggregation process more focused on important nodes and features. The LSTM attention working mechanism in each layer l is shown in Figure 5.
LSTM attention sends the representations of each layer into the bidirectional LSTM, generating the forward LSTM and backward LSTM hidden features h v l and h v l in each layer. These features h v l and h v l are then concatenated and linearly mapped to a score in the linear layer. After normalizing the scores of each layer l, we obtain the attention score Z v l for each layer l. With the attention score Z v l , the most useful neighborhood range of each node v can be recognized ( l Z v l = 1 ). This allows the model to better balance the importance of different nodes when aggregating neighbor node information. Z v l indicates the importance of node v in layer l, and { Z v l } l = 1 n shows the attention node v pays to its neighborhood at different ranges. Finally, take the sum of [ h v l h v l ] through weighting to obtain the final layer representation:
h v f i n a l = s o f t m a x ( { Z v l } l = 1 n )
For each node, the representation in different layers is modeled in sequence through LSTM. The LSTM module can learn node representations and capture long-term dependencies of node features. Attention mechanisms are applied to the output of LSTM for each node. By calculating attention weights, the node representations in different layers can be weighted to emphasize the more important layers and nodes for the target task. Finally, the weighted node representations are aggregated to obtain the final representation of the node, which is used for subsequent tasks, like link prediction.
In summary, LSTM attention in the jump knowledge module is a powerful mechanism that enhances the expressiveness and task relevance of node representations by combining the sequence modeling of LSTM and the attention mechanism. It provides an effective way to learn the interaction between node representations and tasks, and it can better capture the influence of nodes in tasks by adaptively allocating the importance weights of different nodes. Compared with traditional aggregation methods, LSTM attention has more flexibility and expressiveness in cross-layer information transmission, especially when dealing with dependencies and graph structures. At the same time, due to the sequential nature of LSTM, it can better handle information within nodes, rather than only focusing on local connections between nodes. Therefore, LSTM attention is a key mechanism with broad application value in jump knowledge networks.

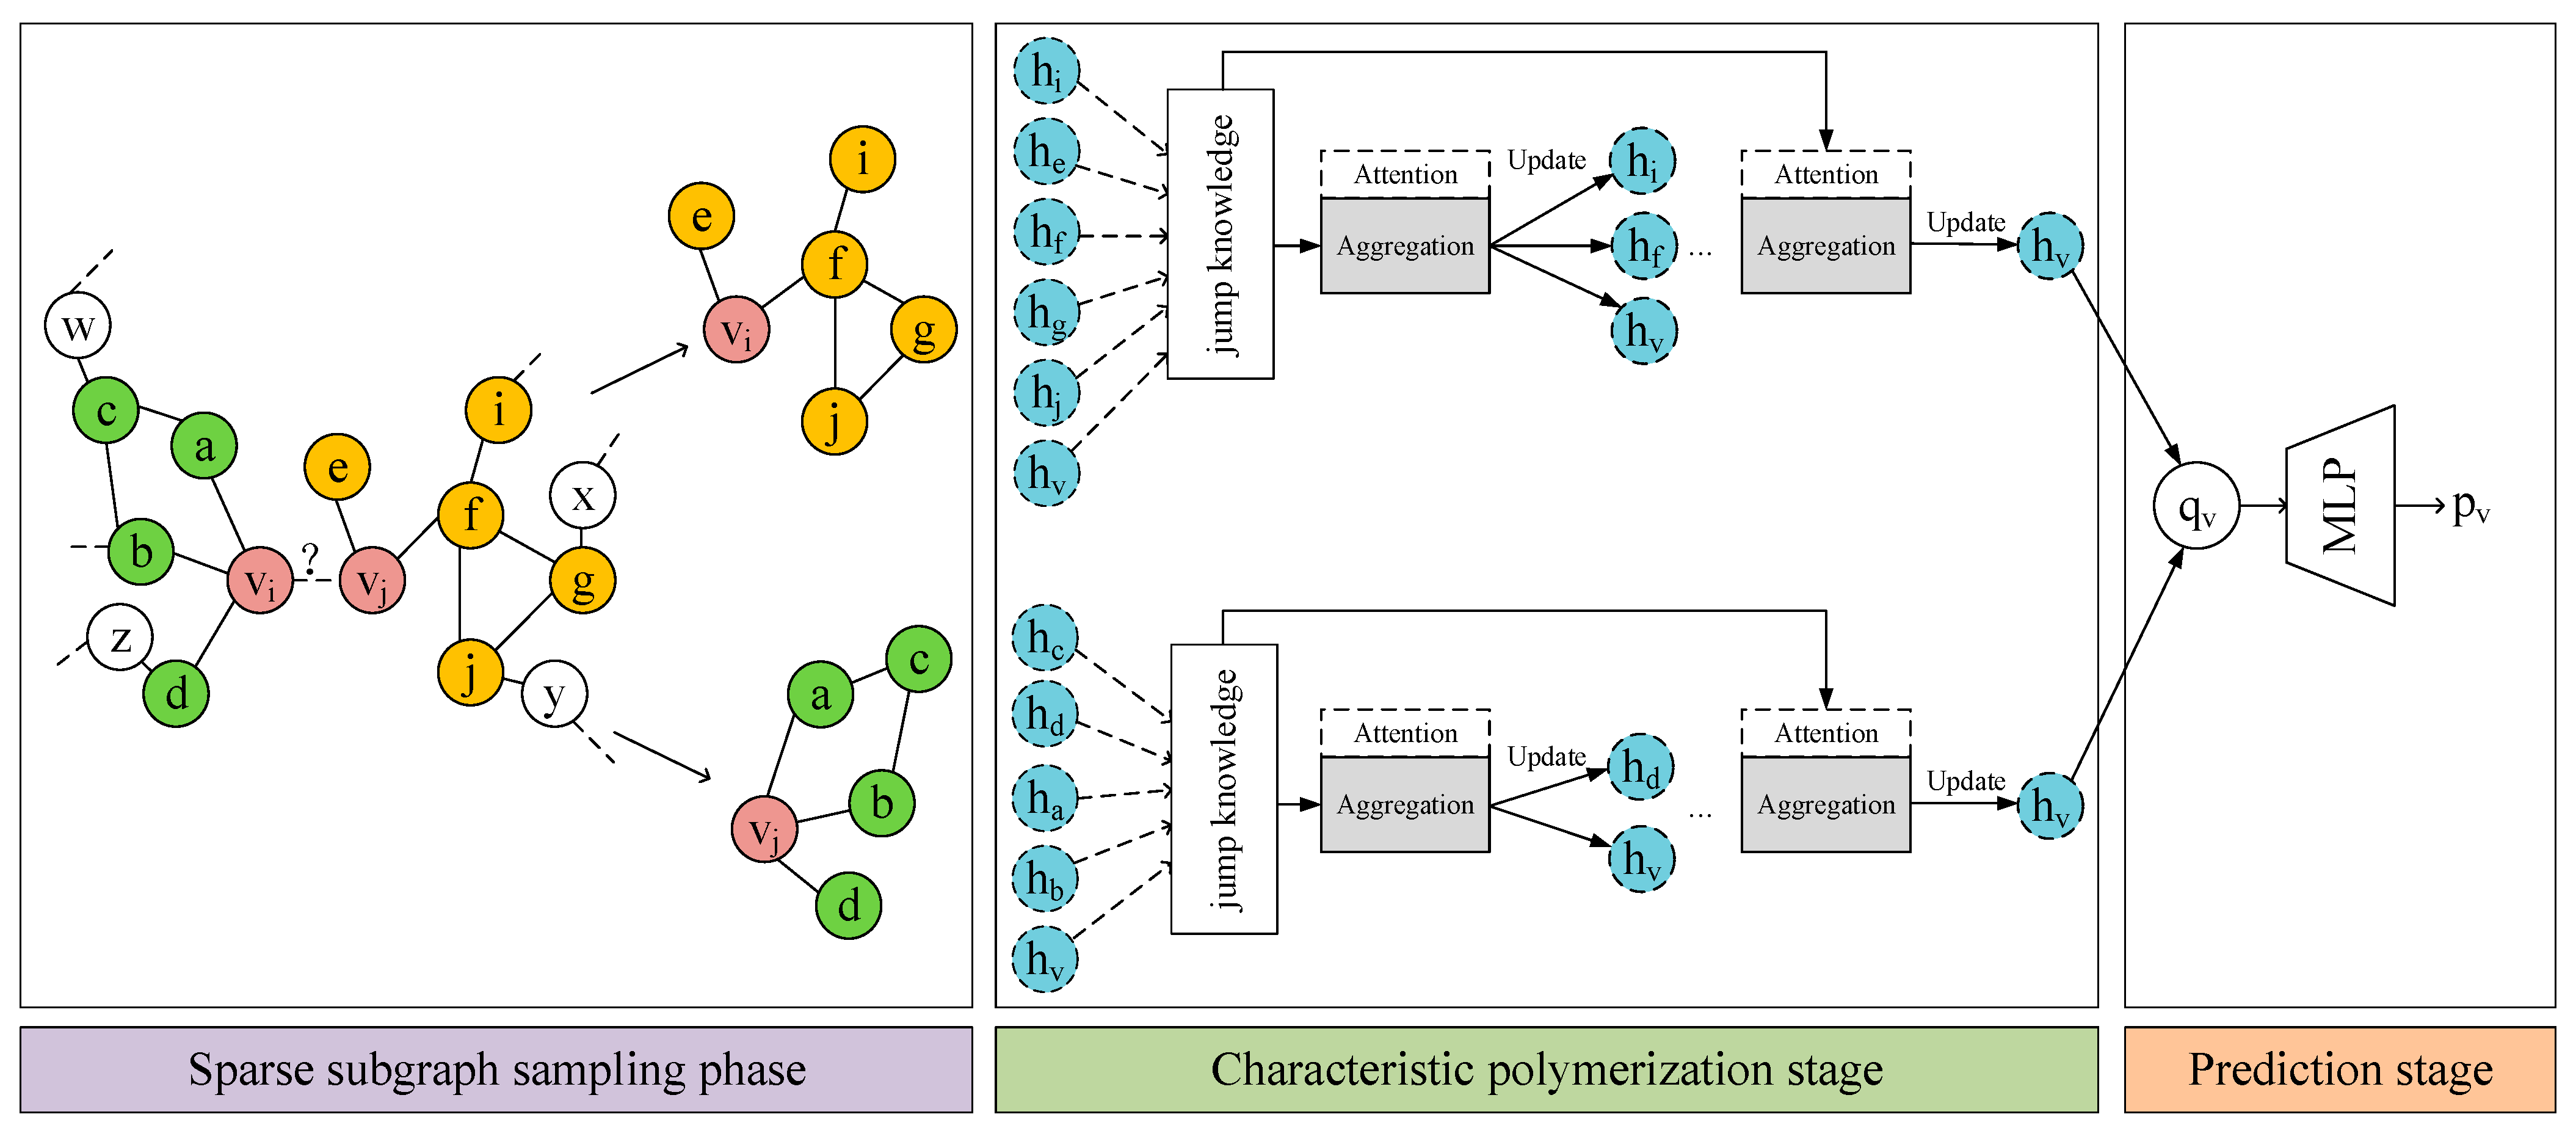
3.3. Framework of the Model

By incorporating the adaptive attention mechanism and jumping knowledge module into the SSP-AA model, we have enhanced the model’s expressiveness. The adaptive attention mechanism allows the model to automatically distribute weights according to the relationships between nodes, thereby better capturing the information within the graph structure. This helps improve the quality of node representations, making them more accurately reflect the actual graph structure data. The jumping knowledge module effectively addresses the issue of over-smoothing that arises with increasing model depth. Over-smoothing can render node representations too similar, reducing the model’s discriminative power. Therefore, the introduction of these two modules allows the model to more effectively integrate the information of neighboring nodes, thereby improving model performance. Figure 6 illustrates the architecture of the SSP-AA model.
As shown in Figure 6, during the sparse subgraph sampling stage of the SSP-AA model, a random walk strategy is used to sample sparse enclosed subgraphs with high-order neighbors no greater than two. In the feature aggregation stage, we extract node features from the enclosed subgraphs with the target node, utilize the jumping knowledge module to capture hidden features in the nodes, and reflect node representations through different network layers. Then, the adaptive attention mechanism is used to assign different weights to each node for aggregation. This aggregation operation incorporating the two modules is added iteratively in each layer until the final target node is updated. In the prediction stage, we use qv to represent the aggregated features of the two target nodes. Finally, the target representation qv is transformed into the link probability pv through a Multi-Layer Perceptron (MLP).

4. Experiment

This study was conducted in an environment using the Windows 11 operating system, an AMD 6800H CPU operating at 3.20 GHz, and 16 GB of memory. Experiments were carried out comparing the SSP-AA model with four advanced models on seven datasets using the AUC metric. Furthermore, ablation experiments were conducted to analyze the performance of the various components of the SSP-AA model. Section 4.1 introduces the datasets used in the experiment and the evaluation metrics. Section 4.2 introduces the comparative methods used in the experiment. Section 4.3 presents the comparative models used in the experiment and their parameter settings, analyzing the performance of the SSP-AA model in different datasets. Section 4.4 examines the impact of two types of modules on the model’s performance and the advantages of the SSP-AA model in subgraph-based scenarios. Section 4.5 analyzes the model’s performance with different parameters.

4.1. Dataset

A set of public homogeneous undirected graph datasets were employed in this study. These datasets have been widely used in examining the structural features of complex networks, undertaking community detection, predicting links, classifying nodes, and conducting other graph-structured data mining tasks. Each dataset underwent a division whereby edges were randomly allocated, with 85% for training, 5% for validation, and 10% for testing purposes. This division process incorporated random negative samples, maintaining a positive-to-negative sample ratio of 1:1. Detailed statistical information regarding these datasets is enumerated in Table 2.
  • USAir: A dataset that describes the flight route map of US airlines. Nodes represent airports, and edges represent direct connections between flights;
  • Celegans: A dataset that describes the nervous system of Caenorhabditis elegans. Nodes represent neurons, and edges represent synaptic connections between neurons;
  • NS: A dataset that describes a large-scale scientific collaboration network. Nodes represent scientists, and edges represent collaborative relationships between scientists (co-authored papers);
  • Power: A dataset that describes the power system in the Western United States. Nodes represent power plants and substations, and edges represent transmission lines;
  • Yeast: A dataset that describes the yeast protein interaction network. Nodes represent yeast proteins, and edges represent interactions between proteins;
  • Ecoli: A dataset that describes the Escherichia coli protein interaction network. Nodes represent E. coli proteins, and edges represent interactions between proteins;
  • PB: A dataset that describes the political blog network. Nodes represent blogs, and edges represent hyperlinks between blogs.
In link prediction tasks, the Area Under the Receiver Operating Characteristic Curve (AUC) is often chosen as the primary indicator to evaluate the performance of the SSP-AA model. The AUC is a widely used performance measure that quantifies the classifier’s ability to distinguish between positive and negative examples in a dataset.
The Receiver Operating Characteristic (ROC) curve [43] depicts the relationship between the true positive rate (TPR) and false positive rate (FPR) at different thresholds, demonstrating the classifier’s performance across all possible thresholds. In link prediction tasks, directly measuring the false positive rate is usually challenging, so all non-existent links are considered negative instances. By changing the threshold, a series of TPRs and FPRs are obtained, which are used to further calculate the AUC. The AUC ranges from 0 to 1, with a value closer to 1 indicating superior model performance.
In addition, the model needs to be run multiple times to verify its performance, so the standard deviation is used to observe the model’s stability. The smaller the standard deviation, the more stable the model performance, as it will not fluctuate significantly due to minor data changes. Therefore, when reporting the AUC value of the SSP-AA model, the standard deviation is usually included to reflect the model’s overall performance and stability. The formula for standard deviation is as follows:
s d = 1 N i = 1 N x i μ 2
Here, x represents a set of values, N represents the total number of values, and μ is the mean of the N values.

4.2. Comparison Method

To validate that the proposed model outperforms other models in predictive performance, the SSP-AA model proposed in this paper is compared with four types of models: heuristic, Graph Auto-Encoder (GAE), Latent Feature-Based (LFB), and SGRL models. For heuristic models, we used Common Neighbors (CNs) [44] and Adam Adar (AA) [45]. The GAE includes GCN [46] and GIN [47] encoders and employs the Hadamard product of a pair of node embeddings as the decoder. LFB models consist of matrix factorization (MF) [48] and node2vec (n2v) [49], supplemented with a logistic classifier head. We selected the advanced Sampling Enclosing Subgraphs (ScaLed) [50] model from SGRL for comparison with the SSP-AA model. Detailed introductions to each of the models are as follows:
  • CN: Evaluates the similarity between two nodes by calculating the number of common neighbors between them. Pairs of nodes with more common neighbors are more likely to form connections in the graph;
  • AA: Utilizes the concept of common neighbors to assign weights to neighbors, weighted according to the degree of the neighbor nodes. Common neighbors with lower degrees are assigned higher weights, as they could potentially be more predictive features;
  • GCN: Learns the representations of nodes in the graph by performing convolution operations on the features of the node and its neighbors, thereby capturing the local structural information in the graph;
  • GIN: Employs an iterative message-passing mechanism to update node representations by aggregating information from neighbor nodes, aiming to capture the global structural information of the graph;
  • MF: Discovers latent node features by decomposing the adjacency matrix; these latent features can capture implicit relationships between nodes and thus can be used for predicting future connections;
  • n2v: Generates node sequences by performing random walks in the graph. These sequences are used as input to train a skip-gram model, thus learning the vector representations of nodes in the graph, which can be used for link prediction tasks;
  • ScaLed: By aggregating information from neighbor nodes in the graph, this method can capture the local structure of the graph and use this information to predict future connections.

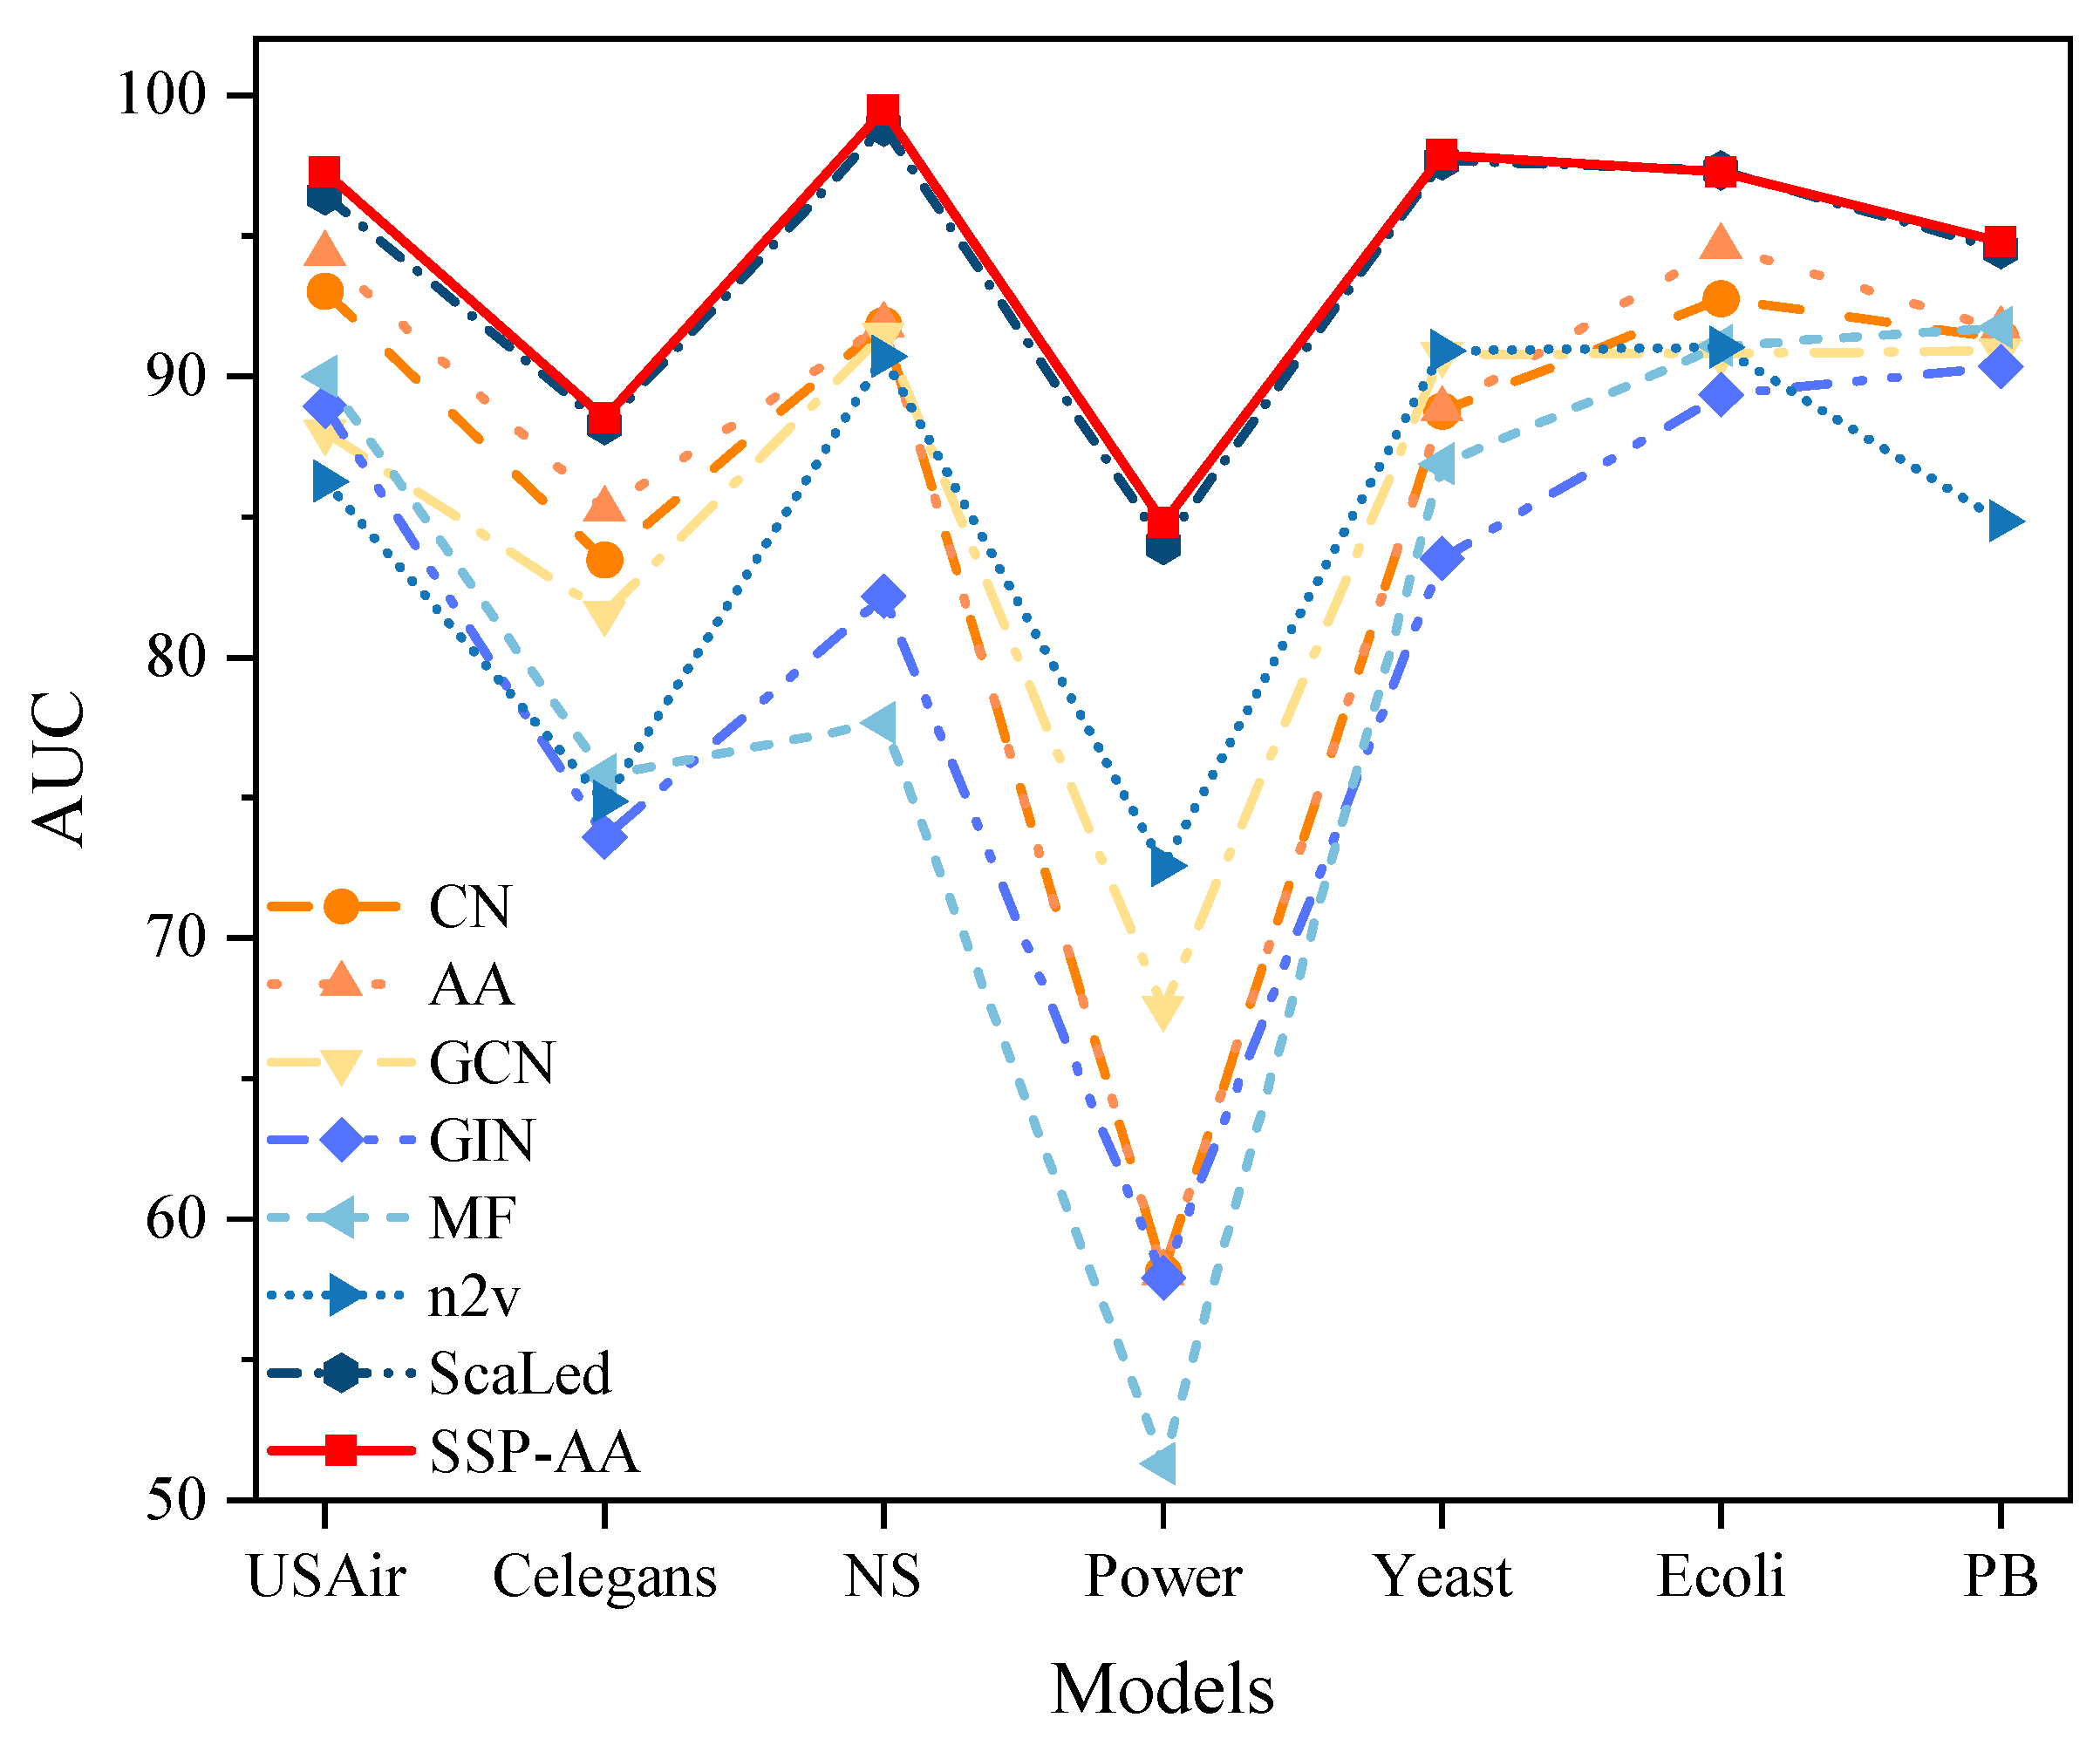
4.3. Comparison of Link Prediction Results

In this section, the SSP-AA model is compared with other advanced models. Firstly, the sampling range is set to 1 for both the CN and AA models. Secondly, to ensure the fairness of the experiment, the number of hidden layers for other models is set to 3, with each hidden layer having a dimension of 32. The AdamW optimizer is used, and the model is trained with a batch size of 32. The initial learning rate is set to 0.0001, and the dropout is set to 0.5 to prevent overfitting. Finally, the sampling parameters p and q for the n2v model are both set to 1. The ScaLed model is set with a random walk number k = 2 and walk length h = 2.
All models have trained fifty times on each of the seven datasets using five different random seeds. The average AUC of each model after five runs is extracted. The link prediction results of the various models are shown in Table 3.
As shown in Table 3, the SSP-AA model outperforms all other GNN methods, affirming the efficacy of the adaptive attention mechanism and the skip knowledge module in the model. The USAir and Celegans datasets are smaller in scale, and the SSP-AA model can better utilize the advantage of adaptive weights to aggregate nodes with higher similarity, thereby significantly improving the model’s performance. Although all the datasets are graph-structured, they come from different domains and typically have distinctive characteristics. Biological networks such as Yeast and Ecoli often possess specific topological structures and functional modules, which can impact the model’s performance. Compared to other datasets, the SSP-AA model performs best on the NS dataset, accurately predicting all missing relationships in the dataset. This is because the NS dataset has a particular graph structure and feature distribution, allowing the SSP-AA model to automatically assign weights to neighboring nodes for precise aggregation of their information and more effective learning of the inter-node relationships. Simultaneously, the skip knowledge module allows the model to share information between different graph neural network layers. In the dataset, both local and global graph structure information significantly contribute to the link prediction task. By using the skip knowledge module, the SSP-AA model can better integrate information of different scales, thereby enhancing prediction performance. In summary, the SSP-AA model achieves impressive results on most datasets. The introduction of the two modules enables the SSP-AA model to more effectively learn the relationships between nodes, capture neighborhood information at different scales, and enhance the model’s generalization ability.
Figure 7 shows the AUC line charts of the SSP-AA model compared to other models on seven datasets. As can be seen in Figure 7, the performance advantages of different methods across multiple datasets can be intuitively observed. Overall, among a multitude of models, the SSP-AA model achieves the best results.

4.4. Ablation Experiments

In this subsection, we analyze the contributions of the two modules in the SSP-AA model and the task of subgraph-based prediction. We provide three different datasets for two sets of separate ablation experiments. Table 4 shows the impact on model performance when the skip knowledge module and the adaptive attention mechanism are successively stripped from the SSP-AA model. Table 5 displays the effect on model performance when the SSP-AA model is based on the entire graph structure and subgraphs. The results are the average AUC and relative error from five experiments.
The results in Table 4 demonstrate that both modules enhance the model’s performance to some extent on the Celegans and NS datasets, thereby confirming the effectiveness of each module. On the one hand, among the two modules, the adaptive attention mechanism has the most substantial impact, indicating that assigning different weights to neighbor nodes is necessary for the model’s aggregation process. On the other hand, integrating hierarchical information through the skip knowledge module also assists in the aggregation process. Therefore, from the ablation study, it can be inferred that these two modules are crucial factors in improving model performance.
Table 5 presents a performance comparison of the SSP-AA model for link prediction tasks based on subgraphs versus those based on the entire graph structure in two large datasets.
From the data in Table 5, it can be intuitively seen that the performance of the model in the link prediction tasks based on subgraphs is higher than based on the entire graph structure. Given the two large datasets chosen, there will be a significant amount of noise present when the model carries out neighbor node aggregation operations in prediction tasks based on the entire graph structure, resulting in a decline in the final model performance. Furthermore, in the link prediction tasks based on subgraphs, due to the higher average degree of the two datasets, the connections between local nodes will be tighter. The attention mechanism can better aggregate similar neighbor nodes, hence the aggregation effect of the SSP-AA model in the link prediction tasks based on subgraphs will be better.

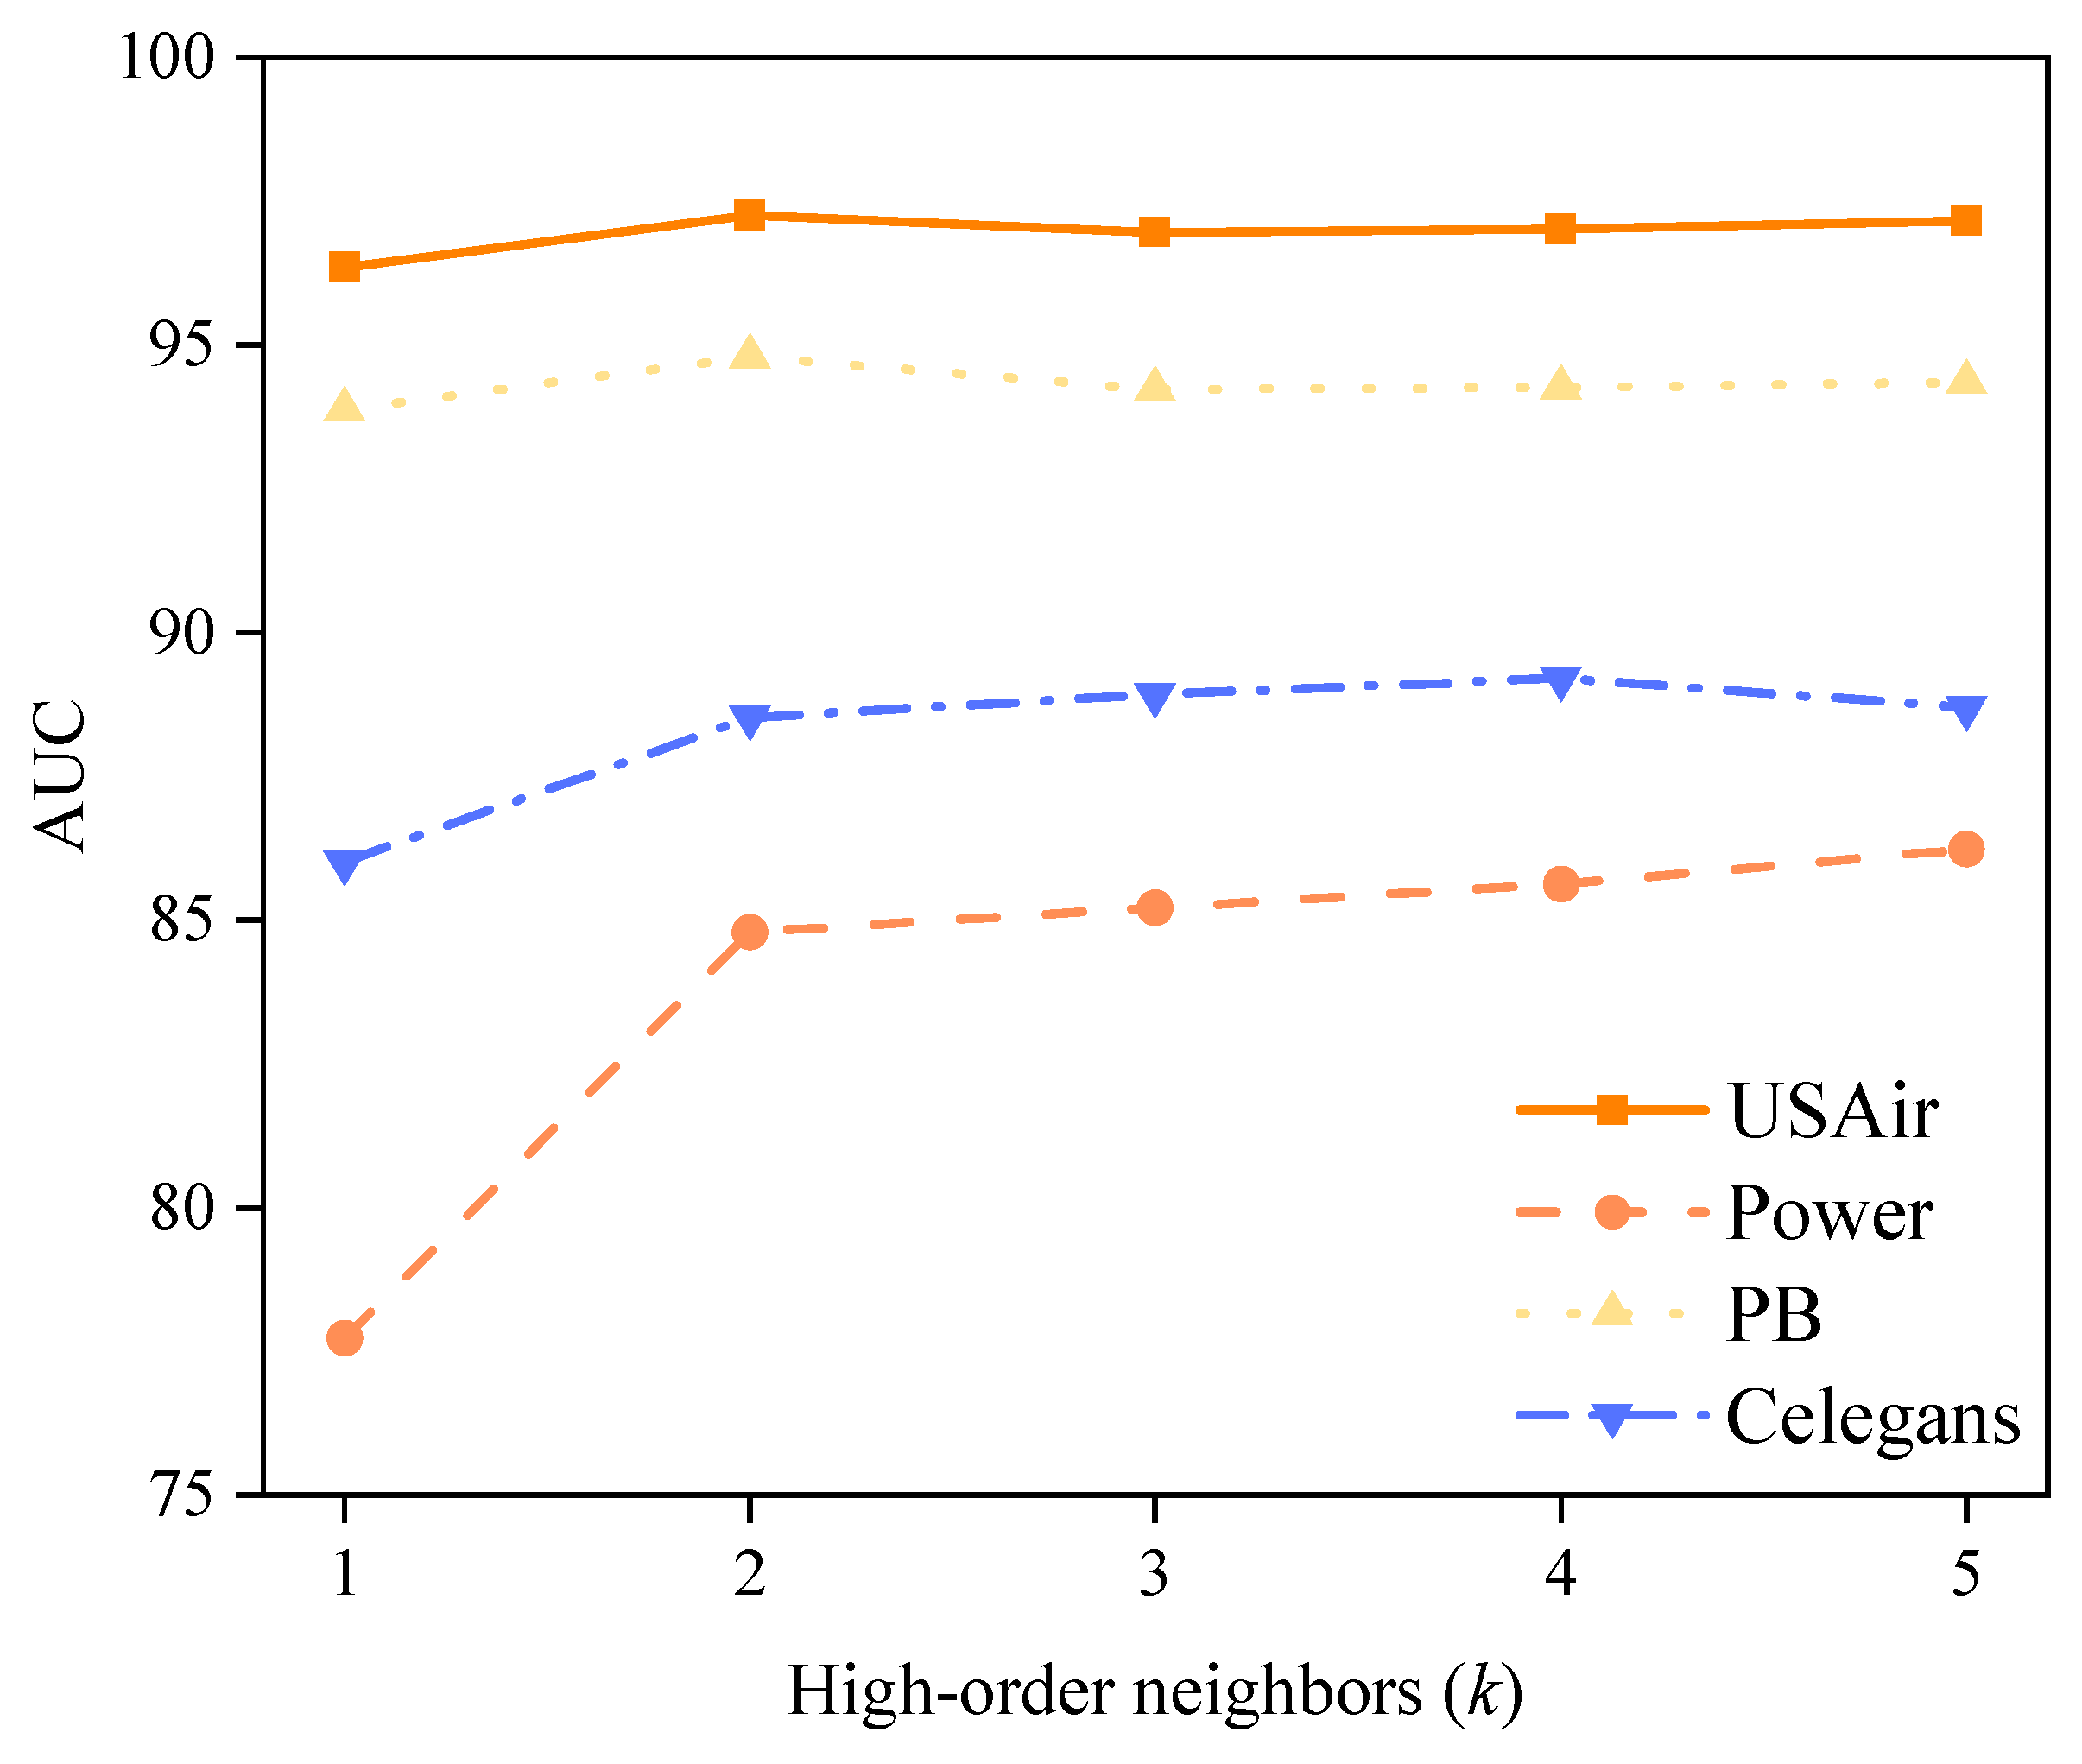
4.5. Parameter Analysis Experiment

In this section, we analyze the impact of different parameter variables on the performance of the SSP-AA model through changes in the high-order neighbor parameters and model depth. The experimental results show the average AUC and relative error of five model runs.
(1) For link prediction tasks, the performance of the SSP-AA model is influenced by the selection of high-order neighbors. Figure 8 shows the impact of high-order neighbor parameters within the range of [1, 5] on model performance in four datasets.
The results show that when the high-order neighbor parameter is set to 1, the number of nodes sampled by the model is relatively small. Some important node information is lost, and the hidden information of high-order neighbors is not utilized, leading to generally lower model performance. However, as the parameter increases, the performance of the model also improves accordingly. It is worth noting that although more neighboring nodes are selected, the performance of the model does not improve in most datasets. Instead, when the high-order neighbor exceeds 2, the performance of the model decreases. The reason for this trend is that these datasets are sparse, and increasing the range of high-order neighbors does not improve model performance. Additionally, sampling more distant neighbor nodes will introduce noise, which in some datasets will lead to a decline in the final model performance when sampling higher-order neighbor nodes. Therefore, considering the performance of the model on various datasets, it is not advisable for the selection of high-order neighbors in the proposed SSP-AA model to exceed 2.
(2) The SSP-AA model is influenced by changes in model depth. Table 6 displays the impact of different depths of the jumping knowledge module in the model on the performance across two different datasets.
Table 6 shows that in three different datasets, the performance is lower when the model depth is in the range of [1, 2]. The model performance improves the most when the model depth is 3. When the model depth is in the range of [4, 8], the change in the model’s performance across three different datasets is minimal and tends toward stability. It is due to the fact that the SSP-AA model lacks sufficient depth to extract complex structural features and high-order neighbor information from the graph, resulting in lower model performance when the model depth is shallow. As the depth further increases, the model’s performance gradually improves. This is because as the model depth increases, the jumping knowledge module enables the information from deep nodes to be directly combined with the information from shallow nodes. Even if the network depth becomes very deep, the original node information is not lost, thereby resolving the over-smoothing problem caused by network depth. These results demonstrate the effectiveness of the jumping knowledge module in the SSP-AA model in resolving the over-smoothing problem. Therefore, the depth of the SSP-AA model proposed in this paper is set to 3.

5. Summary and Outlook

This paper proposes an SSP-AA model for sparse subgraph prediction. Firstly, based on the subgraph-based method, this model effectively enhances the performance in link prediction tasks and addresses the problems of sampling and training difficulties faced by traditional methods on large-scale graph structure data. Secondly, by incorporating the adaptive attention mechanism and the jumping knowledge module into the SSP-AA model, the adaptive attention mechanism empowers the model with self-adjusting weights, allowing the model to more accurately reflect the importance of different nodes in the graph structure. It resolves the issue of lacking adaptive weight allocation when aggregating neighbor node features and automatically assigns weights according to the relationships between nodes, thus better capturing the information in the graph structure. Lastly, the model employs the jumping knowledge module, which flexibly combines the node feature representations across different network layers, better distinguishing different node feature representations, and effectively enhances the expressive ability of nodes in the model. It resolves the over-smoothing problem caused by the increase in the number of layers in traditional graph neural networks. Compared to other advanced models, SSP-AA achieves the best average prediction performance in seven datasets on AUC indicators, demonstrating the effectiveness of these two modules in handling large-scale graph structure data. Furthermore, the SSP-AA model plays an important role in various applications such as knowledge graph-based Q&A systems, search engines, and social networks. Particularly, it plays a crucial role in the research of robots in the field of artificial intelligence and the training of semantic network models and has a significant impact on some large-scale knowledge networks. In future research, we will continue to focus on the following directions:
(1)
Explore the application of graph augmentation techniques to the subgraphs within the SSP-AA model to further enhance its learning capability;
(2)
Further study the methods based on subgraphs by considering the use of edge personalization in neighborhood subgraphs for sampling subgraphs with more target node-specific information;
(3)
Explore integrating other advanced attention mechanisms and graph neural network modules into the SSP-AA model to better cope with complex graph structure data and real-world application scenarios;
(4)
For different tasks and datasets, research methods to adaptively adjust the model structure and parameters to automatically discover the optimal graph neural network configuration;
(5)
Explore extending this method to various large-scale knowledge graphs, such as clinical medical research, industrial Internet, network anomaly detection, and other various networks.

Author Contributions

Conceptualization, Y.G.; Methodology, Y.G.; Software, Y.G.; Validation, A.L., X.Z., J.G. and J.L.; Formal analysis, A.L., X.Z., J.G. and J.L.; Investigation, W.L. and X.Z.; Resources, J.G.; Data curation, Y.G. and A.L.; Writing—original draft, Y.G.; Writing—review & editing, W.L. and A.L.; Visualization, X.Z.; Supervision, W.L.; Project administration, W.L.; Funding acquisition, W.L. All authors have read and agreed to the published version of the manuscript.

Funding

This work was supported by the Ningxia Natural Science Foundation (No.2021AAC03215), National Natural Science Foundation of China (No.62066038, 61962001), and Key Research Project of Northern University for Nationalities (No.2021JCYJ12).

Institutional Review Board Statement

Not applicable.

Informed Consent Statement

Not applicable.

Data Availability Statement

The data presented in this study are available on request from the corresponding author.

Conflicts of Interest

The authors declare no conflict of interest.

References

  1. Hu, W.; Fey, M.; Zitnik, M.; Dong, Y.; Ren, H.; Liu, B.; Catasta, M.; Leskovec, J. Open graph benchmark: Datasets for machine learning on graphs. Adv. Neural Inf. Process. Syst. 2020, 33, 22118–22133. [Google Scholar]
  2. Zhang, C.; Song, D.; Huang, C.; Swami, A.; Chawla, N.V. Heterogeneous graph neural network. In Proceedings of the 25th ACM SIGKDD International Conference on Knowledge Discovery & Data Mining, Anchorage, AK, USA, 4–8 August 2019; pp. 793–803. [Google Scholar]
  3. You, Y.; Chen, T.; Shen, Y.; Wang, Z. Graph contrastive learning automated. In Proceedings of the International Conference on Machine Learning PMLR, Virtual Event, 8–24 July 2021; pp. 12121–12132. [Google Scholar]
  4. Yun, S.; Kim, S.; Lee, J.; Kang, J.; Kim, H.J. Neo-gnns: Neighborhood overlap-aware graph neural networks for link prediction. Adv. Neural Inf. Process. Syst. 2021, 34, 13683–13694. [Google Scholar]
  5. Ying, R.; He, R.; Chen, K.; Eksombatchai, P.; Hamilton, W.L.; Leskovec, J. Graph convolutional neural networks for web-scale recommender systems. In Proceedings of the 24th ACM SIGKDD International Conference on Knowledge Discovery & Data Mining, London, UK, 19–23 August 2018; pp. 974–983. [Google Scholar]
  6. Wu, Z.; Pan, S.; Long, G.; Jiang, J.; Zhang, C. Graph wavenet for deep spatial-temporal graph modeling. arXiv 2019, arXiv:1906.00121. [Google Scholar]
  7. Kong, L.; Chen, Y.; Zhang, M. Geodesic Graph Neural Network for Efficient Graph Representation Learning. arXiv 2022, arXiv:2210.02636. [Google Scholar]
  8. Hamilton, W.L. Graph Representation Learning; Synthesis Lectures on Artifical Intelligence and Machine Learning; Morgan & Claypool Publishers: San Rafael, CA, USA, 2020; Volume 14, pp. 1–159. [Google Scholar]
  9. Wu, F.; Souza, A.; Zhang, T.; Fifty, C.; Yu, T.; Weinberger, K. Simplifying graph convolutional networks. In Proceedings of the International Conference on Machine Learning PMLR, Long Beach, CA, USA, 9–15 June 2019; pp. 6861–6871. [Google Scholar]
  10. Sun, F.Y.; Hoffmann, J.; Verma, V.; Tang, J. Infograph: Unsupervised and semi-supervised graph-level representation learning via mutual information maximization. arXiv 2019, arXiv:1908.01000. [Google Scholar]
  11. Hamilton, W.; Ying, Z.; Leskovec, J. Inductive representation learning on large graphs. In Advances in Neural Information Processing Systems; The MIT Press: Cambridge, MA, USA, 2017; Volume 30. [Google Scholar]
  12. Hamilton, W.L.; Ying, R.; Leskovec, J. Representation learning on graphs: Methods and applications. arXiv 2017, arXiv:1709.05584. [Google Scholar]
  13. Chen, D.; Lin, Y.; Li, W.; Li, P.; Zhou, J.; Sun, X. Measuring and relieving the over-smoothing problem for graph neural networks from the topological view. Proc. AAAI Conf. Artif. Intell. 2020, 34, 3438–3445. [Google Scholar] [CrossRef]
  14. Teji, B.; Roy, S. Missing Link Identification from Node Embeddings using Graph Auto Encoders and its Variants. In Proceedings of the 2022 OITS International Conference on Information Technology (OCIT), Bhubaneswar, India, 14–16 December 2022; IEEE: New York, NY, USA, 2022; pp. 1–6. [Google Scholar]
  15. Seo, Y.; Defferrard, M.; VanderGheynst, P.; Bresson, X. Structured sequence modeling with graph convolutional recurrent networks. In Proceedings of the Neural Information Processing 25th International Conference, ICONIP 2018, Siem Reap, Cambodia, 13–16 December 2018; Springer International Publishing: Berlin/Heidelberg, Germany, 2018; pp. 362–373. [Google Scholar]
  16. Kipf, T.N.; Welling, M. Variational graph auto-encoders. arXiv 2016, arXiv:1611.07308. [Google Scholar]
  17. Isabona, J. Wavelet generalized regression neural network approach for robust field strength prediction. Wirel. Pers. Commun. 2020, 114, 3635–3653. [Google Scholar] [CrossRef]
  18. Alfke, D.; Stoll, M. Semi-supervised classification on non-sparse graphs using low-rank graph convolutional networks. arXiv 2019, arXiv:1905.10224. [Google Scholar]
  19. Boutorh, A.; Marref, K.; Dehiri, N.E. Graph Representation Learning for COVID-19 Drug Repurposing. In Advances in Computing Systems and Applications, Proceedings of the 5th Conference on Computing Systems and Applications, San Diego, CA, USA, 7–10 April 2022; Springer International Publishing: Cham, Switzerland, 2022; pp. 61–72. [Google Scholar]
  20. Lo, W.W.; Layeghy, S.; Sarhan, M.; Gallagher, M.; Portmann, M. E-graphsage: A graph neural network based intrusion detection system for iot. In Proceedings of the NOMS 2022–2022 IEEE/IFIP Network Operations and Management Symposium, Budapest, Hungary, 25–29 April 2022; IEEE: New York, NY, USA, 2022; pp. 1–9. [Google Scholar]
  21. Lan, J.; Lu, J.Z.; Wan, G.G.; Wang, Y.Y.; Huang, C.Y.; Zhang, S.B.; Huang, Y.Y.; Ma, J.N. E-minBatch GraphSAGE: An Industrial Internet Attack Detection Model. Secur. Commun. Netw. 2022, 2022, 5363764. [Google Scholar] [CrossRef]
  22. Rezaeipanah, A.; Mokhtari, M.J.; Boshkani, M. Providing a new method for link prediction in social networks based on the meta-heuristic algorithm. Int. J. Cloud Comput. Database Manag. 2020, 1, 28–36. [Google Scholar] [CrossRef]
  23. Gao, L.; Lin, Y. The Application of Particle Swarm Optimization in Neural Networks. J. Phys. Conf. Series. IOP Publ. 2022, 2278, 012027. [Google Scholar] [CrossRef]
  24. Wang, P.; Wu, C.; Huang, T.; Chen, Y. A Supervised Link Prediction Method Using Optimized Vertex Collocation Profile. Entropy 2022, 24, 1465. [Google Scholar] [CrossRef]
  25. Xie, Z.; Zhu, R.; Zhang, M.; Liu, J. SparseMult: A Tensor Decomposition model based on Sparse Relation Matrix. In Proceedings of the 2022 IEEE/WIC/ACM International Joint Conference on Web Intelligence and Intelligent Agent Technology (WI-IAT), Niagara Falls, ON, Canada, 17–20 November 2022; IEEE: New York, NY, USA, 2022; pp. 761–764. [Google Scholar]
  26. Berahmand, K.; Nasiri, E.; Rostami, M.; Forouzandeh, S. A modified DeepWalk method for link prediction in attributed social network. Computing 2021, 103, 2227–2249. [Google Scholar] [CrossRef]
  27. Arsov, N.; Mirceva, G. Network embedding: An overview. arXiv 2019, arXiv:1911.11726. [Google Scholar]
  28. Ge, J.; Shi, L.L.; Liu, L.; Shi, H.; Panneerselvam, J. Intelligent link prediction management based on community discovery and user behavior preference in online social networks. Wirel. Commun. Mob. Comput. 2021, 2021, 3860083. [Google Scholar] [CrossRef]
  29. Meilicke, C.; Chekol, M.W.; Ruffinelli, D.; Stuckenschmidt, H. An introduction to AnyBURL. In Proceedings of the KI 2019: Advances in Artificial Intelligence, 42nd German Conference on AI, Kassel, Germany, 23–26 September 2019; Springer International Publishing: Berlin/Heidelberg, Germany, 2019; pp. 244–248. [Google Scholar]
  30. Ott, S.; Meilicke, C.; Samwald, M. SAFRAN: An interpretable, rule-based link prediction method outperforming embedding models. arXiv 2021, arXiv:2109.08002. [Google Scholar]
  31. Chen, W.; Li, J.; Jiang, J. Heterogeneous combat network link prediction based on representation learning. IEEE Syst. J. 2020, 15, 4069–4077. [Google Scholar] [CrossRef]
  32. Anand, S.; Rahul Mallik, A.; Kumar, S. Integrating node centralities, similarity measures, and machine learning classifiers for link prediction. Multimed. Tools Appl. 2022, 81, 38593–38621. [Google Scholar] [CrossRef]
  33. Yu, X.; Ye, X.; Zhang, S. Floating pollutant image target extraction algorithm based on immune extremum region. Digit. Signal Process. 2022, 123, 103442. [Google Scholar] [CrossRef]
  34. Ngo, L.; Cha, J.; Han, J.H. Deep neural network regression for automated retinal layer segmentation in optical coherence tomography images. IEEE Trans. Image Process. 2019, 29, 303–312. [Google Scholar] [CrossRef] [PubMed]
  35. Veličković, P.; Fedus, W.; Hamilton, W.L.; Liò, P.; Bengio, Y.; Hjelm, R.D. Deep graph infomax. arXiv 2018, arXiv:1809.10341. [Google Scholar]
  36. Wu, Z.; Pan, S.; Chen, F.; Long, G.; Zhang, C.; Philip, S.Y. A comprehensive survey on graph neural networks. IEEE Trans. Neural Netw. Learn. Syst. 2020, 32, 4–24. [Google Scholar] [CrossRef] [PubMed] [Green Version]
  37. Xu, X.; Zhang, P.; He, Y.; Chao, C.; Yan, C. Subgraph neighboring relations infomax for inductive link prediction on knowledge graphs. arXiv 2022, arXiv:2208.00850. [Google Scholar]
  38. Wang, D.; Cui, P.; Zhu, W. Structural deep network embedding. In Proceedings of the 22nd ACM SIGKDD International Conference on Knowledge Discovery and Data Mining, San Francisco, CA, USA, 13–17 August 2016; pp. 1225–1234. [Google Scholar]
  39. Zhou, Y.; Wu, C.; Tan, L. Biased random walk with restart for link prediction with graph embedding method. Phys. A Stat. Mech. Its Appl. 2021, 570, 125783. [Google Scholar] [CrossRef]
  40. Kim, D.; Oh, A. How to find your friendly neighborhood: Graph attention design with self-supervision. arXiv 2022, arXiv:2204.04879. [Google Scholar]
  41. Xu, K.; Li, C.; Tian, Y.; Sonobe, T.; Kawarabayashi, K.I.; Jegelka, S. Representation learning on graphs with jumping knowledge networks. In Proceedings of the International Conference on Machine Learning, Beijing, China, 14–16 November 2018; pp. 5453–5462. [Google Scholar]
  42. Yang, F.; Zhang, H.; Tao, S.; Hao, S. Graph representation learning via simple jumping knowledge networks. Appl. Intell. 2022, 52, 11324–11342. [Google Scholar] [CrossRef]
  43. Jia, Z.; Lin, S.; Gao, M.; Zaharia, M.; Aiken, A. Improving the accuracy, scalability, and performance of graph neural networks with roc. Proc. Mach. Learn. Syst. 2020, 2, 187–198. [Google Scholar]
  44. Barabási, A.L.; Albert, R. Emergence of scaling in random networks. Science 1999, 286, 509–512. [Google Scholar] [CrossRef] [Green Version]
  45. Adamic, L.A.; Adar, E. Friends and neighbors on the web. Soc. Netw. 2003, 25, 211–230. [Google Scholar] [CrossRef] [Green Version]
  46. Kipf, T.N.; Welling, M. Semi-supervised classification with graph convolutional networks. arXiv 2016, arXiv:1609.02907. [Google Scholar]
  47. Xu, K.; Hu, W.; Leskovec, J.; Jegelka, S. How powerful are graph neural networks? arXiv 2018, arXiv:1810.00826. [Google Scholar]
  48. Symeonidis, P.; Zioupos, A. Matrix and Tensor Factorization Techniques for Recommender Systems; Springer International Publishing: New York, NY, USA, 2016. [Google Scholar]
  49. Grover, A.; Leskovec, J. node2vec: Scalable feature learning for networks. In Proceedings of the 22nd ACM SIGKDD International Conference on Knowledge Discovery and Data Mining, San Francisco, CA, USA, 13–17 August 2016; pp. 855–864. [Google Scholar]
  50. Louis, P.; Jacob, S.A.; Salehi-Abari, A. Sampling Enclosing Subgraphs for Link Prediction. In Proceedings of the 31st ACM International Conference on Information & Knowledge Management, Atlanta, GA, USA, 17–21 October 2022; pp. 4269–4273. [Google Scholar]
Figure 1. (a) Wandering from the target node. (b) Closed enclosing subgraph with labels.
Applsci 13 08166 g001
Figure 2. Weight normalization.
Applsci 13 08166 g002
Figure 3. Jump knowledge connection.
Applsci 13 08166 g003
Figure 4. LSTM structure diagram.
Applsci 13 08166 g004
Figure 5. LSTM attention aggregation.
Applsci 13 08166 g005
Figure 6. Model frame diagram.
Applsci 13 08166 g006
Figure 7. Performance of different models in multiple datasets.
Applsci 13 08166 g007
Figure 8. The AUC values of the SSP-AA model under different high-order neighbor parameters.
Applsci 13 08166 g008
Table 1. SSP-AA symbol definitions.
SymbolsDefinitions
GUndirected Graph
VNodes in the Undirected Graph
EEdges in the Undirected Graph
hNode Features
HA Set of Node Features
WWeight Matrix
lThe lst Layer of the Model
α Weight Vector
bAdjusted Weight Bias Term
eijThe Original Attention Score Between Nodes i and j
σNon-linear Activation Function
Table 2. The dataset used in the experiment.
Dataset NameNumber of NodesEdge NumberAverage Degree
USAir332212612.81
Celegans297214814.46
NS146127423.75
Power494165942.67
Yeast237511,6939.85
Ecoli180514,66016.24
PB1222473227.36
Table 3. Link prediction result.
ModelsUSAirCelegansNSPowerYeastEcoliPB
CN93.02 ± 1.1683.46 ± 1.2291.81 ± 0.7858.10 ± 0.5388.75 ± 0.7092.76 ± 0.7091.35 ± 0.47
AA94.34 ± 1.3185.26 ± 1.1491.83 ± 0.7558.10 ± 0.5488.81 ± 0.6894.61 ± 0.5291.68 ± 0.45
GCN88.03 ± 2.8481.58 ± 1.4291.48 ± 1.2867.51 ± 1.2190.80 ± 0.9590.82 ± 0.5690.9 ± 0.72
GIN88.93 ± 2.0473.60 ± 3.1782.16 ± 2.7057.93 ± 1.2883.51 ± 0.6789.34 ± 1.4590.35 ± 0.78
MF89.99 ± 1.7475.81 ± 2.7377.66 ± 3.0251.30 ± 2.2586.88 ± 1.3791.07 ± 0.3991.74 ± 0.22
n2v86.27 ± 1.3974.86 ± 1.3890.69 ± 1.2072.58 ± 0.7190.91 ± 0.5891.02 ± 0.1784.84 ± 0.73
ScaLed96.44 ± 0.9388.27 ± 1.1798.88 ± 0.5083.99 ± 0.8497.68 ± 0.1797.31 ± 0.1494.53 ± 0.57
SSP-AA97.26 ± 0.7788.52 ± 0.4999.48 ± 0.0984.79 ± 0.2597.89 ± 0.1097.26 ± 0.4094.80 ± 0.12
Table 4. Result of the module ablation study.
ModulesIndexCelegansNS
SSP-AAAUC88.52 ± 0.4999.48 ± 0.09
No Jumping KnowledgeAUC88.33 ± 0.4599.18 ± 0.09
No Adaptive AttentionAUC87.63 ± 0.6798.31 ± 0.32
Table 5. Result of the subgraph ablation study.
ModulesIndexYeastPB
SSP-AAAUC97.89 ± 0.1094.80 ± 0.12
Not based on subgraphsAUC93.39 ± 1.2891.26 ± 0.89
Table 6. The AUC values of the SSP-AA model at different model depths.
Data12345678
USAir96.27 ± 0.9796.65 ± 1.1397.25 ± 0.7897.37 ± 0.3997.29 ± 0.6197.54 ± 0.5497.48 ± 0.397.53 ± 0.51
Celegans86.32 ± 1.3287.14 ± 0.9688.54 ± 0.4788.62 ± 0.6288.56 ± 0.788.59 ± 0.6688.35 ± 0.6588.49 ± 0.64
Ecoli96.03 ± 0.8296.35 ± 0.5697.27 ± 0.3797.12 ± 0.4197.19 ± 0.2597.21 ± 0.3997.36 ± 0.2997.45 ± 0.27
Disclaimer/Publisher’s Note: The statements, opinions and data contained in all publications are solely those of the individual author(s) and contributor(s) and not of MDPI and/or the editor(s). MDPI and/or the editor(s) disclaim responsibility for any injury to people or property resulting from any ideas, methods, instructions or products referred to in the content.

