1. Introduction
In recent years, the generation method of image description [
1], based on deep learning, has made great progress in the field of natural images, but in the field of medical images there is still a lack of effective methods that can automatically analyze diseases in medical images and generate diagnostic text. The reason is that the automatically generated disease diagnosis text should not only conform to the grammatical rules of natural language, that is, the formal cohesion should be good, but should also ensure semantic coherence. Therefore, understanding and describing complex medical radiology images in accurate natural language and automatically generating diagnostic reports remains challenging [
2].
At present, medical image caption models based on deep learning [
3] are all obtained by fine-tuning based on an encoder–decoder structure or by using models pre-trained on natural images [
4] to train public medical image datasets. Although the encoder–decoder structure has been continuously improved to achieve good performance in the description of medical images, the diagnostic reports generated by them still contain numerous repeated words [
5], the generated descriptive sentences are incoherent, and the disease information described is inconsistent with the original disease. In order to solve this problem, the idea of attention mechanisms was used as a reference, and attention mechanisms were added to the traditional codec structure. According to the hidden state of the RNN, the attention mechanism dynamically selects the local feature vector of the image related to the generated word to guide the generation of the word at the current moment. The method based on attention mechanisms can make full use of image feature information and improve the effect of description generation [
6].
However, the traditional medical image description generation method based on attention mechanisms only integrates the word and visual information of the current moment when predicting the target word, ignoring the role of context information in generating the target word, resulting in no coherence and differences between the generated description and the reference description. Therefore, this shows that when generating target words, the model should not only focus on the current visual information but also the previous visual information to ensure visual coherence and conform to human habits. In addition, in traditional medical image description methods, they try to generate complete and complex diagnostic texts based on radiological reports [
7]. However, in terms of radiological images, attempts to copy highly uniform radiological diagnostic reports will lead to inconsistent diagnostic descriptions in the output, which cannot be used as a true explanation of diseases in the images. Even in the most cutting-edge work in the field [
7], the resulting text is nowhere near as good as that of a professional physician and cannot replace a physician in the automated diagnosis of images.
Aiming at the problems in the traditional methods of image description generation above, this paper proposes a method of generating a scoliosis Lenke classification report based on the dual attention of space and context. Instead of trying to reproduce the entire scoliosis Lenke classification and diagnosis report [
8], we only generated the most important sentences. We tried to train a model that generated a simplified but meaningful description as a diagnostic report that could be certified by a clinician and can be used as a reasonable justification for a physician’s decision. This method changes the way that the original diagnosis report is used as the training label in the traditional medical image description generation model. Based on the visual features of the spine images, they were innovatively hand-marked into a new set of short sentences as a label for model training. The corresponding label sentences for each image had the same sentence structure, for example: “This spine, with or without curvature in the proximal thoracic, with or without curvature in the main thoracic, with or without curvature in the lumbar regions, belongs to the Lenke-N type” or “asymptomatic cases”. In addition, the traditional coding–decoding structure has been improved [
9,
10,
11]. In the residual path of ResNet50 [
12], a convolution block attention mechanism focusing on effective features in the space and channels was added to serve as a feature encoder to deepen the extraction of key features of the spine. Using the improved long short-term memory network M-LSTM [
13] as a decoder, additional gating operations were introduced in front of LSTM [
14], so that the input and state of the network were computed in multiple rounds of interaction before the internal calculation of the network, and the context attention mechanism was integrated so that the language modeling ability of the interactive representation between the input and the context became richer. Finally, the model was verified on the proprietary spinal X-ray dataset from Guizhou Orthopaedic Hospital, and the generated diagnostic description obtained satisfactory scores in BLUE, CIDEr and other indicators. The generated diagnostic text was compared with the original diagnostic report, including all key descriptions in the original diagnostic report. This shows that our model can automatically generate simple, high-quality Lenke classification reports for scoliosis.
2. Related Work
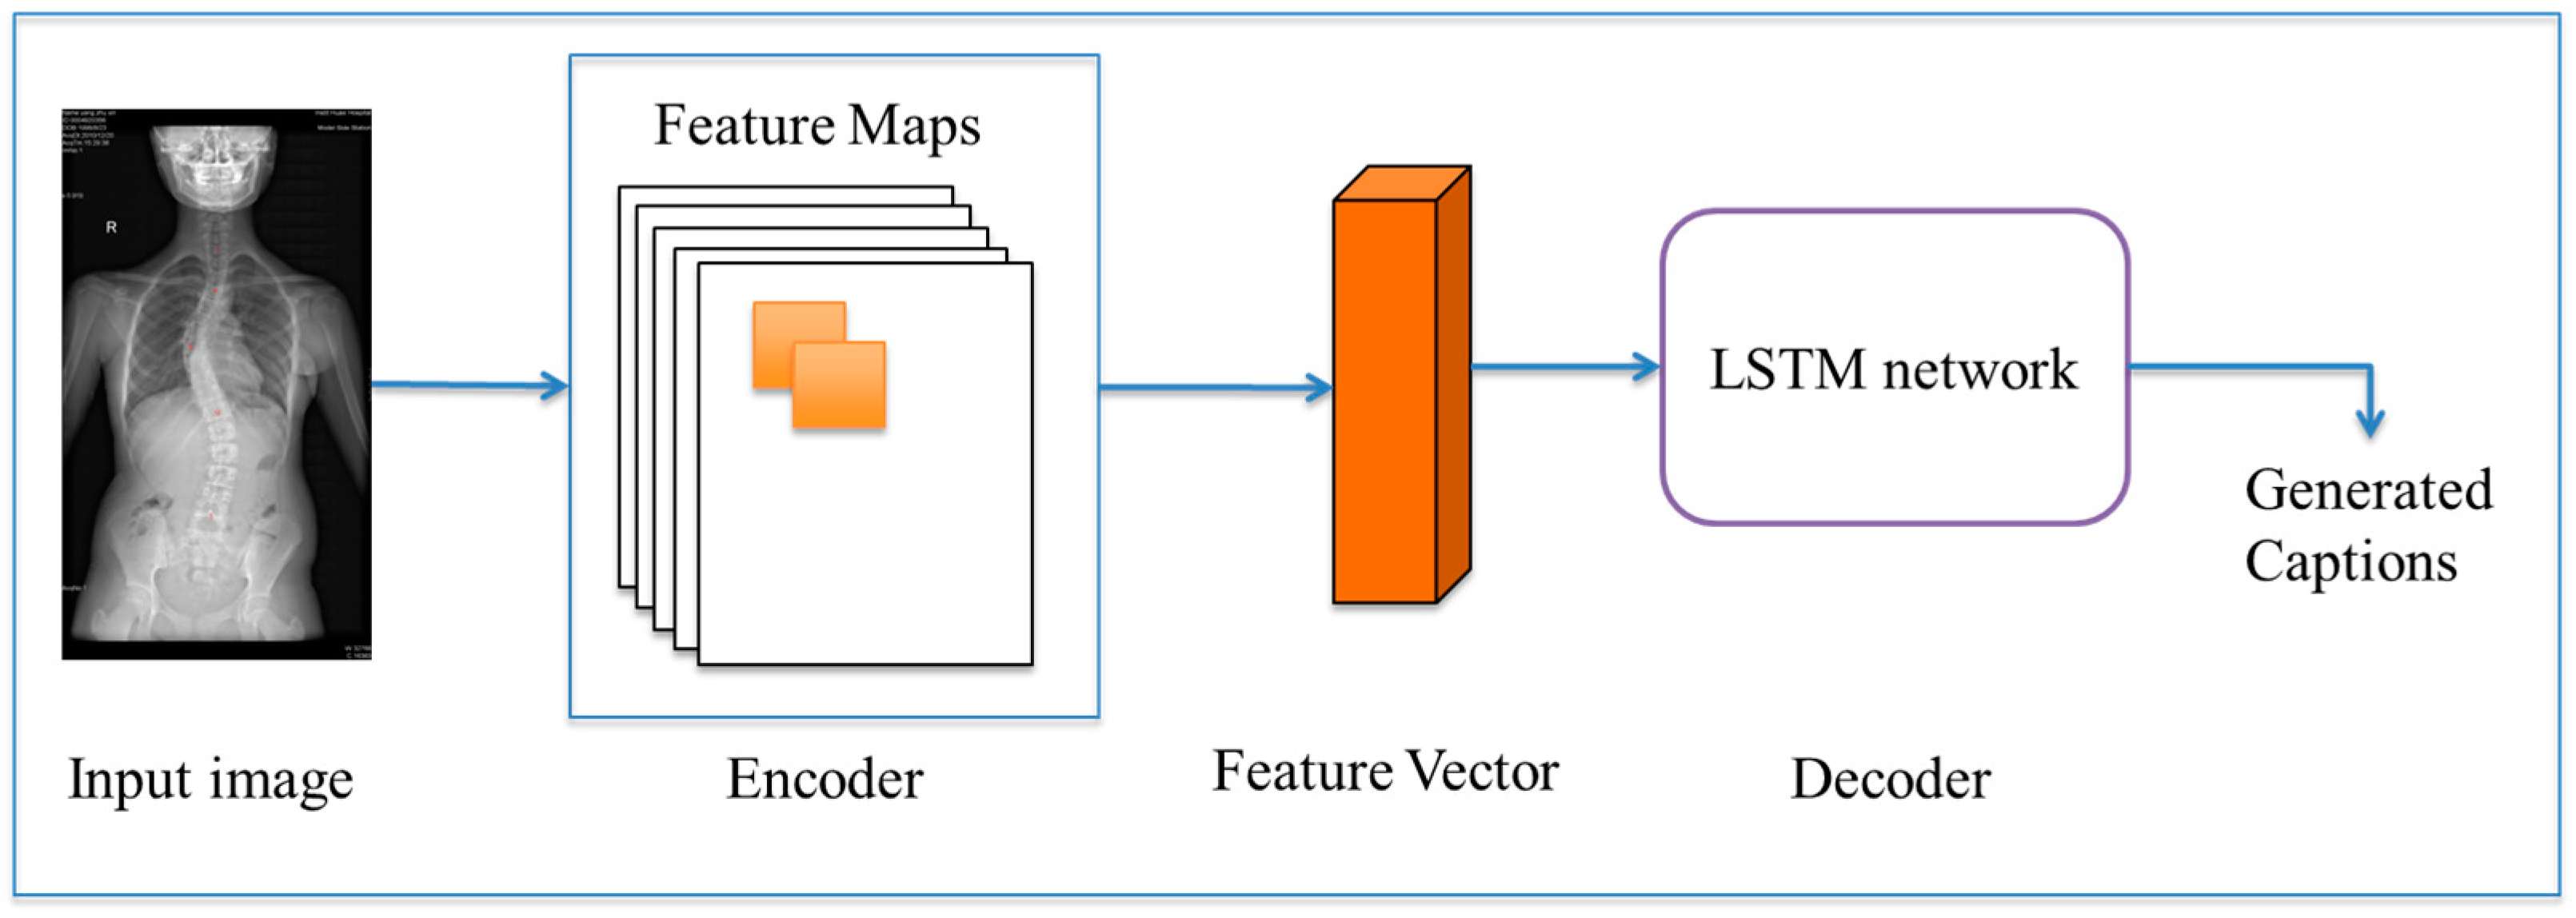
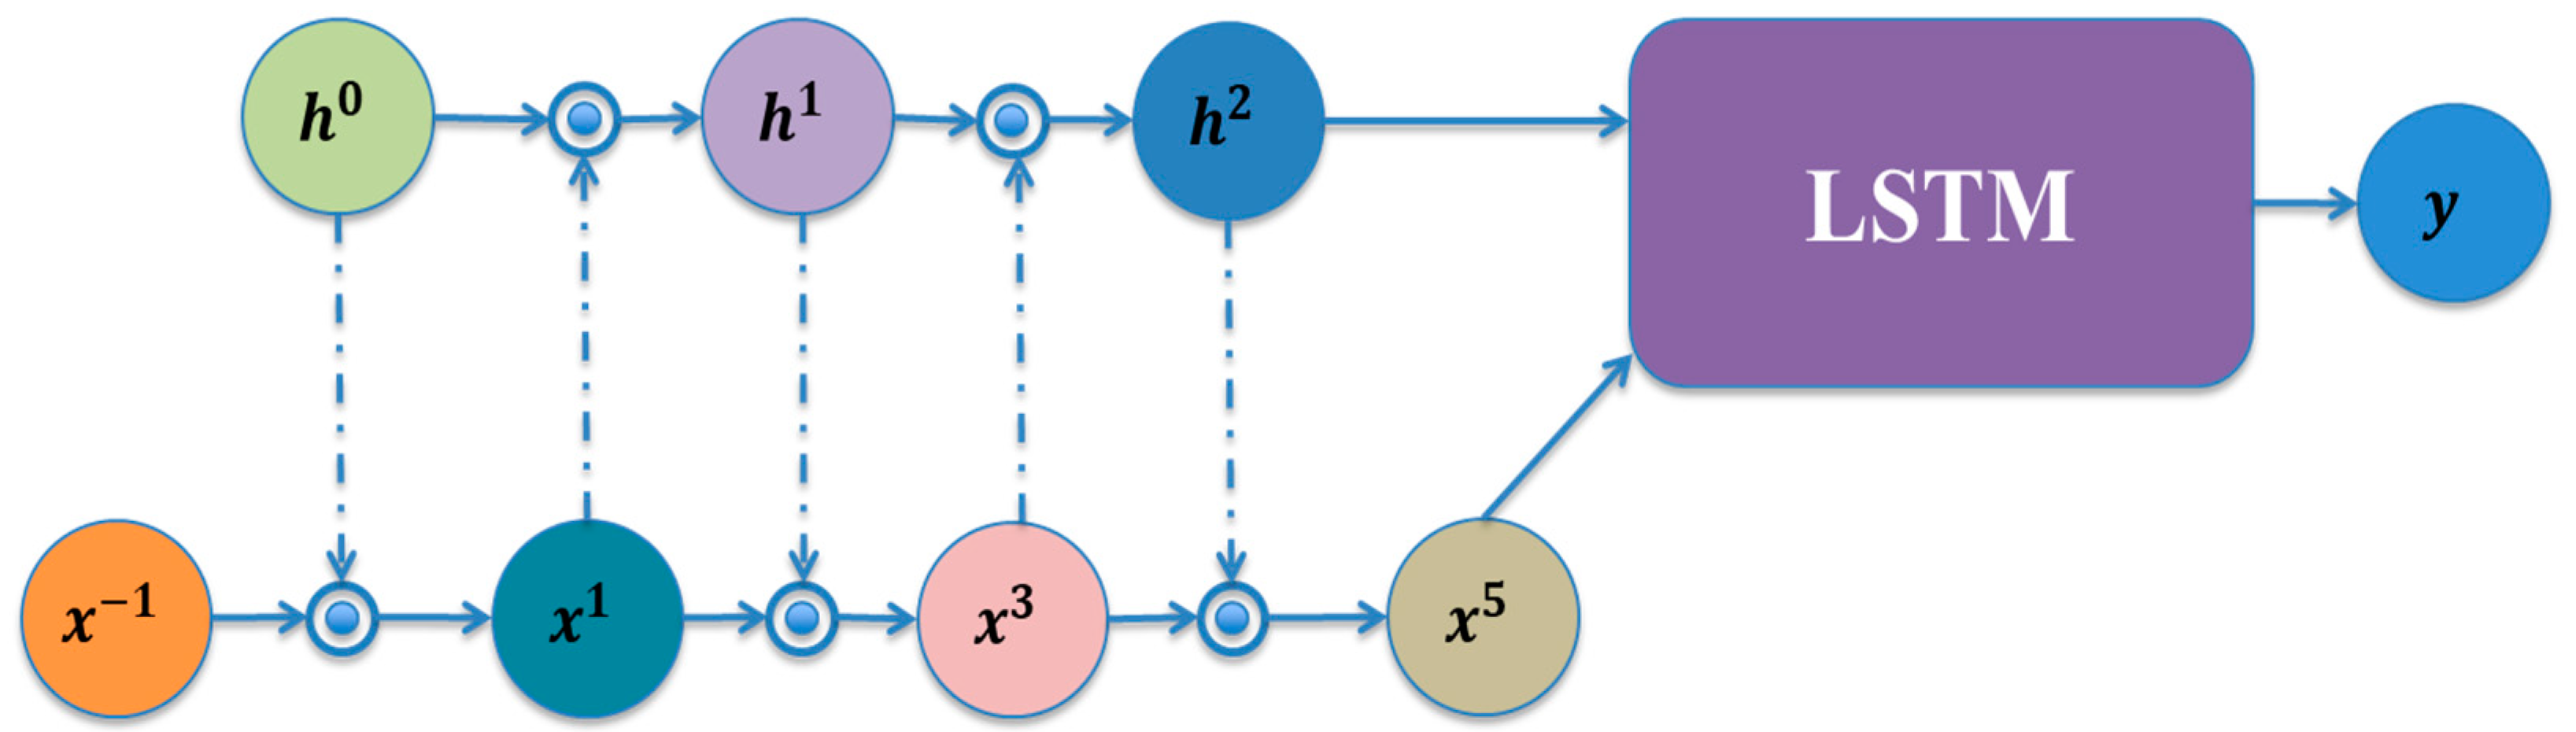
Medical image description generation has great practical significance, which attracts many researchers to carry out targeted exploration. At present, medical image description models based on deep learning methods are all based on an encoder–decoder structure (as shown in
Figure 1), and deep CNN and RNN are utilized in the encoder–decoder structure of these models [
15]. In fact, CNN extracts significant features from the input medical images in the form of fixed-length vectors. RNN or its variant networks, such as long short-term memory (LSTM) and gated reentry unit (GRU), are used as language models [
16] to translate fixed-length vectors obtained from CNN into semantically and syntactically correct disease diagnosis texts.
Shin et al. [
17] applied the coding–decoder structure for the first time to the task of generating medical diagnostic reports for chest X-rays, and the sentences generated by this method were mainly descriptions of disease classification and detection. At the coding end, they selected network-network [
18] and Google network [
19] CNN to extract image features and classify them, and obtained 17 disease labels corresponding to MESH statements. These terms were the most commonly used sentences to describe chest diseases without obtaining repeated results from other MESH terms. Although Shin et al. [
17] obtained a better performance on Google, only short sentences of five words were generated to describe classified diseases, rather than a fluent and coherent report. Wu et al. [
20] modified the basic framework of Vinyals et al. [
16] to generate a description of retinopathy. They used a pre-trained CNN as an encoder, using exit and integration techniques to encode 37,000 fundus images, resulting in feature coding vectors that were fed into the LSTM and decoded into a caption. The method of Wu et al. [
20] only generated the description of abnormal features in the images, and the description of disease information was not detailed enough.
The subtitle generation model of ultrasound images by Zeng et al. [
21] was divided into two modules, an encoder module and a language generation module, and the two modules needed to be trained separately. They used a region detection model, Faster-RCNN [
22], as an encoder to extract disease features and were able to locate diseased areas in ultrasound medical images. Finally, the language generation module generated the description of the critical area of the lesion and could generate the prediction box to locate the lesion area. Compared with other models, this model had the advantages of a short training time and fewer parameters, but the disadvantage was that the prediction error rate of language and words was high in the generated description statements. The decoding phase of the above methods could not obtain enough useful information, and finally the decoding of the sentence could not reach its ideal effect.
Therefore, many researchers have begun to add attention mechanisms to the coding–decoding structure. For example, Zhang et al. [
23] proposed the MDNet model, which innovatively added attention mechanisms to the description task of medical images. The attention module they used was able to increase the model’s ability to extract features, successfully enabling direct mapping from bladder cancer images to diagnostic reports. They used ResNet as an encoder to extract image features and extended it to skip connections to solve the problem of disappearing gradients during training. The image description model they proposed achieved a relatively advanced performance, but the generated diagnostic report only contained the description words of five bladder features, not a complete bladder radiology film diagnostic report. Jing et al. [
24] proposed an image description model with a co-attention mechanism that divided images into regions of the same size, extracted visual features from the last convolutional layer of VGG-19 [
25], and calculated the weighted sum of semantic features and visual features, respectively. The visual context vector and semantic context vector were obtained, respectively, and then the final feature vector was obtained by concatenation. The decoding part adopted the hierarchical structure LSTM, composed of sentence LSTM and word LSTM. While their hierarchical LSTM achieved good performance, the reports they generated contained repeated words, and the absence of contextual consistency in their hierarchical model could be the cause of the repetition. To further address this problem, Wang et al. [
7] proposed an approach similar to Jing et al. [
24], but they encoded input images using ResNet-50 and generated image titles using RNN-based LSTM, but their LSTM was flat, instead of the layered one used in [
24]. However, from their experiments on the chest X-ray dataset, the descriptive results were worse than the OpenI results of Jing et al. [
24], which may be because the decoding effect of flat LSTM was not as good as that of layered LSTM.
3. Materials and Methods
3.1. Datasets
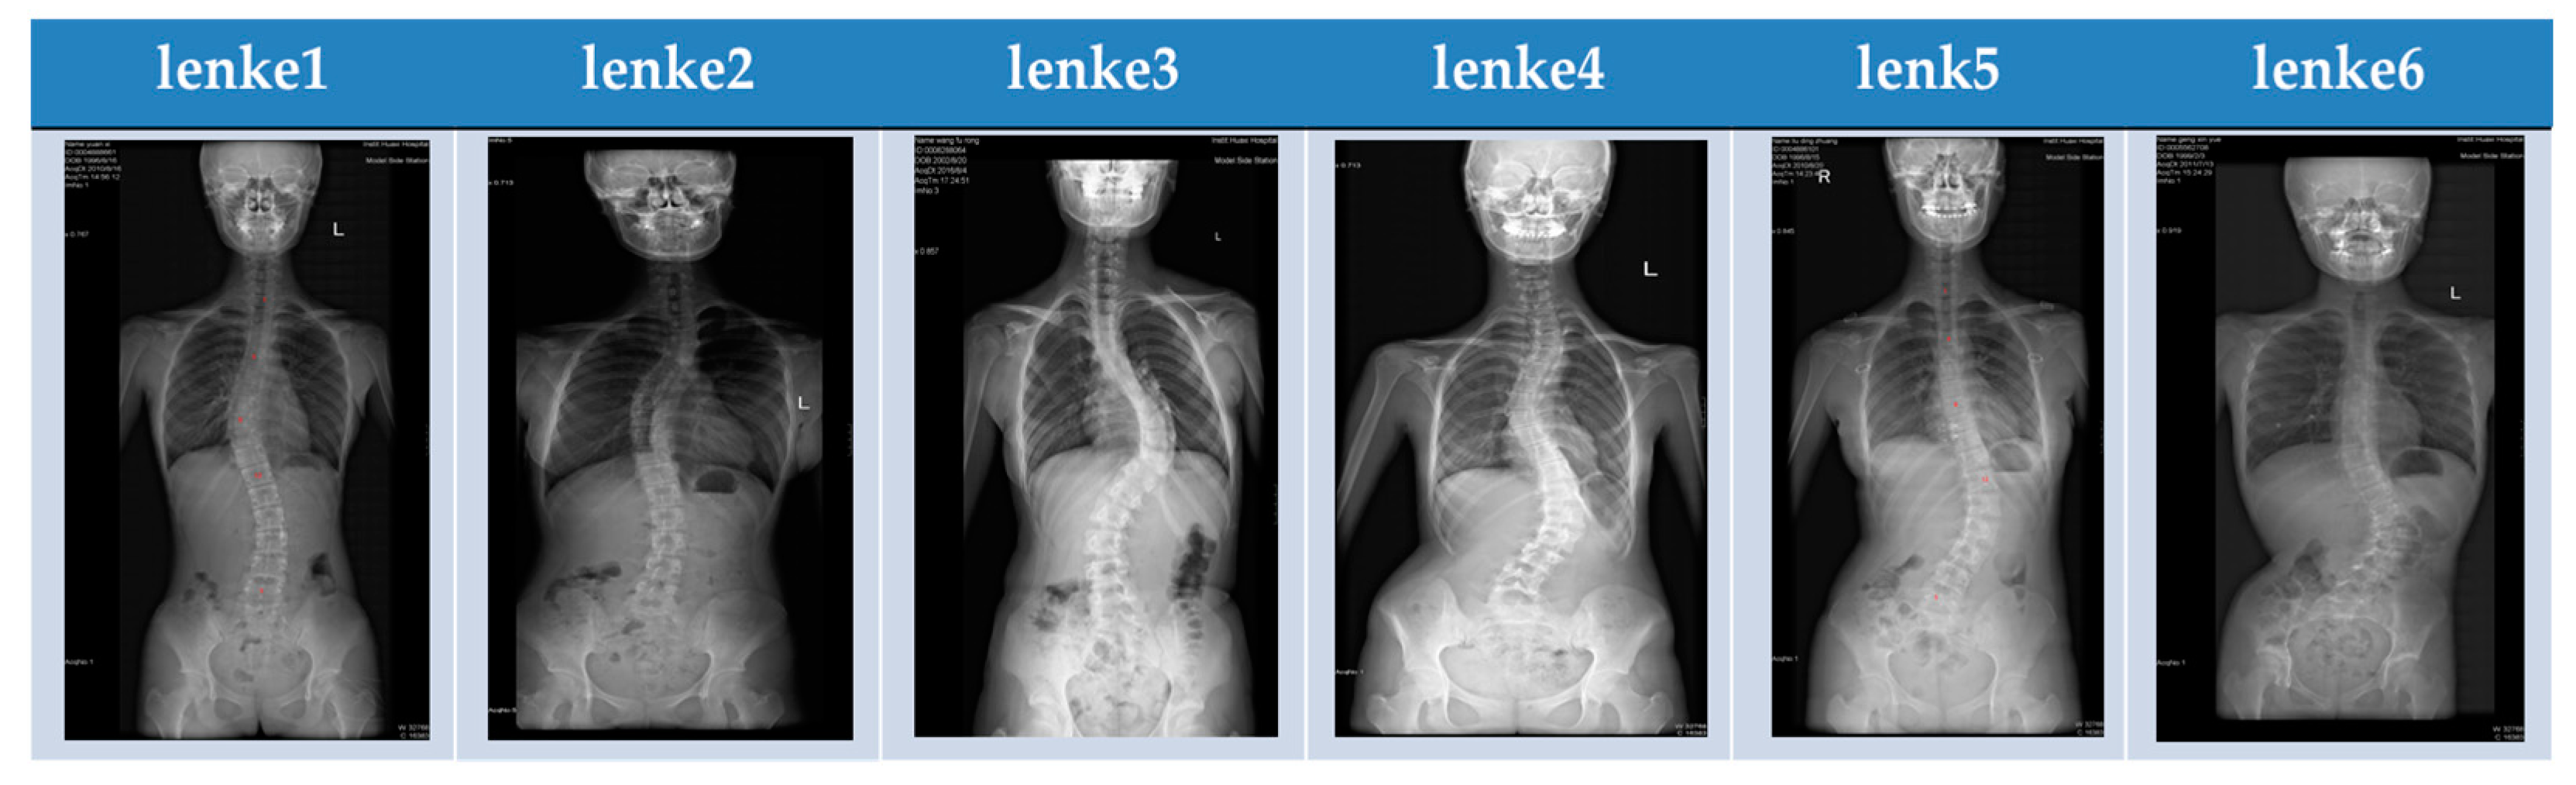
We used 13,200 positive X-ray images of scoliosis from patients with scoliosis in Guizhou Orthopedics Hospital, including 2820 Lenke-1, 1820 Lenke-2, 980 Lenke-3, 1260 Lenke-4, 2820 Lenke-5, and 2500 Lenke-6, 1000 asymptomatic sheets, and corresponding diagnostic reports. The diagnostic report was then used for training after statement processing. Specifically, we used 60% of the dataset for training (7920 images), 20% for validation (2140 images), and 20% for testing (2140 images). Details of the dataset are shown in
Table 1, and examples of spinal X-ray images are shown in
Figure 2.
3.2. Overall Framework
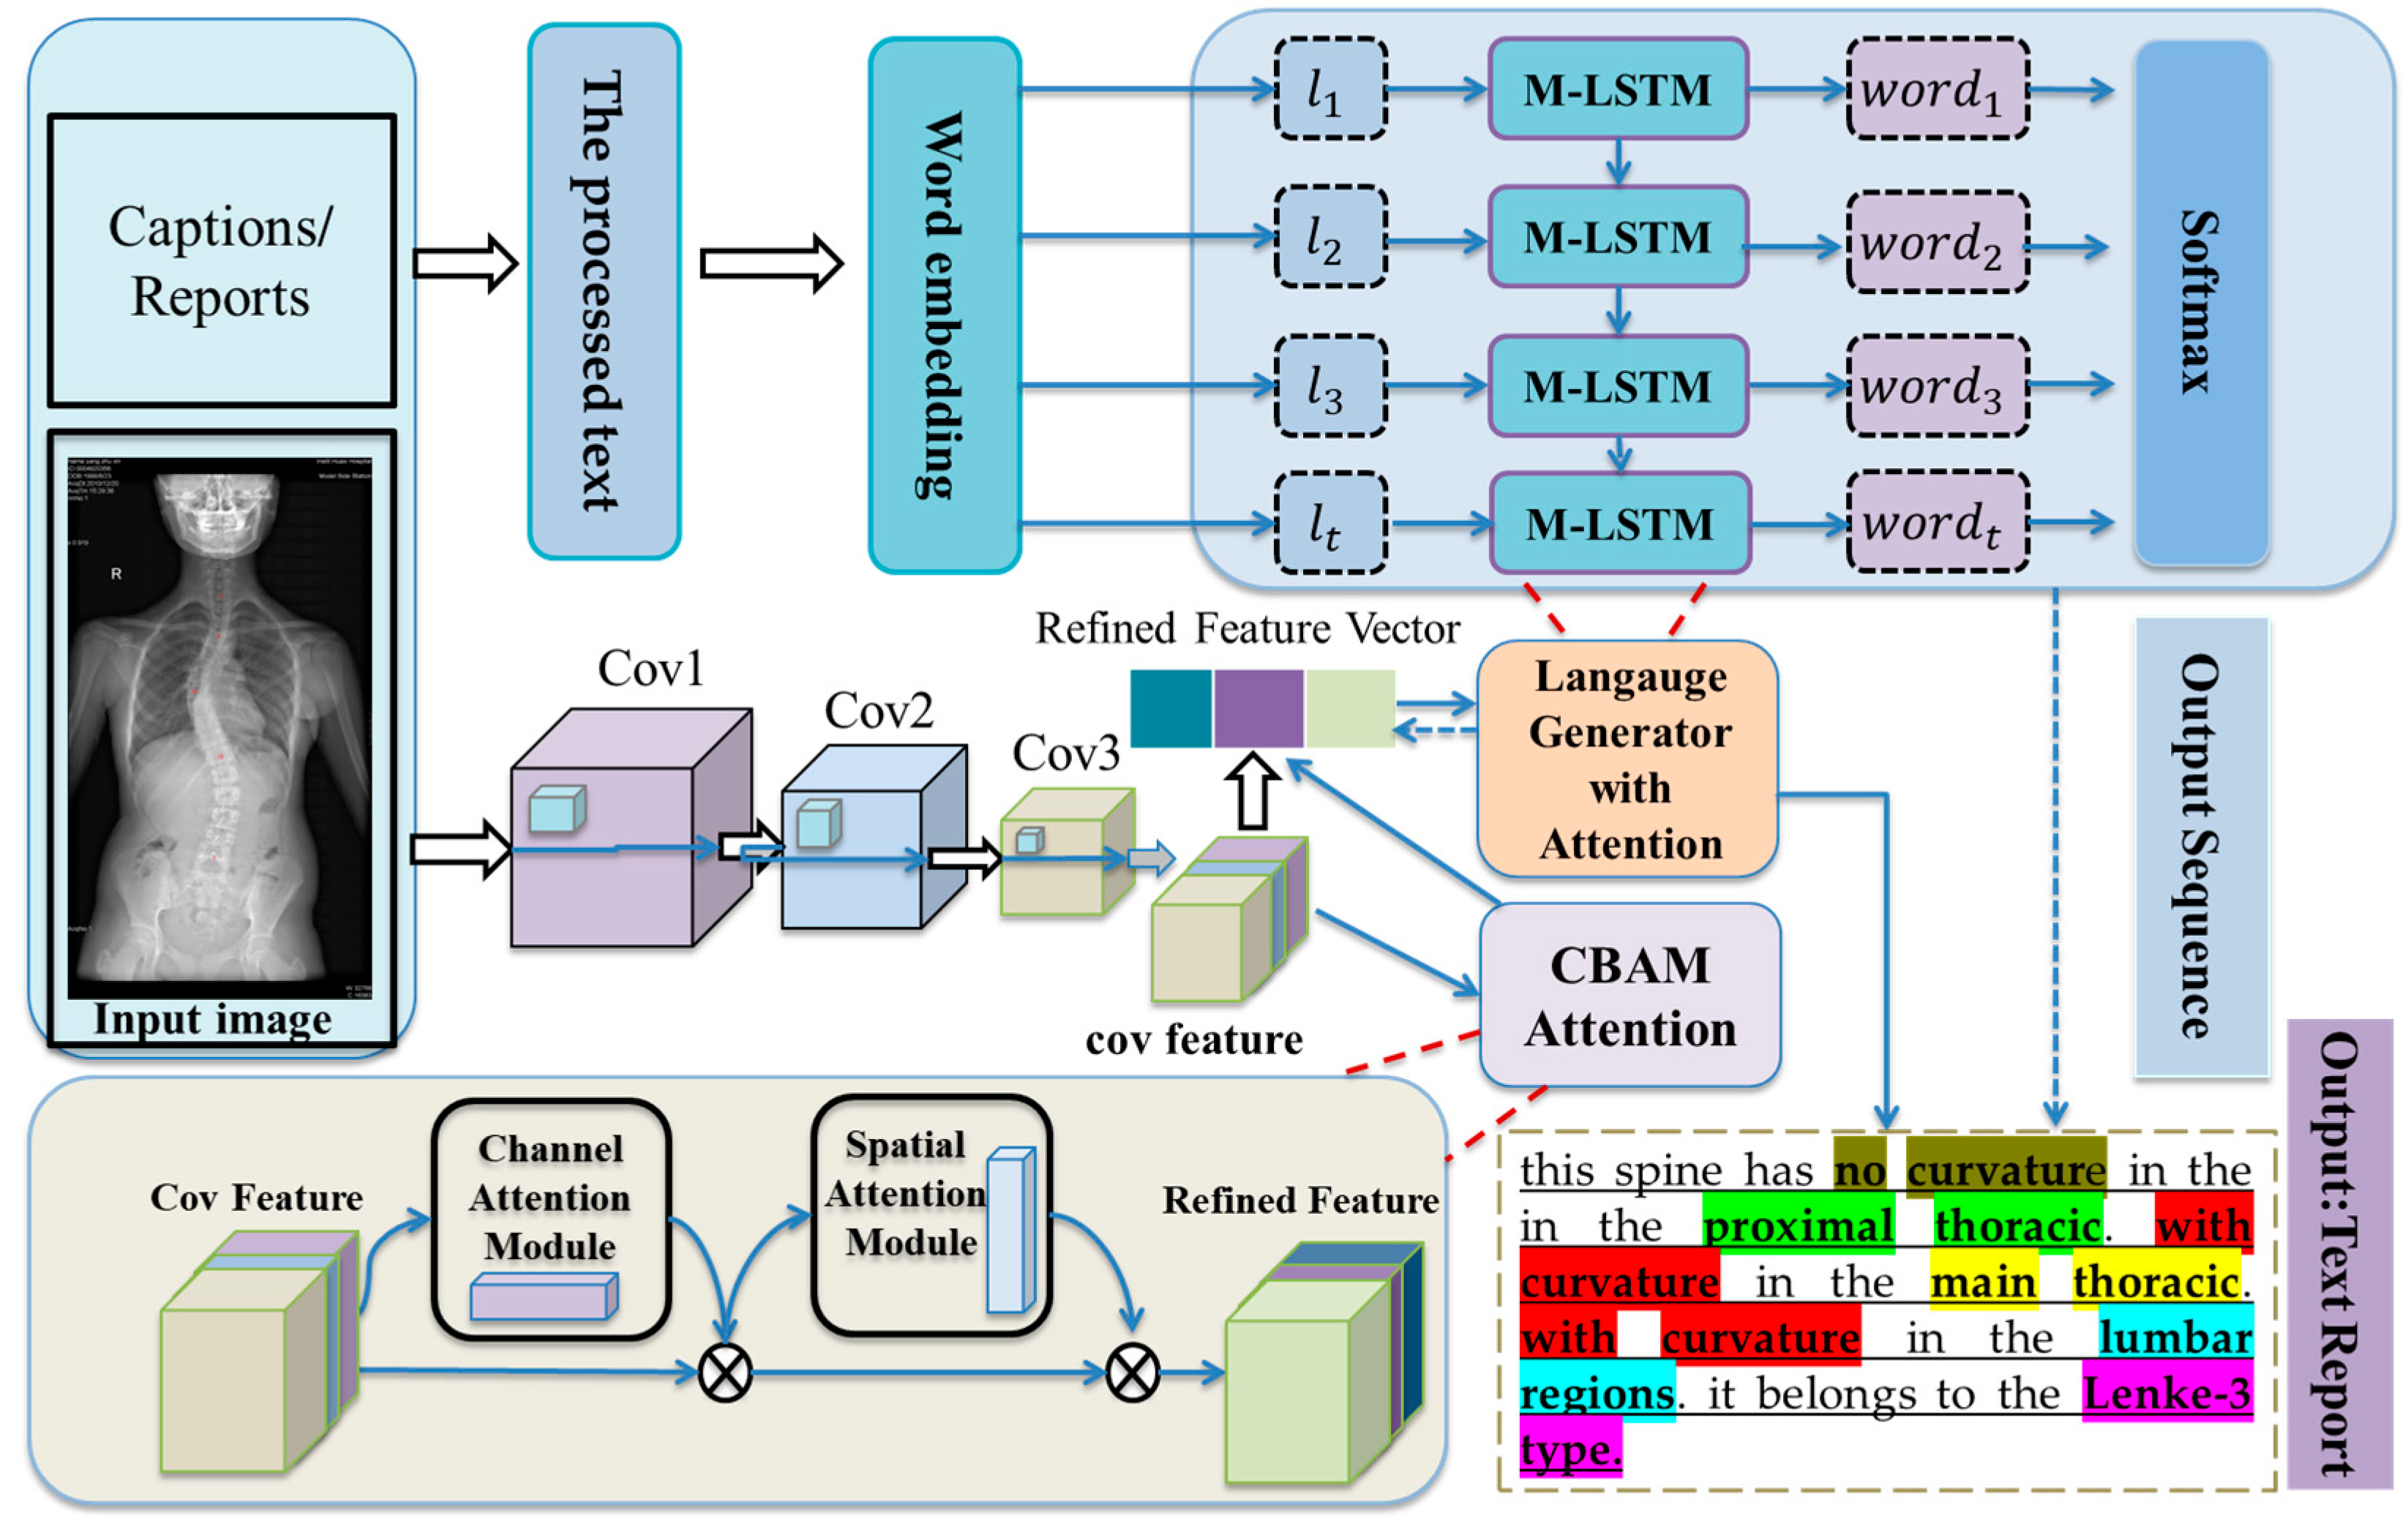
This paper proposes an automatic generation model for end-to-end Lenke classification reports for scoliosis. The model uses ResNet-50 [
11], which integrates the CBAM channel and spatial attention mechanism, as the feature encoder. Image features extracted by the ResNet50 network are re-calibrated into maps and weighted for different feature channels after compression, excitation, and spatial attention operations in the CBAM module. Therefore, the network is able to extract better-correlated features from spinal images for encoding. The improved long and short-term memory network M-LSTM fusion attention mechanism is used as the decoder. After the input of the coding vector, the features requiring active attention in the corresponding image region are dynamically selected according to the corresponding feature weights, and the image region with a high correlation with the current word is focused on. The key parts of the image are selectively focused by selecting a subset of the feature vector, and more reasonable description words are generated. The overall framework of the model is shown in
Figure 3.
The input to the model is image
, and the sentence sequence corresponding to
:
. First, image input
is convolved by ResNet50 feature encoder to extract image feature
. Then, the CBAM module added in the residual path is used for compression, excitation and spatial attention operation, and different weight
is assigned to the characteristic channels one by one, Finally, the output
is obtained by operation Scale, and
is input to the M-LSTM decoder as a new feature encoding vector. The mapping process is
.
is the weight parameter that ResNet50 network needs to train, and
is the offset value.
is the initial value input in the M-LSTM decoder.
is another input word vector of the model. It is encoded by the label word
of the training image through one hot encoding mode to obtain a word encoding vector
with a fixed length of 15 and multiplied by the word embedding matrix
to obtain:
In Equations (2) and (3), is the final output value of M-LSTM. and are the weight parameter and bias parameter of Softmax classifier, respectively, and is the output of image description statement of Softmax classifier.
In the training process of the model, input image is
, output
, which corresponds to the description sentence
, and the probability of describing output
is Equation (4). The logarithm of its likelihood function is taken to obtain logarithmic likelihood function Equation (5):
The training objective of the model is to maximize the logarithmic likelihood sum of all training samples, where
is the parameter that the model needs to be trained, and the solution of
can be converted into the solution of an optimal problem:
where the first term is the model loss function, and the second term is the regularization loss. In the training process, changes and optimization are constantly adopted to maximize the probability of image description corresponding to the input image data.
3.3. Feature Extraction
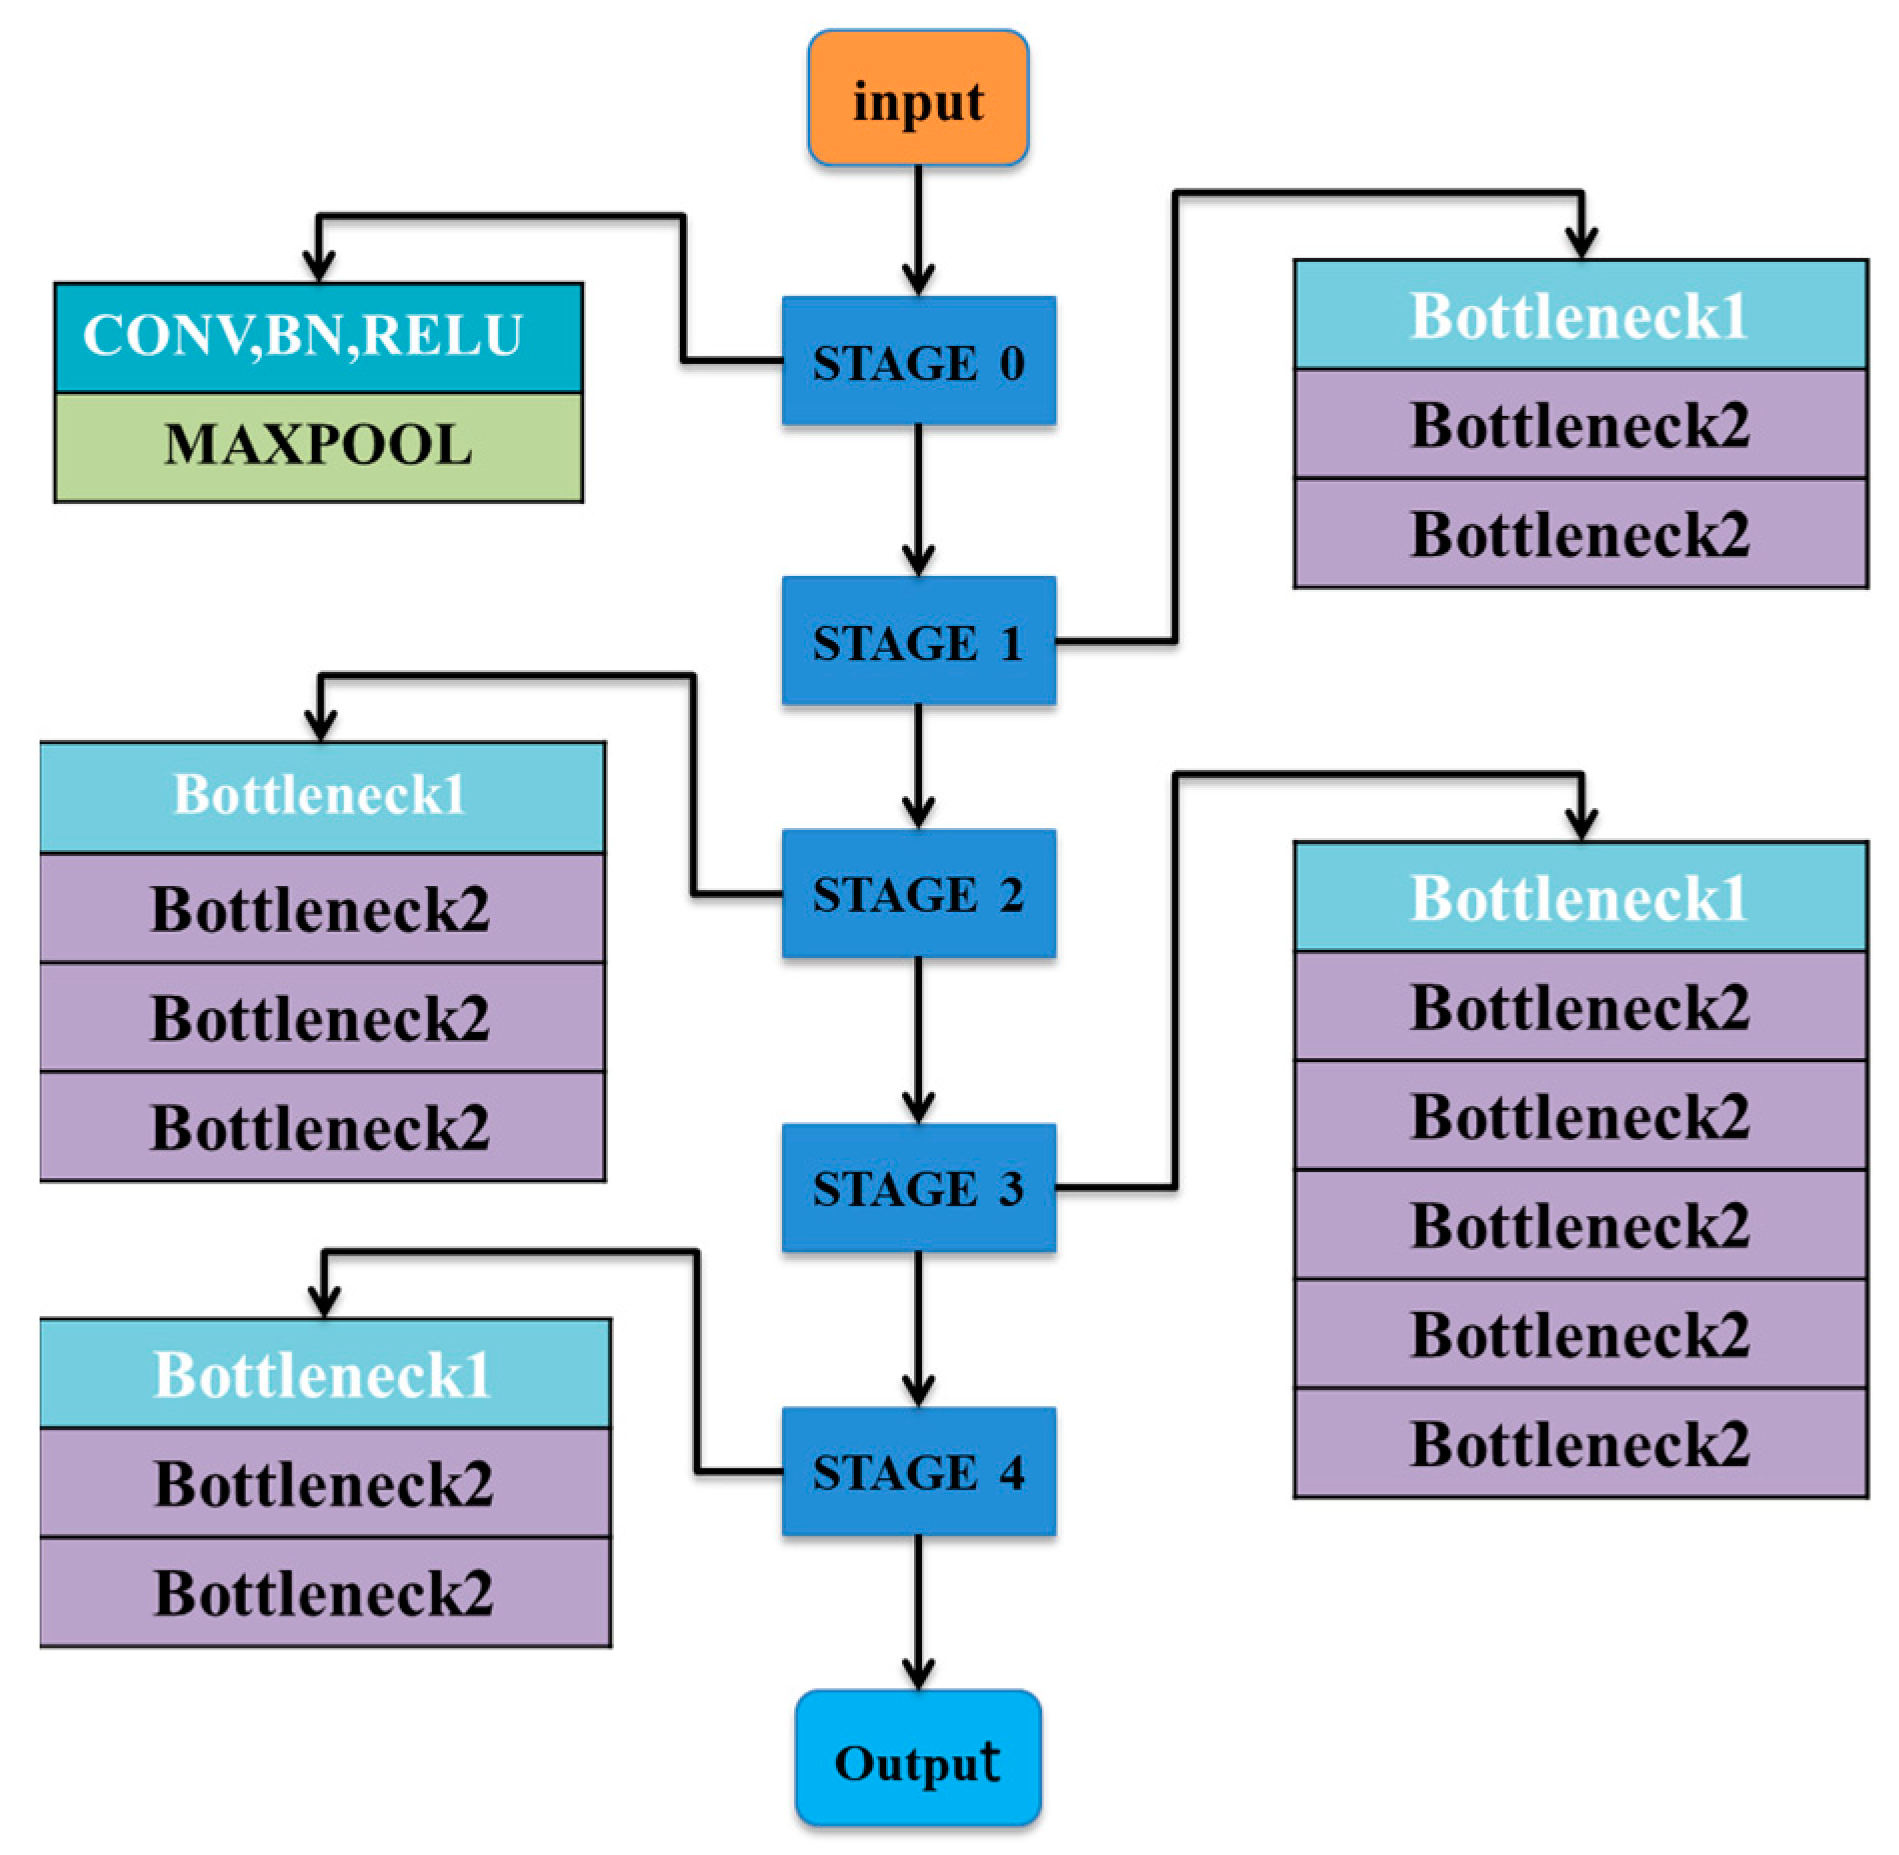
ResNet solves the degradation problem of deep networks through residual learning and can extract image features better. ResNet directly connects and combines the output of convolutional layers with different depths, which deepens the convolutional neural network and controls the complexity of the network at the same time. It also adds a residual unit through a short-circuit mechanism, which opens a channel next to the network so that the input can reach the output directly. The object of optimization is changed from the original fitting output F(x) to the sum of output and residual path input x: H(x) = F(x) + x. Such a structure prevents the residual network from losing the feature information extracted from the previous layer due to too much depth in the process of model training. Therefore, with the deepening of the ResNet network, its learning ability will become stronger, and its ability to extract image features will be greatly improved compared with the traditional convolutional neural network. In addition, ResNet’s downsampling channel uses convolution, which changes the original fully connected layer. ResNet network models are Bottlenecks filled with residual modules, but ResNET-50, ResNET-101, and Resnet-152 differ only in the number of Stage4 Bottleneck2 modules.
In this paper, ResNet-50 [
12] was selected for image feature extraction. While maintaining the depth and complexity of the network, ResNet-50 avoids the problem of the traditional convolutional neural network possibly causing gradient disappearance and degradation due to excessive depth, and it has faster convergence speed and is easier to learn.
Figure 4 shows the network structure of ResNet-50.
3.4. CBAM Attention
Although Resnet50 extracts multiscale features to ensure the diversity of features, it cannot focus on the importance of features. Adding the SE module after the Resnet50 module can allow a better focus on the effective characteristics of sampling. CBAM is an attentional mechanism module combining space and channel. Compared with SENet [
26], CBAM achieves better performance in image feature extraction. In deep learning, due to the difference in weight value between each channel, the product of each weight value and the value of the original channel is the characteristic value really required by deep learning. Based on SENet, the CBAM module considers the importance of pixels in different positions of each channel, obtains the importance of feature maps in channel and space by learning, and changes the weight value of different features to extract a more effective feature map. Suppose the input feature maps of the module in the middle of the network are
,
C,
H, and
W are the number, height and width of input feature graph channels, respectively, and the output of feature graph
is obtained through the operation of the one-dimensional channel attention mechanism
, as shown in Equation (7). After the two-dimensional space attention mechanism
, the feature graph output
is obtained, as shown in Equation (8), where
is the feature graph multiplied element by element.
In Formula (7), the channel attention pays attention to the meaningful learning features in the feature graph. By using maximum pooling and average pooling, the feature graph is compressed in the spatial dimension to obtain two different spatial background description factors,
and
. The shared network of multi-layer sensing units is used to calculate the background description factors to obtain the channel attention feature graph, as shown in Formulas (9) and (10), with
, b, Relu as the activation function after
.
In Formulas (10) and (11), the spatial attention pays more attention to the location information in the feature graph. Maximum pooling and average pooling are adopted to obtain two different feature description factors, and , in the channel dimension. The calculation process is as shown in Formulas (12) and (13). Finally, the two features are combined and the convolution operation is used to obtain the spatial attention feature figure ().
3.5. Decoder M-LSTM
Long-term and short-term memory networks can effectively improve the long-term dependence problem common in recurrent neural networks, but the network model still has some problems, such as weak generalization ability, weak language modeling ability, and poor performance in the face of context decorrelation. By introducing additional gating operations, the MOGRIFIER-LSTM [
13] model enables multiple rounds of interactive calculation between input and hidden state before input to LSTM, which enables richer interactive representation between input and context and enhances the context modeling ability of the model. The specific process of interactive calculation between input and hidden states is shown in
Figure 5.
As can be seen from the figure above, multiple rounds of interactive calculation were carried out between input
and hidden state
h before input to LSTM, where
is input
and
is hidden state
. The order of interactive calculation is
, which is a hyperparameter. When
, the network does not carry out additional gating operation, and the calculation method is as follows:
The input and hidden state obtained through multiple rounds of iterative interaction fusion are inputted into LSTM. The calculation method is as follows:
where
is sigmoid activation function,
is weight matrix, and b is bias.
3.6. M-LSTM with Contextual Attention
The image description model with the introduction of the attention mechanism will generate each word of the description statement according to the significant part of the image that is currently concerned, so that the decoder can selectively focus on some parts of the image by selecting a subset of feature vectors and pay attention to different image regions at different moments of decoding to generate more reasonable words. What is calculated by the attention mechanism is the context vector that captures the visual information of a particular area. The calculation method is as follows:
where
is the region to be calculated,
is the information of the previous time
,
is the multi-layer perceptron scoring function of the two pieces of information of the coupled calculation area
and time
, and
is the weight, which measures the degree of attention of the image area
at moment
.
where
is the binary variable introduced, which takes the value of 1 when region
is selected, and 0 otherwise. In order to use maximum likelihood estimation, we need to marginalize the implicit variable and then take the lower bound of the logarithmic edge likelihood as the objective function
:
where
is a description statement generated for image
. To find the gradient of the objective function:
Approximate with N Monte Carlo sampling method:
The moving average method is used to reduce the variance of the Monte Carlo method’s estimated gradient. In the TH batch gradient descent, the moving average is estimated to be the cumulative sum of the previous logarithmic likelihood with exponential decay:
To further reduce the variance, the entropy of multivariate Bernoulli distribution is introduced to improve the robustness of the algorithm:
4. Experiments
4.1. Evaluation Criteria
In the test stage, BLEU [
27] and CIDEr [
28] were used in this experiment. BLEU measures the accuracy of the machine-generated description by using an n-gram to count the coverage between the generated description and the reference description. The greater the coverage, the more accurate the generated description. CIDEr performs TF-IDF weighting for each n-gram between sentences and calculates the cosine similarity between their TF-IDF weight vectors to measure the consistency between the reference description and generated description and evaluate the consistency and richness of the image description.
4.2. Experimental Details
The platform used in the experiment was the GIGABYTE Technology RTX4090 24G with two graphics cards, and the deep learning framework was PyTorch. The loss function of the model adopted the cross-entropy loss function, and Adam was used as the algorithm optimizer to better train the model and improve the quality of the model. CUDA and cuDNN were used in training to accelerate the learning of GPU models and improve the training speed.
Table 2 describes the hardware and software configurations.
In the dataset used in the experiment, there was a lot of noise in the pictures which would disturb and affect the experimental results. Therefore, it was necessary to preprocess the data before the experiment to reduce the impact of the original data on the experimental results and obtain real and reliable results. The specific preprocessing method was as follows: the input image was clipped, and the size of the training image in the dataset was adjusted to the input size and dimension of the ResNet50 network (224 × 224 × 3); the diagnostic report statement corresponding to the image of the dataset was preprocessed; the characters, not letters or numbers, in the description statement were screened and removed; the words were divided by the space; and the words obtained after word segmentation were extracted and made into a vocabulary. The words that appeared fewer than five times were used as the <<UNK>> Mark and substitute, creating word-to-index and index-to-word mappings. To avoid the impact of excessively long description statements on the model, the maximum length of the description statements was set to 15 words.
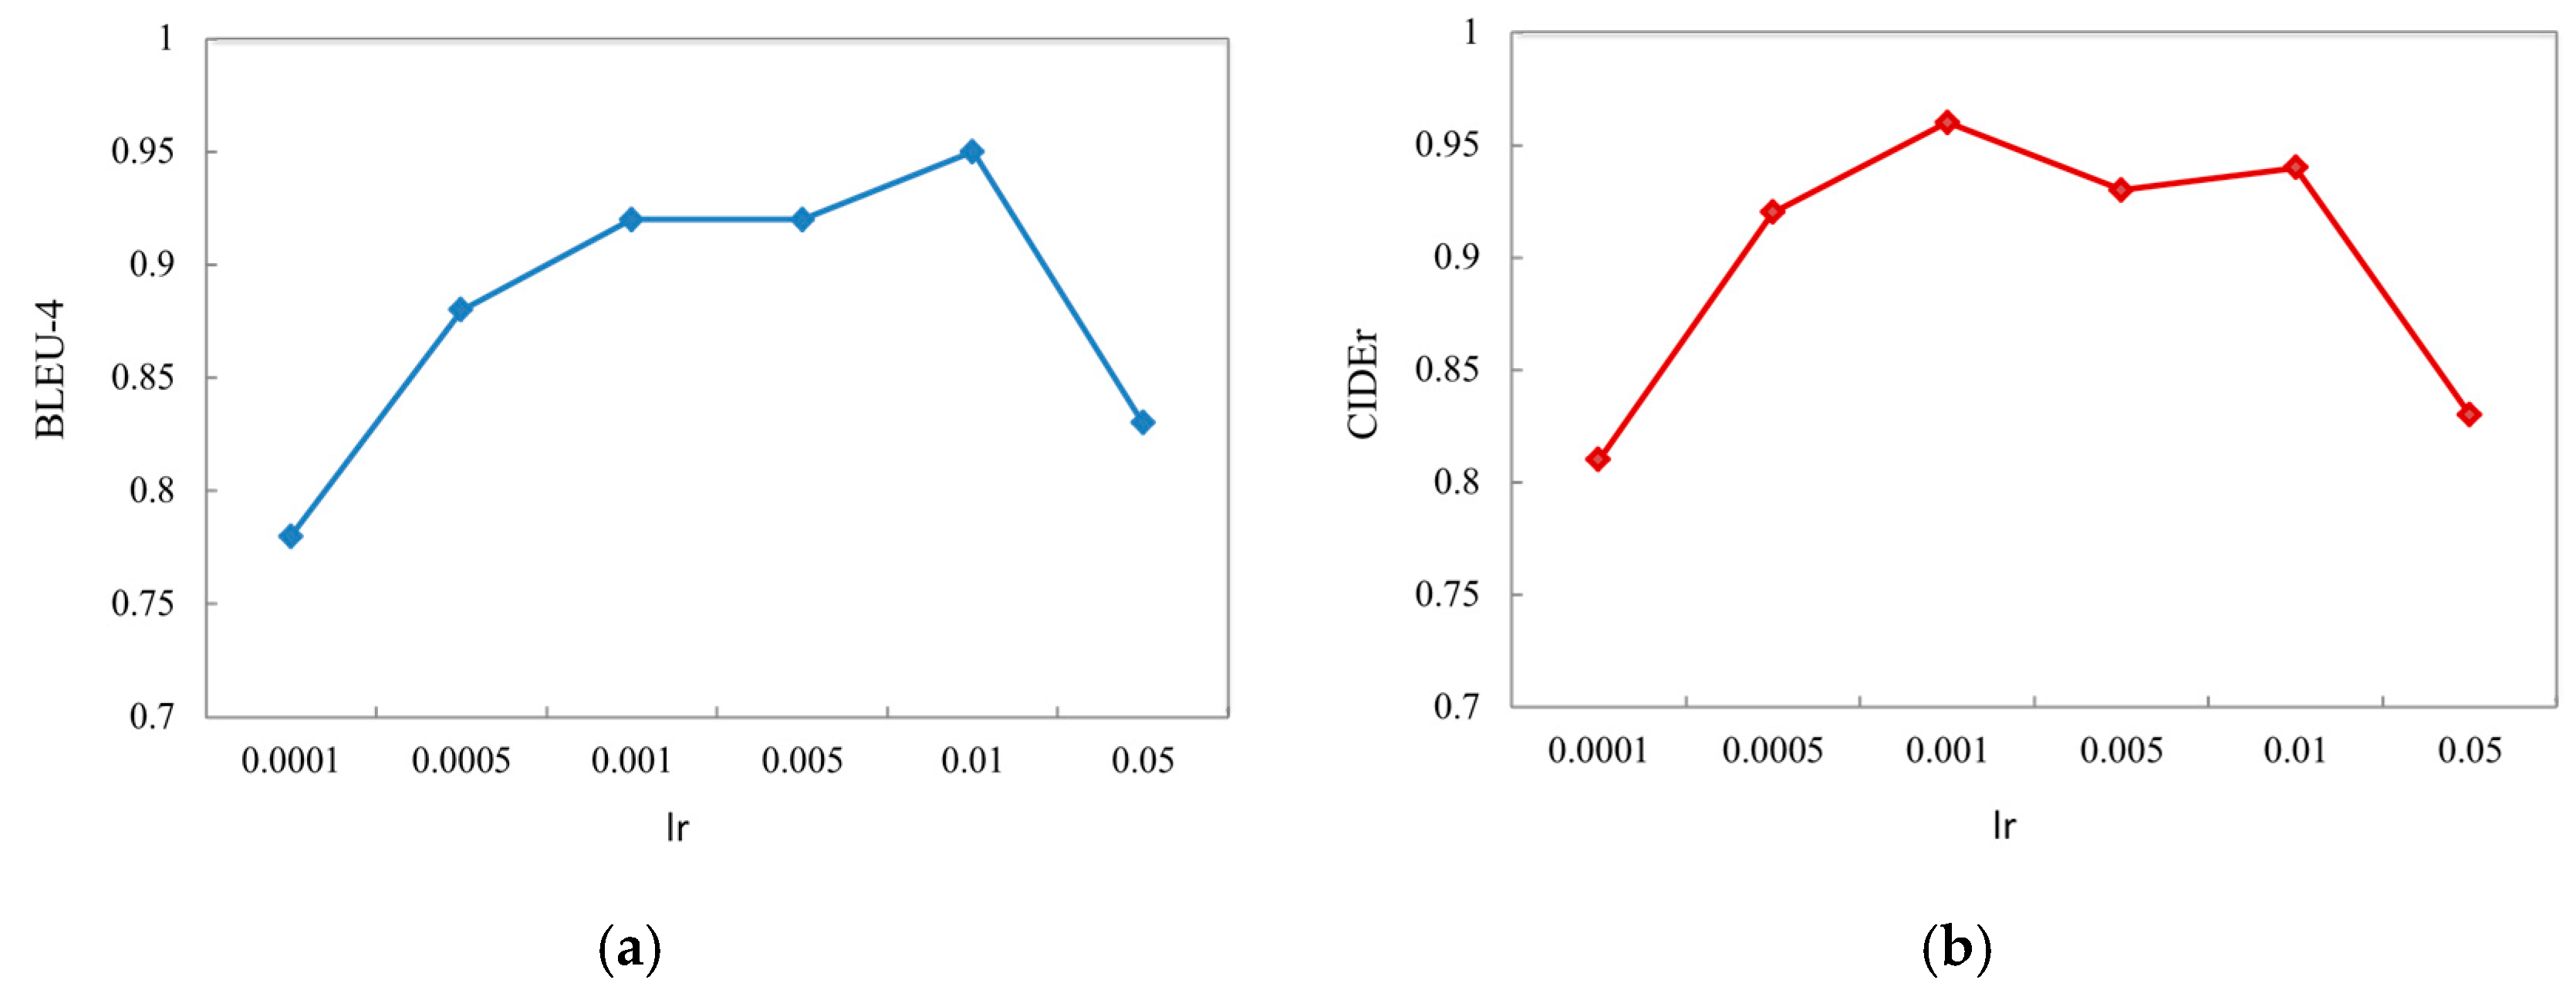
In addition, before model training, it is necessary to determine the setting of the hyperparameter during training. The hyperparameter does not need to be driven by data, but needs to be adjusted manually before or during training. The learning rate of model training needs to be adjusted manually, and a too high or too low learning rate will lead to model optimization failure. In this paper, the model was trained by pre-setting different learning rates (Lr), and the evaluation results are shown in
Figure 6. According to the experimental results, the learning rate with the highest score on the evaluation index was selected as the super parameter setting for the subsequent model training to better train the model.
4.3. BLEU and CIDEr Score
In order to verify the effect of the proposed model on image description generation, three comparative experiments were undertaken in this part. Comparison experiment 1: The model presented in this paper was compared with baseline models such as Multimodal RNN, DeepVS, and Google NIC [
28]. Each model was trained and tested on our spine X-ray dataset, and the test and comparison results are shown in
Table 3.
Judging from the results, the model proposed in this paper was compared with Multimodel RNN, DeepVS, Google NIC, and Soft-Attention and Hard-Attention models using attention mechanisms that have a great improvement on the BLEU index to evaluate the smoothness and accuracy of generated sentences, and the CIDEr index to reflect the diversity of image description generation.
Comparison experiment 2: This model was compared with the models mentioned in the related work in
Section 2 of this paper in our spinal X-ray image dataset. The comparison results are shown in
Table 4.
The comparison results on the spinal X-ray image dataset show that compared with the four models, the proposed model had considerable improvement in all evaluation indexes of BLEU-2, BLEU-3, BLEU-4, and CIDER, except the BLEU-1 index.
Comparison experiment 3: In order to demonstrate the effect of simplified explanatory sentences, we showed the BLEU and CIDER scores of the trained model under the original diagnosis report and the simplified sentence report, respectively. The scores of BLEU and CIDEr are shown in
Table 5. Non-scoliosis samples were not included in the test set because non-scoliosis images would automatically be described as empty sentences, perfectly repeating the original label, which would inflate the score.
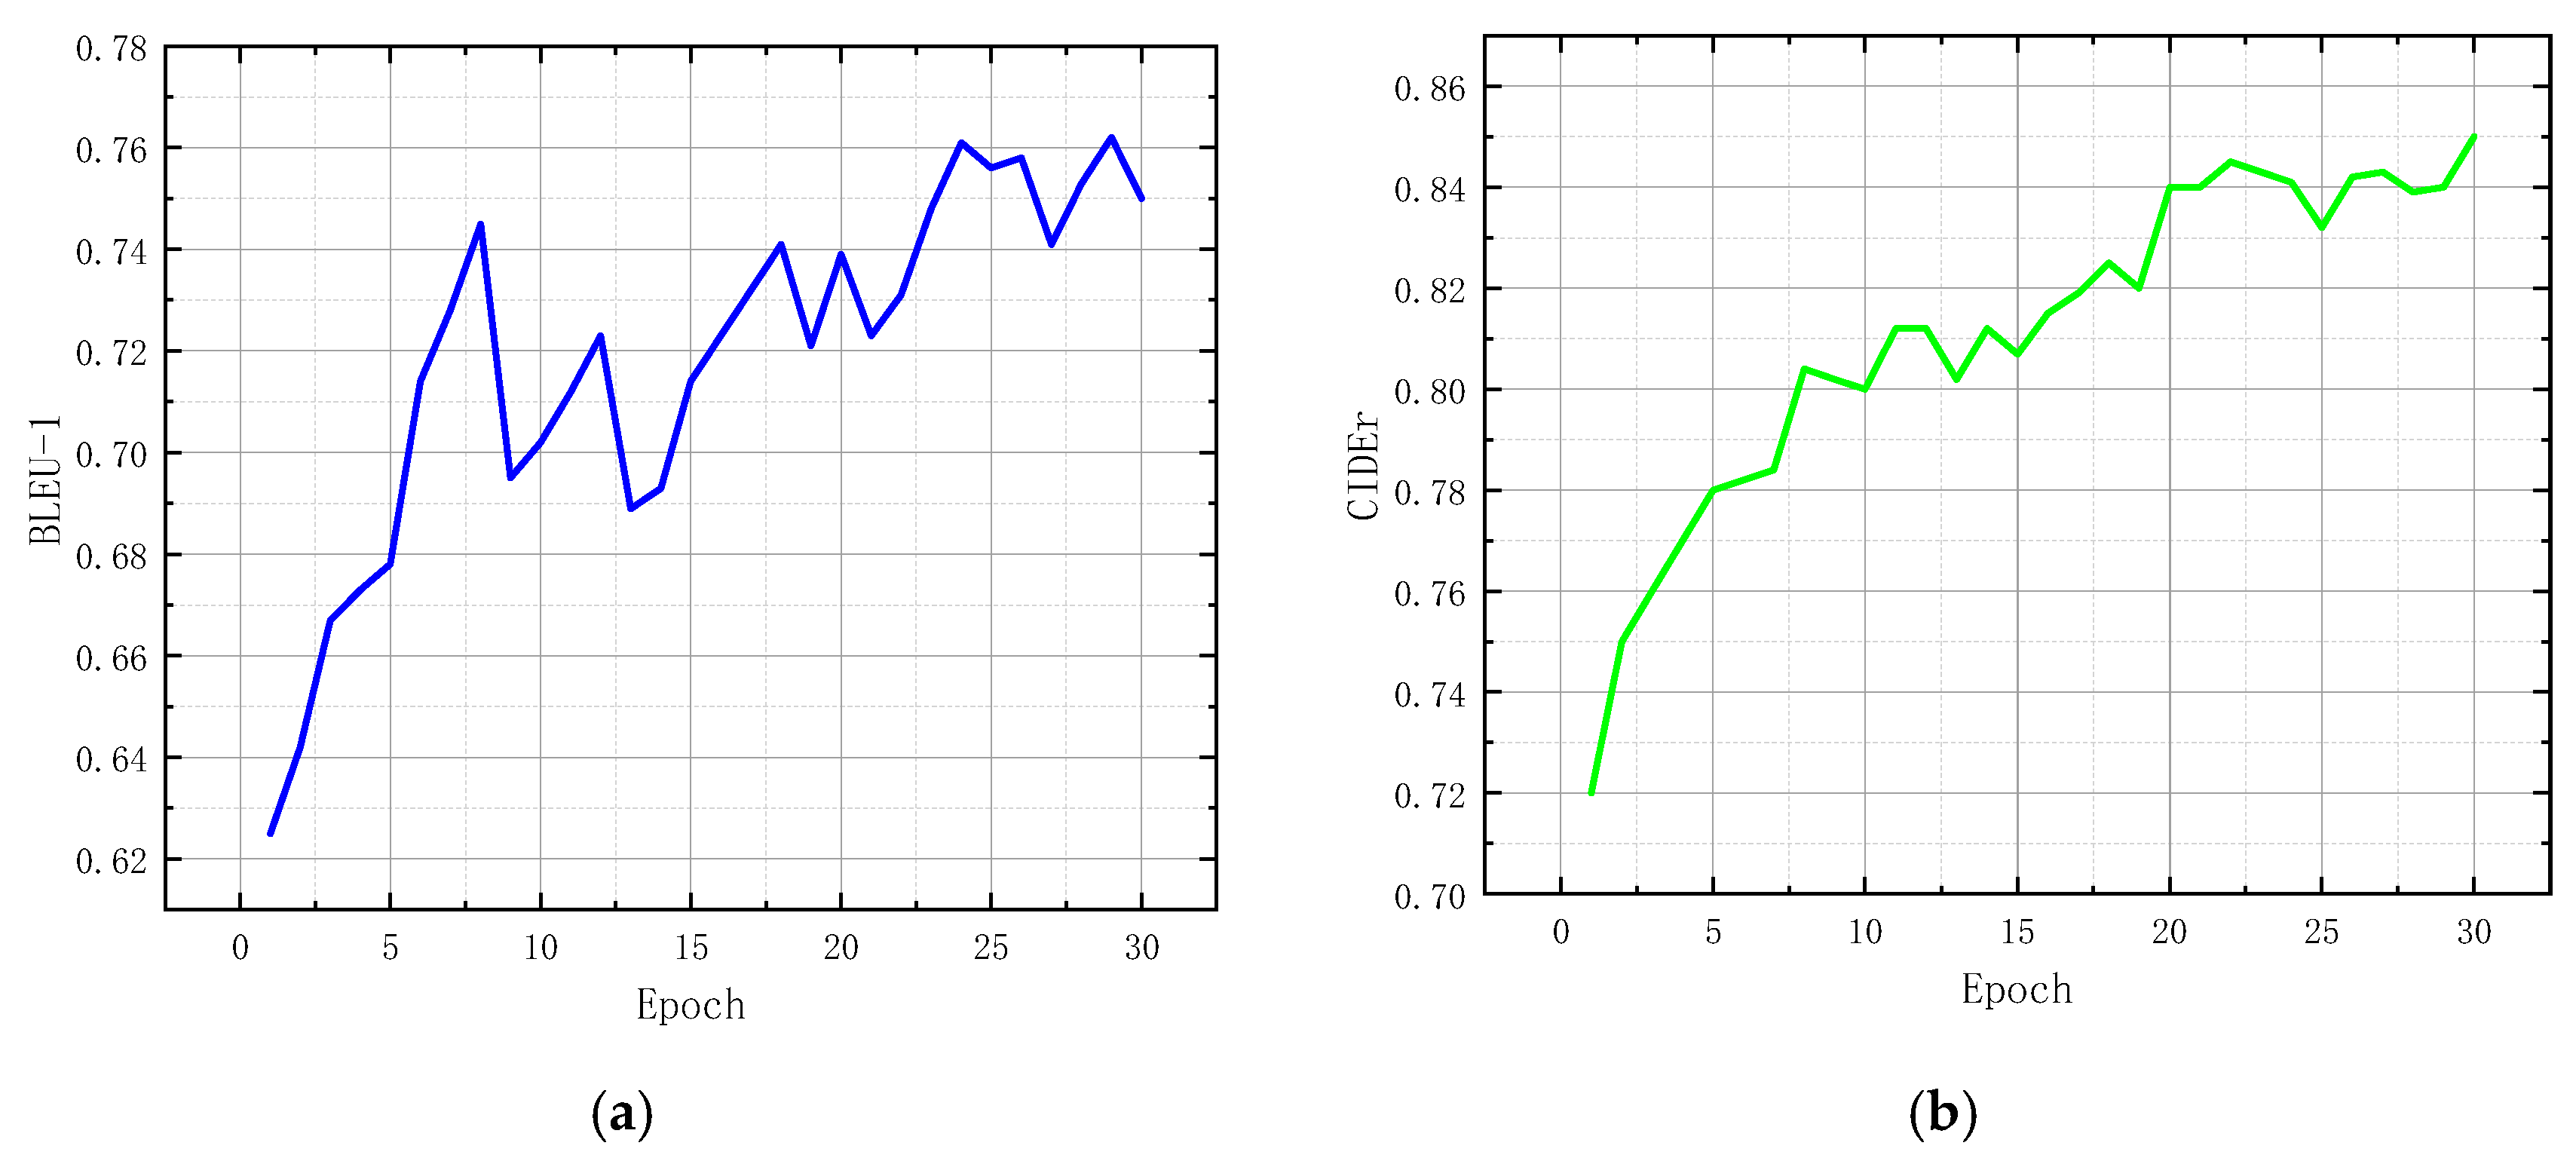
It can be seen from the table that the diagnostic text generated by the model trained with the simplified diagnostic report had much higher scores in both the BLEU1-4 index and the CIDEr index than that generated by the model trained with the original report, which confirms that simplifying complex diagnostic reports can improve the model’s ability to reproduce sentences and obtain more accurate spinal image description. During the training, the evaluation index changed with each iteration of the model, as shown in
Figure 7. It can be seen from the figure that with each iteration of the model, the evaluation index constantly improved, and the model effect became better and better.
4.4. Description Results
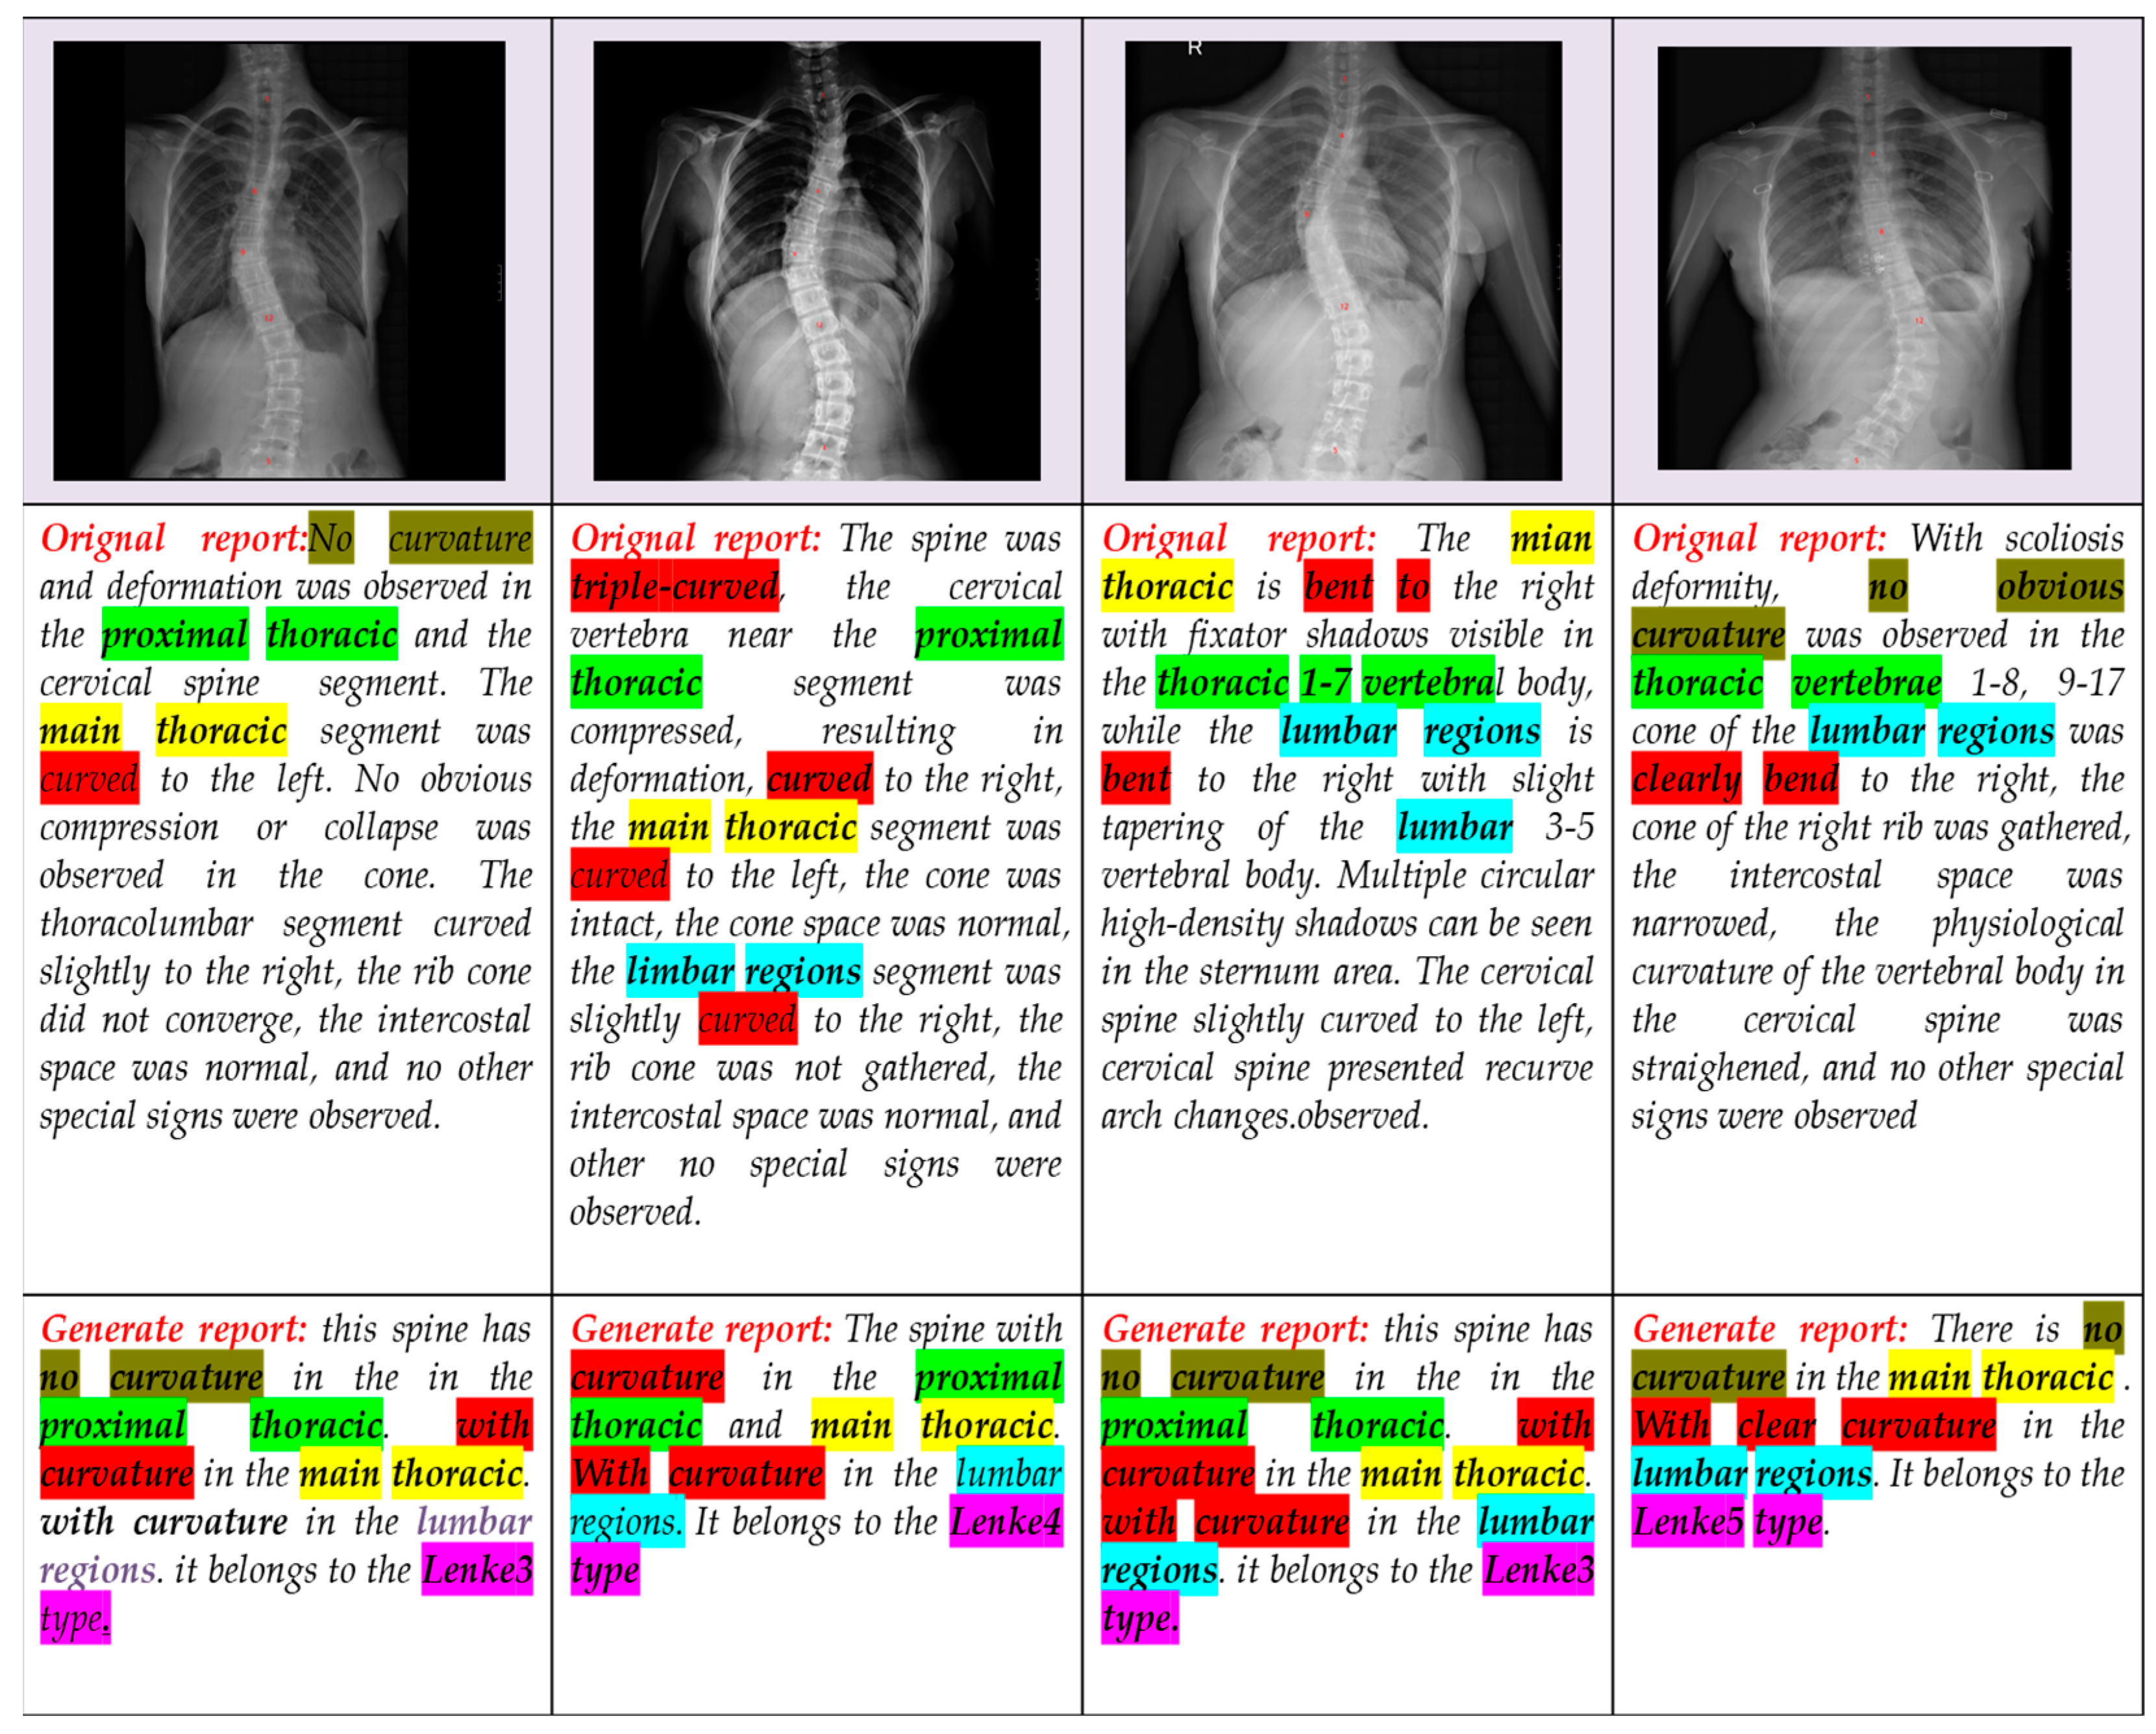
To evaluate the descriptive ability of our model to generate sentences, 200 spinal X-ray images of different Lenke classifications were randomly selected from the test set for validation. The description of this model in the spinal X-ray image is shown in
Figure 8.
It can be seen from the description results that the model in this paper has a good ability to describe the curvature characteristics of scoliosis. Different Lenke classification images can be identified, and the bending position, bending direction, and category of the image can be described in the description process. The sentences described had consistent sentence structures, as expected. In addition, we calculated the percentage of sentences containing spinal curvature positions and key feature descriptions in the models trained on the original diagnosis report and the models trained on the processed sentences, respectively, as shown in
Table 6. It can be seen from the table that the model trained by the simplified sentence could generate a more accurate description of the disease characteristic information than the model trained by the original report.
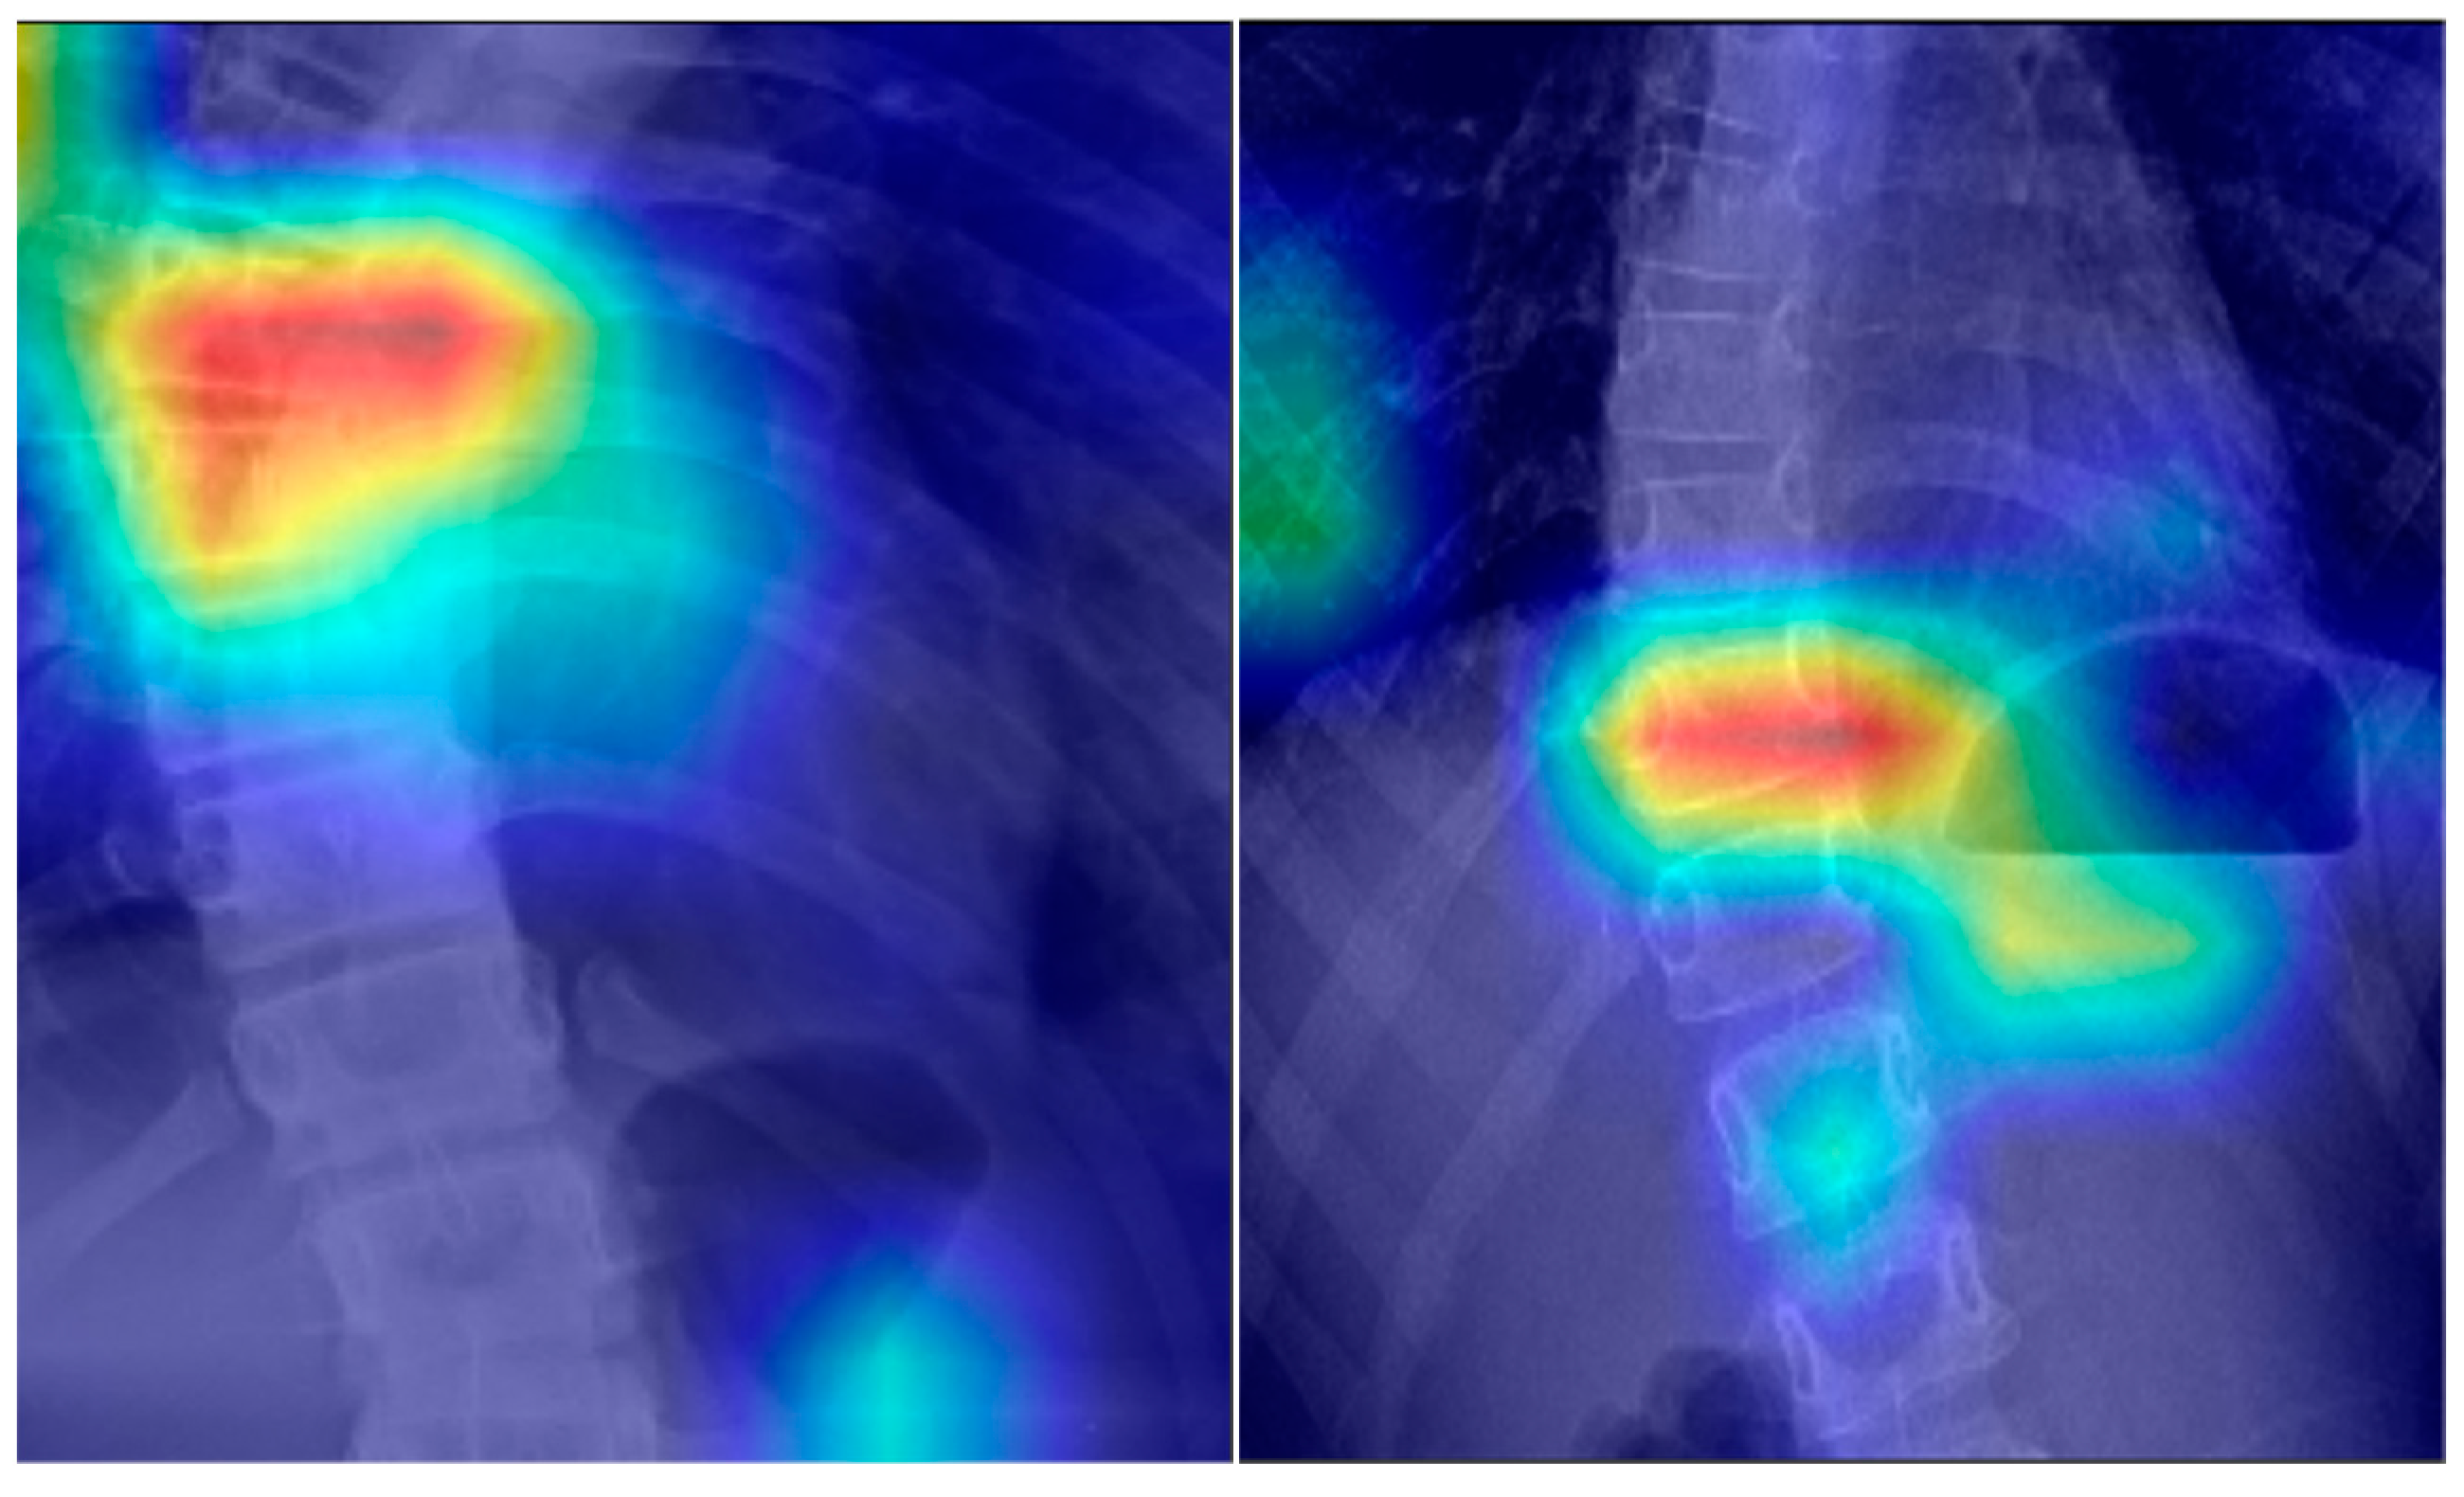
Finally, in order to verify whether the spinal X-ray image description model could really pay attention to the semantics of key features in spinal images, attention mechanism visualization was adopted for the feature extraction process of the model, and it was generated into the corresponding thermal map output. The thermal map results are shown in
Figure 9. It can be seen that the model was able to focus on the position of the curvature of the spine in the description, resulting in a more accurate and detailed description.
4.5. Doctor’s Score
We selected 30 cases from the test set, which included a randomly selected Lenke classification image of scoliosis, randomly distributed from Lenke-1 to Lenke-6. For each Lenke classification, we used the model to generate the corresponding diagnostic text and gave it to five clinicians at Guizhou Orthopedics Hospital. We asked the doctors to compare our diagnostic text with the original diagnostic report and score the accuracy of the description of the key features of the spine and the accuracy of the Lenke classification of the spine. This was rated on a scale of 1 to 10, with 1 representing a completely unsatisfactory explanation and 10 representing a perfect explanation.
Table 7 shows the average scores of the scoring results given by clinicians. As can be seen from the scoring results, the scores were mainly distributed between 8 and 9, so the diagnostic text generated by this model could be recognized by professional doctors.
5. Discussion
To date, many researchers have made many attempts to generate descriptive texts from natural and medical images, but these methods have all used existing diagnostic report data as training labels, aiming to generate the same diagnostic text as the original report. However, the sentences in the original report were too complex, and the logic of the sentences was mostly affected by the subjective factors of clinicians. It is impossible for a computer to understand and reproduce the original report written by a human mind, so the diagnostic text generated by their model was not very effective.
In terms of spinal medical images, most of the current work is based on the disease detection and classification of spinal medical image datasets, and there has been no related research on the generation of spinal disease diagnosis reports. Therefore, this paper conducted a study on the automatic generation of a scoliosis diagnosis report. Different from the previous description methods, we created a new set of hand-marked sentences according to the visual features of spinal images under the guidance of professional radiologists as the labels for model training, and marked up the original diagnosis report into simple and consistent sentences with the same structure, using these sentences as a training model. Therefore, in the validation of the test sets, the model in this paper could output short but critical feature descriptions of the diagnostic text. In the model, the convolutional attention mechanism CBAM we added was different from the channel attention mechanism in traditional methods or the global attention mechanism. This attention mechanism could focus on channel and spatial features. Therefore, features with better correlation in spinal images could be extracted, and the description sentences generated could pay more attention to the information about spinal curvature. In addition, the attention mechanism was also added in the text decoding stage. The attention mechanism allowed the decoder to focus on the image region, with a high correlation with the words of the current moment, and it could predict the words of the current moment according to the words of the previous moment, instead of directly focusing on the whole image. Finally, the region features related to the current moment were used to generate words. This method was also the reason why the sentences generated by this model had good effects both in accuracy and in the score of evaluation indicators.
This method is not limited to models and datasets; it can also be applied to other medical image analysis tasks. However, there are limitations to this approach, as the preparation of short statement labels is cumbersome and a certain medical knowledge of scoliosis is required in the process of condensing traditional original diagnosis reports. Therefore, applying the simplified method of sentence labeling to the generation of other medical image diagnosis reports also requires a certain medical knowledge reserve or the guidance of professional doctors.
6. Conclusions
At present, before scoliosis surgery in hospitals, the diagnosis is made by the doctor observing the patient’s spinal X-ray. The results of different doctors’ observations may be biased, and the accuracy of the diagnosis report usually depends on the doctor’s experience. Therefore, this paper proposes an end-to-end Lenke classification report automatic generation model for scoliosis that innovatively processes the original diagnosis report into standardized simple sentences for training. In the model, image features are extracted by a deep residual network of fusion channels and spatial attention mechanisms. The improved M-LSTM long and short memory networks are integrated with the attention mechanism to decode the diagnostic text. Finally, in order to verify the effect of the model, the test was carried out on the scoliosis test set. From the perspective of the generated descriptive sentences, it can describe the curvature information of the spine in the spinal X-ray map through standardized and concise sentences and give the Lenke classification results of the spine. The generated descriptive sentences have achieved good scores on the BLEU and CIDEr indexes. In order to further prove the diagnostic significance of the generated diagnostic text, we gave the diagnostic text to five professional clinical doctors for scoring, and the average score was 8.66, which proved that the diagnostic text generated by our model can assist doctors in diagnosis.


