Article

Influence Mechanism of the Interfacial Water Content on Adhesive Behavior in Calcium Silicate Hydrate−Silicon Dioxide Systems: Molecular Dynamics Simulations

School of Architecture and Transportation Engineering, Guilin University of Electronic Technology, Guilin 541004, China
*
Authors to whom correspondence should be addressed.
Appl. Sci. 2023, 13(13), 7930; https://doi.org/10.3390/app13137930
Submission received: 5 June 2023 / Revised: 3 July 2023 / Accepted: 4 July 2023 / Published: 6 July 2023
(This article belongs to the Special Issue Advances in Cement-Based Materials)

Abstract

:
The performance indicators of concrete are mainly determined by the interface characteristics between cement hydration slurry and aggregates. In this study, molecular dynamics technology was used to evaluate the effect of the interfacial water content on the evolution of the interface structure, interaction energy, and mechanical properties of calcium silicate hydrate (C-S-H) and silicon dioxide (SiO2) systems, and the weakening mechanism of the C-S-H/SiO2 interface in a humid environment was revealed. The results showed that all stress–strain curves of C-S-H/SiO2 were divided into the elastic stage and the failure stage. As the interfacial water layer thickened, the molecular weight of the water invading the C-S-H gradually increased, and the desorption of Ca2+ ions in the surface region became significant, while the amount of Ca2+ ions entering the water-layer region increased. The interaction energy of the C-S-H/SiO2 progressively became larger, and the energy ratio (ER) significantly decreased; the tensile strength σc and residual strength σr of C-S-H/SiO2 both showed a downward trend. In summary, a lower water content had a limited impact on the interfacial bonding strength, while the weakening effect enhanced with an increase in the interfacial water content. This phenomenon was also demonstrated in concrete interfacial bond strength experiments.

1. Introduction

As an abundantly utilized type of material in buildings, the industrial energy consumption of cement production has reached 40% of the total energy consumption of human production, and its carbon dioxide emissions account for 8% of the world’s total [1]. The development of high-performance cement−based material, under the same bearing capacity, can effectively reduce material consumption, which is of great significance in achieving sustainable development [2]. Concrete is mainly composed of gel, aggregate, and the interface transition zone (ITZ). The interface transition zone, which is the link between the gel and the aggregate, has a remarkable effect on the overall performance of cementitious composites [3]. The ITZ has a greater porosity than the substrate, as well as being relatively loose, leading to micro-cracks, which seriously affect the durability of the material [4]. Consequently, a large amount of research has been conducted into this problem.
The microscopic properties of concrete ITZ have mainly been evaluated using microstructure identification techniques, such as scanning electron microscopy (SEM). For instance, Varga et al. [5] used the SEM images of concrete ITZ to analyze how the interfacial wetness influenced the adhesive performance of the gel and aggregate pull-off. Shen et al. [6] applied backscattered electron (BSE) imaging and nano-indentation techniques to study ITZ change characteristics during the carbonation of concrete. Using atomic force microscopy (AFM), SEM, and nano−indentation techniques, Xiao et al. [7] discussed the subject−to−mix ratio, the types of aggregate, and the hydration period for interfacial characteristics of recycled concrete ITZ. Tian et al. [8] adopted X-ray computed tomography (XCT) to reconstruct the micromorphology of concrete, and comprehensively examine the impact of the ITZ, pore, and aggregate upon the chloride ions’ diffusivity flux. However, most of the above techniques require relatively specific specimens, and the spatial resolution cannot fully reveal the composition information of the interface microstructure.
The molecular dynamics (MD) technique is a computational simulation tool using the basis of traditional Newtonian mechanics. It has been extensively used in investigating the microstructure and characteristics of cement composites [9,10]. Sanchez et al. [11] utilized molecular dynamics methods to research the atomic interactions, structural changes, and kinetic characteristics at the interface of the C-S-H structures and the graphite structures with various functional groups. They discovered that interfacial interactions are the most predominant role of the electrostatic forces. Yang et al. [12] revealed the weakening mechanism for the adhesive performance at the interface of C-S-H and epoxy resin in a thermal environment from a nanoscale perspective, and found that an increased temperature decreases interfacial interactions. Zhou et al. [13] worked with the atomic interaction mechanism of the common aggregate calcite/silica and C-S-H, and discussed the influence of moisture on the interactions. From the above studies, it is clear that most research works have focused on C-S-H/carbon-based nanomaterial interfaces and C-S-H/polymer interfaces, while only a few studies have examined and considered the effects of the interfacial water molecule content on the adhesive properties of C-S-H/aggregate interfaces.
In this study, the MD technique was employed to evaluate the influence of the interfacial water content on the evolution of the interface structure, the interaction energy, and the mechanical property of the C-S-H/SiO2 system. The C-S-H/SiO2 interfacial weakening mechanism in a humid environment was revealed. These results are crucial for understanding nanoscale gel/aggregate interactions, and for developing high-performance cementitious materials.

2. Computational Simulation Details

2.1. Molecular Model

The approach suggested by Pellenq et al. [14] to establish the amorphous C-S-H structure served as a foundation for the current study; the starting structure for the amorphous C-S-H structure was a supercell from Hamid’s proposed monoclinic Tobermorite-11 Å layered structure. The specific method was as follows. (1) The monoclinic structure of the supercell was transformed into a cubic structure, while the atomic cartesian positions and model dimensions were kept consistent. After this, the C-S-H structure dimensions in x, y, and z were 22.32 Å, 22.17 Å, and 22.77 Å, respectively, and the angles α, β, and γ were all 90°. (2) To match the actual distribution characteristics of the C-S-H silicates chain, as observed in nuclear magnetic resonance (NMR) experiments, some SiO2 groups were randomly removed from the C-S-H structure [14]. (3) The ordered distribution water molecules in this structure were removed, and then water molecules were arbitrarily introduced into the C-S-H structure interlayer region, to reach water saturation using the grand canonical Monte Carlo absorption technique. (4) The saturated models were then relaxed by 1000 ps under the isothermal–isobaric (NPT) ensemble, nearly to equilibrium. Based on the above method, the obtained C-S-H’s molecular formula was (CaO)1.67(SiO2)·(H2O)1.68. Meanwhile, the density of the final structure (2.45 g/cm3), the structure of the silicon chain Qn distribution (Q0 = 11.63%, Q1 = 67.44%, and Q2 = 20.93%), and the average chain length (MCL = 2.62), as shown in Figure 1a, were in agreement with the previous simulations [14] and experimental results [15].
In this research, the silica crystal was utilized to simulate the aggregate, where the sizes of the lattice were x = y = 4.913 Å, z = 5.4052 Å, and the angles of the lattice were α = β = 90°, γ = 120°. To construct the ideal C-S-H/SiO2 interface, additional processing was required for the established C-S-H structure and the selected SiO2 crystal. Firstly, the established C-S-H structure was cut along the [001] direction, so that the z-direction surface was exposed, and the resulting model had the final dimensions x = 43.73 Å, y = 44.25 Å, and z = 47 Å. Secondly, the SiO2 model was also cut along the [001] direction, and supercells were generated in the x- and y-axis directions, until it matched the dimensions of the C-S-H cross-section. Figure 1b displays the established SiO2 model. At last, the C-S-H/SiO2 interface model was completed, after the SiO2 crystal model was placed on the C-S-H interface.
To examine the interfacial water content impact mechanism on the bonding performance of the C-S-H/SiO2 system, the models that had varying water-layer thicknesses (0 Å, 1 Å, 3 Å, and 5 Å) were selected as the study subjects. This is shown in Figure 1d–g, where the preparation of water layers was achieved by the absorption of water molecules within a box of the rated thickness (0 Å, 1 Å, 3 Å, and 5 Å) and its density was established at 1 g/cm3, as seen in Figure 1c.

2.2. Force Field

The choice of force field type directly impacts the precision of molecular dynamics simulations. The combined empirical force field approach (ClayFF + CVFF) has been extensively used, and has proven effective for studying the interfacial properties of cementitious materials with other organic or inorganic materials [16,17]. To analyze the mechanism of interfacial water content on the bonding performance of the C-S-H/SiO2 system, the combined empirical force field approach was utilized in the present investigation.
Both the C-S-H and interface water molecules were given the ClayFF force field. The ClayFF is a reliable general empirical force field, which can simulate the structural performance and dynamical characteristics of the C-S-H and its interfacial properties with precision and efficiency. This force field was applied successfully to the simulation of cementitious materials, and their interatomic interactions at the liquid-phase interface [18,19]. Furthermore, this force field was also employed to simulate the connection between water molecules, along with clay mineral surfaces [20,21].
The SiO2 aggregates were simulated, utilizing the CVFF force field. This force field’s potential functions consist of bond and non-bond interactions, and it mainly contains the calculations of bond length, bond angles, torsion angles, and dihedral angles. In short, simulating the C-S-H/SiO2 system interaction utilizing the combined empirical force field (ClayFF + CVFF) approach was successful.

2.3. Simulation Process

The simulation process was implemented using the Large-scale Atomic/Molecular Massively Parallel Simulator (LAMMPS) software. In this study, the simulation process was separated into equilibrium state simulation and uniaxial stretching simulation phases. Firstly, the dynamic equilibrium of 500 ps was performed using the NPT ensemble. The simulation utilized a time step of 1 fs, and the Nosé–Hoover thermostat was adopted to control a temperature of 300 K, along with pressure at 0 KPa. In order to guarantee the reliability of the equilibrium analysis, relevant data were used from the last 100 ps of the equilibrium state simulation. Secondly, the uniaxial (Z direction) tensile tests were simulated, to analyze the mechanical performance and stretching behavior of different C-S-H/SiO2 systems. The uniaxial tensile load strain rate was 0.001/ps during the tensile tests, and the maximum strain was 0.25. The system’s temperature and time steps were consistent with the equilibrium state simulation process.

3. Results and Discussion

3.1. Local Microstructure Evolution

For research into the impacts of varying interfacial water molecule contents on the C-S-H/SiO2 system, the changes in the z-axis direction sizes of four models with varying interface water-layer thicknesses (0 Å, 1 Å, 3 Å, and 5 Å) after equilibration were counted, as shown in Figure 2. Figure 2a depicts the initial and balance sizes of the C-S-H/SiO2 model along the z-axis for varying water-layer thicknesses. The size of the C-S-H/SiO2 model increased gradually as the interfacial water content rose. However, the change in the C-S-H/SiO2 model’s structural size was inconsistent with the amount by which the interfacial water layer thickened.
The differential size between the initial model and the balanced model is presented in Figure 2b. It is evident that when the interfacial water layer thickened (increasing from 0 Å to 1 Å), the variation in the structure size was less than 1 Å, and the differential size between the initial model and the balanced model was 0.66 Å. When the interfacial water layer thickened (increasing from 0 Å to 3 Å and 5 Å), the differential sizes between the initial model and the balanced model were 1.32 Å and 1.96 Å, respectively. The optimized water-layer thickness changed from 1 Å, 3 Å, and 5 Å to 0.34 Å, 1.68 Å, and 3.04 Å.
In order to disclose the mechanism by which the interfacial water molecule content affects the microstructure of C-S-H/SiO2, this research analyzed the evolution of interfacial water molecules, and the evolution of Ca2+ ions at the C-S-H surface region. A detailed analysis follows.
(1)
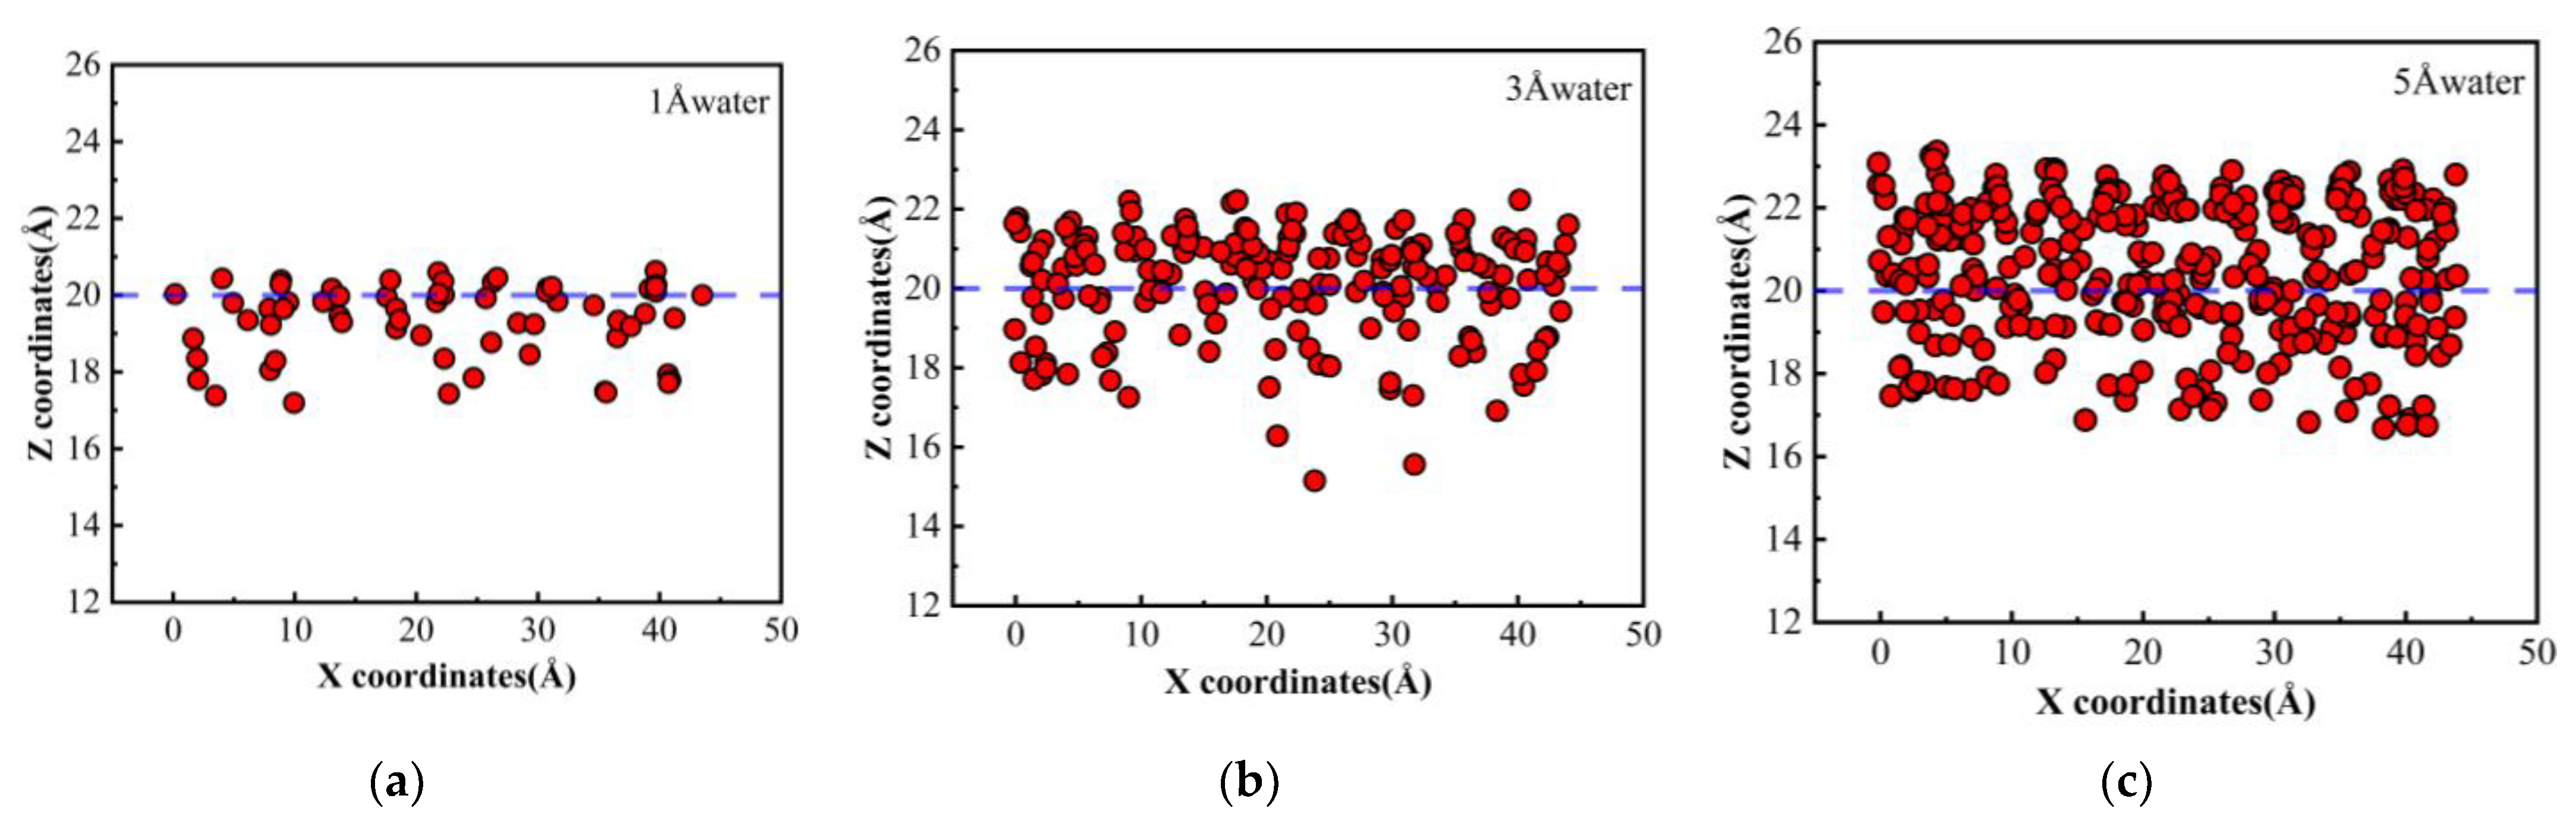
Evolution of interface H2O molecules
Figure 3 is the distribution of the interfacial H2O molecules with varying contents at the X−Z planar in the C-S-H/SiO2 model. As depicted in Figure 3a, when 1 Å-thick interfacial water molecules were introduced, the interfacial water molecules progressively invaded the C-S-H structure. Based on the Wenzel theory, water molecules could fill the solid’s pits on its rough surface, and the C-S-H surface’s hydrophilic nature allowed water molecules to diffuse on its surface [22,23]. As revealed in Figure 3b,c, when the interfacial water layer thickened (increasing from 1 Å to 5 Å), the numerous molecules of H2O formed clusters easily, while exhibiting a high mobility [24] and diffusion coefficient [25]. As a result, the number of H2O molecules that invaded increased gradually.
Because of the invasion of H2O molecules, the change sizes of the C-S-H/SiO2 model were smaller than the change in the water molecule thickness. As more H2O molecules invaded the C-S-H, the difference between the initial and balance sizes of the model structure increased, as the interfacial water layer thickened. This result is consistent with the variation law of the structure size presented in the previous paper (as shown in Figure 2). The interfacial water molecule evolution law has a similarity to the conclusion obtained by Kai et al. [26], suggesting that water molecules can impact structure size by filling interfacial molecular voids.
(2)
Ca2+ ion evolution at the surface region of C-S-H
For the C-S-H/SiO2 system with varying interfacial water contents, Figure 4 depicts the spatial distribution of Ca2+ ions at the surface region of C-S-H. It is thus clear that in the absence of a water layer (0 Å), Ca2+ ions were bound by the surfaces of C-S-H and SiO2 [27], resulting in a majority of the Ca2+ ions being located near the system interface (Figure 4a). However, with 1 Å-thick interfacial water molecules injected, almost all of the Ca2+ ions were found back in the C-S-H structure (Figure 4b). This is because, with the interfacial water molecules introduced, the O atoms within the H2O molecules readily and easily form-bonded to Ca2+ ions [28], resulting in a weaker binding of Ca2+ ions on the SiO2 surface.
With the water-layer thickness increasing from 1 Å to 5 Å, some of the Ca2+ ions underwent desorption, detached from the C-S-H surface region, and entered the aqueous-layer region, as illustrated in Figure 4c,d. When the interfacial water contents were relatively large, the bond of the C-S-H to Ca2+ ions at the surface region was weakened, resulting in the enhancement of the movement ability of Ca2+ ions [27]. As the interfacial water layer thickened, the desorption of Ca2+ ions in the surface region became significant, and the number of Ca2+ ions entering the water layer region increased, leading to a decrease in the cohesion of the interface. The result was similar with the movement behavior of Ca2+ ions between C-S-H substrates and epoxy molecules at varying interfacial water contents, as observed by Kai et al. [26].

3.2. Analysis of Interaction Mechanisms

The correlation between two particles’ spatial positions in a particle system is known as the radial distribution function (RDF) [29]. Its physical meaning lies in the proportion of the atomic density in a system’s local area to its average density. The RDF is determined using the following equation:
g r = 1 4 r 2 π ρ δ r d N r
where dN(r) represents the number of atoms within a region from r to r + δr, ρ represents the system’s average density, and δr is the regional distance. Differences in system structure can lead to different values and trends of RDF, determining the system state. The RDF of an amorphous system has a wave peak only in the proximity, and tends toward 1 as the radius increases [30]. Given that the ClayFF force field employed different potential energy parameters for the interlayer calcium (Cah) and intralayer calcium (Cao) in the C-S-H [31], the Cah dominated the motion of Ca2+ ions within the model. Therefore, the RDF was analyzed in this paper by counting the Cah.
Figure 5 shows the RDF of the different ionic pairs for varying C-S-H/SiO2 interfacial models. The RDF between the ionic pairs all showed apparent peaks in the near range, and the RDF values gradually tended toward 1, as the atomic spacing increased. This conforms to the short-range ordered and long-range disordered structural characteristics of amorphous matter. The peaks of RDF appeared at the same position, indicating that there was no influence from the interfacial water molecule content on the bond lengths of Cah-SiCSH and SiCSH-OCSH. However, in the C-S-H/SiO2 model with varying interfacial water molecule contents, there were some variations in the RDF peaks of the different ion pairs.
When the interfacial water layer thickened (introducing a 1 Å thickness), the RDF peak values of Cah-SiCSH gradually became larger (Figure 5a), indicating that the quantity of Cah ions around the Si ions increased gradually within C-S-H. The Cah-SiCSH RDF peak values showed a decreasing law as the water-layer thickness increased from 1 Å to 5 Å, indicating that the amount of Cah ions close to the Si ions in C-S-H decreased gradually. This result agrees with the Ca2+ distribution in the C-S-H surface region observed by the C-S-H/SiO2 interfacial model for varying thicknesses of the water layer (Figure 4).
As the interfacial water layer thickened, the RDF peak values of the SiCSH-OCSH increased continuously (Figure 5b). It can be seen that an augmentation of the thickness of the water layer resulted in a higher accumulation of O atoms accumulated by Si atoms in a short range. This result demonstrates that as the water layer became thicker, more water molecules intruded into the C-S-H (Figure 3).

3.3. Analysis of Interaction Energy

The bonding performance of the C-S-H/SiO2 systems is typically assessed through the interaction energy between the C-S-H and the aggregate [13]. The interaction energy detailed formulae are as follows:
E C S H a g g r e g a t e = E a g g r e g a t e + E C S H E a g g r e g a t e + C S H
where Eaggregate+CSH represents the C-S-H/aggregate system total energy at balance; Eaggregate represents the aggregate energy; and ECSH represents the C-S-H energy. The positive interaction energy represents repulsion, while the negative interaction energy represents attraction. As the positive value increases, the interface becomes more unstable. The interface adhesion improves as the absolute value of the negative value increases.
In previous experimental studies, the energy ratio (ER) has frequently served as a metric to assess the ramifications of the water content on the adhesive characteristics of asphalt, in relation to the aggregate [32]. This approach derived its underpinnings from the supposition that the water susceptibility is positively correlated to the dry adhesion work, and negatively correlated to the debonding work. On this basis, Xu et al. [33] and Zhou et al. [13] evaluated the bonding performance among C-S-Hs with the aggregate, demonstrating the effectiveness of this method on the microscopic scale. The ER can be computed by Equation (3), the adhesion work among C-S-H with the aggregate is computed with Equation (4), and the work of debonding due to the addition of water to it can be calculated according to Equation (5). The detailed formulae are as follows:
E R = W a d h e s i o n / W d e b o n d i n g w a t e r
W a d h e s i o n = Δ E C S H _ a g g r e g a t e / A
W d e b o n d i n g w a t e r = Δ E a g g r e g a t e w a t e r + Δ E C S H w a t e r / A Δ E C S H a g g r e g a t e / A
where Wadhesion represents the adhesion work among C-S-H structures with the aggregate structure; Wdebonding-water represents the work required to debond the two structures when water is present in the interface region; ΔECSH-water represents the interaction energy of the C-S-H with water; ΔEaggregate-water represents the interaction energy among the aggregate with water; ΔECSH-aggregate refers the interaction energy between the C-S-H and the aggregate; and A refers the area of the interface contact region.
Figure 6 displays the computed interaction energy and energy ratio (ER) of C-S-H/SiO2 in varying moisture contents. From Figure 6a, it can be seen that the interaction energy of the C-S-H/SiO2 progressively became larger as the interfacial water-layer thickened. The occurrence of water at the interface weakened the interfacial interactions, and reduced the bonding capacity. There was a tendency for the interfacial interactions to become weaker as 1 Å-thick interfacial water molecules were introduced, and the interaction energy rose from −532.8849 kcal/mol to −487.7079 kcal/mol. This phenomenon arose because the O atom in the interface water bonded easily with the Ca2+ ions [28,34], resulting in the bond created between the Ca2+ ions in C-S-H and the O in SiO2 being destroyed (as shown in Figure 7). As more Ca2+ ions entered the water layer, the movement ability of Ca2+ ions was enhanced, and it was easier to bond with the O atoms of water. Therefore, as the water layer thickened further (growing to 5 Å), the interfacial interactions became observably weaker, and the energy increased from −487.7079 kcal/mol to −181.4997 kcal/mol. This result coincides with the Ca2+ ion distribution law in Figure 4c,d.
As demonstrated in Figure 6b, the energy ratio (ER) decreased significantly with the increase in the interfacial water-layer thickness. This phenomenon suggests that the interfacial bonding performance between C-S-H and SiO2 aggregates was diminished due to the existence of water molecules. Moreover, experimental studies have confirmed this conclusion. As an example, Shi et al. [35] discovered that the deterioration of the peeling fracture energy was proportional to the amount of moisture at the bonding-layer–concrete interface.

3.4. Analysis of Mechanical Properties

In order to further explore the C-S-H/SiO2 system of mechanical properties subject to the interfacial water content, uniaxial tensile simulation experiments were conducted along the direction of the Z axis in this study. In Figure 8, the C-S-H/SiO2 system stress–strain relation curves obtained for varying water-layer thicknesses are plotted, while the variation in the tensile strength σc and the residual strength σr are discussed. The C-S-H/SiO2 systems stress–strain curves with different water-layer thicknesses were all divided into two stages: the elasticity (OA) stage and the failure (AB) stage (Figure 8a). During the OA stage, the stress values of all C-S-H/SiO2 systems gradually increased and reached a peak value, as the strain increased. During the AB stage, the stress dropped sharply as the tensile strain increased, and then gradually flattened out.
Figure 8b demonstrates that as the interfacial water layer thickened, the C-S-H/SiO2 system tensile strength σc showed a downward trend, indicating that the water molecules presented a weakening effect on the bonding performance. Whilst 1 Å-thick interfacial water molecules were introduced, the decrease in tensile strength σc was smaller, and the strength value decreased from 1.31 GPa to 1.18 GPa. As the water-layer thickness increased to 3 Å and 5 Å, the tensile strength σc decreased significantly, and the strength values decreased to 0.92 GPa and 0.68 GPa, respectively. Visible lower water content had a limited impact on the interfacial bonding strength, while the weakening effect enhanced with the increase in the interfacial water content. This result is consistent with that obtained from the interaction energy (as shown in Figure 6). The simulation results are similar to the mechanisms by which water molecules weaken the adhesive performance of the asphalt–quartz [36], and the effect of the ITZ thickness and strain rate on the mechanical properties of C-S-H/SiO2 systems [37].
However, the tensile strength obtained from the MD simulations is much greater than the experimental results. Gu et al. [38] examined the mechanical properties of the interface between cobblestone aggregate and mortar, and found that the tensile strength of the interface was 1.8 MPa. Jebli et al. [39] obtained a tensile strength of 1.75 MPa for the cement–aggregate interface, after a hydration time of 90 days. This large difference was attributed to the time and space constraints of the MD simulations [40]. Furthermore, the actual influencing factors, such as porosity, were not considered in this simulation.
The residual strength σr exhibits of the material tended to decrease in the case of increasing water-layer thickness (Figure 8b). During the event of a low water content, the C-S-H/SiO2 system exhibited an excellent interfacial bonding performance, and the structure showed good resistance to loading, even after the structure was damaged. As the interfacial water content grew, the interfacial bonding performance of the system was weakened, causing a further reduction in the material residual strength σr, with the strength value decreasing from 0.37 GPa to 0.18 GPa. The simulation results are similar to the mechanisms by which water molecules weaken the adhesive performance of the C-S-H–graphene-oxide [41] and asphalt–aggregate [42] interfaces. Moreover, this phenomenon was verified in the concrete interfacial bond strength experiments by Beushausen et al. [43].

4. Conclusions

  • As the interfacial water content increased, the size of the C-S-H/SiO2 model increased gradually. As the interfacial water layer thickened (increasing from 0 Å to 5 Å), the number of water molecules invading C-S-H increased gradually, leading to an increase in the difference between the initial size and the balanced size of the model structure.
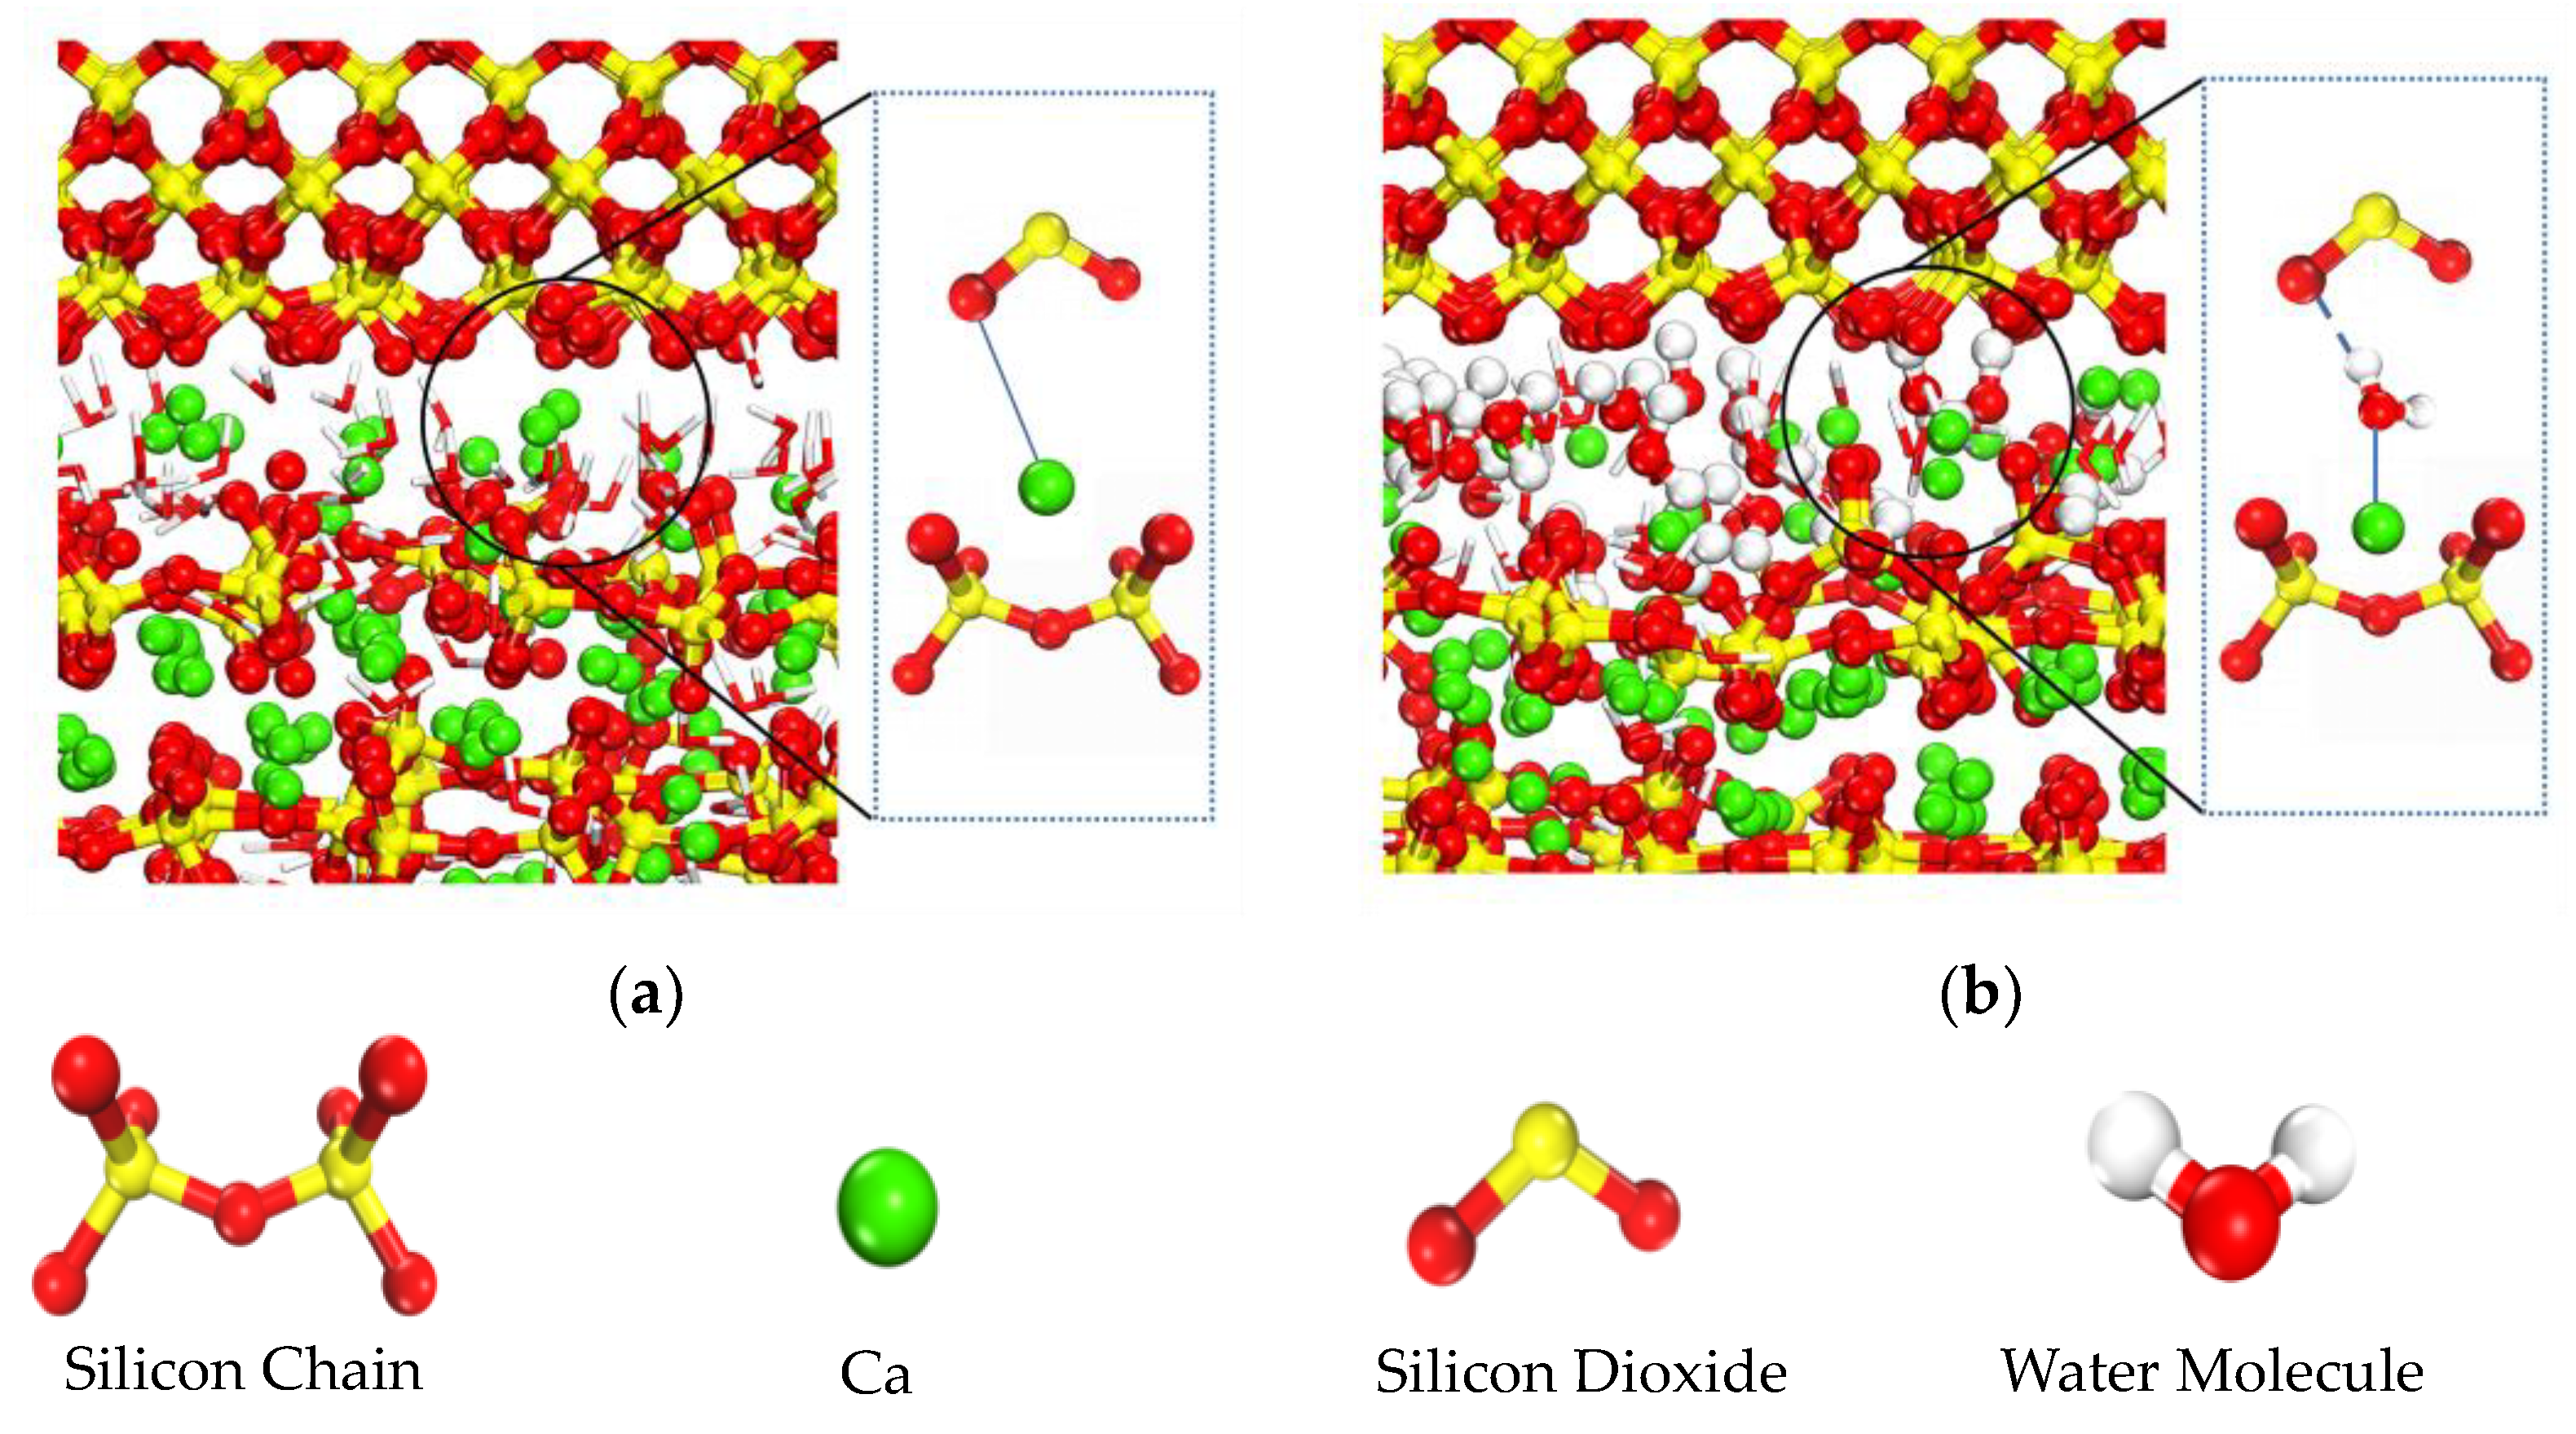
  • With the injection of interfacial water molecules, the O atoms within the H2O molecules easily bonded to Ca2+ ions, resulting in almost all of the Ca2+ ions being located back within the C-S-H. As the interfacial water layer thickened, the Ca2+ ion desorption in the C-S-H surface region became significant, and the number of Ca2+ ions entering the water layer region increased, leading to a decrease in the interface cohesion.
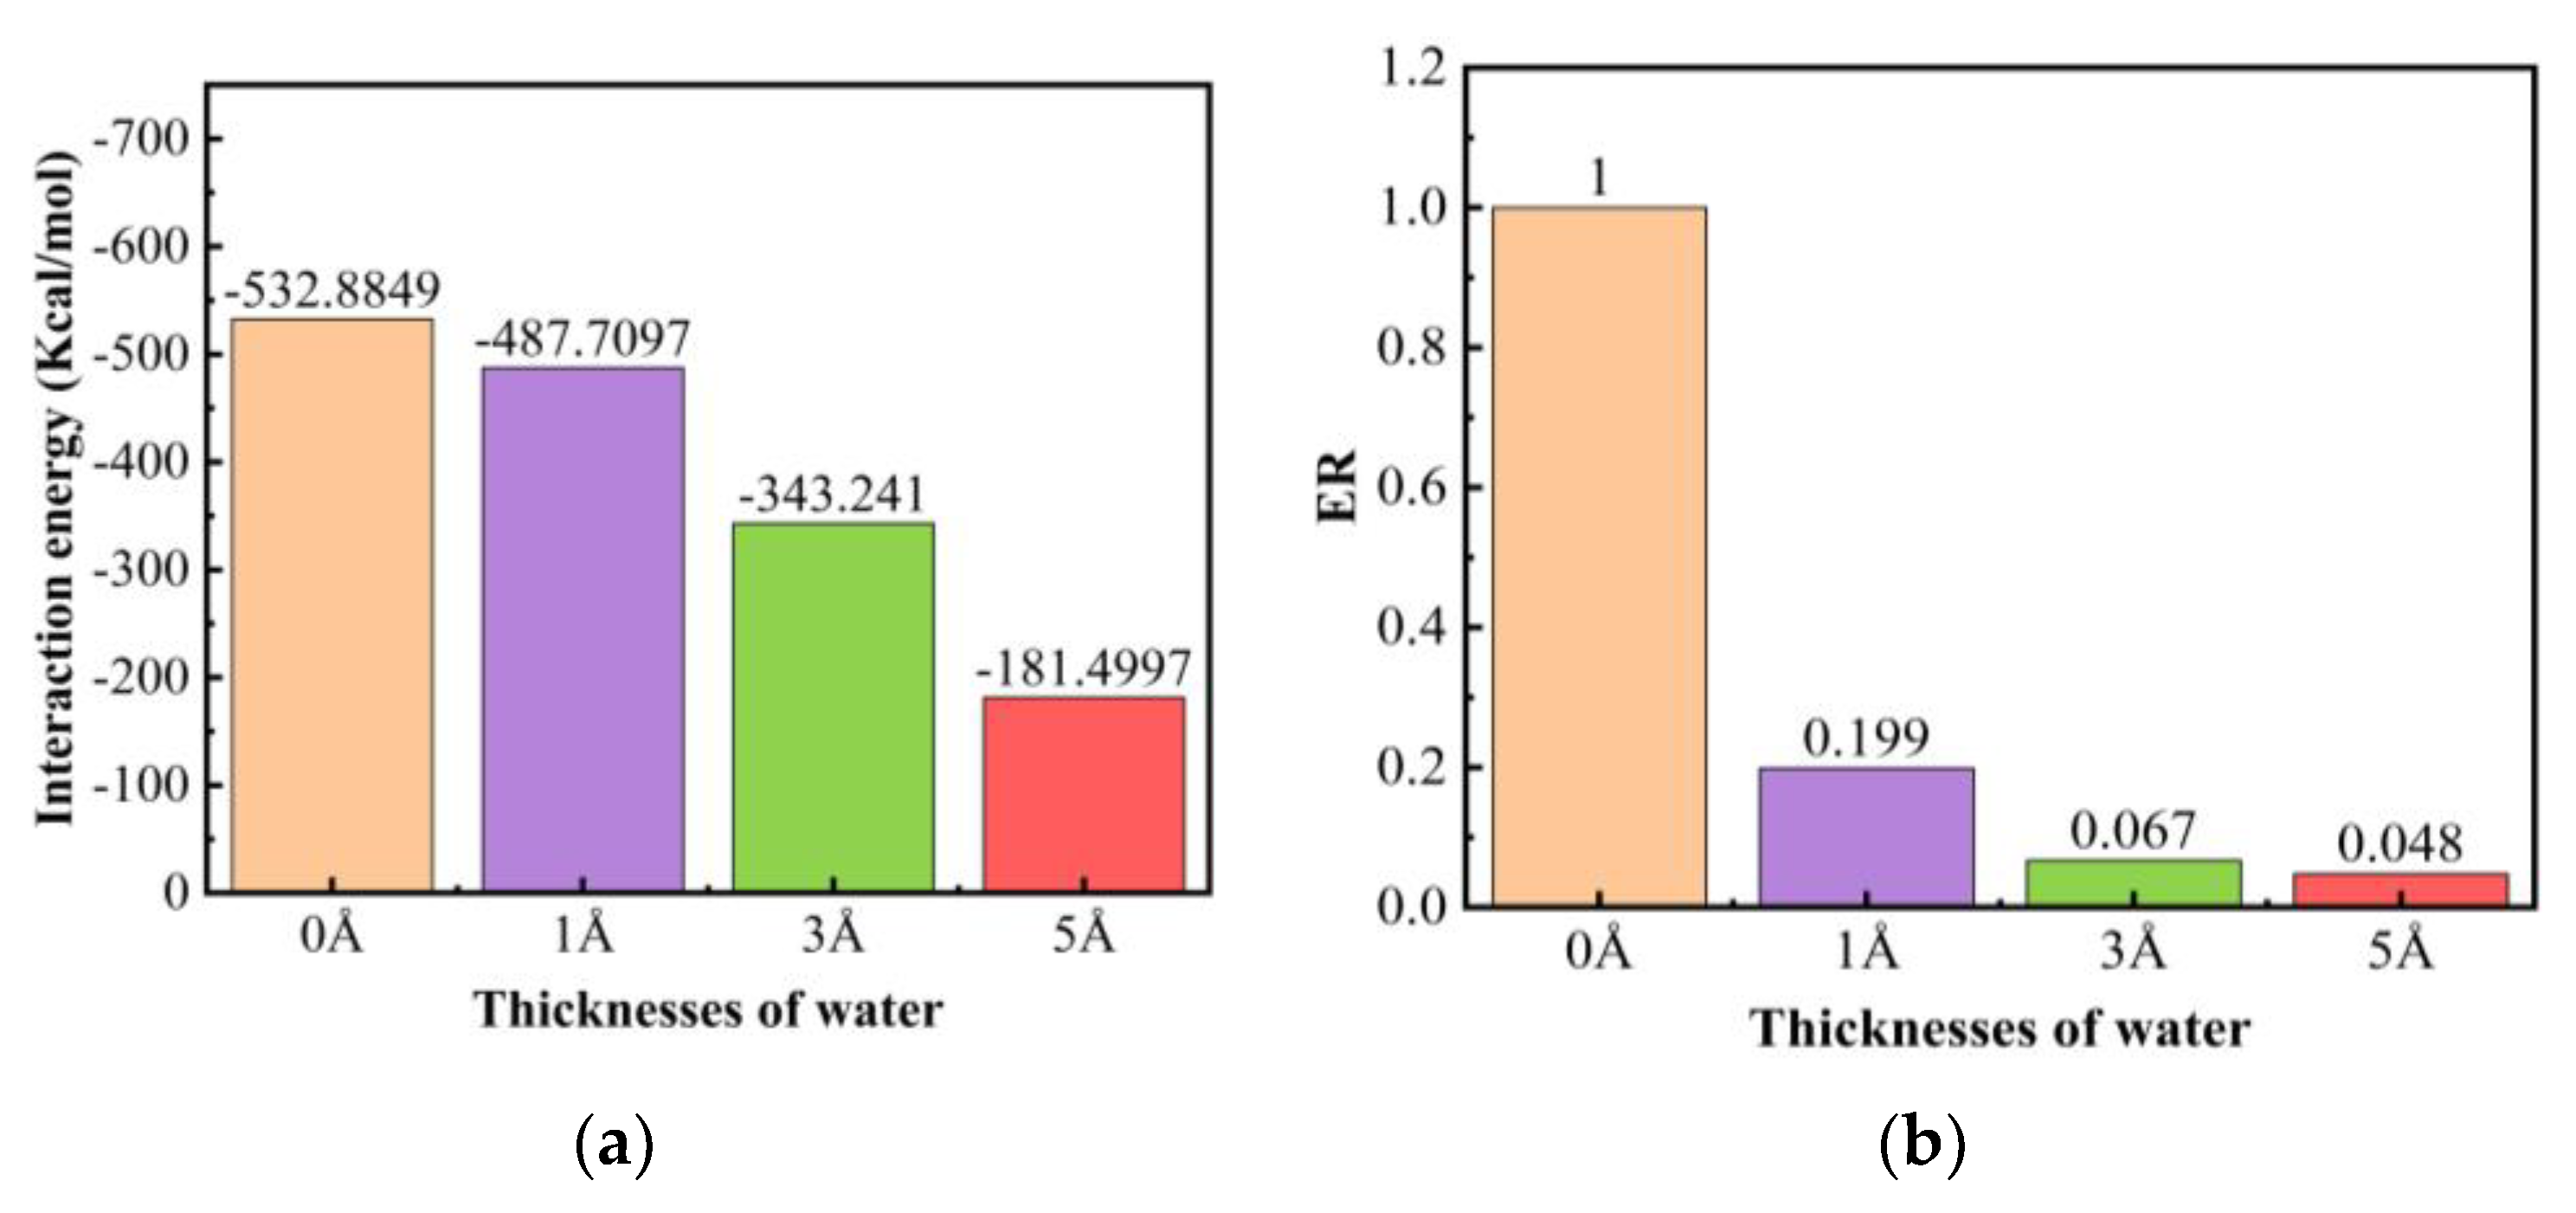
  • As the interfacial water layer thickened, the interaction energy of the C-S-H/SiO2 progressively became larger, and the energy ratio (ER) decreased significantly. The same conclusion has also been confirmed in experimental research.
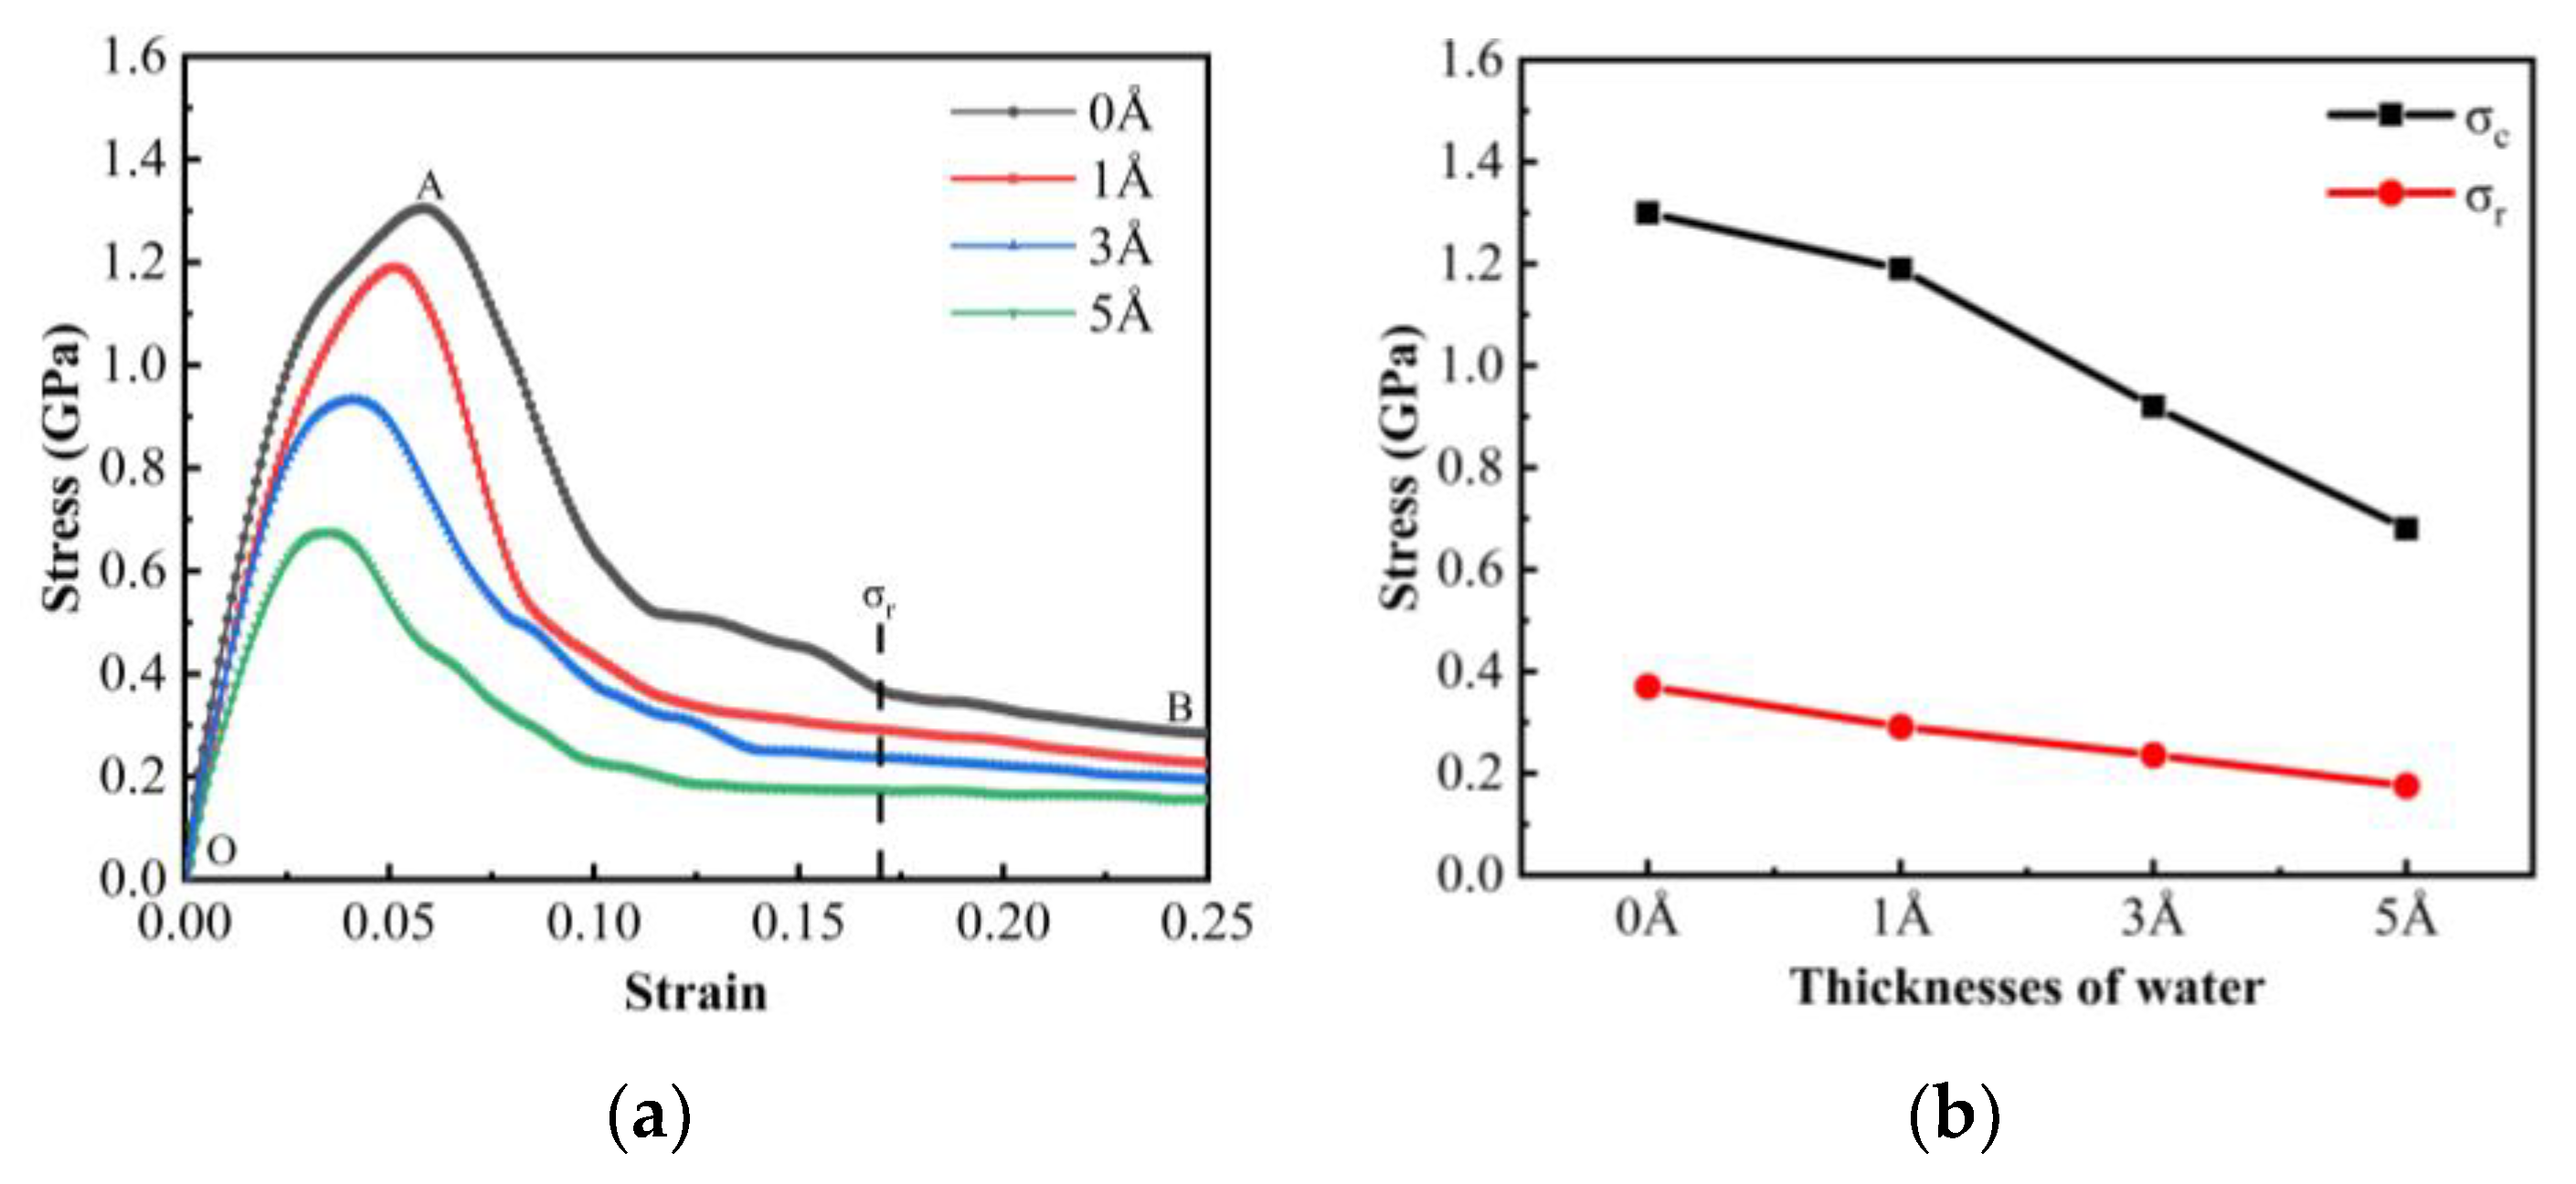
  • The C-S-H/SiO2 system stress–strain curves with varying water-layer thicknesses were all divided into two stages: the elasticity stage and the failure stage. With an increased interfacial water-layer thickness, the tensile strength σc and the residual strength σr of the C-S-H/SiO2 system both showed a downward trend. The weakening effect of a low water content on the interface bonding strength was limited, and as the interfacial water content increased, the weakening effect on the C-S-H/SiO2 was enhanced. This phenomenon has been verified in concrete interfacial bond strength experiments.

Author Contributions

Conceptualization, B.M. and X.H.; methodology, Y.C.; software, Y.C.; validation, B.M. and X.H.; formal analysis, Y.C.; investigation, Y.C.; resources, B.M. and B.Y.; data curation, Y.C.; writing—original draft preparation, Y.C.; writing—review and editing, Y.C. and B.M.; visualization, X.H.; supervision, B.Y.; project administration, B.M.; funding acquisition, B.M. and X.H. All authors have read and agreed to the published version of the manuscript.

Funding

The work was supported by the National Natural Science Foundation of China (No. 12162010), the Science Technology Base and Talent Special Project of Guangxi, China (No. AD19245143), and the Natural Science Foundation of Guangxi, China (No. 2021GXNSFAA220087).

Data Availability Statement

The data used to support the findings of this study are available from the corresponding author upon request.

Conflicts of Interest

The authors declare that they have no known competing financial interests or personal relationships that could appear to have influenced the work reported in this paper.

References

  1. Behera, M.; Bhattacharyya, S.K.; Minocha, A.K.; Deoliya, R.; Maiti, S. Recycled aggregate from C&D waste & its use in concrete-A breakthrough towards sustainability in construction sector: A review. Constr. Build. Mater. 2014, 68, 501–516. [Google Scholar]
  2. Zhang, L.; Yan, J.J.; Li, X. A Review on the Durability of Concrete Structure. Mater. Rep. 2013, 27 (Suppl. S1), 294–297. (In Chinese) [Google Scholar]
  3. Ollivier, J.; Maso, J.; Bourdette, B. Interfacial transition zone in concrete. Advn. Cem. Bas. Mat. 1995, 2, 30–38. [Google Scholar] [CrossRef]
  4. Zhu, Z.G.; Chen, H.S. Overestimation of ITZ thickness around regular polygon and ellipse aggregate. Comput. Struct. 2017, 182, 205–218. [Google Scholar] [CrossRef]
  5. De la Varga, I.; Munoz, J.F.; Bentz, D.P.; Spragg, R.P.; Stutzman, P.E.; Graybeal, B.A. Grout-concrete interface bond performance: Effect of interface moisture on the tensile bond strength and grout microstructure. Constr. Build. Mater. 2018, 170, 747–756. [Google Scholar] [CrossRef]
  6. Shen, Q.Z.; Pan, G.H.; Zhan, H.G. Effect of interfacial transition zone on the carbonation of cement-based materials. J. Mater. Civil. Eng. 2017, 29, 4017020. [Google Scholar] [CrossRef]
  7. Xiao, J.Z.; Li, W.; Sun, Z.H.; Lange, D.A.; Shah, S.P. Properties of interfacial transition zones in recycled aggregate concrete tested by nanoindentation. Cem. Concr. Compos. 2013, 37, 276–292. [Google Scholar] [CrossRef]
  8. Tian, Y.; Chen, C.C.; Jin, N.G.; Jin, X.Y.; Tian, Z.S.; Yan, D.M.; Yu, W. An investigation on the three-dimensional transport of chloride ions in concrete based on X-ray computed tomography technology. Constr. Build. Mater. 2019, 221, 443–455. [Google Scholar] [CrossRef]
  9. He, Y.X.; Ma, B. Molecular dynamics analysis on bending mechanical behavior of alumina nanowires at different loading rates. Trans. Nonferrous Met. Soc. 2022, 32, 3687–3698. [Google Scholar] [CrossRef]
  10. Yang, J.B.; Zhao, Z.Y.; Yin, H. Research Development on Molecular Dynamics of C-S-H Gels. Mater. Rep. 2021, 35, 5095–5101+5121. (In Chinese) [Google Scholar]
  11. Sanchez, F.; Zhang, L. Molecular dynamics modeling of the interface between surface functionalized graphitic structures and calcium–silicate–hydrate: Interaction energies, structure, and dynamics. J. Colloid. Interf. Sci. 2008, 323, 349–358. [Google Scholar] [CrossRef] [PubMed]
  12. Yang, Q.R.; Jing, Z.Q.; Wang, P.; Hou, D.S. Molecular Dynamics Simulation of Temperature Influenced Epoxy/C-S-H Interfacial Bonding Properties. J. Build. Mater. 2022, 25, 1086–1091. (In Chinese) [Google Scholar]
  13. Zhou, Y.; Peng, Z.C.; Huang, J.L.; Ma, T.; Huang, X.M.; Miao, C.W. A molecular dynamics study of calcium silicate hydrates-aggregate interfacial interactions and influence of moisture. J. Cent. South. Univ. 2021, 28, 16–28. [Google Scholar] [CrossRef]
  14. Pellenq, R.J.; Kushima, A.; Shahsavari, R.; Van Vliet, K.J.; Buehler, M.J.; Yip, S.; Ulm, F.J. A realistic molecular model of cement hydrates. Proc. Natl. Acad. Sci. USA 2009, 106, 16102–16107. [Google Scholar] [CrossRef] [PubMed]
  15. Allen, A.J.; Thomas, J.J.; Jennings, H.M. Composition and density of nanoscale calcium-silicate-hydrate in cement. Nat. Mater. 2007, 6, 311–316. [Google Scholar] [CrossRef] [PubMed]
  16. Hou, D.S.; Yang, Q.R.; Wang, P.; Jin, Z.Q.; Wang, M.H.; Zhang, Y.; Wang, X.P. Unraveling disadhesion mechanism of epoxy/CSH interface under aggressive conditions. Cem. Concr. Res. 2021, 146, 106489. [Google Scholar] [CrossRef]
  17. Wang, P.; Qiao, G.; Zhang, Y.; Hou, D.S.; Zhang, J.R.; Wang, M.H.; Wang, X.P.; Hu, X.X. Molecular dynamics simulation study on interfacial shear strength between calcium-silicate-hydrate and polymer fibers. Constr. Build. Mater. 2020, 257, 119557. [Google Scholar] [CrossRef]
  18. Shahsavari, R.; Pellenq, R.J.; Ulm, F.J. Empirical force fields for complex hydrated calcio-silicate layered materials. Phys. Chem. Chem. Phys. 2011, 13, 1002–1011. [Google Scholar] [CrossRef]
  19. Sun, M.; Yang, Q.R.; Zhang, G.Y.; Zhang, Y.; Wang, P.; Hou, D.S.; Liu, Q.F.; Zhang, J.R.; Zhang, J.G. Structure, dynamics and transport behavior of migrating corrosion inhibitors on the surface of calcium silicate hydrate: A molecular dynamics study. Phys. Chem. Chem. Phys. 2021, 23, 3267–3280. [Google Scholar] [CrossRef]
  20. Vasconcelos, I.F.; Bunker, B.A.; Cygan, R.T. Molecular dynamics modeling of ion adsorption to the basal surfaces of kaolinite. J. Phys. Chem. C 2007, 111, 6753–6762. [Google Scholar] [CrossRef]
  21. Hou, D.S.; Li, Z.J. Molecular dynamics study of water and ions transport in nanopore of layered structure: A case study of tobermorite. Micropor. Mesopor. Mat. 2014, 195, 9–20. [Google Scholar] [CrossRef]
  22. Hou, D.S.; Zheng, H.P.; Wang, P.; Wan, X.M.; Wang, M.H.; Wang, H.B. Molecular insight in the wetting behavior of nanoscale water droplet on CSH surface: Effects of Ca/Si ratio. Appl. Surf. Sci. 2022, 587, 152811. [Google Scholar] [CrossRef]
  23. Tang, S.W.; A, H.B.; Chen, J.T.; Yu, W.Z.; Yu, P.; Chen, E.; Deng, H.Y.; He, Z. The interactions between water molecules and C-S-H surfaces in loads-induced nanopores: A molecular dynamics study. Appl. Surf. Sci. 2019, 496, 143744. [Google Scholar] [CrossRef]
  24. Tam, L.H.; Lau, D.; Wu, C. Understanding interaction and dynamics of water molecules in the epoxy via molecular dynamics simulation. Mol. Simulat. 2018, 45, 120–128. [Google Scholar] [CrossRef]
  25. Bahraq, A.A.; Obot, I.B.; Al-Osta, M.A.; Al-Amoudi, O.S.B.; Maslehuddin, M. Molecular-level investigation on the effect of surface moisture on the bonding behavior of cement-epoxy interface. J. Build. Eng. 2022, 61, 105299. [Google Scholar] [CrossRef]
  26. Kai, M.F.; Ji, W.M.; Dai, J.G. Atomistic insights into the debonding of Epoxy-Concrete interface with water presence. Eng. Fract. Mech. 2022, 271, 108668. [Google Scholar] [CrossRef]
  27. Luo, Q.; Li, Y.Y.; Zhang, Z.; Peng, X.J.; Geng, G.Q. Influence of substrate moisture on the interfacial bonding between calcium silicate hydrate and epoxy. Constr. Build. Mater. 2022, 320, 126252. [Google Scholar] [CrossRef]
  28. Hou, D.S.; Ma, H.Y.; Zhu, Y.; Li, Z.J. Calcium silicate hydrate from dry to saturated state: Structure, dynamics and mechanical properties. Acta. Mater. 2014, 67, 81–94. [Google Scholar] [CrossRef]
  29. Levine, B.G.; Stone, J.E.; Kohlmeyer, A. Fast analysis of molecular dynamics trajectories with graphics processing units—Radial distribution function histogramming. J. Comput. Phys. 2011, 230, 3556–3569. [Google Scholar] [CrossRef] [Green Version]
  30. Ma, B.; Zhu, L.W.; Niu, H.H. Effect of Water Molecules on Microstructure and Mechanical Properties of Amorphous C-S-H Gel. J. Mater. Sci. Eng. 2021, 39, 271–276+303. (In Chinese) [Google Scholar]
  31. Lin, W.H.; Fu, J.; Wang, Z.H.; Xin, H. Molecular dynamics Simulations of Mechanical Properties of C-S-H Structures with Varying Calcium-to-Silicon Ratios. Mater. Rep. 2017, 31, 158–163+169. (In Chinese) [Google Scholar]
  32. Bhasin, A.; Little, D.N.; Vasconcelos, K.L.; Masad, E. Surface free energy to identify moisture sensitivity of materials for asphalt mixes. Transp. Res. Rec. 2007, 2001, 37–45. [Google Scholar] [CrossRef]
  33. Xu, G.J.; Wang, H. Study of cohesion and adhesion properties of asphalt concrete with molecular dynamics simulation. Comp. Mater. Sci. 2016, 112, 161–169. [Google Scholar] [CrossRef]
  34. Tong, T.T.; Li, Z.L.; Du, X.Q.; Li, B.; Liu, H.J. Adsorption Law of Interlayer Water of Calcium Silicate Hydrate and Its Effect on the Molecular Structure. Mater. Rep. 2020, 34, 16049–16054. (In Chinese) [Google Scholar]
  35. Shi, J.J.; Pan, Y.F.; Li, H.D.; Fu, J. Effects of water immersion on the adhesion between adhesive layer and concrete block. Adv. Civ. Eng. 2019, 2019, 7069757. [Google Scholar] [CrossRef]
  36. Wang, H.; Lin, E.Q.; Xu, G.J. Molecular dynamics simulation of asphalt-aggregate interface adhesion strength with moisture effect. Int. J. Pavement Eng. 2015, 18, 414–423. [Google Scholar] [CrossRef]
  37. Wu, H.T.; Pan, J.W.; Wang, J.T. Mechanical properties of interface between C-S-H and silicon dioxide: Molecular dynamics simulations. J. Mater. Res. Technol. 2022, 21, 3678–3685. [Google Scholar] [CrossRef]
  38. Gu, X.L.; Hong, L.; Wang, Z.L.; Lin, F. Experimental study and application of mechanical properties for the interface between cobblestone aggregate and mortar in concrete. Constr. Build. Mater. 2013, 46, 156–166. [Google Scholar] [CrossRef]
  39. Jebli, M.; Jamin, F.; Malachanne, E.; Garcia-Diaz, E.; El Youssoufi, M.S. Experimental characterization of mechanical properties of the cement-aggregate interface in concrete. Constr. Build. Mater. 2018, 161, 16–25. [Google Scholar] [CrossRef] [Green Version]
  40. Lau, D.; Jian, W.; Yu, Z.C.; Hui, D. Nano-engineering of construction materials using molecular dynamics simulations: Prospects and challenges. Compos. Part. B-Eng. 2018, 143, 282–291. [Google Scholar] [CrossRef]
  41. Zhang, Y.; Yang, T.J.; Jia, Y.T.; Hou, D.S.; Li, H.B.; Jiang, J.Y.; Zhang, J.R. Molecular dynamics study on the weakening effect of moisture content on graphene oxide reinforced cement composite. Chem. Phys. Lett. 2018, 708, 177–182. [Google Scholar] [CrossRef]
  42. Sun, W.; Wang, H. Moisture effect on nanostructure and adhesion energy of asphalt on aggregate surface: A molecular dynamics study. Appl. Surf. Sci. 2020, 510, 145435. [Google Scholar] [CrossRef]
  43. Beushausen, H.; Höhlig, B.; Talotti, M. The influence of substrate moisture preparation on bond strength of concrete overlays and the microstructure of the OTZ. Cem. Concr. Res. 2017, 92, 84–91. [Google Scholar] [CrossRef]
Figure 1. Diagrammatic sketch of structures: (a) C-S-H gel; (b) SiO2; (c) 5 Å thickness water; (dg) C-S-H/SiO2 system featuring a varying interfacial water-layer thickness (0 Å, 1 Å, 3 Å, 5 Å). (The O atoms, Si atoms, Ca atoms, and H atoms are represented by red balls, yellow balls, green balls, and white balls, respectively).
Applsci 13 07930 g001
Figure 2. (a) The initial and balance sizes for the C-S-H/SiO2 model along the z-axis for varying water-layer thicknesses; (b) the differential size between the initial model and the balanced model.
Applsci 13 07930 g002
Figure 3. The distribution of interfacial H2O molecules with varying contents at the X−Z planar in the C-S-H/SiO2 model (a) 1 Å; (b) 3 Å; (c) 5 Å. (The red spheres represent the positions of interfacial H2O molecules, and the C-S-H surface positions are indicated by the blue dashed lines).
Applsci 13 07930 g003
Figure 4. The spatial distribution of Ca2+ ions at the surface region of the C-S-H. (a) 0 Å; (b) 1 Å; (c) 3 Å; (d) 5 Å. (The green spheres represent the position of Ca2+ ions in the X−Z planar, and the C-S-H surface positions are indicated by blue dashed lines).
Applsci 13 07930 g004
Figure 5. Radial distribution functions (RDFs) of the different ionic pairs for different C-S-H/SiO2 interfacial models: (a) Cah-SiCSH; (b) SiCSH-OCSH.
Applsci 13 07930 g005
Figure 6. (a) Interaction energy of C-S-H/SiO2; (b) energy ratio (ER).
Applsci 13 07930 g006
Figure 7. Schematic diagram of interfacial connection (a) 0 Å water; (b) 1 Å water.
Applsci 13 07930 g007
Figure 8. (a) The C-S-H/SiO2 system stress–strain curves; (b) tensile strength σc and residual strength σr.
Applsci 13 07930 g008
Disclaimer/Publisher’s Note: The statements, opinions and data contained in all publications are solely those of the individual author(s) and contributor(s) and not of MDPI and/or the editor(s). MDPI and/or the editor(s) disclaim responsibility for any injury to people or property resulting from any ideas, methods, instructions or products referred to in the content.

