
Degradation of Hydraulic System due to Wear Particles or Medium Test Dust

Abstract
:1. Introduction
2. Materials and Methods
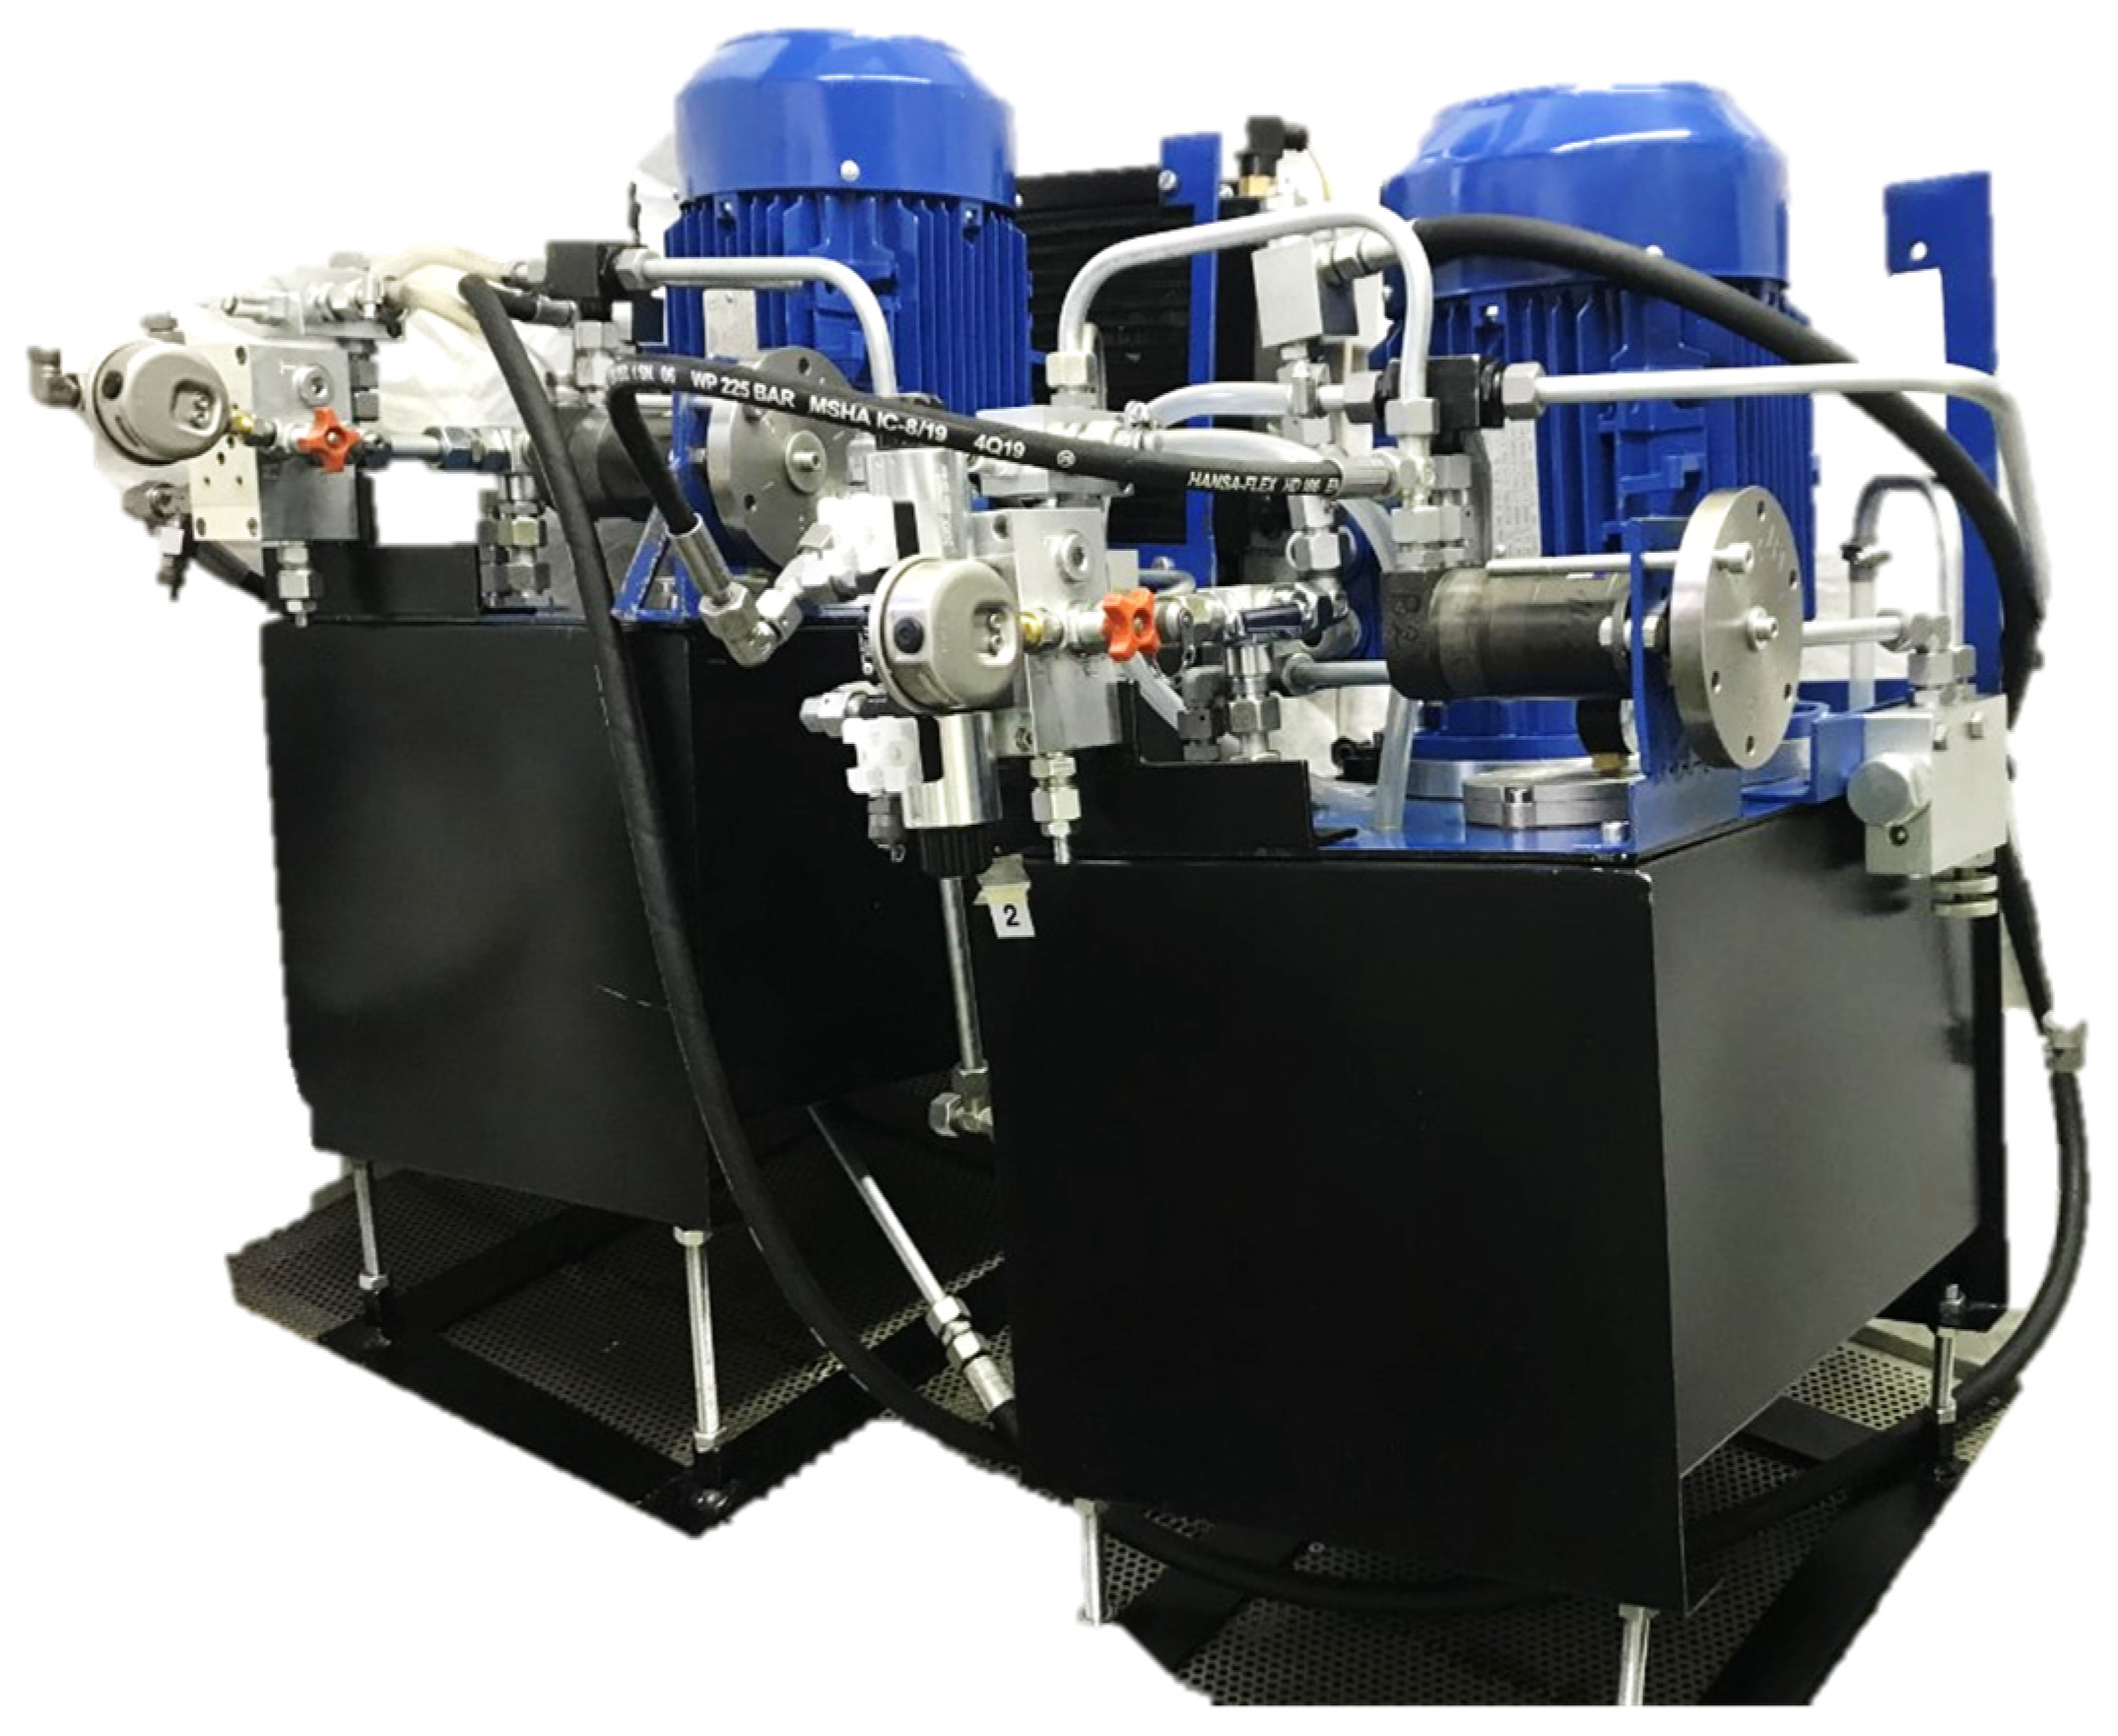
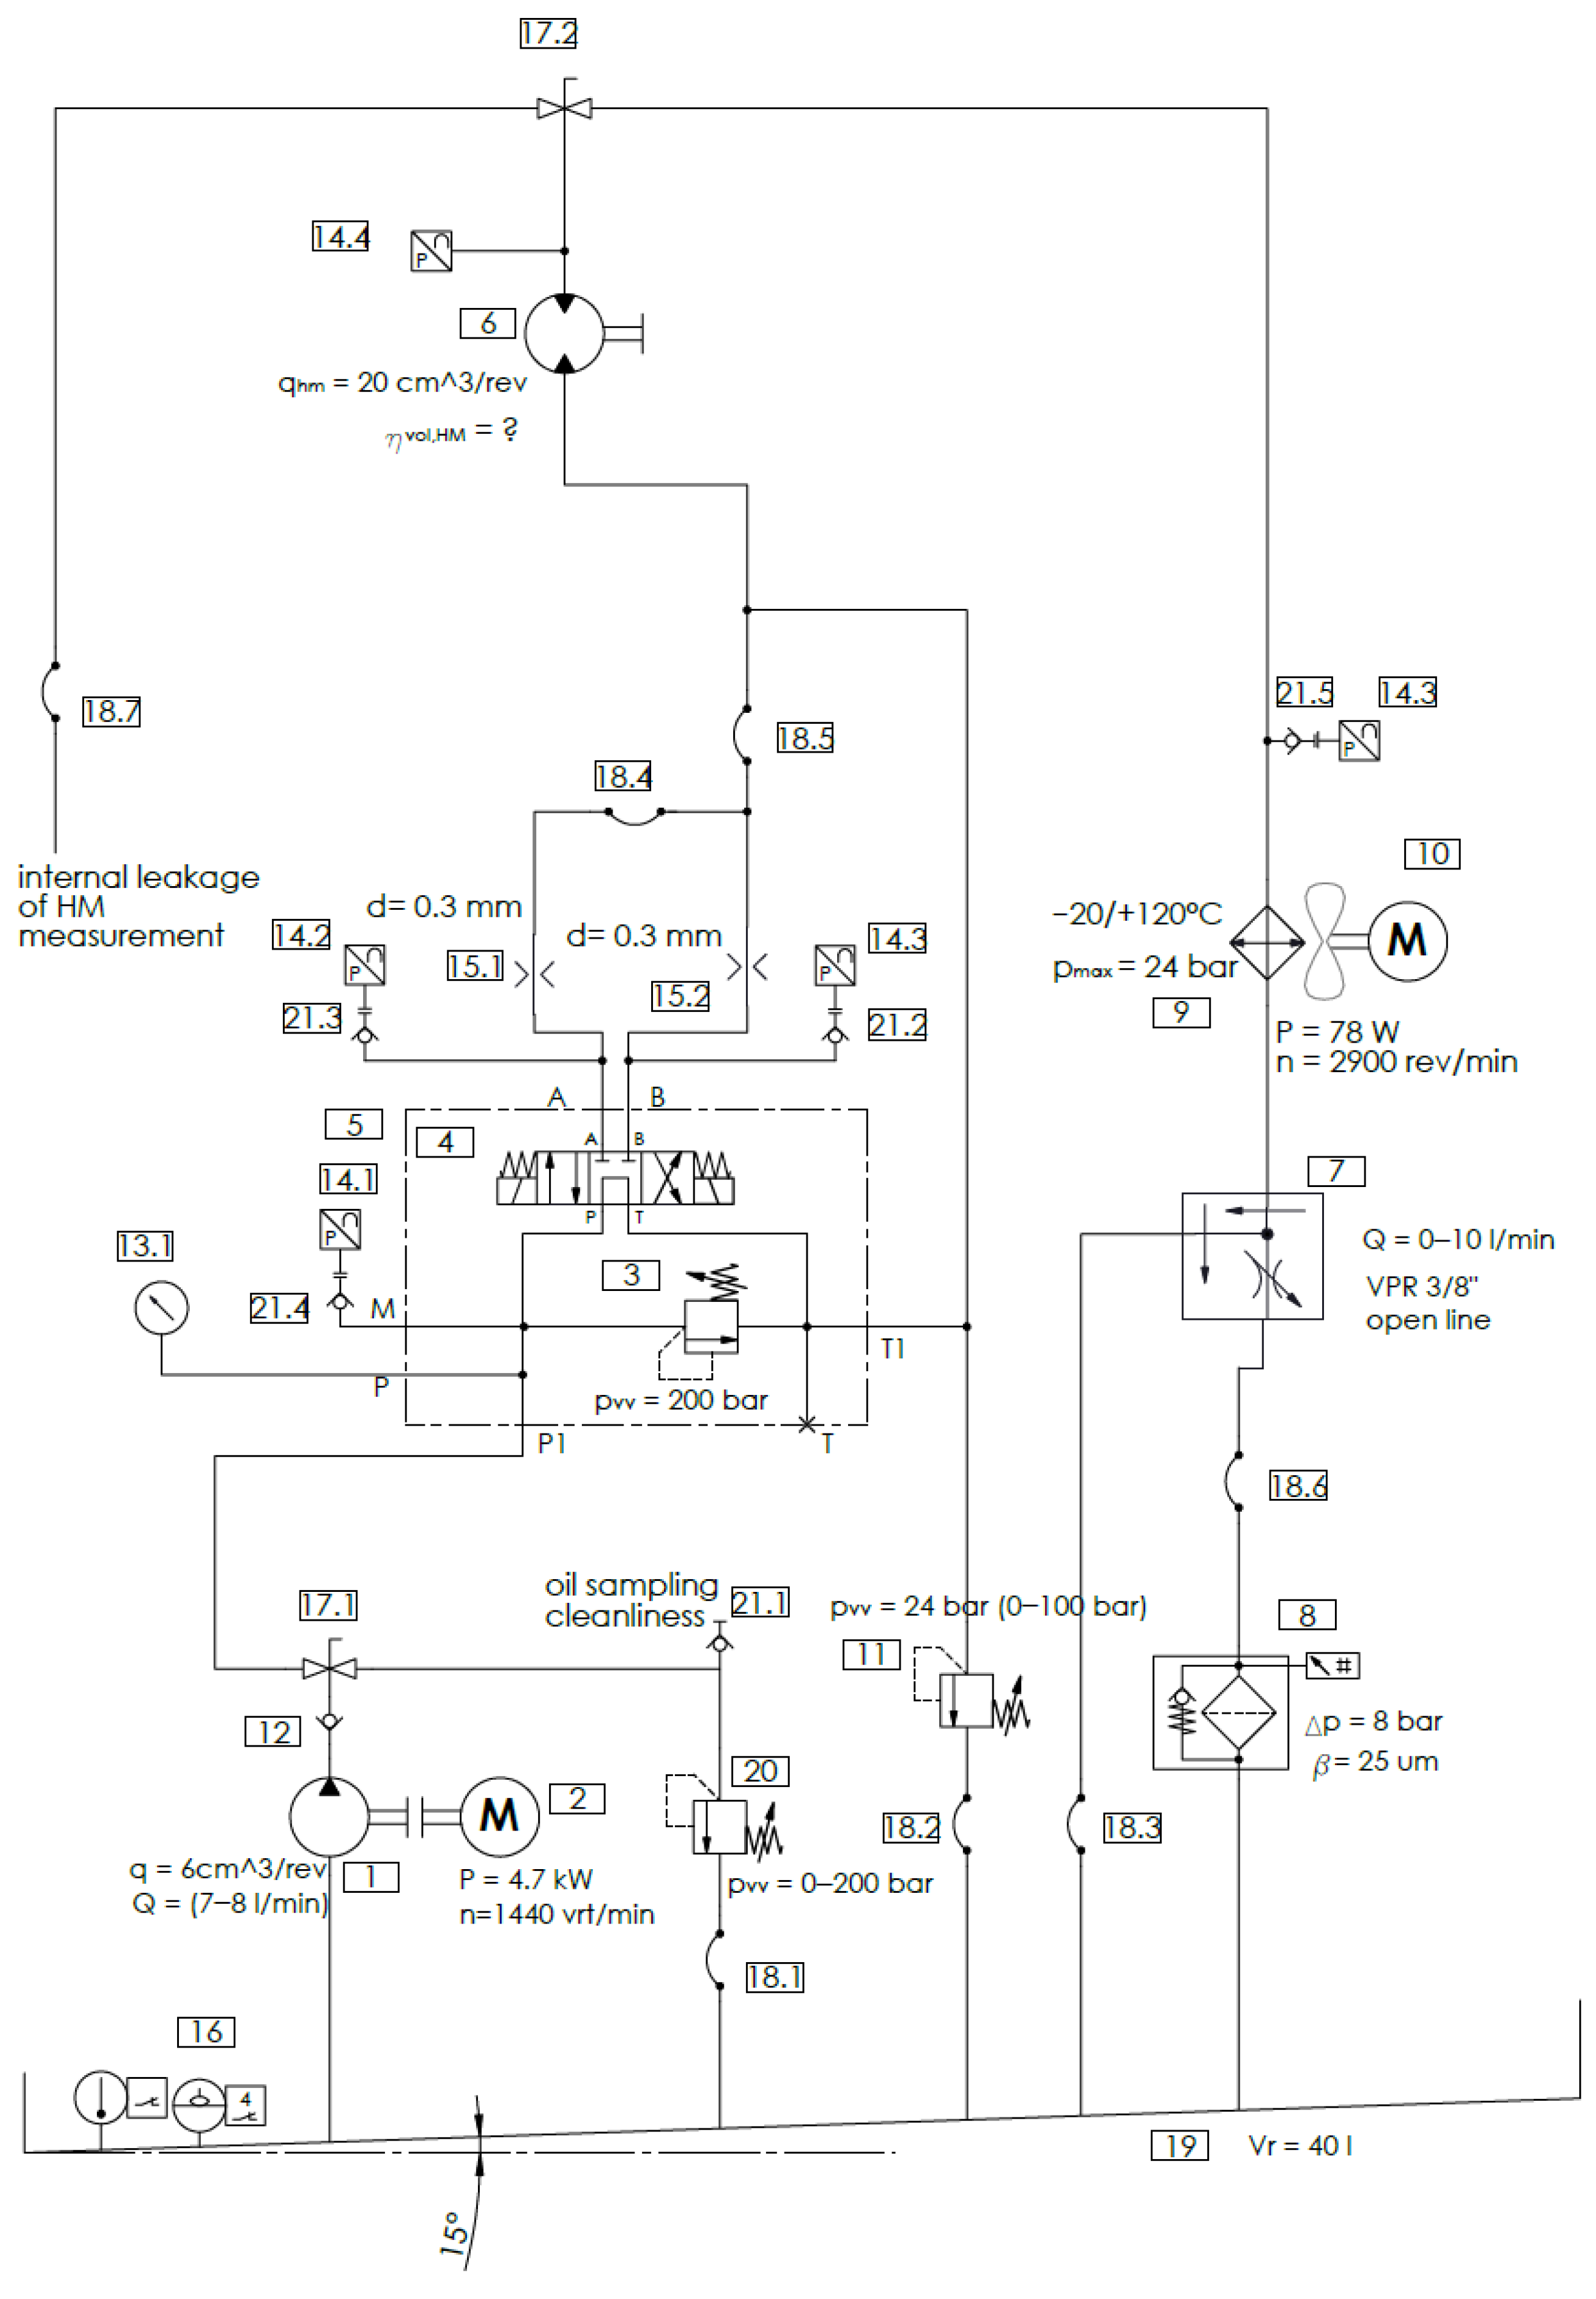
2.1. Test Rig
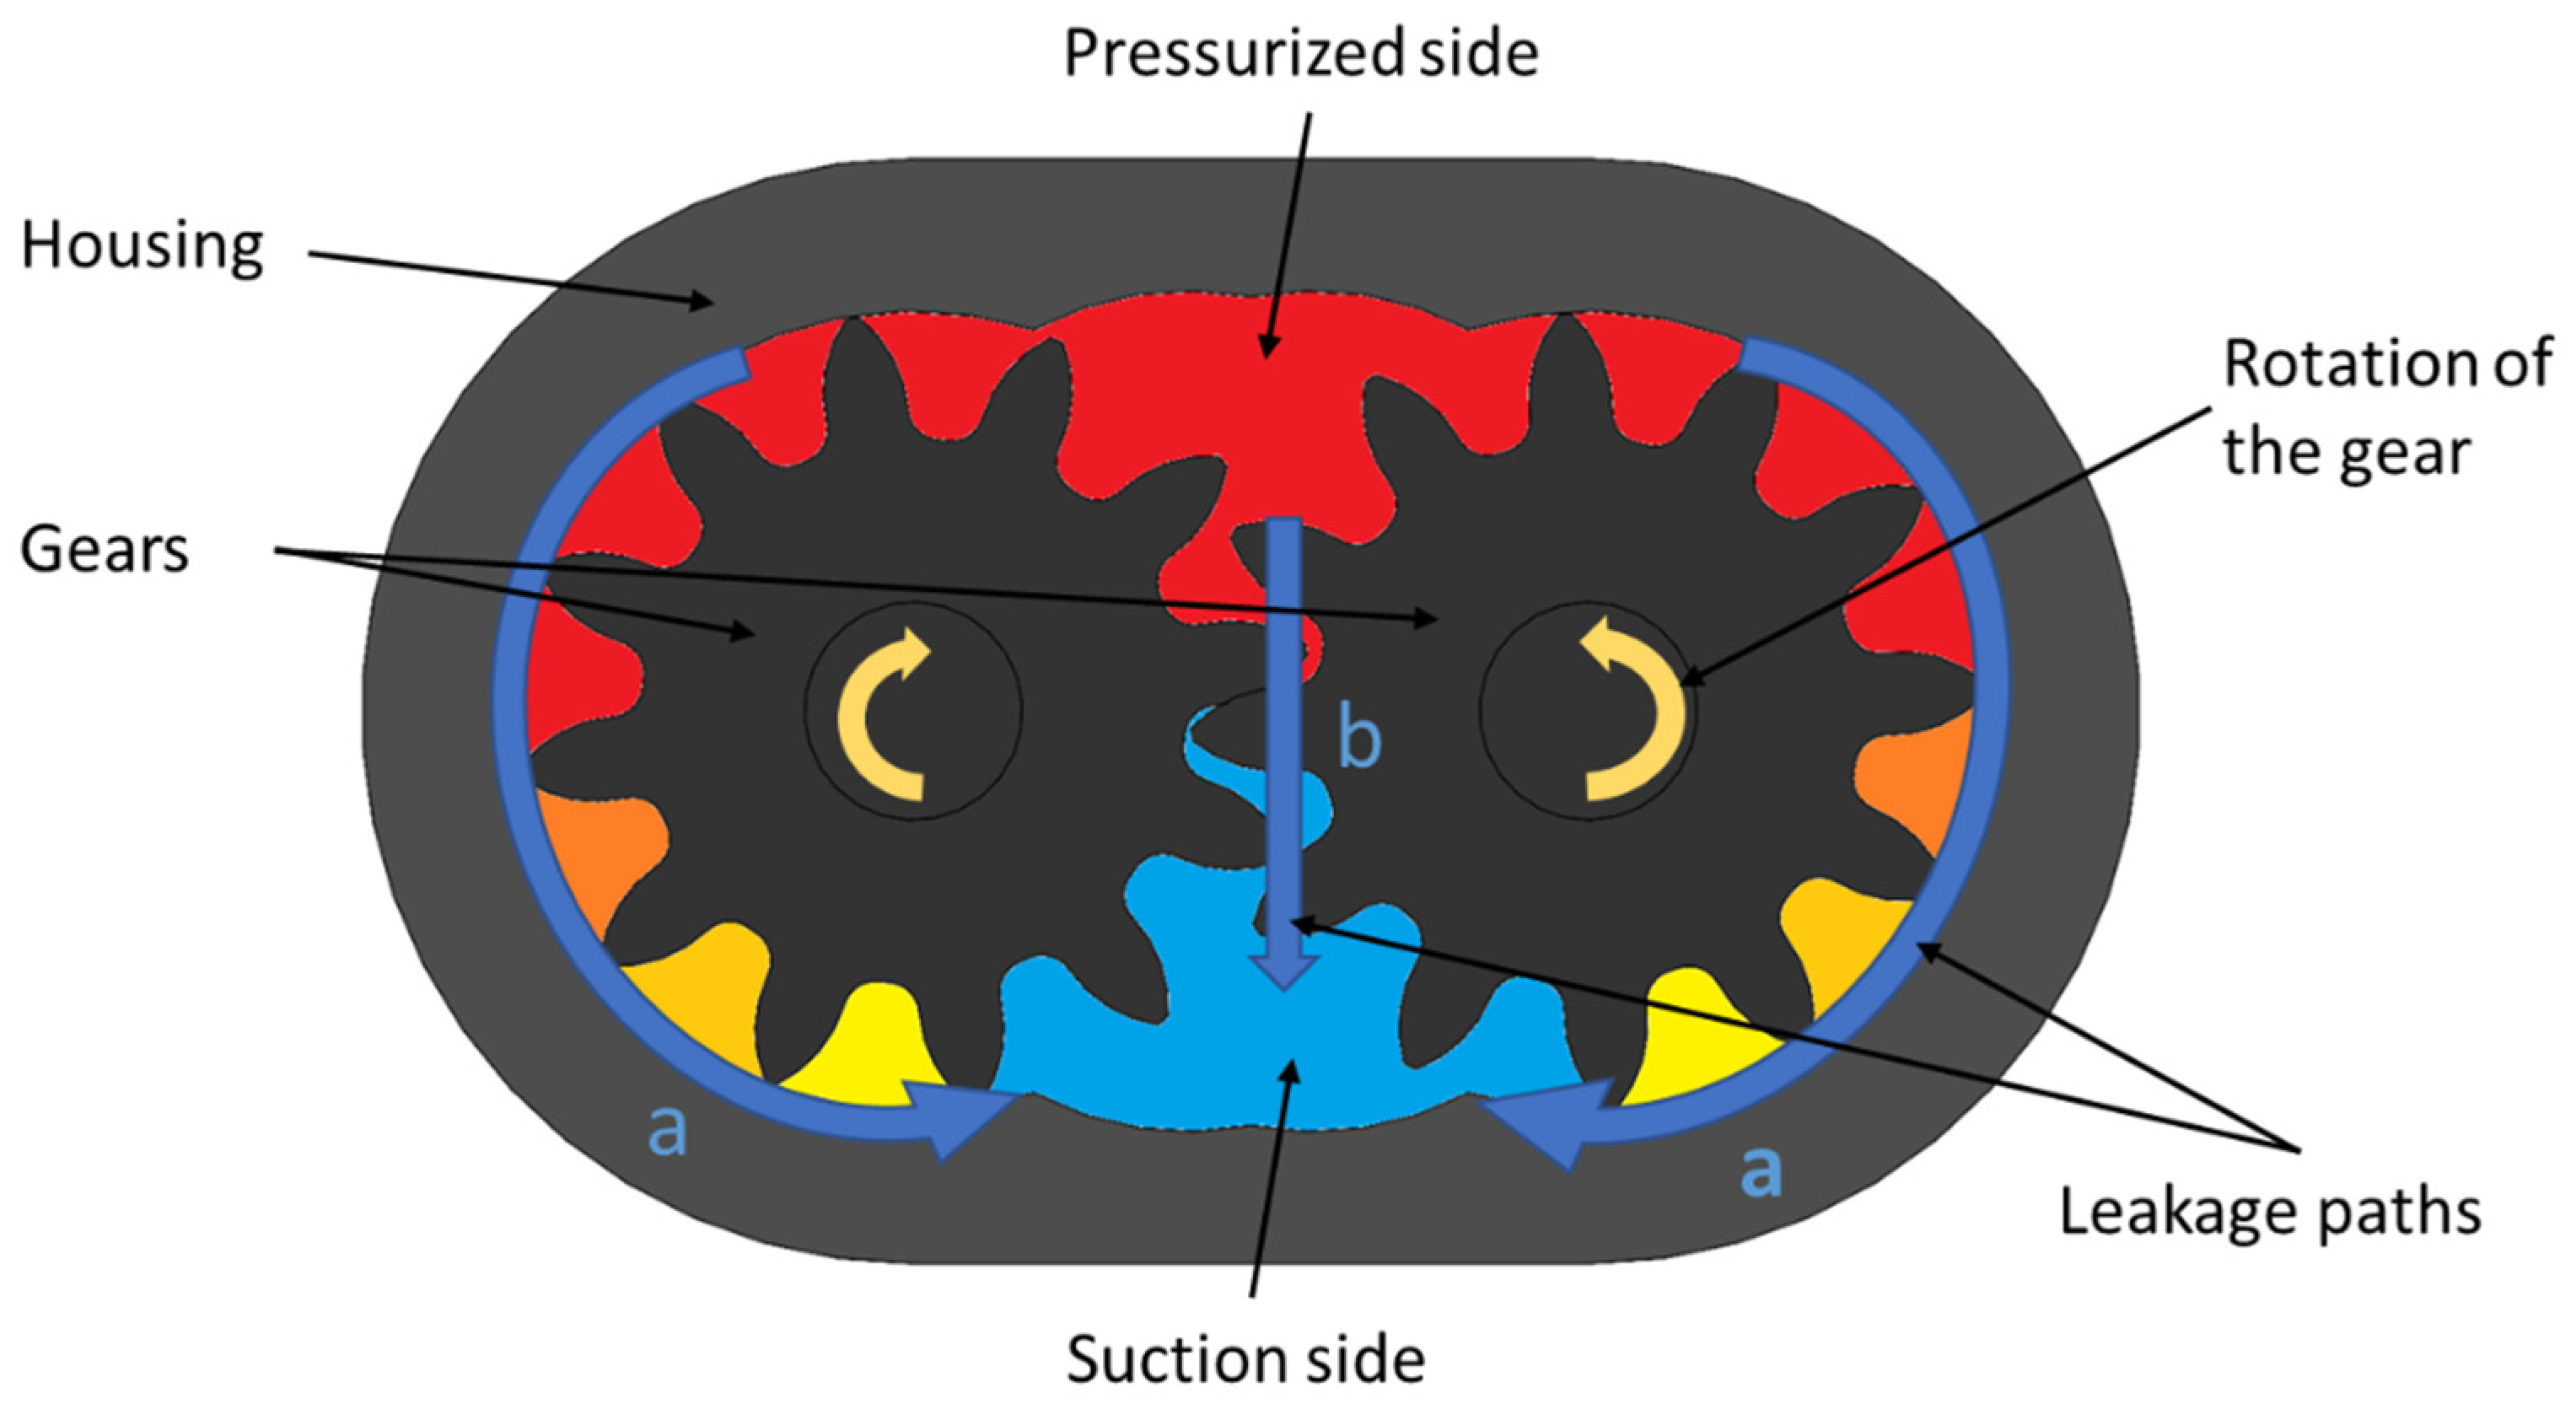
2.2. Hydraulic External Gear Pump—Specimen 1
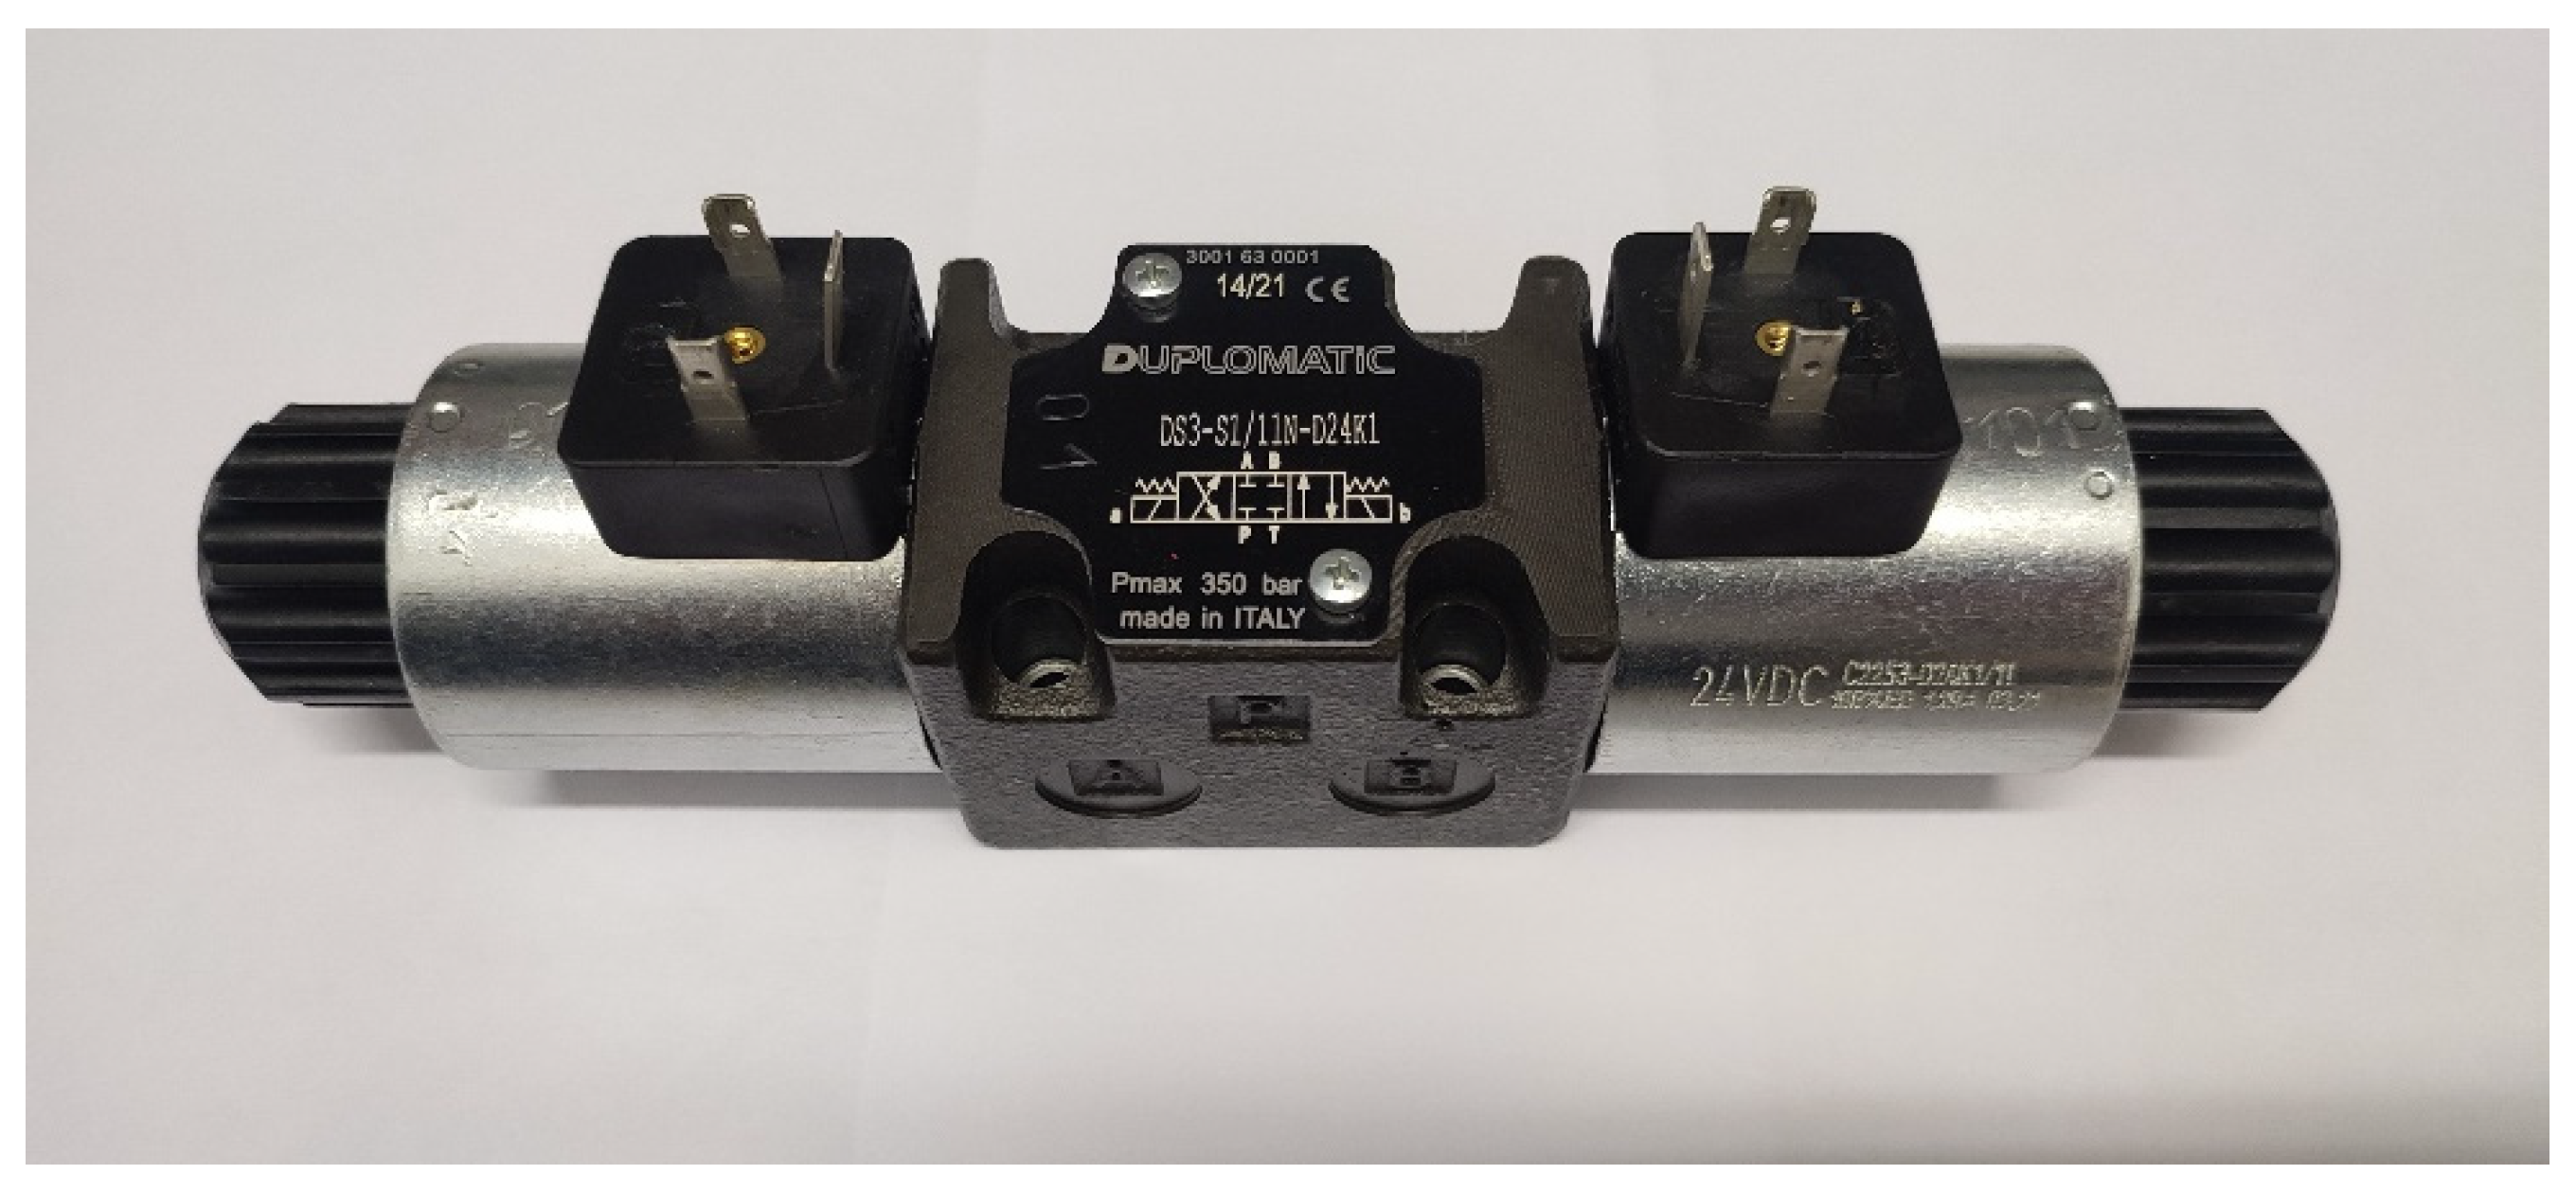
2.3. Hydraulic Directional 4/3 Valve—Specimen 2
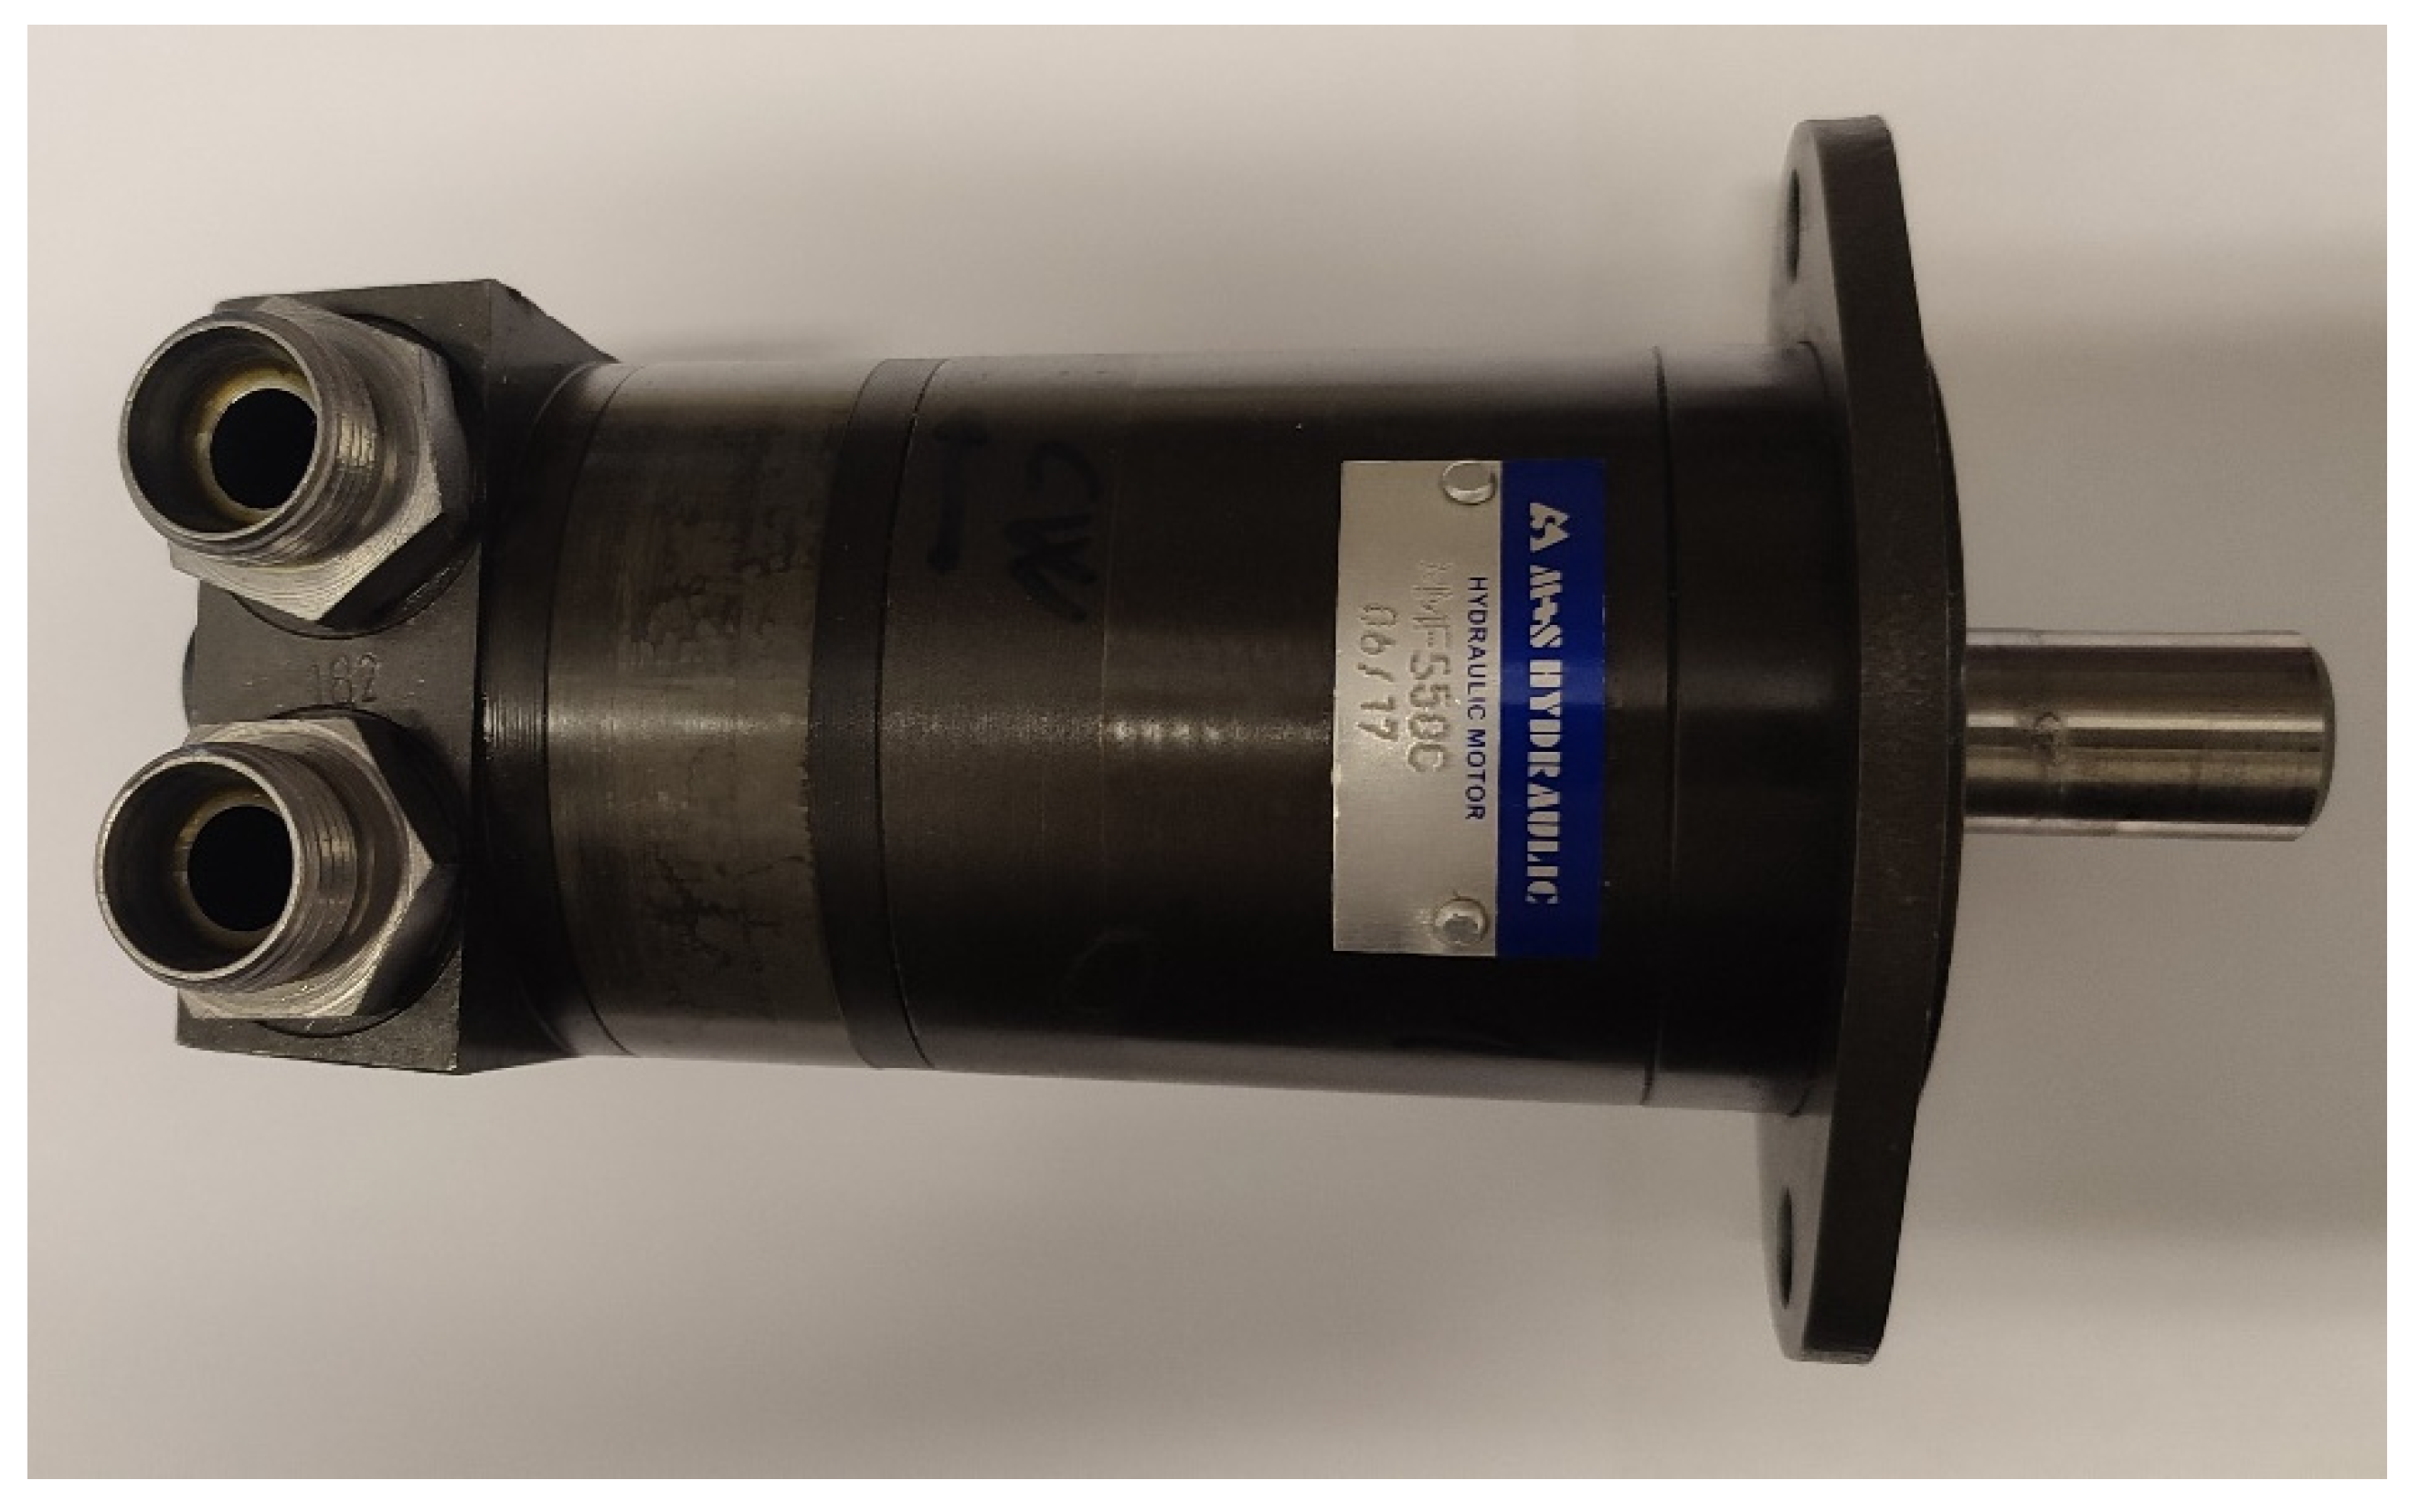
2.4. Hydraulic Motors—Specimen 3
3. Results
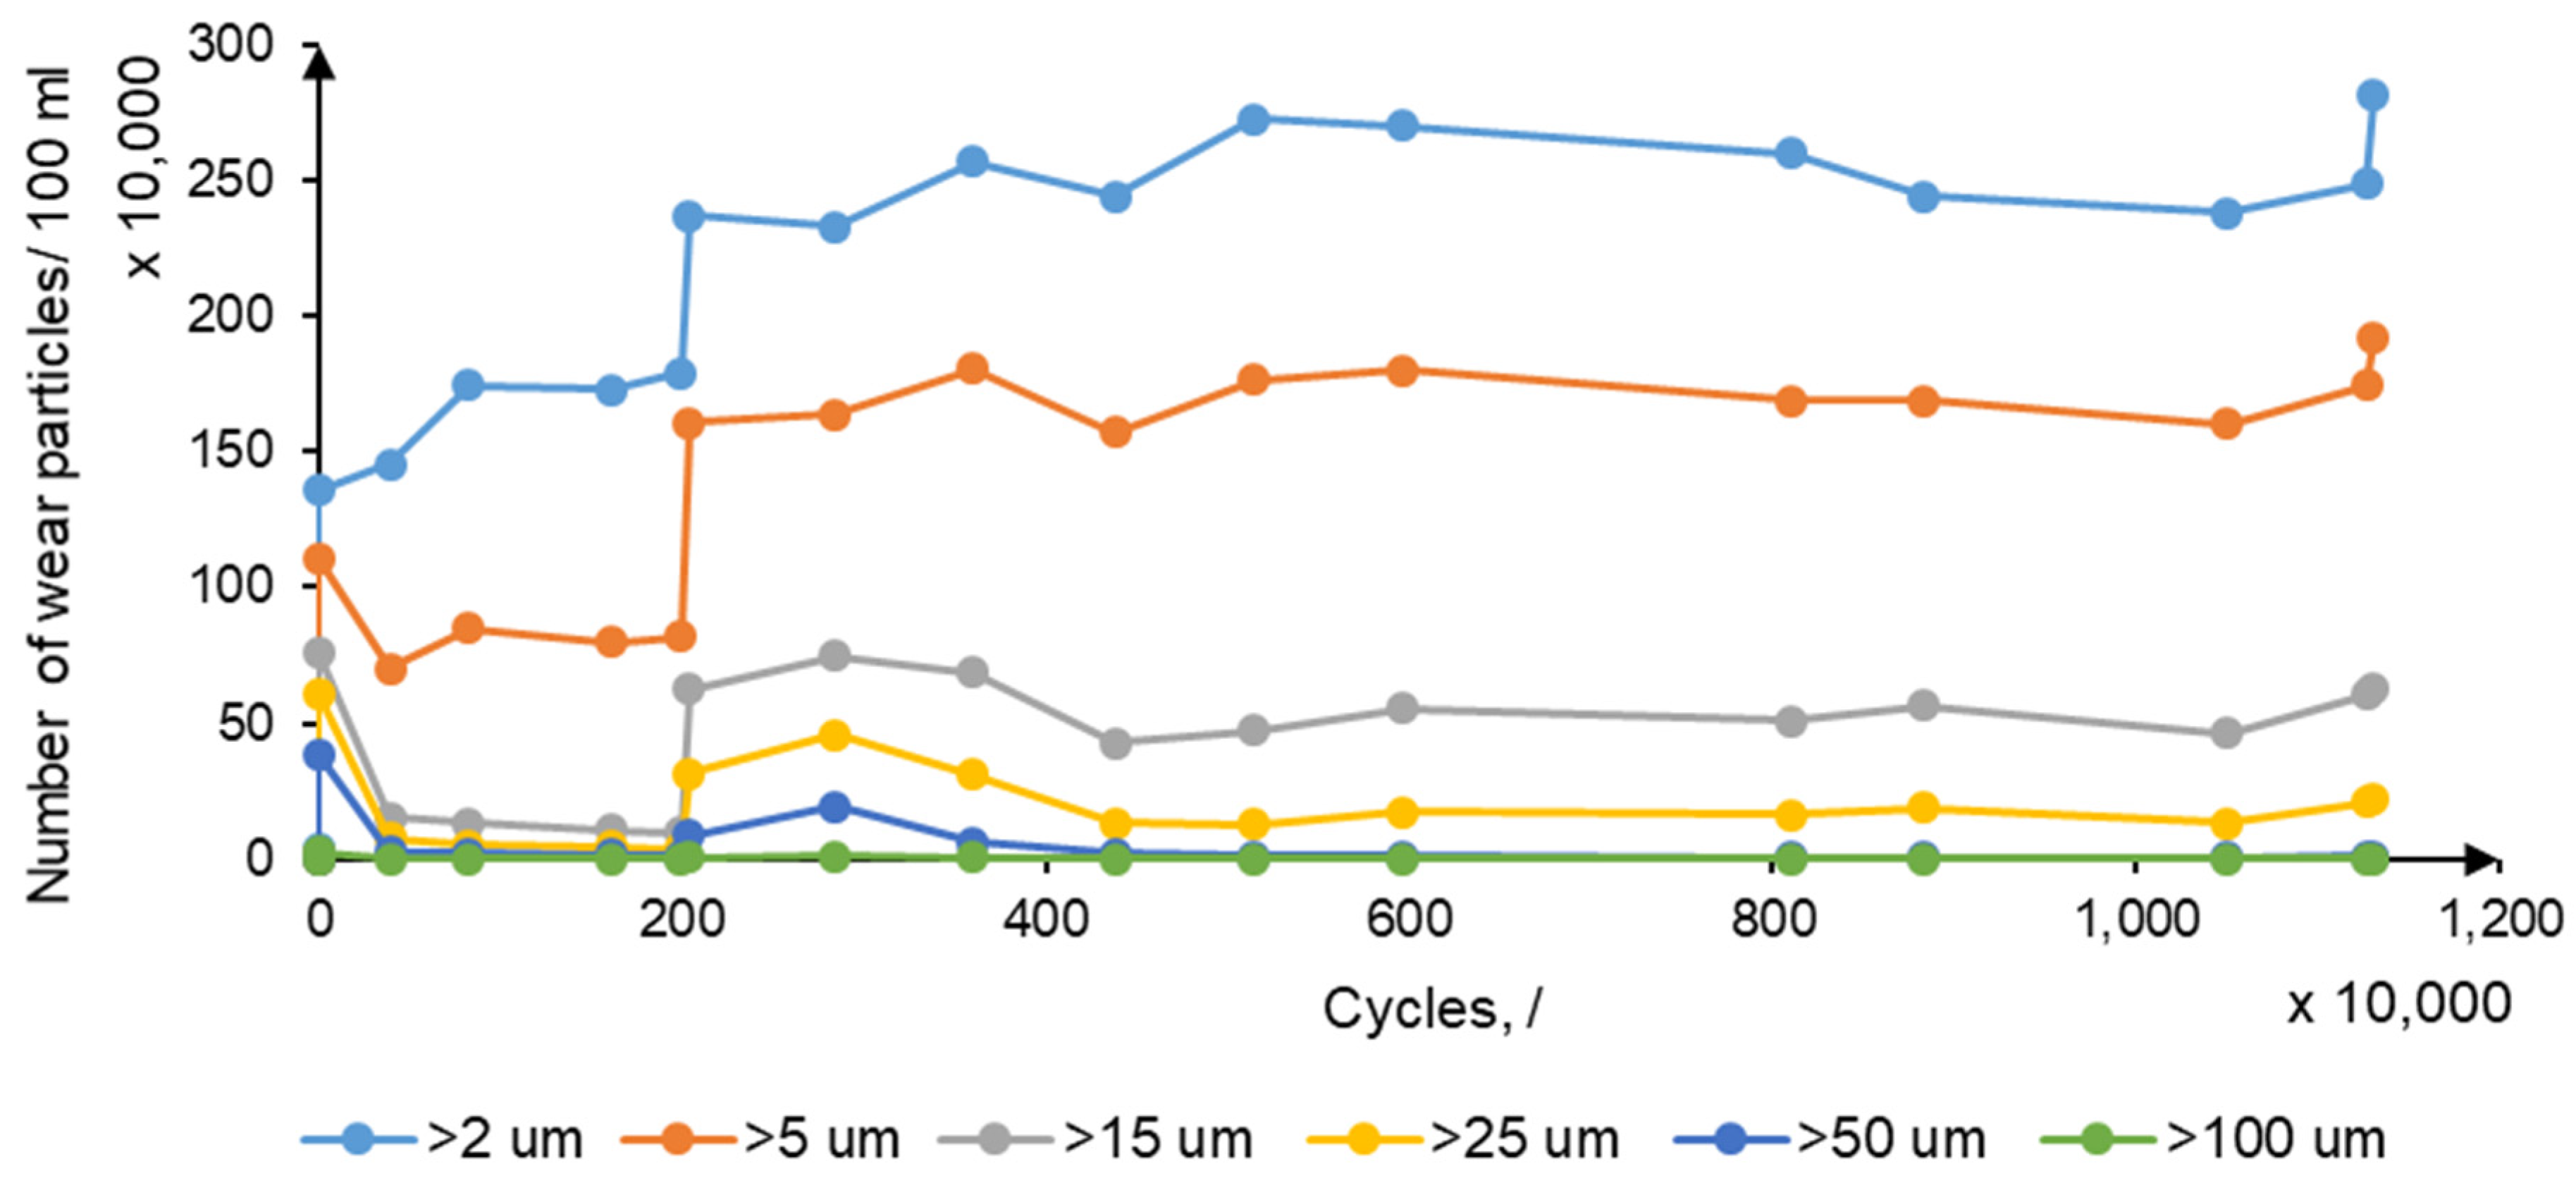
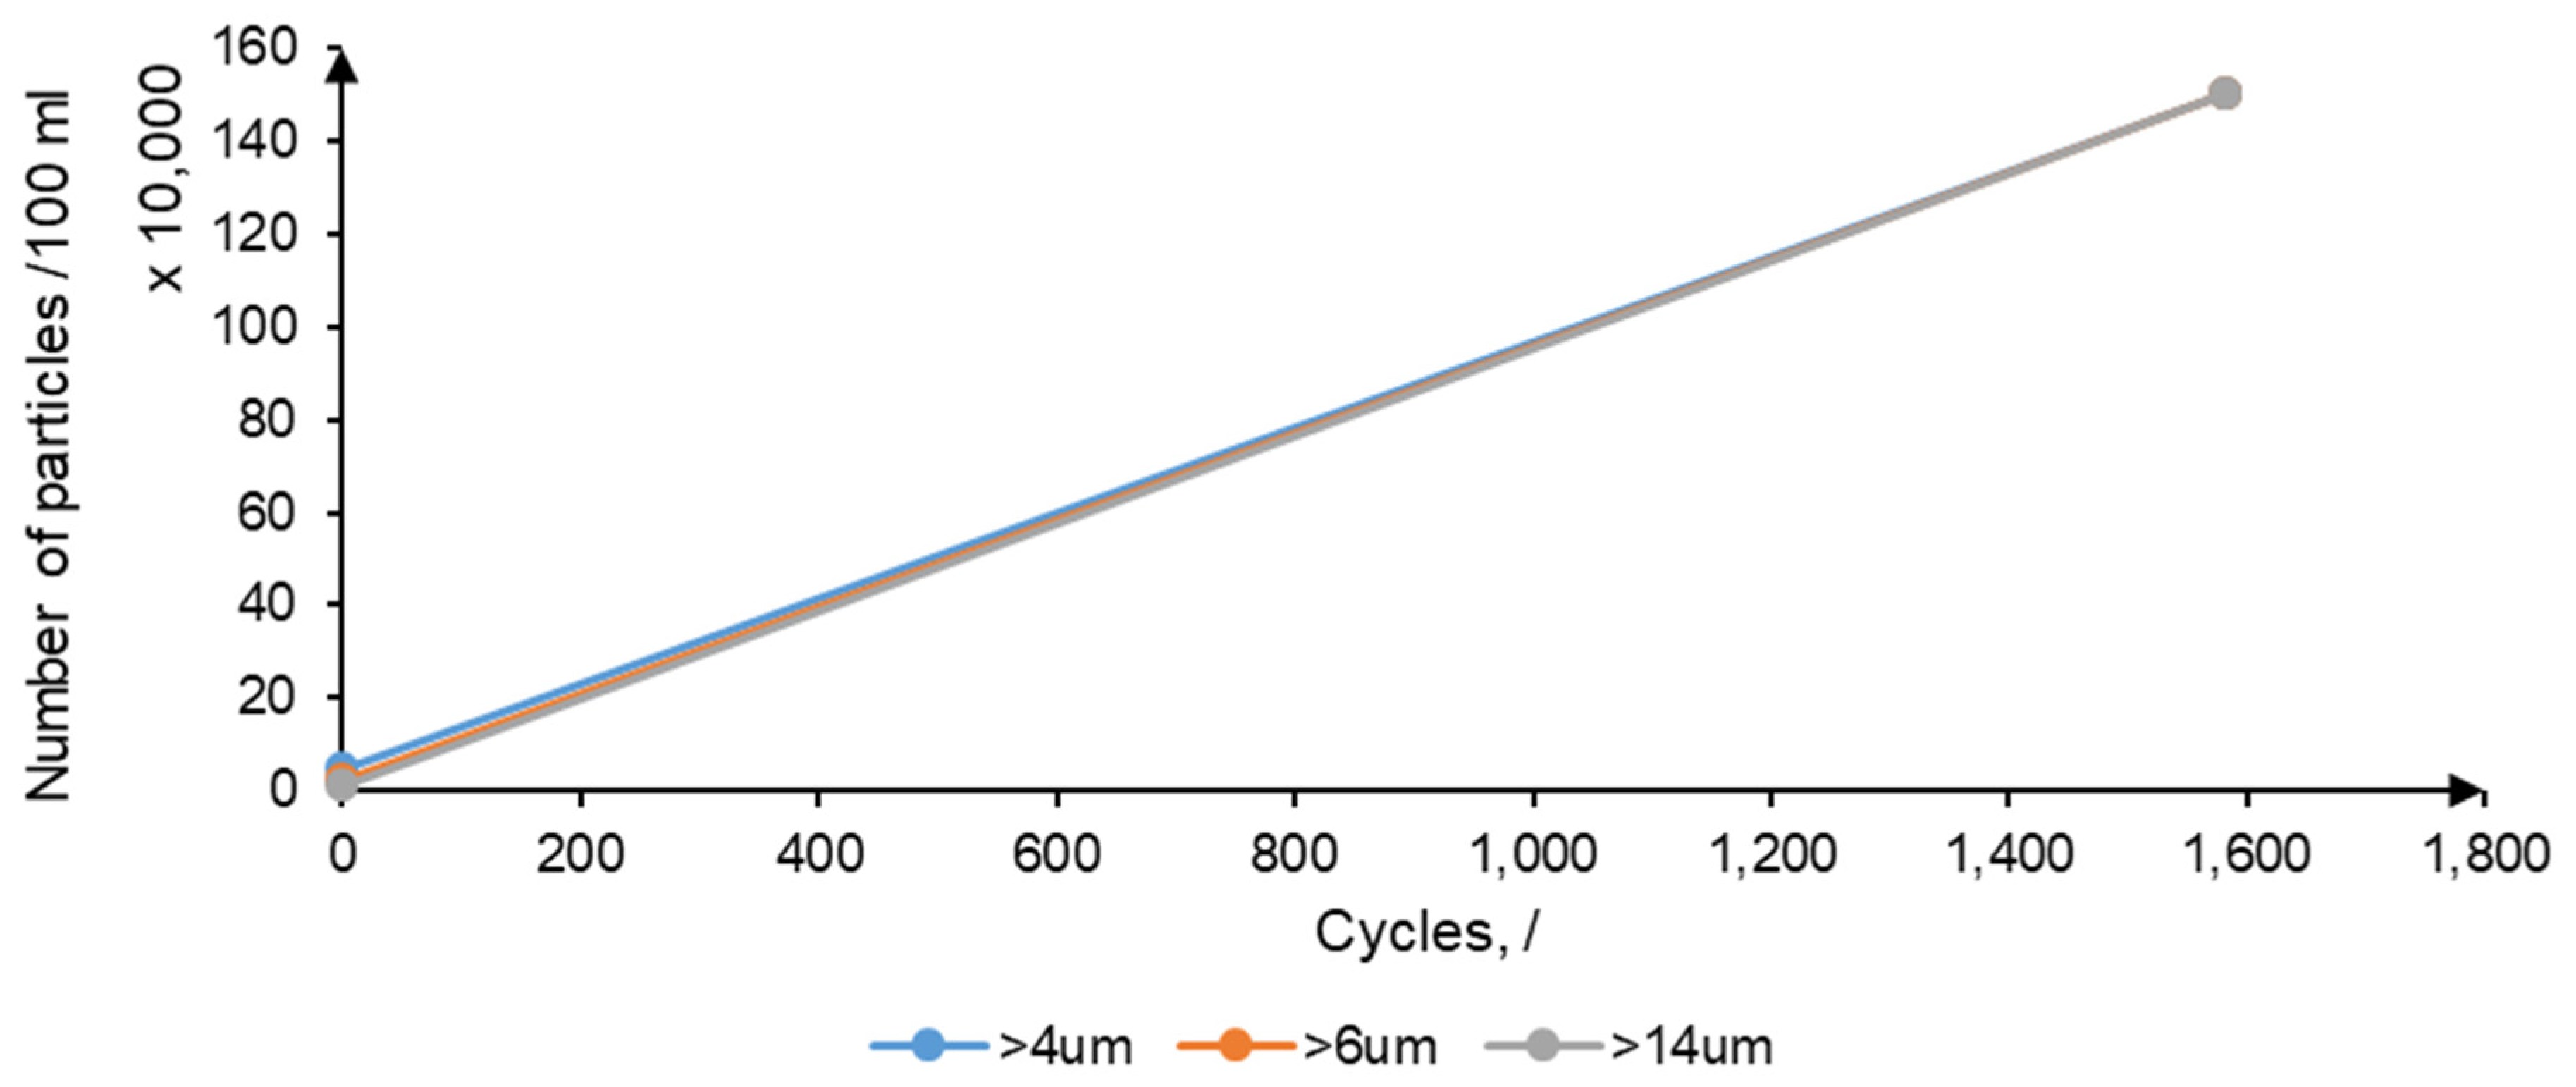
3.1. Cleanliness
3.2. Gear Pump
3.2.1. Volumetric Efficiency of Gear Pump
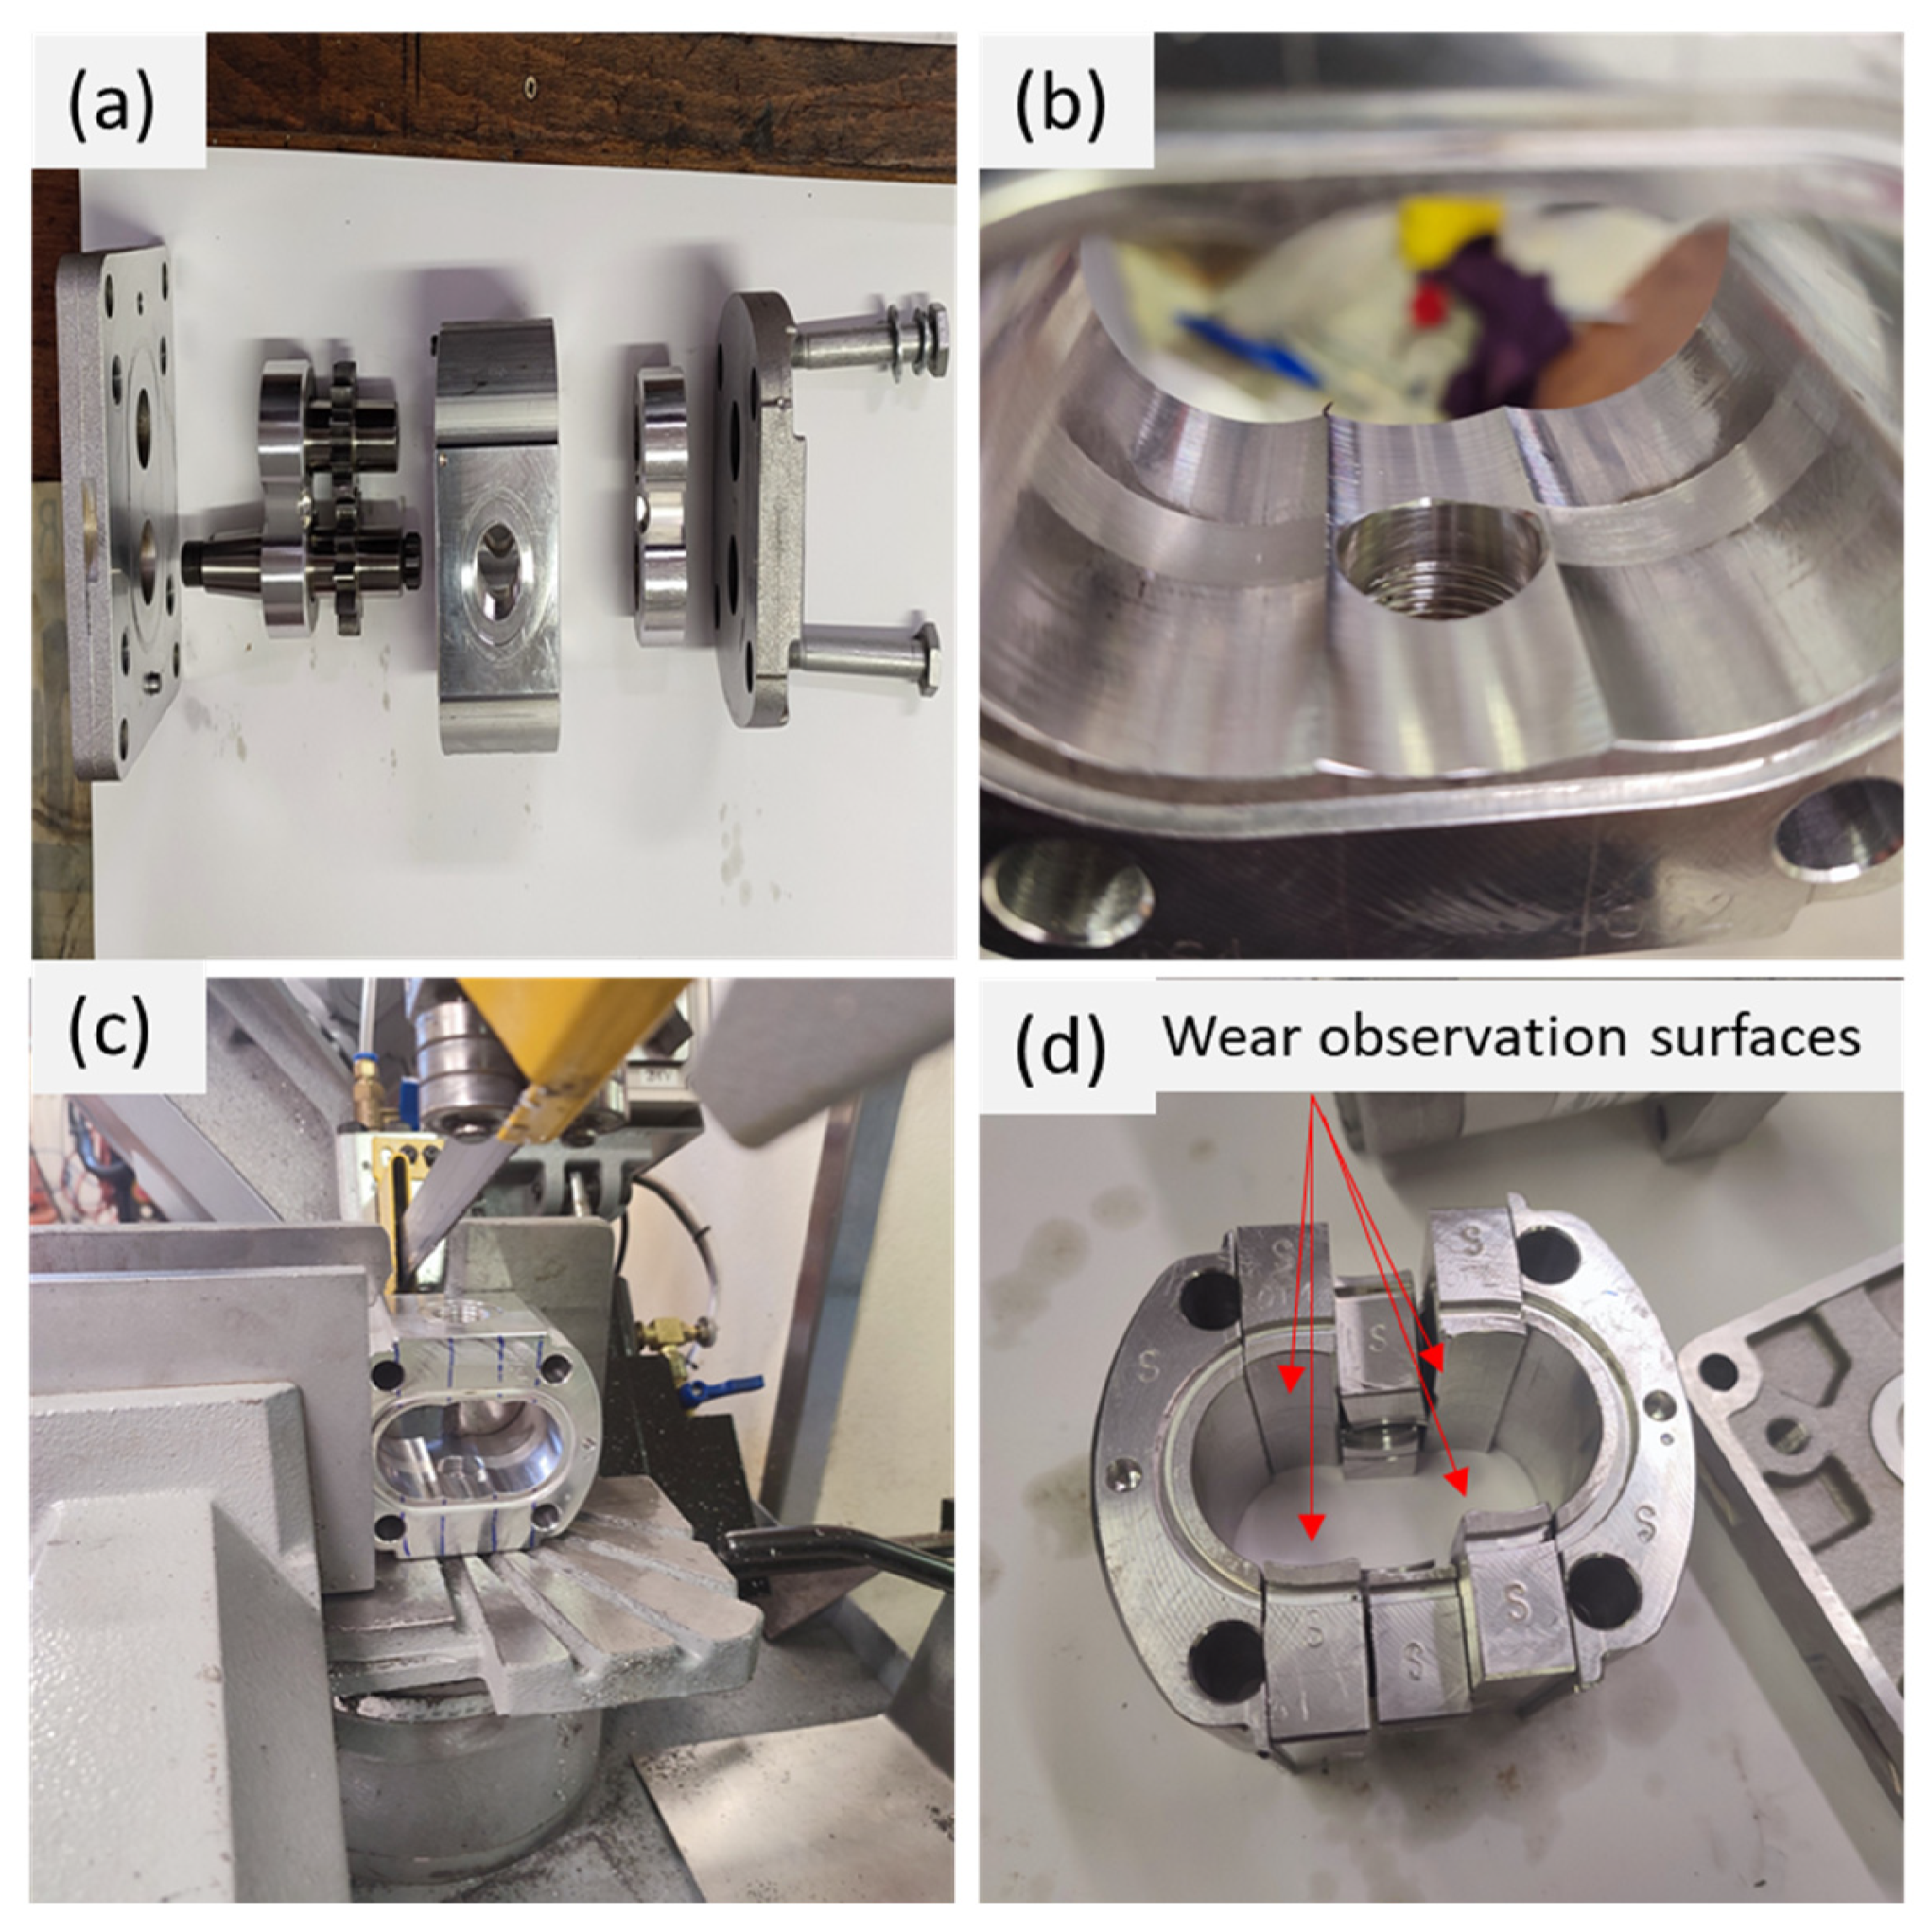
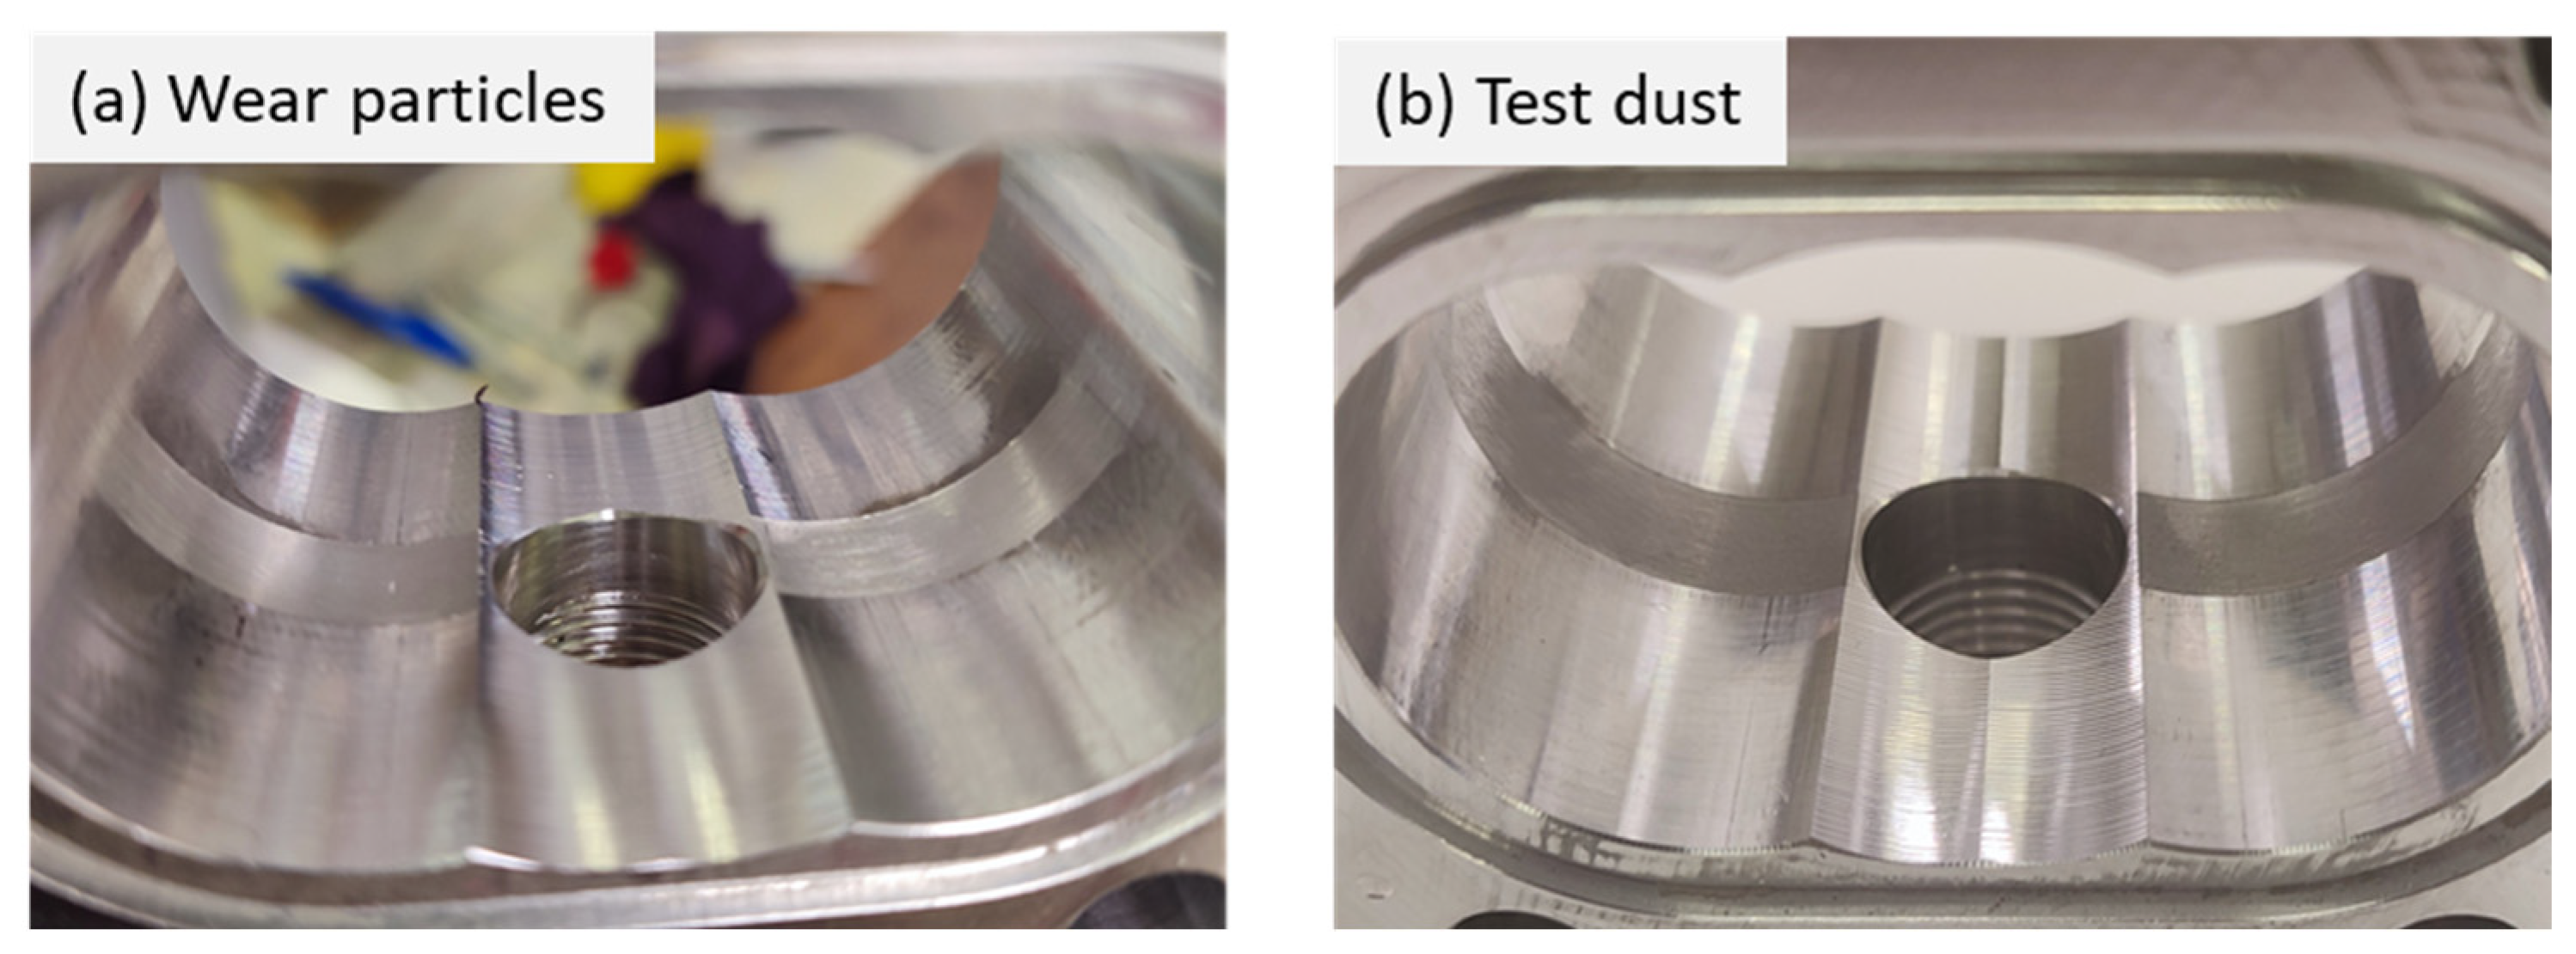
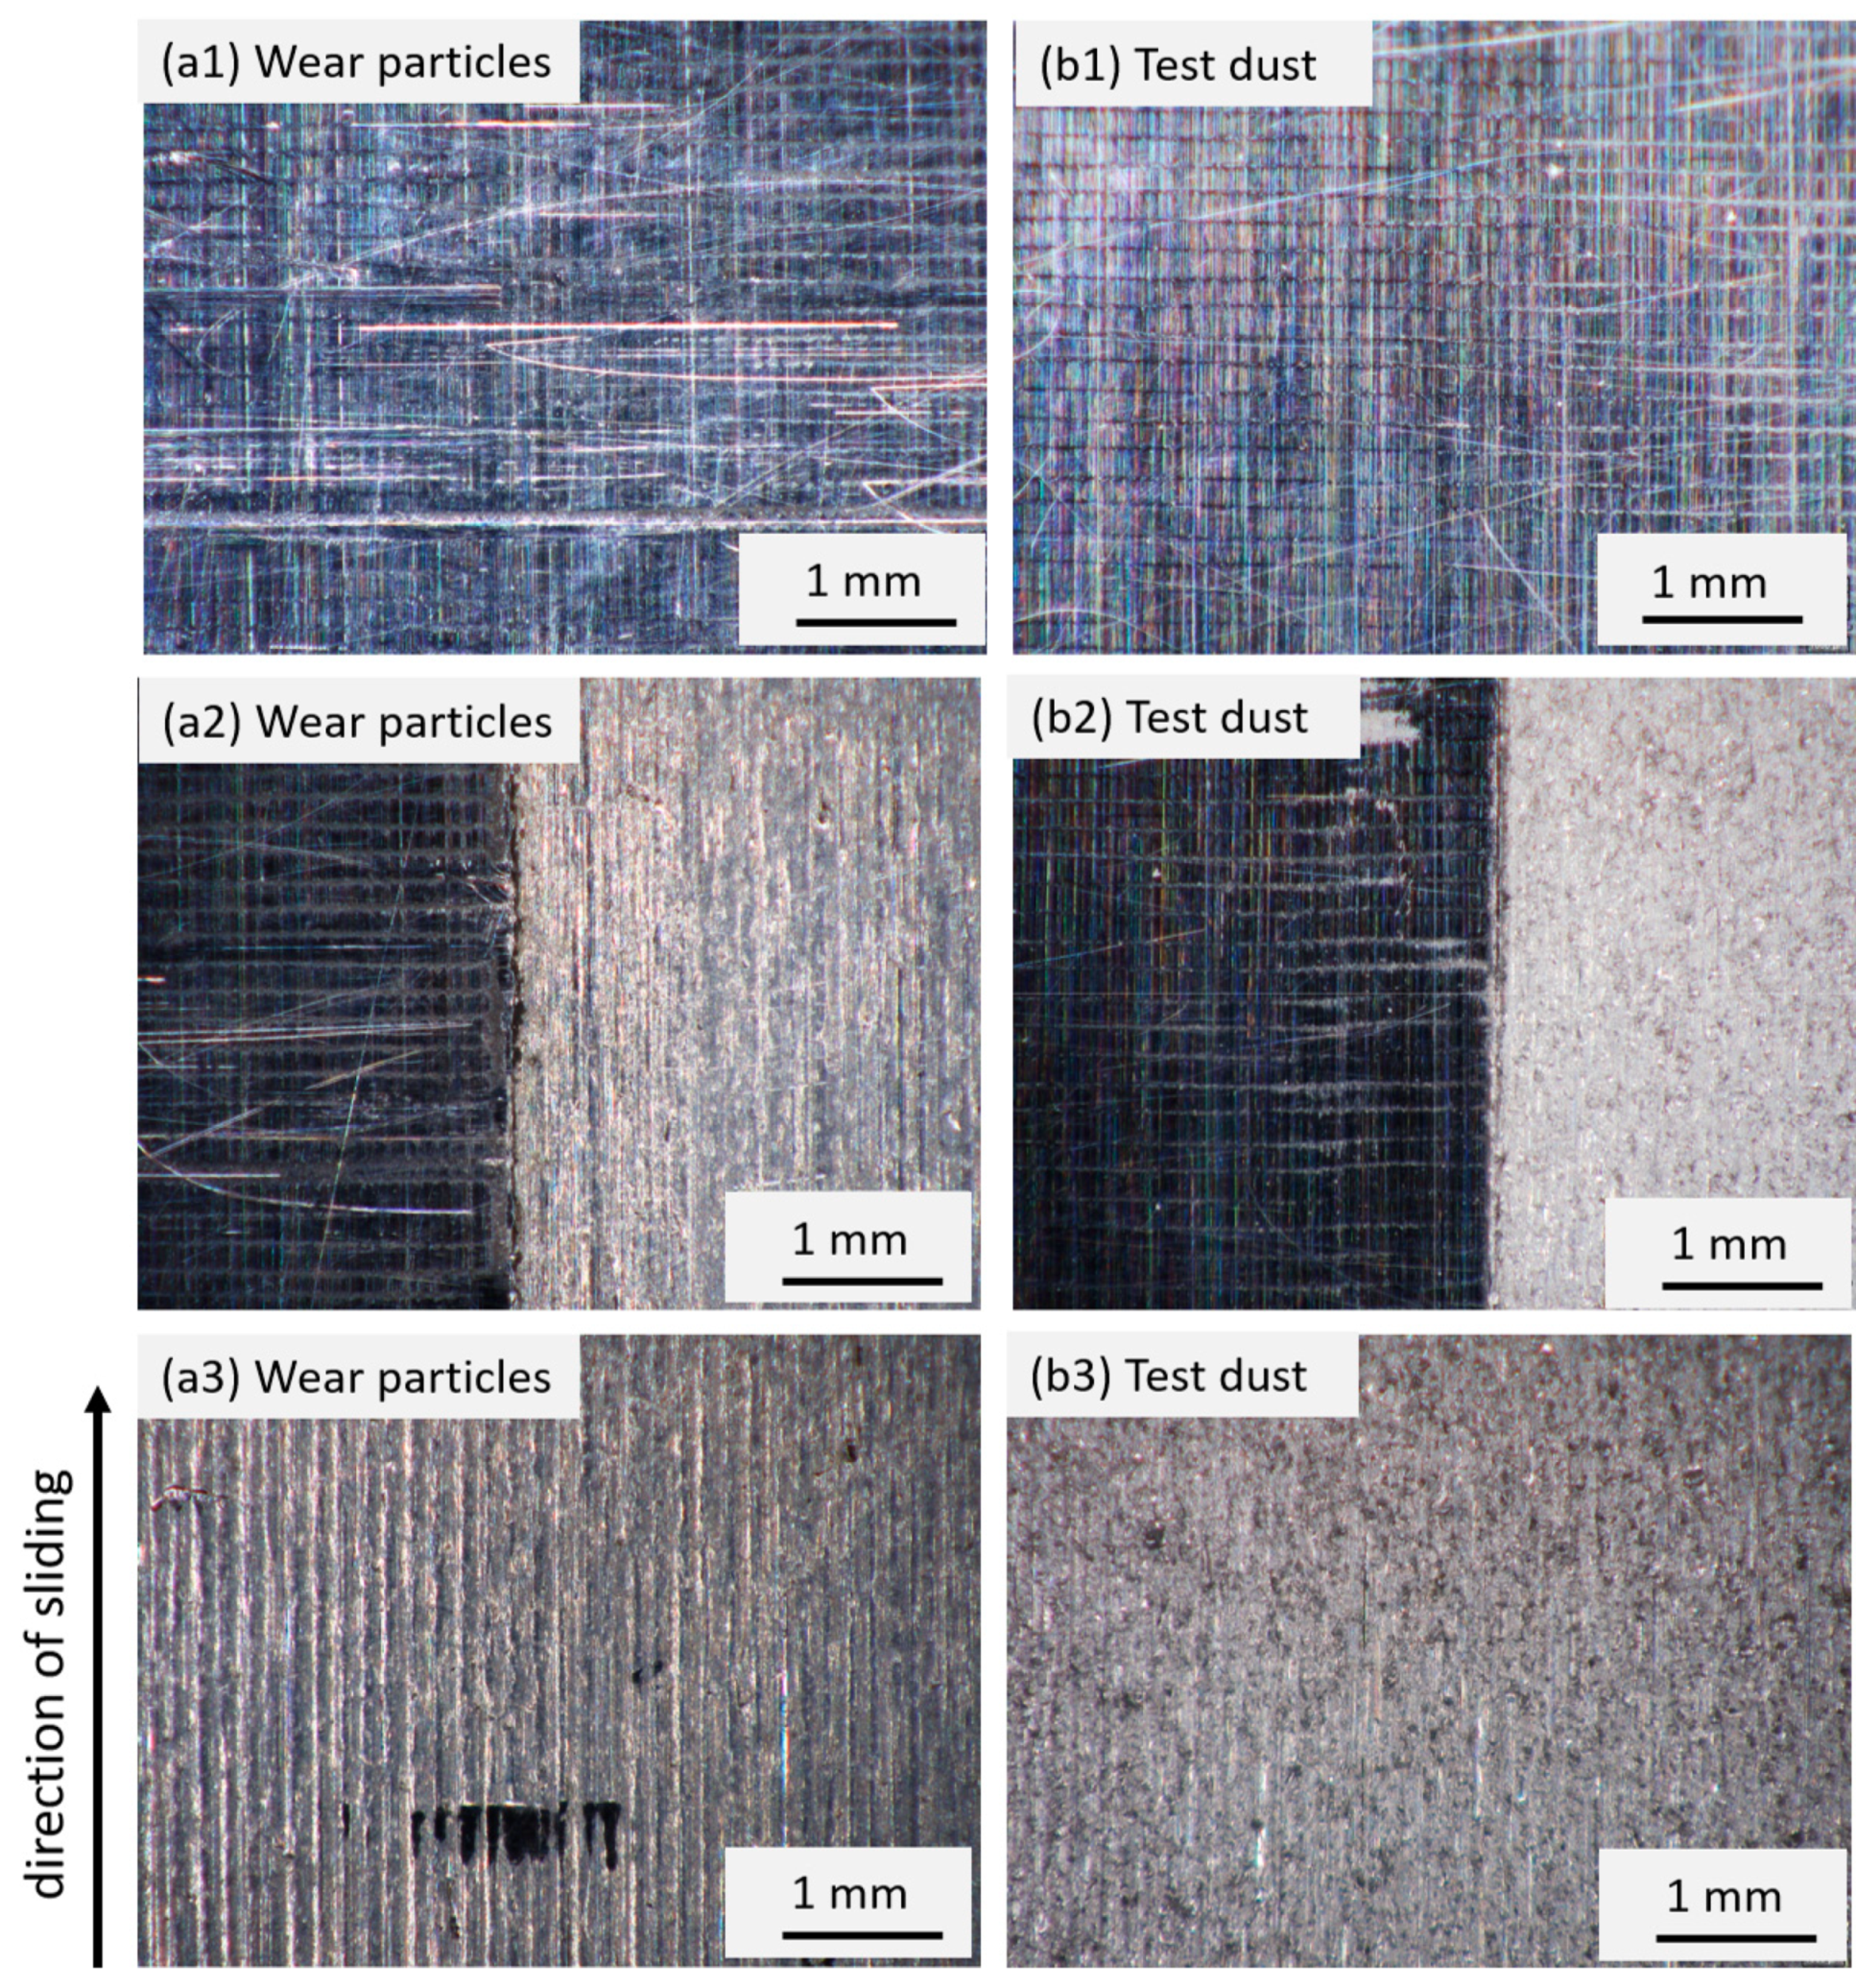
3.2.2. Surface Inspection of Hydraulic Gear Pump
3.3. Directional 4/3 Valve
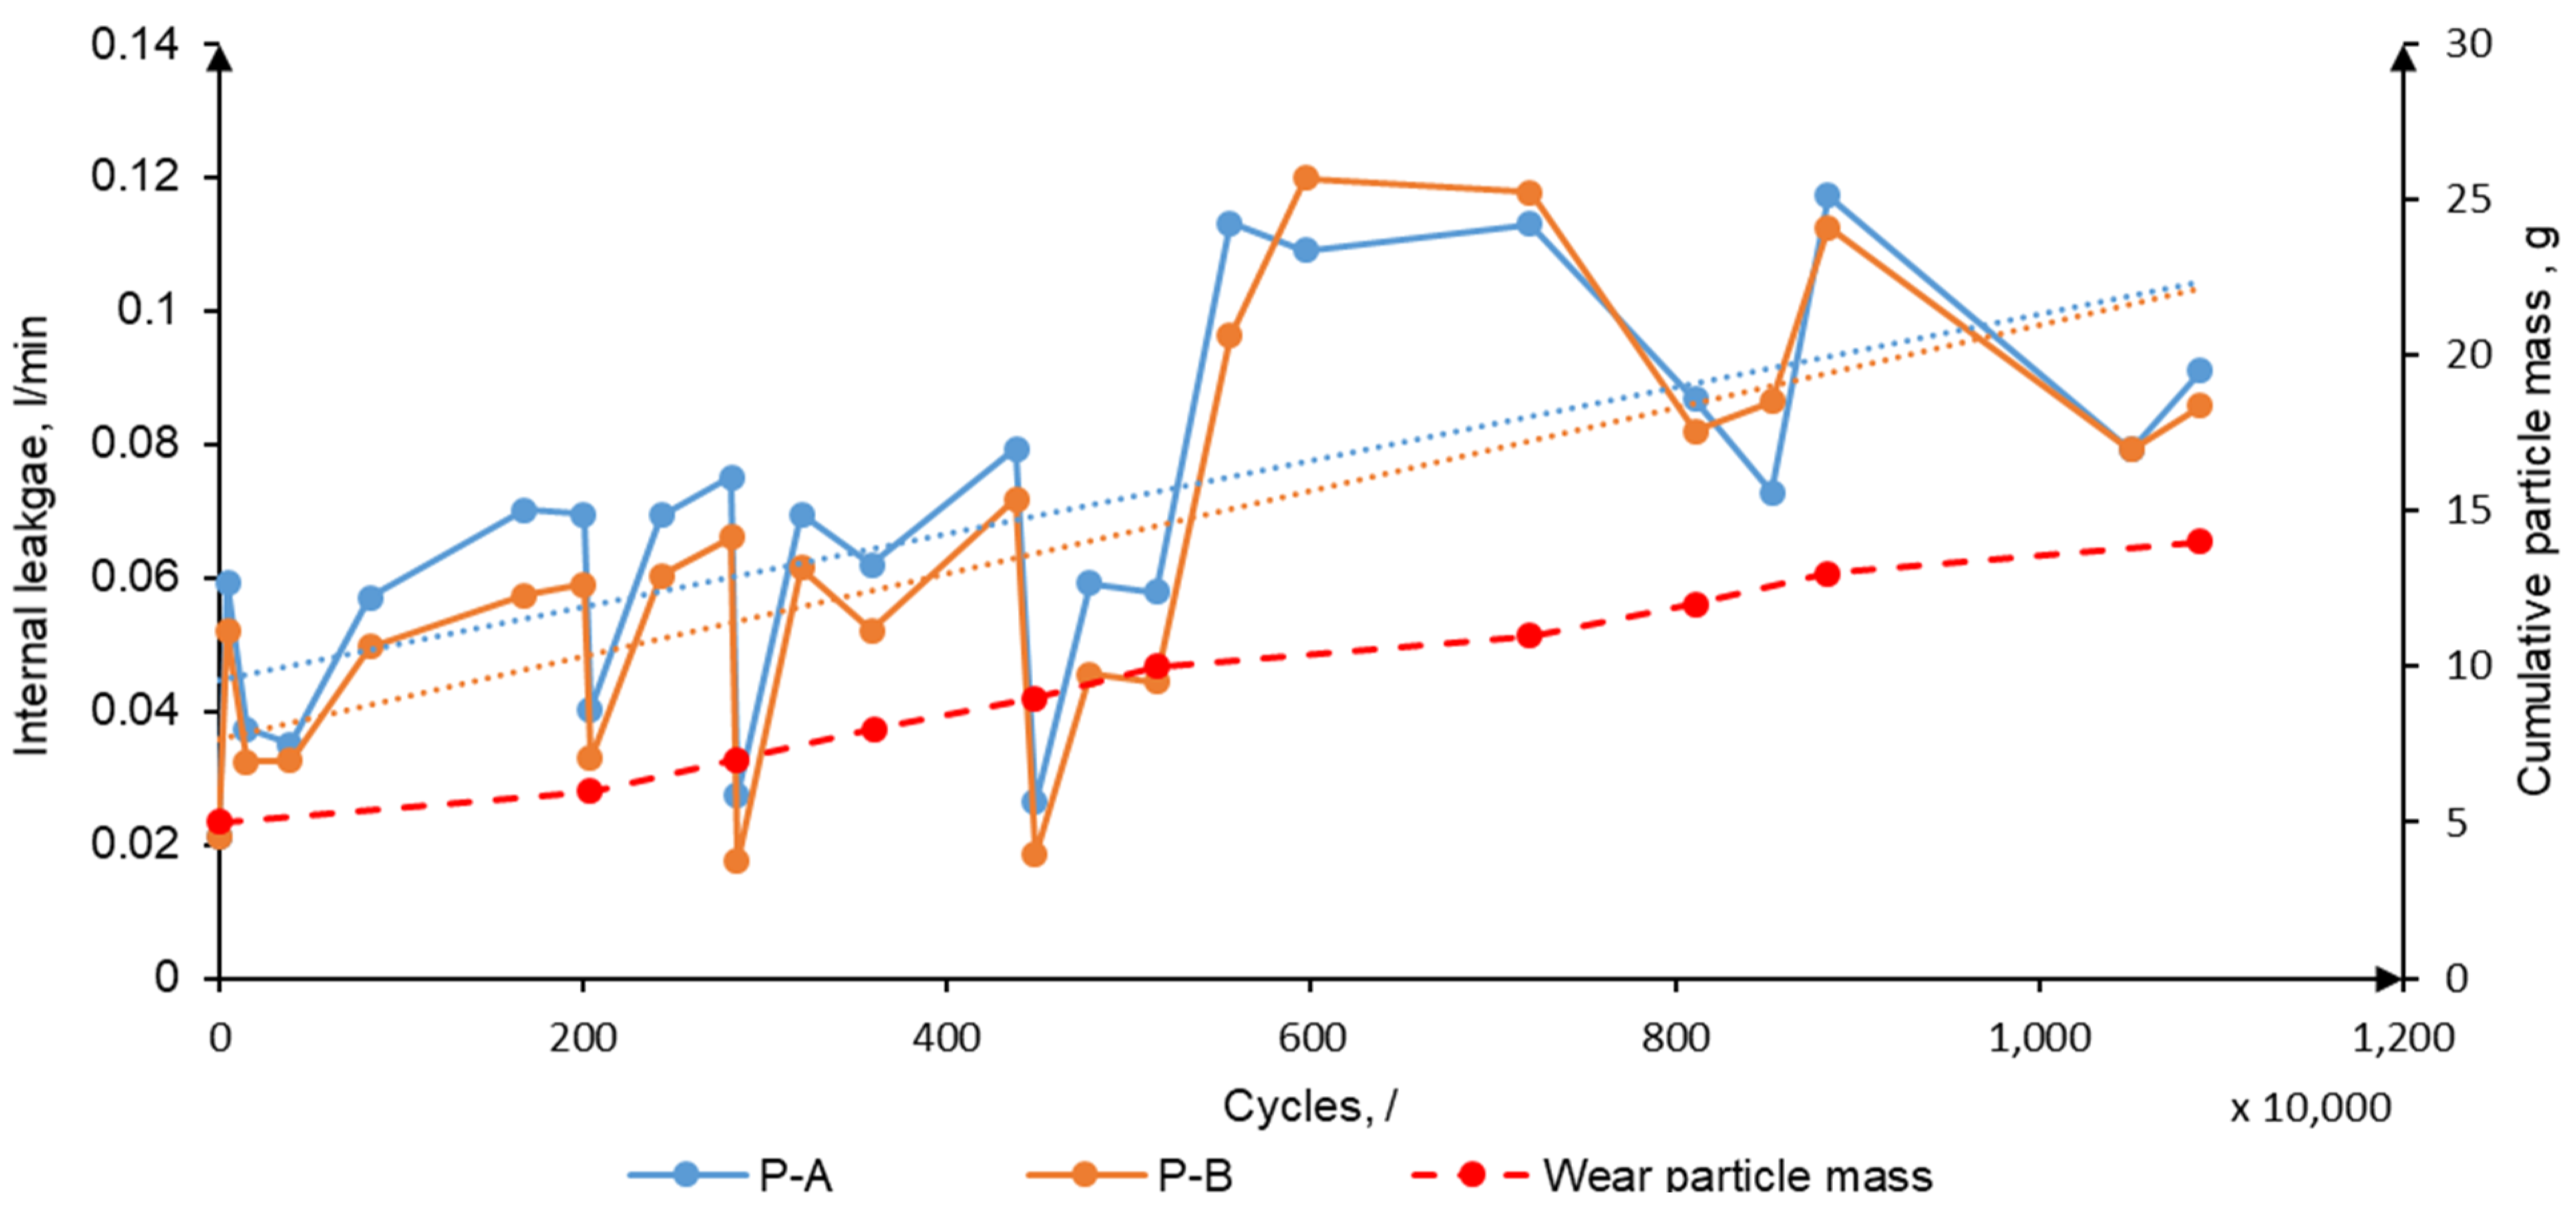
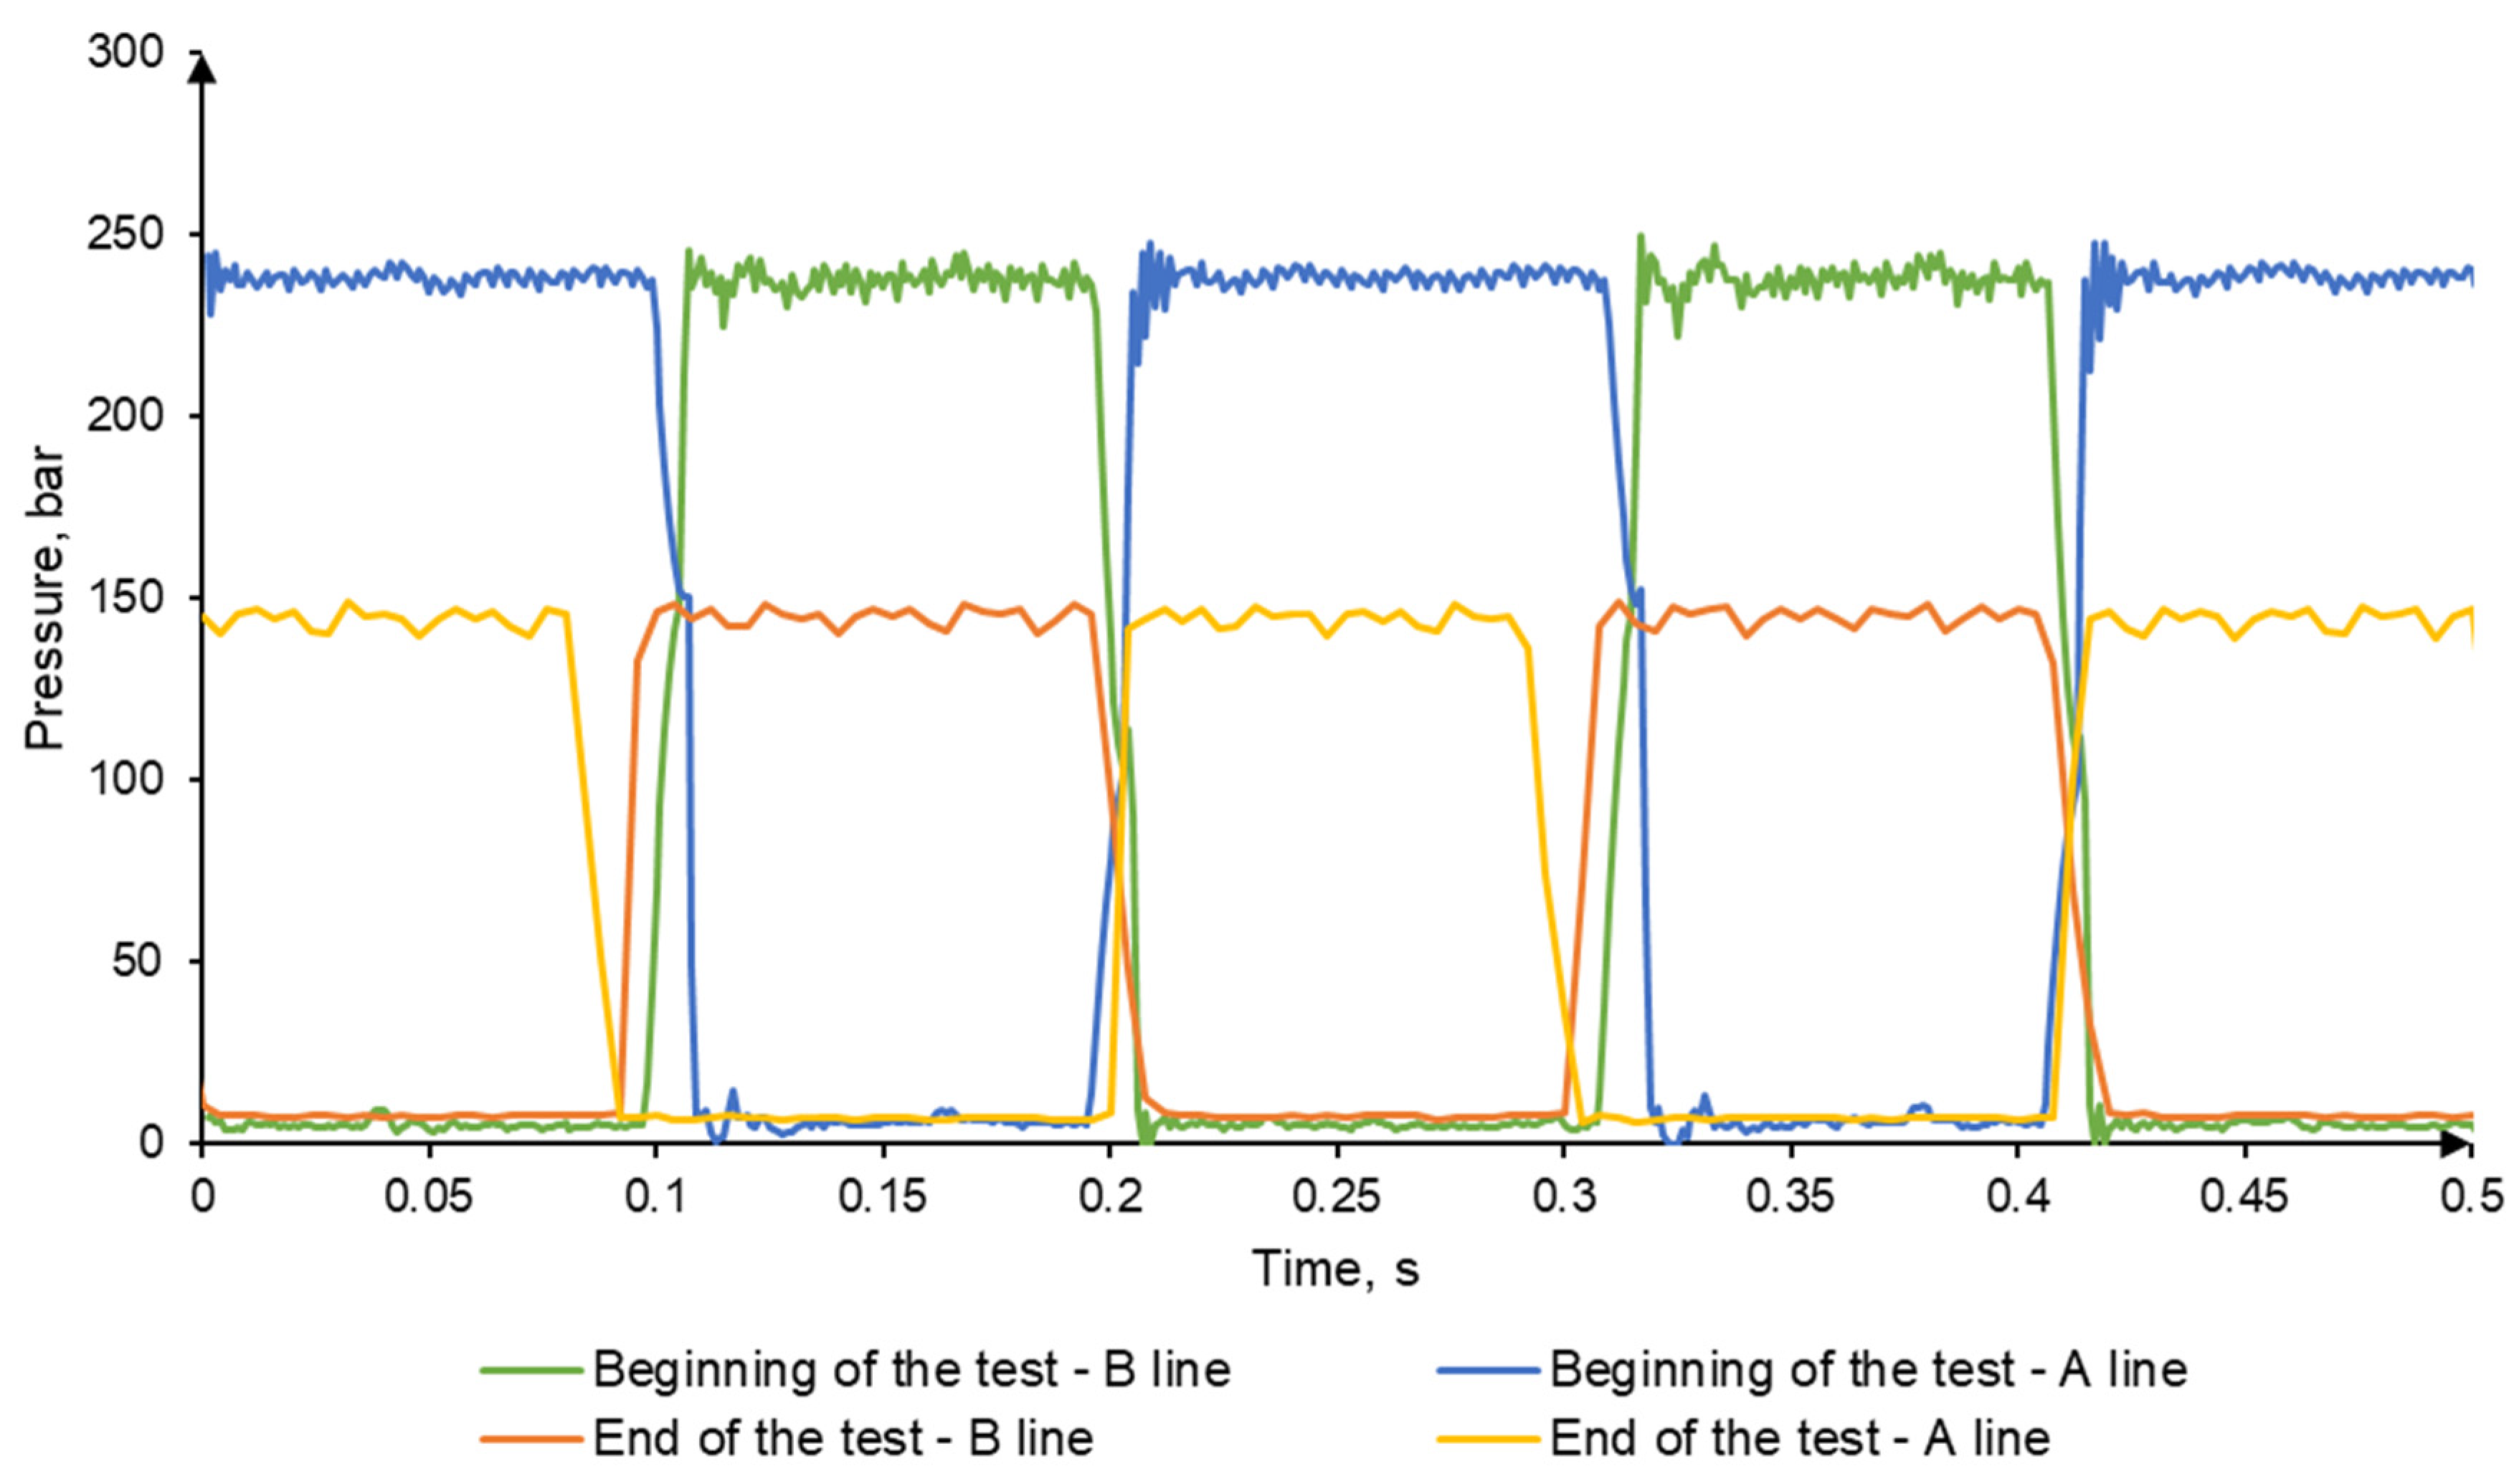
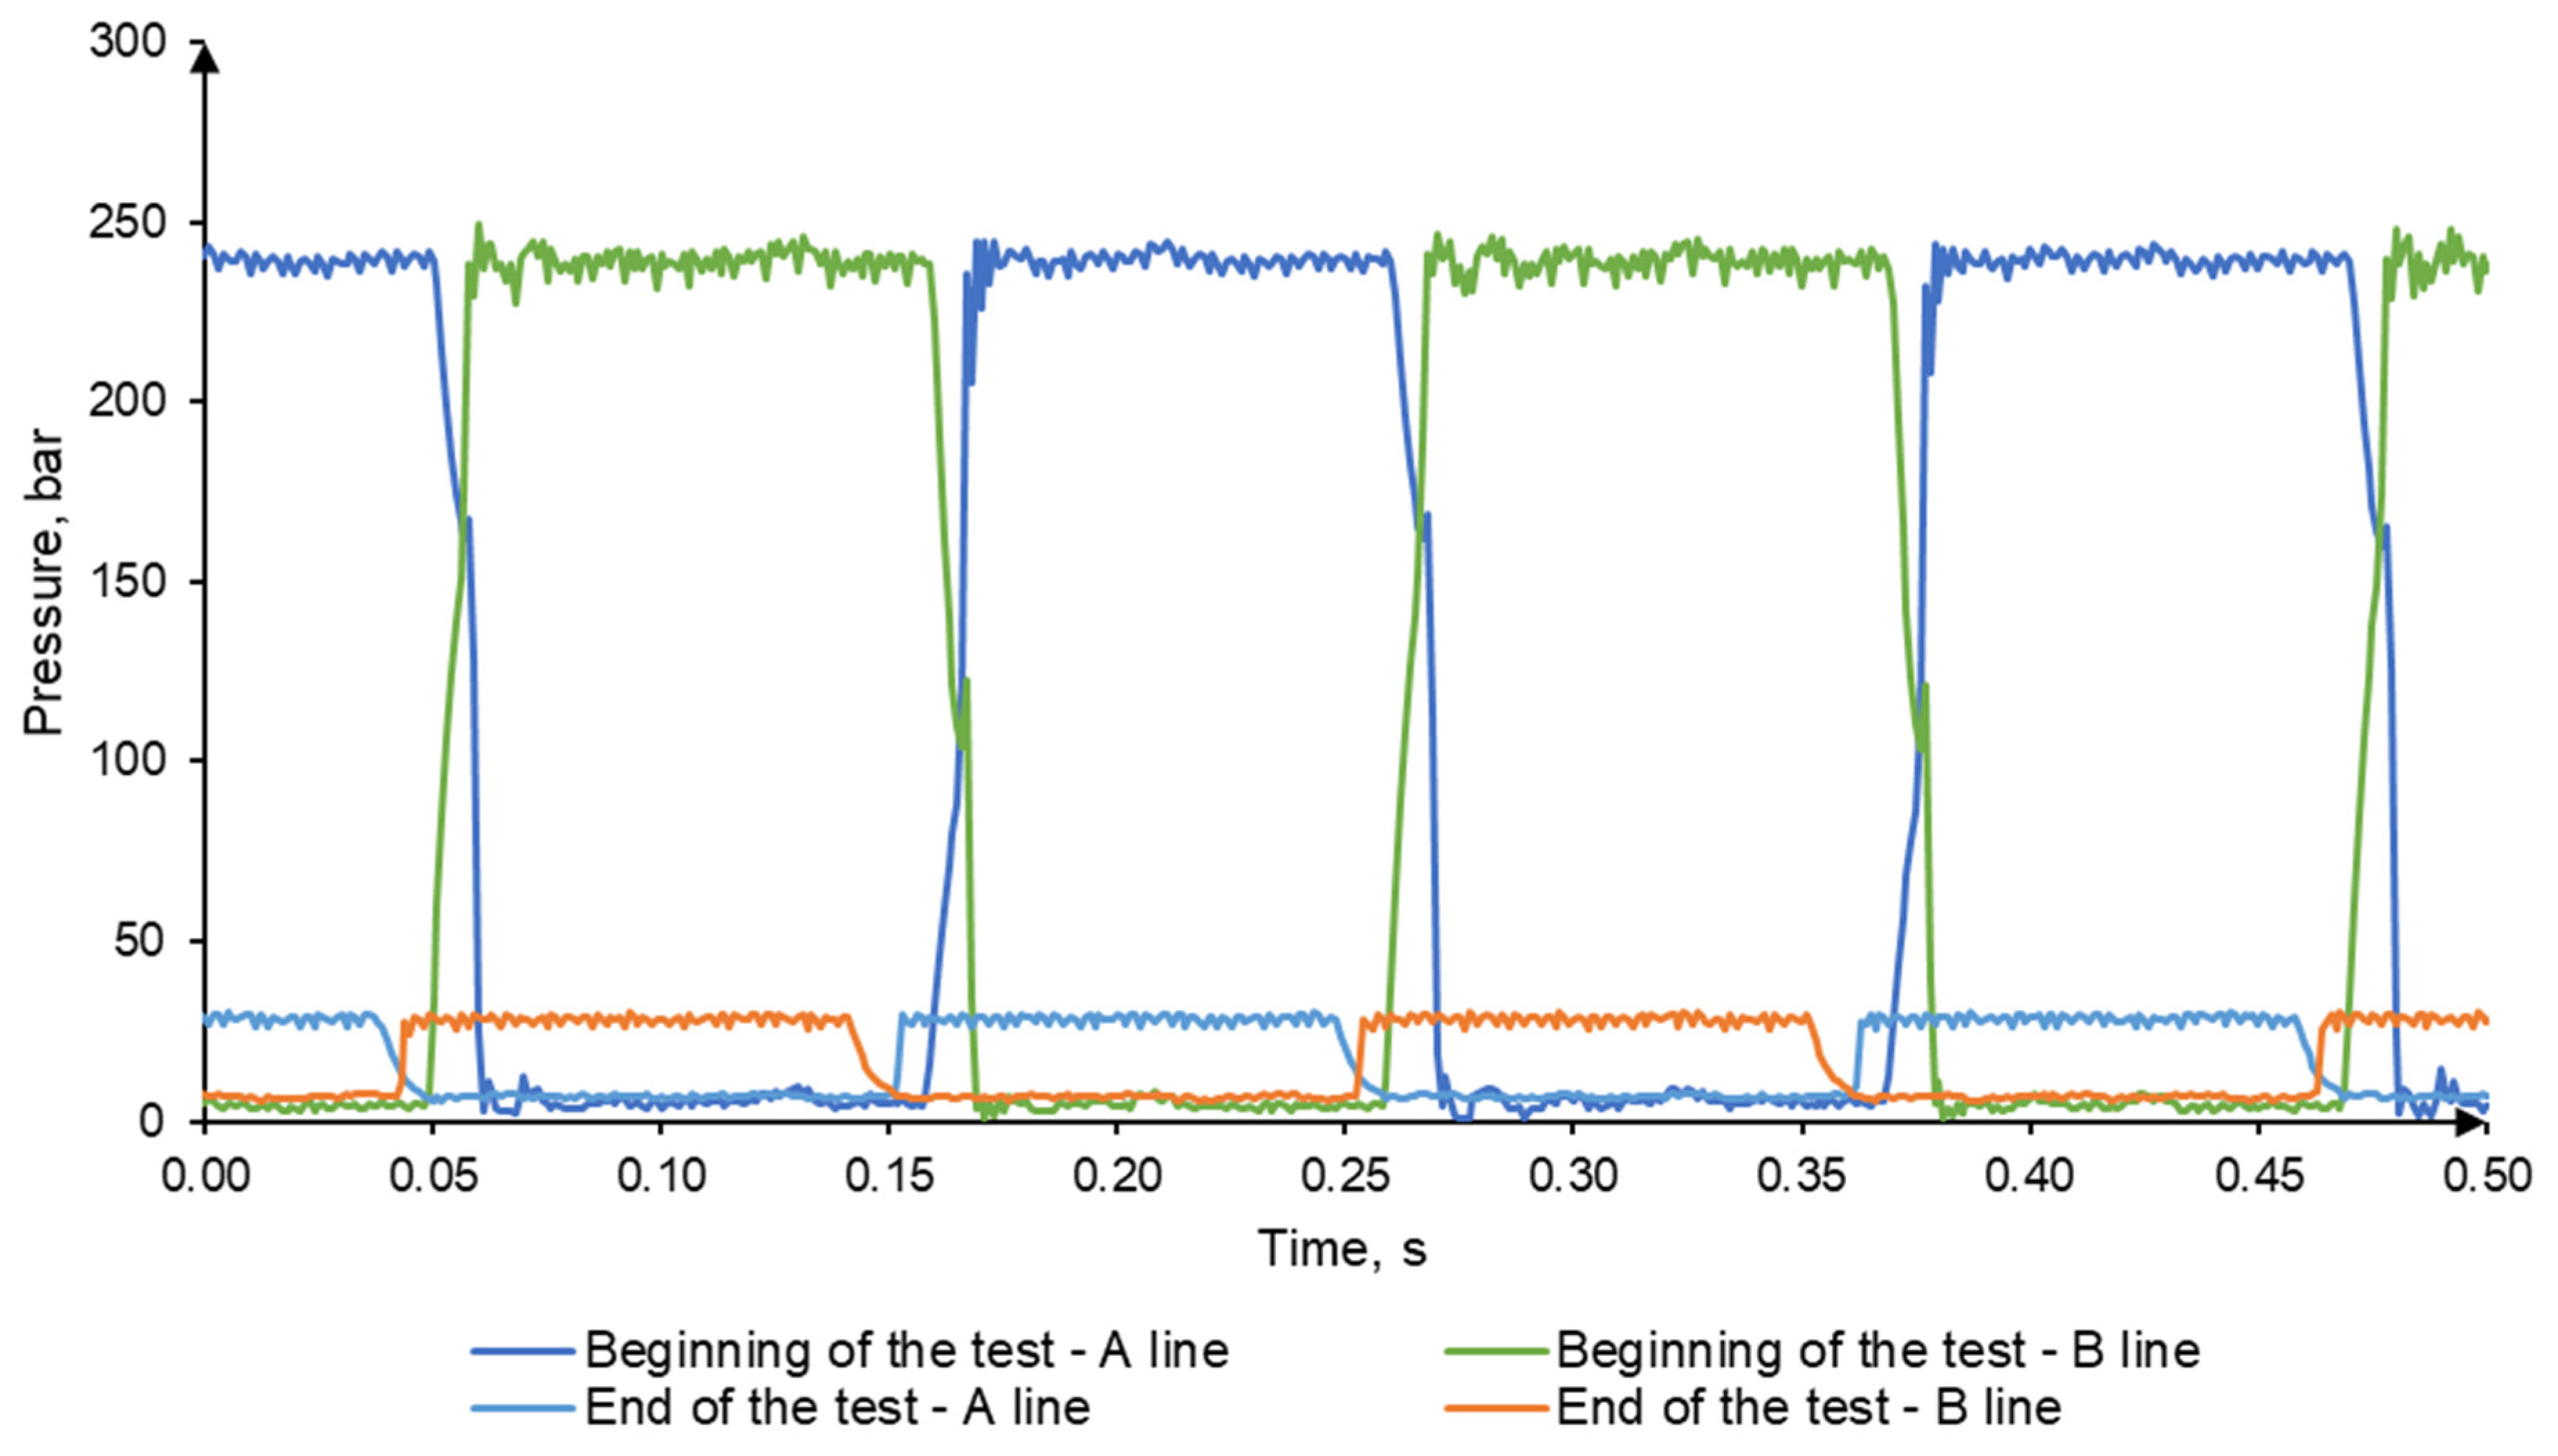
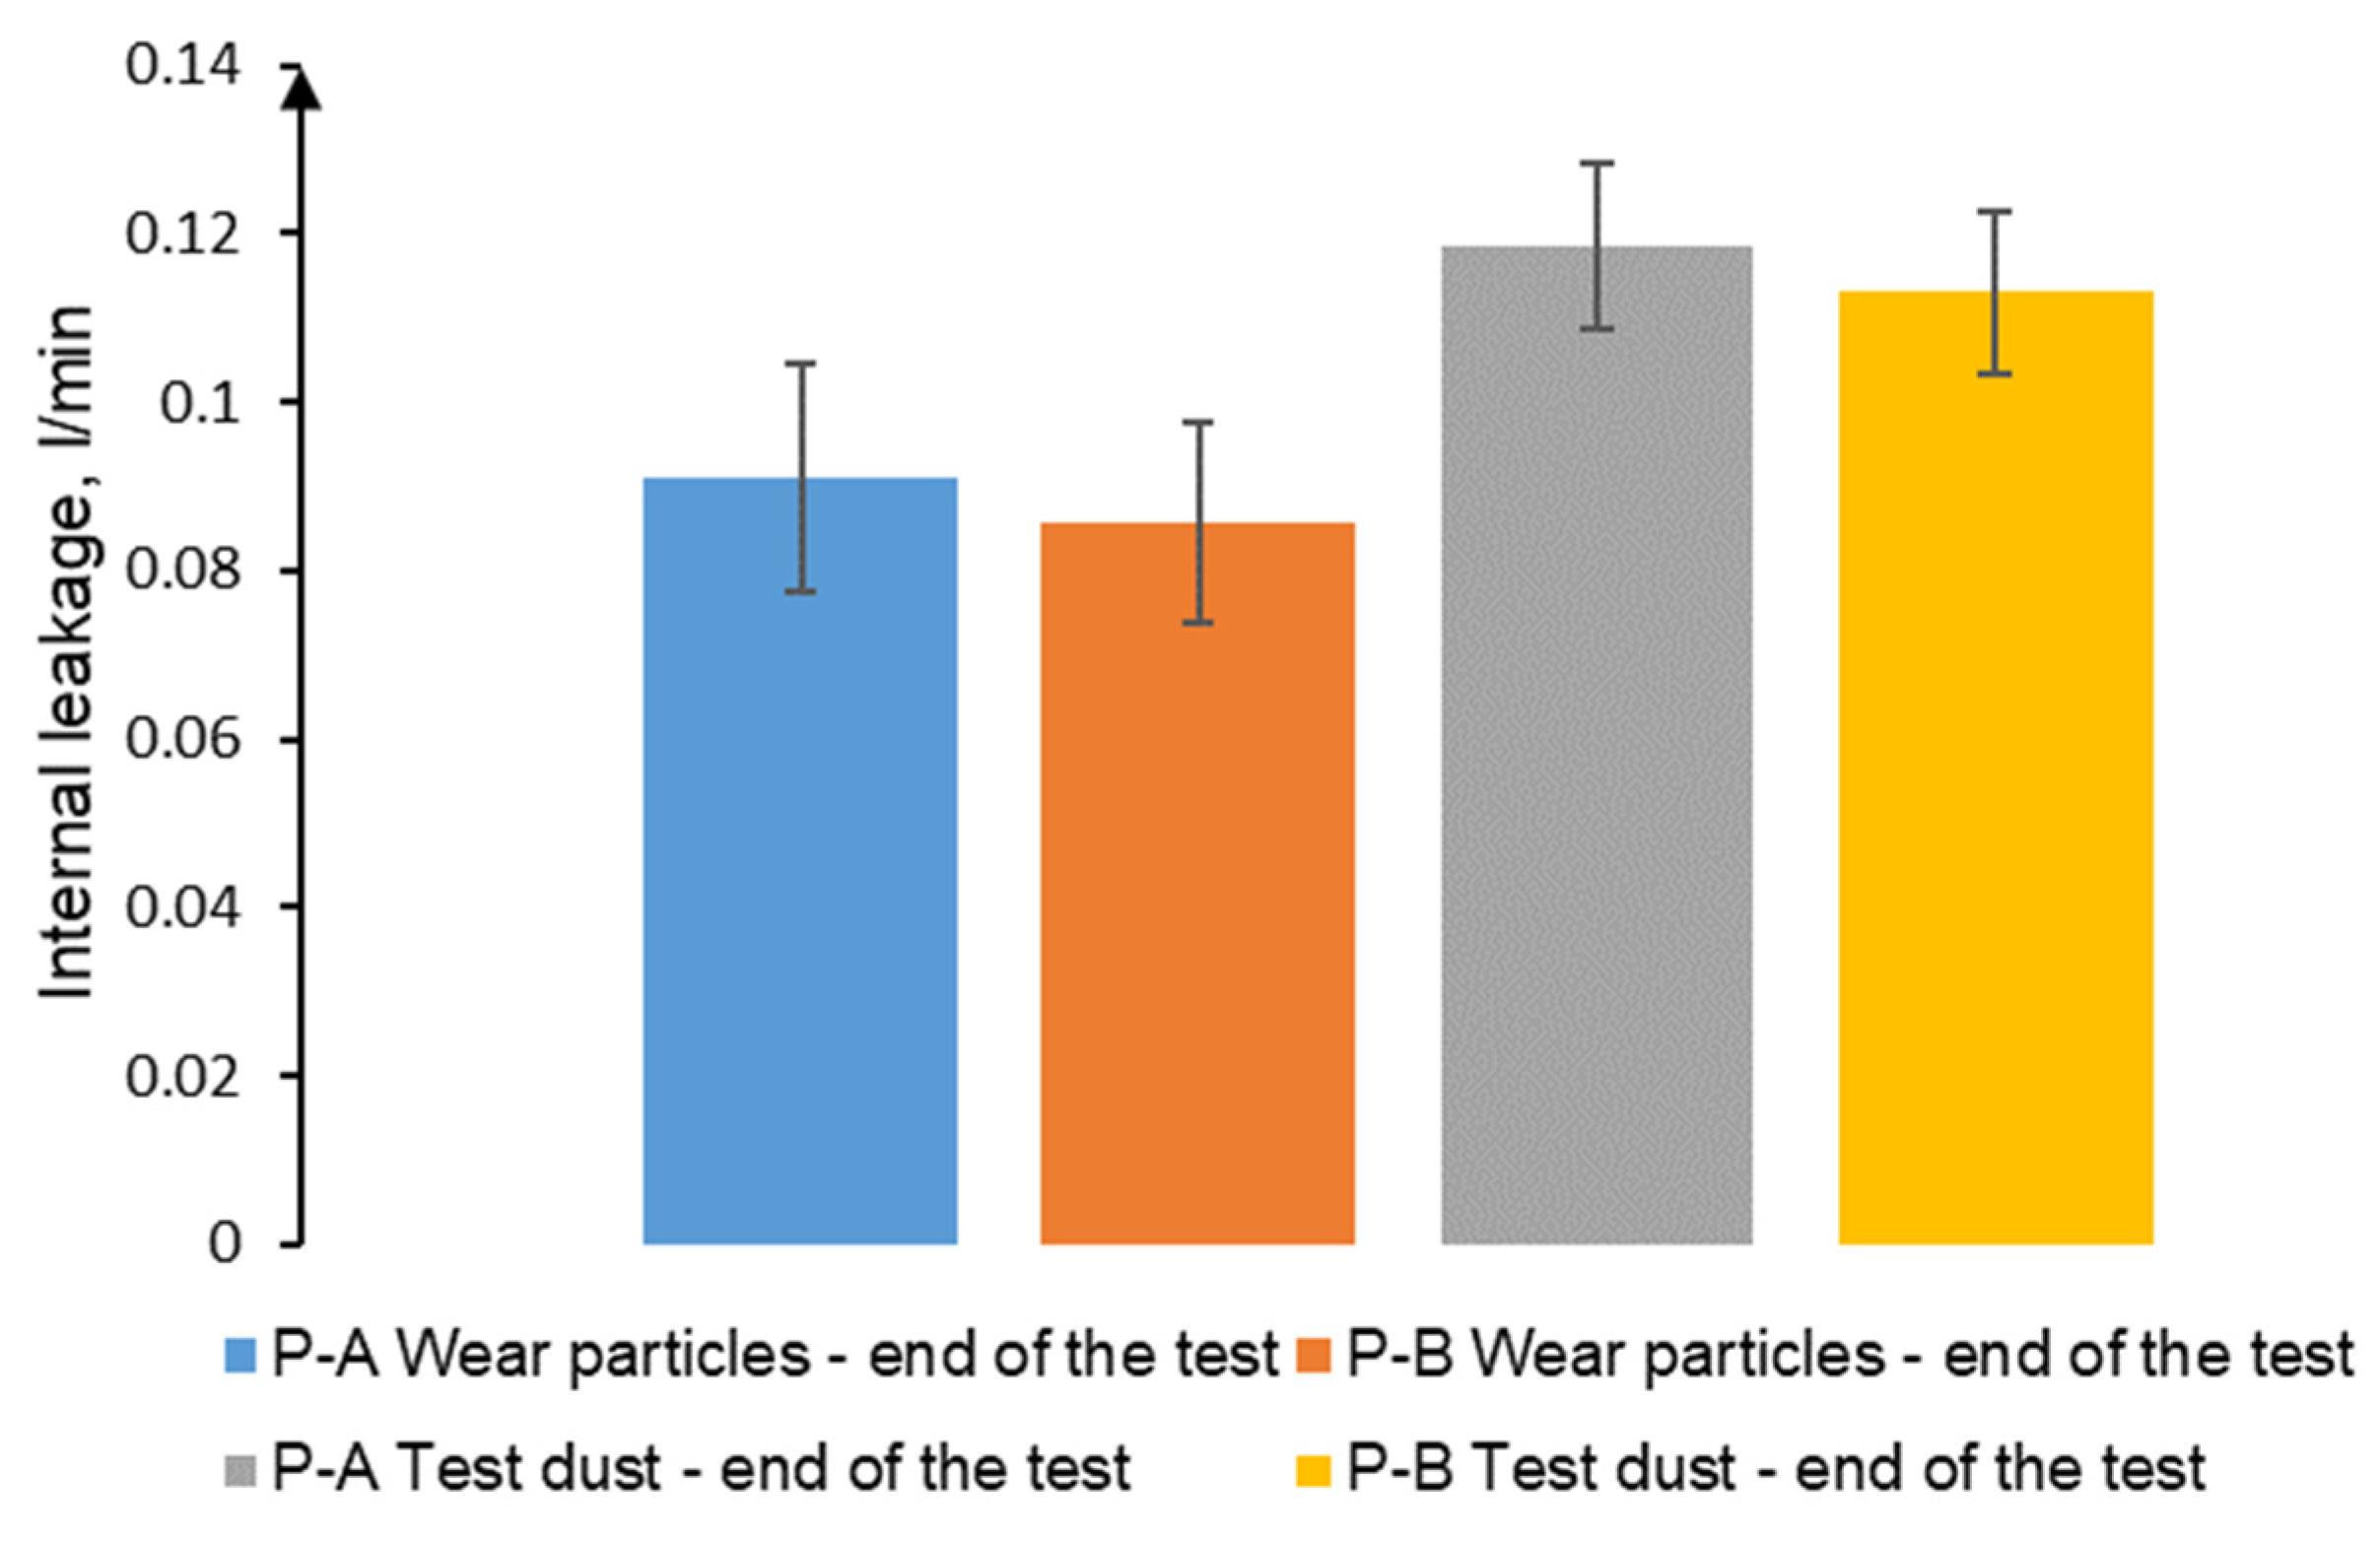
3.3.1. Internal Leakage Measurements on Directional 4/3 Valve

3.3.2. Pressure Drop on Directional 4/3 Valve during Operation
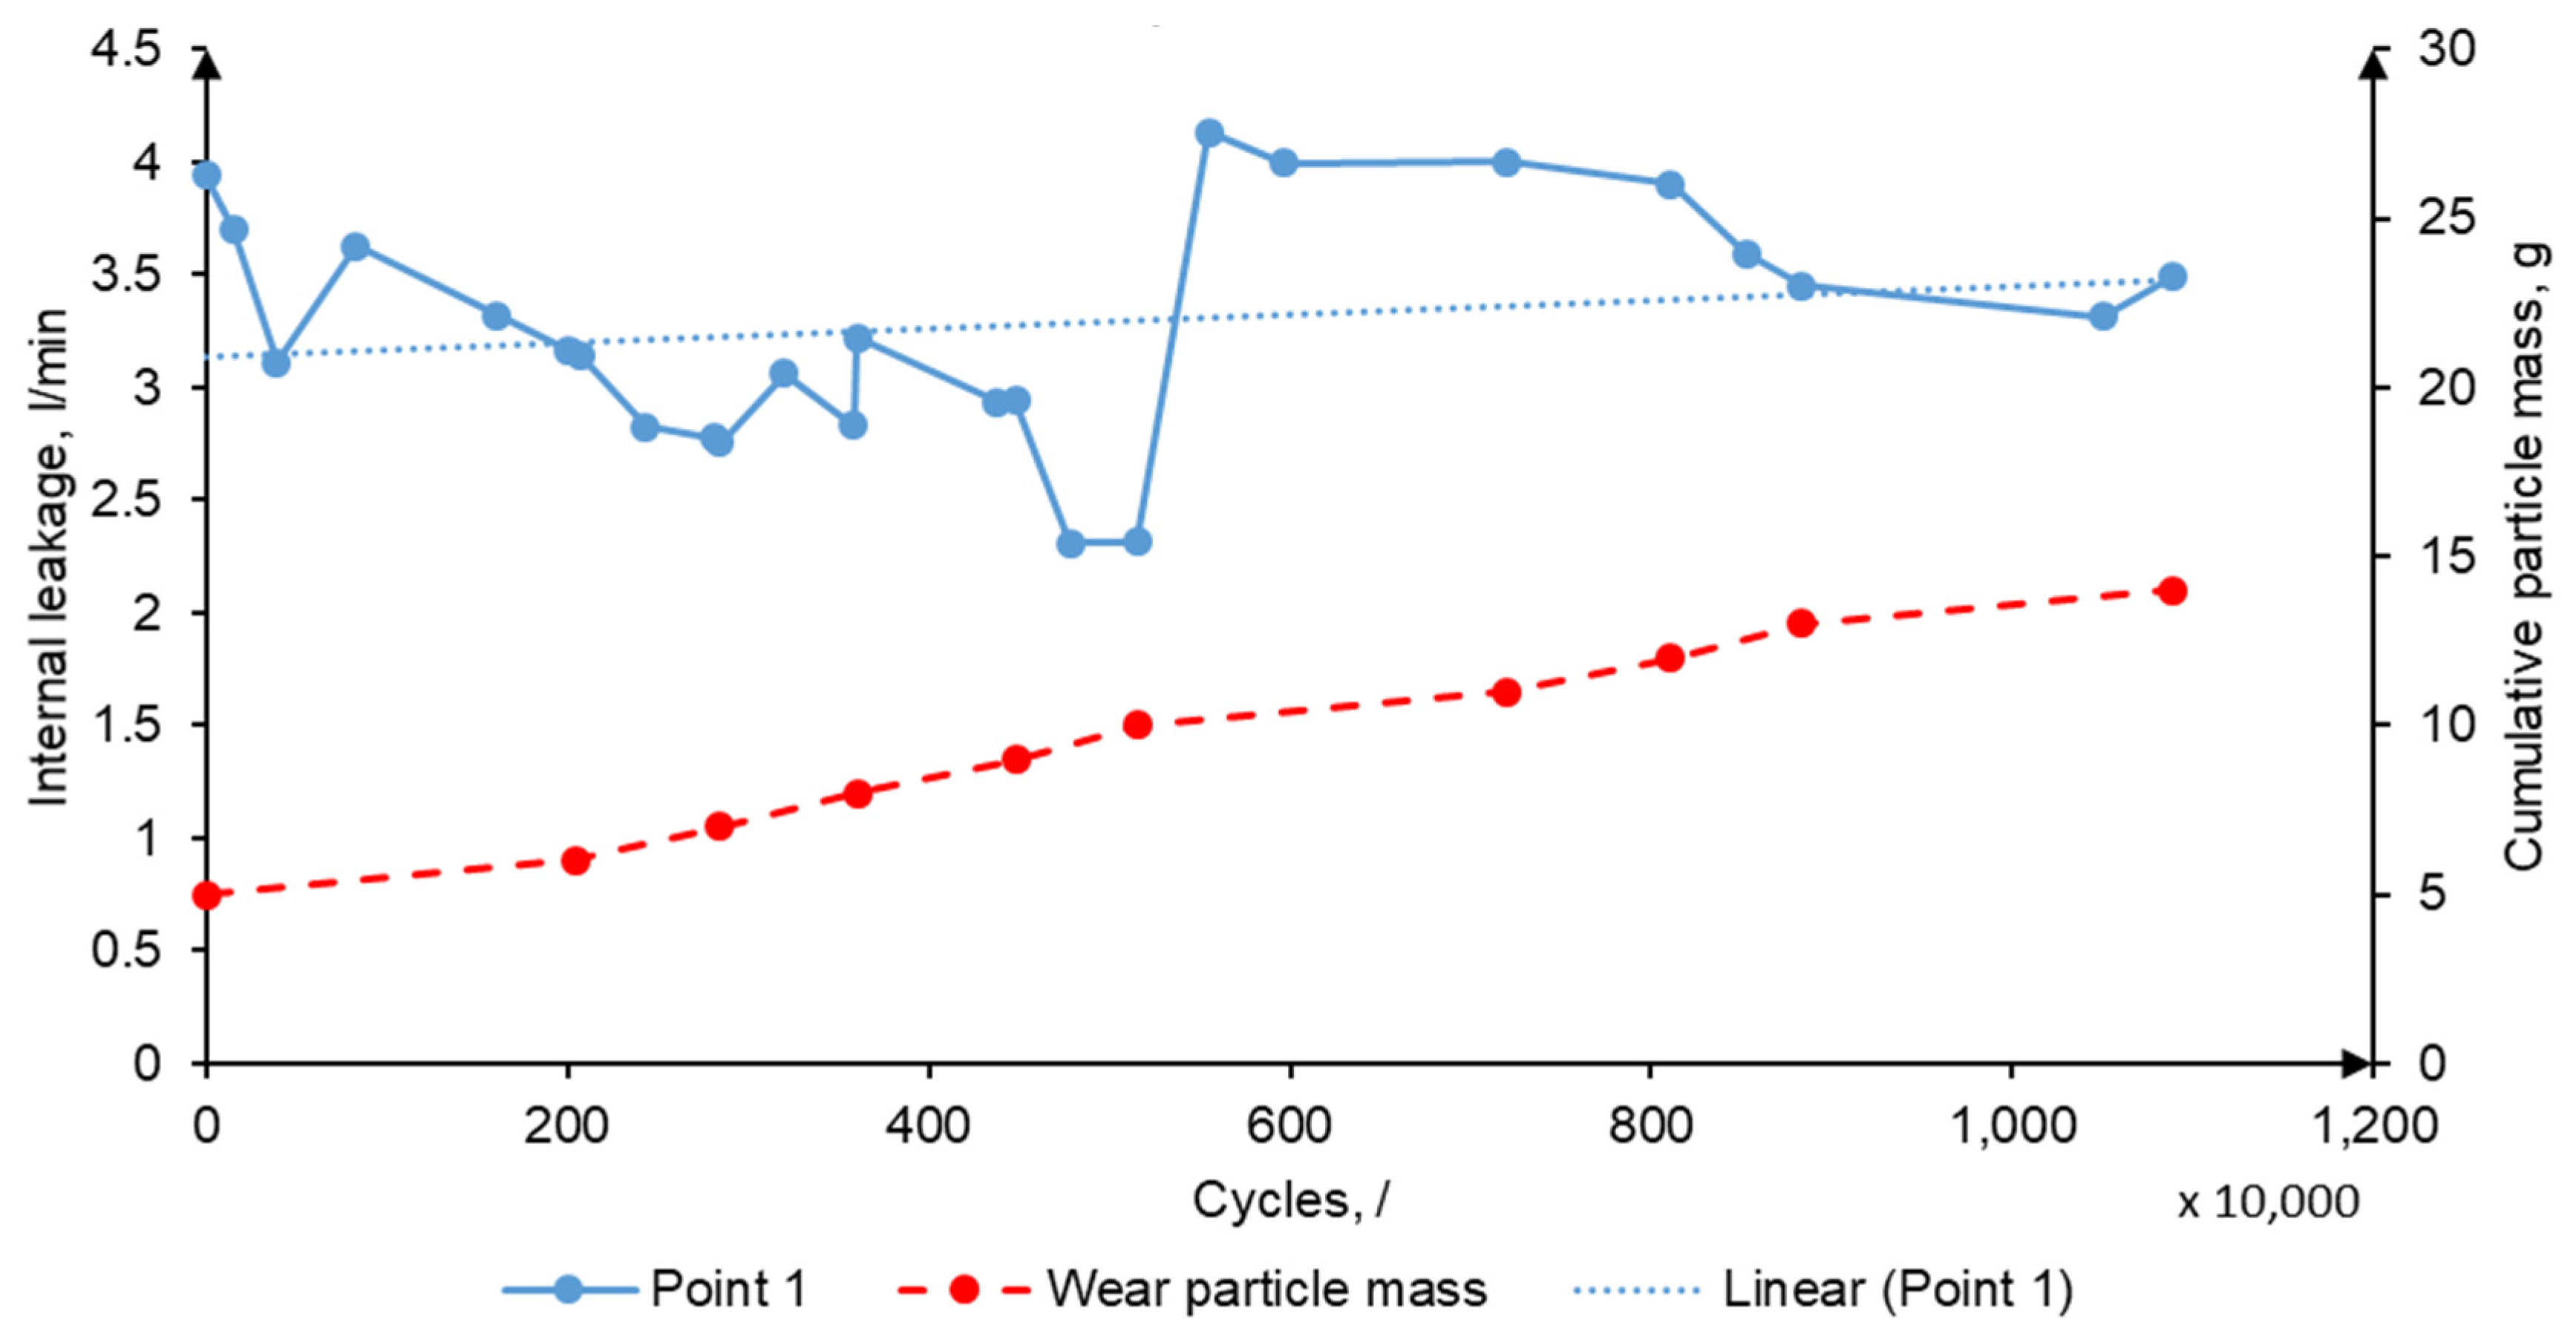
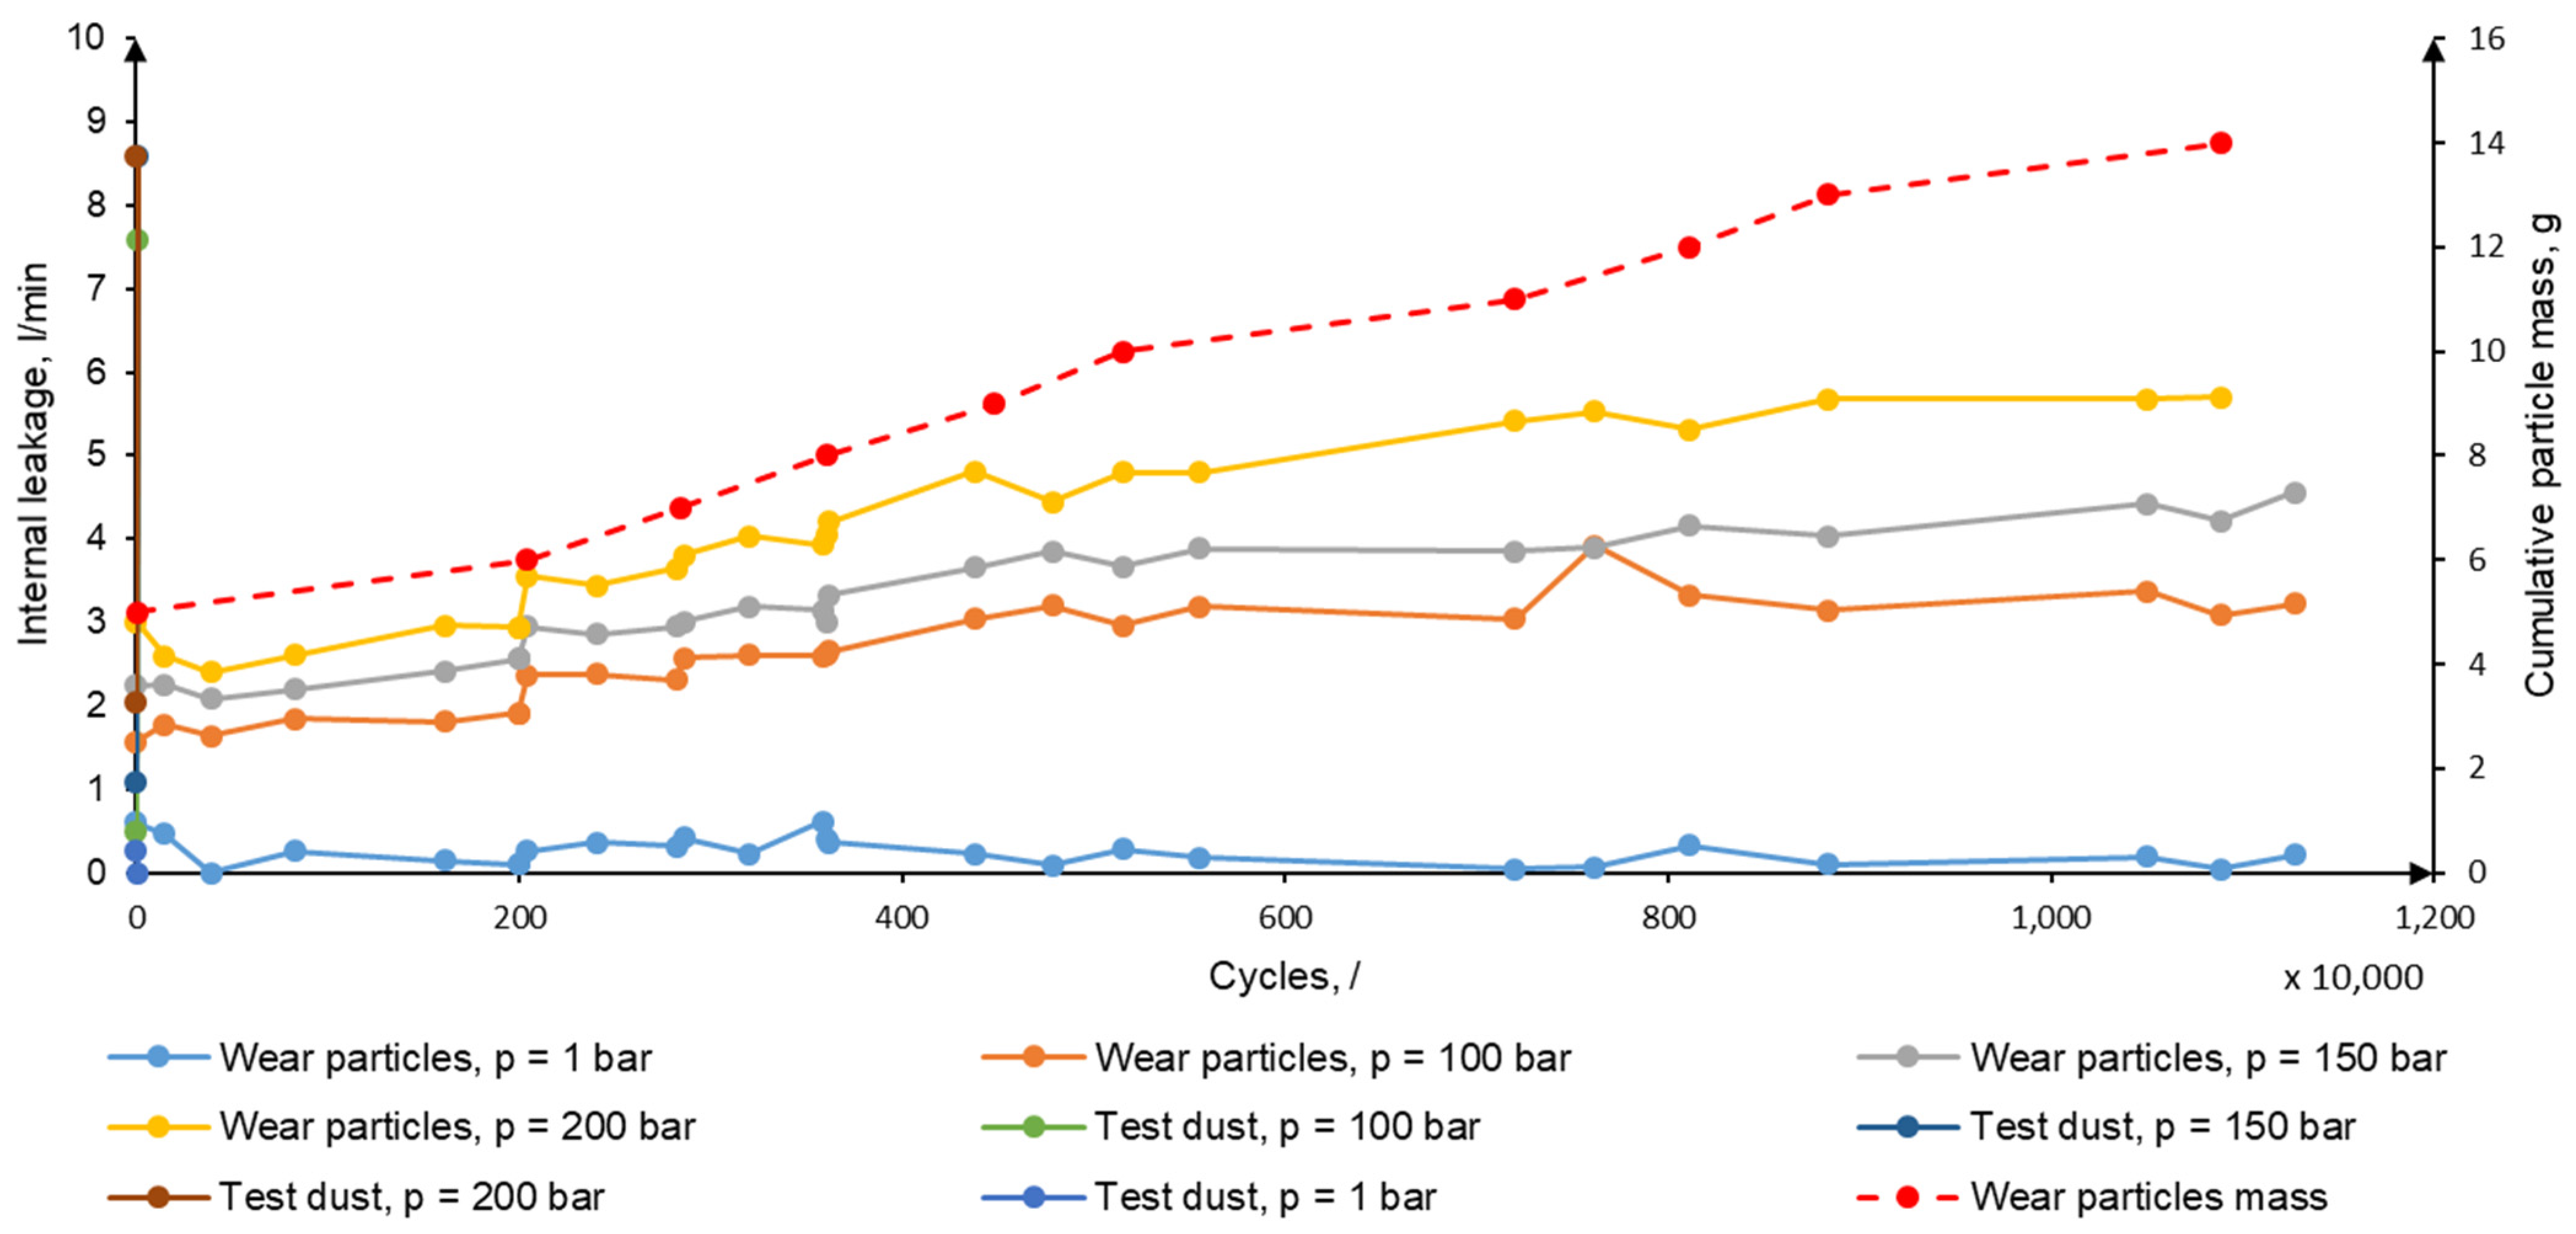
3.4. Internal Leakage Measurements on Hydraulic Motor
4. Discussion
4.1. Comparison of Hydraulic Gear Pumps Tested with Wear Particles and Test Dust
4.2. Comparison of Directional 4/3 Valves Tested with Wear Particles and Test Dust
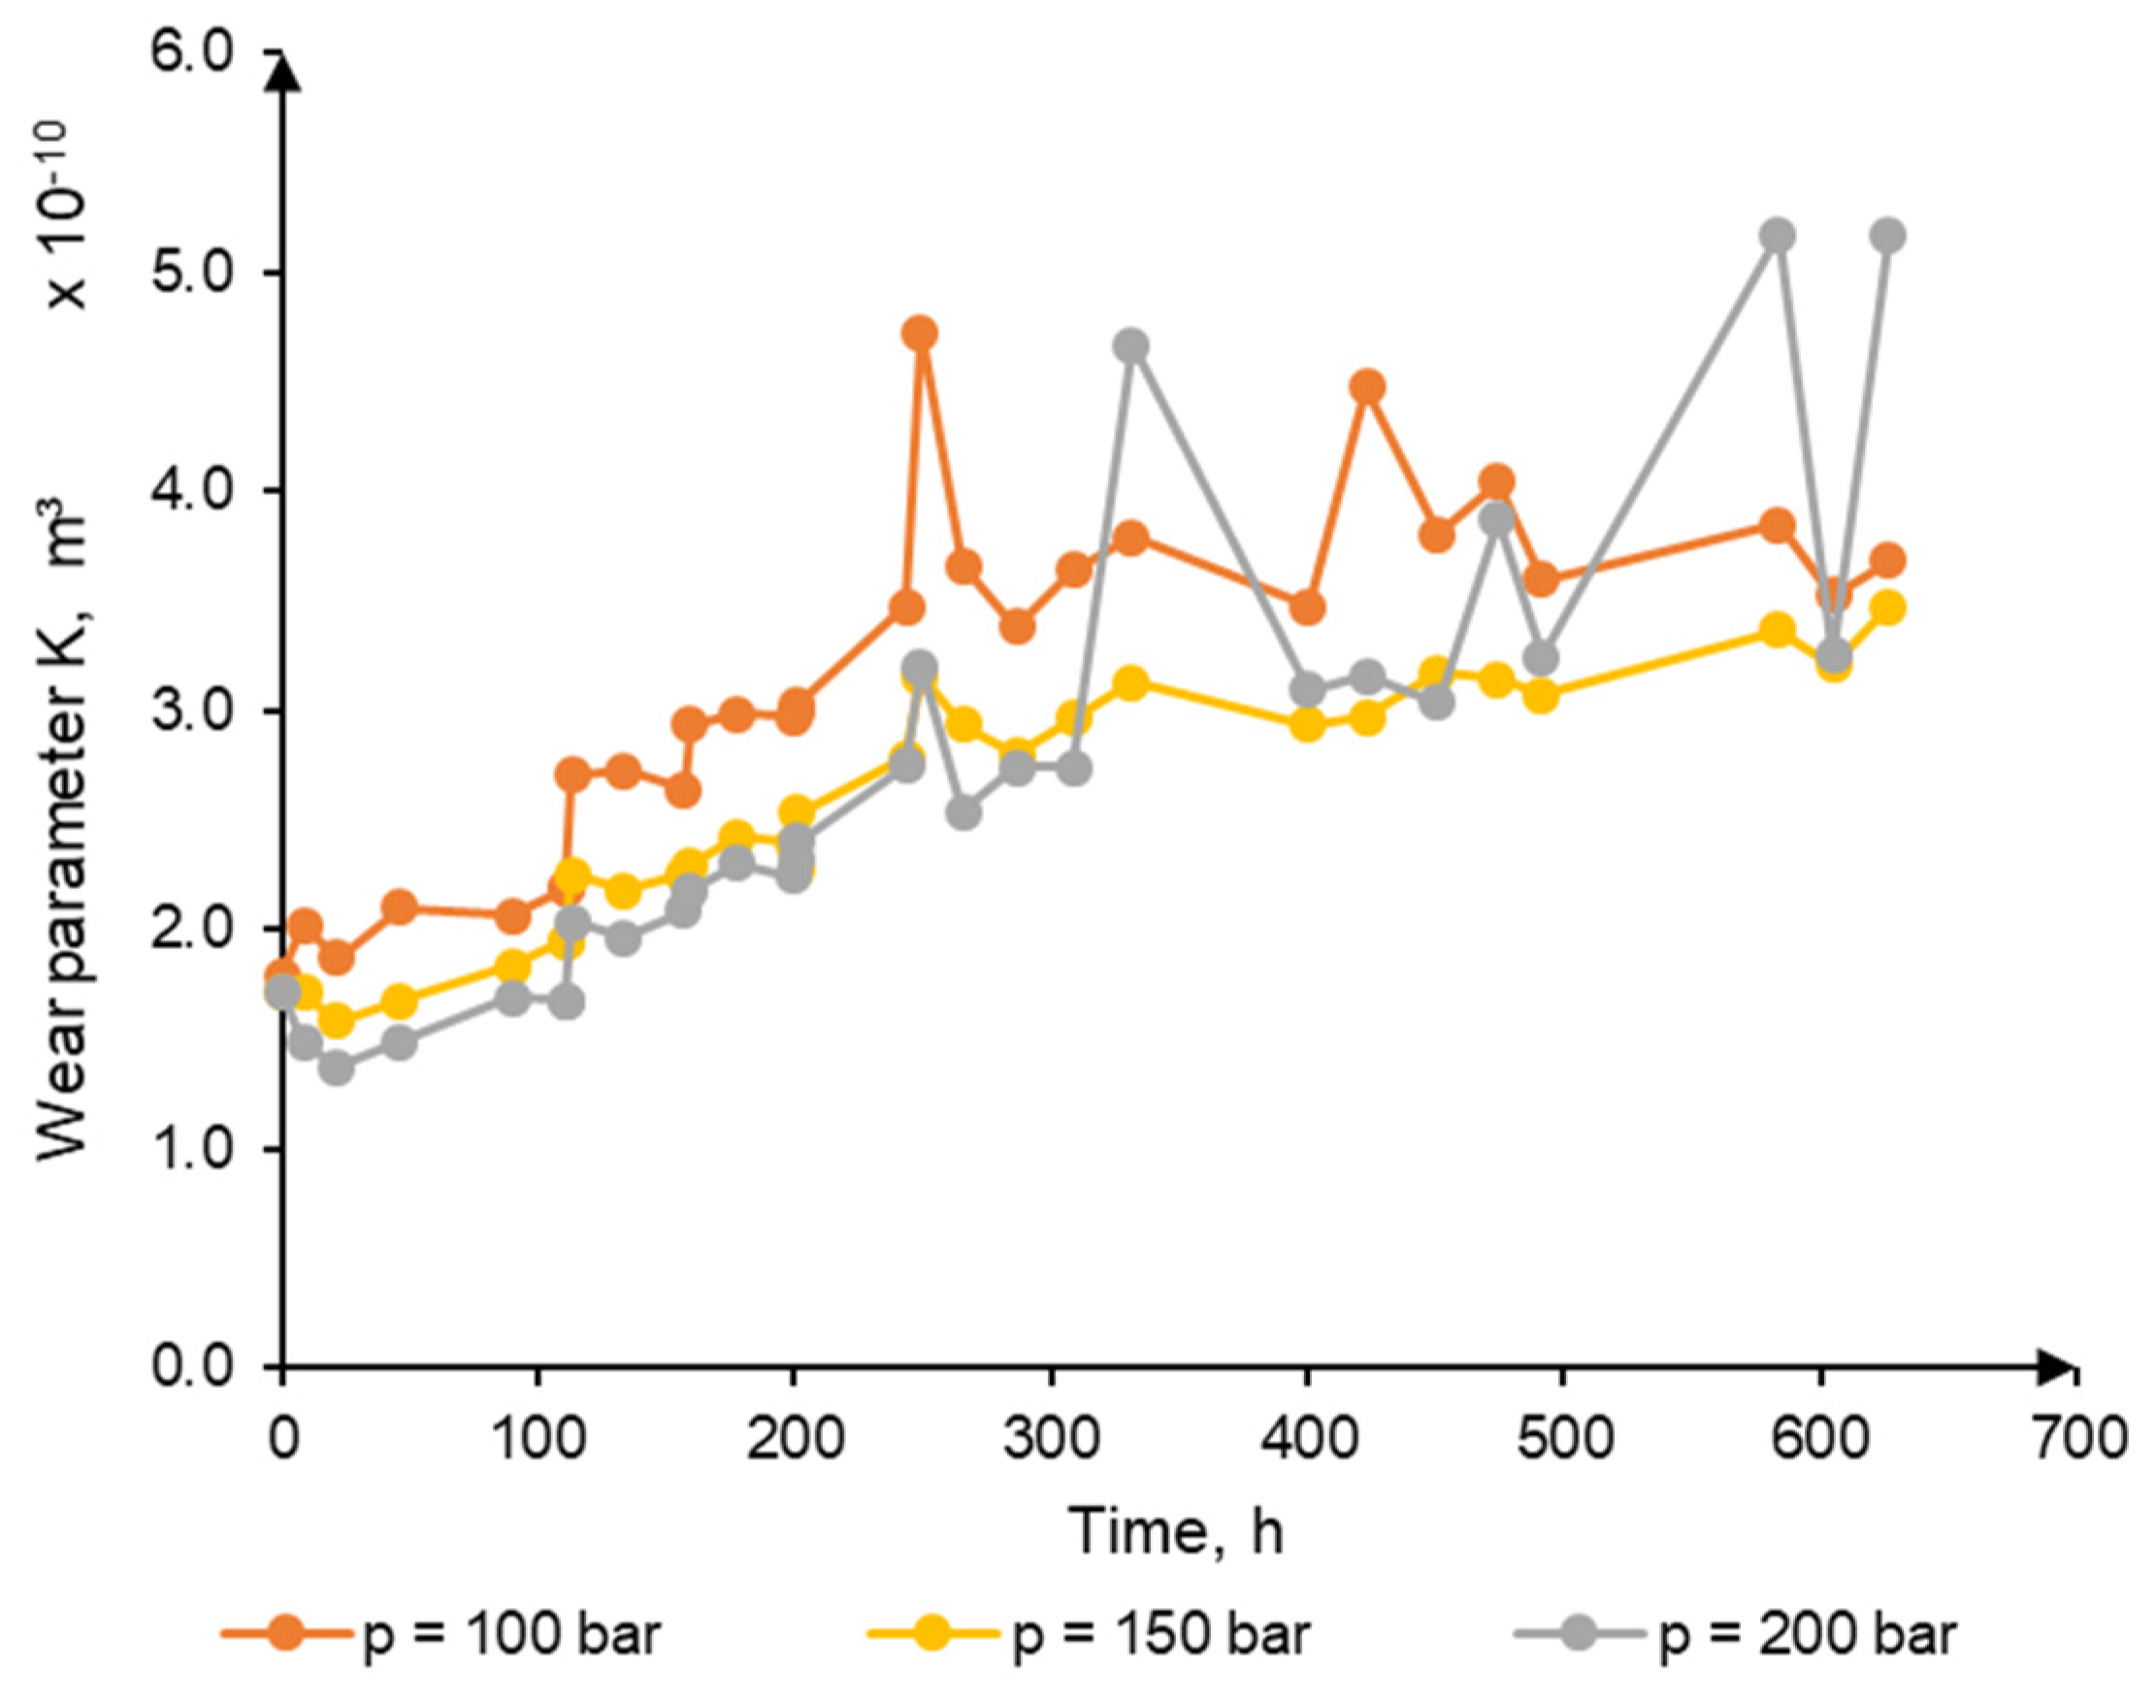
4.3. Wear Parameter
5. Conclusions
- The hydraulic system tested with wear particles failed after 624 h of operation because the pump could not reach a pressure higher than 149 bar, which is insufficient for most hydraulic applications. The hydraulic system tested with test dust failed after 5.3 min of operation because the pump could not reach a pressure higher than 27 bar.
- The cleanliness of the oil, including the wear particles, was 22/21/19, and the cleanliness of the oil, including the test dust, was 21/21/21. The test results show that the wear particles are less abrasive than the test dust, which can be attributed to the different operating times of the two hydraulic systems and the relatively equal concentration of contaminants (wear particles and test dust) in the hydraulic oil in each system.
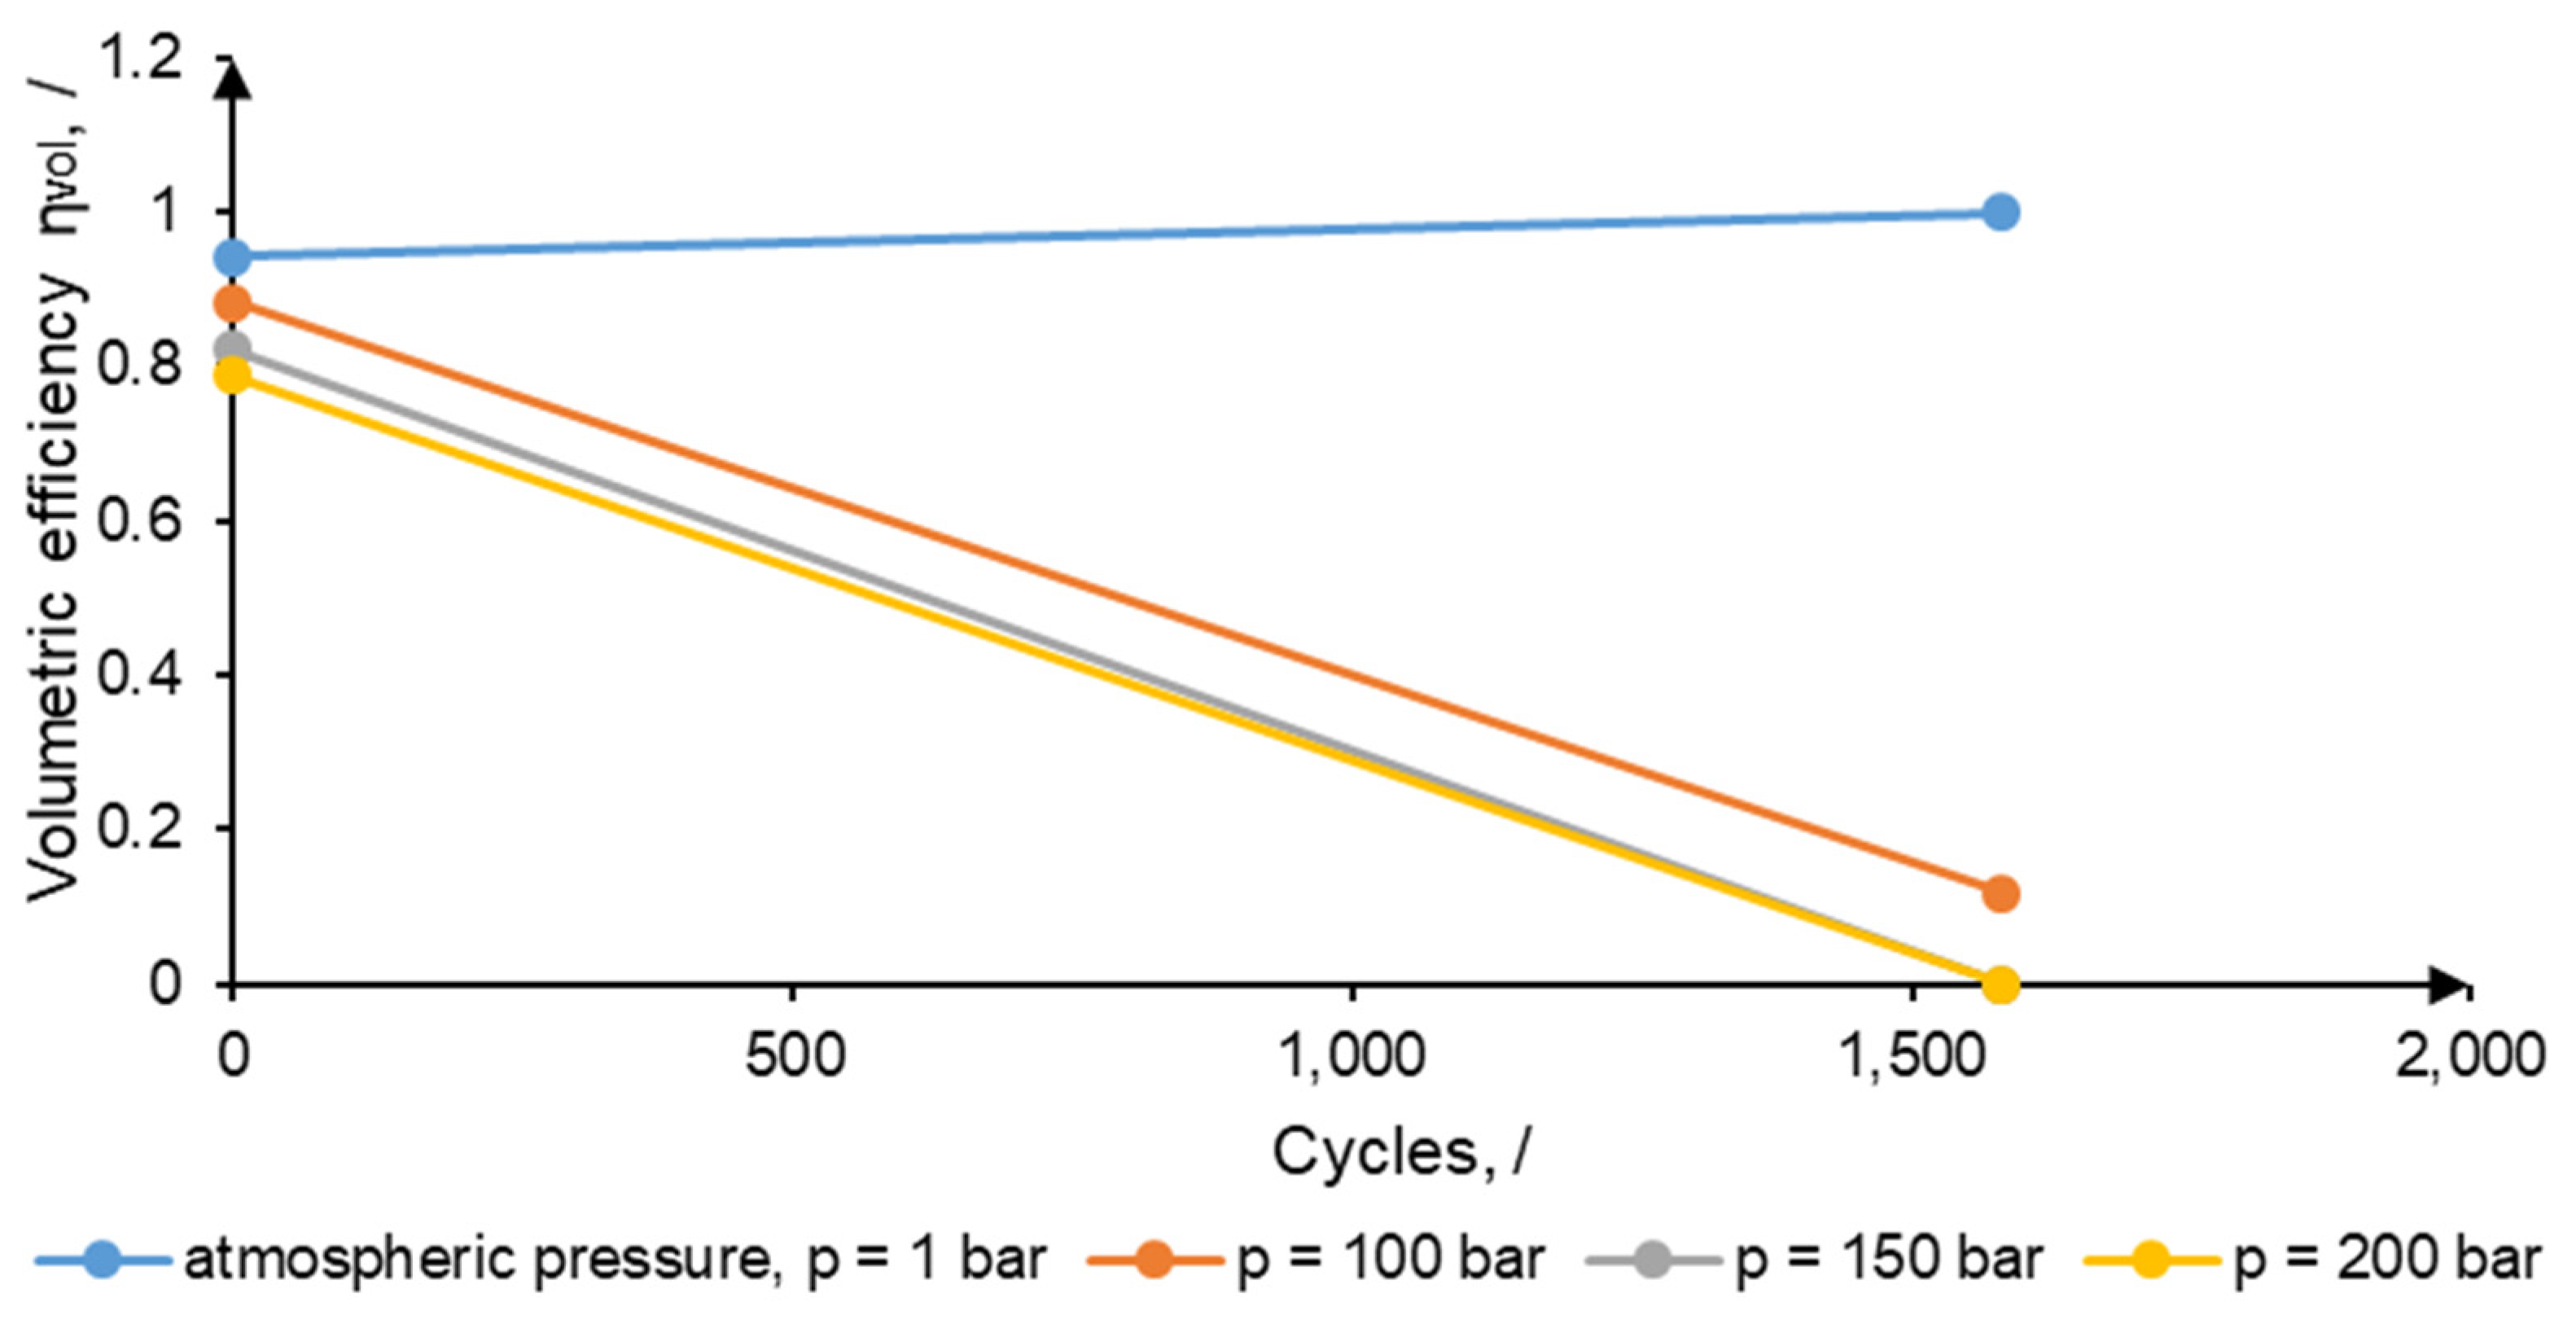
- The volumetric efficiency of the pump tested with wear particles decreased from 0.83 to 0.64 after 623 h of operation with a decrease in efficiency of 0.18. For the pump tested with test dust, the efficiency dropped from 0.87 to 0.11 within 5.3 min with a decrease of 0.76.
- The volumetric efficiency of the valve tested with wear particles decreased from 0.998 to 0.990, corresponding to a 0.008 decrease in efficiency, and the valve tested with test dust had a decrease from 0.995 to 0.986, corresponding to a 0.009 decrease in efficiency. Compared to the drop in efficiency of the pump, the drop in efficiency of the valve is negligible. The difference is due to the fact that the aluminum housing of the gear pump is a softer material than the cast iron housing of the directional 4/3 valve and therefore wears out much faster. It is also recognized that the valve is tribologically less loaded than the gear pump.
- The wear parameter represents the amount of leakage as a function of various pressures and indicates the amount of wear of a particular hydraulic component. For the pump tested with wear particles, the value is 4 × 10⁻¹³ m3 at the beginning of the test and varies from 7.5 × 10⁻¹³ to 1.1 × 10⁻¹² m3.
- An important part for improving hydraulic systems operation is filtering. Extra care should be taken when new hydraulic is put into the existing operating system in order to avoid contamination, especially with hard particles, such as test dust (SiO2, Al2O3, etc.). New hydraulic fluid should be filtered and the cleanliness of the fluid should be measured, and if the cleanliness is equal or better than the one in the system, only then can fluid be put in the system. Particles cannot be entirely removed from the hydraulic fluid because new particles are also generated due to components wear during the operation of the machine, and furthermore, the smallest particles cannot be removed with the filter because the grid of the filter material is too rough.
- A higher concentration (greater number) of particles causes a higher possibility that these particles will damage the sealing surfaces and wear surfaces. With an increase in wear, the gap between the sealing surfaces increases and therefore the leakage increases. Test dust has a higher hardness than wear particles; therefore, it will cause a larger amount of wear than wear particles in the same operation time. With further testing at different fluid cleanliness levels with wear particles and test dust, the acceleration factor can be determined.
Novelty and Aspects of the Study
- (1)
- Two experiments and the comparison between test dust and wear particles were presented for the first time.
- (2)
- The two identical test rigs and test procedures with identical hydraulic components showed that the test dust has a more damaging effect than the wear particles present in the real hydraulic system.
- (3)
- The acceleration factor in tests with test dust is about 7000.
- (4)
- The most wear-prone component is the gear pump due to its aluminum alloy housing.
- (5)
- The directional control valve was tribologically less loaded than the gear pump, which consequently had a more constant volumetric efficiency.
- (6)
- Filtration is one of the most important procedures that every hydraulic system should incorporate to provide sufficient fluid cleanliness and prolong the service life of the system.
Author Contributions
Funding
Institutional Review Board Statement
Informed Consent Statement
Data Availability Statement
Acknowledgments
Conflicts of Interest
Glossary
| Wear particles | Particles generated due to wear between the sliding surfaces of the elements of a component. |
| Service life | Product or component period can continuously perform its intended function. |
| Hydraulic fluids | Hydraulic fluid is the medium used to transmit power in hydraulic machines. |
| Filtration | Separating substances based on their physical and chemical properties. Usually involves the removal of solid particles from a mixture containing both solids and liquids. |
| Cleanliness of fluids | According to the standard ISO 4406, cleanliness is the particle concentration and size distribution in a fluid and is evaluated with three size categories: number of particles greater than 4 μm, particles greater than 6 μm, and particles greater than 14 μm. |
| Acceleration testing | Process of testing a product or component by subjecting it to conditions beyond normal operating parameters in order to rapidly uncover faults and potential causes of failure. |
| Gear pumps | Pumps use the meshing of gears to pump fluid by displacement. They are one of the most common types of pumps for hydraulic fluid power applications. |
| Hydraulic components | Part of a hydraulic system that performs one or more of the following functions: generation, transport, or control of hydraulic power, actuation, and fluid maintenance. This includes pumps, pipes, valves, cylinders, hydraulic motors, filters, tanks, etc. |
| Internal leakage | Inside components, there is a gap between the two elements with relative velocities. When there is a pressure difference, a certain flow escapes through this gap, which is called internal leakage. Internal leakage is inevitable in components that use elements with sliding contacts. As the sliding surfaces wear, the internal leakage increases. |
| Directional valve | Hydraulic component that controls the direction of flow of hydraulic energy and thus fluid. |
| Performance monitoring | A set of measurements and tools that you can use to determine how well the applications are working and how efficient the system is. |
| Troubleshooting | A systematic approach to problem solving designed to track down the problem with appropriate measurement equipment and correct the problem by replacing or repairing the system component. |
References
- Zhang, Y.; Liu, Y.; Wang, Z.; Tao, Y.; Yang, L.; Li, Y. Prediction of Oil Contamination in Aviation Hydraulic System and Active Leakage Strategy. In Proceedings of the 2022 IEEE 17th Conference on Industrial Electronics and Applications (ICIEA), Chengdu, China, 16–19 December 2022; pp. 578–583. [Google Scholar] [CrossRef]
- Ng, F.; Harding, J.A.; Glass, J. Improving hydraulic excavator performance through in line hydraulic oil contamination monitoring. Mech. Syst. Signal Process. 2017, 83, 176–193. [Google Scholar] [CrossRef] [Green Version]
- Jardine, A.K.; Lin, D.; Banjevic, D. A review on machinery diagnostics and prognostics implementing condition-based maintenance. Mech. Syst. Signal Process. 2006, 20, 1483–1510. [Google Scholar] [CrossRef]
- Zio, E.; Peloni, G. Particle filtering prognostic estimation of the remaining useful life of nonlinear components. Reliab. Eng. Syst. Saf. 2011, 96, 403–409. [Google Scholar] [CrossRef]
- ISO 4406:2017; Hydrulic Fluid Power-Fluids-Method for Coding the Level of Contamination by Solid Particles. ISO: Geneva, Switzerland, 2017.
- Day, M.; Hong, J.-H. The AS4059 Hydraulic System Cleanliness Classification System: Replacement of NAS1638. J. Drive Control. 2012, 9, 39–45. [Google Scholar] [CrossRef]
- Frith, R.; Scott, W. Control of solids contamination in hydraulic systems—An overview. Wear 1993, 165, 69–74. [Google Scholar] [CrossRef]
- Esteves, P.J.; Seriacopi, V.; de Macêdo, M.C.S.; Souza, R.M.; Scandian, C. Combined effect of abrasive particle size distribution and ball material on the wear coefficient in micro-scale abrasive wear tests. Wear 2021, 476, 203639. [Google Scholar] [CrossRef]
- Trezona, R.; Allsopp, D.; Hutchings, I. Transitions between two-body and three-body abrasive wear: Influence of test conditions in the microscale abrasive wear test. Wear 1999, 225–229, 205–214. [Google Scholar] [CrossRef]
- Moosavi, A.; Osterland, S.; Krahl, D.; Müller, L.; Weber, J. Numerical Prediction and Experimental Investigation of Cavitation Erosion of Hydraulic Components Using HFC. J. Mech. Eng. Autom. 2020, 10, 129–139. [Google Scholar] [CrossRef]
- Peng, Z.; Kessissoglou, N.; Cox, M. A study of the effect of contaminant particles in lubricants using wear debris and vibration condition monitoring techniques. Wear 2005, 258, 1651–1662. [Google Scholar] [CrossRef]
- Gorle, J.; Heiskanen, V.-M.; Nissi, S.; Majas, M. Effect of temperature, flow rate and contamination on hydraulic filtration. MM Sci. J. 2018, 2018, 2490–2493. [Google Scholar] [CrossRef]
- Fletcher, R.; Bright, D. Shape Factors of ISO 12103-A3 (Medium Test Dust). Filtr. Sep. 2000, 37, 48–56. [Google Scholar] [CrossRef]
- Fletcher, R.; Filliben, J.; Ritchie, N.; Petillon, N. Acceptance Testing Methodology for the Production of Standard Reference Material 2806: Medium Test Dust in Hydraulic Fluid. J. Res. Natl. Inst. Stand. Technol. 2021, 126, 126044. [Google Scholar] [CrossRef]
- Szala, M.; Szafran, M.; Macek, W.; Marchenko, S.; Hejwowski, T. Abrasion Resistance of S235, S355, C45, AISI 304 and Hardox 500 Steels with Usage of Garnet, Corundum and Carborundum Abrasives. Adv. Sci. Technol. Res. J. 2019, 13, 151–161. [Google Scholar] [CrossRef]
- Gots, A.N.; A Amirseyidov, S. Analysis of accelerated methods testing piston engine for reliability. IOP Conf. Series: Mater. Sci. Eng. 2021, 1086, 012006. [Google Scholar] [CrossRef]
- Fitch, E.C.; Inue, R. Hydraulic Component Service Life as Influenced by Lubricity and Abrasivity. In Proceedings of the 38th National Conference on Fluid Power, Chicago, IL, USA, 16–18 November 1982; pp. 201–207. [Google Scholar]
- Frith, R.; Scott, W. Comparison of an external gear pump wear model with test data. Wear 1996, 196, 64–71. [Google Scholar] [CrossRef]
- Backé, W. Recent research projects in hydraulics. Proc. JFPS Int. Symp. Fluid Power 1993, 1993, 3–27. [Google Scholar] [CrossRef]
- Jung-Hun, S.; Kyung-Ryeol, J.; Hyoung-Eui, K. A Study on the Effects of Contaminant Types on the Wear Degradation Characteristics in Internal Gear Pumps. Tribol. Lubr. 2011, 27, 134–139. [Google Scholar]
- Zhang, K.; Yao, J.; Jiang, T. Degradation assessment and life prediction of electro-hydraulic servo valve under erosion wear. Eng. Fail. Anal. 2014, 36, 284–300. [Google Scholar] [CrossRef]
- Ranganathan, G.; Raj, T.H.S.; Ram, P.M. Wear characterisation of small PM rotors and oil pump bearings. Tribol. Int. 2004, 37, 1–9. [Google Scholar] [CrossRef]
- Frith, R. A Model of Gear Pump Wear due to Solids Contamination. Ph.D. Thesis, Queensland University of Technology, Brisbane, Australia, 1994. [Google Scholar]
- Peng, C.; Fischer, F.J.; Schmitz, K.; Murrenhoff, H. Comparative analysis of leakage calculations for metallic seals of ball-seat valves using the multi-asperity model and the magnification-based model. Tribol. Int. 2021, 163, 107130. [Google Scholar] [CrossRef]
- Majdič, F.; Pezdirnik, J.; Kalin, M. Experimental validation of the lifetime performance of a proportional 4/3 hydraulic valve operating in water. Tribol. Int. 2011, 44, 2013–2021. [Google Scholar] [CrossRef]
- Zhang, D.; Li, Z.; Wang, L.; Kong, L.; Gao, F.; Wang, Q. Study on tribological properties of boronized and textured composite surface and its application on camshaft connecting-rod type hydraulic motor. Wear 2021, 482-483, 203964. [Google Scholar] [CrossRef]
- Ludema, K.C.; Ajayi, L. Friction, Wear, Lubrication: A Textbook in Tribology, 2nd ed.; CRC Press: Boca Raton, FL, USA, 2018. [Google Scholar] [CrossRef]
- Duplomatic Motion Solutions: DS3 Solenoid Operated Directional Control Valve. Available online: https://duplomaticmotionsolutions.com/docs/2021/41150-ed-121_c84c2271fb.pdf (accessed on 20 May 2023).
- MMFS50C: Product Feature Summary. Available online: https://www.danitrading.dk/Content/ProductFiles/leverand%C3%B8rer%20-%20udland/m%20plus%20s/datablad/mmfs50c.pdf (accessed on 20 May 2023).
- Pezdirnik, J. Fluid flow through gaps in hydraulic components—(Liquid flow through gaps between paralell surfaces without relative velocity). Stroj. Vestn. J. Mech. Eng. 2001, 47, 210–216. [Google Scholar]
- Strmčnik, E.; Majdič, F. Comparison of leakage level in water and oil hydraulics. Adv. Mech. Eng. 2017, 9, 168781401773772. [Google Scholar] [CrossRef]
- Findeisen, D. Ölhydraulik: Handbuch für die Hydrostatische Leistungsübertragung in der Fluidtechnik, 5th ed.; Springer Verlag: Berlin/Heidelberg, Germany, 2006. [Google Scholar]
- Swanson, P.A.; Vetter, A.F. The Measurement of Abrasive Particle Shape and Its Effect on Wear. ASLE Trans. 1985, 28, 225–230. [Google Scholar] [CrossRef]


| Position | Item Description |
|---|---|
| 1 | Gear pump with fix displacement |
| 2 | Electric motor |
| 3 | Pressure relief valve |
| 4 | 4/3 directional valve with solenoid |
| 5 | Hydraulic block |
| 6 | Hydraulic motor |
| 7 | Hydraulic priority valve |
| 8 | Filter |
| 9 | Cooler |
| 10 | Electric motor for vent |
| 11 | Pressure relief valve for measuring |
| 12 | Check valve |
| 13 | Manometer |
| 14 | Pressure sensor |
| 15 | Orifice |
| 16 | Temperature and oil level switch |
| 17 | Manually operated 3/2 valve |
| 18 | Flexible hydraulic hose |
| 19 | Reservoir |
| 20 | Pressure relief valve for measuring |
| 21 | Quick coupling for measurement |
| Pressure p, Bar | Actual Rotational Speed nact, rev/min | Theoretical Rotational Speed ntheor, rev/min |
|---|---|---|
| 0 | 1498 | 1500 |
| 50 | 1489 | 1500 |
| 100 | 1480 | 1500 |
| 150 | 1465 | 1500 |
| 200 | 1460 | 1500 |
Disclaimer/Publisher’s Note: The statements, opinions and data contained in all publications are solely those of the individual author(s) and contributor(s) and not of MDPI and/or the editor(s). MDPI and/or the editor(s) disclaim responsibility for any injury to people or property resulting from any ideas, methods, instructions or products referred to in the content. |
© 2023 by the authors. Licensee MDPI, Basel, Switzerland. This article is an open access article distributed under the terms and conditions of the Creative Commons Attribution (CC BY) license (https://creativecommons.org/licenses/by/4.0/).
Share and Cite
Novak, N.; Trajkovski, A.; Kalin, M.; Majdič, F. Degradation of Hydraulic System due to Wear Particles or Medium Test Dust. Appl. Sci. 2023, 13, 7777. https://doi.org/10.3390/app13137777
Novak N, Trajkovski A, Kalin M, Majdič F. Degradation of Hydraulic System due to Wear Particles or Medium Test Dust. Applied Sciences. 2023; 13(13):7777. https://doi.org/10.3390/app13137777
Chicago/Turabian StyleNovak, Nejc, Ana Trajkovski, Mitjan Kalin, and Franc Majdič. 2023. "Degradation of Hydraulic System due to Wear Particles or Medium Test Dust" Applied Sciences 13, no. 13: 7777. https://doi.org/10.3390/app13137777