

An Efficient NIDPS with Improved Salp Swarm Feature Optimization Method

Department of Information Systems, College of Computer and Information Sciences, King Saud University, Riyadh 11451, Saudi Arabia
Appl. Sci. 2023, 13(12), 7002; https://doi.org/10.3390/app13127002
Submission received: 30 April 2023
/
Revised: 31 May 2023
/
Accepted: 3 June 2023
/
Published: 10 June 2023
(This article belongs to the Special Issue Recent Advances in Cybersecurity and Computer Networks)
Abstract
:Network security problems arise these days due to many challenges in cyberspace. The malicious attacks on installed wide networks are rapidly spreading due to their vulnerability. Therefore, the user and system information are at high risk due to network attacks. To protect networks against these attacks, Network Intrusion Detection and Prevention Systems (NIDPS) are installed on them. These NIDPS can detect malicious attacks by monitoring abnormal behavior and patterns in network traffic. These systems were mainly developed using Artificial Intelligence (AI) algorithms. These intelligent NIDPS are also able to detect the attack type while detecting network attacks. Previous studies have proposed many NIDPS for network security. However, many challenges exist so far such as limited available data for training AI algorithms, class imbalance problems, and automated selection of the most important features. These problems need to be solved first, which will lead to the precise detection of network attacks. Therefore, the proposed framework used the highly imbalanced UNSW-NB15 dataset for binary and multiclass classification of network attacks. In this framework, firstly dataset normalization is applied using standard deviation and the mean of feature columns; secondly, an Improved Salp Swarm Algorithm (ISSA) is applied for automated feature selection separately on binary and multiclass subsets. Thirdly, after applying feature selection, the SMOTE–Tomek class balancing method is applied where at least four different ML classifiers are used for binary and multiclass classification. The achieved results outperformed as compared to previous studies and improved the overall performance of NIDPS.
1. Introduction
Today, many anomalies are found in any systems such as in healthcare, blockchain, cloud computing, and other networks. Any deviation from normal activity in these systems is known as an anomaly. These anomalies are creating economic-, time-, and resources-based problems [1]. Similarly, network security has become an open challenge to make cyberspace stronger than ever to make it cyber-attack-free. Cybersecurity is a structure containing certain protocols to follow such as in organizations to prevent unauthorized use of information and communications in a network [2]. Warfare using the internet between countries is also rising in this modern and digital era. Therefore, cybersecurity also becomes a weapon such as to strengthen the security of national assets and to protect citizens’ information and the confidentiality of their data [3].
However, an efficient intruder detection system is needed to detect network attacks or anomalies found in systems. These anomalies are of two types: network- and host-based anomalies [4]. The host-based anomalies could be detected using Host Intruder Detection and Prevention Systems (HIDPSs), which use an application that is installed on the host side and used to monitor the incoming traffic by monitoring abnormal activities in it [5]. It does not provide any protection to the network on which the host is being installed. To take action against malicious attacks on a network, a NIDPS is needed, whereas it is installed just after the firewall is placed on the network [6].
These NIDPSs work based upon intelligent methods provided by AI. Mainly, these methods belong to Machine Learning (ML) and Deep Learning (DL) domains. These algorithms took cleaned data as input by applying pre-processing operations on raw data to develop a NIDPS [7]. These trained and classifiable methods are then installed on a NIDPS to detect the abnormal behavior of network traffic and pop up an alert to network engineers. The data created by internet sources and the big networks themselves have an abundance of traffic that makes the network complex and wide. These big data and wide networks make networks more vulnerable to malicious attacks. However, the response against each type of network type is different. Therefore, the precise detection of network attacks with their category is more challenging to solve. The probability to detect attack-type affects performance as the problem becomes multiclass [8].
NIDPS problems are not only about its performance efficiency against detection of multiple types of attacks, but it also has problems while proposing an optimal solution using ML [9] and DL [10] methods. These problems include the selection of the most distinguishing features to detect network attacks. For feature selection, many methods such as wrapper method [11], algorithm-based methods, and evolutionary computing domain [12] pruning methods are used. Feature selection before developing NIDPS is an important task as it reduces the feature matrix size while feeding it to classifiers. The evolutionary computing domain-based methods are used for automatic feature selection, which leads to full automation with a reduction of time and space complexity of NIDPS. The Particle Swarm Optimization (PSO) method is also used for feature selection, which improved the classification results [13], whereas this study suggested using more methods of PSO for parameters optimization and to increase the NIDPS performance as well. Furthermore, a survey is conducted based on the issue of the “curse of dimensionality”. It gives an in-depth look to swarm intelligence methods for feature selection and highlights that these methods are good for feature selection due to their simpler and potential searching nature [14]. Therefore, these methods are more useful when needed to apply to big datasets.
Furthermore, class imbalance problems arise in developing NIDPS, which is a big problem. Due to imbalanced data between attack category instances, the previously proposed NIDPS becomes less reliable if their proposed methods do not solve the class imbalance ratio while training ML or DL models. The class imbalance problem normally remains ignored in many of the previously proposed NIDPS and created a big question for those NIDPS results, which does not solve it and made a biased NIDPS [15]. A class imbalance problem could also be defined as an improper distribution of categorical or binary data. It usually occurs in network-attacked datasets when the instance data against positive class exist with a lower ratio as compared to negative class data [16]. It creates a huge problem when it is fed to ML and DL classifiers by excess training of models against a single negative class only. The under-sampling and over-sampling are two ways to solve the class imbalance problem. The under-sampling technique reduces the majority class samples or instances to balance the majority and minority class instances. The over-sampling technique increases the minority class instances to solve the class imbalance problem [17]. However, these method needs vary from case study to case study of datasets.
To solve the class imbalance problem, a few of the data and algorithm-interpreted methods are proposed, which solved the minority class problem by oversampling their instance numbers. They make a new dataset and give a more authentic NIDPS by solving class imbalance problems. However, the more efficient, minority class oversampled, and robust automated method of feature selection is needed to give a more precise, efficient, reliable, and confident NIDPS [18,19]. Therefore, the proposed study uses a UNSW-NB15 dataset that contains a big class imbalance problem [20] against each category of network attack data as compared to the normal category. The proposed framework contributed in the following ways:
- A searching potential and automated method of feature selection ‘ISSA’ is applied instead of using manual features selection, which uses hit and trial methods.
- The class balancing is performed using majority and minority class balancing methods via SMOTE–Tomek on the most appropriate feature subset using ISSA.
- An improved and more efficient NIDPS is developed after solving feature selection and class balancing problems.
The rest of the article is divided into four sections. The related work, proposed methodology, results and discussion, and conclusion at last with future directions in it.
2. Related Work
Machine-learning-based schemes and methods have been extensively adopted in different real-time problems. These problems include energy consumption minimization [21], object detection [22], and more specifically the information security domain problems such as credit card fraud detection [23], CAPTCHA solving [24] to enhance the security of CAPTCHA-based security questions. Few of the recent studies focused on feature selection and class imbalance problems while proposing an IDPS. A credit card fraud detection method is proposed [25] in which firstly the outliers are removed from the dataset to clean it, and secondly the feature ranking is performed using the Shapiro method to select the most important features. The class oversampling is performed using the SMOTEN method. The oversampled, feature-selected based experiment increases the performance of classification from 0.971 AUC to 1.00. The recent studies and their applied approaches, including their used datasets and their achieved results, are discussed in this section. A two-phase feature selection approach is applied using (1) a filter method, which is made up of information gain and random forest that reduces the dimensionality of the features, (2) an applied recursive feature selection approach applied that removes the redundancy of the feature set [26].
The UNSW-NB15 dataset [20,27,28] is used in this study, where multiclass classification performance is increased by applying the multi-layer perceptron (MLP) method and achieves an accuracy of 84.24%. The final selected features were 23, which were filtered from 42 features given in the dataset. A binary classification based upon the UNSW-NB15 dataset is applied and Decision Tree (DT) was found as the best classifier among five different applied ML classifiers [29]. The chi-square feature selection method is applied for feature selection and then uses 5 ML classifiers to classify the UNSW-NB15 dataset. Another study [30] uses the recursive feature selection method and gives an improved accuracy-based result. The 20 important features are selected from UNSW-NB15 datasets, which have 42 total features in them. The test-set-based prediction assessment gave 97.34% accuracy.
S.M. Kasongo et al. [31] proposed a filter for feature selection adopted using the XGBoost algorithm. The 19 features were filtered from 42 features whereas classical ML methods are applied for binary and multi-class classification. The training, testing, and validation results are reported where the best achieved multi-class testing accuracy is 77.51%, precision 79.50%, recall 77.53%, and F1-score 77.28% using Artificial Neural Network (ANN). The binary-classification-based best results were achieved by Decision Tree (DT) with 90.85% accuracy, 80.33% precision, recall 98.38%, and 88.45% F1-score. It claimed that the feature selection approach increased the binary classification results from 88% to more than 90%.
The multi-class and binary class classification was performed on KDDCUP99 and UNSW-NB15 datasets [32]. A different SVM model was proposed and used for classification. It used the non-linear behavior of data normalization instead of default linear data normalization. The binary classification accuracy achieved 85.99%, whereas multi-class classification accuracy reached 75.77%. The class imbalance problem is solved by a few studies that have shown that the NIDS detection performance is improved. The two-stage focal loss-based deep neural network (DNN) was applied to handle the imbalance class distribution in the UNSW-NB15 dataset. The comparative analysis of multiclass classification results showed that the proposed DL method increases the F1-score to 6.37% [33]. It furthermore reported that their proposed focal loss-based learning improved the minority class problem of a dataset. On the same dataset of UNSW-NB15, the class balancing was fulfilled via Generative Adversarial Network (GAN) by generating new instances [34]. Furthermore, the chi-square method is used for feature selection and then fed to ML classifiers. The reported results show that accuracy improvement for multiclass and binary are reached up to 87.44% and 98.14%, respectively.
The recursive elimination method with random forest method was adopted for features selection where many of the classical ML methods were applied on the UNSW-NB15 dataset [35]. The two-stage classification was performed where 74% accuracy was achieved at the first stage with SVM and then its output was given to multiple classifiers and achieved the 86% classification accuracy with 12% improvement. M. Zeeshan et al. [36] proposed UNSW-NB15 dataset classification and BoT-IoT dataset classification on binary and three classes (DoS, DDoS, and Normal) based multiclass classification. In this method, the authors reported that standard features are used, which are selected as per protocol followed by networks. The manual selection to cover class imbalance is performed by selecting equal instances of binary and multiclass classification. An LSTM model for classification is used where 96.3% accuracy is achieved on both types of classification.
An efficient technique to propose IDS was conducted by M. Bakro et al. [37]. It uses a feature selection approach using four filters, chi-square, symmetric uncertainty, and an automated method of the stacked encoder. These filters formed a new feature vector, which fed the ensemble method of classification having LSTM, SVM, XGBoost, and FLN methods. Further optimization of these ensemble methods is performed using the crow search method. It validated the results on three datasets; namely, NSL-KDD, Kyoto, and CSE-CIC-IDS-2018.
Another study [38] used SMOTE method to over-sample the minority class instances and increase their class ratio against the normal class using three datasets: NSL-KDD, KDD99, and UNSW-NB15. The features are selected using the Gini method, where only 24 features are selected among 41 in the KDD-99 dataset, 20 selected from NSL-KDD, and 30 from the UNSW-NB15 dataset. The weighted F1-scores reported for three datasets, the highest weighted F1-scores for UNSW-NB15 dataset achieved by random forest and it increased to 78% via SMOTE as compared to the original UNSW-NB15 F1-score that was 77% for multiclass. The highest binary F1-score for SMOTE-based UNSW-NB15 against random forest was up to 88.5%. The KDD99 achieved 94% F1-score for binary class and 90 with decision tree as highest for multiclass. NSL with SMOTE achieved 72 for multiclass with random forest and 83 highest for binary class with K-means.
The multiple deep learning models have been applied on two datasets: NSL-KDD and UNSW-NB15 [39]. The XGboost method of feature selection was applied to reduce the feature space. The 22 and 17 numbers of the feature have been selected from NSL-KDD and UNSW-NB15 datasets, respectively. The applied methods include simple Recurrent Neural Network, LSTM, and GRU models. Both binary and multiclass types of classifications are applied, where XGBoost-LSTM achieved the highest accuracy in binary classification for the NSL-KDD dataset, and test accuracy as 88.13% and 87.07% for the UNSW-NB15 dataset. In multiclass classification, NSL-KDD achieved 86.93% and for the UNSW-NB15 dataset, and it reached up to 78.40% via the XGBoost-GRU method.
The two-way minority balancing and majority creation are applied with SMOTE and One-Sided Selection (OSS) methods [40]. In this way, a balanced dataset is produced that reduces the training and testing time in the next stage. CNN and LSTM classifiers are applied to extract the spatial and temporal features, respectively. The testing accuracy for NSL-KDD% was reported as 83.58% and 77.16% for the UNSW-NB15 dataset. It mainly focuses on hybrid approaches applied for class balancing and NIDS.
A summary of recently applied methods that most directly solved the NIDS problem without solving the class imbalance problem and achieved classification results using different datasets is shown in Table 1. It is also seen in the above-discussed articles that recently many of the studies are using class imbalance problem solutions using various methods such as SMOTE, the manual selection of equal instances from each class, etc. The used methods are of manual adaptation while not giving a fully automated framework. The automation is mainly to achieve this while giving AI-based solutions. Similarly, the feature selection before applying class imbalance could reduce the classifiers’ complexity by reducing the feature set size. Furthermore, we could see that in the above studies, very few of them gave a full solution, which is solving the class imbalance problem with a feature selection solution with full automation.
Therefore, these studies still need a robust, dynamic, and more precise framework that not only focuses on the performance of NIDS, but also efficiently solves the minority class problem with appropriate feature selection methods.
3. Materials and Methods
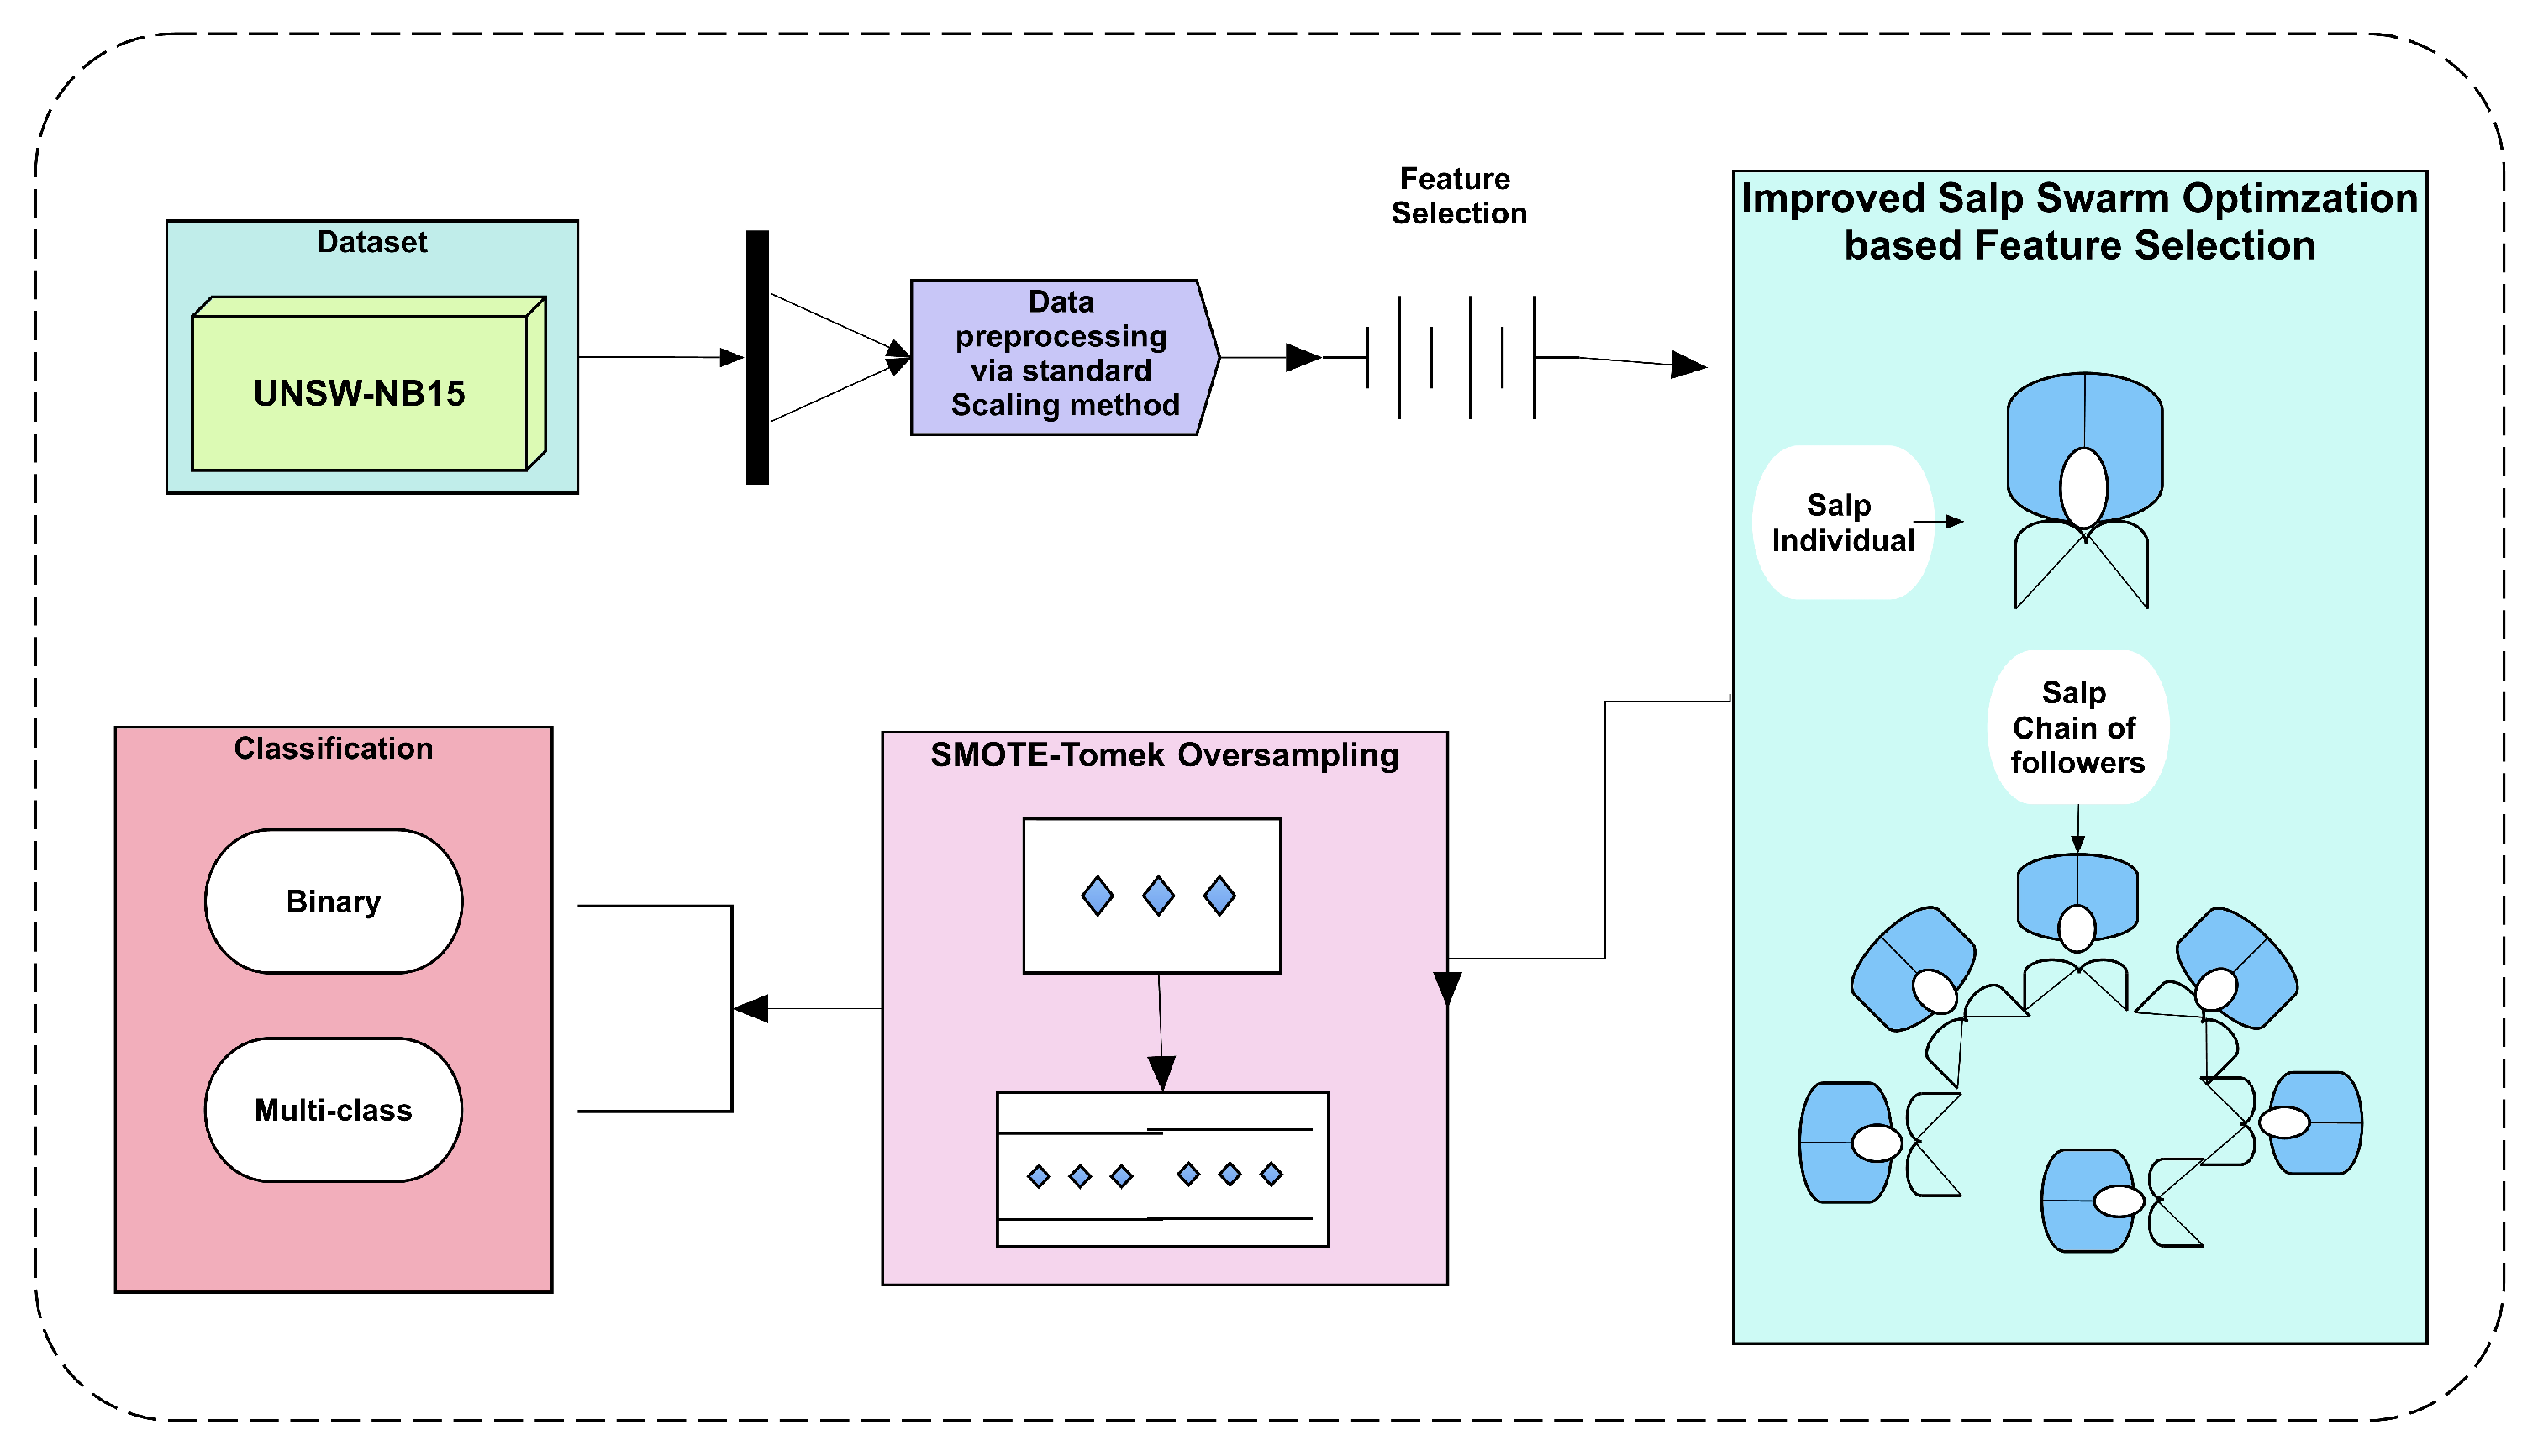
The proposed methodology consists of three major steps (feature selection, class balancing, and classification), and all of these are shown in Figure 1. The proposed framework used the UNSW-NB15 dataset, which has a high data imbalance ratio between its classes. Therefore, a class imbalance is also a problem before applying binary and multiclass classifications. In our applied approach, firstly data preprocessing is employed, which scales data according to a standard format. The preprocessed data are furthermore given to an automated method of feature selection.
The previous studies mostly used manual methods of feature selection such as fixing 15 features from 42 features of the UNSW-NB15 dataset based on their ranks or scores to feed ML classifiers. However, the proposed framework uses a dynamic method of feature selection instead of manual methods. Automated feature selection is a way in which all given features are fed to the method and select the most optimal ones. To employ this dynamic feature selection, the proposed study uses the ISSA method of feature selection. It works on a bio-inspired natural phenomenon of salps, which are sea species that remain in search of food optimally with their chain of followers.
After the selection of features, the class imbalance problem is solved using the SMOTE–Tomek method. After solving the class imbalance problem, two types of results are discussed in this study. Firstly, the results of classification before applying to oversample, feature selection. Secondly, the results after applying oversampling method via SMOTE–Tomek. Both types of results are represented and discussed in Section 4, which gives strength to the applied methods.
3.1. Data Preprocessing
The public dataset UNSW-NB15 [20] is utilized for NIDS development. It is publicly available on the internet such as on the Kaggle website [27] and the Australian Intelligent Security Group (ISG) website [28]. The dataset has two types of data (binary and multiclass) in it. The binary- and multiclass-categories-based data are extracted as two separate datasets from the original dataset and then both of them are interpreted separately in the next steps. The data normalization is applied using the standard scaler method of Python. The feature columns have different ranges of values including very higher and lower values, which badly affect machine learning results. Therefore, each feature or column value is re-scaled as mean = 0 and standard deviation = 1. The feature normalization is performed using Equation (1).
The x is the instance that is under processing of normalization, whereas is the mean of an overall column and is the standard deviation that is calculated for that column. After applying the data preprocessing step on the dataset, the feature selection is performed to reduce the high dimensionality of the dataset. is the mean of an overall column and is the standard deviation, which is calculated for the under-consideration column. After applying the data preprocessing step on the dataset, the feature selection is performed to reduce the high dimensionality of the dataset.
3.2. Feature Selection Using Improved Salp Swarm Algorithm (ISSA) Method
In the feature selection phase, previously many of the studies used wrapper and filter methods. Those are old and manual methods based on scores and rankings of features. Therefore, the proposed study uses an automated way of feature selection via an evolutionary computing domain method.
Evolutionary computing domain methods are nature-inspired and have heuristic ways to find an optimal way to fulfill their goals. These methods are considered to be more optimal due to their heuristic and searching potential nature. It does not use any fixed threshold value to filter out any particular data whereas it uses a fitness function to calculate and iterate over the whole feature space of given data. It uses multiple iterations and uses all feature combinations throughout the input feature space. Therefore, it is considered a more optimal solution as compared to other manual feature selection methods. For example, sea species search around for food and have almost the same searching criteria.
Similarly, salp is a marine organism that has a shape very similar to jellyfish. It moves and feeds through its feeding filters. It has a salp chain-like structure. While finding food, its leader’s salp individual leads the chain and tries to find the optimal location to find food. Once a more optimal location is found, it updates the whole salp chain after updating the leader location into search space. The original method of SSA was developed in 2017 by Mirjalili et al. [41].
In that method, a search space is given in which a weight initialization is given to the salp population. The weights continuously remain updated using lower and upper bound values concerning the best position found by salp individuals. However, the improved version for salp swarm optimization was published in 2020 by Hegazy et al. [42]. This method uses KNN classifiers while calculating the fitness of each iteration and considers new ones on two bases: the minimization of features and the maximization of accuracy with the selected subset of features. The pseudo-steps for feature selection using the ISSA method are given in Algorithm 1:
| Algorithm 1 ISSA method working steps. |
| Step 1: Initialize and load preprocessed dataset |
| Step 2: Initialize all salp (indices) locations with random values |
| Step 3: Dedicate different feature subsets to all salps |
| Step 4: Check the fitness of all salps using the ISSA fitness function |
| Step 5: Update the positions of all salps |
| Step 6: if maximum iteration is reached or stopping condition is reached, stop and extract the maximum accuracy achieved feature subset using the KNN method or if not then revise steps 1 to 5 |
The major steps of the ISSA feature selection method are described above that contain 6 steps mainly. As we can see in step 2, the locations of salps are initialized using random values, and its mathematical representation is shown in Equation (2).
In Equation (2), , representing the leader position of the salp chain, used an inertia parameter w, which has [0,1] range of values where is the position of the food source. The is a random value that also ranges between 0,1.
It balances the exploitation fact if any are found in locating the new position of the salp leader. The () and () are showing the upper and lower bound positions of search space in a given matrix of feature column values. However, after setting the leader position in the salp chain, the followers’ positions are updated using Equation (3).
In Equation (3), the shows the position of position follower of the salp chain where n is the dimension of the given feature space. However, as discussed above, ISSA used an updated fitness function based upon the KNN classifier to update the positions of the salp and to select the most accurately classified subset of features. The fitness function is calculated using Equation (4).
The fitness is controlled by two constants known as and . The is the error rate of the classifier which is using the features subset from the total features given in the feature set matrix. However, based upon fitness value, the selection of features is controlled using a single dimension vector having 0,1 binary values to show 1 for selection of features and 0 for not selection. The mathematical representation of a singleton feature vector for feature selection is shown in Equation (5). It is taken out from the salp population containing feature subsets.
The selected feature set () is a vector showing the value 0,1 based upon the continuous position of the salp individual () in feature space n by moving with m position. The selection of features is based on the fitness value that is calculated from the feature subset performance described above. In ISSA, the salp chain generation, each salp has been assigned a different set of features and given to KNN classifiers for classification. The selected subset of features is given to classifiers, whereas the loss of it is checked in terms of the position of the salp individual. If the position of the salp chain leader is found to be better based on the selected subset feature performance, then the leader and other followers’ positions are also updated. At last, if the maximum iteration position is reached, then the position of the best-performing subset of features is finalized and the algorithm is terminated. This method of feature selection is dynamic, and it is applied on binary and multiclass feature sets separately. However, to feed the big and class-balanced dataset, the selected subset of features is given to the SMOTE–Tomek oversampling method.
3.3. SMOTE–Tomek Oversampling to Balance Class Minority
The dataset is highly imbalanced when we see multiclass instances whereas it is less imbalanced when we see binary class distributions. SMOTE single method is used as an oversampling technique to create instances for minority classes with the use of the Euclidean distance method and K-nearest neighbor (KNN) method instead of using random oversampling of the same data. The Tomek is another single method of under-sampling; it uses minority and majority class samples to create an in-between sample selected from minority and majority class data for a third class. However, the combination of both methods covers the under-sampling and oversampling of both solutions. The proposed study uses the SMOTE–Tomek method to balance the minority and majority class instances. The combination of both of these methods works in such a way that SMOTE selects random data from the minority class of selected features data of UNSW-NB15. Secondly, the distance between random data and KNN-method-based neighbors is calculated. The new instance for the minority class is inserted as a product of the different methods and calculated in the second step. The new data are created in this way until the desired amount of instances is reached for the newly inserted oversampled data. The Tomek method starts working after SMOTE by calculating majority class instances; if the ratio of the majority class already meets the required amount of data, then the new instance does not insert. The proposed study uses a different amount of class imbalance ratio against each category of the multiclass dataset to enhance the classification performance, but equalizes class distributions in the binary class problems.
3.4. Classification Using ML
The automated selected features for binary class and multiclass data are separately given to SMOTE–Tomek oversampling methods. The 2 classes-based balanced dataset using the SMOTE–Tomek method and substituted subset of important features using ISSA methods is fed to 4 different ML classifiers. The results before and after oversampling are given to show the validity of selected features based on oversampled data. The results are collected using an 80–20 dataset split of given data. The binary and multiclass classifications are performed, where 4 types of results are shown in total. Two experiments were mainly conducted. In the first, 42 original features exist in the UNSW-NB15 dataset and are used for binary and multiclass classifications. Secondly, the selected features-based minority and majority class balanced dataset is used, and results for both binary and multiclass classification are shown in Section 4.
4. Results and Discussion
The applied strategies on the UNSW-NB15 dataset to solve three major problems of NIDPS development are solved and discussed in a step-wise manner. The results for all of the applied methods are described in this section. Firstly, the feature selection performance of the ISSA method is shown, where 14 features were selected for multiclass classification and 15 features were selected for binary class classification. Secondly, the dataset description is added before and after minority and majority class balancing. Lastly, two types of experimental results are shown in which results of original data-based binary and multiclass classifications are shown and the results after applying feature selection and class balancing methods are shown. The validity of the results shows that better performance is achieved while feature selection and class balancing problems are solved before applying classification. The overall framework-based steps are described in detail in Algorithm 2:
| Algorithm 2 Proposed framework working steps. |
| Step 1: Initialize and load preprocessed dataset |
| Step 2: Perform ISSA method-based feature selection |
| Step 3: Separate binary and multiclass feature sets based upon network attack categories |
| Step 4: Apply the SMOTE–Tomek method of minority and majority class balancing |
| Step 5: Conduct two Experiments for classifications and calculate results |
| Step 6: In Experiment 1: Fed feature selected and class balanced feature matrix to 4 ML classifiers for binary classification |
| Step 7: In Experiment 2: Fed feature selected and class balanced feature matrix to 4 ML classifiers for multiclass classification |
| Step 8: Extract results and perform a comparison to prove better performance as compared to previous methods based upon the applied combination of methods |
There are 8 steps involved to develop the proposed NIDPS system. The preprocessed dataset is given to reduce the features with the ISSA method of feature selection which has chosen 14 features for multiclass and 15 features for binary classifications. Step 3 describes that the binary and multiclass categories-based feature-selected matrices are separated. Step 4, based on minority and majority class balancing, is performed, where this balanced dataset is fed to ML classifiers. The 2 experiments are conducted separately, on the original dataset for binary and multiclass classification and secondly on feature-selected and class-balanced new datasets based on binary and multiclass classifications as described in steps 6 and 7. In step 8, the extracted results are compared with previous studies, which showed an improvement in results.
4.1. Feature Selection Using ISSA Method
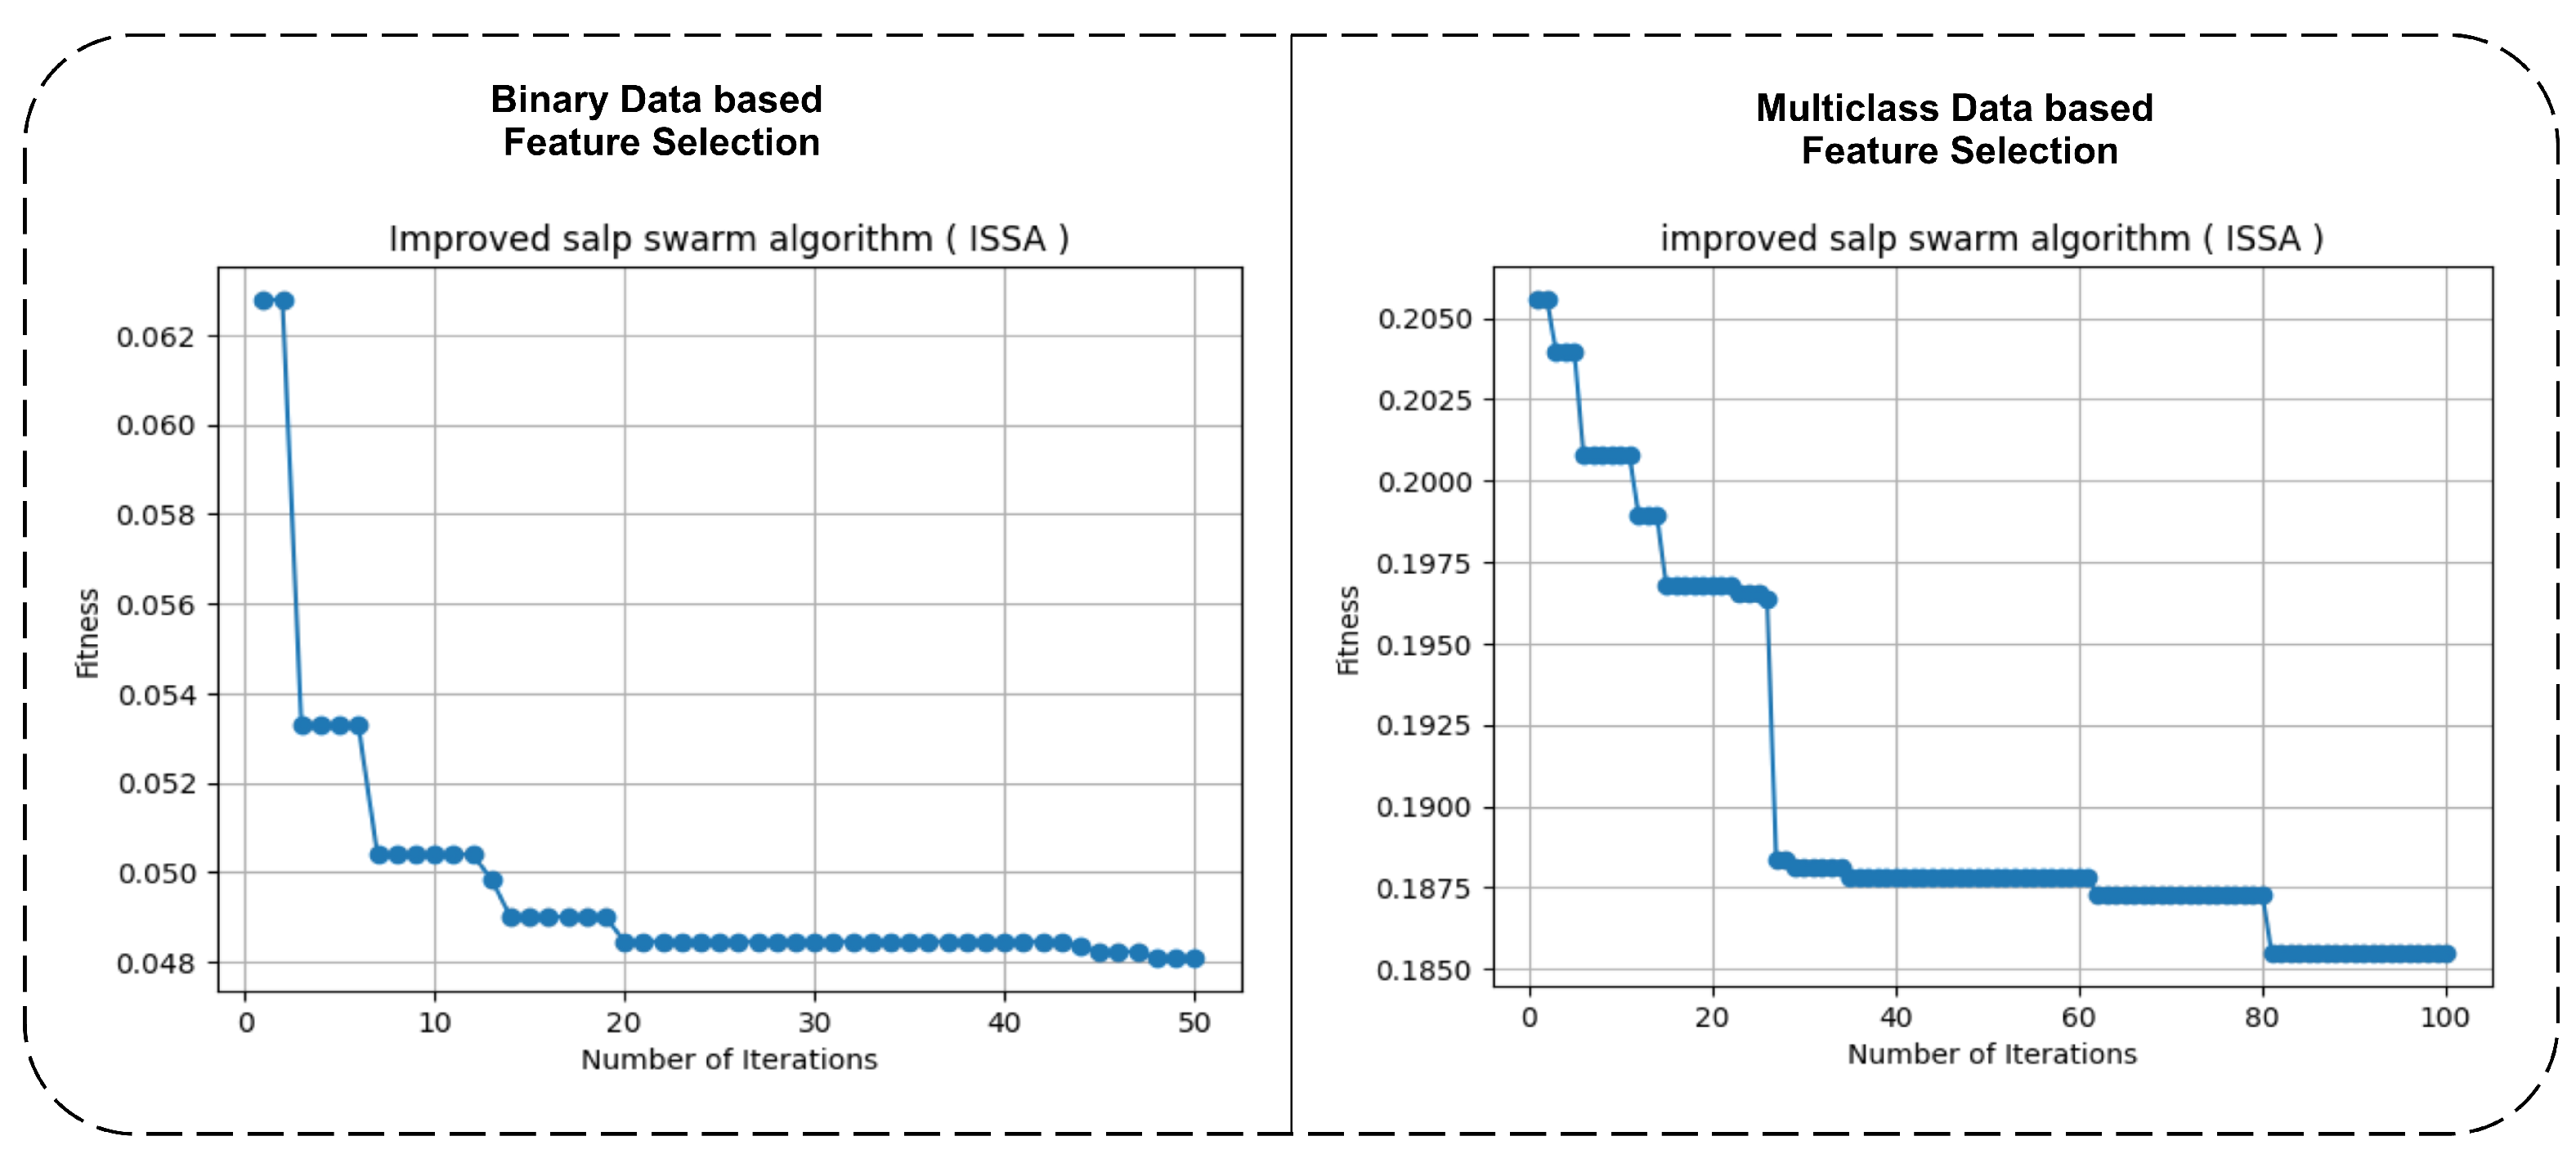
The dynamic feature selection is applied to the preprocessed dataset using the ISSA method as explained in Section 3.2. However, stopping conditions of the ISSA method vary for binary and multiclass feature sets to fine-tune the ISSA method while training. The training of ISSA simply could be explained as finding the optimal and best location in the search space of the ISSA method. However, the optimal or best search space in terms of feature selection is known as the best and most accurate performance achieved subset of features. This is the fitness criteria of the ISSA method, to find the best combinations of features with the highest accuracy. To find the best subset of features from given feature sets, the ISSA method did the training. The training graph on minimization of loss is maintained at a maximum of 100 epochs. In binary class data, the loss does not decrease while applying 100 epochs, therefore it stopped on 50 epochs as the optimal stopping condition, and the result is founded. At this stage, it selected 15 features. In the case of multiclass problems as classes were 10, the loss was also not in decimal values. Although 100 epochs are used as maximum training conditions for the ISSA method, as a result, it is given 14 features as optimal ones for classification. The training graphs for both binary and multiclass classifications are shown in Figure 2.
The left side for feature selection-based loss value is showing that it started from 0.062 and stopped to consist of a similar value for many epochs as 0.048. The right side of the training graph for multiclass data is showing that the loss value started from 0.2050 and ended at 0.1850 value while the value lastly decreased when moving from 80–100 epochs. It is observed that the binary class loss ranges in between 0.0 decimal values whereas, in the case of multiclass, the loss ranges from 0.2 to 0.18, this is due to the multiclass and binary class type of features data. The multiclass dataset loss fell to less low as compared to the binary class as there are only two types of classes to distinguish. The optimal fine-tuning parameters applied for both multiclass and binary class data feature selections are described in Table 2.
Table 2 shows that 10 salp individuals are assigned to subset feature sets from the original given features. The final selected features range changes for multiclass as 14 features and 15 features for binary classification. The 50 and 100 values are given as maximum epochs, where they could be changed if the dataset size and classes change. The number of folds used while testing on KNN methods for training and testing of feature subsets with salps is 5 and the K value as neighbor assigning is also 5.
4.2. Dataset Description before and after Applying SMOTE–Tomek Method
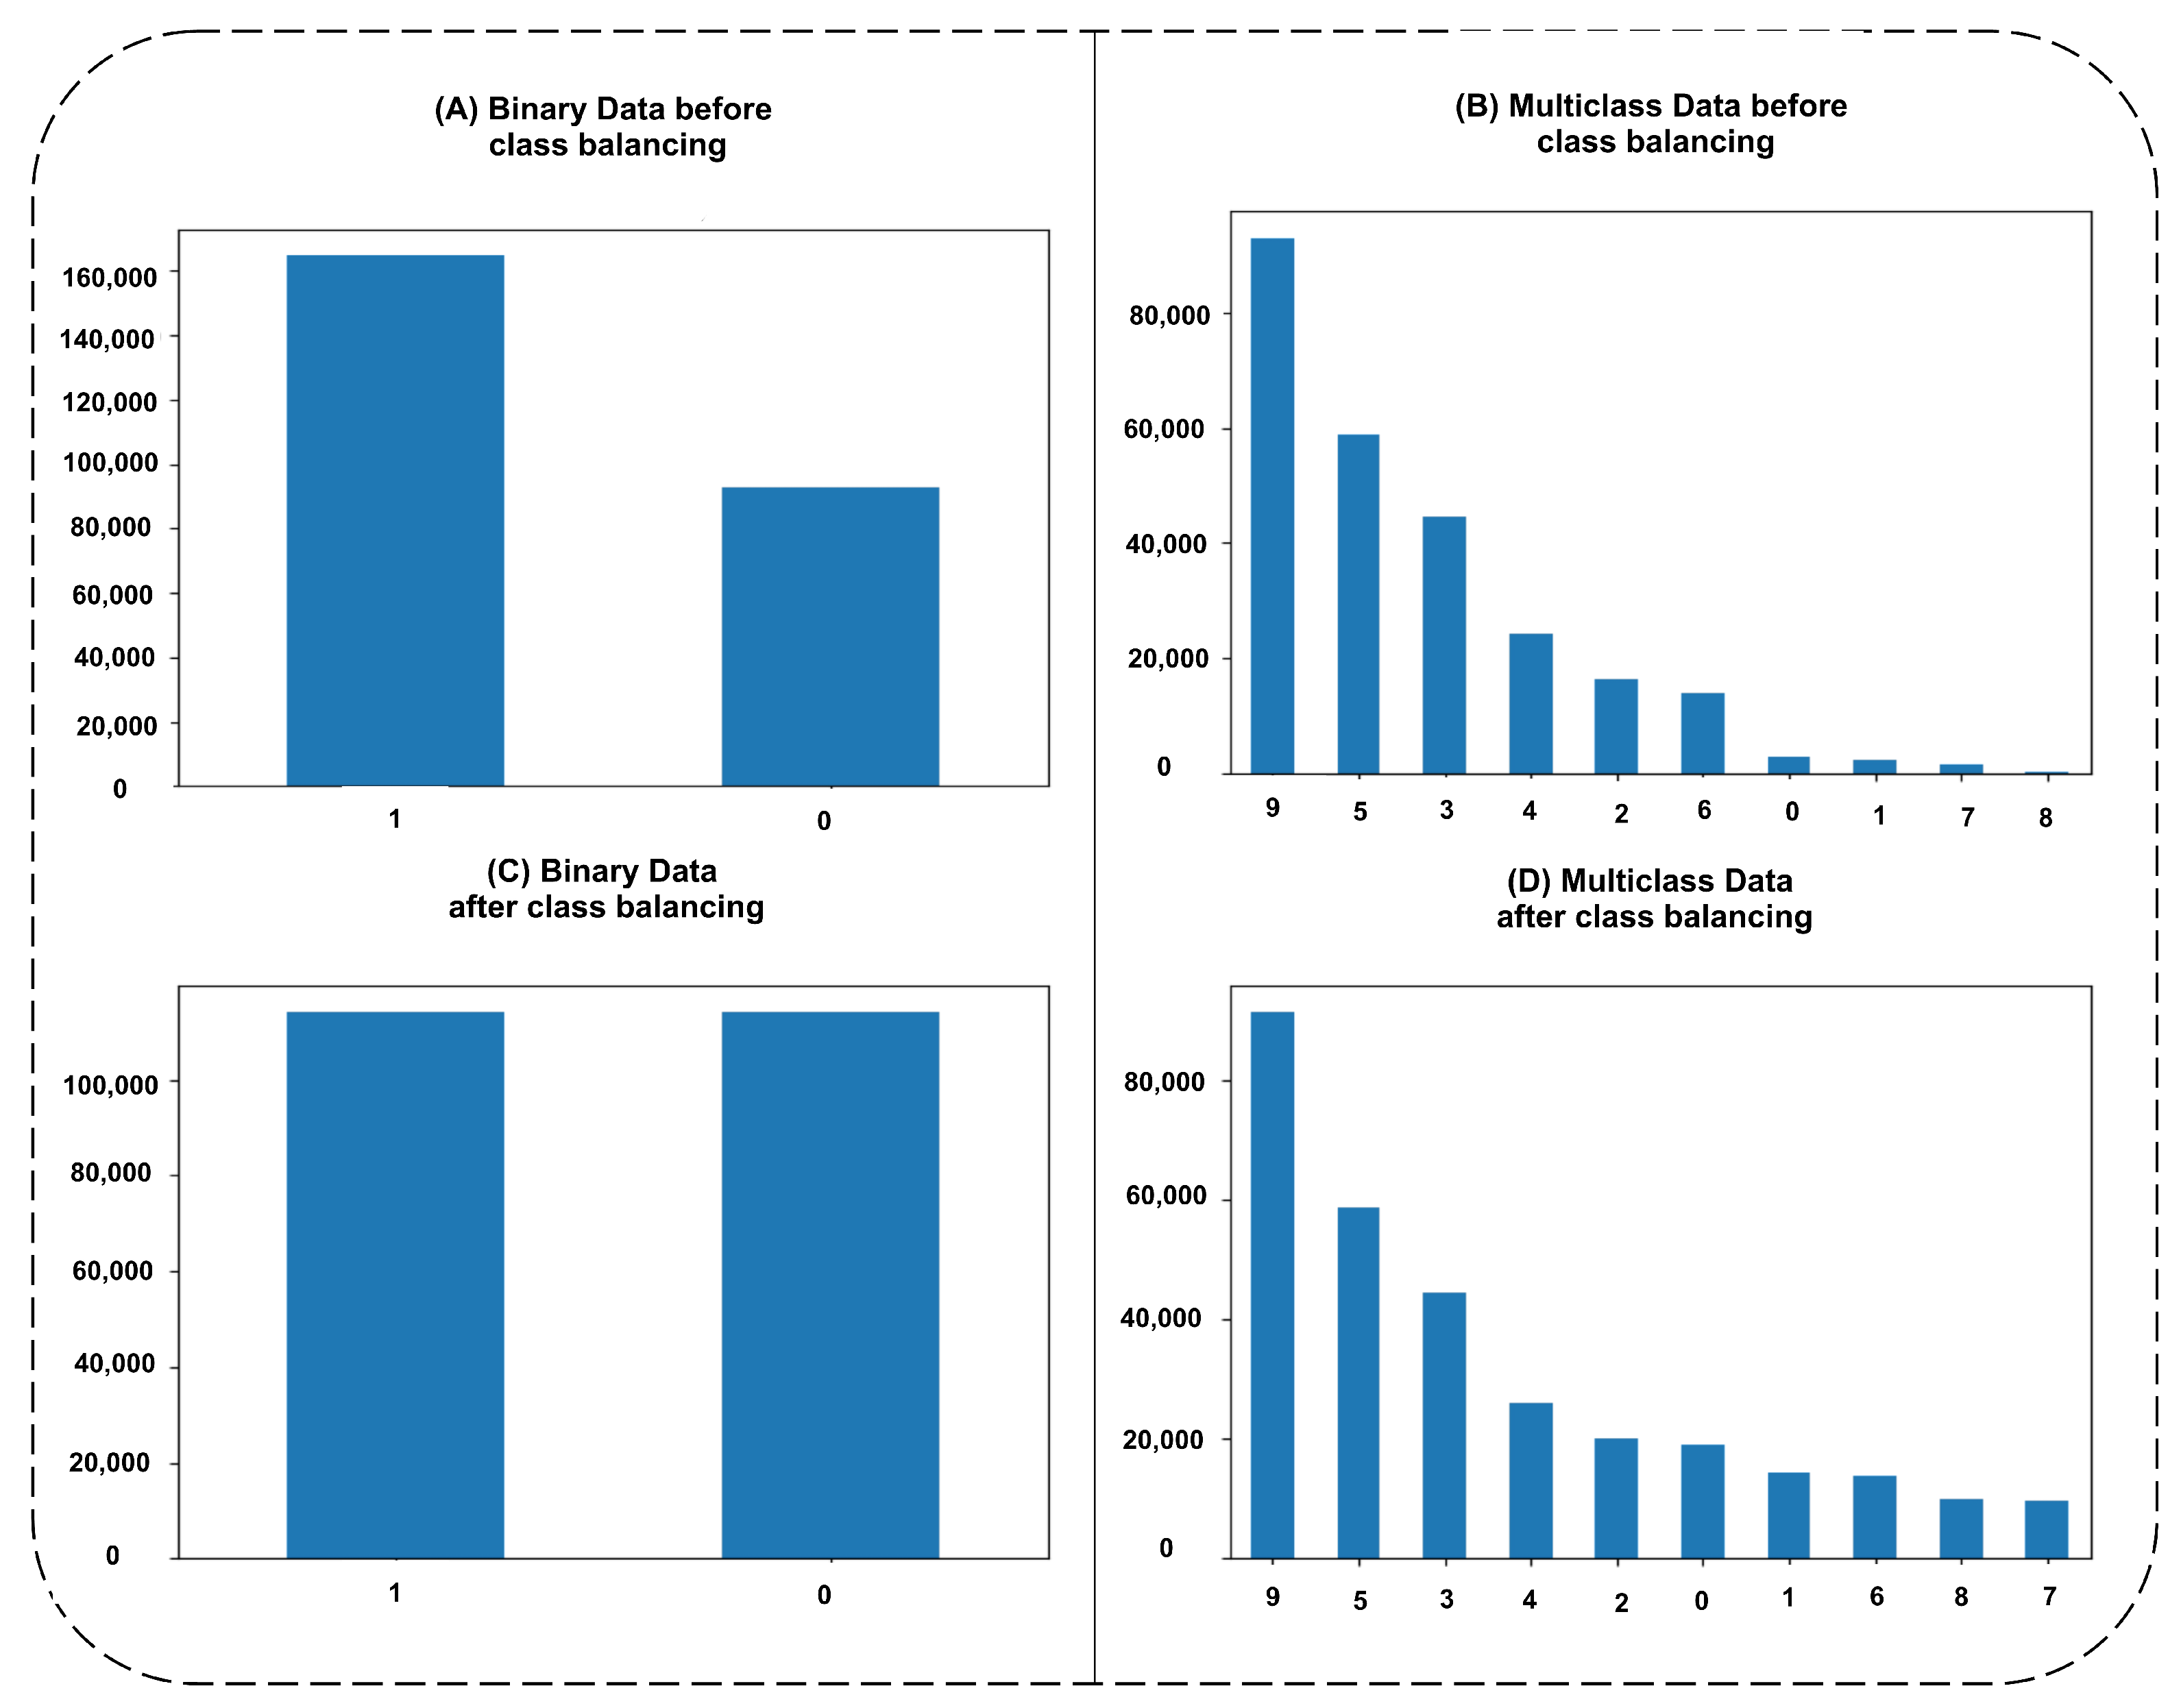
The features are selected at the first stage by applying standard scaling on 42 features given in the UNSW-NB15 dataset. The ISSA feature selection method showed 14 and 15 important features while applying multiclass and binary class classification, respectively. These two selected feature sets are given to the SMOTE–Tomek method for class balancing. Before and after applying the SMOTE–Tomek method, class instances for binary and multiclass datasets are shown in Figure 3.
The class-wise instances in section (A) show that 164,674 instances exist in the original dataset for class 1 and 9300 for class 0. Section (C) shows oversampling not only for class 0, but also for class 1 because the SMOTE–Tomek method is used for oversampling and undersampling both to balance the classes whereas both classes contain 114,034 instances. However, in multiclass class instances selection, as we can see in section (B) that class 9 has 93,000, class 5 has 58,871, class 3 has 44,525, class 4 has 24,246, class 2 has 16,353, class 6 has 13,987, class 0 has 2677, class 1 has 2329, class 7 has 1511, and class 8 has 174. If we discuss oversampled multiclass data instances, the bar graph is shown in section (D), it contains instances as class 9 has 91,432, class 5 has 58,689, class 3 has 44,576, class 4 has 25,957, class 2 has 20,157, class 0 has 18,997, class 1 has 14,465, class 6 has 13,776, class 8 has 9973, and class 7 has 9781. The different behavior against each class for minority class balancing is shown where class 9 is a normal class that has 93,000 instances originally which decreased due to the use of the Tomek method. However, based on the results before and after applying class balancing, the results of classification for binary and multiclass are discussed in the coming section.
4.3. ML Classification before Applying Feature Selection and Class Balancing Methods
The 4 different classifiers which were abundantly applied in previous studies are adopted by our proposed study, where an 80 (training)–20 (testing) split of data is used. The binary and multiclass classifications are both applied using 4 classifiers, where accuracy, precision, recall, and F1-score metrics are used for the evaluation of binary and multiclass data performances. Table 3 contains results for both types of classification and a visual illustration is shown in Figure 4.
Table 3 shows binary classification results for 4 ML classifiers, where the performance of all classifiers varies slightly from 94 to more than 96%. The best classifier remains a random forest with 96.29% accuracy, 96.28% precision, 96.29% recall, and 96.28% F1-score. The worst classifier remains the gradient descent-boosting classifier as its training and testing time was also more than double and its scores remain at 94.16 accuracy and recall with 94.14 as precision and F1-score. The two methods of decision tree and extra tree remain in between, whereas the decision tree is outer bound to the extra tree in terms of accuracy score and according to other metrics as well. It showed a 95.61 score, which is lower bound to the extra tree performance score, which is 96.29%, which is nearer to the highest score achiever method random forest.
However, if we look at multiclass classification scores, again random forest showed 82.58% accuracy and recall, 82.50% precision, and 81.44% F1-score. The worst score achiever (gradient descent boosting) again remained in multiclass classification with 81.42% accuracy, 81.31% precision, 81.42% recall, and 79.02% F1-score. Now, we look at F1-scores, which mainly contain the class-wise performance with class imbalance fact in it due to recall and precision scores sum and multiplication in its formula. Due to class imbalance, F1 reduces its score by comparing with accuracy, which is 82.58%, and F1 remains at 81.44%. Similarly, in the case of the worst performer gradient descent-boosting method. It reduces from 81.42 to 79.02. Therefore, class imbalance problems affect F1 scores for all classifiers, which need to be solved to make it nearer to accuracy.
4.4. ML Classification after Applying Feature Selection and Class Balancing Methods
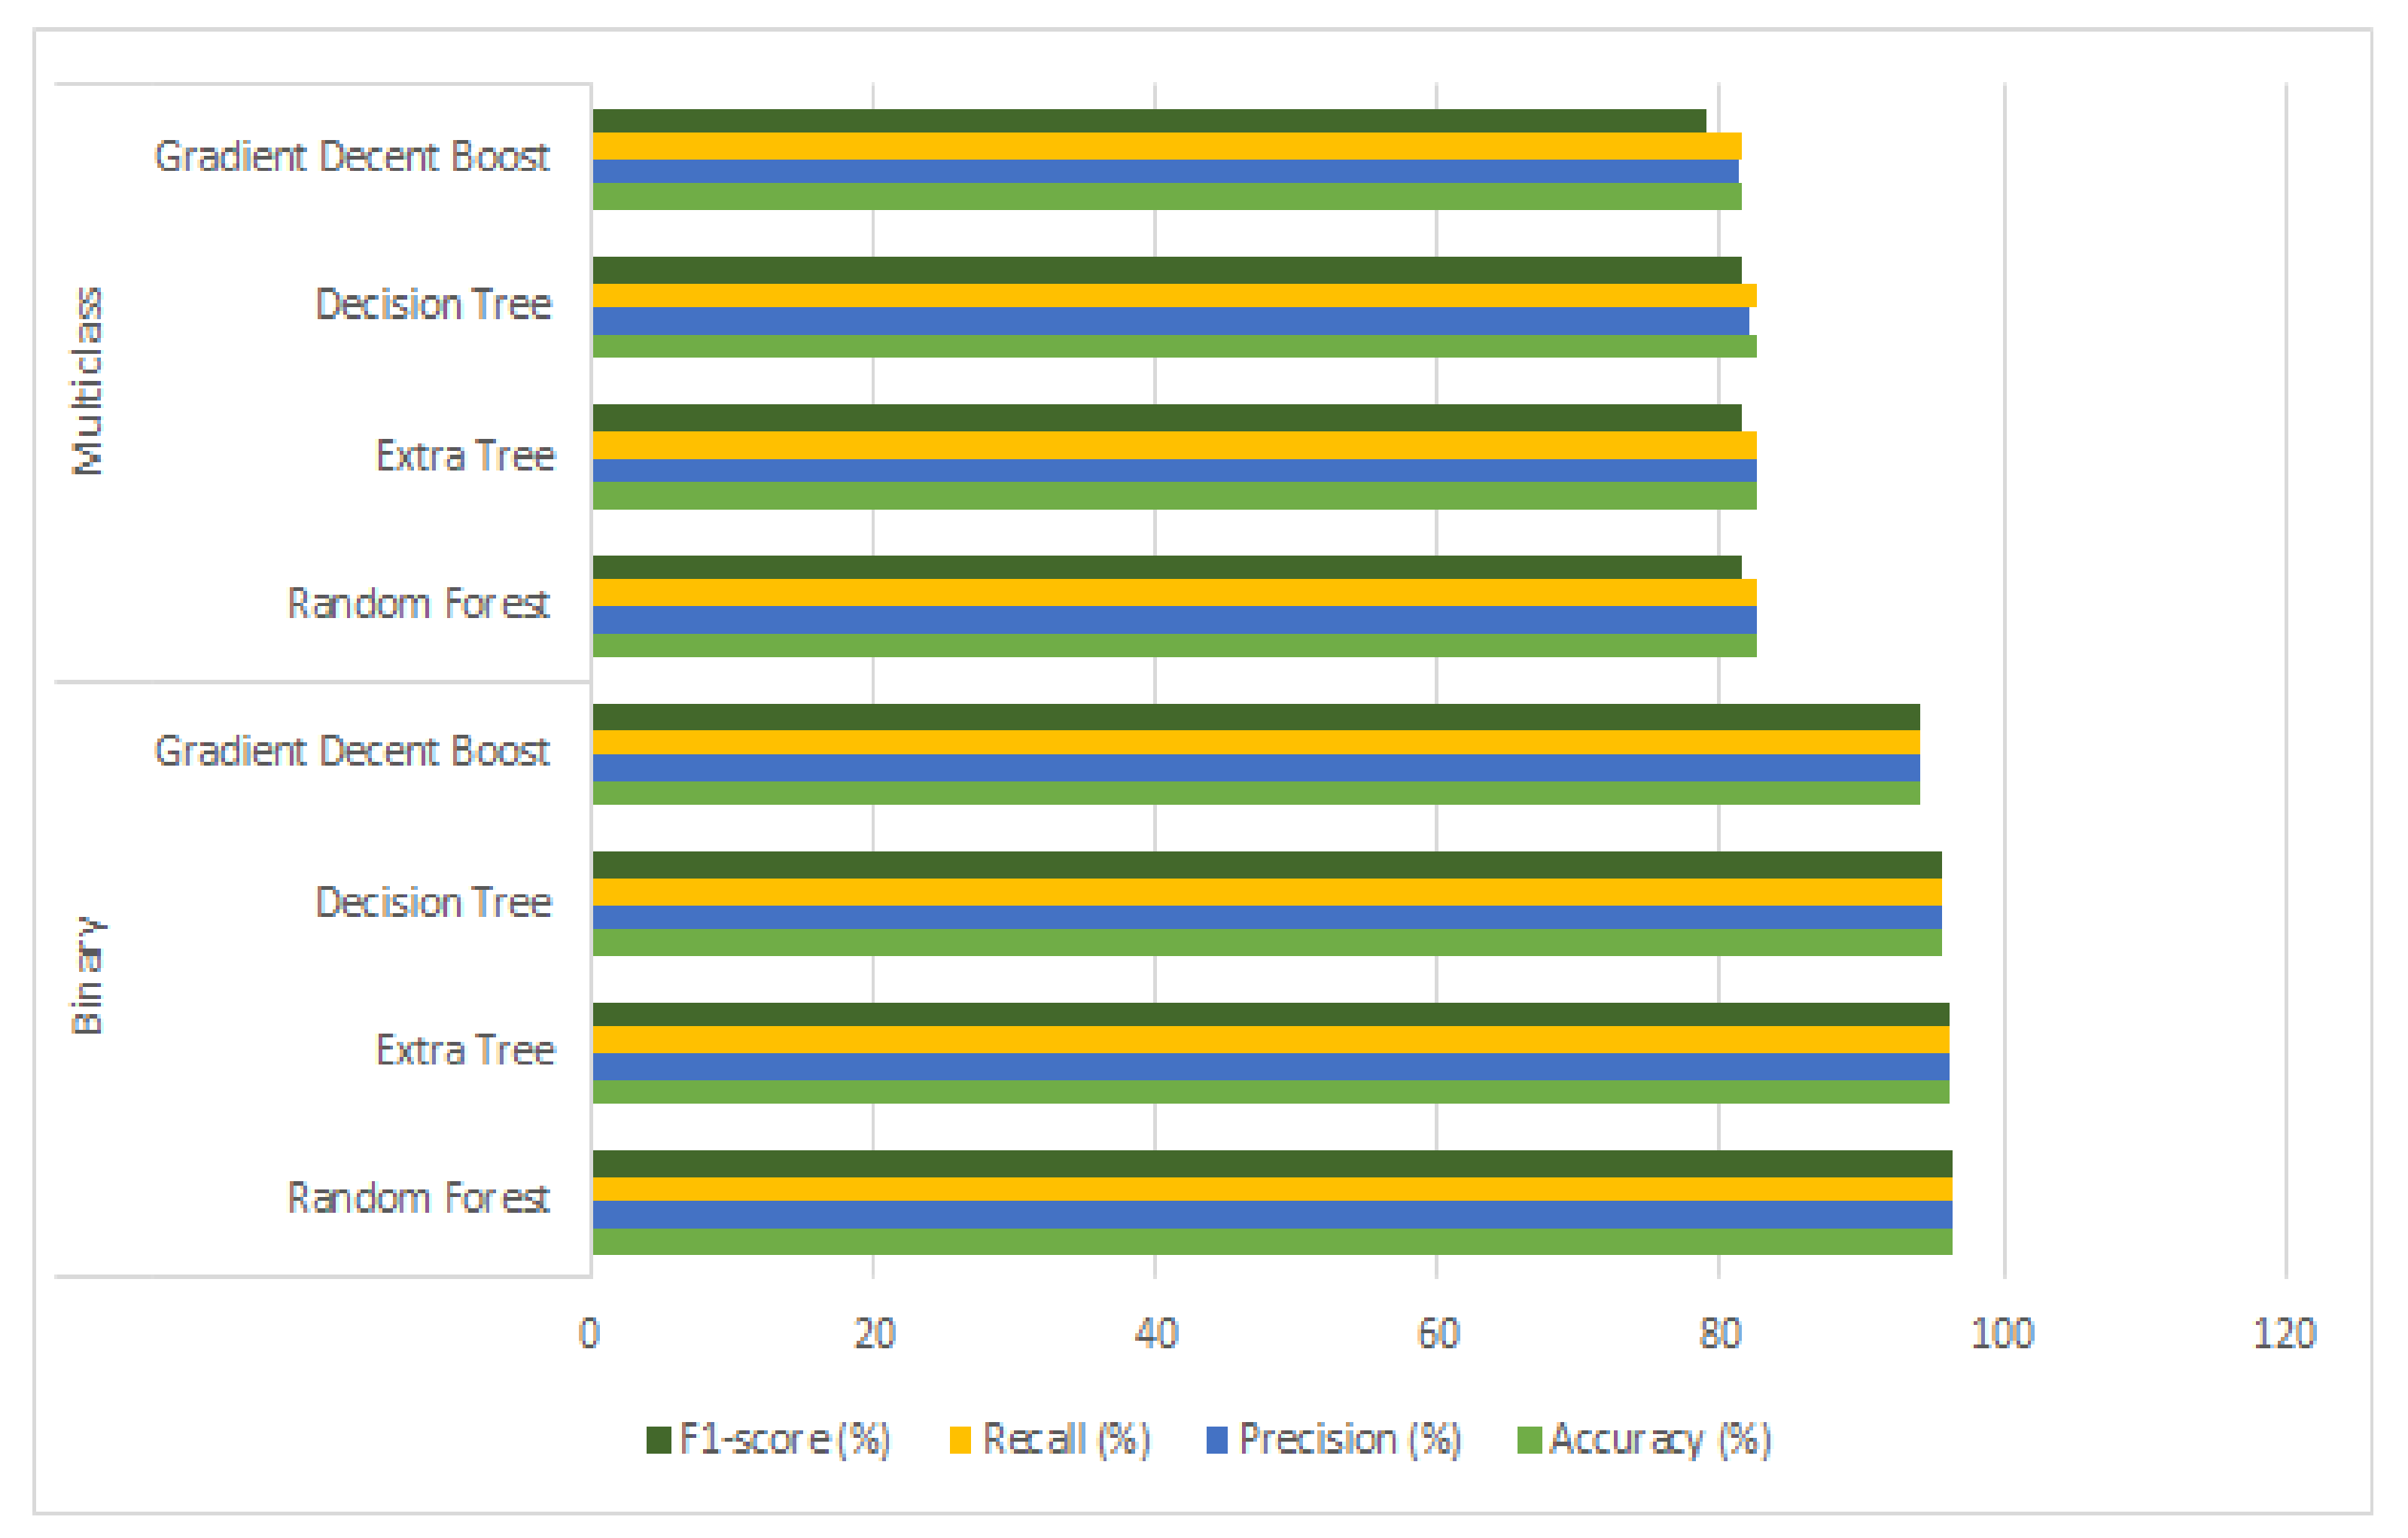
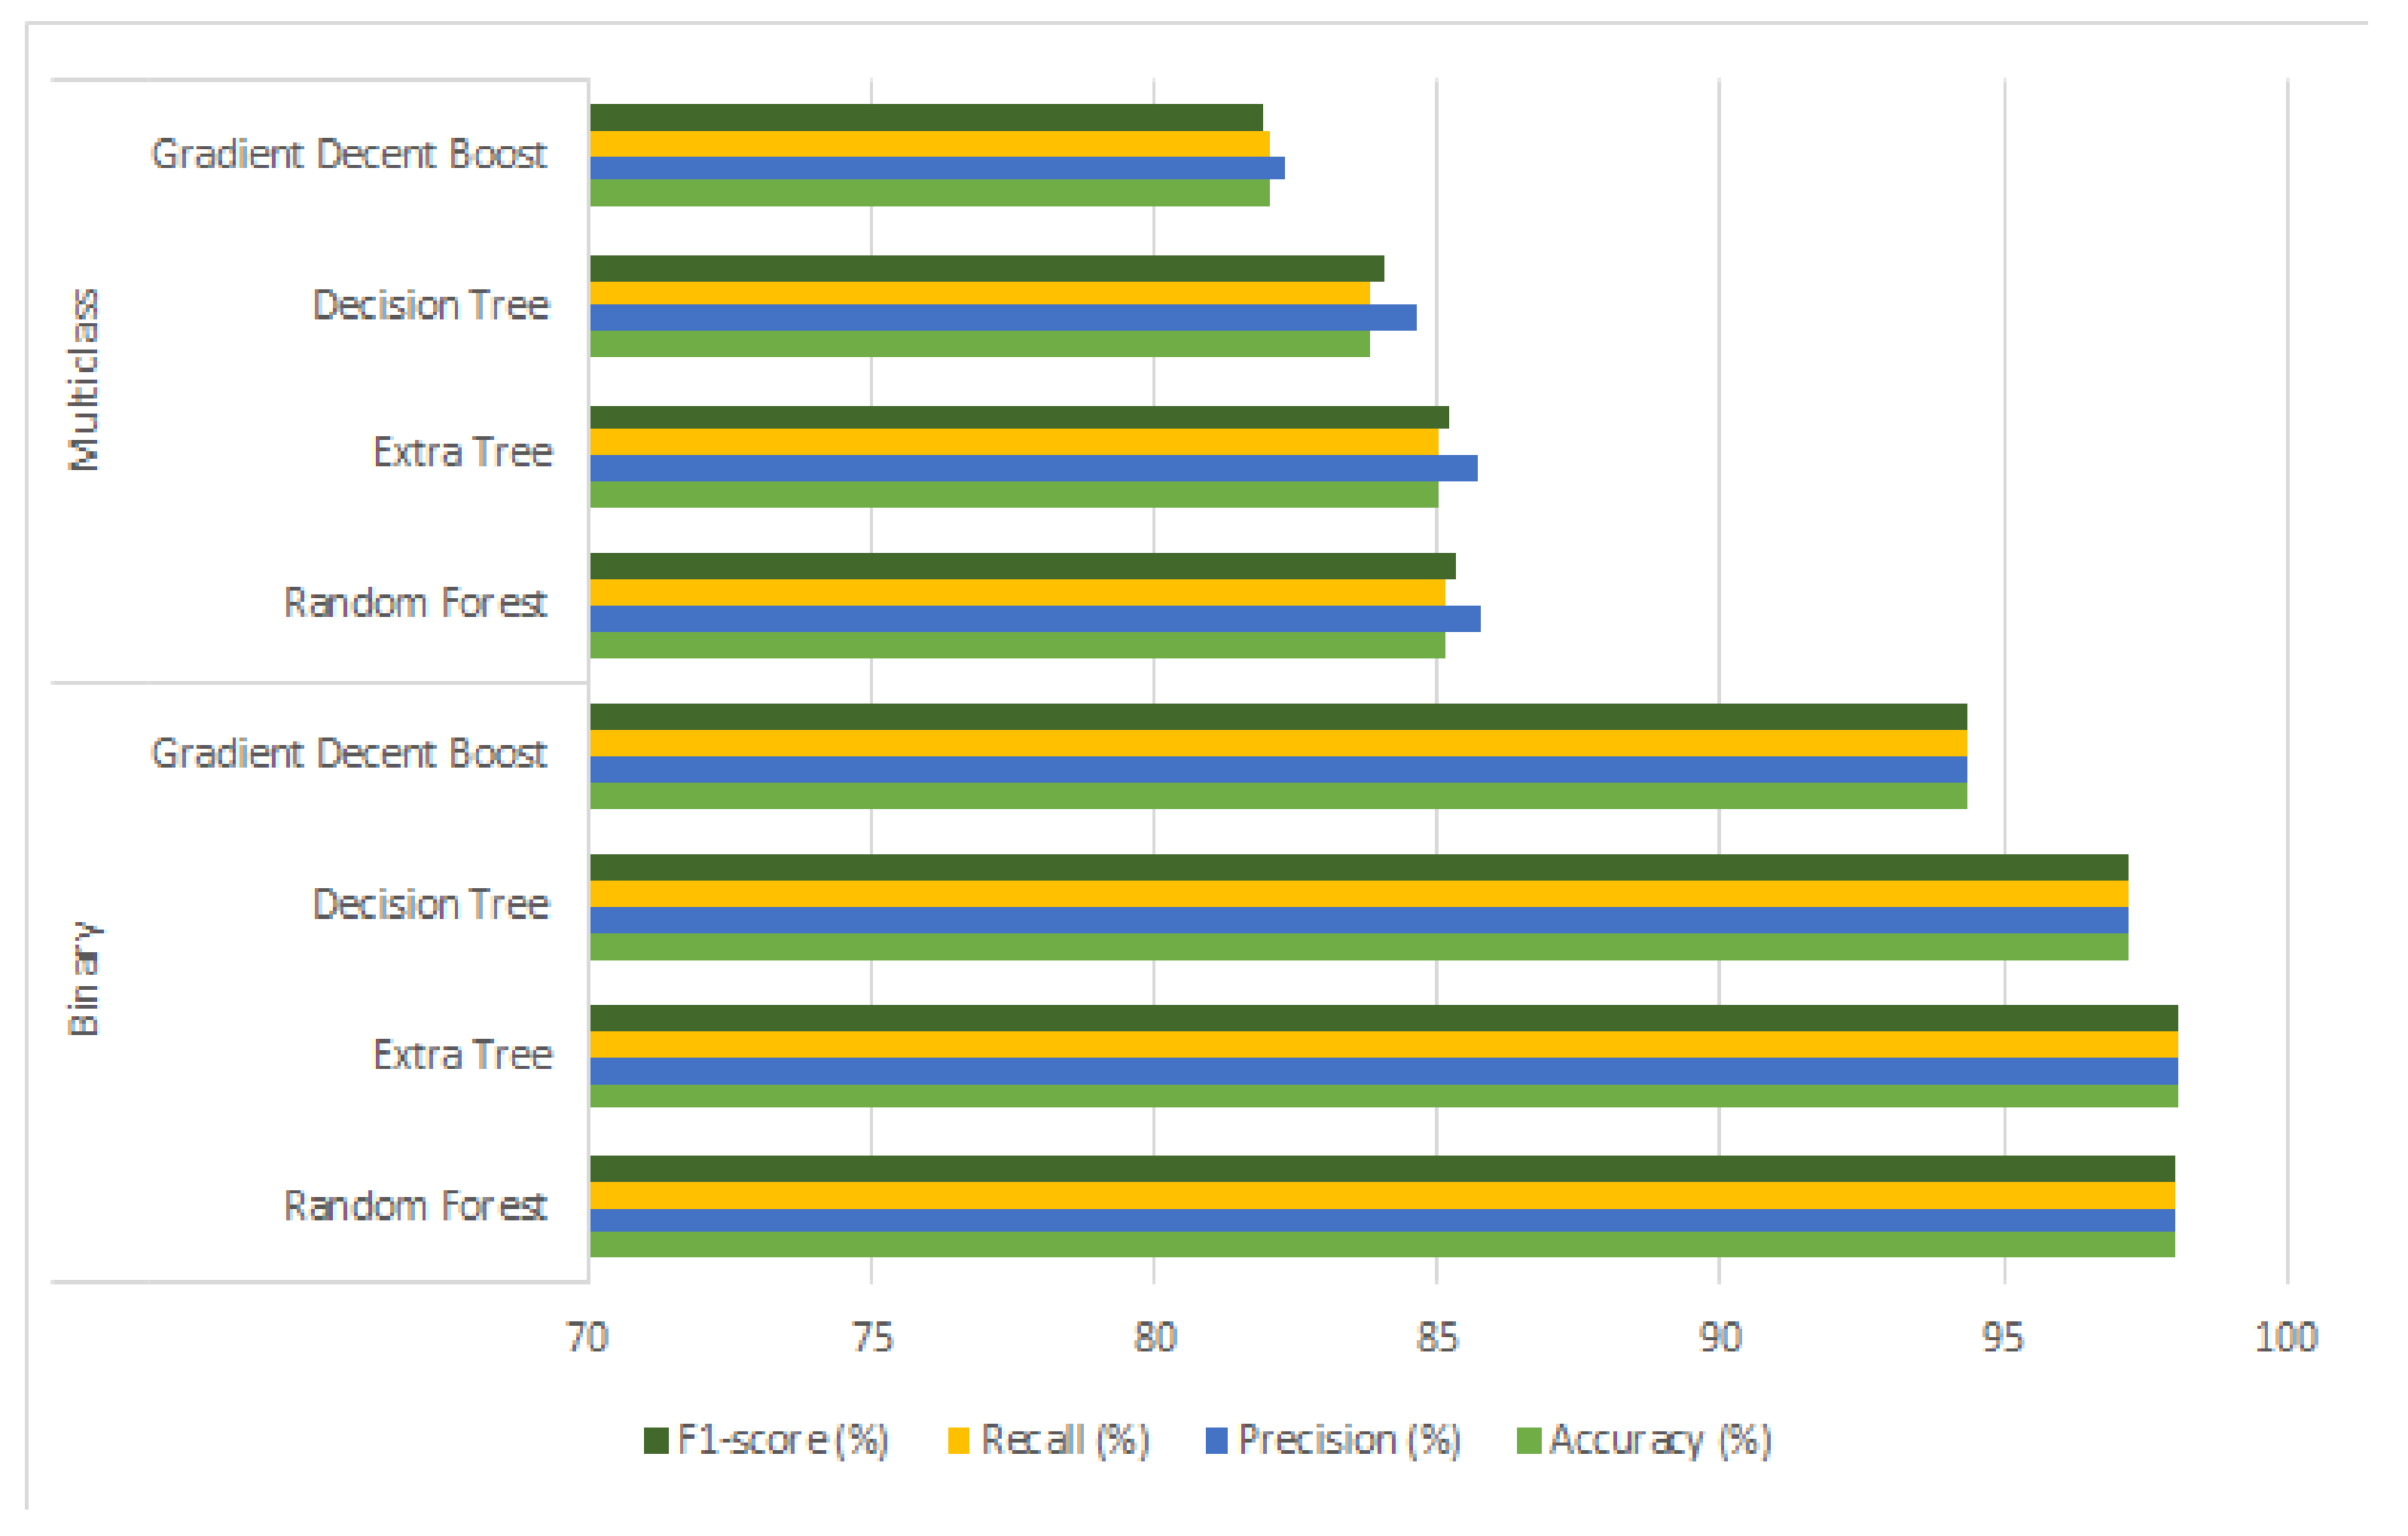
The feature selection using the ISSA method at first applied to all features that are 42 in number. The feature selection gives 14 multiclass important features, whereas it gives 15 feature subsets for binary class feature sets. Both selected feature subsets are given to the SMOTE–Tomek method for minority and majority class instances balancing, which is discussed in Section 3.3 regarding operational working and in Section 4.2, and the class-wise increment for both binary and multiclass data is discussed. However, these feature sets that are selected using the ISSA method and are class balanced using the SMOTE–Tomek method are fed to four ML classifiers. Both binary and multiclass classification results are shown in Table 4 and the graphical description is shown in Figure 5.
The binary and multiclass classification results against extra tree classifiers showed the best performance, whereas previously it was best for random forest before applying feature selection and class balancing methods. However, there is no big difference between the random forest and extra tree classifier performance. The random forest showed 98.03% accuracy, precision, recall, and F1-score, which means it remains similar in all classes even in F1-score as well, which was lower in Table 3. The worst performing classifier again gradient descent boosting is with 94.35% accuracy, and almost similar in all other metrics as well.
The best performer is the extra trees method with 98.09% accuracy and recall, and F-score with a slightly larger 98.10% precision score. The third-best performer method is the decision tree, which is nearer to the extra tree method. It showed 97.22% accuracy, precision, recall, and F1-score. If we look at multiclass classifiers’ performance, the results are sufficiently increased as they increased in binary classification also. The binary class classification results as compared to Table 3 are increased from 96.46% to 98.09% in terms of accuracy. The best performer in multiclass classification is not changed this time as compared to Table 3. The best performer is the random forest with 85.15% accuracy and recall, 85.79% precision, and 85.31% F1-score. The second-best performer is an extra tree with 84.98%, which is nearer to 85%, whereas if we look at F1-score, which is 85.19%, that is, more importantly, good as compared to accuracy because this time this score is representing a class imbalance problem solution. Similarly, the third-best-performing classifier decision tree showed 83.81% accuracy with an increment of F1-score up to 84.07%. The worst classifier is again proven as a gradient descent-boosting method, which showed 82.01% accuracy, whereas F1-score is not increased in this case by comparing to the other three methods, but it improved as compared to Table 3 results. The graphical representation is shown in Figure 5.
However, if we look at classification results before and after applying feature selection and data balancing methods, the results of all classifiers improved for both types of classifications. Although, an important thing to notice in both types of classification is that by resolving feature selection and class balancing problems, not only the performance of classifiers is increased but also the score becomes consistent in all metrics including F1-score, which is more specifically targeting the class imbalance problem.
5. Comparison
The proposed study is compared with previous studies, which used SMOTE for class balancing and similarly other methods to solve network intrusion detection systems by applying binary and multiclass classifications. Their achieved results and applied methods on the UNSW-NB15 dataset are shown in Table 5. If we look at the comparison table, the first comparison in Table 5 has shown results as binary accuracy with an 85.99% score and multiclass accuracy as 75.77%. The UNSW-NB15 dataset is used in it. It uses the SVM method of classification with monitoring the non-linear kernel behavior. If we look at the second comparison, which uses SMOTE for oversampling and the OSS method for undersampling for class balancing, after that two methods were applied in which CNN was applied at first, which uses to extract the spatial features, and secondly, the Bi-LSTM method is used to extract the temporal features. In this way, a deep hierarchical model of classification is formed to give a hybrid solution. It shows a classification accuracy of 77.16% on the UNSW-NB15 dataset. It also uses the NSL-KDD dataset on which classification accuracy reached 83.58%. However, its performance remains lower in achieving better scores on the UNSW-NB15 dataset as compared to the results of the proposed study.
Similarly, the third comparison uses the XGBoost method for feature selection, which is normally the method used for classification. Furthermore, it uses ML methods for classification on the same dataset used by the proposed study. All metrics for multiclass classification remain nearer to 77–79%, which is lower than the proposed study-achieved results. The fourth comparison applied a two-step method of feature selection using filter and wrapper methods. The achieved results showed 84.24% multiclass accuracy, which is lower than the proposed study achieved results. The fifth comparison used two datasets for applying its framework in which he applied the XGboost method of feature selection with GRU, LSTM, and RNN methods of classification. The binary and multiclass classification is applied to NSL-KDD and UNSW-NB15 datasets where the UNSW-NB15 dataset is used by the proposed framework. Therefore, compared with the dataset results where the achieved results by a proposed framework in the binary and multiclass category are higher. We can say that by comparing the proposed study in terms of both classifications with selected features and class balancing methods, the proposed framework achieved better results than all of them. However, the performance of binary and multiclass classification is improved due to dataset balancing and appropriate feature selection methods.
6. Conclusions
Network security becomes a worldwide problem and many studies and solutions have been proposed to solve such problems. These solutions still have a deficiency in them due to many current problems. These problems are with the NIDPS system itself, and also with the data mining domain. The development of NIDPS is mainly based on the training of a dataset to create a machine or deep learning domain classifier. This dataset is normally imbalanced due to the abundance of records of the normal flow of network traffic and has very network-attacked instances. In this way, the use of these imbalanced datasets to develop NIDPS will lead to compromising performance. Therefore, problems such as class imbalance and feature selection need to be solved first and then a NIDPS for network attack detection needs to be developed. The proposed study uses a framework in which feature set normalization is applied to class-imbalanced datasets (UNSW-NB15). Then the dynamic or automatic selection of features is applied using the ISSA method, whereas previous studies mostly used manual feature selection methods. The ISSA method is from the particle swarm optimization (PSO) domain in which a swarm moves to find the best or optimal solution. Therefore, ISSA methods are considered to be more intelligent as compared to other feature selection methods due to their searching potential nature. Previously applied methods of feature selection use a manual selection of features via hit and trial methods to enhance the NIDPS detection accuracy. However, the proposed study uses dynamic and searching-specific nature methods of feature selection for binary and multiclass feature sets separately. The selected features are then fed to the SMOTE–Tomek method of oversampling and under-sampling for class balancing. The class-balanced and feature selected feature-matrices are separated and finalized for binary and multiclass classifications. The results for binary and multiclass classifications are extracted using four different ML classifiers. These results are collected before and after applying feature selection and class balancing techniques. The results showed that if feature reduction is applied at first to reduce the feature dimensionality, and class balancing is applied to balance class instances, then the performance of binary and multiclass classification is improved. The automated and dynamic method of feature selection made a fully automated NIDPS. Furthermore, it reduces time and space complexity by excluding the less meaningful features. It leads to more efficient results detection with less time and space consumption. For future work, it is suggested to use more evolutionary computing methods for the dynamic selection of features where more methods of minority class balancing could be applied. The class-balanced and feature-selected datasets could increase the NIDPS performance but also it could increase the performance of any other intruder detection system. The time and space complexities-based analysis could be conducted to prove the validity of the proposed framework.
Funding
There is no external funding received for this research.
Institutional Review Board Statement
Not applicable.
Informed Consent Statement
Not applicable.
Data Availability Statement
Data set is publicly available.
Acknowledgments
This research was supported by the Researchers Supporting Project (RSP2023R476), King Saud University, Riyadh, Saudi Arabia.
Conflicts of Interest
The authors declare no conflict of interest.
References
- Dlamini, G.; Fahim, M. DGM: A data generative model to improve minority class presence in anomaly detection domain. Neural Comput. Appl. 2021, 33, 13635–13646. [Google Scholar] [CrossRef]
- Khalaf, B.A.; Mostafa, S.A.; Mustapha, A.; Mohammed, M.A.; Mahmoud, M.A.; Al-Rimy, B.A.S.; Razak, S.A.; Elhoseny, M.; Marks, A. An Adaptive Protection of Flooding Attacks Model for Complex Network Environments. Secur. Commun. Netw. 2021, 2021, 5542919. [Google Scholar] [CrossRef]
- Kumar, V.; Sinha, D.; Das, A.K.; Pandey, S.C.; Goswami, R.T. An integrated rule based intrusion detection system: Analysis on UNSW-NB15 data set and the real time online dataset. Clust. Comput. 2020, 23, 1397–1418. [Google Scholar] [CrossRef]
- Wang, M.; Zheng, K.; Yang, Y.; Wang, X. An Explainable Machine Learning Framework for Intrusion Detection Systems. IEEE Access 2020, 8, 73127–73141. [Google Scholar] [CrossRef]
- Almomani, O. A hybrid model using bio-inspired metaheuristic algorithms for network intrusion detection system. Comput. Mater. Contin 2021, 68, 409–429. [Google Scholar] [CrossRef]
- Meryem, A.; Ouahidi, B.E. Hybrid intrusion detection system using machine learning. Netw. Secur. 2020, 2020, 8–19. [Google Scholar] [CrossRef]
- Aleesa, A.; Younis, M.; Mohammed, A.A.; Sahar, N. Deep-intrusion detection system with enhanced UNSW-NB15 dataset based on deep learning techniques. J. Eng. Sci. Technol. 2021, 16, 711–727. [Google Scholar]
- Hoque, M.S.; Mukit, M.A.; Bikas, M.A.N. An implementation of intrusion detection system using genetic algorithm. arXiv 2012, arXiv:1204.1336. [Google Scholar]
- Jianhong, H. Network intrusion detection algorithm based on improved support vector machine. In Proceedings of the 2015 International Conference on Intelligent Transportation, Big Data and Smart City, Halong Bay, Vietnam, 19–20 December 2015; pp. 523–526. [Google Scholar]
- Kwon, D.; Natarajan, K.; Suh, S.C.; Kim, H.; Kim, J. An Empirical Study on Network Anomaly Detection Using Convolutional Neural Networks. In Proceedings of the 2018 IEEE 38th International Conference on Distributed Computing Systems (ICDCS), Vienna, Austria, 2–6 July 2018; pp. 1595–1598. [Google Scholar]
- Taher, K.A.; Jisan, B.M.Y.; Rahman, M.M. Network intrusion detection using supervised machine learning technique with feature selection. In Proceedings of the 2019 International Conference on Robotics, Electrical and Signal Processing Techniques (ICREST), Dhaka, Bangladesh, 10–12 January 2019; pp. 643–646. [Google Scholar]
- Almomani, O. A feature selection model for network intrusion detection system based on PSO, GWO, FFA and GA algorithms. Symmetry 2020, 12, 1046. [Google Scholar] [CrossRef]
- Talita, A.; Nataza, O.; Rustam, Z. Naïve bayes classifier and particle swarm optimization feature selection method for classifying intrusion detection system dataset. J. Phys. Conf. Ser. 2021, 1752, 012021. [Google Scholar] [CrossRef]
- Nguyen, B.H.; Xue, B.; Zhang, M. A survey on swarm intelligence approaches to feature selection in data mining. Swarm Evol. Comput. 2020, 54, 100663. [Google Scholar] [CrossRef]
- Hodo, E.; Bellekens, X.; Hamilton, A.; Tachtatzis, C.; Atkinson, R. Shallow and deep networks intrusion detection system: A taxonomy and survey. arXiv 2017, arXiv:1701.02145. [Google Scholar]
- Sun, Y.; Wong, A.K.; Kamel, M.S. Classification of imbalanced data: A review. Int. J. Pattern Recognit. Artif. Intell. 2009, 23, 687–719. [Google Scholar] [CrossRef]
- Shelke, M.S.; Deshmukh, P.R.; Shandilya, V.K. A review on imbalanced data handling using undersampling and oversampling technique. Int. J. Recent Trends Eng. Res 2017, 3, 444–449. [Google Scholar]
- Amin, A.; Anwar, S.; Adnan, A.; Nawaz, M.; Howard, N.; Qadir, J.; Hawalah, A.; Hussain, A. Comparing oversampling techniques to handle the class imbalance problem: A customer churn prediction case study. IEEE Access 2016, 4, 7940–7957. [Google Scholar] [CrossRef]
- Fu, Y.; Du, Y.; Cao, Z.; Li, Q.; Xiang, W. A Deep Learning Model for Network Intrusion Detection with Imbalanced Data. Electronics 2022, 11, 898. [Google Scholar] [CrossRef]
- Moustafa, N.; Slay, J. UNSW-NB15: A comprehensive data set for network intrusion detection systems (UNSW-NB15 network data set). In Proceedings of the 2015 Military Communications and Information Systems Conference (MilCIS), Canberra, Australia, 10–12 November 2015; pp. 1–6. [Google Scholar]
- Chen, M.; Liu, W.; Wang, T.; Zhang, S.; Liu, A. A game-based deep reinforcement learning approach for energy-efficient computation in MEC systems. Knowl.-Based Syst. 2022, 235, 107660. [Google Scholar] [CrossRef]
- Kamran, M.; Rehman, S.U.; Meraj, T.; Alnowibet, K.A.; Rauf, H.T. Camouflage Object Segmentation Using an Optimized Deep-Learning Approach. Mathematics 2022, 10, 4219. [Google Scholar] [CrossRef]
- Alharbi, A.; Alshammari, M.; Okon, O.D.; Alabrah, A.; Rauf, H.T.; Alyami, H.; Meraj, T. A novel text2IMG mechanism of credit card fraud detection: A deep learning approach. Electronics 2022, 11, 756. [Google Scholar] [CrossRef]
- Lu, S.; Huang, K.; Meraj, T.; Rauf, H.T. A novel CAPTCHA solver framework using deep skipping Convolutional Neural Networks. PeerJ Comput. Sci. 2022, 8, e879. [Google Scholar] [CrossRef] [PubMed]
- Alabrah, A. An Improved CCF Detector to Handle the Problem of Class Imbalance with Outlier Normalization Using IQR Method. Sensors 2023, 23, 4406. [Google Scholar] [CrossRef]
- Yin, Y.; Jang-Jaccard, J.; Xu, W.; Singh, A.; Zhu, J.; Sabrina, F.; Kwak, J. IGRF-RFE: A Hybrid Feature Selection Method for MLP-based Network Intrusion Detection on UNSW-NB15 Dataset. arXiv 2022, arXiv:2203.16365. [Google Scholar] [CrossRef]
- David, M.W. Unsw-nb15. 2019. Available online: https://www.kaggle.com/datasets/mrwellsdavid/unsw-nb15 (accessed on 12 January 2023).
- The UNSW-NB15 Dataset: UNSW Research. Available online: https://research.unsw.edu.au/projects/unsw-nb15-dataset (accessed on 12 January 2023).
- Disha, R.A.; Waheed, S. A Comparative study of machine learning models for Network Intrusion Detection System using UNSW-NB 15 dataset. In Proceedings of the 2021 International Conference on Electronics, Communications and Information Technology (ICECIT), Khulna, Bangladesh, 14–16 September 2021; pp. 1–5. [Google Scholar]
- Suresh Kumar, P.; Akthar, S. Building an efficient feature selection for intrusion detection system on UNSW-NB15. In Proceedings of the 2nd International Conference on Computational and Bio Engineering; Springer: Singapore, 2021; pp. 641–649. [Google Scholar]
- Kasongo, S.M.; Sun, Y. Performance analysis of intrusion detection systems using a feature selection method on the UNSW-NB15 dataset. J. Big Data 2020, 7, 1–20. [Google Scholar] [CrossRef]
- Jing, D.; Chen, H.B. SVM based network intrusion detection for the UNSW-NB15 dataset. In Proceedings of the 2019 IEEE 13th International Conference on ASIC (ASICON), Chongqing, China, 29 October–1 November 2019; pp. 1–4. [Google Scholar]
- Luo, S.; Zhao, Z.; Hu, Q. Focal loss based two-stage training for class imbalance network intrusion detection. In Proceedings of the 2021 IEEE 3rd International Conference on Frontiers Technology of Information and Computer (ICFTIC), Virtual, 12–14 November 2021; pp. 687–693. [Google Scholar]
- Alabrah, A. A Novel Study: GAN-Based Minority Class Balancing and Machine-Learning-Based Network Intruder Detection Using Chi-Square Feature Selection. Appl. Sci. 2022, 12, 11662. [Google Scholar] [CrossRef]
- Meftah, S.; Rachidi, T.; Assem, N. Network based intrusion detection using the UNSW-NB15 dataset. Int. J. Comput. Digit. Syst. 2019, 8, 478–487. [Google Scholar]
- Zeeshan, M.; Riaz, Q.; Bilal, M.A.; Shahzad, M.K.; Jabeen, H.; Haider, S.A.; Rahim, A. Protocol-Based Deep Intrusion Detection for DoS and DDoS Attacks Using UNSW-NB15 and Bot-IoT Data-Sets. IEEE Access 2021, 10, 2269–2283. [Google Scholar] [CrossRef]
- Bakro, M.; Kumar, R.R.; Alabrah, A.A.; Ashraf, Z.; Bisoy, S.K.; Parveen, N.; Khawatmi, S.; Abdelsalam, A. Efficient Intrusion Detection System in the Cloud Using Fusion Feature Selection Approaches and an Ensemble Classifier. Electronics 2023, 12, 2427. [Google Scholar] [CrossRef]
- Divekar, A.; Parekh, M.; Savla, V.; Mishra, R.; Shirole, M. Benchmarking datasets for anomaly-based network intrusion detection: KDD CUP 99 alternatives. In Proceedings of the 2018 IEEE 3rd International Conference on Computing, Communication and Security (ICCCS), Kathmandu, Nepal, 25–27 October 2018; pp. 1–8. [Google Scholar]
- Kasongo, S.M. A deep learning technique for intrusion detection system using a Recurrent Neural Networks based framework. Comput. Commun. 2023, 199, 113–125. [Google Scholar] [CrossRef]
- Jiang, K.; Wang, W.; Wang, A.; Wu, H. Network intrusion detection combined hybrid sampling with deep hierarchical network. IEEE Access 2020, 8, 32464–32476. [Google Scholar] [CrossRef]
- Mirjalili, S.; Gandomi, A.H.; Mirjalili, S.Z.; Saremi, S.; Faris, H.; Mirjalili, S.M. Salp Swarm Algorithm: A bio-inspired optimizer for engineering design problems. Adv. Eng. Softw. 2017, 114, 163–191. [Google Scholar] [CrossRef]
- Hegazy, A.E.; Makhlouf, M.; El-Tawel, G.S. Improved salp swarm algorithm for feature selection. J. King Saud Univ.-Comput. Inf. Sci. 2020, 32, 335–344. [Google Scholar] [CrossRef]
Figure 1.
Flowchart of the proposed methodology to detect binary and multiclass network attacks.

Figure 2.
Training graphs for feature selection using the ISSA method: binary data (Left) and multiclass (Right).
Figure 2.
Training graphs for feature selection using the ISSA method: binary data (Left) and multiclass (Right).

Figure 3.
Binary and multiclass instances bar graph is shown in 4 sections: (A) binary class instances in the original dataset, (B) multiclass instances in the original dataset, (C) class balanced instances using SMOTE–Tomek for binary data, and (D) class balanced instances using SMOTE–Tomek for multiclass data.

Figure 4.
Graphical illustration of 4 ML classifiers’ results before applying feature selection and data balancing methods.
Figure 4.
Graphical illustration of 4 ML classifiers’ results before applying feature selection and data balancing methods.

Figure 5.
Graphical illustration of 4 ML classifier results after applying feature selection and data balancing methods.
Figure 5.
Graphical illustration of 4 ML classifier results after applying feature selection and data balancing methods.


Table 1.
Tabular description of previously proposed NIDS studies.
| Study | Year | Applied Methods | Dataset | Results |
|---|---|---|---|---|
| [32] | 2019 | Proposed SVM with non-linear kernel behavior | UNSW-NB15 | Binary Accuracy = 85.99% Multi-class Accuracy = 75.77% |
| [40] | 2020 | OSS- and SMOTE-based class balancing and CNN, LSTM-based hybrid approach for classification | UNSW-NB15 | Accuracy = 77.16% |
| [40] | 2020 | OSS- and SMOTE-based class balancing and CNN, LSTM-based hybrid approach for classification | NSL-KDD | Accuracy = 83.58% |
| [31] | 2020 | XGBoost-method-based feature selection and ML classifiers for classification | UNSW-NB15 | Binary Accuracy = 90.85%, Precision = 80.33%, Recall = 98.38%, F1-Score = 88.45% |
| [31] | 2020 | XGBoost-method-based feature selection and ML classifiers for classification | UNSW-NB15 | Multi-Class Accuracy = 77.51%, Precision = 79.50%, Recall = 77.53%, F1-Score = 77.28% |
| [36] | 2021 | Manual selection of standard features and LSTM-based classification BoT-IoT | UNSW-NB15 | Multi-class (3 Categories) Accuracy = 96.32% |
| [26] | 2022 | Two phase feature selection using filter and wrapper methods with MLP classification | UNSW-NB15 | Multi-class Accuracy = 84.24% |
| [39] | 2023 | XGBoost-method-based feature selection and LSTM-, RNN-, GRU-based classification | NSL-KDD | Binary Accuracy = 88.13%, Multiclass Accuracy = 86.93% |
| [39] | 2023 | XGBoost-method-based feature selection and LSTM-, RNN-, GR- based classification | UNSW-NB15 | Binary Accuracy = 87.07%, Multiclass Accuracy = 78.40% |
Table 2.
Optimal parameters found for feature selection using ISSA method.
| Parameter | Values |
|---|---|
| Salps selected for feature subset | 10 |
| Epochs | 50–100 |
| K value in KNN | 5 |
| Folds | 5 |
Table 3.
Binary and multiclass classification results on original UNSW-NB15 dataset before applying feature selection and class balancing methods.
Table 3.
Binary and multiclass classification results on original UNSW-NB15 dataset before applying feature selection and class balancing methods.
| Categories | Methods | Accuracy | Precision | Recall | F1-Score |
|---|---|---|---|---|---|
| Binary | Random Forest | 96.46 | 96.46 | 96.46 | 96.46 |
| Extra Tree | 96.29 | 96.28 | 96.29 | 96.28 | |
| Decision Tree | 95.61 | 95.62 | 95.61 | 95.62 | |
| Gradient Descent Boost | 94.16 | 94.14 | 94.16 | 94.14 | |
| Multiclass | Random Forest | 82.58 | 82.50 | 82.58 | 81.44 |
| Extra Tree | 82.52 | 82.53 | 82.52 | 81.49 | |
| Decision Tree | 82.55 | 82.02 | 82.55 | 81.53 | |
| Gradient Descent Boost | 81.42 | 81.31 | 81.42 | 79.02 |
Table 4.
Binary and multiclass classification results on original UNSW-NB15 dataset after applying feature selection and class balancing methods.
Table 4.
Binary and multiclass classification results on original UNSW-NB15 dataset after applying feature selection and class balancing methods.
| Categories | Methods | Accuracy | Precision | Recall | F1-Score |
|---|---|---|---|---|---|
| Binary | Random Forest | 98.03 | 98.03 | 98.03 | 98.03 |
| Extra Tree | 98.09 | 98.10 | 98.09 | 98.09 | |
| Decision Tree | 97.22 | 97.22 | 97.22 | 97.22 | |
| Gradient Descent Boost | 94.35 | 94.36 | 94.35 | 94.35 | |
| Multiclass | Random Forest | 85.15 | 85.79 | 85.15 | 85.31 |
| Extra Tree | 84.98 | 85.70 | 84.98 | 85.19 | |
| Decision Tree | 83.81 | 84.64 | 83.81 | 84.07 | |
| Gradient Descent Boost | 82.01 | 82.30 | 82.01 | 81.90 |
Table 5.
Comparison with recently applied different studies on binary and multiclass classification using UNSW-NB15 dataset.
Table 5.
Comparison with recently applied different studies on binary and multiclass classification using UNSW-NB15 dataset.
| Study | Year | Propsed Methods | Results |
|---|---|---|---|
| [32] | 2019 | Proposed SVM with non-linear kernel behavior | Binary Accuracy = 85.99% Multi-class Accuracy = 75.77% |
| [40] | 2020 | OSS- and SMOTE-based class balancing and CNN- and LSTM-based hybrid approach for classification | Accuracy = 77.16% |
| [31] | 2020 | XGBoost-method-based feature selection and ML classifiers for classification | Multi-Class Accuracy = 77.51%, Precision = 79.50%, Recall = 77.53%, F1-Score = 77.28% |
| [26] | 2022 | Two-phase feature selection using filter and wrapper methods with MLP classification | Multi-class Accuracy = 84.24% |
| [39] | 2023 | XGBoost-method-based feature selection and LSTM-, RNN-, and GRU-based classification | Binary Accuracy = 87.07%, Multiclass Accuracy = 78.40% |
| Proposed Framework | ISSA-method-based feature selection and SMOTE–Tomek-based class balancing for network intruder detection | Binary Accuracy = 98.09%, Precision = 98.10%, Recall = 98.09%, F1-score = 98.09% | |
| Multi class Accuracy = 85.15%, Precision = 85.79%, Recall = 85.15%, F1-score = 85.31% |
Disclaimer/Publisher’s Note: The statements, opinions and data contained in all publications are solely those of the individual author(s) and contributor(s) and not of MDPI and/or the editor(s). MDPI and/or the editor(s) disclaim responsibility for any injury to people or property resulting from any ideas, methods, instructions or products referred to in the content. |
© 2023 by the author. Licensee MDPI, Basel, Switzerland. This article is an open access article distributed under the terms and conditions of the Creative Commons Attribution (CC BY) license (https://creativecommons.org/licenses/by/4.0/).
Share and Cite
MDPI and ACS Style
Alabrah, A. An Efficient NIDPS with Improved Salp Swarm Feature Optimization Method. Appl. Sci. 2023, 13, 7002. https://doi.org/10.3390/app13127002
AMA Style
Alabrah A. An Efficient NIDPS with Improved Salp Swarm Feature Optimization Method. Applied Sciences. 2023; 13(12):7002. https://doi.org/10.3390/app13127002
Chicago/Turabian StyleAlabrah, Amerah. 2023. "An Efficient NIDPS with Improved Salp Swarm Feature Optimization Method" Applied Sciences 13, no. 12: 7002. https://doi.org/10.3390/app13127002
Note that from the first issue of 2016, this journal uses article numbers instead of page numbers. See further details here.