Article

Biochar Effects on Ce Leaching and Plant Uptake in Lepidium sativum L. Grown on a Ceria Nanoparticle Spiked Soil

1
Department of Agricultural, Food, Environmental and Animal Sciences, University of Udine, Via Delle Scienze 208, I-33100 Udine, Italy
2
Dipartimento di Scienze Agrarie e Forestali, University of Palermo, Viale Delle Scienze Bldg. 4, I-90128 Palermo, Italy
*
Author to whom correspondence should be addressed.
Appl. Sci. 2023, 13(11), 6846; https://doi.org/10.3390/app13116846
Submission received: 6 May 2023 / Revised: 29 May 2023 / Accepted: 30 May 2023 / Published: 5 June 2023

Abstract

:
The increasing use of nanoparticles is causing a threat to the environment and humans. The aim of this work was to evaluate the effects of the quenching procedure of biochar production on the biochar capacity to retain the CeO2 nanoparticle (CeO2NP) in soil. The effects on Lepidium sativum L. (watercress) were considered. Two biochars were produced from fir wood pellets under the same pyrolysis conditions but with different quenching procedures: dry quenching and wet quenching. The two biochars (BCdryQ and BCwetQ) were separately added to a CeO2NP-spiked soil (1000 mg kg−1) at the dose 5%DW and placed in 12 lysimeters under controlled conditions. Lepidium sativum L. seeds were sowed on each lysimeter. The lysimeters were irrigated once a week for 7 weeks, and the leachates were collected. At the end of the experiment, the aboveground biomass was harvested; the total number of plants and the number of plants at the flowering stage were counted, and the height of the tallest plant and the total dry biomass were measured. The data showed that the quenching procedure influences the CeO2NP retention in soil, and BCdryQ can reduce the leaching of the nanoparticles. Biochar significantly increased the flowering in plants, and BCwetQ reduced the biomass production. This work highlights the importance of the biochar production process for soil applications. The production settings are crucial in determining the efficacy of the product for its ultimate use.

1. Introduction

The use of nanoparticles has been increasing over the last few years. Nanoscale material application includes a variety of different areas (e.g., electronic, biomedical, pharmaceutical, cosmetic, energy, environmental, etc.). Its increasing use is posing a threat to the environment and human beings that can be exposed by inhalation, absorption through the dermal system and ingestion through the gastrointestinal system [1]. It has been proved that their presence in the ecosystem may have negative effects on organisms’ reproduction, mobility and survival [2], especially in mammals. Additionally, toxicological effects might be caused by their biomimetics properties and high ability of distribution and bioaccumulation in soil, water and foods [3]. Cerium is the rare-earth element (REE) considered by the authors of this article, belongs to the group of and is included in the wider group of REEs [4]. The toxicity of the REE, which are not essential to plants, is still under investigation. However, commercial REE fertilizers are used for their proven positive effect on the yield of several crop species [5]. Nonetheless, it is noteworthy that annual long-term applications of insecticides and herbicides and the excessive fertilization were identified as a significant source of potentially toxic trace elements such as heavy metals and REEs that can modify the natural geochemistry of agricultural soils [6]. Several authors have proven that REEs can be absorbed and accumulated by plants, and some have linked such a phenomenon with the similarity of the atomic radii that they share with Ca [7]. Some authors [8] have reported the biochemical and physiological aspects of REEs in plants in a review that also described the history of the application of REEs in agriculture that started in China in the year 1972 after decades of research. In water, when such elements are not in their ionic form but occur as nanoparticles, the scenario changes radically, and it gets more complicated to understand and predict the interactions and fate of the elements in the environment. In experiments using CeO2 nanoparticles (CeO2NPs) [9], it was noticed that 250 mg L−1 was sufficient to show toxicity in beans (Phaseolus vulgaris L. var. khomain, pinto beans). The authors noticed that the treatment with CeO2NPs induced a reduction in Mo accumulation and a parallel overaccumulation of K, regardless of the tissue considered, as well as a modification of the phytohormones levels. Negative results were also observed by some authors [10], who noticed that the growth of shoots and chlorophyll synthesis were inhibited by CeO2NPs in glycine max, and by others [11], who observed chromosomal aberrations in Allium sativum L. root cells as a consequence of high Ce concentration exposure that could be associated with the inhibition of root growth.
Additionally, it has been reported that CeO2NPs were taken up without any modification into the plant tissues of soybean seedlings and, also, in roots of corn seedlings [12]. Other authors observed such a phenomenon in plants of Coriandrum sativum L. [12], Cucumis sativus L. [13] and Solanum lycopersicon L. [14]. Going up the food chain, animals have been proven to undergo accumulation. Investigating the effects of the combined exposure to diesel exhaust particles (DEPs) and CeO2 on the pulmonary system in a rat model (specific pathogen-free male Sprague–Dawley rats exposed via a single intratracheal instillation), it was observed that CeO2 induces a sustained inflammatory response [15]. CeO2 activated alveolar macrophage and lymphocyte secretion of the proinflammatory cytokine IL-12. Other studies showed effects on the nematode Caenorhabditis elegans [16], the bacteria Escherichia coli [17] and several others.
The fate of nanoparticles in natural soil is not yet entirely clear. It is certain that many factors influence their fate and behavior. An interesting review [18] described the parameters affecting the mobility and bioavailability of the TiO2 nanoparticle in soil as being the soil pH, the organic matter content, the soil texture and ionic strength that may affect the nanoparticle’s zeta potential, surface charge/affinity and aggregation. Furthermore, studying the transport of polyvinylpyrrolidone-coated Ag-NP in a spiked solution applied to 11 soils in saturated columns, some authors [19] observed that the nanoparticle would rapidly interact with the soil colloids such as maghemite or montmorillonite, which would rapidly limit their mobility. The authors concluded that the interactions of the nanoparticles that led to the aggregation with soil colloids (heteroaggregation) played a key role in the transport of the nanoparticles, which ultimately depended on the size of the aggregate. From this perspective, biochar, being a porous and negatively charged material thanks to the functional groups on its surface, is very likely capable of interfering with the mobility of nanoparticles in soils. Hence, it can be an important tool for soil remediation when it is about nanoparticle contamination. Porous media interfere with the mobility of contaminants in soil, the reason being that they impede their movements by straining or physically filtering the particles: the ones that are larger than the pores are trapped, while the others are removed by interception, diffusion and sedimentation [20]. The surface charges of the nanoparticles—hence, their interaction with the soil aggregates and the biochar particles—depend on the pH. A study of the nanoceria uptake by cells as a function of the amount of surface charge on the nanoparticles indicated that factors such as the pH have a considerable impact on the surface charges of nanoceria particles [21]. Not only the nanoparticles but also the biochar and, in general, pyrogenic carbonaceous material contain C-rich nanoparticles that can interact with engineered metal nanoparticles and have a significant influence on both heteroaggregation and homoaggregation phenomena that influences the metal nanoparticles’ mobility in soil [22]. In facts, porous materials have been applied to reduce the aggregations of metal nanoparticles; among these porous materials with higher surface areas and ion exchange capacities, biochar has become one of the most widely used supporting materials for metal nanoparticles [23]. Last, but not least, biochars have a great impact on the soil pH. In fact, it changes the soil properties, and the variations in terms of mobility may be due to variations in the CEC; porosity and other factors, such as pH, Ca ion concentration and the presence of other types of natural colloids that are the likely final sink of the nanoparticles [24]. Citrate-capped Au nanoparticles, for instance, have been observed to be retained by biochar-amended soils that were significantly more effective from this point of view than sandy soils [25]. In this interesting study, the authors evaluated several aspects, such as the charge neutralization, the pore penetration, the hydrogen bonding and the charge transfer between the biochar and the nanoparticles. The role of the functional groups is clearly very important, which emphasizes the interaction of the biochar with the new contaminants that is not limited to the physical level. Given the assumption that the transport of nanoparticles in soil is affected by the soil’s physical and chemical properties, we hypothesize that biochar may have different effects on the nanoparticle’s mobility and be useful for the remediation of CeO2NP-contaminated soils. Such an effect may be influenced by the quenching process at the end of pyrolysis. The quenching process can be dry or water quenching. The first one consists in letting the biochar cool down for the time necessary to reach room temperature; the second is performed by adding water directly onto the hot biochar at the end of pyrolysis. Water quenching determines a higher porosity and a lower ash content through the leaching of elements that leave free interlayer spaces [26]. Such a modification is expected to produce a different sorption capacity of the biochar used on polluted sites. The work aimed to evaluate the effects of two quenching procedures as the final stage of the biochar production and the biochars’ capacity to retain cerium nanoparticles in CeO2NP-spiked soil. Therefore, the study aimed to study the CeO2NPs leaching from the soil amended with two biochars, as well as the effects on plant Lepidium sativum L. (watercress).

2. Materials and Methods

2.1. Materials Characterization and Experiment Set-Up

The CeO2NPs (particle size < 25 nm) in the form of nanopowder were purchased from Sigma-Aldrich Co. LLC. The soil was collected from a residential area located in the proximity of the University of Udine, Italy (46°04′52″ N, 13°12′33″ E; top 20 cm), air-dried at room temperature and sieved through a 2 mm mesh before the characterization. The soil was classified as clay soil (sand 26%, silt 6.4% and clay 67.6%) with a pH 7.40 ± 0.01, CEC 13.9 ± 0.3 (cmol kg−1 DM) and OM 4.4 ± 0.6 (%); it was sieved through a 2 cm mesh before the addition of the nanoparticles and the application of the biochars. Both these two phases were achieved using a cement mixer (20 min for each mixing and 15 days equilibration between the nanoparticles and the biochar addition). The two biochars used to amend the soil were produced using the same feedstock (fir wood pellets) but with a different quenching procedure: wet (BCwetQ) and dry (BCdryQ), as described by [27]. Briefly, the first quenching procedure was performed by watering the pyrolyzed feedstock directly in the kiln of the carbonization system, while the second quenching procedure was done by sealing the kiln until the biochar cooling was complete. The mixtures were used to fill up 12 packed lysimeters (height: 55 cm; diameter: 15 cm) (Figure 1) according to the following experimental designs: CTRL (soil + CeO2NPs at 1000 ppm), DRY (soil + CeO2NPs at 1000 ppm + 5%DW biochar dry-quenched) and WET (soil + CeO2NPs at 1000 ppm + 5%DW biochar quenched with water). There were 4 replications. The biochars (BCwetQ and BCdryQ) were produced using the Elsa Research carbonization system (BLUECOMB™) [27].

2.2. Experiment Management

The lysimeters received artificial illumination (PAR: 500 μmol s−1m−2, 16 h day−1) and were kept at room temperature. They were initially saturated with water, and after 15 days of equilibration, seeds of L. sativum L. were sowed at the amount of 0.021 g of seed for each lysimeter. After two days, the germination was complete, and after 5 days from sowing, the drip irrigation started. Two sources of irrigation per lysimeter provided 1000 mL of deionized water once a week for 7 weeks. The leached water was collected at the bottom of the lysimeters after 3 days of irrigation. After the determination of the leachate volume, 50 mL of leachate were filtered with a cellulose nitrate membrane (pore size = 0.45 µm), and the electric conductivity (EC) and pH (slurry ratio for biochar characterization: biochar:water = 1:20; slurry ratio for soil characterization: soil:water = 1:4) were measured. Then, the leachate samples were acidified in test tubes and stored in a refrigerator until the elemental characterization using an ICP-OES (Varian Inc., Palo Alto, CA, USA, Vista MPX).
At the end of the experiment, the aboveground biomass was harvested from each lysimeter. The total number of plants and the number of plants at the flowering stage were counted. The height of the tallest plant was also measured, as well as the total dry biomass (70 °C, 24 h). The dry biomass was acid-mineralized with a microwave unit (MarsXpress, CEM Corporation, Charlotte, NC, USA) following the USEPA protocol [28] and analyzed with the ICP-OES to verify the Ce uptake. The substrates in the columns were also sampled at three depths (15, 25 and 35 cm); 2 mm-sieved; oven-dried (70 °C, 24 h) and acid-digested using the USEPA protocol [29] and analyzed with the ICP-OES.
The total organic C (TOC) and total N (TN) in the soil leachates were measured by an automated elemental analyzer (Shimadzu TOC-VCPN, Kyoto, Japan).

2.3. Statistical Analysis

The one-way ANOVA (repeated measurements) was applied using the Tukey HSD test for the post hoc analysis (significance level = 0.05). When the homogeneity test results were significant, data transformation was used (ln(EC)). When the data transformation was not enough to meet the assumption for the ANOVA, the Kruskal–Wallis test was applied. The ANCOVA was used for the data on Ce leaching to separate the effect due to the type of quenching and the time of sampling. SPSS (IBM ver.16.0) software was used for the statistical analyses.

3. Results

3.1. Soil Characteristic
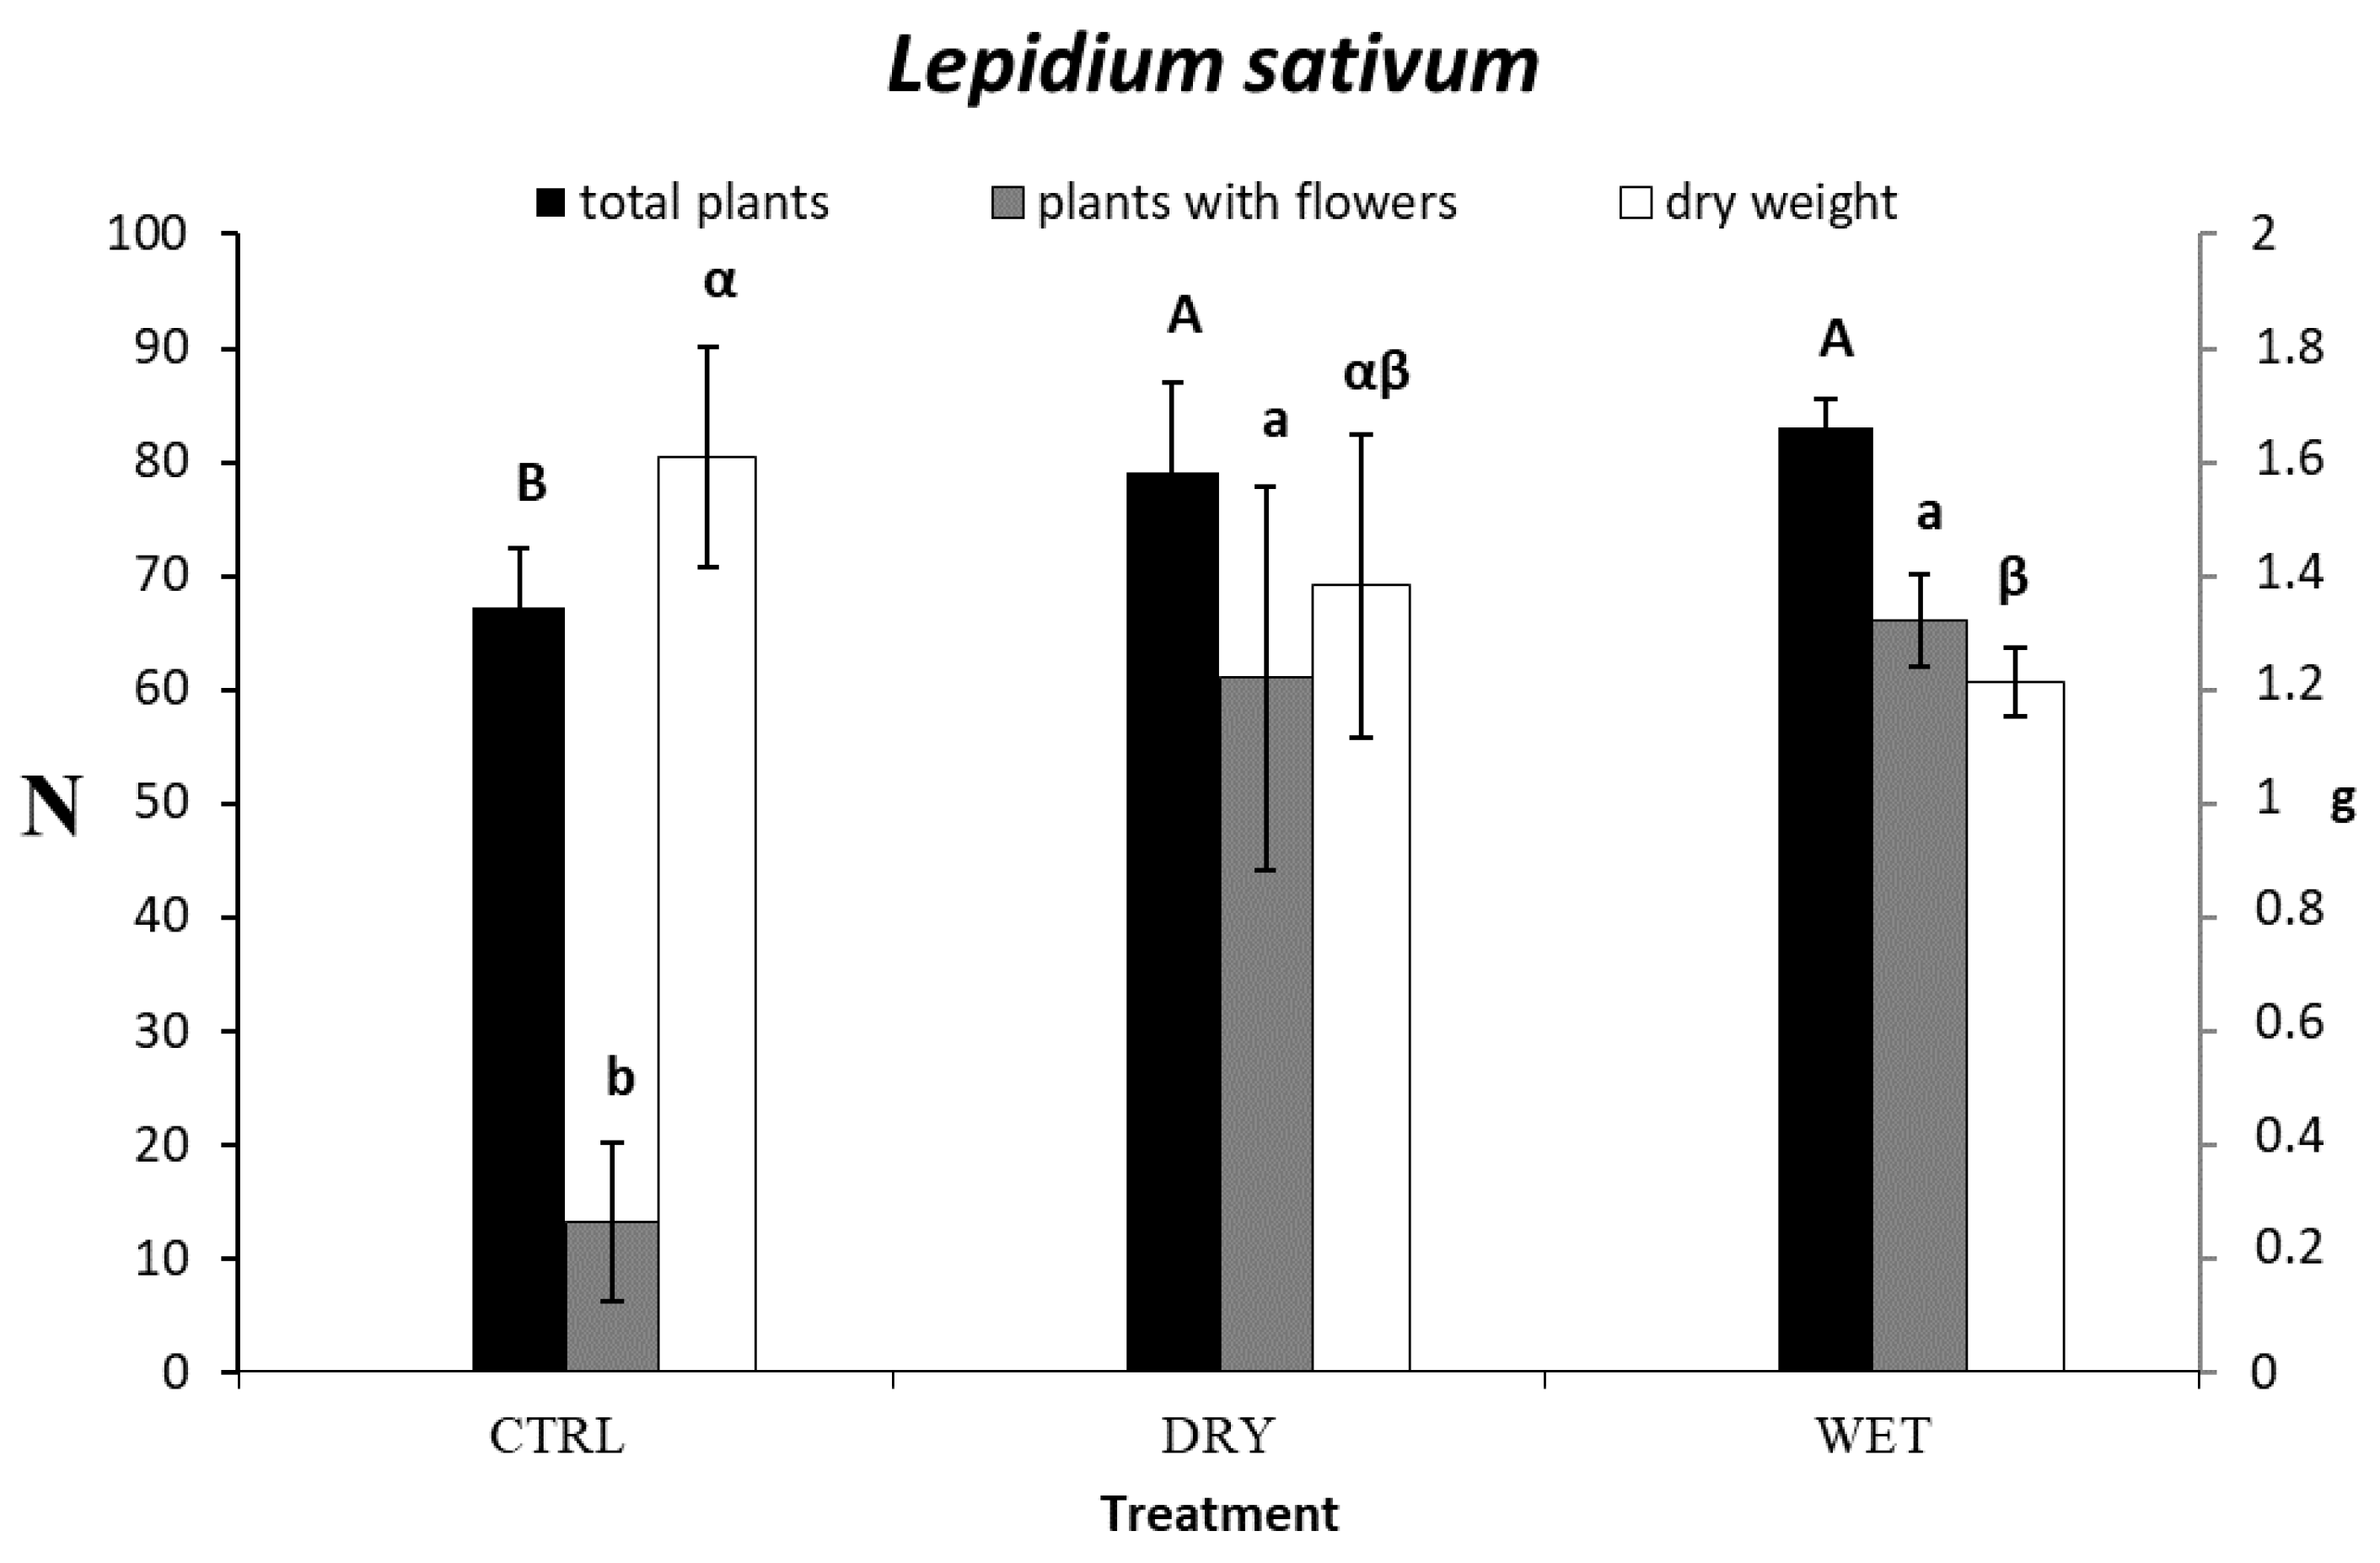
The application of the two biochars to the CeO2NP-spiked soil determined a significant change in the EC. The EC (n = 3) of the three substrates were statistically different and decreased in the following order: CTRL > DRY > WET (Table 1). The wet treatment resulted in the lowest EC, which was determined by the fact that the quenching water washed away part of the ashes, which remained in the BCdryQ, instead. Table 1 shows the pH, which were different for the three substrates but in a different order: DRY > WET > CTRL. The fact that the amended soil showed a higher pH compared to the unamended soil (CTRL) was due to the high pH of the two biochars.

3.2. Ce in Plants

The plants’ Ce uptake was negligible (below the detection limit). Hence, no effects of biochar application could be highlighted.
The biochars increased the plant survival exposed to CeO2NPs, regardless of the type. At harvest, the CTRL treatment resulted in 67 plants versus 79 plants (p-value = 0.042) and 83 plants (p-value = 0.009) in the DRY and WET treatments, respectively. The number of plants was not statistically different between the two biochars.
Although the mean height in the CTRL treatment was the highest (25 ± 1.96 cm, n = 4), no differences resulted in the ANOVA. However, the biochars induced early flowering of the species L. sativum (Figure 1) for the limited period of the experiment (plants at the flowering stage: 13 ± 7; 61 ± 16.9 and 66 ± 4 for the CTRL, DRY and WET substrates, respectively).
The Kruskal–Wallis test revealed that the anticipation of the flowering stage detected in the plants of L. sativum grown on the eight lysimeters amended with the two biochars was significant (p-value = 0.02 for both the biochars versus the CTRL treatment). Such an influence showed the same effect regardless of the type of biochar (in the comparison of each single biochar with the CTRL treatment, the eta-squared values were equal (0.771)). In conclusion, flowering was anticipated, regardless of the type of quenching. Similar results were also observed by other authors [30].

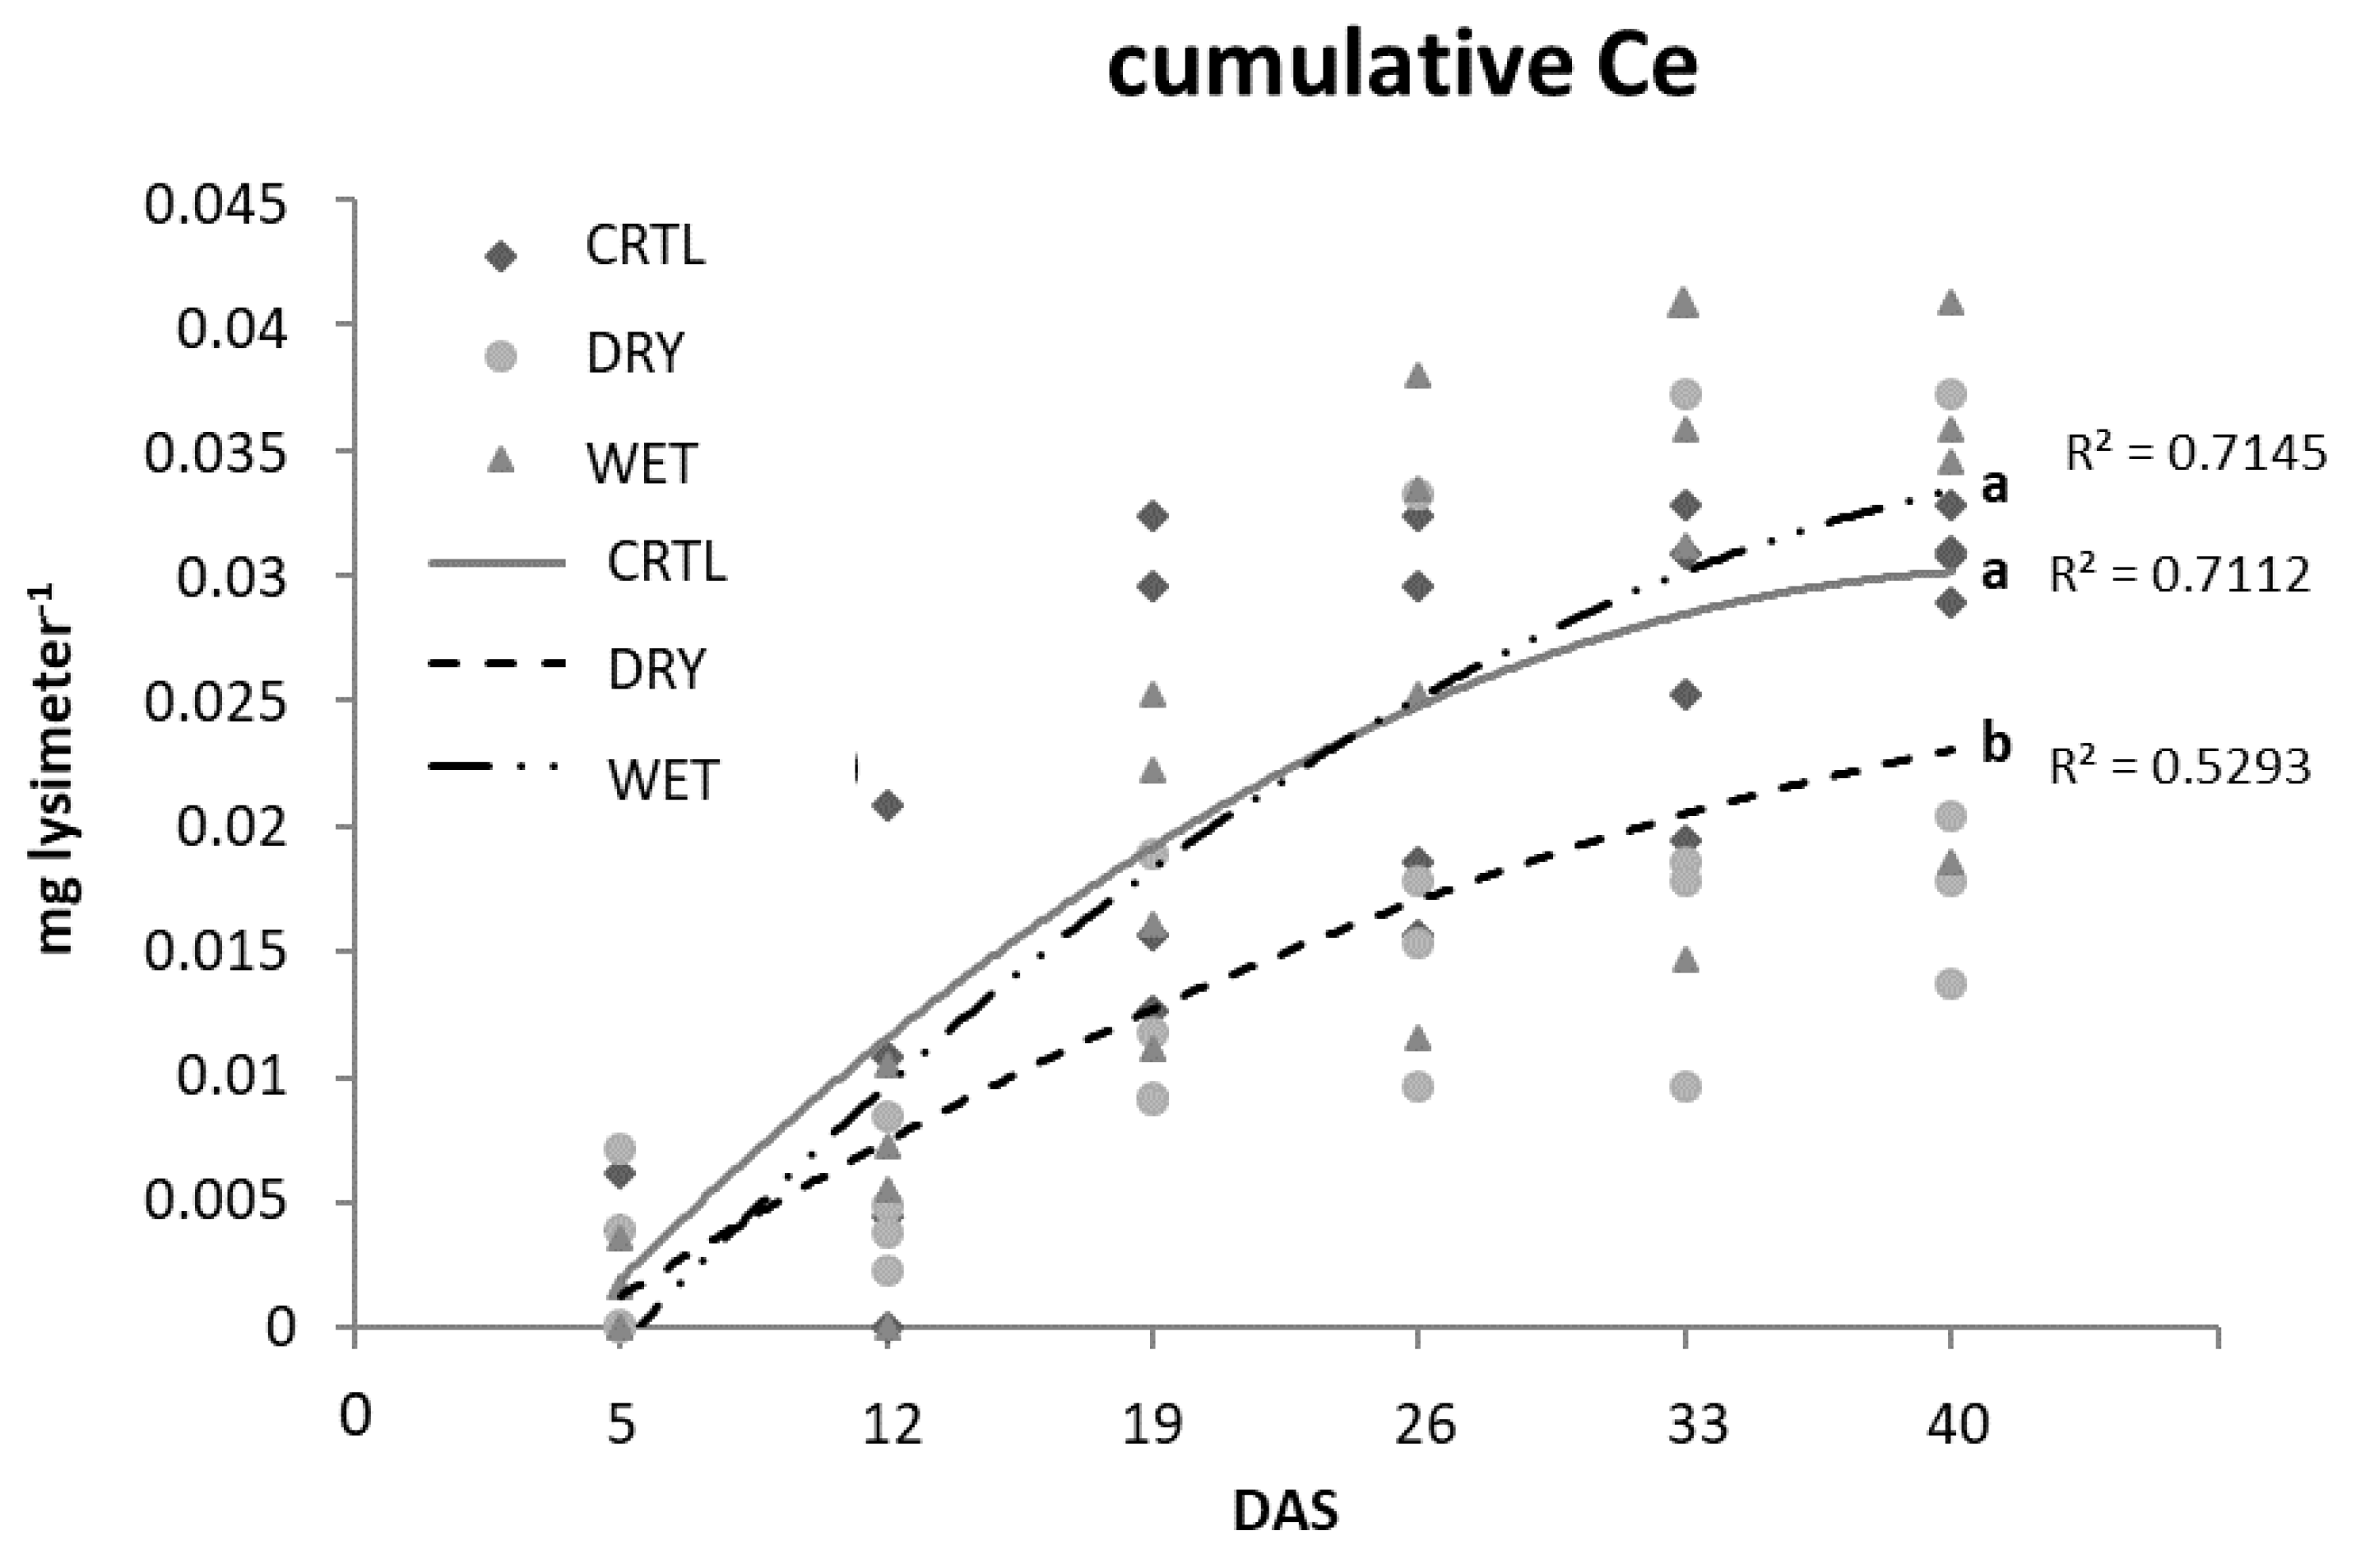
3.3. Ce in Leachates

Figure S1 reports the leachate volume measured after each irrigation. The initial difference in the leachates of the three treatments was due to the difference in the biochar quenching procedure. Despite that the columns were initially saturated, a certain fraction of the pores of the dry biochar were still not wetted after 15 days of equilibration. With the following first irrigation, these pores most likely retained part of the water, thereby resulting in a lower volume of the leachates from the four columns with the soil amended with BCdryQ. This can be explained by considering what was reported by the authors in a recent study [27]. They studied the changes of BCdryQ and BCwetQ after an experiment on an addition to the soil by using the fast field cycling NMR relaxometry technique. The analyses revealed that the biochars underwent different modifications that altered their initial porosity and hydrophobicity. In particular, BCdryQ was chemically modified so that its hydrophobicity was reduced; BCwetQ changed both chemically and physically, so both the porosity degree and surficial chemistry changed. Due to these transformations, BCdryQ and BCwetQ changed differently in their attitudes to retain water. BCdryQ became less hydrophobic than BCwetQ, which might explain the higher reduction in terms of the leachate volume of the substrate DRY at the first irrigation compared to the leachate of the substrate WET (Figure S1). Moreover, this proves that the water-holding capacity (WHC) of the soil amended with the two biochars changed in time due to the biochar aging. The general decreasing trend of the leachate volumes with the following irrigations is explained by the fact that the evapotranspiration of the plants on top of the columns became more and more significant as the plants were growing.
The ANCOVA (‘biochars type’ as fixed factor and ‘sampling’ as covariate) showed that there was no difference in statistical terms when the CeO2NP total content in the leachates was considered (Figure S1). A different outcome resulted when the cumulative CeO2NPs leached from the lysimeter were analyzed (Figure 2).
This parameter was calculated with the following formula:
C e O 2 N P s c u m u l i = [ C e O 2 N P s ] i V l e a c h a t e   i + n = 1 i C e O 2 N P s   c u m u l i 1
where
  • [CeO2NPs]i = Ce concentration (mg L−1) of the ith leachate;
  • Vleachate i = volume (L) of the leachate at the ith sampling;
  • i = sampling number ϵ [1,6].
The ANCOVA ran on the cumulative CeO2NPs showed that both the sampling and the biochar-type factors were significant in determining the amount of CeO2NPs leached from the lysimeters (p-values < 0.000 and 0.017, respectively). Figure 2 shows the polynomial curves fitting the data on the leached cumulative CeO2NPs. The dry quenching results in the treatment significantly reduced the leaching of NPs from the soil. The mean amount of CeO2NPs removed with the irrigation was 0.014 mg.
The amount of CeO2NPs leached was affected by BCdryQ when compared to BCwetQ (Figure 2). This is in agreement with a work on the capacity of different soils to capture silver nanoparticles (AgNPs) [31], that demonstrated that BC increases the EC of the soil, hence its ionic strength, decreasing the nanoparticles’ mobility.

3.4. Ce in Soil

No differences were observed in the total content of CeO2NPs in the soil profile (sampling depths: 15, 25 and 35 cm) for every single treatment (CRTL, WET and DRY) (Figure S2) at the end of the experiment. The two-way ANOVA (factors: BC and depth) showed that depth is not significant, as well as the interaction of depth x BC. On the other hand, the BC type (BCwetQ and BCdryQ) is a significant factor: the total Ce concentration in mg kgDW−1 in the soil, considering the three treatments at the end of the experiment, resulted in significant differences in the following order: CTRL = DRYQ > WETQ (means: 443, 380 and 225 mg kgDW1). The WET substrate showed a lower EC (Table 1). The smaller amount of Ce in the WET treatment was in agreement with the fact that the lower EC might determine a higher water mobility and lower nanoparticle soil retention. Moreover, in agreement with what was stated by [27], given the fact that BCwetQ has a lower BET surface area and a higher hydrophobicity, this can further explain the lower capacity in retaining CeO2NPs; conversely, being more hydrophilic due to the chemical changes of the aging process in soil, BCdryQ may retain CeO2NPs with higher efficacy than BCwetQ, and this explains the lower mean mg Ce lysimeter−1 of the DRY treatment compared to the WET, which is 1.46 times higher.

3.5. Total Organic Carbon (TOC) and Total Nitrogen (TN) in Leachates

Figure 3a,b report the TOC of the leachates collected after the irrigations.
As reported by [27], BCdryQ has a higher C content than BCwetQ. By considering the leachates, the TOC from BCdryQ and BCwetQ-treated columns (see Figure 3a) were not statistically different, except for the leachates collected on the 26th day after sowing. By looking at the mean values, it appeared that the TOC mean value from the WET Q treatment was always higher than the DRY Q treatment. Table 2 reports the p-values of the pairwise comparison for the factors DAS and treatment for the variable TOC results from the two-way ANOVA.
The two treated substrate did not differ, but they were significantly different from the CTRL treatment. In particular, the biochar application resulted in a lowering of the leachable organic C, regardless of the type of quenching.
As for the irrigations, the TOC in the leachates was such that the first two leachates (occurring at 5 and 12 DAS) were significantly higher than the last two leachates (occurring at 33 and 40 DAS), while the TOC mean values for the leachates 19 and 26 DAS were not statistically different from the first and second irrigations (5 and 12 DAS) and from the second irrigation (12 DAS), respectively.
With regards to the TN, Figure 3b shows a clear difference between the TN in the CRTL leachates that was separate from the leachates collected from the treated substrates (WET and DRY), being much higher when the biochar was not applied to the soil.

4. Discussion

4.1. Ce in Plants

The data regarding Ce plant uptake was in accordance with the observations by other authors [32,33,34], studying CeO2 nanoparticle uptakes of corn, lettuce, soybeans and zucchini grown in a soil amended with biochar from pecan shells, observed that, in most cases, there were no effects on the Ce accumulation in plant tissues. In fact, Ce accumulation occurred mostly at the highest CeO2 level (2000 mg kg−1). The authors of [33] confirmed that a 2000 mg CeO2NPs L−1 concentration in hydroponic conditions negatively affected Triticum aestivum L. growth and its photosynthesis-related processes. The application of biochar from the pyrolysis of bamboo leaves at 500 °C considerably reduced about nine-fold the Ce in plants through the surface complexation process, alleviating the phytotoxic effects; they also observed that the biochar application showed a positive effect on plant growth at all CeO2NPs exposure levels. The authors of [34], in a study where AgNPs were accounted for, concluded that the exposure to plants induced dose-dependent phytotoxicity with negative effects on the plant growth, photosynthesis, gas exchange and nutrients assimilation. The addition of biochar reduced the toxic effects of AgNPs by reducing four to eight times the uptake and Ag tissue accumulation.
Although not the main objective of the present study, a phonological shift observed in L. sativum induced by the BC application (regardless of the quenching type) was observed. According to [35], biochar can have a full range of responses in terms of germination and plant development, thereby influencing some growth traits but not some others, and have an impact on the hormone pathways. The experiments performed by [36] using three types of biochar and L. sativum (other than lentils, lettuce, cucumbers and tomatoes) revealed that differences were observed for cress seeds with which two biochars (paper sludge and wheat husks biochar and sewage sludge biochar) showed a phytostimulant effect.
A greater height of the plants as a response after biochar application was observed by several authors, such as in rice [37], in corn [38] and in cotton [39]. Recently, several studies have been performed to observe the nanoceria accumulation in plants from contaminated soils, considering a wide spectrum of concentrations and no evidence of accumulation was observed at the lowest concentrations (from 1.3 to 62.5 mg kg−1) [40]. According to the authors, evidence of CeO2NPs uptake was found for concentrations above 100 mg kg−1. However, the processes that influence the nanoparticles’ bioavailability are still unknown. The same authors, examining the effect of the soil properties on the CeO2NPs’ phytoavailability and uptake by fescue and tomatoes, observed that one of the main influencing factors (second only to the initial concentration of Ce in soil) was the soil type in terms of texture, the clay soils being the ones for which the phytoavailability was lower than the sandy soils within the range 70–80%. This was another important observation that could explain the low plant uptake, since the clay content of the soil used in this experiment had a high clay content (67.7%).

4.2. Ce in Leachates

The different quenching procedures at the end of the biochar production process had an influence on the CeO2NP leaching from the soil that received BCdryQ, as previously stated in the Results section when describing Figure 2. Given the fact that part of the water was retained by the pyrolyzed mass and the rest of it was leached away, the water quenching procedure might be responsible for the removal of a fine fraction of carbonized particles and ashes that could have potentially interacted with ions and nanoparticles in the soil after the addition of the biochar. In other words, this fine fraction might be able to affect the mobility of ions and nanoparticles in the amended soil, together with the soil particles (clay) and contribute to the explanation of the lower amount of Ce in the leachates of the DRY substrate. In a review on the impact of engineered nanoparticles on the physical and chemical properties of soils [41], it was confirmed the role of soil organic matter (SOM) and the explanation of the adsorption of the latter in metal nanoparticles to form a corona that could induce aggregation between the nanoparticles that subsequently precipitated on the soil particles. This process contributed to leaching reduction.

4.3. Ce in Soil

The fact that the content of CeO2NPs did not change in the soil profile contrasted with the cumulative study of the leachates, where it was shown that NP transport from the soil occurred. This contradiction could be accounted for by hypothesizing that such transport removed the more mobile fraction of the NPs (the NPs in the soil solution and the NPs aggregated to small colloids); this removal emptied the pool of mobile NPs of the columns to the point that no more differences were detectable. The differences in terms of the total amount (mg) of Ce leached at the end of the experiment could be attributed to the different influences of the BC on the soil properties (porosity, pH, ionic strength, etc.). Indeed, BC had an effect on the amount of the mobile fraction of CeO2NPs. From this point of view, the BC efficacy in reducing the mobility of the NPs has to be taken into account. Moreover, Figure S3 shows that the EC, which is related to the ionic strength, the temperature and the mobility of the ions of the substrate, tended to reach a plateau at the end of the experiment. Such behavior might justify the lack of differences in the soil profile in terms of the Ce content. This was also confirmed by the trends of the cumulative curves reported in Figure 2, which means that the increments of leached NPs were smaller in time, approaching an equilibrium state.

4.4. Effects of TOC in CeO2NP Retention

The TOC in soil solutions can influence the nanoparticle mobility in the soil, as reported by [42]. According to them, the dissolved organic carbon (DOC), which is a fraction of the TOC, showed a positive correlation with the concentration of CuO nanoparticles in the soil solution, being able to impede the aggregation by steric repulsion. In fact, the nanoparticles’ aggregation could accelerate their sedimentation from the soil solution, avoiding their movement in the soil profile. According to [43], dispersed nanoparticles in an aquatic environment were partly deposited as sediment after aggregation as homoaggregates and heteroaggregates. The soil solution was extremely complex, and the fate of the nanoparticles was inevitably set by its properties, as well as the nanoparticles’ properties. Many other authors have agreed with the conclusion that the DOC enhances the nanoparticles’ stability, avoiding aggregation [40,44]. Given this assumption, the CeO2NPs might have undergone different homo- and heteroaggregations (the latter with the soil natural colloids), depending on the presence (or absence) of the biochar and on the type of quenching procedure. Considering the effect of the treatments (the reduced TOC in the leachates of the treated soils compared to the controls), it might be concluded that a higher aggregation between the nanoparticles or between the nanoparticles and the soil colloids might have occurred, thereby justifying a smaller leaching of the nanoparticles as a direct consequence. Another possible explanation could be that the organic carbon retained in the biochar-amended soils could have otherwise coated the nanoparticles and bridged them to the soil/biochar surface, again reducing their mobility. This might, in part, explain the lower cumulative Ce in the leachate of the columns with DRY soil compared with the control (Figure 2). The same conclusion cannot be assumed when considering the WET soil. Therefore, the differences between the effects of the two biochars (BCdryQ and BCwetQ) cannot be ascribed to the sole TOC reduction; otherwise, the cumulative Ce trends of the two substrates WET and DRY would have been much more similar. Figure 2 shows that the DRY treatment was separate from the WET treatment and the control. This implies that other factors must have played a role in reducing the nanoparticles’ leaching in the DRY substrate. This result must be explained with a different interaction between BCdryQ and the nanoparticle compared to BCwetQ. A possible explanation can be found in [27], which described the chemical surficial alteration of BCdryQ after the soil application, which determined a higher oxidation that was very important in determining the nanoparticles’ retaining capacity of the biochar through electrostatic interactions.

4.5. Ce in Leachates

As for the TN (Figure 3b), it was evident that the leached N was always higher from the CTRL substrate when compared with the biochar-treated ones. This might be the reason explaining the evidence that the biomass production of the plants from the CTRL treatment was the highest (Figure 1). Additionally, this could be due to the fact that the biochar application resulted in a lower mobility and bioavailability of the nutrient. According to [45] and, as it turns out, from the meta-analysis done by [46], the application of biochar to soil can have negative effects in the short term (<6 months) when it is about N and P availability to plants in agricultural ecosystems. Nguyen et al. [47], considering 56 studies and 1080 experimental conditions, concluded that biochar reduces soil inorganic N, regardless of the experimental conditions, within one year after application in 95% of cases.

5. Conclusions

The quenching procedure as the final phase of biochar production is an important step in influencing the performances of the product in the leaching of nanoparticles in soil. Such a step is less relevant when it is about biomass production and plant survival. Although some consider the REEs of limited toxicity to the environment, the increasing use of such elements in the nanoparticle industry may entail new threats and cause future issues related to the (bio)accumulation of elements that were once of no concern. Further investigations are required. The effect of biochar application on the mobility of CeO2NPs in soil as a result of the study reported in this work is limited to a specific scenario that is characterized by a specific type of nanoparticle and a single type of feedstock for biochar production. The wide variety of biochars and the fact that biochars undergo an aging process imposes the need for further research. More research needs to be done to study the evolution of nanoparticle retention by biochars throughout a certain amount of time.
This work highlights how important the biochar production process is when biochar is considered a tool for reducing the phytotoxicity of a moderately contaminated soil. Finally, this work shows the potential of biochars in lowering the N losses via leaching, but it also raises questions on how this might impact the N availability to plants.

Supplementary Materials

The following supporting information can be downloaded at: https://www.mdpi.com/article/10.3390/app13116846/s1: Figure S1: Mean volume of the leachates measured at each sampling indicated by the days after sowing for the tree substrates: CTRL, DRY and WET (mean ± Std. Dev., n = 4). Figure S2: Mean soil total content of Ce measured at three depths (15, 25 and 35 cm) at the end of the experiment for the tree substrates: CTRL, DRY and WET (mean ± Std. Dev., n = 4). Figure S3: Electric conductivity (EC) and pH of the leachates collected after each irrigation of the three substrates (CTRL, DRY and WET) (6 samplings; n = 4).

Author Contributions

Conceptualization, writing and data analysis: G.F.; validation and paper review: L.M. and P.C. All authors have read and agreed to the published version of the manuscript.

Funding

This research received no external funding.

Conflicts of Interest

The authors declare no conflict of interest.

References

  1. Sengul, A.B.; Asmatulu, E. Toxicity of metal and metal oxide nanoparticles: A review. Environ. Chem. Lett. 2020, 18, 1659–1683. [Google Scholar] [CrossRef]
  2. Tourinho, P.S.; van Gestel, C.A.M.; Lofts, S.; Svendsen, C.; Soares, A.M.V.M.; Loureiro, S. Metal-based nanoparticles in soil: Fate, behavior, and effects on soil invertebrates. Environ. Toxicol. Chem. 2012, 31, 1679–1692. [Google Scholar] [CrossRef] [PubMed]
  3. Chaud, M.; Souto, E.B.; Zielinska, A.; Severino, P.; Batain, F.; Oliveira, J., Jr.; Alves, T. Nanopesticides in Agriculture: Benefits and Challenge in Agricultural Productivity, Toxicological Risks to Human Health and Environment. Toxics 2021, 9, 131. [Google Scholar] [CrossRef]
  4. Connelly, N.G.; Damhus, T.; Hartsborn, R.M.; Hutton, A.T. Nomenclature of Inorganic Chemistry—IUPAC Recommendations; RCS Publishing: Cambridge, UK, 2005. [Google Scholar]
  5. Thomas, P.J.; Carpenter, D.; Boutin, C.; Allison, J.E. Rare earth elements (REEs): Effects on germination and growth of selected crop and native plant species. Chemosphere 2013, 96, 57–66. [Google Scholar] [CrossRef] [Green Version]
  6. Naccarato, A.; Tassone, A.; Cavaliere, F.; Elliani, R.; Pirrone, N.; Sprovieri, F.; Tagarelli, A.; Giglio, A. Agrochemical treatments as a source of heavy metals and rare earth elements in agricultural soils and bioaccumulation in ground beetles. Sci. Total Environ. 2020, 749, 141438. [Google Scholar] [CrossRef] [PubMed]
  7. Carpenter, D.; Boutin, C.; Allison, J.E.; Parsons, J.L.; Ellis, D.M. Uptake and Effects of Six Rare Earth Elements (REEs) on Selected Native and Crop Species Growing in Contaminated Soils. PLoS ONE 2015, 10, e0129936. [Google Scholar] [CrossRef] [Green Version]
  8. Hu, Z.; Richter, H.; Sparovek, G.; Schnug, E. Physiological and Biochemical Effects of Rare Earth Elements on Plants and Their Agricultural Significance: A Review. J. Plant Nutr. 2004, 27, 183–220. [Google Scholar] [CrossRef]
  9. Salehi, H.; Miras-Moreno, B.; Chehregani Rad, A.; Pii, Y.; Mimmo, T.; Cesco, S.; Lucini, L. Relatively Low Dosages of CeO2 Nanoparticles in the Solid Medium Induce Adjustments in the Secondary Metabolism and Ionomic Balance of Bean (Phaseolus vulgaris L.) Roots and Leaves. J. Agric. Food Chem. 2020, 68, 67–76. [Google Scholar] [CrossRef]
  10. Li, J.; Mu, Q.; Du, Y.; Luo, J.; Liu, Y.; Li, T. Growth and Photosynthetic Inhibition of Cerium Oxide Nanoparticles on Soybean (Glycine max). Bull. Environ. Contam. Toxicol. 2020, 105, 119–126. [Google Scholar] [CrossRef]
  11. Xu, Q.-M.; Wang, Y.-Z.; Liu, H.; Cheng, J.-S. Physiological responses and chromosomal aberration in root tip cells of Allium sativum L. to cerium treatments. Plant Soil 2016, 409, 447–458. [Google Scholar] [CrossRef]
  12. Morales, M.I.; Rico, C.M.; Hernandez-Viezcas, J.A.; Nunez, J.E.; Barrios, A.C.; Tafoya, A.; Flores-Marges, J.P.; Peralta-Videa, J.R.; Gardea-Torresdey, J.L. Toxicity Assessment of Cerium Oxide Nanoparticles in Cilantro (Coriandrum sativum L.) Plants Grown in Organic Soil. J. Agric. Food Chem. 2013, 61, 6224–6230. [Google Scholar] [CrossRef] [PubMed]
  13. Zhang, P.; Ma, Y.; Zhang, Z.; He, X.; Zhang, J.; Guo, Z.; Tai, R.; Zhao, Y.; Chai, Z. Biotransformation of Ceria Nanoparticles in Cucumber Plants. ACS Nano 2012, 6, 9943–9950. [Google Scholar] [CrossRef] [PubMed]
  14. Wang, Q.; Ma, X.; Zhang, W.; Pei, H.; Chen, Y. The impact of cerium oxide nanoparticles on tomato (Solanum lycopersicum L.) and its implications for food safety. Metallomics 2012, 4, 1105–1112. [Google Scholar] [CrossRef] [PubMed]
  15. Ma, J.Y.; Young, S.-H.; Mercer, R.R.; Barger, M.; Schwegler-Berry, D.; Ma, J.K.; Castranova, V. Interactive effects of cerium oxide and diesel exhaust nanoparticles on inducing pulmonary fibrosis. Toxicol. Appl. Pharmacol. 2014, 278, 135–147. [Google Scholar] [CrossRef] [PubMed] [Green Version]
  16. Roh, J.-Y.; Park, Y.-K.; Park, K.; Choi, J. Ecotoxicological investigation of CeO2 and TiO2 nanoparticles on the soil nematode Caenorhabditis elegans using gene expression, growth, fertility, and survival as endpoints. Environ. Toxicol. Pharmacol. 2010, 29, 167–172. [Google Scholar] [CrossRef]
  17. Zeyons, O.; Thill, A.; Chauvat, F.; Menguy, N.; Cassier-Chauvat, C.; Oréar, C.; Daraspe, J.; Auffan, M.; Rose, J.; Spalla, O. Direct and indirect CeO2nanoparticles toxicity for Escherichia coli and Synechocystis. Nanotoxicology 2009, 3, 284–295. [Google Scholar] [CrossRef]
  18. Tan, W.; Peralta-Videa, J.R.; Gardea-Torresdey, J.L. Interaction of titanium dioxide nanoparticles with soil components and plants: Current knowledge and future research needs—A critical review. Environ. Sci. Nano 2017, 5, 257–278. [Google Scholar] [CrossRef]
  19. Cornelis, G.; Pang, L.; Doolette, C.; Kirby, J.K.; McLaughlin, M.J. Transport of silver nanoparticles in saturated columns of natural soils. Sci. Total Environ. 2013, 463–464, 120–130. [Google Scholar] [CrossRef]
  20. Nowack, B.; Bucheli, T.D. Occurrence, behavior and effects of nanoparticles in the environment. Environ. Pollut. 2007, 150, 5–22. [Google Scholar] [CrossRef]
  21. Patil, S.; Sandberg, A.; Heckert, E.; Self, W.; Seal, S. Protein adsorption and cellular uptake of cerium oxide nanoparticles as a function of zeta potential. Biomaterials 2007, 28, 4600–4607. [Google Scholar] [CrossRef] [Green Version]
  22. Yi, P.; Pignatello, J.J.; Uchimiya, M.; White, J.C. Heteroaggregation of Cerium Oxide Nanoparticles and Nanoparticles of Pyrolyzed Biomass. Environ. Sci. Technol. 2015, 49, 13294–13303. [Google Scholar] [CrossRef] [PubMed]
  23. Liu, J.; Jiang, J.; Meng, Y.; Aihemaiti, A.; Xu, Y.; Xiang, H.; Gao, Y.; Chen, X. Preparation, environmental application and prospect of biochar-supported metal nanoparticles: A review. J. Hazard. Mater. 2020, 388, 122026. [Google Scholar] [CrossRef] [PubMed]
  24. Klaine, S.J.; Alvarez, P.J.J.; Batley, G.E.; Fernandes, T.F.; Handy, R.D.; Lyon, D.Y.; Mahendra, S.; McLaughlin, M.J.; Lead, J.R. Nanomaterials in the environment: Behavior, fate, bioavailability, and effects. Environ. Toxicol. Chem. 2008, 27, 1825–1851. [Google Scholar] [CrossRef]
  25. Uchimiya, M.; Pignatello, J.J.; White, J.C.; Hu, S.-L.; Ferreira, P.J. Surface Interactions between Gold Nanoparticles and Biochar. Sci. Rep. 2017, 7, 5027. [Google Scholar] [CrossRef] [PubMed] [Green Version]
  26. Lehmann, J.; Gaunt, J.; Rondon, M. Bio-char sequestration in terrestrial ecosystems—A review. Mitig. Adapt. Strateg. Glob. Change 2006, 11, 403–427. [Google Scholar] [CrossRef]
  27. Fellet, G.; Marchiol, L.; Bortolotti, V.; Zama, F.; Landi, G.; Chillura Mar-tino, D.F.; Ferro, V.; Conte, P.; Lo Meo, P. Changes in physical-chemical biochar properties following ad-dition to soil. Agriculture 2022, 12, 320. [Google Scholar] [CrossRef]
  28. USEPA. USEPA Method 3051: Microwave assisted acid digestion of sediments, sludges, soils, and oils. In Test Methods for Evaluating Solid Waste, 3rd ed.; USEPA: Washington, DC, USA, 1995. [Google Scholar]
  29. USEPA. USEPA Method 3052: Microwave assisted acid digestion of siliceous and organically based matrices. In Testmethods for Evaluating Solid Waste, 3rd ed.; USEPA: Washington, DC, USA, 1995. [Google Scholar]
  30. Graber, E.R.; Tsechansky, L.; Mayzlish-Gati, E.; Shema, R.; Koltai, H. A humic substances product extracted from biochar reduces Arabidopsis root hair density and length under P-sufficient and P-starvation conditions. Plant Soil 2015, 395, 21–30. [Google Scholar] [CrossRef]
  31. González-Fuenzalida, R.A.; Sanjuan-Navarro, L.; Moliner-Martínez, Y.; Campíns-Falcó, P. Quantitative study of the capture of silver nanoparticles by several kinds of soils. Sci. Total Environ. 2018, 630, 1226–1236. [Google Scholar] [CrossRef]
  32. Servin, A.D.; De la Torre-Roche, R.; Castillo-Michel, H.; Pagano, L.; Hawthorne, J.; Musante, C.; Pignatello, J.; Uchimiya, M.; White, J.C. Exposure of agricultural crops to nanoparticle CeO2 in biochar-amended soil. Plant Physiol. Biochem. 2017, 110, 147–157. [Google Scholar] [CrossRef] [Green Version]
  33. Abbas, Q.; Liu, G.; Yousaf, B.; Ali, M.U.; Ullah, H.; Munir, M.A.M.; Ahmed, R.; Rehman, A. Biochar-assisted transformation of engineered-cerium oxide nanoparticles: Effect on wheat growth, photosynthetic traits and cerium accumulation. Ecotoxicol. Environ. Saf. 2019, 187, 109845. [Google Scholar] [CrossRef]
  34. Abbas, Q.; Yousaf, B.; Ullah, H.; Ali, M.U.; Zia-Ur-Rehman, M.; Rizwan, M.; Rinklebe, J. Biochar-induced immobilization and transformation of silver-nanoparticles affect growth, intracellular-radicles generation and nutrients assimilation by reducing oxidative stress in maize. J. Hazard. Mater. 2019, 390, 121976. [Google Scholar] [CrossRef] [PubMed]
  35. French, E.; Iyer-Pascuzzi, A.S. A role for the gibberellin pathway in biochar-mediated growth promotion. Sci. Rep. 2018, 8, 5389. [Google Scholar] [CrossRef] [PubMed] [Green Version]
  36. Gascó, G.; Cely, P.; Paz-Ferreiro, J.; Plaza, C.; Méndez, A. Relation between biochar properties and effects on seed germination and plant development. Biol. Agric. Hortic. 2016, 32, 237–247. [Google Scholar] [CrossRef]
  37. Zhang, W.; Chen, W. Application effect of biochar on rice (Conference Paper). In Proceedings of the ICAE 2011 Proceedings: International Conference on New Technology of Agricultural Engineering 2011, Zibo, China, 27–29 May 2011; pp. 731–736. [Google Scholar]
  38. Tanure, M.M.C.; da Costa, L.M.; Huiz, H.A.; Fernandes, R.B.A.; Cecon, P.R.; Junior, J.D.P.; da Luz, J.M.R. Soil water retention, physiological characteristics, and growth of maize plants in response to biochar application to soil. Soil Tillage Res. 2019, 192, 164–173. [Google Scholar] [CrossRef]
  39. Wu, X.; Wang, D.; Riaz, M.; Zhang, L.; Jiang, C. Investigating the effect of biochar on the potential of increasing cotton yield, potassium efficiency and soil environment. Ecotoxicol. Environ. Saf. 2019, 182, 109451. [Google Scholar] [CrossRef] [PubMed]
  40. Layet, C.; Auffan, M.; Santaella, C.; Chevassus-Rosset, C.; Montes, M.; Ortet, P.; Barakat, M.; Collin, B.; Legros, S.; Bravin, M.N.; et al. Evidence that Soil Properties and Organic Coating Drive the Phytoavailability of Cerium Oxide Nanoparticles. Environ. Sci. Technol. 2017, 51, 9756–9764. [Google Scholar] [CrossRef]
  41. Sun, W.; Dou, F.; Li, C.; Ma, X.; Ma, L.Q. Impacts of metallic nanoparticles and transformed products on soil health. Crit. Rev. Environ. Sci. Technol. 2020, 51, 973–1002. [Google Scholar] [CrossRef]
  42. Qiu, Y.; Mu, Z.; Wang, N.; Wang, X.; Xu, M.; Li, H. The aggregation and sedimentation of two different sized copper oxide nanoparticles in soil solutions: Dependence on pH and dissolved organic matter. Sci. Total Environ. 2020, 731, 139215. [Google Scholar] [CrossRef]
  43. Liu, Z.; Wang, C.; Hou, J.; Wang, P.; Miao, L.; Lv, B.; Yang, Y.; You, G.; Xu, Y.; Zhang, M.; et al. Aggregation, sedimentation, and dissolution of CuO and ZnO nanoparticles in five waters. Environ. Sci. Pollut. Res. 2018, 25, 31240–31249. [Google Scholar] [CrossRef]
  44. Majumdar, S.; Peralta-Videa, J.R.; Trujillo-Reyes, J.; Sun, Y.; Barrios, A.C.; Niu, G.; Flores-Margez, J.P.; Gardea-Torresdey, J.L. Soil organic matter influences cerium translocation and physiological processes in kidney bean plants exposed to cerium oxide nanoparticles. Sci. Total Environ. 2016, 569–570, 201–211. [Google Scholar] [CrossRef] [Green Version]
  45. Gao, S.; DeLuca, T.H.; Cleveland, C.C. Biochar additions alter phosphorus and nitrogen availability in agricultural ecosystems: A meta-analysis. Sci. Total Environ. 2018, 654, 463–472. [Google Scholar] [CrossRef] [PubMed]
  46. Liao, J.; Liu, X.; Hu, A.; Song, H.; Chen, X.; Zhang, Z. Effects of biochar-based controlled release nitrogen fertilizer on nitro-gen-use efficiency of oilseed rape (Brassica napus L.). Sci. Rep. 2020, 10, 11063. [Google Scholar] [CrossRef] [PubMed]
  47. Nguyen, T.T.N.; Xu, C.-Y.; Tahmasbian, I.; Che, R.; Xu, Z.; Zhou, X.; Wallace, H.M.; Bai, S.H. Effects of biochar on soil available inorganic nitrogen: A review and meta-analysis. Geoderma 2017, 288, 79–96. [Google Scholar] [CrossRef] [Green Version]
Figure 1. Total number of Lepidium sativum L. plants, and the number of plants at the flowering stage at harvest and total aboveground biomass (dry weight in g) at harvest. Different letters indicate that the means are statistically different (ANOVA, Tukey’s test, p < 0.005).
Applsci 13 06846 g001
Figure 2. Cumulative Ce leached from the 12 lysimeters after the 6 irrigations for the 3 treatments (CTRL, DRY and WET). Different letters indicate that the means are statistically different (ANCOVA, Tukey’s test, p < 0.005). Curves are polynomial regression fitted to the data points (second grade).
Applsci 13 06846 g002
Figure 3. Total organic carbon (TOC) (a) and total nitrogen (TN) (b) in ppm (mg L−1) of the leachates collected after the 6 irrigations of the 12 columns (n = 4).
Applsci 13 06846 g003aApplsci 13 06846 g003b
Table 1. PH, electric conductivity (EC) and salinity of the two biochars (dry quenching and wet quenching) and the three soils used in the lysimeters (CTRL, DRY Q and WET Q).
SubstratespHEC
µS cm−1
Salinity
mg L−1
biochar (dry quenching) a9.69 ± 0.05ndnd
biochar (wet quenching) a9.87 ± 0.05ndnd
soil (CTRL) b7.78 ± 0.01160 ± 1276 ± 6
soil + biochar (dry quenching) (DRY Q) b7.99 ± 0.06119 ± 456 ± 2
soil + biochar (wet quenching) (WET Q) b7.88 ± 0.03100 ± 247 ± 1
a soil:water ratio: 1:20; b soil:water ratio: 1:4 (mean ± SD; n = 3). nd = not detected.
Table 2. p-values from the ANOVA performed on the variable TOC, considering (a) the factor leachates that is indicated by the days after sowing (DAS) and (b) the factor substrates.
(a)
DAS51219263340
5nsnsns0.0280.0010.004
12 nsnsns0.0030.011
19 nsnsnsns
26 nsnsns
33 nsns
40 ns
(b)
SubstrateCRTLDRYWET
CTRLns0.0000.000
DRY nsns
WET ns
ns = not significant (p-value > 0.05).
Disclaimer/Publisher’s Note: The statements, opinions and data contained in all publications are solely those of the individual author(s) and contributor(s) and not of MDPI and/or the editor(s). MDPI and/or the editor(s) disclaim responsibility for any injury to people or property resulting from any ideas, methods, instructions or products referred to in the content.

