Article

3D Reconstruction of Celadon from a 2D Image: Application to Path Tracing and VR

Department of Computer Engineering, Dong-A University, Busan 49315, Republic of Korea
*
Author to whom correspondence should be addressed.
Appl. Sci. 2023, 13(11), 6848; https://doi.org/10.3390/app13116848
Submission received: 13 May 2023 / Revised: 31 May 2023 / Accepted: 1 June 2023 / Published: 5 June 2023

Abstract

:
We present a straightforward approach for reconstructing 3D celadon models from a single 2D image. The celadon is a historical example of the surface of revolution. Our approach uses a surface of revolution technique to generate the basic shape of the celadon and then applies texture mapping to create a realistic appearance. The process involves detecting the contour and corners of the celadon image, determining an axis of revolution, generating a profile curve, and finally constructing a 3D celadon model. Additionally, we create models as triangular meshes at multiple resolutions, employing a B-spline curve as the profile curve. It enhances the adaptability of the models for various purposes. We render various scenes using a path tracer to assess the suitability of the generated 3D celadon models and generate a VR celadon museum with the models. Overall, our approach offers a simple and efficient solution for reconstructing a 3D celadon model, generating VR content, and demonstrating extensive applicability across numerous disciplines.

1. Introduction

Computer graphics technology allows for the effective visualization of digital data and can be used to create digital twins of physical objects for preservation, learning, and research purposes. In particular, 3D digitalized cultural artifacts can provide valuable insights into various fields, such as history, culture, and art. The representative cultural artifact is a celadon [1,2,3], which is a form of ceramic pottery that originated in medieval East Asia. The celadon helps to understand past cultures, lifestyles, and art styles from when the celadon was originally made. Nevertheless, the celadon is a fragile artifact affected by environmental factors, such as humidity, temperature, and light. These factors can also cause patterns on the celadon to be lost over time, resulting in the decline of its cultural value.
Because of these characteristics of the celadon, researchers have actively focused on 3D reconstruction techniques for its preservation [4,5,6,7,8]. Nowadays, a virtual reality (VR) museum offers immersive experiences that allow users to explore and interact with 3D digitalized artifacts, including celadon pottery [9,10,11]. Through the VR environment, users can virtually examine celadons from various angles, gaining a deeper understanding of their intricate details and cultural significance [12]. Although sharing and accessing 3D digital models of celadons online is convenient, many people still need help digitizing these valuable cultural artifacts into 3D [11]. To address this challenge, we propose a general guideline that simplifies generating a 3D model and texture from a single 2D input celadon image, making it easier and more accessible. Figure 1 shows the eight 3D models generated by our method from the 2D images, placed on pedestals and encased in glasses as if they were on display in a museum.
From a geometric perspective, the celadon is shaped like a surface of revolution. This unique characteristic simplifies the creation of 3D data compared to other complex 3D objects. Surfaces of revolution can be defined using only two parameters: a profile curve C and an axis of revolution A. Accurately representing the profile curve is the key to successful 3D reconstructions. We first extract a profile polyline using image processing techniques that consider the celadon in the input image as a surface of revolution. The profile polyline can be converted to the B-spline profile curve C by curve fitting [13,14].
B-spline curves are locally defined splines representing various geometry types by adjusting degrees, knots, and control points [15,16]. This property represents the profile curve at different resolutions with fewer data, maintaining the shape of the celadon. Fitting the profile polyline to the B-spline profile curve offers several advantages over other algorithms [17,18,19,20,21] in that the B-spline can offer superior curve representation and accuracy compared to these algorithms. Based on the process, we generate 3D celadon models by rotating the curve around the axis.
The final step is to generate textures that include the colors and patterns of the celadon and apply these to the 3D models. To do so, we first separate a celadon region from a background in the input image. Then, we automatically generate rectangular-shaped texture images using linear interpolation. Applying the generated textures to the celadons will help to analyze and understand them.
There are several ways to represent 3D data, such as triangular mesh, point clouds, voxels, and implicit surfaces. We construct 3D celadon models in the triangular mesh, put the generated textures on them, and render in various scenes using a path tracer [22]. When rendering a scene using a path tracer, selecting a value of samples per pixel (SPP) σ is crucial because it is a trade-off between image quality and rendering speed.
The main contributions of this work can be summarized as follows:
  • We propose a general guideline for obtaining a 3D celadon model from one single 2D image without requiring any additional inputs.
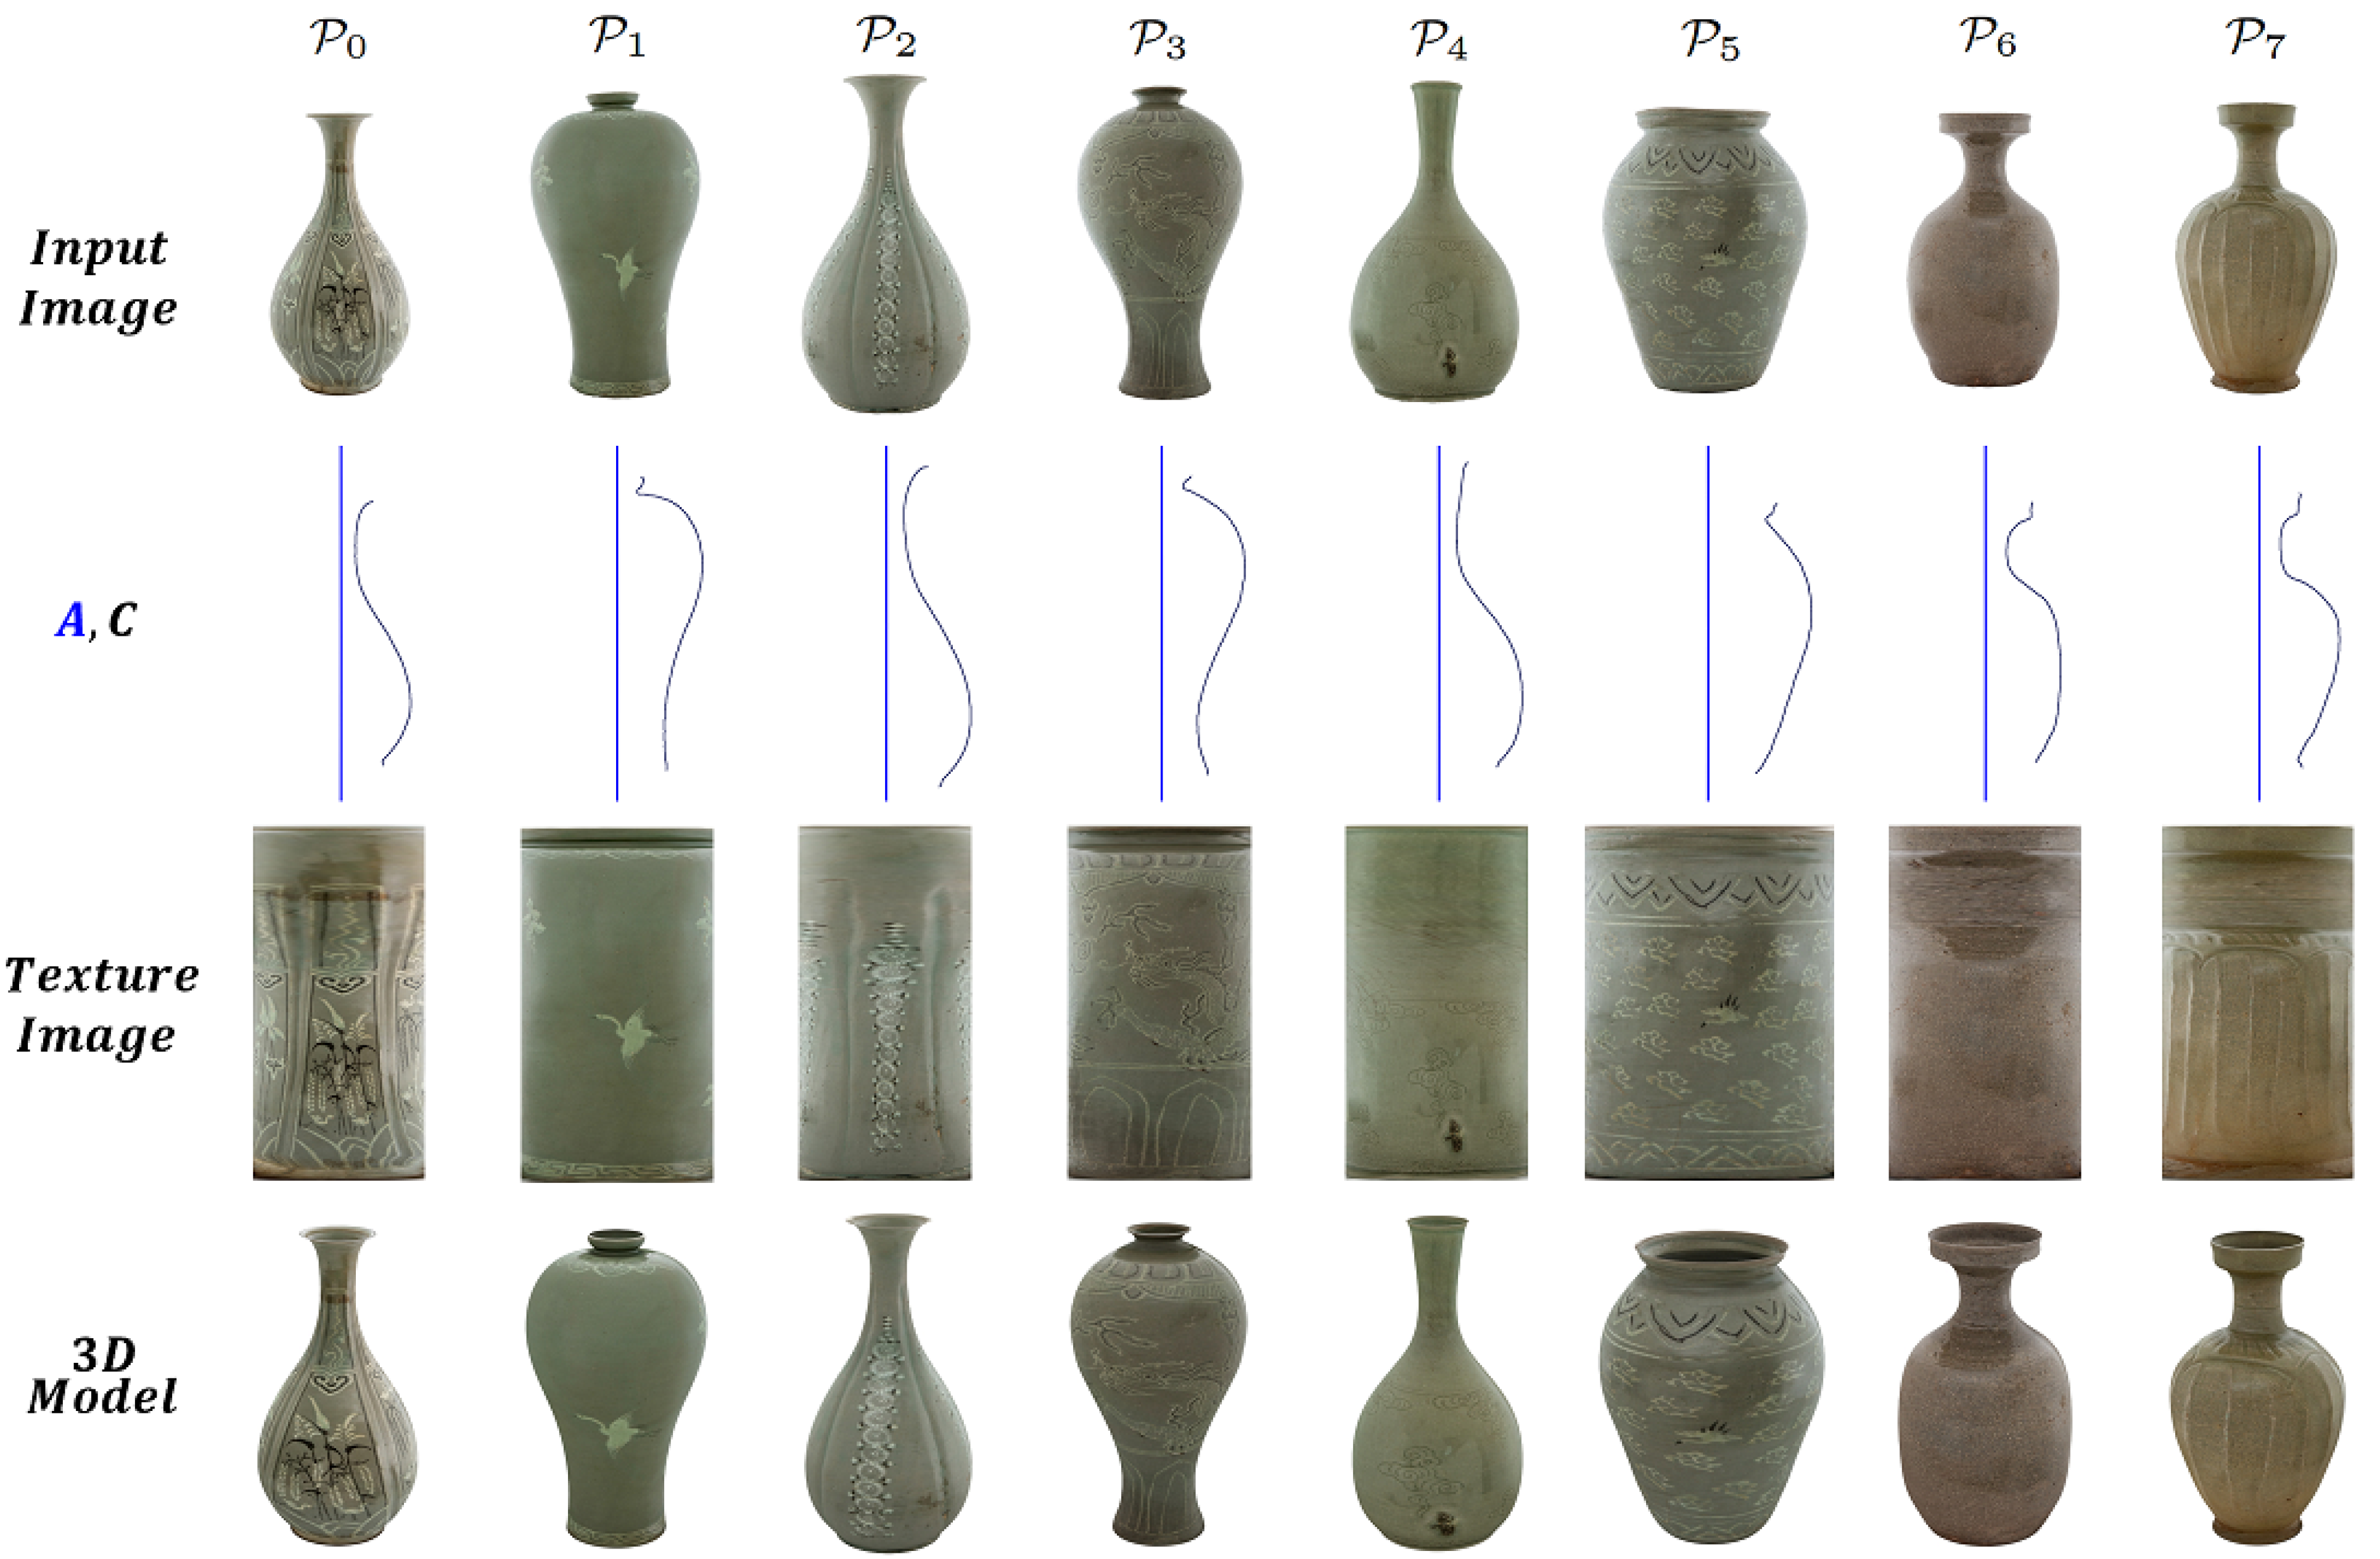
  • Our method considers the celadon in the input images as a surface of revolution and extracts a profile polyline and an axis of revolution from it.
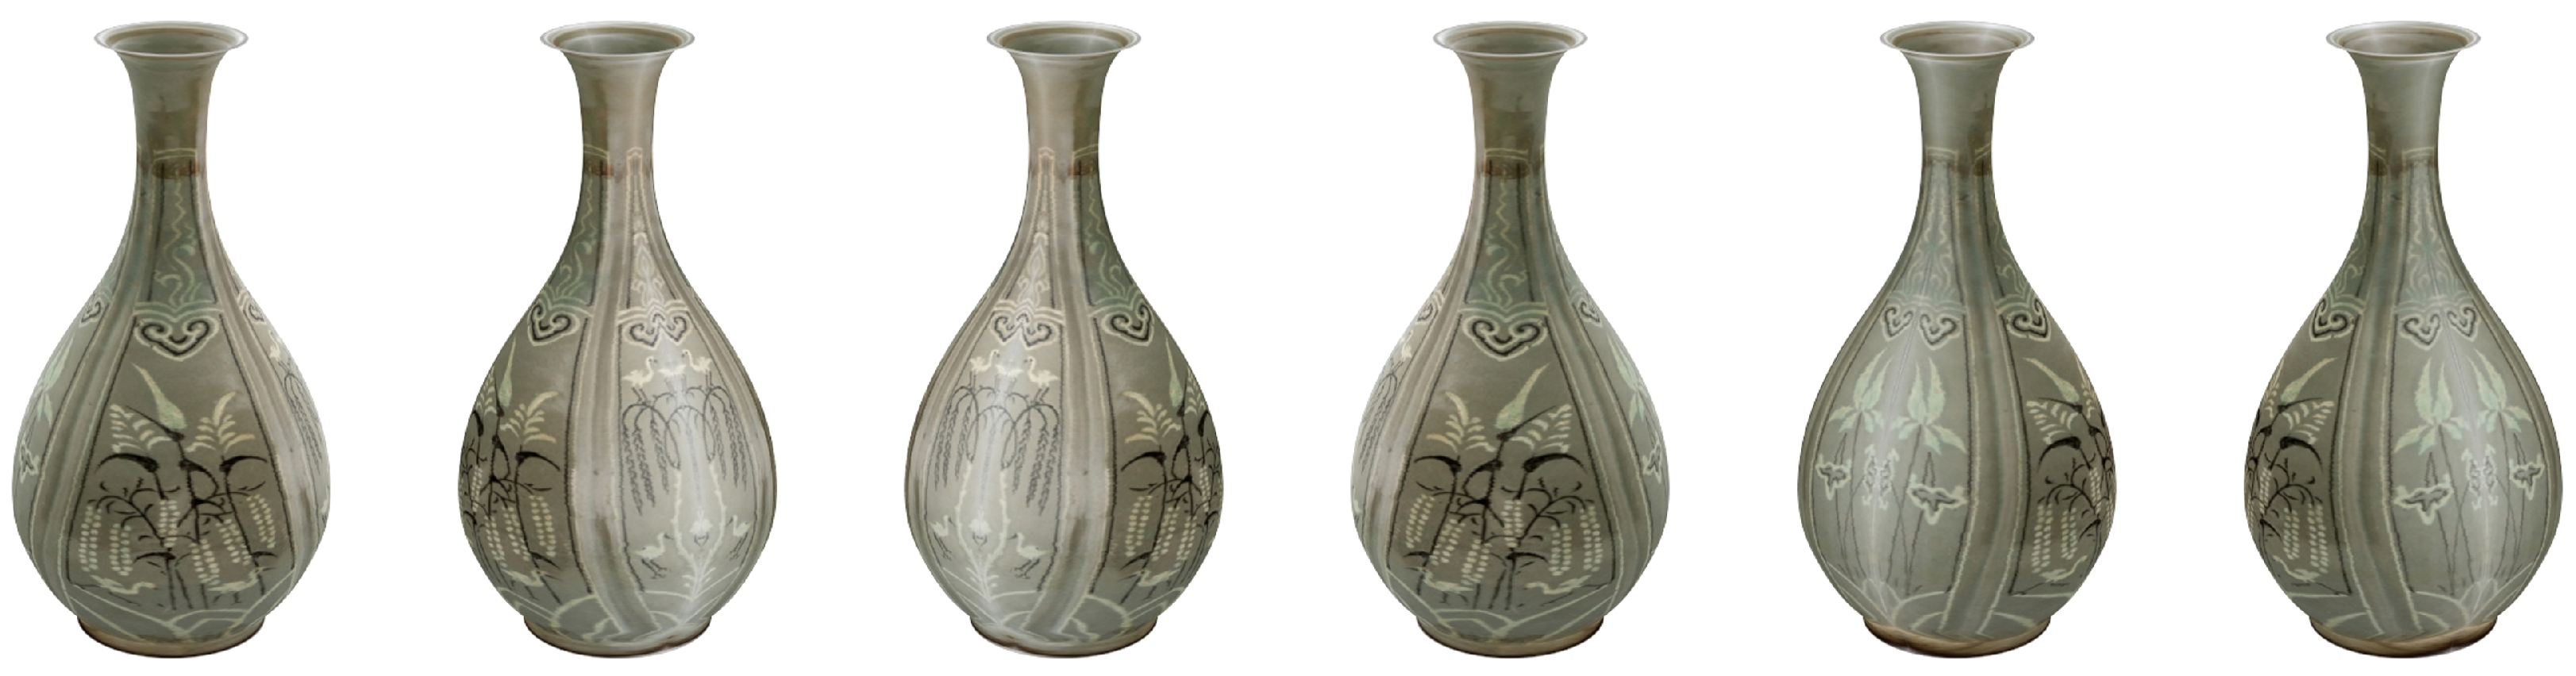
  • Using the fitted B-spline profile curve, we can generate 3D models at various resolutions we want.
  • We automatically generate a texture image of the celadon by separating a region of the celadon from a background in the input image and applying linear interpolation.
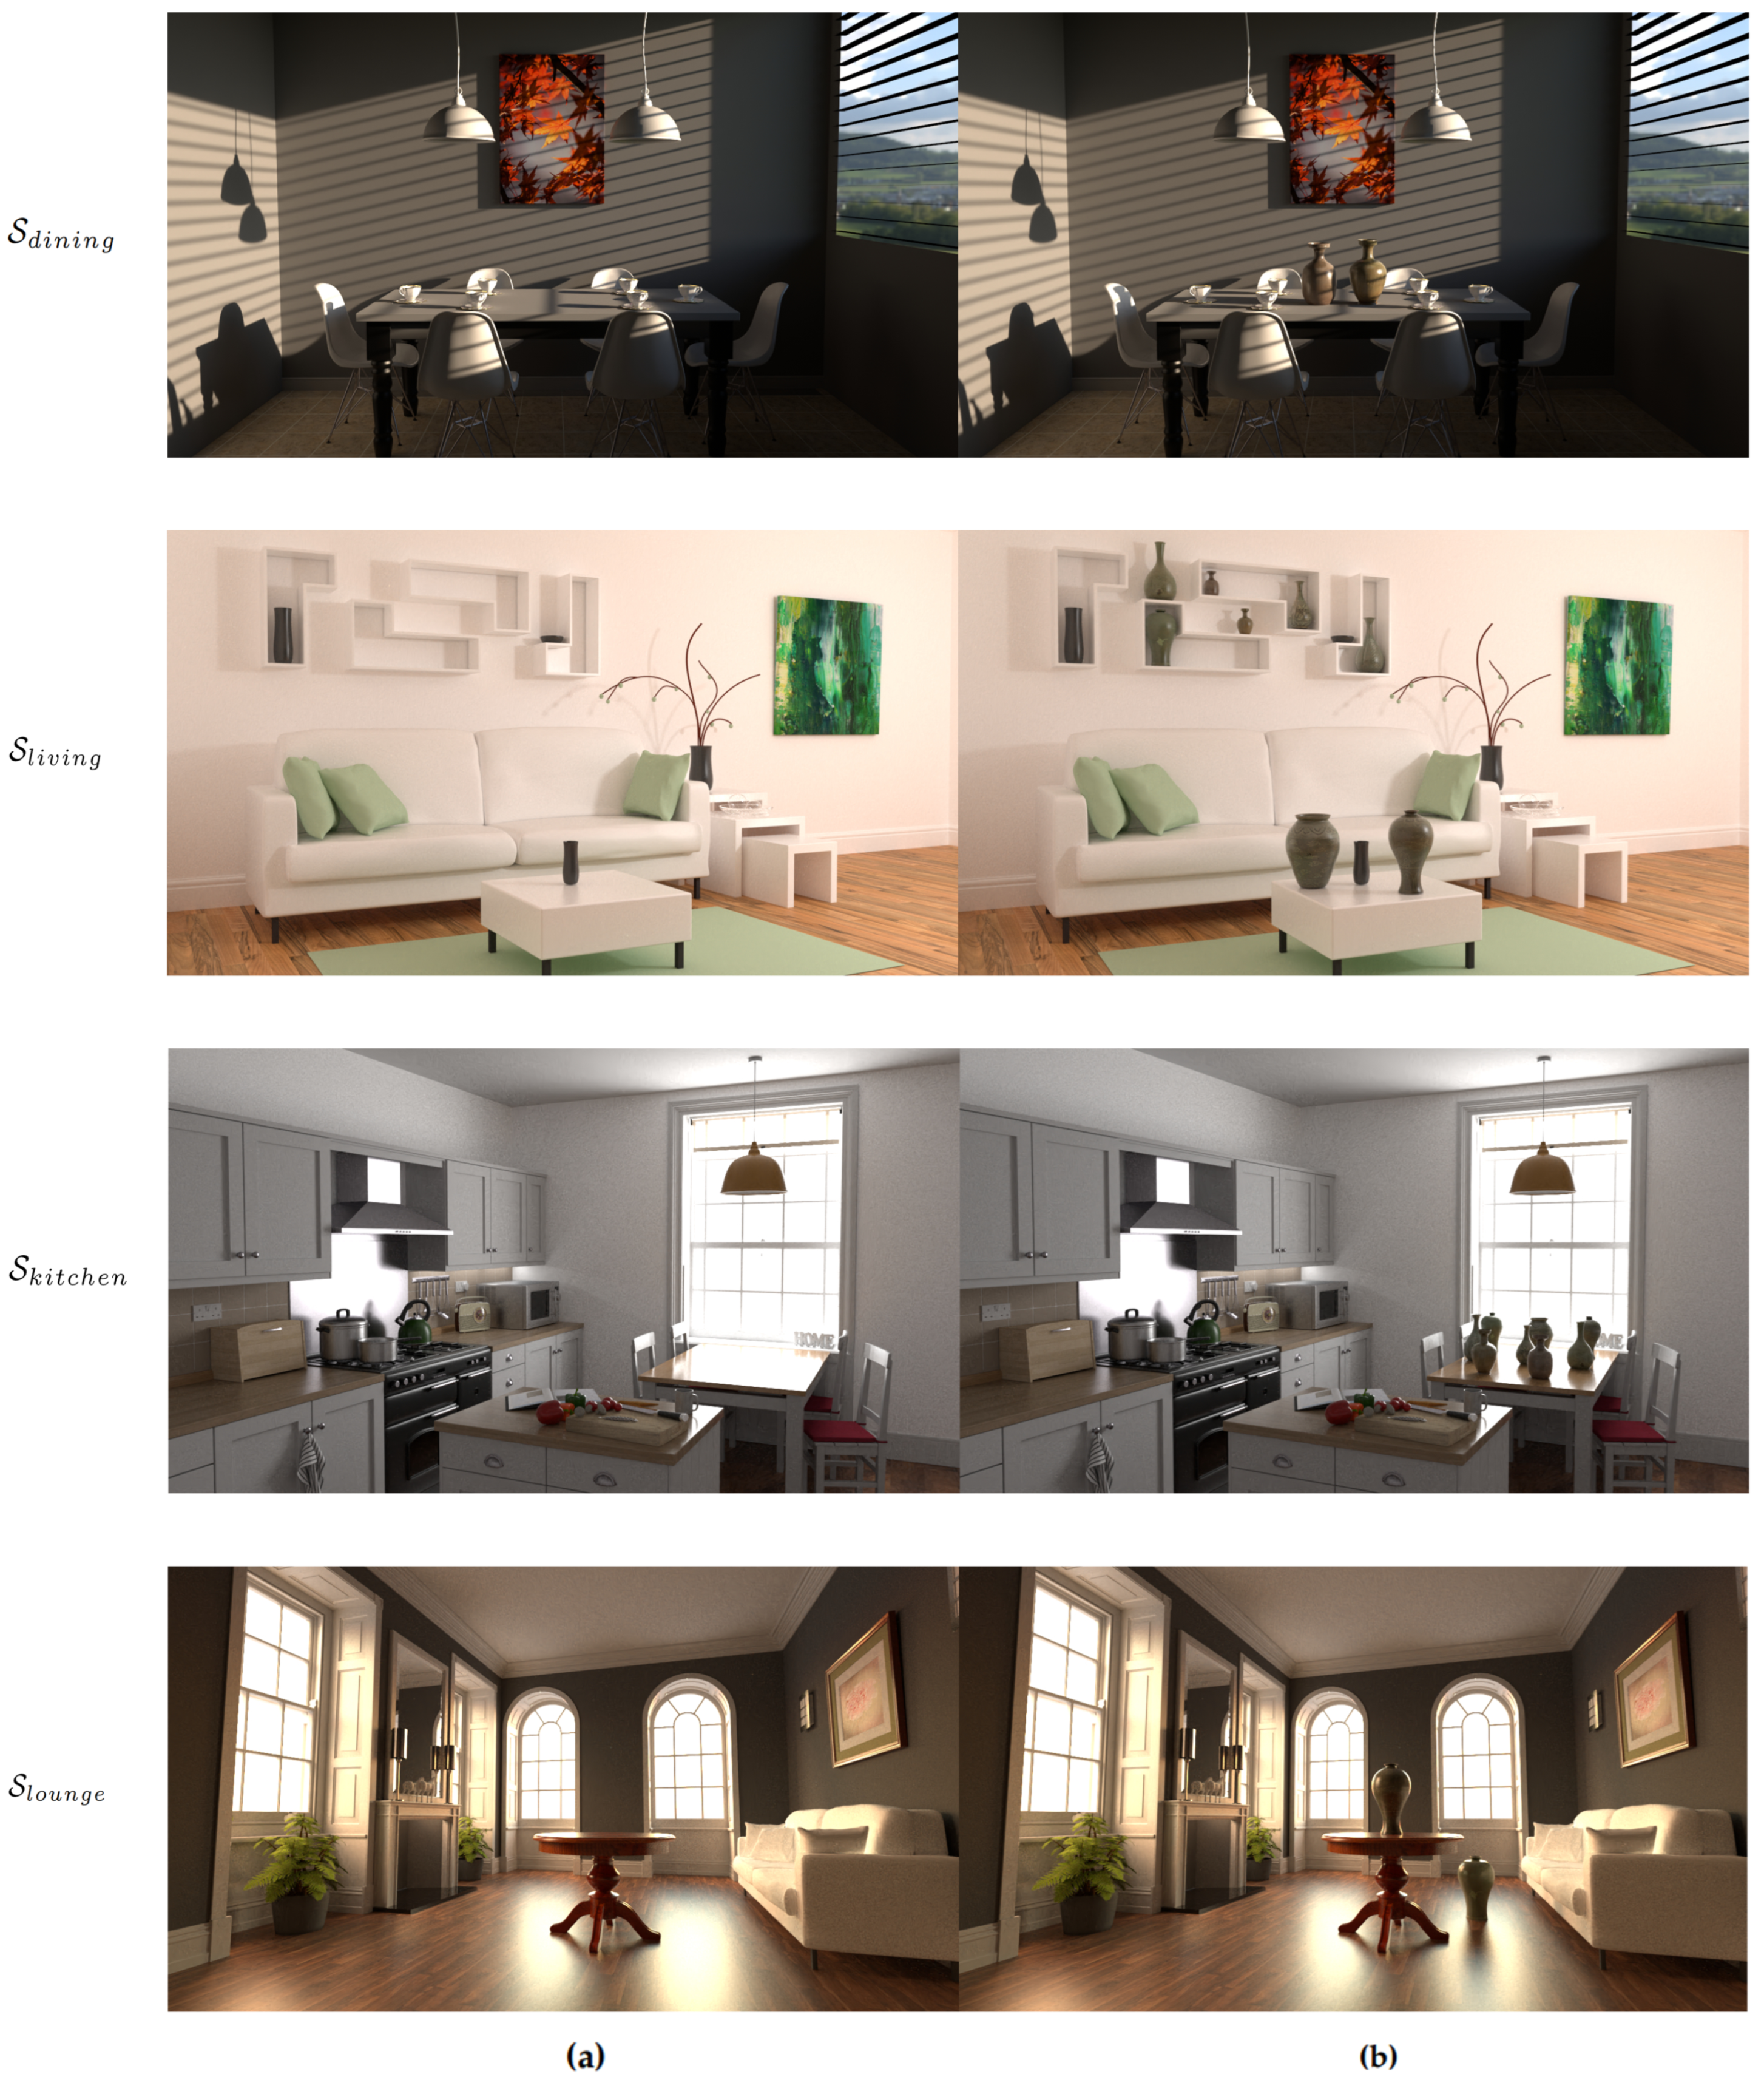
  • We produce various scenes with our 3D celadon models using a path tracer [22] and assess their suitability.
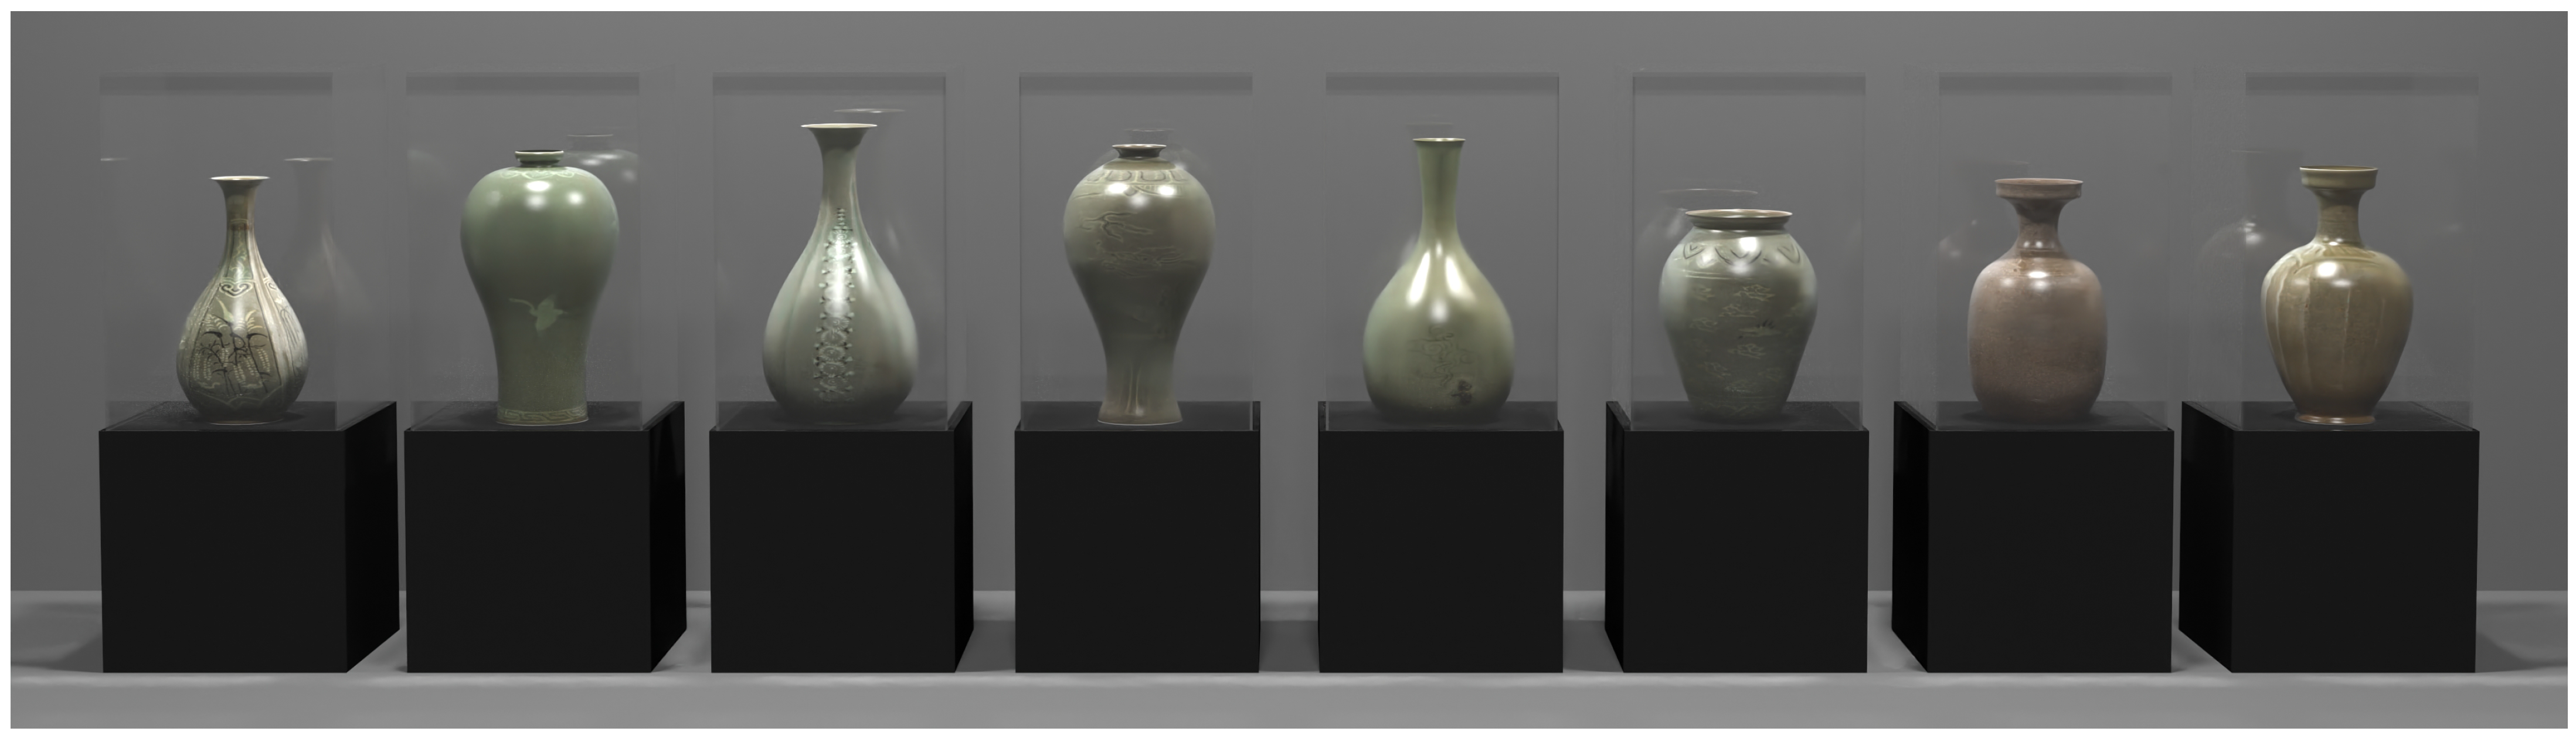
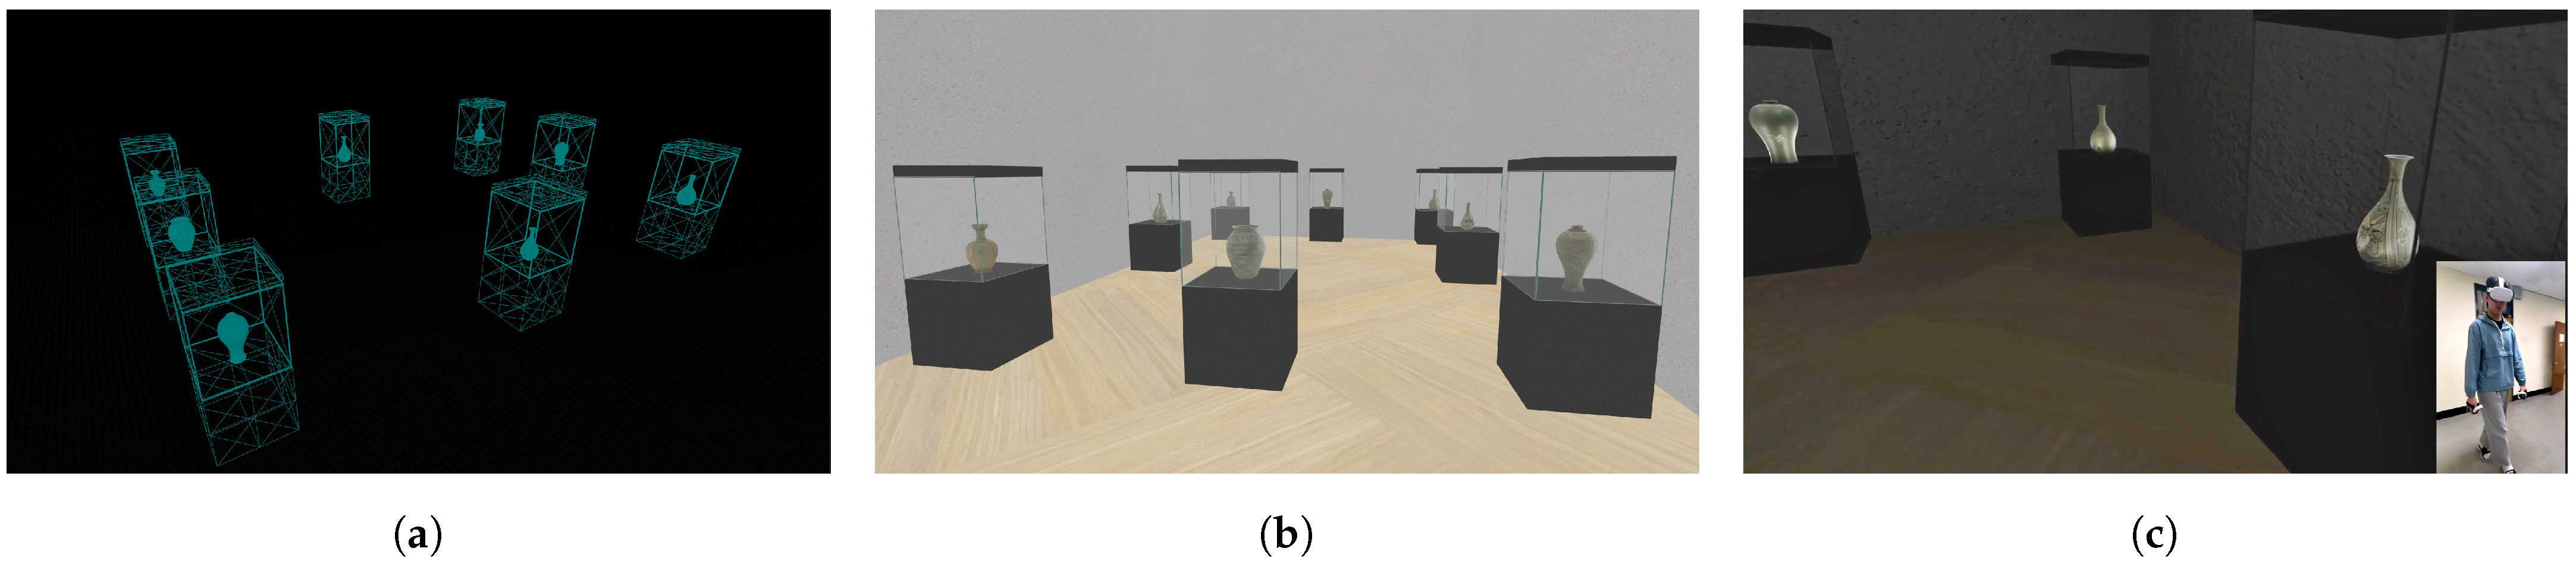
  • We also generated a VR celadon museum with the models using Unreal Engine 5, which shows that valuable cultural artifacts can be easily used as VR content and viewed by anyone interested.

2. Related Works

2.1. 2D Image Processing

Suzuki–Abe’s algorithm [23] has been widely used for contour detection due to its superior performance compared to an earlier method [24]. They introduced new procedures for border labeling and identifying the parent border of the currently traced border, improving the algorithm’s overall accuracy and speed. Moreover, they proposed a method for extracting only an object’s the outermost border, which enhances the algorithm’s usefulness in various applications, such as object detection, image segmentation, feature extraction, and so on.
Corners are distinct features that can be distinguished from other parts of an image. They are robust to deformations and provide valuable information about the shape and structure of objects. Moravec’s method [25] is a classic corner detection algorithm that calculates the intensity variation in small windows shifted in four diagonal directions around a pixel. While the method is suitable for real-time applications due to its simplicity, it is sensitive to noise and may generate false positives when detecting corners in noisy regions.
Harris’s method [26] improved the method [25] by looking for regions with significant changes in intensity in multiple directions. The algorithm utilizes the second-moment matrix to compute the corner response, improving noise robustness and offering more reliable corner detection. Shi–Tomasi’s method [27] was introduced as an extension of Harris’s method [26] that changes the scoring function used to detect corners. It is considered more robust and performs better.
Reducing points in a curve while preserving its shape is crucial in image processing. Various algorithms for polyline simplification have been proposed in the literature [17,18,19,20,21]. For example, the algorithms of Douglas–Pecuker [17] and Visvalingam–Whyatt [21] are threshold-based. Additionally, alternative methods based on B-spline curves have been proposed [13,28,29]. Dierckx [13] proposed a B-spline curve construction method by finding the coefficient of the basis functions that minimize the least-squares error between a given polyline data and the B-spline curve. Hall [28] used a B-spline curve to generate a profile curve for a surface of revolution and generated a 3D model by rotating the B-spline curve around the axis of revolution. Badiu et al. [29] proposed an efficient and accurate technique that generates a B-spline profile curve through photogrammetry and automatically creates the shapes of pottery using CAD.

2.2. 3D Rendering of Surfaces of Revolution (SORs)

Wong et al. [30] proposed a method for reconstructing SORs from a single uncalibrated perspective view by utilizing the characteristics of SORs. Colombo et al. [31] presented a projective geometry technique that utilizes the symmetry properties of SORs for camera self-calibration, 3D reconstruction, and texture extraction from a single uncalibrated image, including SORs.
SORs are common in everyday objects such as bottles, glasses, cans, jars, and pottery. Among these objects, pottery has significant archaeological and cultural value, and the 3D reconstruction of pottery and pottery fragments has been an active research topic. Kampel and Sablatnig [6] proposed an automatic 3D reconstruction method for pottery fragments using point cloud data obtained from 3D scanning. Karasik and Smilansky [7,8] emphasized the usefulness of 3D scanning technology in archeology and proposed a pottery processing automation pipeline for pottery documentation and analysis.
Their approach also involves scanning pottery fragments and restoring the whole pottery into a 3D model using point cloud data. Banterle et al. [4] proposed an automated pipeline for digitizing catalog drawings of pottery types. They segmented the drawings into regions of interest and extracted features from each region. The extracted features are then used to match the drawing with a set of 3D models of pottery types. Dashti et al. [5] presented a virtual pottery system for ceramic artists. The system combines virtual reality and haptic technology to provide a realistic simulation of the pottery-making process. In ray tracing, Kajiya [32] introduced a simplified ray tracing algorithm for SORs that changes the 3D ray–surface intersection problem into a 2D curve–curve intersection problem, which is solved by a strip tree. Baciu et al. [33] suggested hybrid bounding volumes that further developed the strip tree [32] with monotonic interval partitioning.

3. 3D Reconstruction from a 2D Celadon Image

This section comprehensively explains our method for reconstructing a celadon, a representative example of SORs. First, a profile polyline of the celadon can be extracted from a 2D input image. This polyline can be further refined by fitting it to a B-spline curve, allowing for resolution adjustments as necessary. A 3D celadon model can be generated by rotating the curve around the axis of revolution. The following subsections provide detailed explanations of each step in this process.

3.1. Extract a Profile Curve

Extracting a profile polyline from a 2D celadon image is a crucial stage in the process of 3D reconstruction. The contour of the celadon outlines its shape, while its corners help identify distinct features. Furthermore, the axis of revolution is essential in ensuring proper alignment while generating a 3D celadon model. A profile polyline is extracted using the features then fitted to a B-spline curve around the axis to generate the model. Figure 2 illustrates the flow of the proposed method.
Contour detection. Before extracting the contour of the celadon in the input image, we first distinguish it from the background. The binary thresholding method leads us to move a region of interest (ROI) from the whole image to the celadon, so we convert it to a grayscale image and apply the method. After that, we apply Suzuki–Abe’s method [23] to the thresholded image to extract an outermost contour from the image and apply Douglas–Peucker’s  [17] method to approximate the original contour, which enables us to detect referential corners while preserving its shape considerably. The detected contour of the celadon is shown in black in Figure 2b.
Corner detection. A non-flawed celadon always has a rim and a base, with four corners in total, two on the rim and the other two on the base. It is essential to accurately identify the corners of the celadon as they help determine the endpoints of the profile polylines in the contour polyline. However, detecting these corners directly from the original data is challenging. We smooth the contour polyline using a 7 × 7 Gaussian filter and apply the Shi–Tomasi’s [27] method to find its top and bottom corners. These are referential corners used to determine the original contour’s corners accurately. The detected corners of the celadon are shown in pink in Figure 2b.
Axis of revolution. The next step is to determine the axis of revolution A of the celadon using the four corners. The Principal Component Analysis (PCA) creates two eigenvectors that best describe the original contour. We employ this feature to determine the A . Specifically, we select one eigenvector closest to the vertical axis, as it is crucial to align the A with the vertical axis. To achieve this, we divide the corners into relatively left and right corners and select any set of them. We can find a direction vector of the A using the selected corners and the two eigenvectors. It is important to note that the axis of revolution should pass through the average point of the original contour. If the A slightly deviates from the vertical axis, we adjust the A and the contour to align with the vertical axis, reducing errors. Figure 2c shows the eigenvectors produced by the PCA in the green and red arrows and the A in the blue line.
Profile polylines. The contour, corners, and A derived in the previous steps extract the profile polylines. The corners serve as endpoints of them. Selecting one profile polyline between them for generating a 3D celadon model is necessary for the following B-spline curve fitting. Figure 2d shows only the A and the celadon’s right profile curve. Algorithm 1 summarises extracting a profile polyline from an input celadon image.
Algorithm 1: Extract a profile polyline.
   Input   : I - an input celadon image
   Output P p - a profile polyline of the celadon
                              # Contour detection
    G I convertToBinaryThreshold ( I , t h r e s h o l d )
    P c findContour( G I )
                                # Corner detection
    G a approximateContour( P c )
    G b gaussianFilter( G a , ( 7 , 7 ) )
    F findCorners( G b , P c )
                       # Derive an axis of revolution
    e 1 , e 2 , m PCA( P c )
    d getAxisDirection( e 1 , e 2 , C)
    A makeAxisOfRevolution( d , m )
                           # Select a profile polyline
    P p getProfilePolyline( P c , C , A )

3.2. Texture Generation

There are limited patterns and colors present in the input image of the celadon, but it is possible to extract them to create a 2D texture image T ( u , v ) , 0 u , v 1 to be mapped onto the 3D celadon model. In Section 3.1, we isolated the ROI from the whole image to focus on the celadon. With the ROI, we can generate a rectangular texture image with the same dimensions as the ROI using the scanline method. Non-white color pixels in the ROI are mapped to the texture image while scanning from the celadon’s top to bottom. Note that each scanline has a different number of pixels with non-white color pixels. Therefore, we perform linear interpolation on any scanline with a smaller number of pixels than the width of the ROI while mapping.
Figure 3 describes the simplified process of generating a texture image for a simple image, where pixels are shown as circles. Figure 3a shows the input image, while Figure 3b,c highlight a specific scanline with a red border to show the linear interpolation of it. Figure 3d shows the interpolated resulting texture image. Algorithm 2 summarises generating a texture image from an input celadon image.
Algorithm 2: Generate a texture.
Input   : I - a input celadon image
Output T ( u , v ) - a texture image of the celadon
R O I extractROI(I)
T ( u , v ) makeBlankImage (ROI.dimension)
s c a n l i n e s makeScanlinesOf (ROI)
foreach scanline in scanlines do
  scanline.map( R O I , T ( u , v ) )
  if scanline.width < ROI.width then
    scanline.interpolate( R O I , T ( u , v ) )
  end if
end foreach

3.3. Curve Fitting with a B-Spline Curve

The profile polyline obtained from image processing is a discrete polyline on a 2D image. However, such a polyline has resolution limitations in representing a profile curve. To address this issue, it is necessary to transform the profile polyline into a mathematically defined curve, such as a spline. Therefore, we fit the polyline with a third-order B-spline curve by obtaining control points and knot vectors using Dierckx’s method [13]. Subsequently, we split the resulting B-spline curve non-uniformly based on the curvature variation to generate a final profile curve C. The profile curve C is then used to generate a corresponding 3D celadon model.

3.4. Construct a Triangular Mesh

The triangular mesh comprises a set of vertices representing the points in R 3 and triangles formed by connecting these vertices with edges. We uniformly sample 360° at a fixed interval and rotate the profile curve C around the axis A to generate vertices of the celadon model. Then, we connect the vertices with horizontally adjacent vertices in triangles to create edges and faces.
In addition to generating the 3D model, we should create texture coordinates while connecting the adjacent vertices. The texture coordinates are computed by mapping the angles to the u and the vertical range of the profile curve C to the v. When it comes to mapping for u, we use a linear mapping method, which maps [0°, 180°] to [ 1 ,   0 ] u and [180°, 360°] to [ 0 ,   1 ] u . Finally, we can apply the generated texture image to the 3D celadon model, as shown in Figure 4.

4. Experimental Results

Our approach was implemented on a Windows PC with an Intel Core i7-11700 2.5 GHz processor, 32 GB of RAM, and an NVIDIA GeForce RTX 3070 graphics card, using Python 3.11.1. We experimented with eight celadon examples [34] by processing their 2D input images to generate corresponding 3D models. In order to simplify data acquisition, we limited ourselves to using one image per celadon. For rendering the 3D celadon models in various scenes and evaluating their suitability in different environments [35], we employed the Mitsuba 3 renderer [22]. Furthermore, we used Unreal Engine 5 [36] to construct a VR celadon museum exhibiting the models. Figure 5 shows the results of the 3D reconstruction for the celadons, from P 0 to P 7 . The first row of Figure 5 shows input 2D celadon images. The second row shows each image’s axis of revolution A and profile curve C, shown in blue and black, and the third row shows their texture images. The last row shows the generated 3D celadon models for each input image based on their A , C, and texture images.
Table 1 presents numerical information, such as the computing time for each step of the 3D reconstruction process. Image processing took a similar time for all examples. However, the non-uniformly splitting B-spline curve can impact the resulting 3D model’s generation time. As the number of divided domains increases, the number of points and faces in the corresponding 3D model also increases, resulting in slower 3D model generation. The number of divided domains depends on the curvature variations of each profile curve of the celadon, so it has a unique value according to the celadon examples. Meanwhile, we computed the approximation error of the B-spline profile curve C by measuring the one-sided Hausdorff distance to the profile polyline curve with Filip’s approximation technique [14]. As shown in Table 1, the B-spline profile curve C approximations are considered to be accurate since their approximation errors are at most 2.33 pixels.
Through several rendering tests, we decided to set the SPP value σ to 64 for low quality and 1024 for high quality and selected HD ( 1280 × 720 ), FHD ( 1920 × 1080 ), and 4K ( 3840 × 2160 ) as the image resolutions to experiment. The scenes were rendered using these two σ values and three image resolutions. Since our GPU hardware does not support σ to 1024 in 4K, we selected 512 for high quality in 4K. The rendering times for each scene at different resolutions and σ values are displayed in Table 2, with each scene represented by a subscript. The results show that the rendering time for each scene is proportional to the image resolution and σ . In particular, the scene S s h o w c a s e , as shown in Figure 1 with a celadon encased in glasses, is rendered slowly as brighter scenes S l i v i n g , S k i t c h e n , and S l o u n g e because path tracing the glass material requires high computational costs. Figure 6a shows the scenes without our 3D reconstructed celadon models, and Figure 6b includes them, with σ = 1024 and HD resolution. Please note that all scenes were rendered with a GPU and then denoised using an Optix AI-accelerated Denoiser [37].
Finally, we generated a VR celadon museum with the celadon models. Figure 7a,b show the layouts of the VR museum in wireframe and an unlit view mode, which are features supported by Unreal Engine 5, and Figure 7c shows a screenshot of the VR museum experience while wearing a VR headset (please refer to the supplementary video for additional details). To enhance the visual aesthetics of the celadon models in the VR environment, we surrounded the models with glass showcases and placed eight directional light sources inside, simulating a real museum environment. Despite being generated from a single 2D image, the models sufficiently represent the geometries and textures of their original celadon, showing that they are suitable for VR content.

5. Conclusions

This paper presents a general guideline for generating a 3D celadon model from a single 2D image and further illustrates how to apply the model to various scenes rendered with a path tracer, along with a VR celadon museum. Our approach involves feature extraction from the 2D image and the detection of the profile curve. This curve is approximated by a B-spline curve, which offers a higher curve representation and flexibility compared to other approximation algorithms. This leads to the ability to generate 3D celadon models at any desired resolution. The texture coordinates of the 3D model are also automatically calculated, eliminating the need for any further inputs.
The resulting 3D models can be easily used as VR content, for example, in cultural heritage applications. People can examine the celadon models in the VR celadon museum, facilitating a deeper understanding of the celadon’s intricate details and cultural significance. However, the original celadon images were captured via perspective projection with a possibility that celadons can contain specular lightings in the images, causing distortions in the profiles and textures, reducing the reconstruction accuracy. In future work, we plan to calibrate the original images captured via perspective projection and develop an automated method for generating a VR celadon museum.

Supplementary Materials

The following supporting information can be downloaded at: https://doi.org/10.5281/zenodo.7932434 (accessed on 13 May 2023).

Author Contributions

All authors contributed to this work by collaboration. S.K. and Y.P. implemented the proposed method, performed the experiments, and wrote the paper. All authors have read and agreed to the published version of the manuscript.

Funding

This work was supported by the Dong-A University research fund.

Institutional Review Board Statement

Not applicable.

Informed Consent Statement

Not applicable.

Data Availability Statement

The data presented in this study are openly available in Goryeo Celadon Museum, reference number [34].

Acknowledgments

The authors thank Minseok Kim for the technical support of Unreal Engine 5.

Conflicts of Interest

The authors declare no conflict of interest.

References

  1. Carolyn, K. Koh Choo. A scientific study of traditional Korean celadons and their modern developments. Archaeometry 1995, 37, 53–81. [Google Scholar]
  2. Namwon, J. Introduction and Development of Koryŏ Celadon. In A Companion to Korean Art; Wiley: Hoboken, NJ, USA, 2020; pp. 133–158. [Google Scholar]
  3. Yan, L.; Liu, M.; Sun, H.; Li, L.; Feng, X. A comparative study of typical early celadon shards from Eastern Zhou and Eastern Han dynasty (China). J. Archaeol. Sci. Rep. 2020, 33, 102530. [Google Scholar] [CrossRef]
  4. Banterle, F.; Itkin, B.; Dellepiane, M.; Wolf, L.; Callieri, M.; Dershowitz, N.; Scopigno, R. Vasesketch: Automatic 3d representation of pottery from paper catalog drawings. In Proceedings of the 2017 14th IAPR International Conference on Document Analysis and Recognition (ICDAR), Kyoto, Japan, 9–15 November 2017; Volume 1, pp. 683–690. [Google Scholar]
  5. Dashti, S.; Prakash, E.; Navarro-Newball, A.A.; Hussain, F.; Carroll, F. PotteryVR: Virtual reality pottery. Vis. Comput. 2022, 38, 4035–4055. [Google Scholar] [CrossRef] [PubMed]
  6. Kampel, M.; Sablatnig, R. Profile-based pottery reconstruction. In Proceedings of the 2003 Conference on Computer Vision and Pattern Recognition Workshop, Madison, WI, USA, 16–22 June 2003; Volume 1, p. 4. [Google Scholar]
  7. Karasik, A. A complete, automatic procedure for pottery documentation and analysis. In Proceedings of the 2010 IEEE Computer Society Conference on Computer Vision and Pattern Recognition-Workshops, San Francisco, CA, USA, 13–18 June 2010; pp. 29–34. [Google Scholar]
  8. Karasik, A.; Smilansky, U. 3D scanning technology as a standard archaeological tool for pottery analysis: Practice and theory. J. Archaeol. Sci. 2008, 35, 1148–1168. [Google Scholar] [CrossRef]
  9. Kabassi, K. Evaluating websites of museums: State of the art. J. Cult. Herit. 2017, 24, 184–196. [Google Scholar] [CrossRef]
  10. Shehade, M.; Stylianou-Lambert, T. Virtual Reality in Museums: Exploring the Experiences of Museum Professionals. Appl. Sci. 2020, 10, 4031. [Google Scholar] [CrossRef]
  11. Banfi, F.; Pontisso, M.; Paolillo, F.R.; Roascio, S.; Spallino, C.; Stanga, C. Interactive and Immersive Digital Representation for Virtual Museum: VR and AR for Semantic Enrichment of Museo Nazionale Romano, Antiquarium di Lucrezia Romana and Antiquarium di Villa Dei Quintili. ISPRS Int. J. Geo-Inf. 2023, 12, 28. [Google Scholar] [CrossRef]
  12. Heeyoung, P.; Cheongtag, K.; Youngjin, P. The Variables of Surface of Revolution and its effects on Human Visual Preference. J. Korea Comput. Graph. Soc. 2022, 28, 31–40. [Google Scholar] [CrossRef]
  13. Dierckx, P. Algorithms for Smoothing Data with Periodic and Parametric Splines. Comput. Graph. Image Process. 1982, 20, 171–184. [Google Scholar] [CrossRef]
  14. Filip, D.; Magedson, R.; Markot, R. Surface algorithms using bounds on derivatives. Comput. Aided Geom. Des. 1986, 3, 295–311. [Google Scholar] [CrossRef]
  15. Cohen, E.; Riesenfeld, R.F.; Elber, G. Geometric Modeling with Splines: An Introduction; CRC Press: Boca Raton, FL, USA, 2001. [Google Scholar]
  16. Farin, G. Curves and Surfaces for Computer-Aided Geometric Design: A Practical Guide; Elsevier: Amsterdam, The Netherlands, 2014. [Google Scholar]
  17. Douglas, D.H.; Peucker, T.K. Algorithms for the Reduction of the Number of Points Required to Represent a Digitized Line or Its Caricature. Cartographica 1973, 10, 112–122. [Google Scholar] [CrossRef] [Green Version]
  18. Lang, T. Rules for the robot draughtsmen. Geogr. Mag. 1969, 42, 50–51. [Google Scholar]
  19. Opheim, H. Smoothing A Digitzed Curve by Data Reduction Methods. In Eurographics Conference Proceedings; Encarnacao, J.L., Ed.; The Eurographics Association: Prague, Czechia, 1981. [Google Scholar] [CrossRef]
  20. Reumann, K.; Witkam, A.P.M. Optimizing curve segmentation in computer graphics. In Proceedings of the International Computing Symposium 1973, Davos, Switzerland, 4–7 September 1973; pp. 467–472. [Google Scholar]
  21. Visvalingam, M.; Whyatt, J.D. Line generalisation by repeated elimination of points. Cartogr. J. 1993, 30, 46–51. [Google Scholar] [CrossRef]
  22. Jakob, W.; Speierer, S.; Roussel, N.; Nimier-David, M.; Vicini, D.; Zeltner, T.; Nicolet, B.; Crespo, M.; Leroy, V.; Zhang, Z. Mitsuba 3 Renderer. 2022. Available online: https://mitsuba-renderer.org (accessed on 10 January 2023).
  23. Suzuki, S.; Abe, K. Topological Structural Analysis of Digitized Binary Images by Border Following. Comput. Vis. Graph. Image Process. 1985, 30, 32–46. [Google Scholar] [CrossRef]
  24. Moore, D.J.H. An Approach to the Analysis and Extraction of Pattern Features Using Integral Geometry. IEEE Trans. Syst. Man Cybern. 1972, 2, 97–102. [Google Scholar] [CrossRef]
  25. Moravec, H.P. Obstacle Avoidance and Navigation in the Real World by a Seeing Robot Rover; Stanford University: Stanford, CA, USA, 1980. [Google Scholar]
  26. Harris, C.; Stephens, M. A Combined Corner and Edge Detector. In Proceedings of the Alvey Vision Conference, Manchester, UK, 31 August–2 September 1988; pp. 23.1–23.6. [Google Scholar] [CrossRef]
  27. Shi, J.; Tomasi, C. Good Features to Track. In Proceedings of the 1994 Proceedings of IEEE Conference on Computer Vision and Pattern Recognition, Seattle, WA, USA, 21–23 June 1994. [Google Scholar]
  28. Hall, N.S.; Laflin, S. A computer aided design technique for pottery profiles. In Computer Applications in Archaeology; Computer Center, University of Birmingham: Birmingham, UK, 1984; pp. 178–188. [Google Scholar]
  29. Badiu, I.; Buna, Z.; Comes, R. Automatic generation of ancient pottery profiles using CAD software. J. Anc. Hist. Archaeol. 2015, 2. [Google Scholar] [CrossRef] [Green Version]
  30. Wong, K.Y.K.; Mendonça, P.R.S.; Cipolla, R. Reconstruction of surfaces of revolution from single uncalibrated views. Image Vis. Comput. 2004, 22, 829–836. [Google Scholar] [CrossRef] [Green Version]
  31. Colombo, C.; Del Bimbo, A.; Pernici, F. Metric 3D reconstruction and texture acquisition of surfaces of revolution from a single uncalibrated view. IEEE Trans. Pattern Anal. Mach. Intell. 2005, 27, 99–114. [Google Scholar] [CrossRef] [PubMed]
  32. Kajiya, J.T. New techniques for ray tracing procedurally defined objects. ACM Siggraph Comput. Graph. 1983, 17, 91–102. [Google Scholar] [CrossRef]
  33. Baciu, G.; Jia, J.; Lam, G. Ray tracing surfaces of revolution: An old problem with a new perspective. In Proceedings of the Computer Graphics International 2001, Hong Kong, China, 3–6 July 2001; pp. 215–222. [Google Scholar]
  34. Goryeo Celadon Museum. Available online: https://www.celadon.go.kr/ (accessed on 20 December 2022).
  35. Rendering Resources. Available online: https://benedikt-bitterli.me/resources/ (accessed on 10 January 2023).
  36. Unreal Engine 5. Available online: https://www.unrealengine.com/ (accessed on 21 February 2023).
  37. Parker, S.G.; Bigler, J.; Dietrich, A.; Friedrich, H.; Hoberock, J.; Luebke, D.; McAllister, D.; McGuire, M.; Morley, K.; Robison, A.; et al. Optix: A general purpose ray tracing engine. ACM Trans. Graph. (tog) 2010, 29, 1–13. [Google Scholar] [CrossRef]
Figure 1. The scene S s h o w c a s e rendered in 4K resolution with a value of samples per pixel σ = 512 . Our generated 3D celadon models are placed on pedestals and encased in glasses.
Applsci 13 06848 g001
Figure 2. The flow from 2D celadon image to a 3D model: (a) input 2D image; (b) detected contour and corners; (c) the axis of revolution A ; (d) profile curve C with A ; (e) generated 3D celadon model.
Applsci 13 06848 g002
Figure 3. Simplified representation of the texture generation procedure: (a) input scanlines; (b) selecting one scanline; (c) filling the missing data with linear interpolation; (d) the final result of texture generation.
Applsci 13 06848 g003
Figure 4. The rendered images of a P 0 model by rotating it 360° in a 60° interval.
Applsci 13 06848 g004
Figure 5. Geometric data generated by our 3D reconstruction algorithm from input image: axis of revolution A , profile curve C, generated texture image, and generated 3D model with texture.
Applsci 13 06848 g005
Figure 6. Rendered scenes [35] with a path tracer [22]: (a) scenes without our 3D celadon models; (b) scenes with the models.
Applsci 13 06848 g006
Figure 7. The VR celadon museum in Unreal Engine 5: (a) rendering the museum with wireframe; (b) rendering the museum in unlit mode; (c) a user wanders around the museum and appreciates 3D celadon models generated by our method.
Applsci 13 06848 g007
Table 1. Details of 3D reconstruction for each celadon, where the computing times are all measured in milliseconds.
CeladonImage ProcessingB-spline3D ModelApprox.
Error
(pixels)
Time (ms)# Contour
Points
# Control
Points
# DomainsTime (ms)# Vertices# Faces
P 0 64.0668815261982.6294,320187,9202.27
P 1 70.12830172981076.89107,640214,5602.17
P 2 78.04835203271176.80118,080235,4401.38
P 3 68.07813183691375.21133,200265,6802.33
P 4 70.03783143821469.63137,880275,0401.85
P 5 68.03699183961462.05142,920285,1201.45
P 6 69.00701244671779.77168,480336,2401.26
P 7 71.01755275542082.57199,800398,8801.46
Table 2. Details of rendering the scenes in various resolutions and σ values, where the rendering times are measured in seconds.
NameCeladonRendering Time (s)
HDFHD4K
σ = 64 σ = 1024 σ = 64 σ = 1024 σ = 64 σ = 512
S d i n i n g P 6 , P 7 2.0815.973.4635.9910.0872.04
S l o u n g e P 1 , P 3 2.6039.045.8486.6022.98174.00
S k i t c h e n P 0 ,..., P 7 3.8741.737.3592.7525.49187.74
S s h o w c a s e P 0 ,..., P 7 6.73102.6216.18224.9057.41451.41
S l i v i n g P 0 ,..., P 7 8.90102.2915.66233.0264.37469.07
Disclaimer/Publisher’s Note: The statements, opinions and data contained in all publications are solely those of the individual author(s) and contributor(s) and not of MDPI and/or the editor(s). MDPI and/or the editor(s) disclaim responsibility for any injury to people or property resulting from any ideas, methods, instructions or products referred to in the content.

