


Rediscovering Automatic Detection of Stuttering and Its Subclasses through Machine Learning—The Impact of Changing Deep Model Architecture and Amount of Data in the Training Set


Abstract
:Featured Application
Abstract
1. Introduction
- -
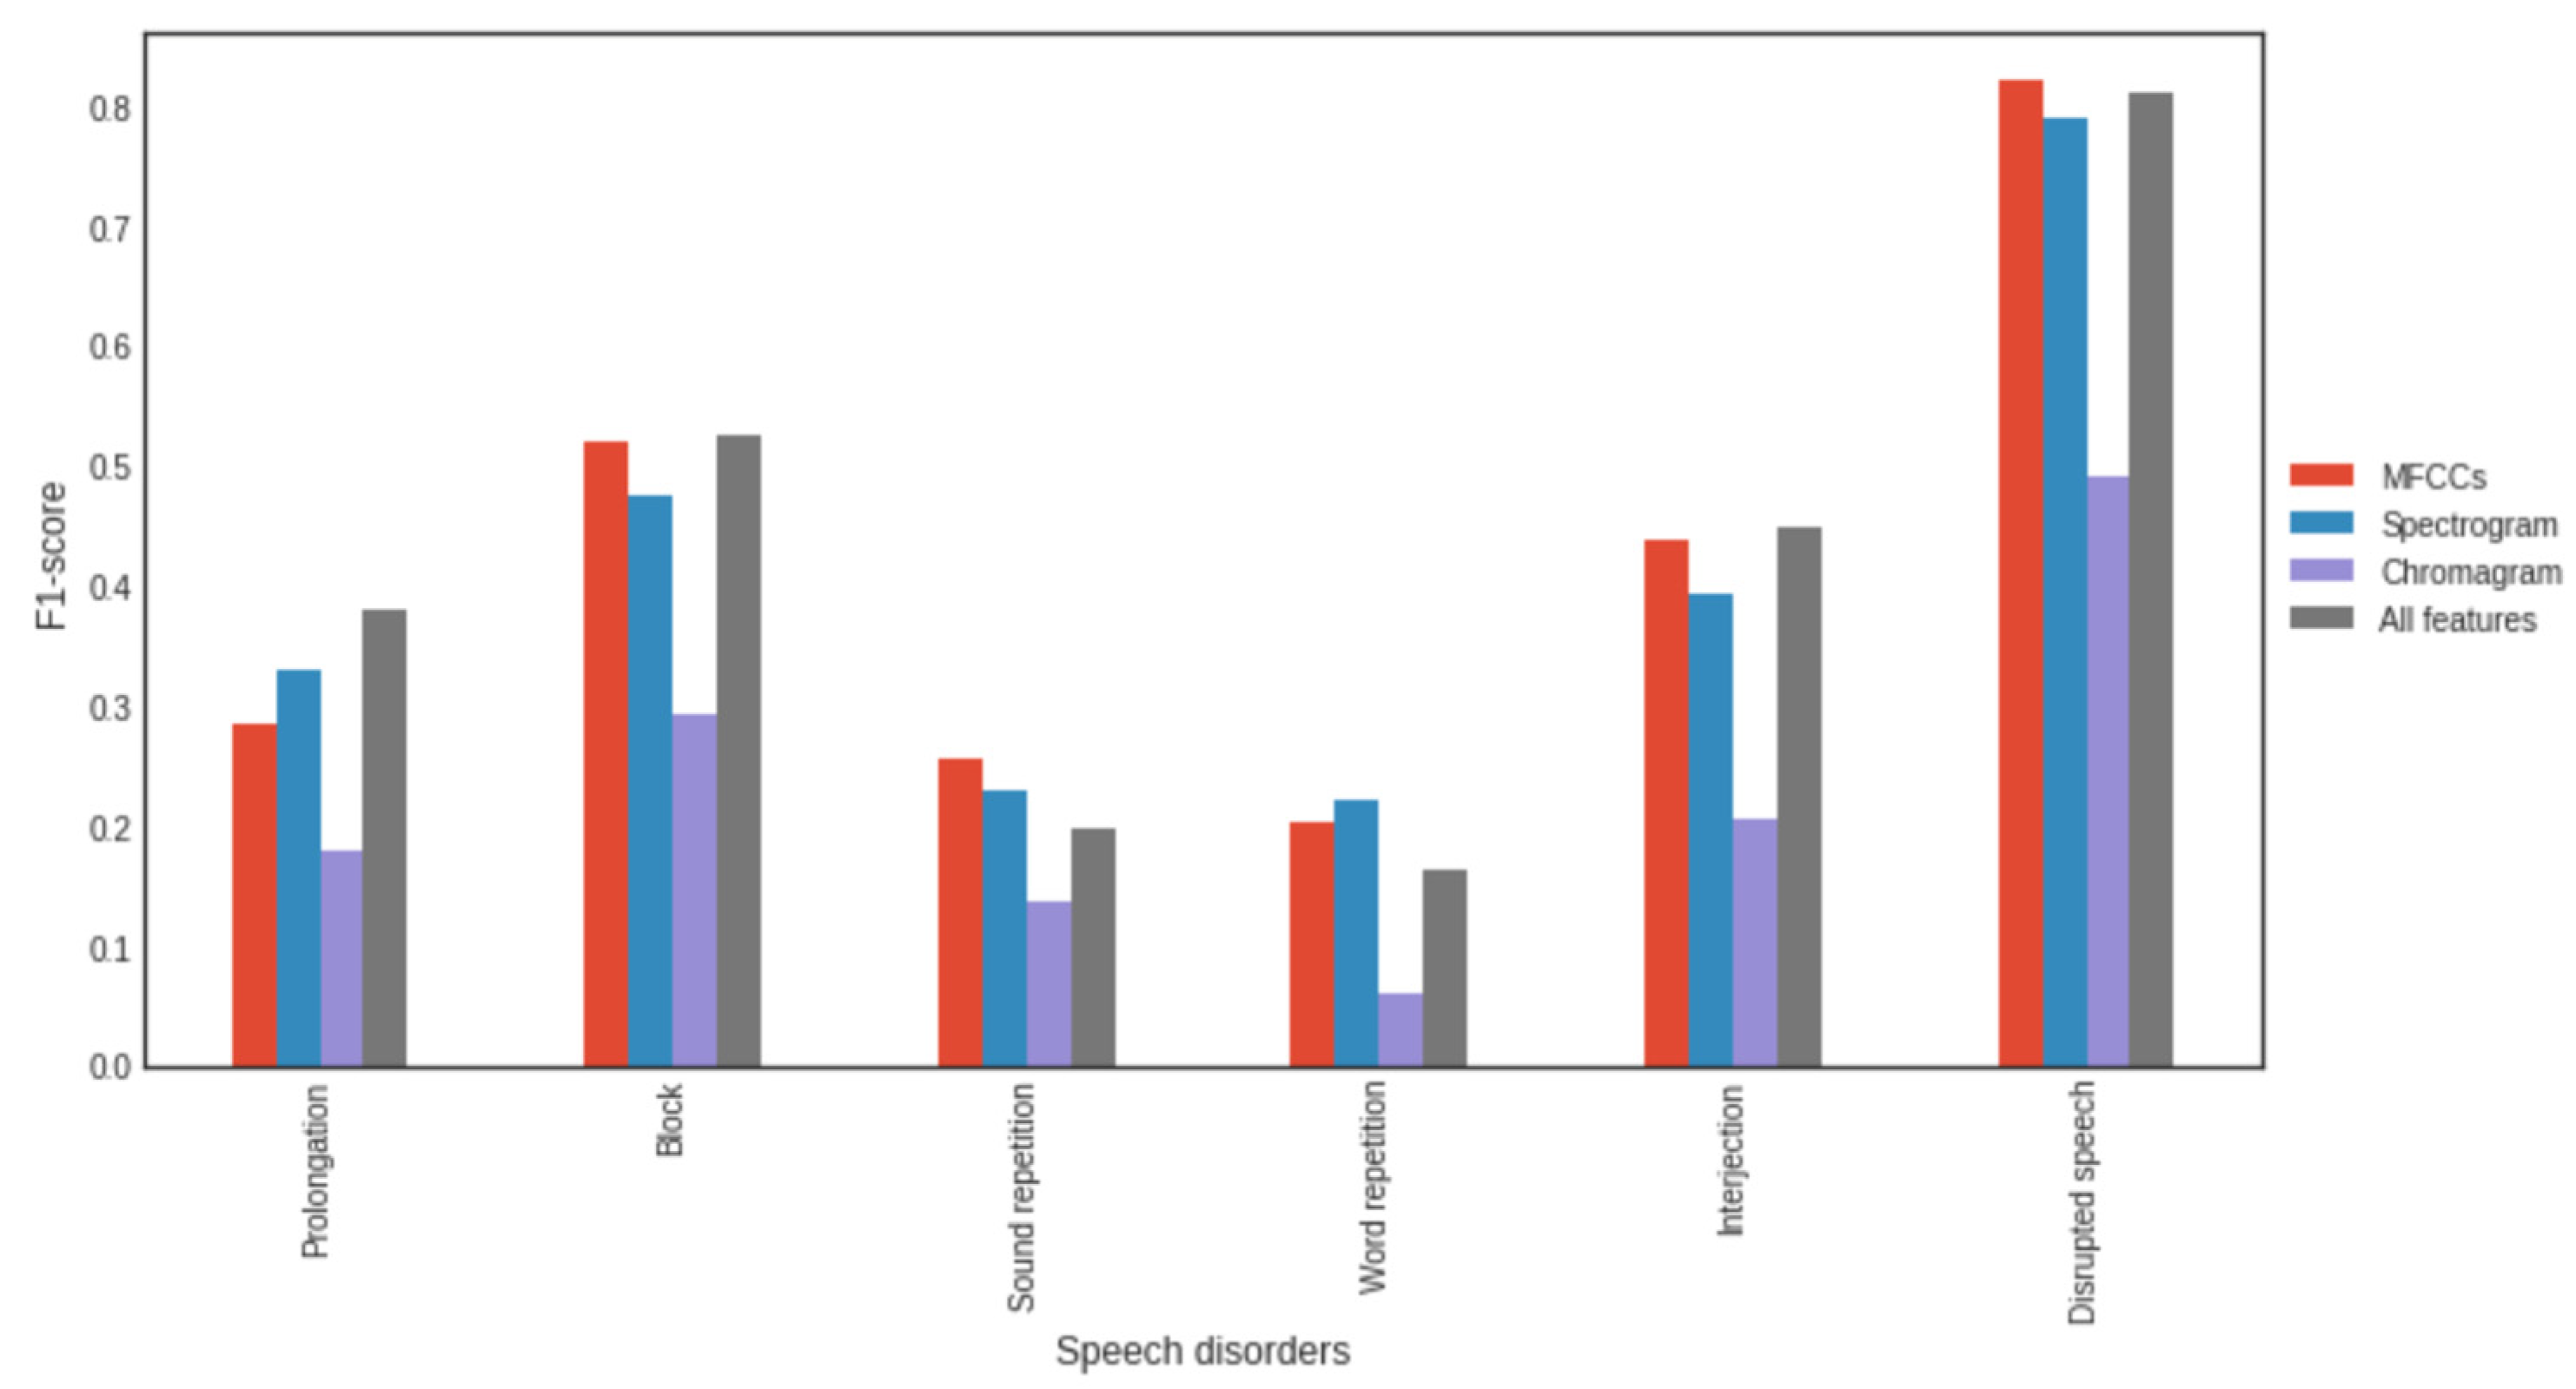
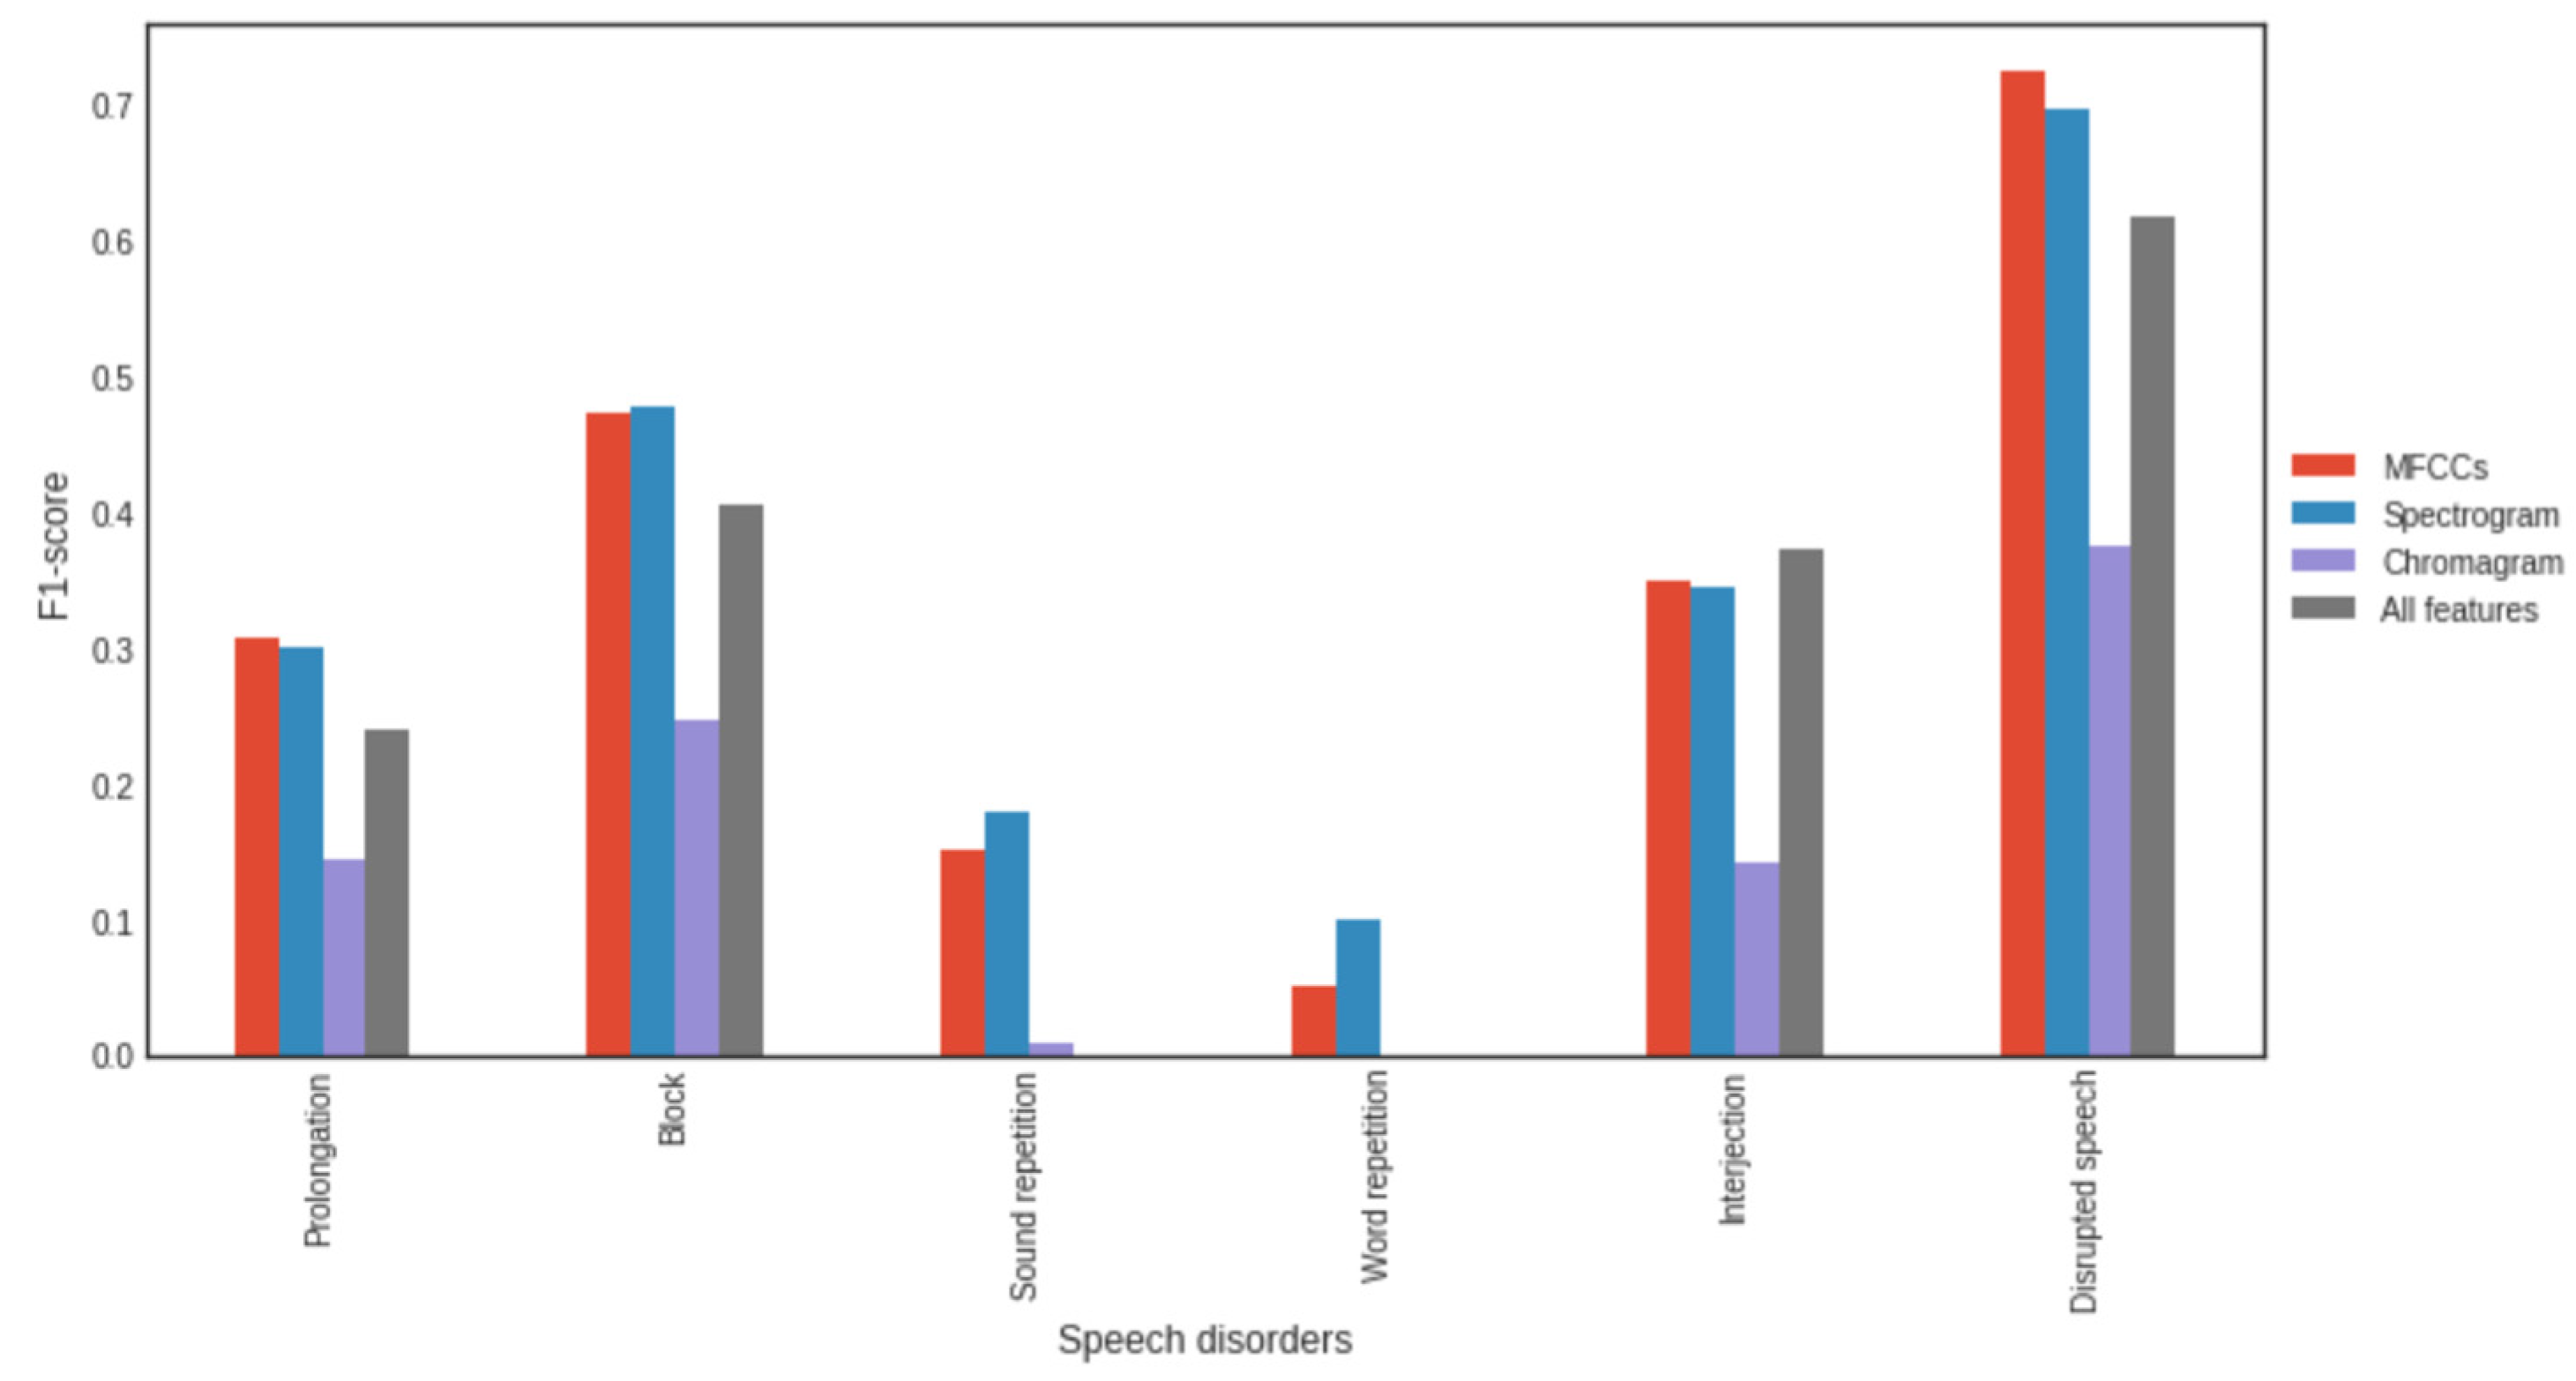
- We examine the impact of individual signal features such as Mel-Frequency Cepstral Coefficients (MFCCs), pitch-determining features in the signal, and various 2D speech representations on the recognition performance;
- -
- We propose restructuring the network model so it achieves an F1 measure of 0.93 for the general class classification;
- -
- We use the Wav2Vec2 transformer-based model that achieved better results for word and sound repetitions, which is promising for further research as there are issues with satisfactory results in those classes;
- -
- We demonstrate that the results obtained by the best-performing algorithm are comparable to state of the art and it outperforms the literature-reported outcomes, both for general class classification and when detecting speech disfluency subclasses.
2. Background
2.1. Datasets Available
- Block—a pause in a speech indicating taking a breath or stuttering;
- Prolongation (prolongation)—prolongation of a single vowel, e.g., “M[mmm]ommy”;
- Syllable repetition (sound repetition)—repetition of a single slab or sound, e.g., “I [pr-pr-pr-]prepared dinner”;
- Word or phrase repetition (word/phrase repetition)—for example, “I made [made] dinner”;
- Interjection—the insertion of a word or voice into an utterance, e.g., “um”, “uh”;
- No dysfluencies.
- Pause (natural pause)—a natural pause in speech not caused by stuttering;
- Unintelligible passage (unintelligible)—the authors were unable to understand the speaker’s message;
- Unsure—the denominator was uncertain into which class or classes the block should be classified;
- No speech (no speech)—there is silence, or only noise occurring in the background;
- Poor audio quality (poor audio quality);
- Music—no speech, while background music can be heard.
- -
- Po—observed agreement between evaluators;
- -
- Pe—expected agreement when data are randomly labeled.
- Classes related to speech disorders: breaks (10.3%), prolongations (8.1%), repetitions of sounds (13.3%), repetitions of words or whole phrases (2.5%), any speech disorder (46.9%), and interjections (27.3%);
- Classes not related to speech disorders: natural pauses in speech (2.7%), unintelligible speech (3.0%), and uncertainty of the evaluator (0.4%).
2.2. Machine Learning Application for Stuttering Detection
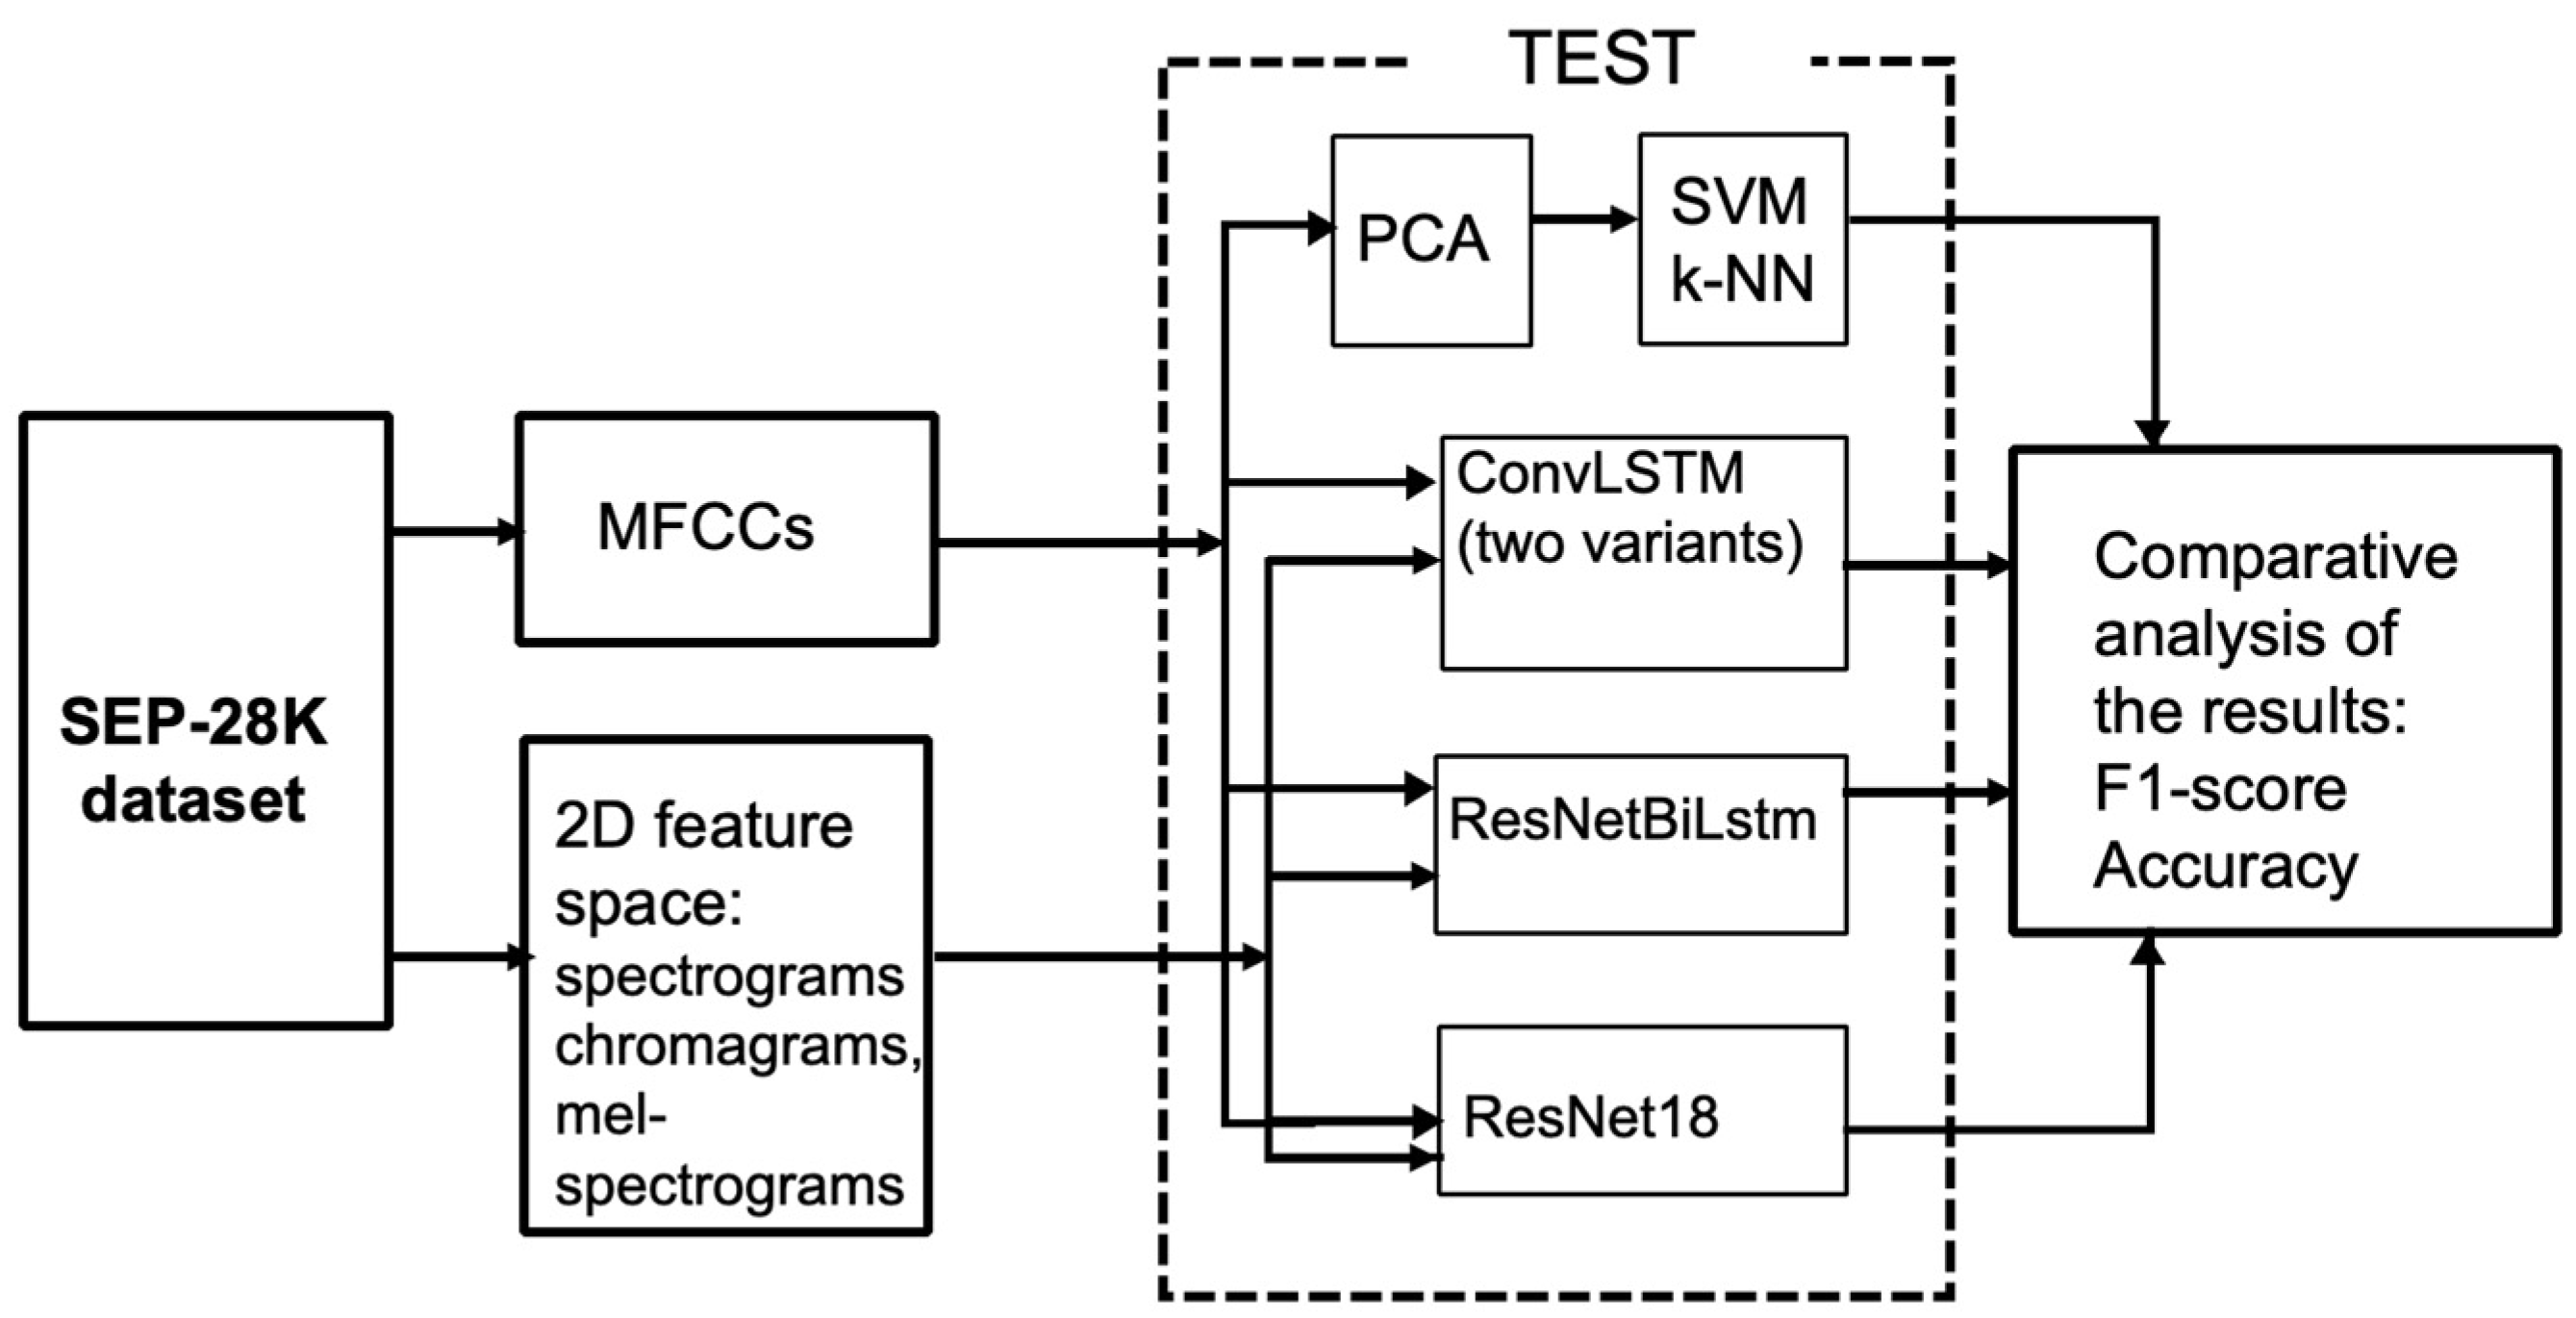
3. Method
3.1. Assumptions
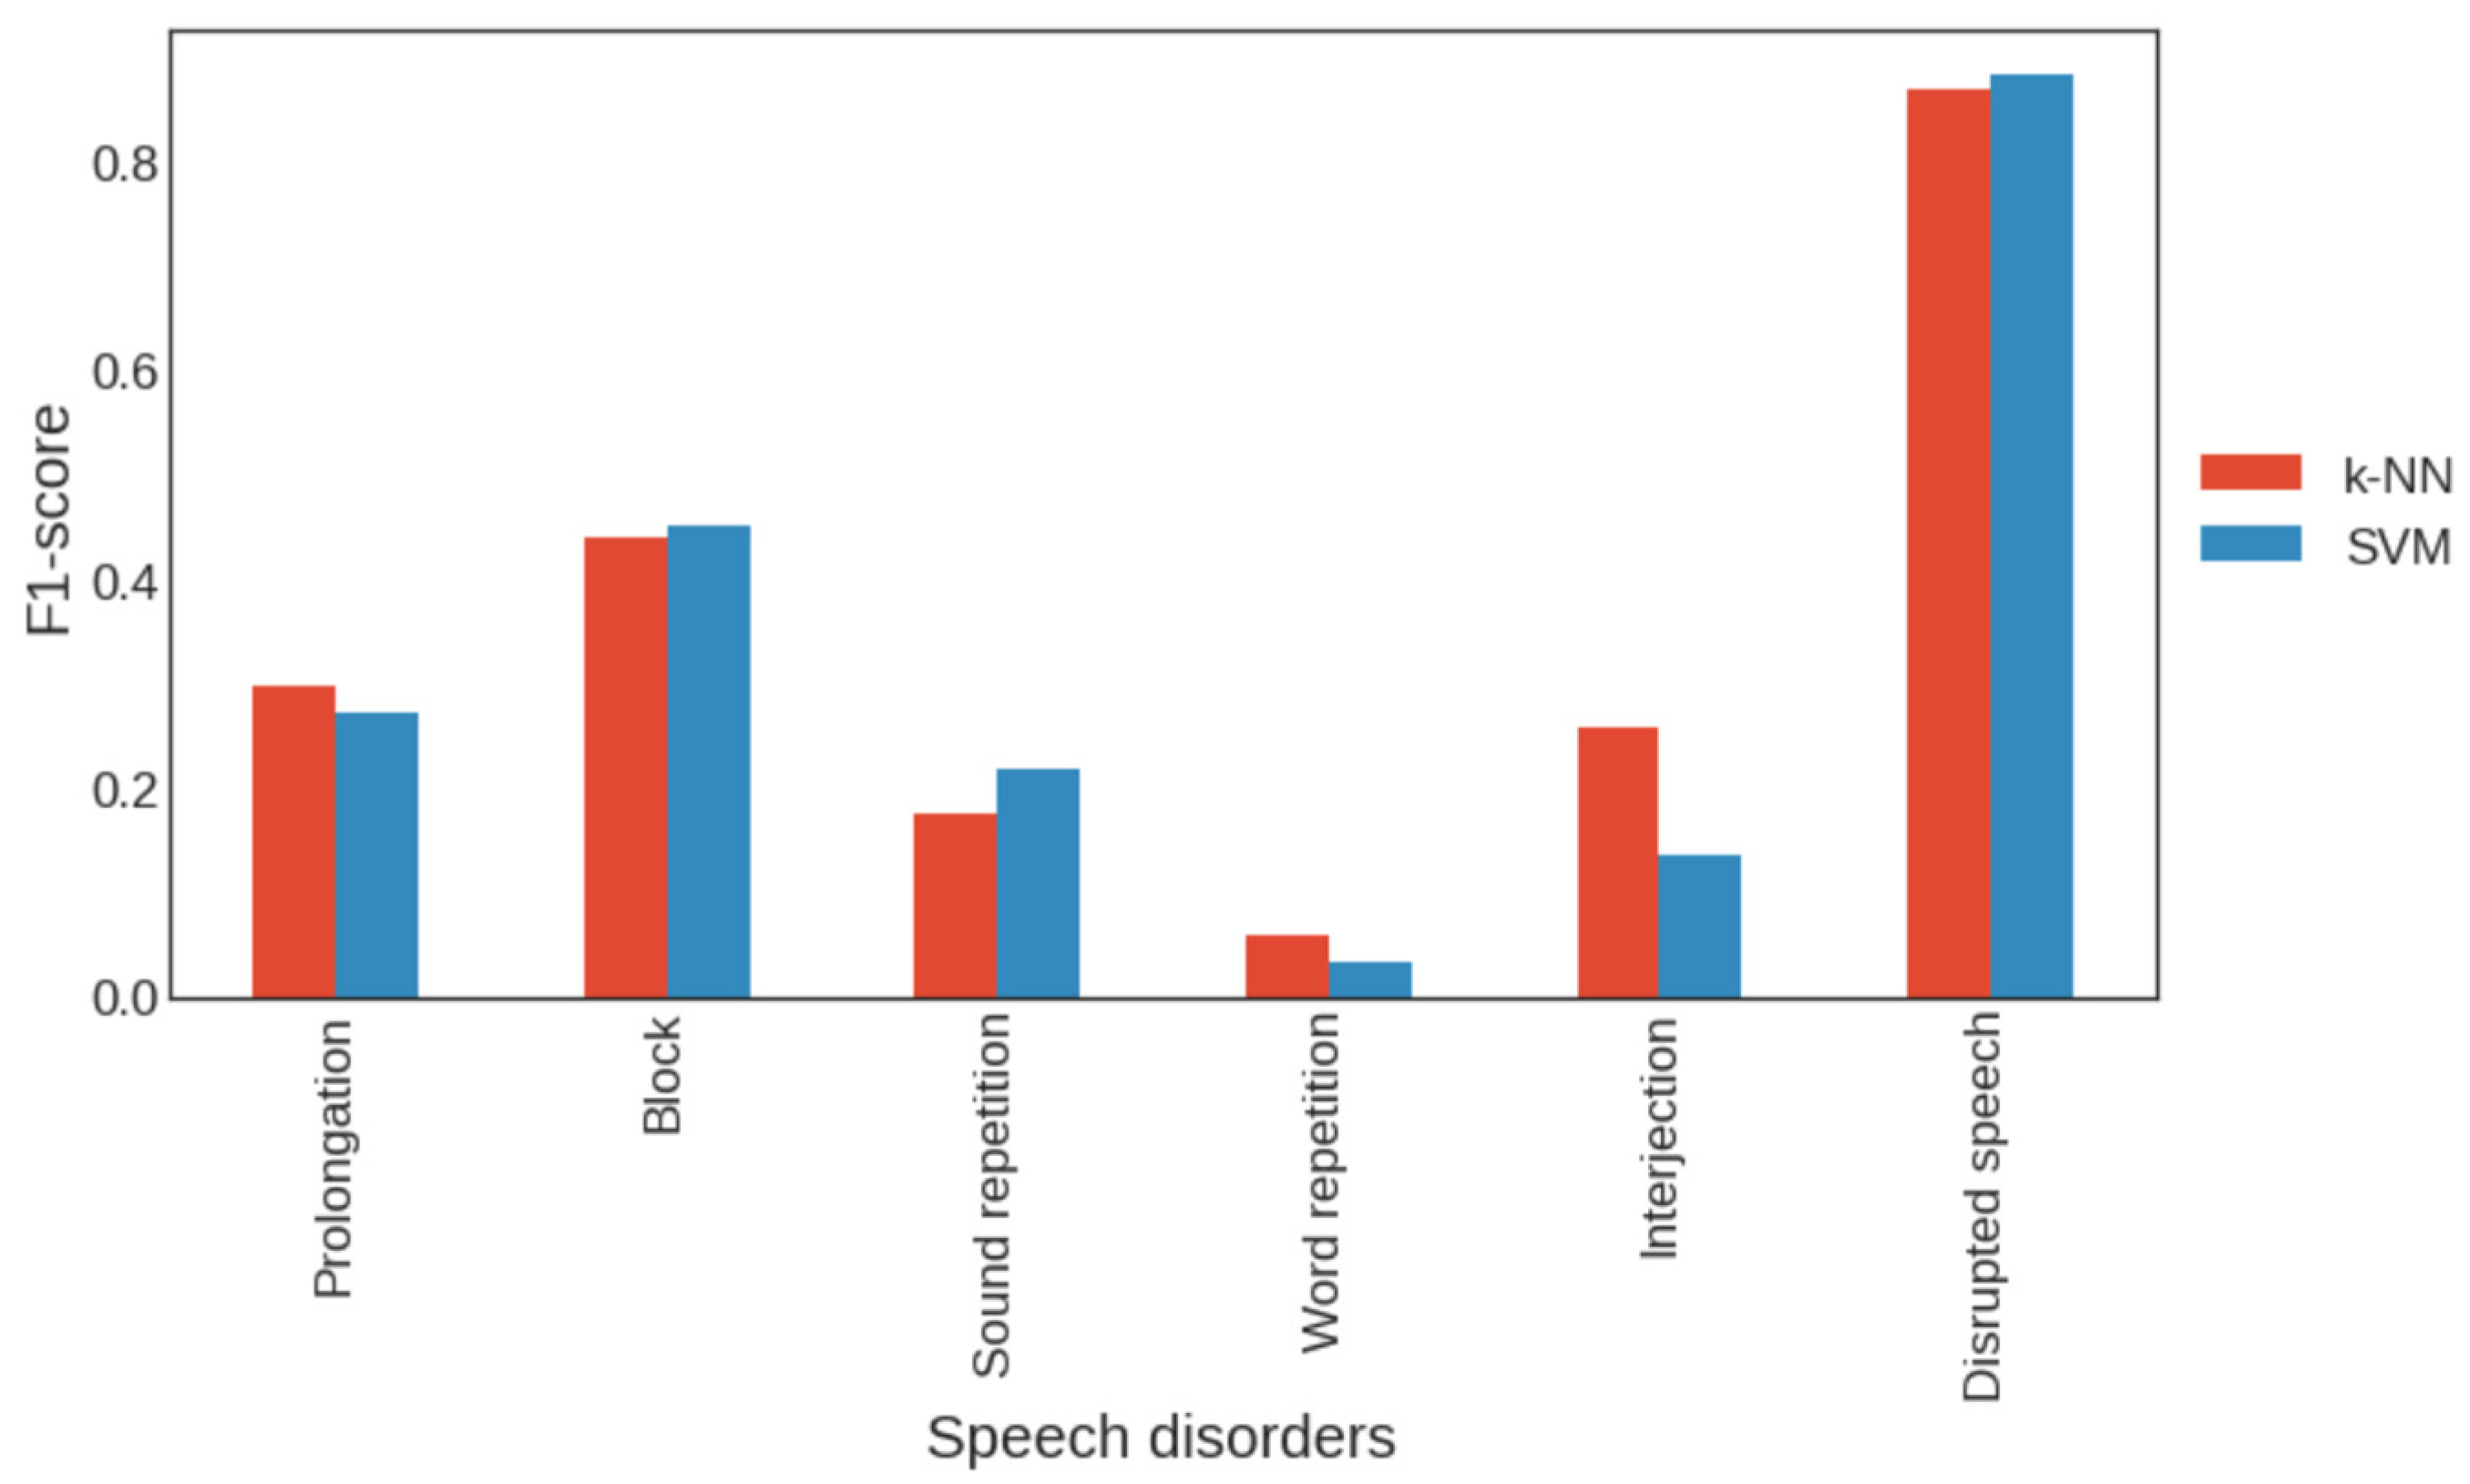
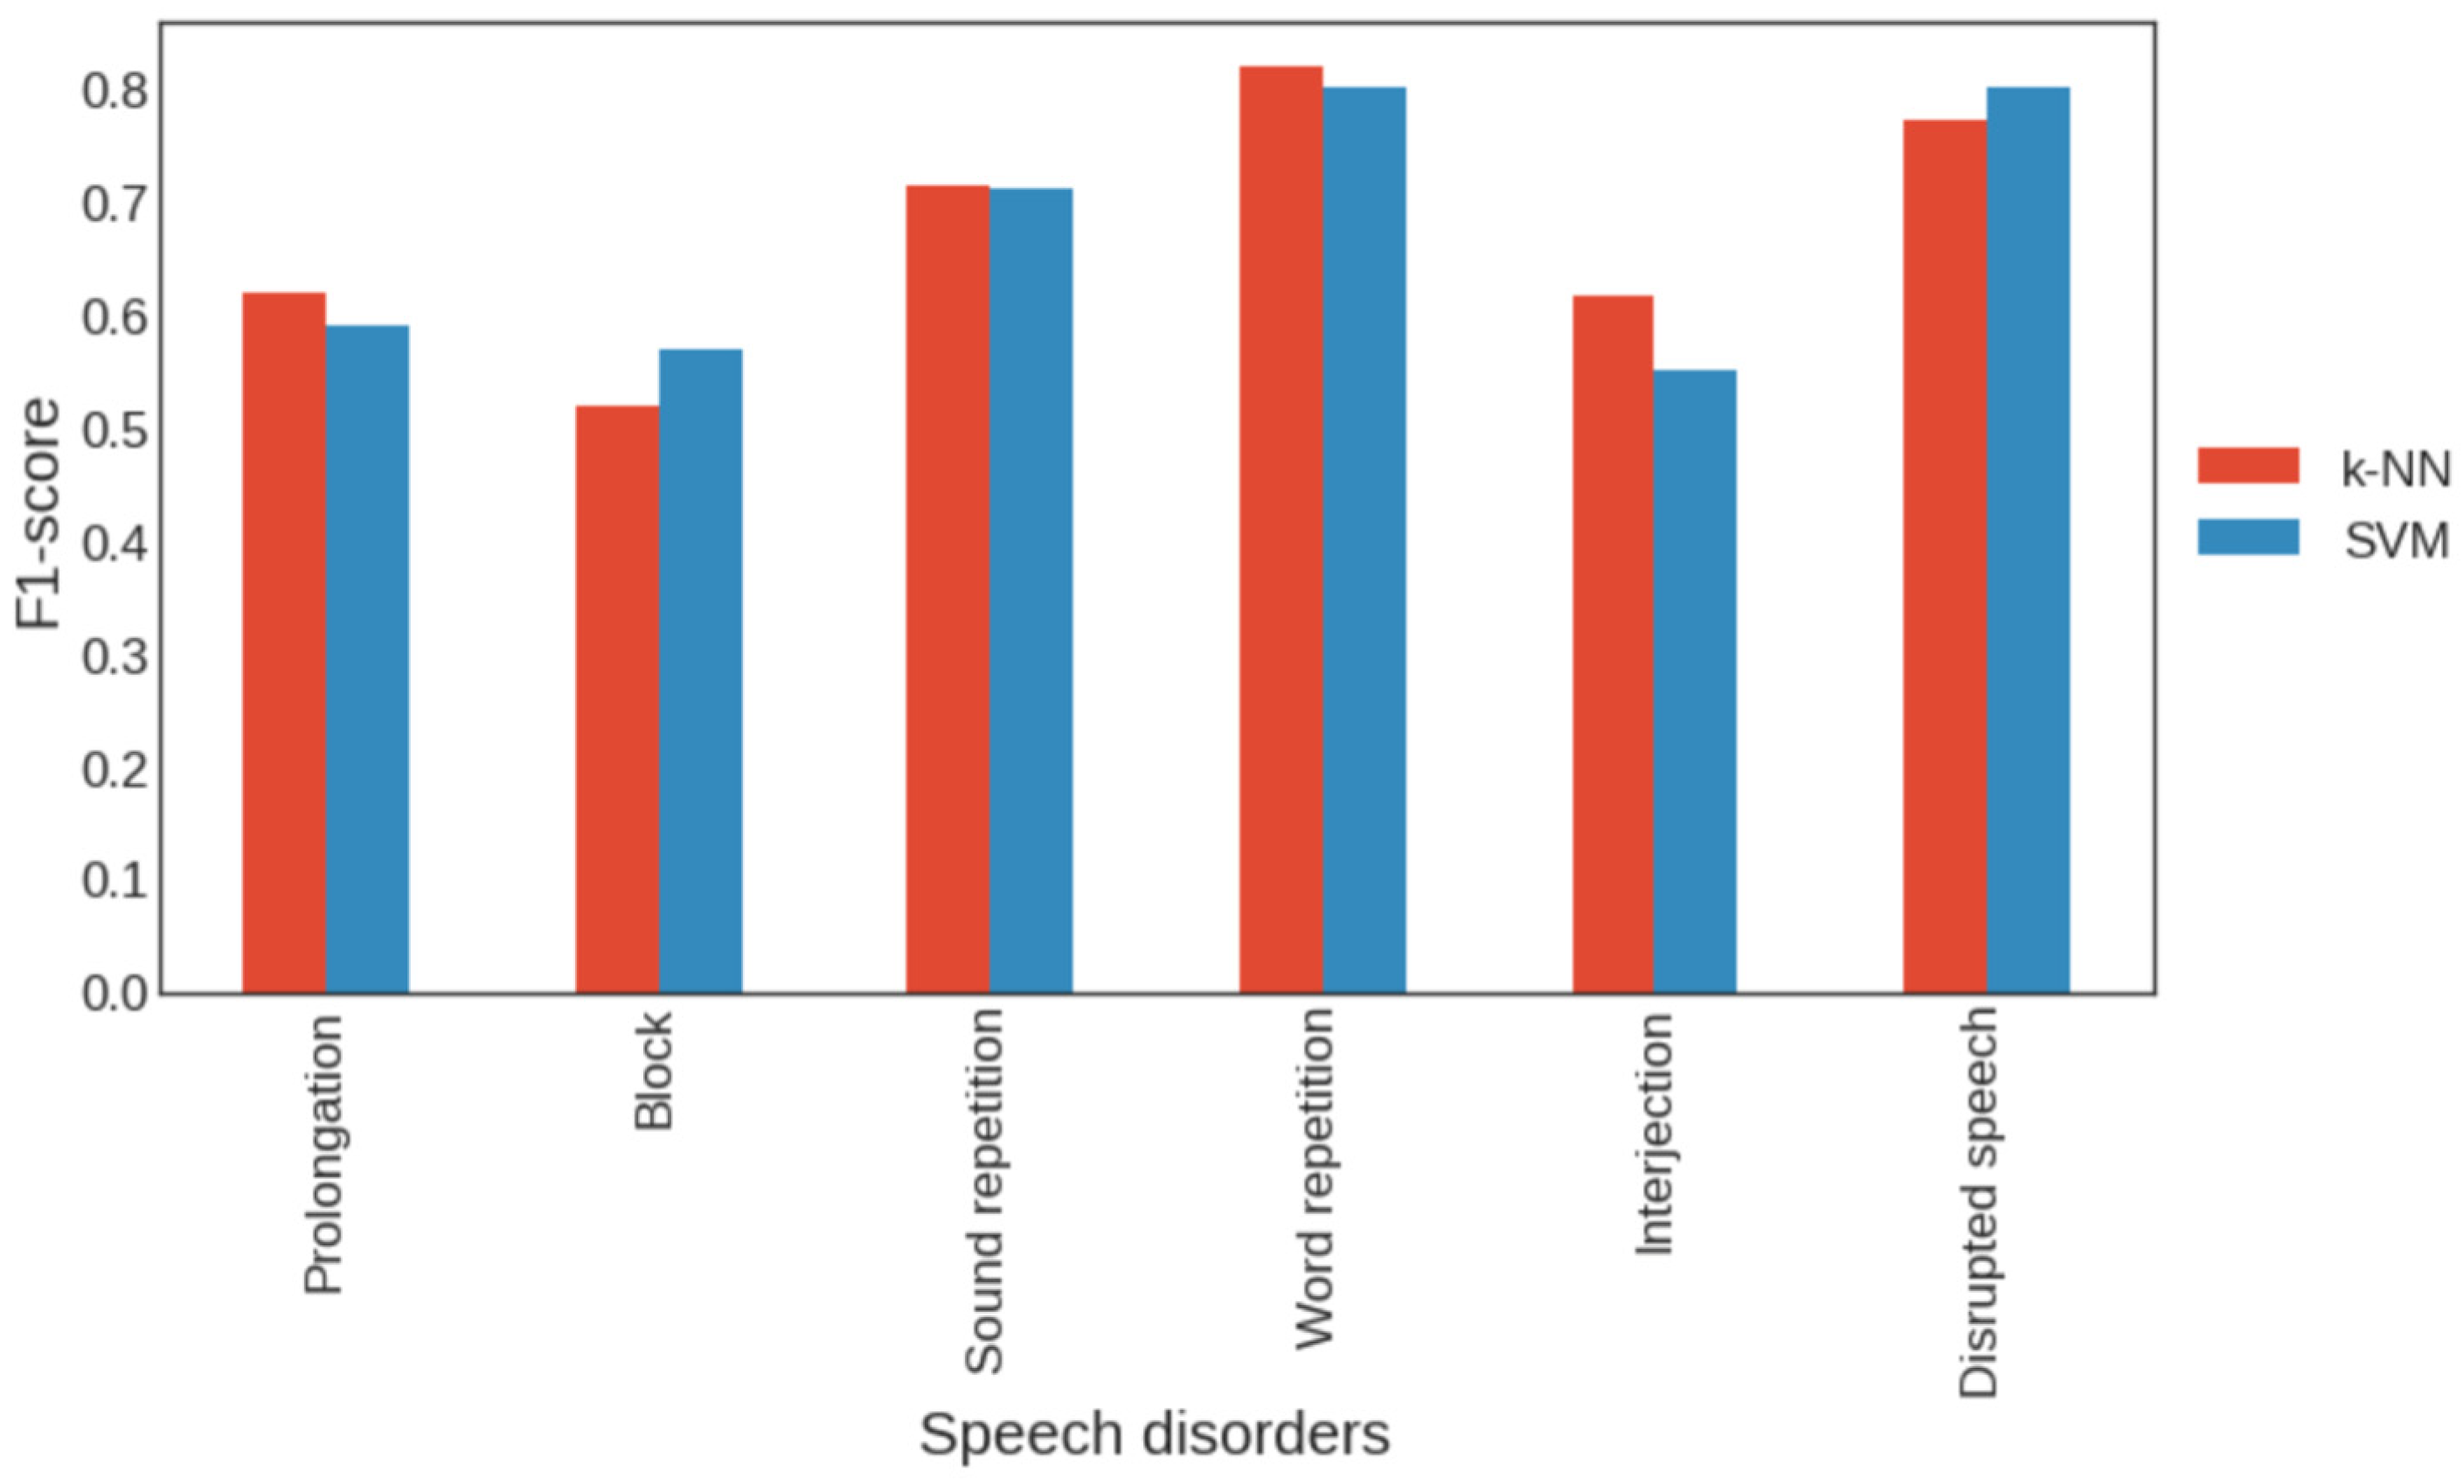
3.2. Classical Approach to Stuttering Detection
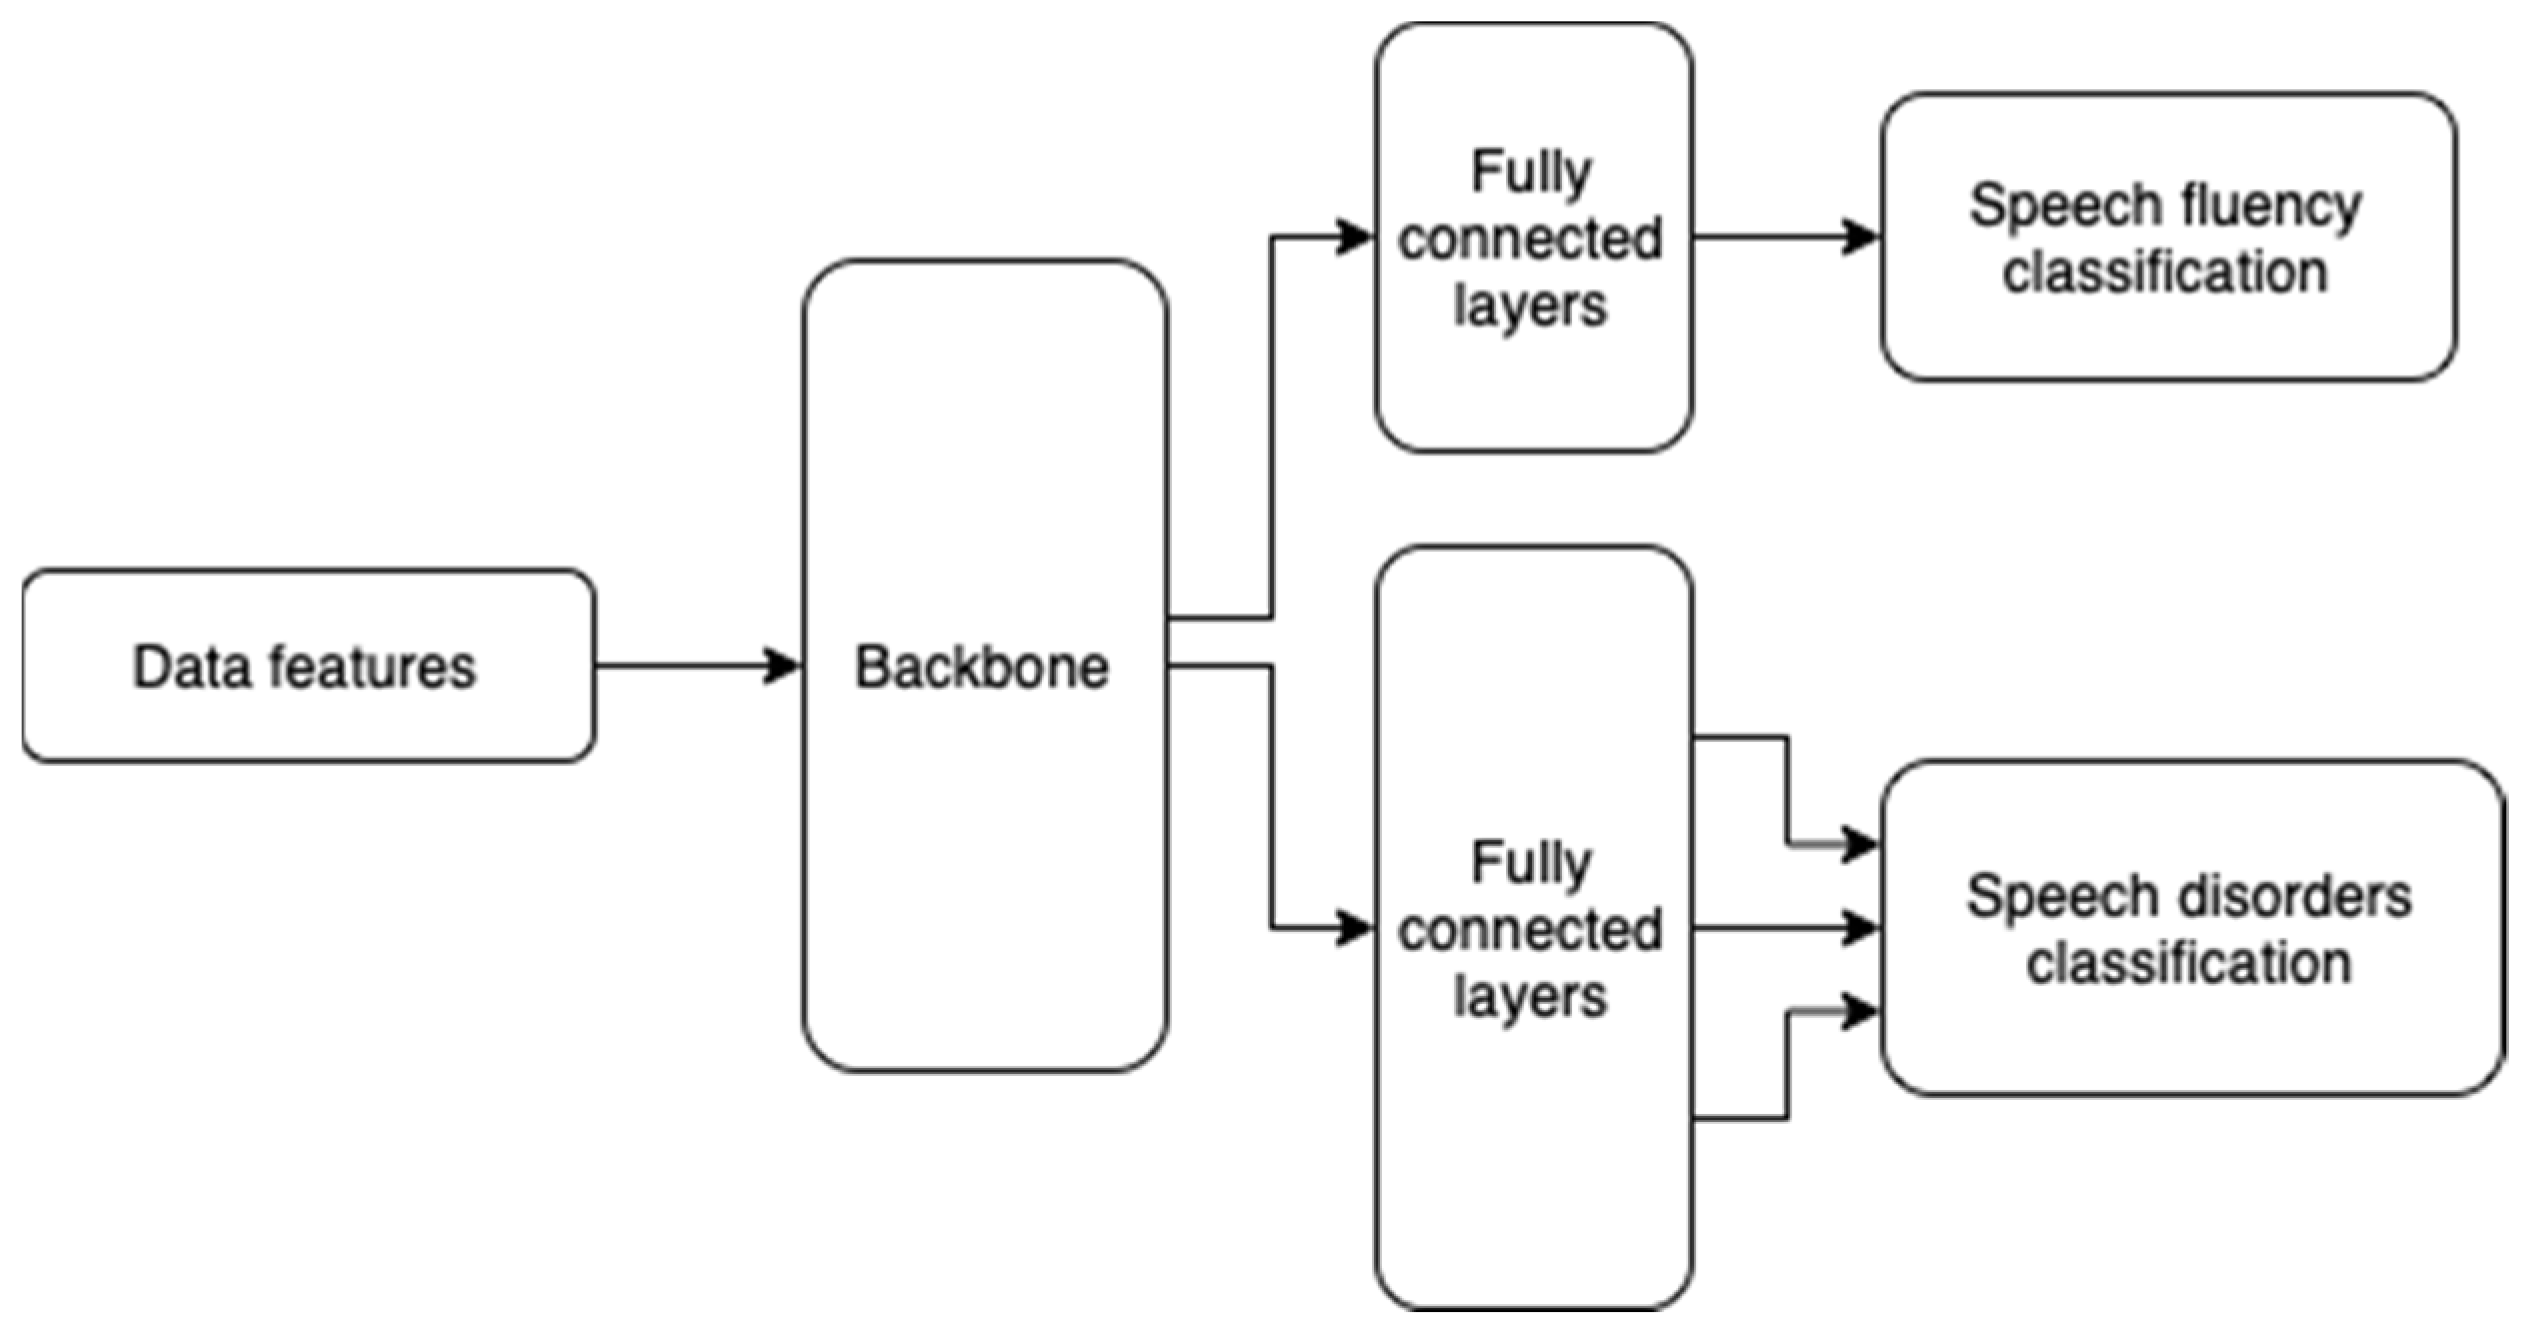
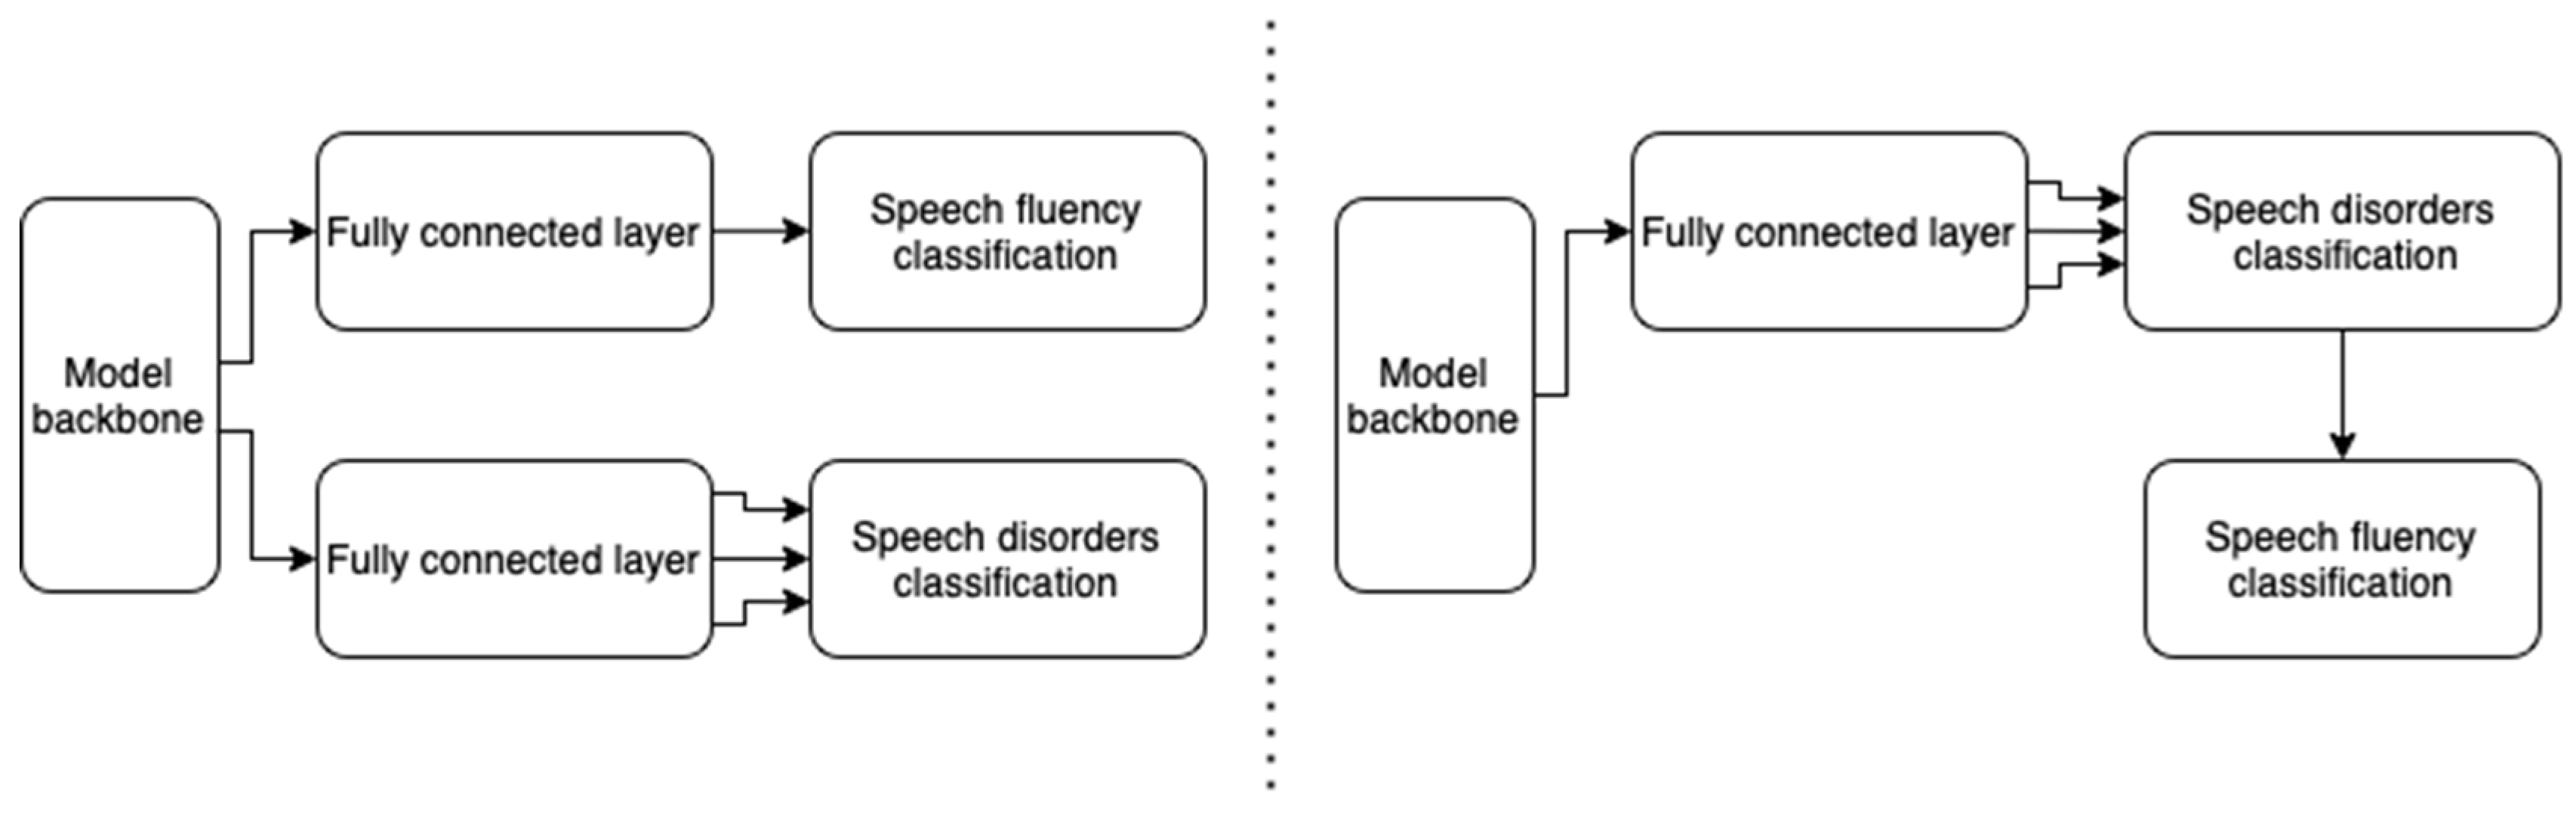
3.3. Deep Machine Learning Models Employed in Stuttering Detection
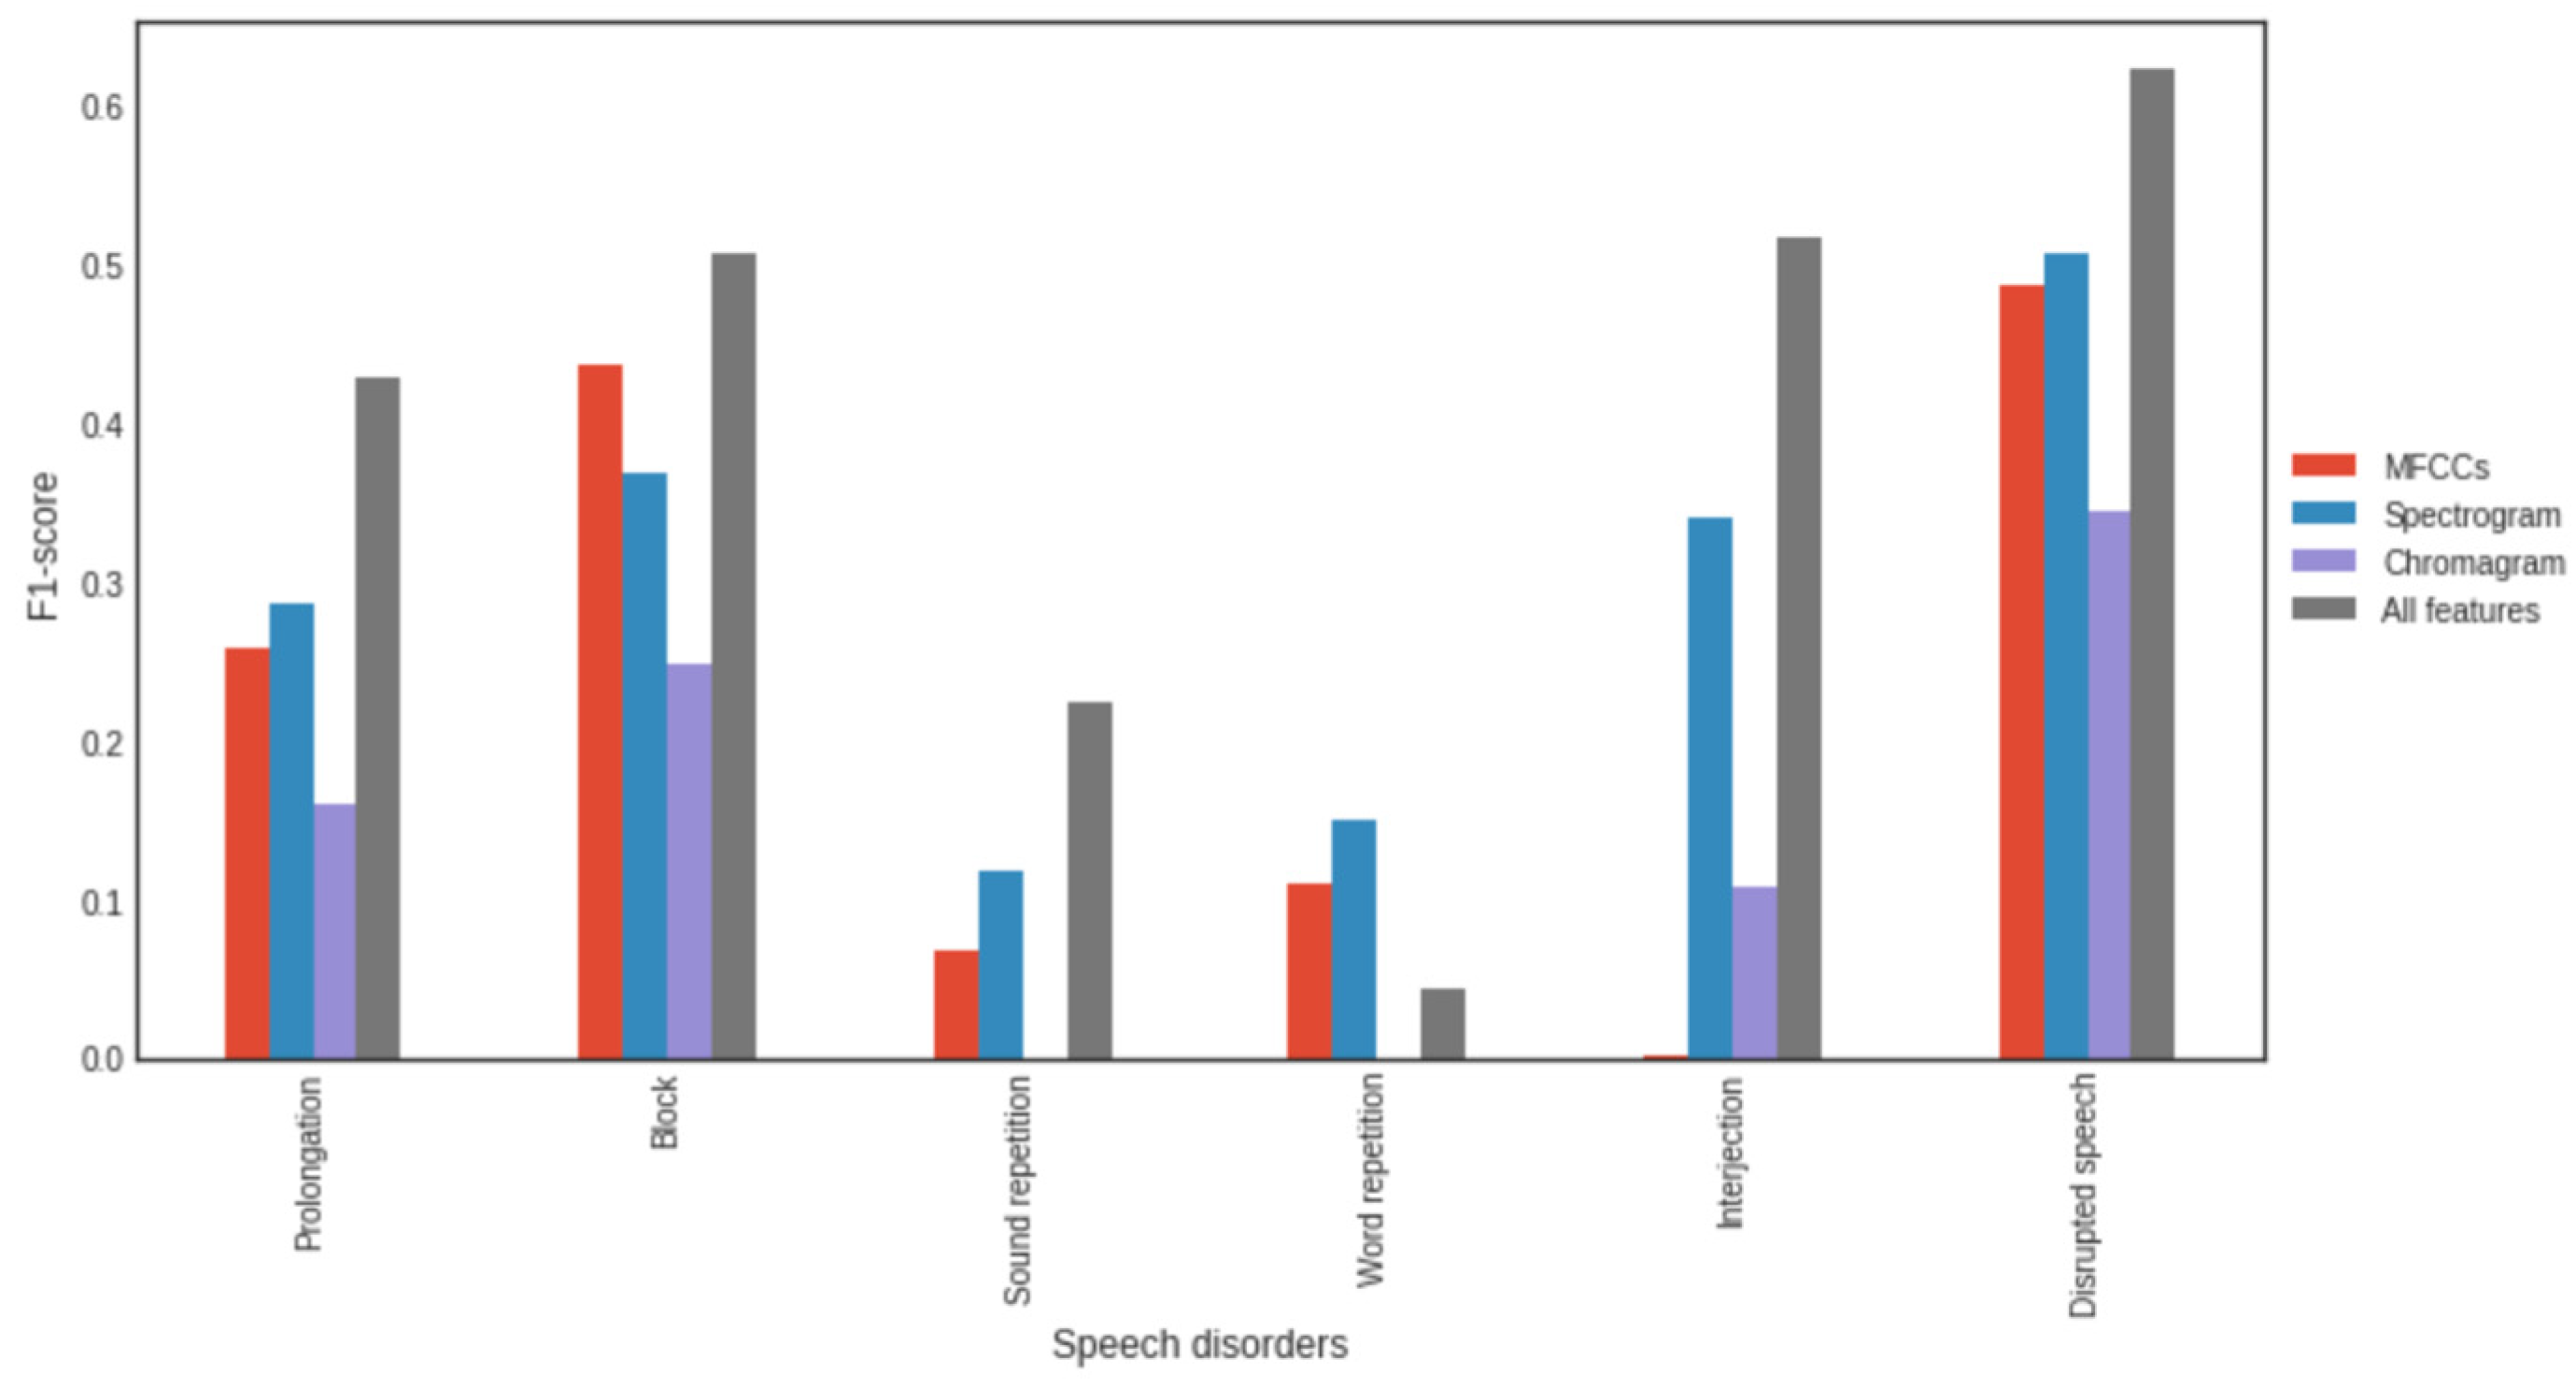
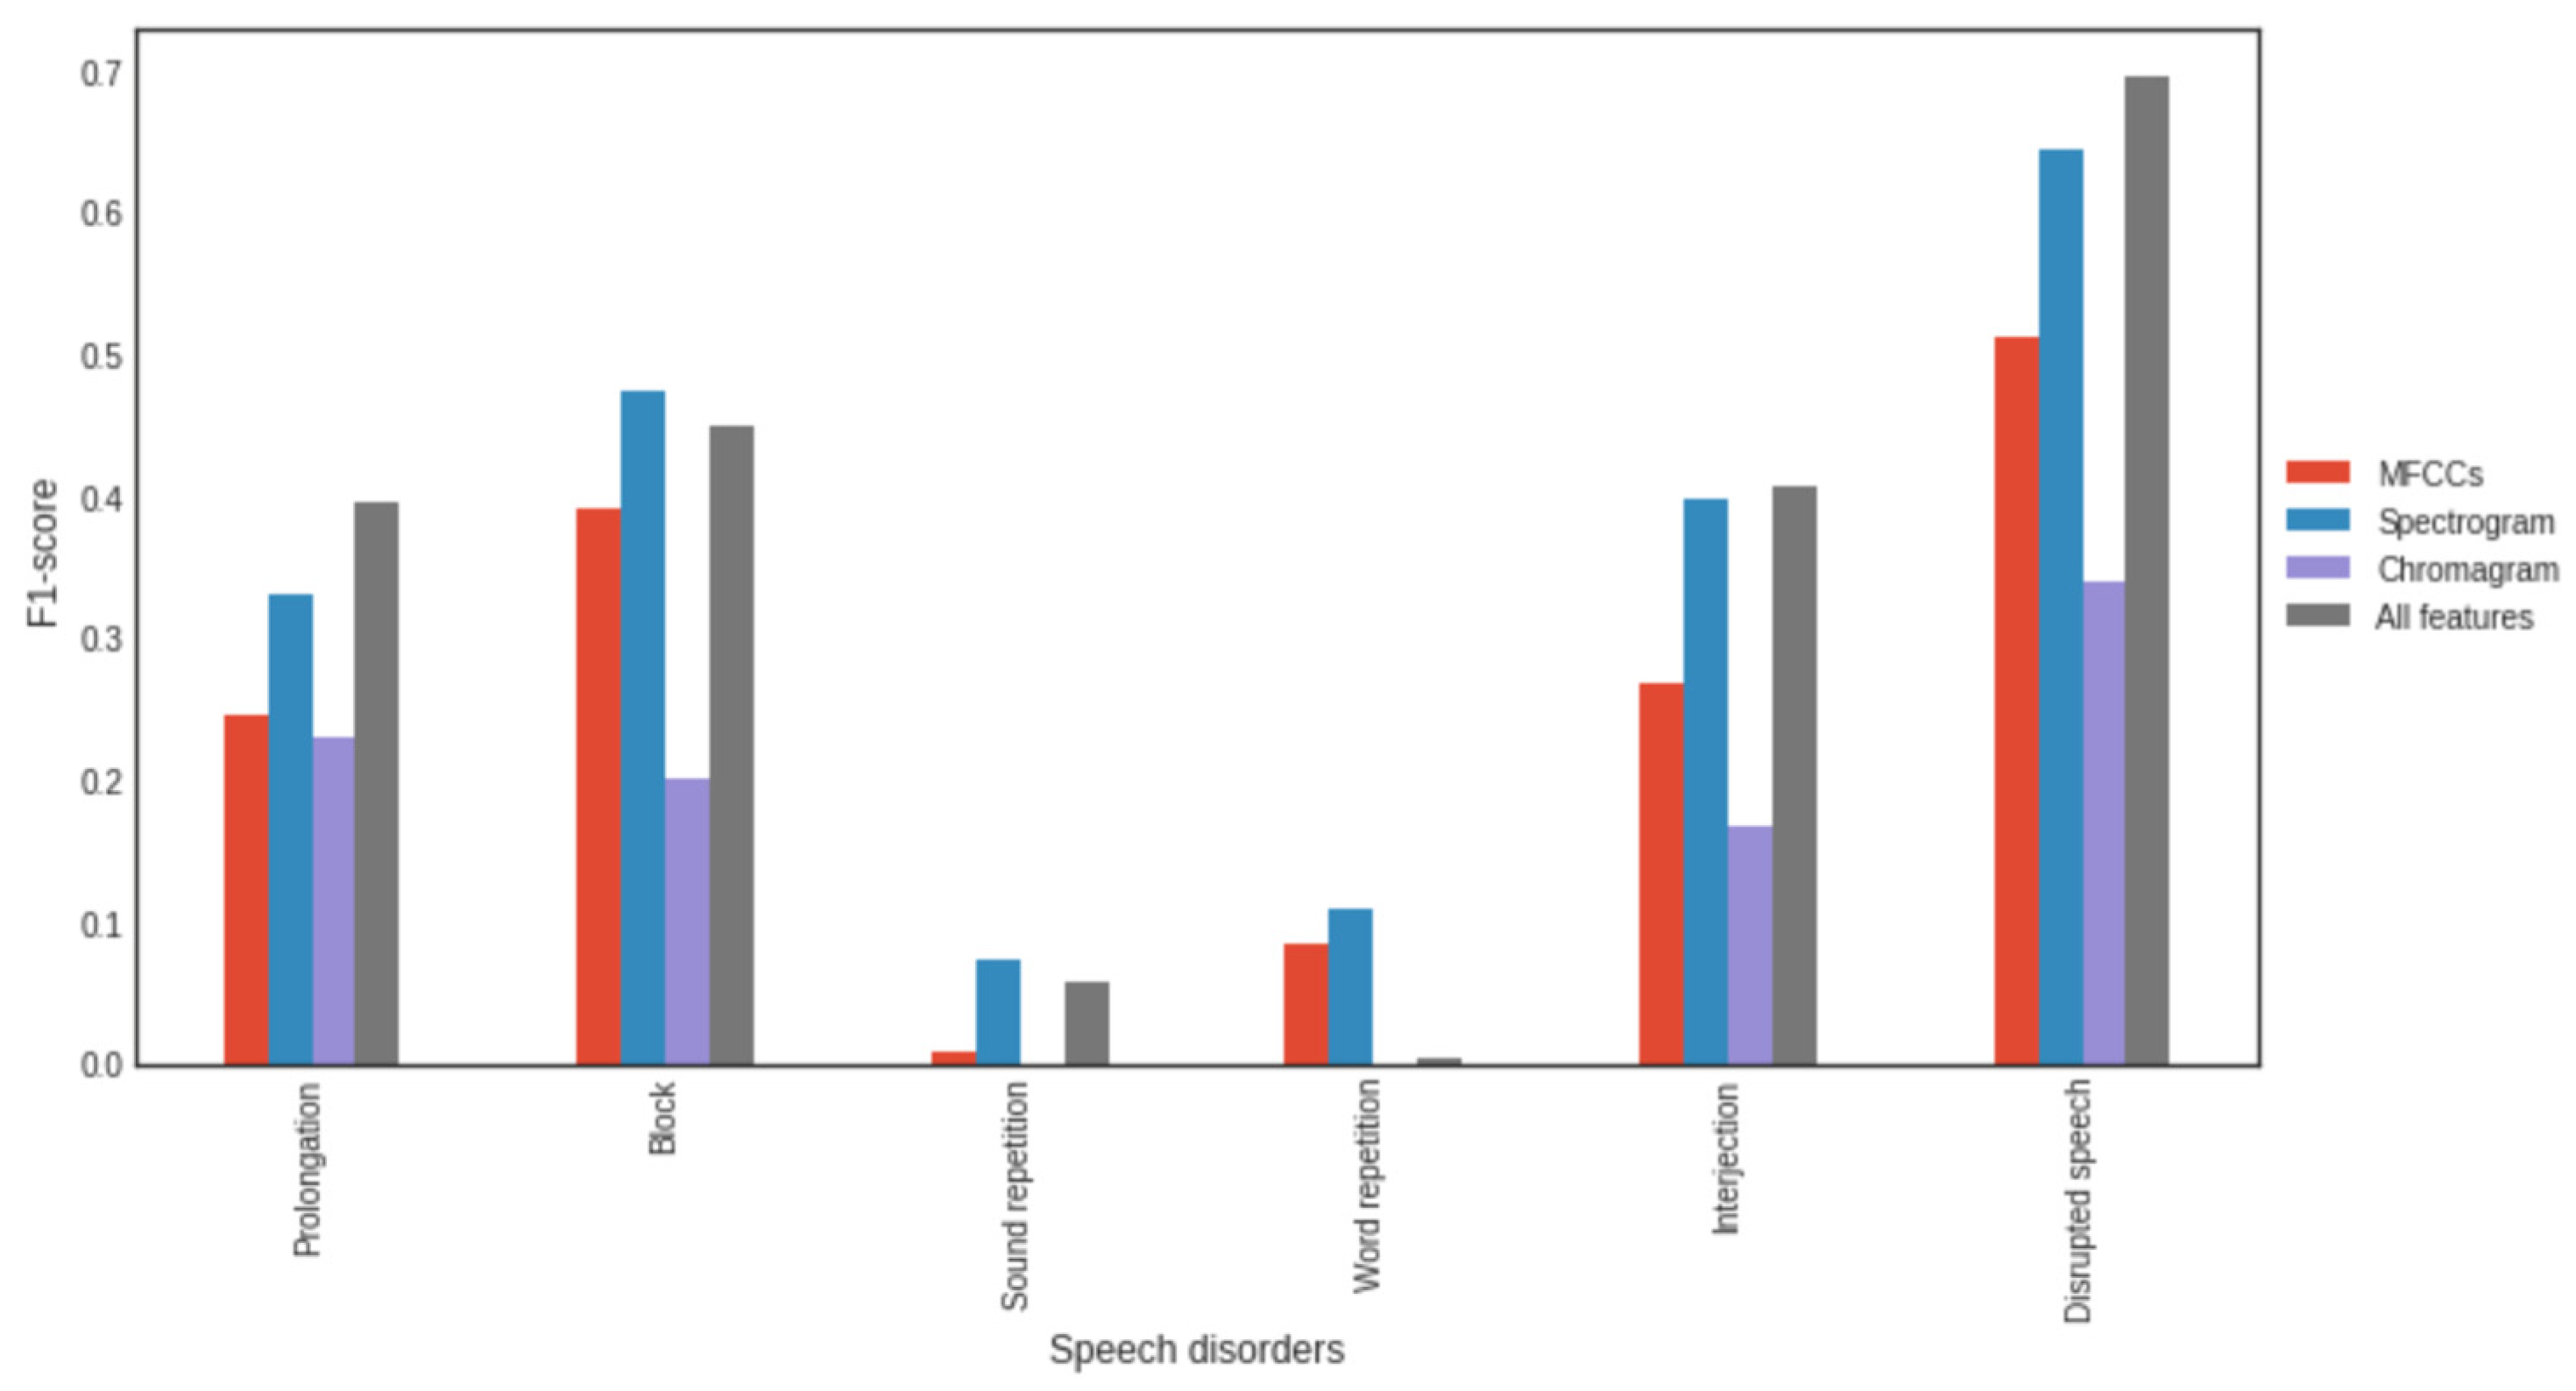
3.4. Impact of Feature Types
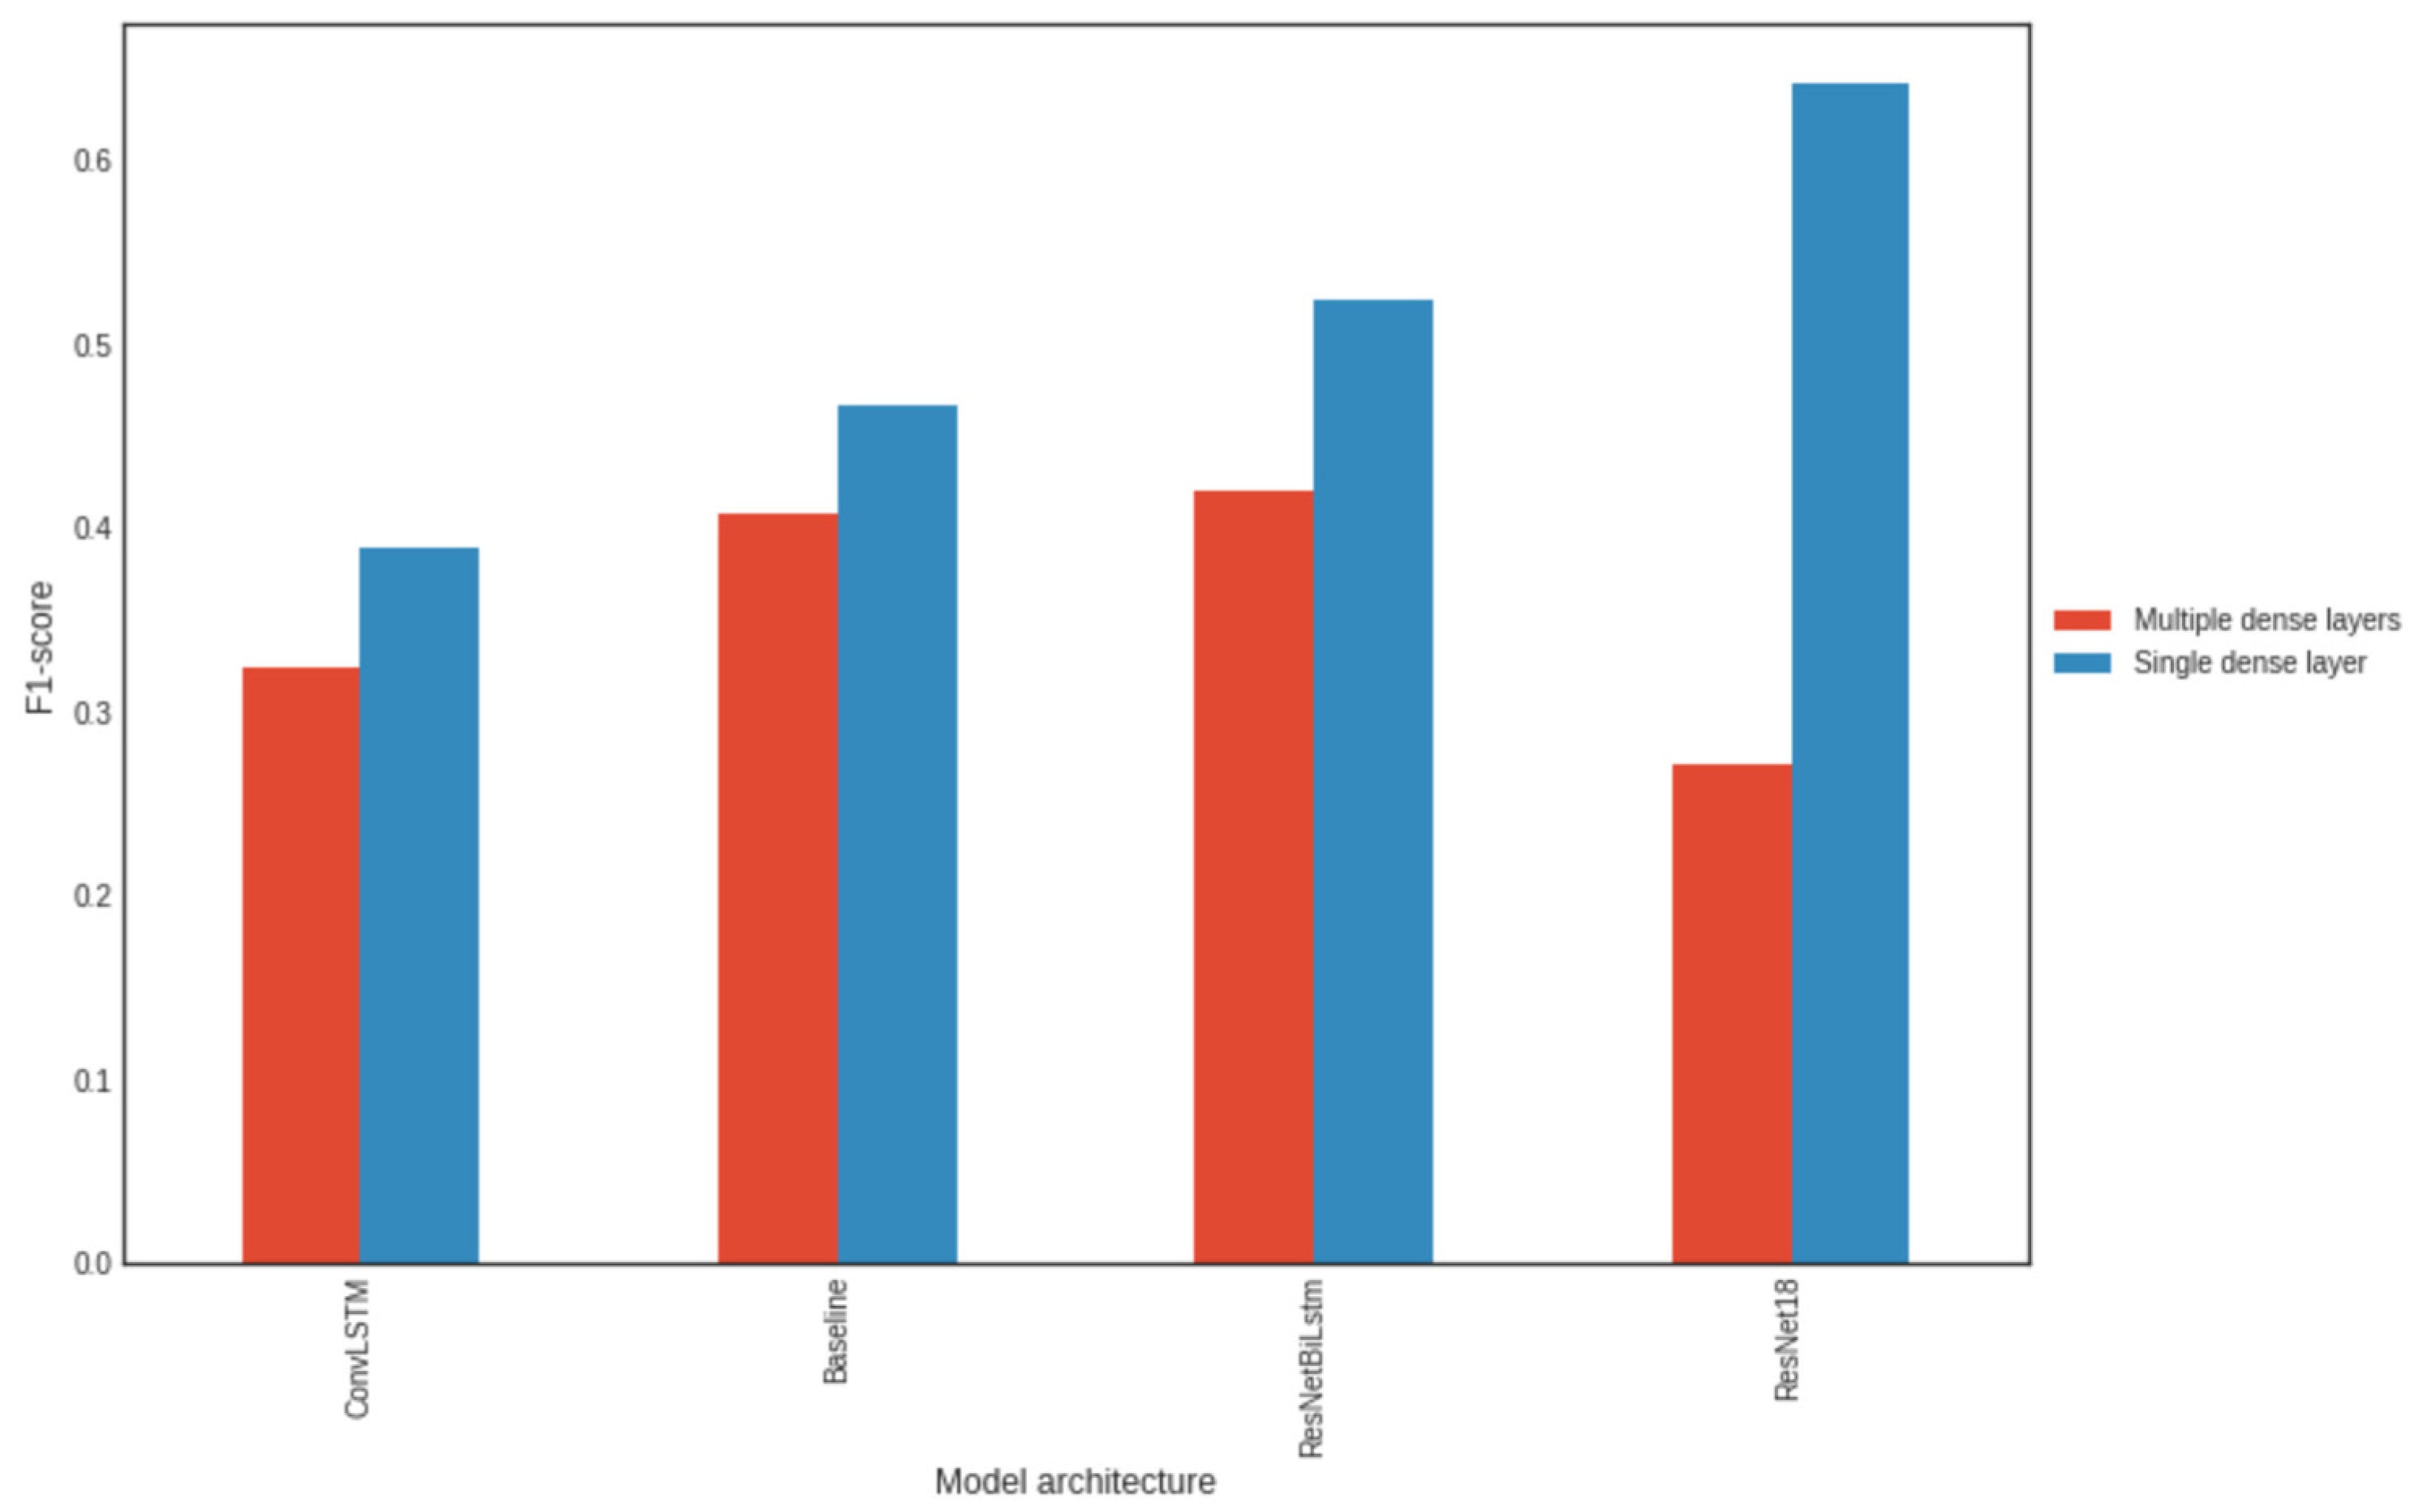
3.5. Impact of the Number of Dense Neural Layers at the End of the Model
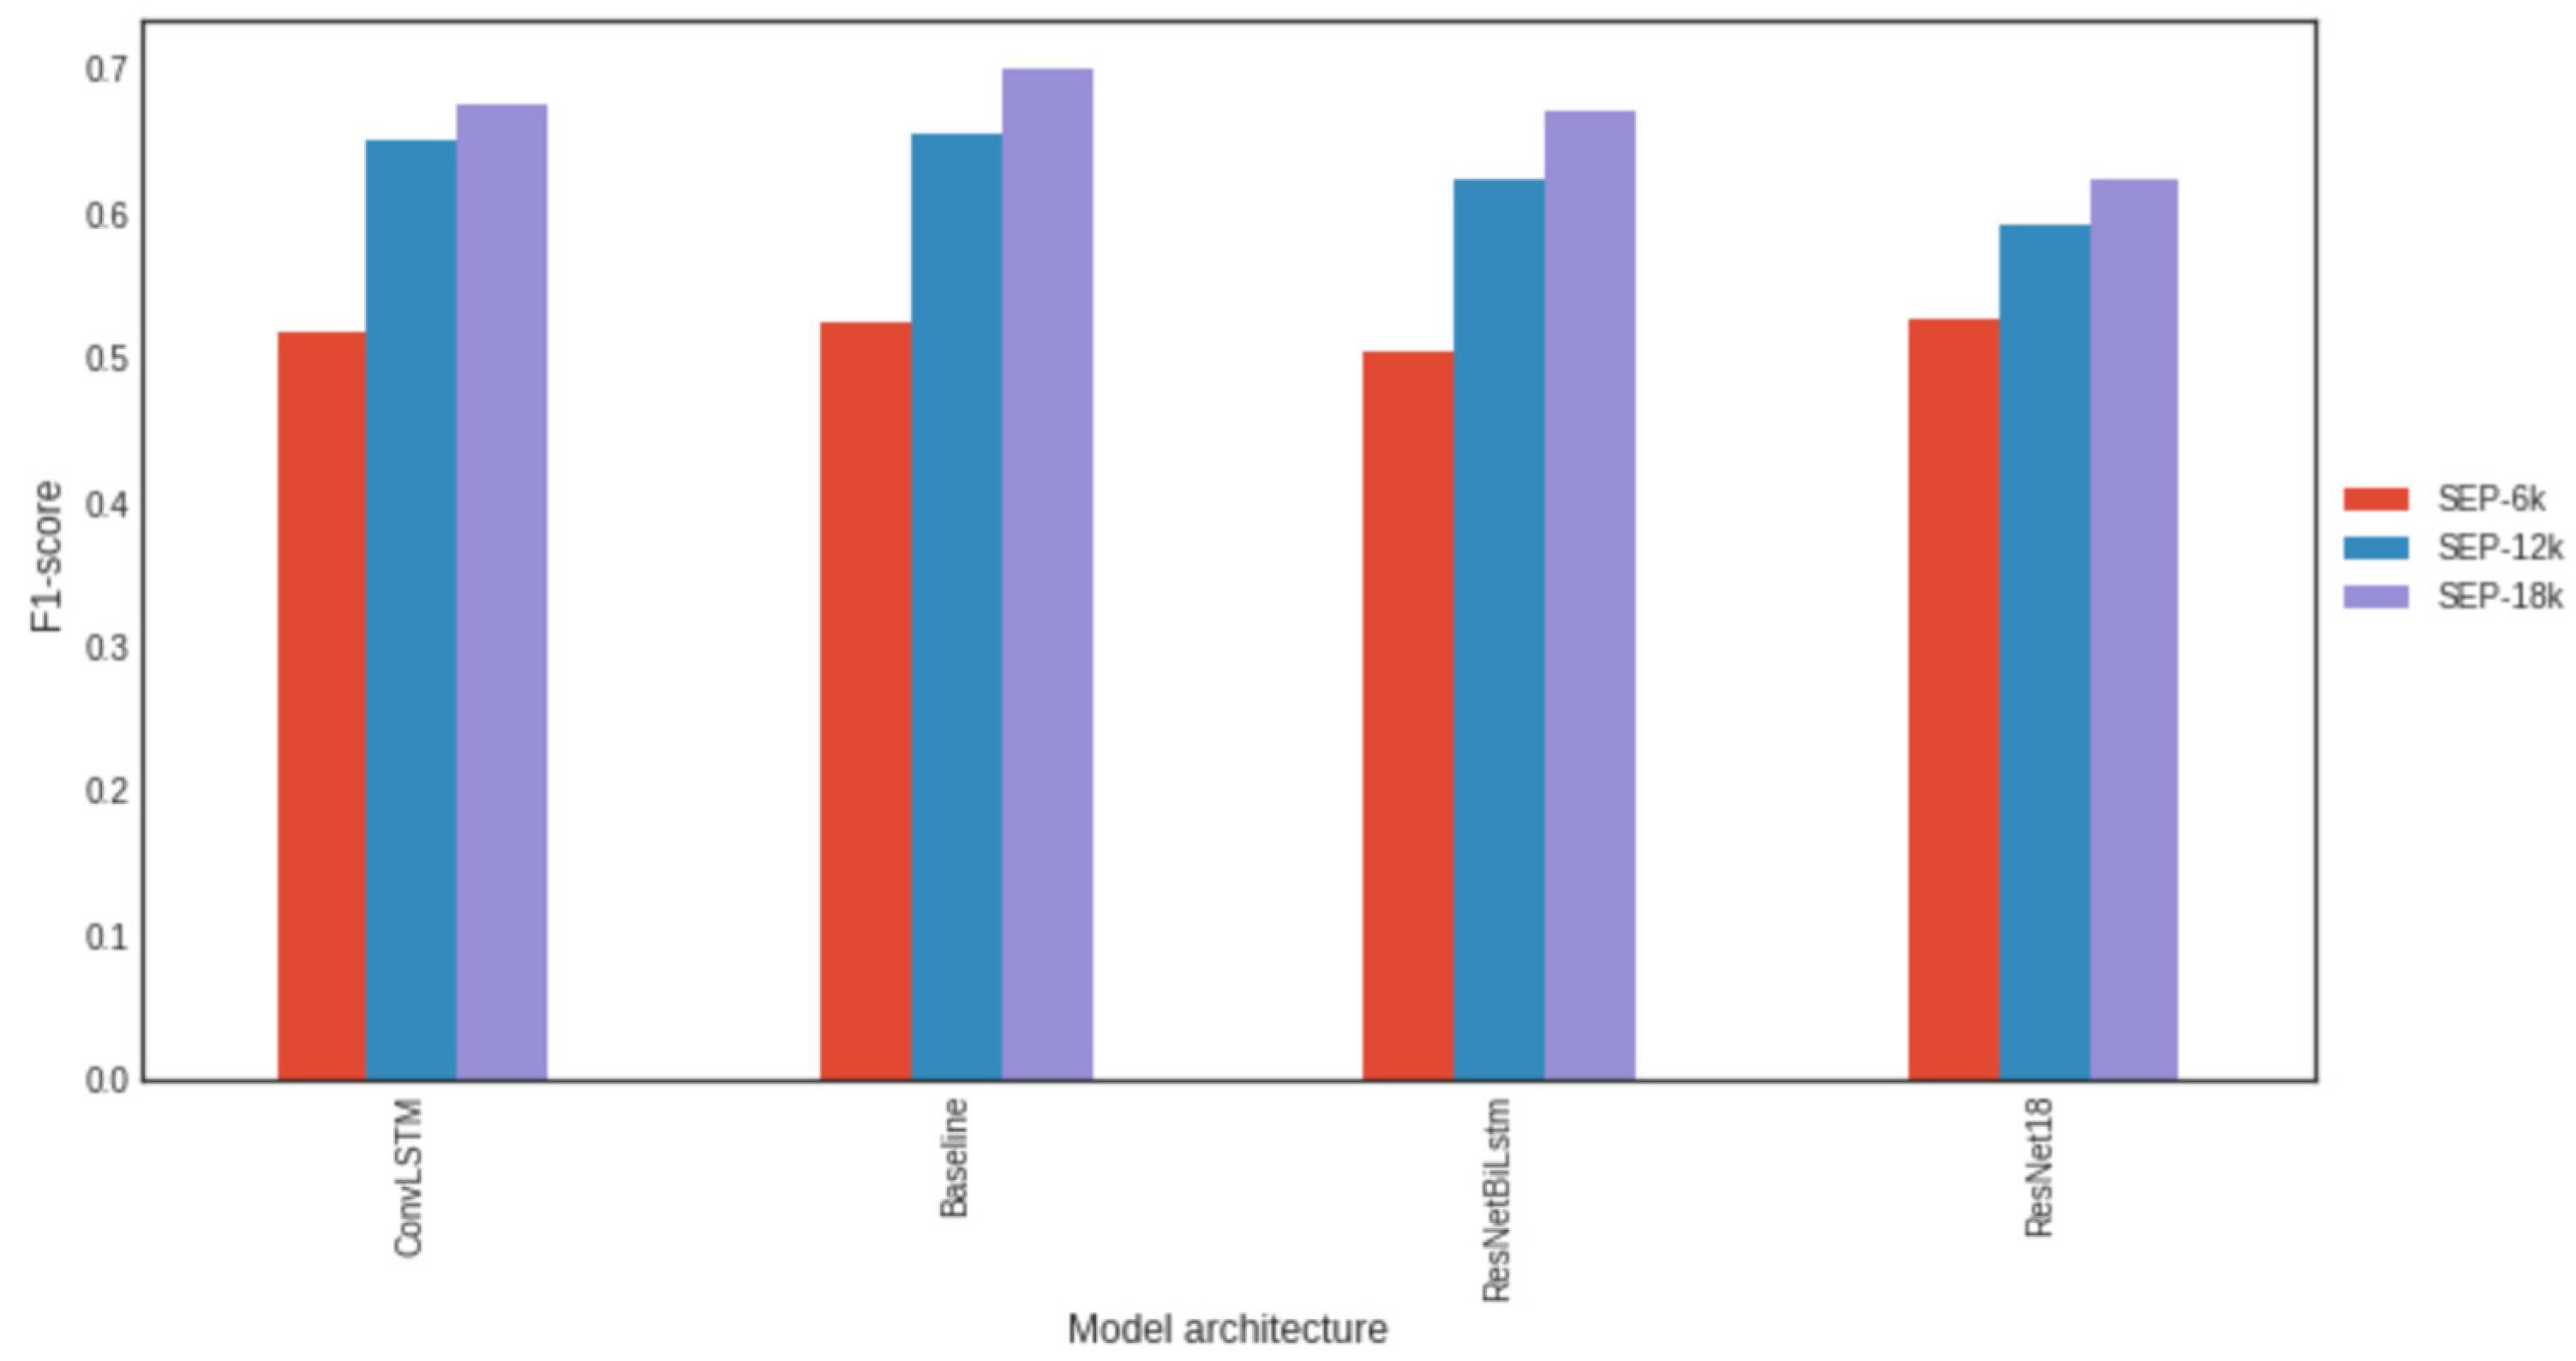
3.6. Impact of the Amount of Data in the Training Set
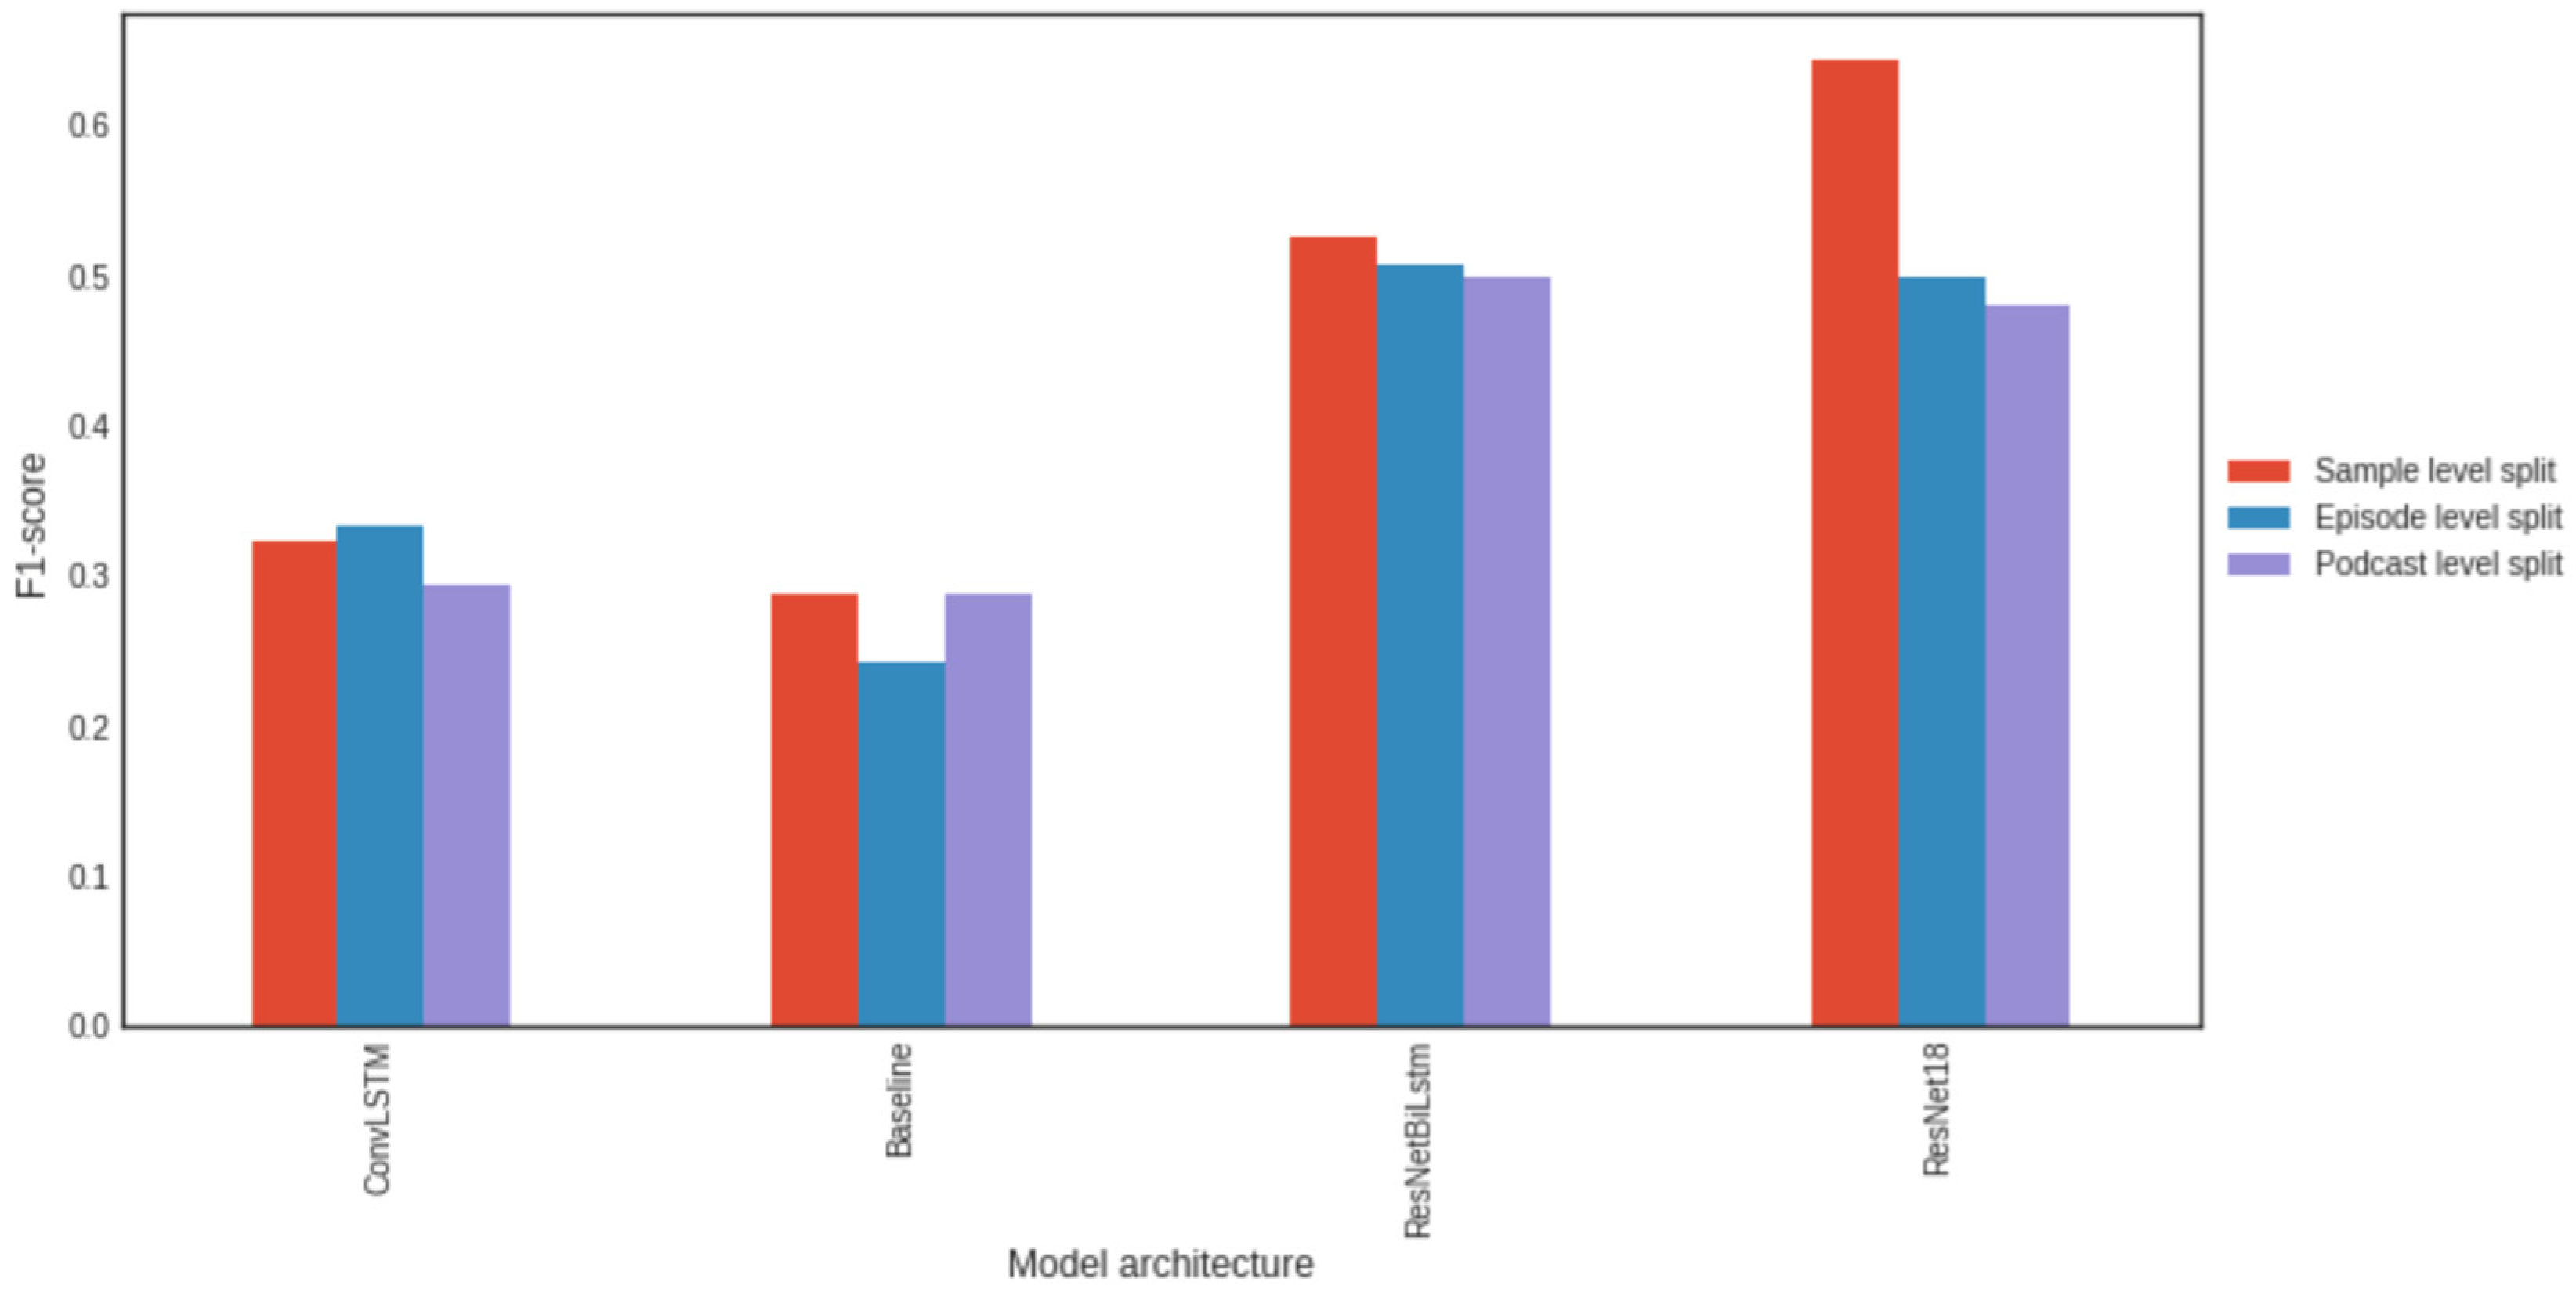
3.7. Impact of the Data Division into Training, Validation, and Test Sets
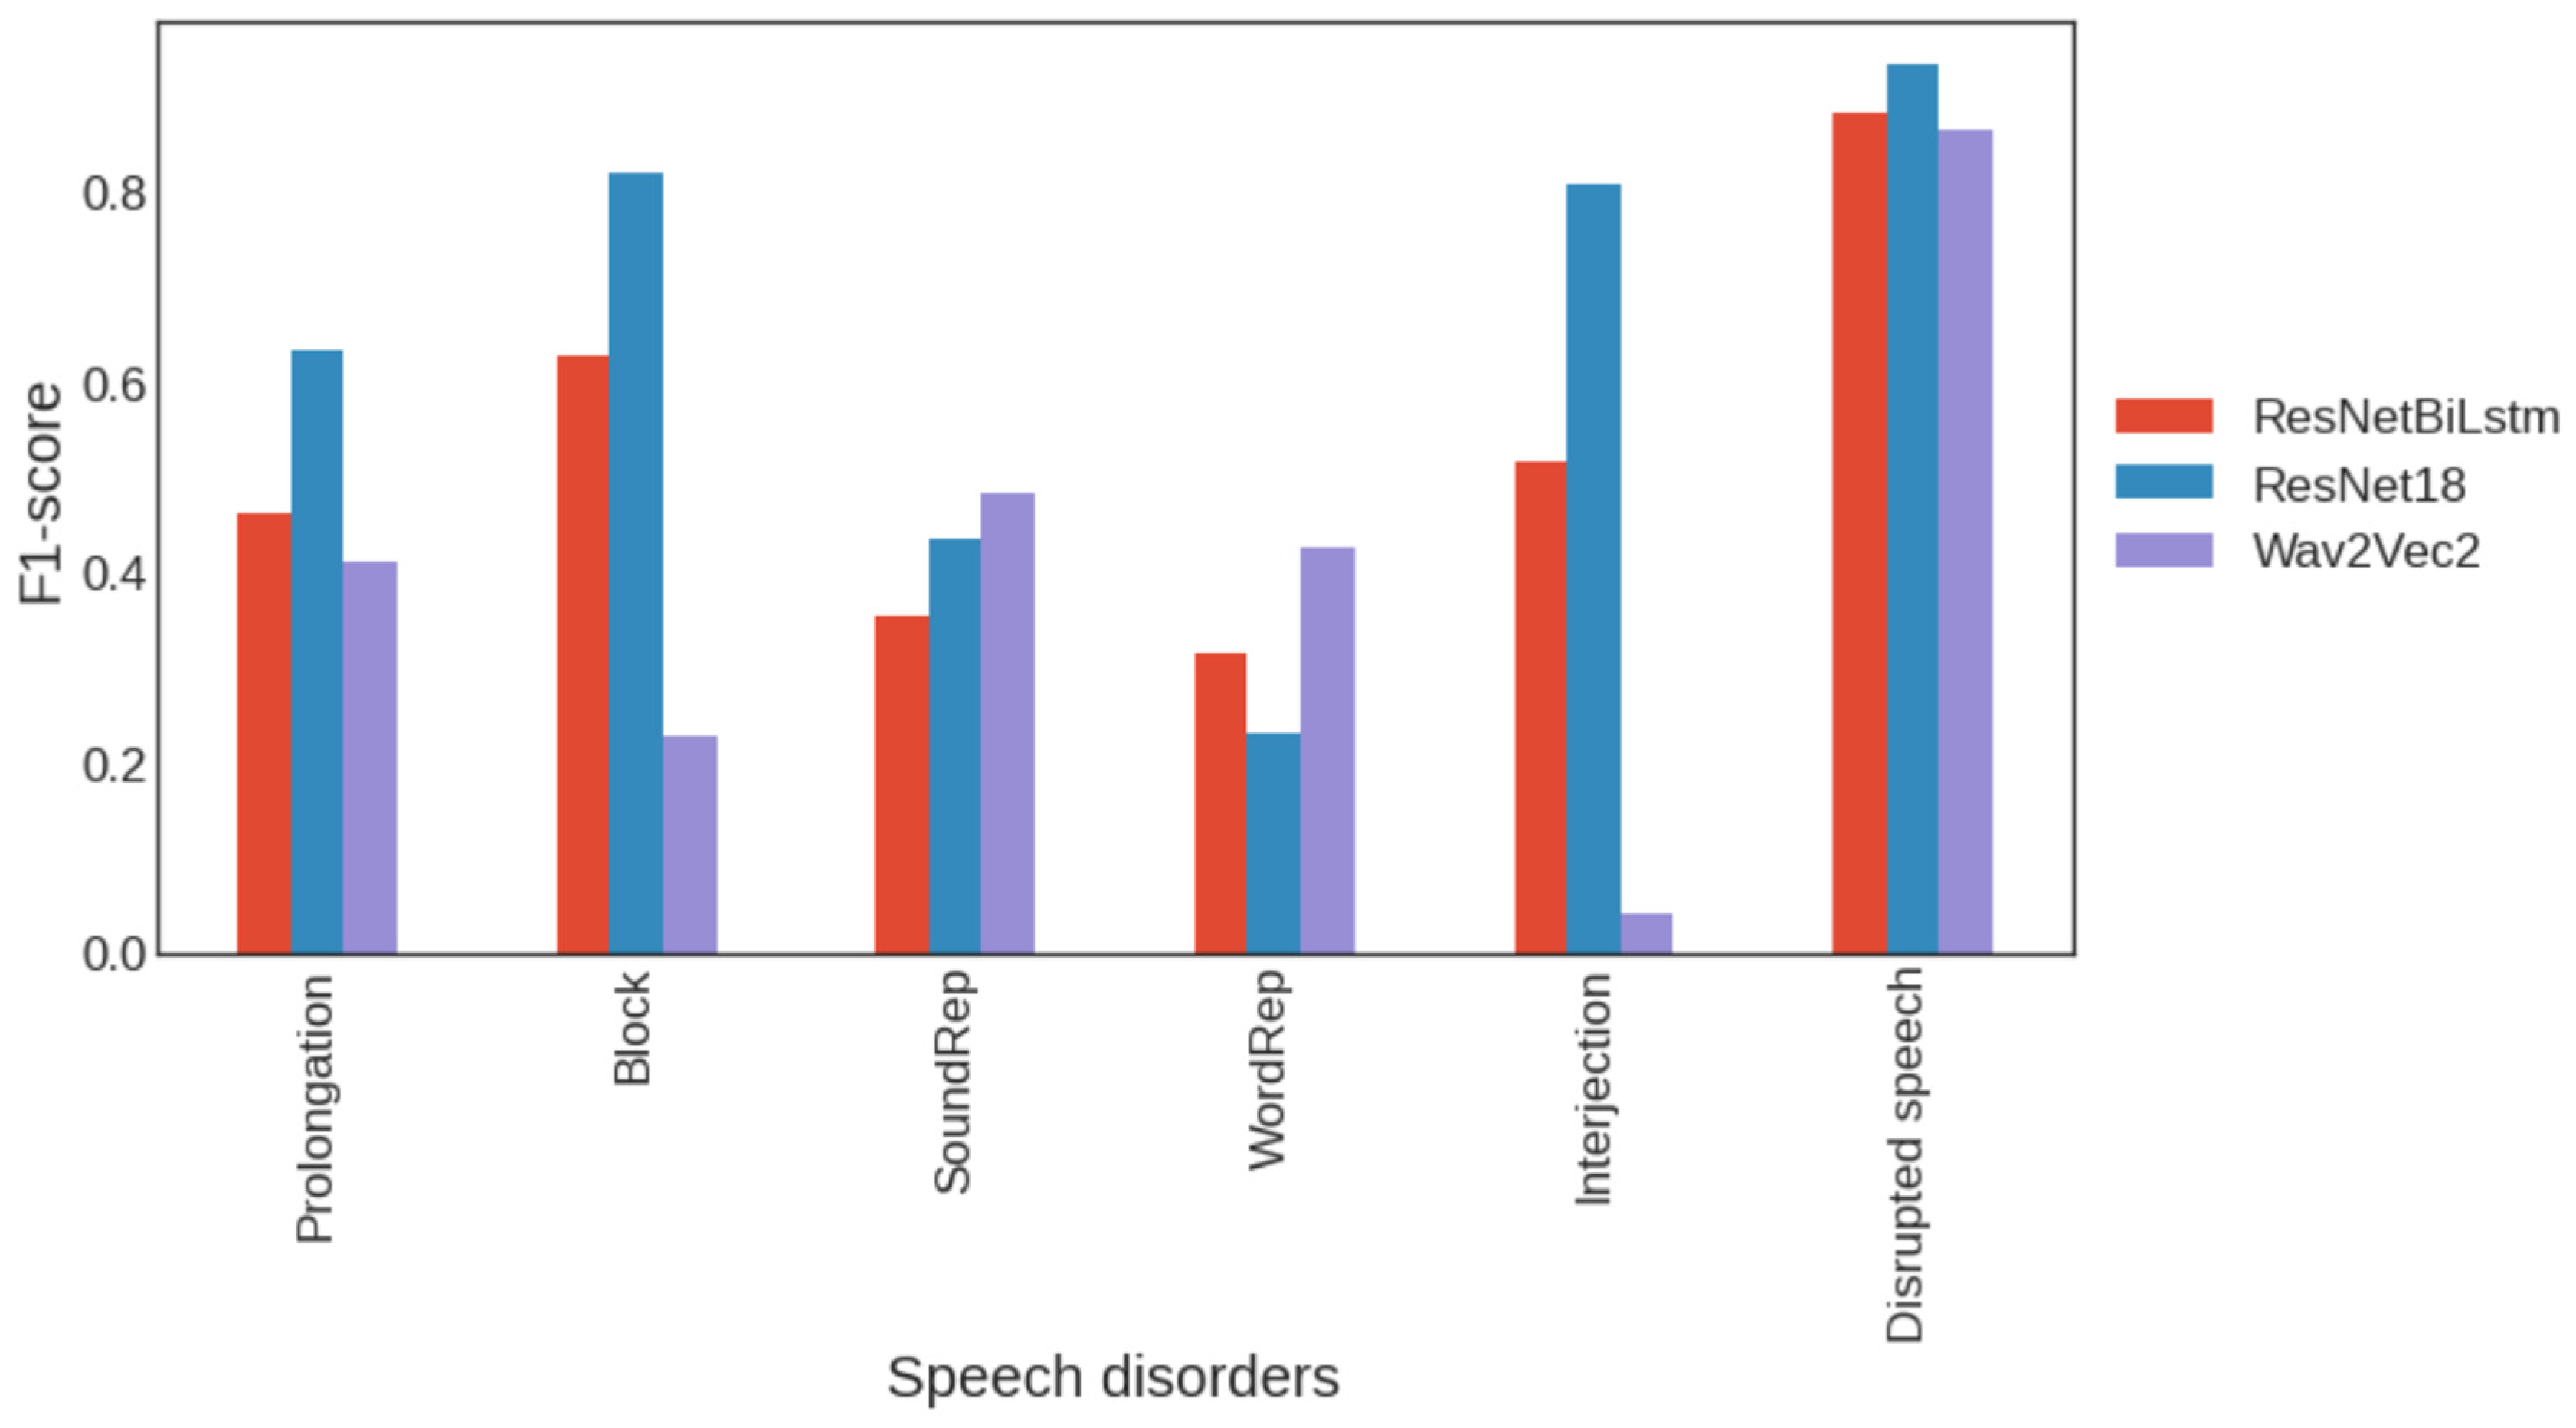
3.8. Implementation of Wav2Vec
3.9. Testing Algorithms on the FluencyBank Dataset
4. Conclusions
5. Summary
Author Contributions
Funding
Institutional Review Board Statement
Informed Consent Statement
Data Availability Statement
Conflicts of Interest
References
- Alharbi, S.; Hasan, M.; Simons, A.; Brumfitt, S.; Green, P. Sequence Labeling to Detect Stuttering Events in Read Speech. Comput. Speech Lang. 2020, 62, 101052. [Google Scholar] [CrossRef]
- Arnab, A.; Jayasumana, S.; Zheng, S.; Torr, P. Higher Order Conditional Random Fields in Deep Neural Networks. arXiv 2016. [Google Scholar] [CrossRef]
- Bhatia, G.; Saha, B.; Khamkar, M.; Chandwani, A.; Khot, R. Stutter Diagnosis and Therapy System, Based on Deep Learning. arXiv 2020, arXiv:2007.08003. [Google Scholar]
- Sheikh, S.; Sahidullah, M.; Hirsch, F.; Ouni, S. Machine Learning for Stuttering Identification: Review, Challenges and Future Directions. Neurocomputing 2022, 514, 385–402. [Google Scholar] [CrossRef]
- Korzekwa, D.; Lorenzo-Trueba, J.; Drugman, T.; Kostek, B. Computer-assisted pronunciation training—Speech synthesis is almost all you need. Speech Commun. 2022, 142, 22–33. [Google Scholar] [CrossRef]
- Li, J. Recent Advances in End-to-End Automatic Speech Recognition. arXiv 2021, arXiv:2111.01690. [Google Scholar] [CrossRef]
- Michalopoulou, Z.H.; Gerstoft, P.; Kostek, B.; Roch, M.A. Introduction to the special issue on machine learning in acoustics. J. Acoust. Soc. Am. 2021, 150, 3204–3210. [Google Scholar] [CrossRef]
- Piotrowska, M.; Korvel, G.; Kostek, B.; Ciszewski, T.; Czyżewski, A. Machine learning-based analysis of English lateral allophones. Int. J. Appl. Math. Comput. Sci. 2019, 29, 393–405. [Google Scholar] [CrossRef]
- Roch, M.A.; Gerstoft, P.; Kostek, B.; Michalopoulou, Z.H. How machine learning contributes to solve acoustical problems. J. Acoust. Soc. Am. 2021, 17, 48–57. [Google Scholar] [CrossRef]
- Howell, P.; Davis, S.; Bartrip, J. The University College London Archive of Stuttered Speech (UCLASS). J. Speech Lang. Hear. Res. 2009, 52, 556–569, Erratum in: J. Speech Lang. Hear. Res. 2010, 53, 1774. [Google Scholar] [CrossRef]
- Yairi, E.; Ambrose, N. Epidemiology of stuttering: 21st century advances. J. Fluen. Disord. 2013, 38, 66–87. [Google Scholar] [CrossRef]
- Chu, S.H.; Unicomb, R.; Lee, J.; Cho, K.S.; Louis, K.O.S.; Harrison, E.; McConnell, G. Public attitudes toward stuttering in Malaysia. J. Fluen. Disord. 2022, 74, 105942. [Google Scholar] [CrossRef]
- Wheeler, K. For People Who Stutter, the Convenience of Voice Assistant Technology Remains out of Reach, USA Today (Online). 2020. Available online: https://eu.usatoday.com/story/tech/2020/01/06/voice-assistants-remain-out-reach-people-who-stutter/2749115001/ (accessed on 4 March 2023).
- Lea, C.; Mitra, V.; Joshi, A.; Kajarekar, S.; Bigham, J. SEP-28k: A Dataset for Stuttering Event Detection from Podcasts with People Who Stutter. arXiv 2021, arXiv:2102.12394. [Google Scholar]
- Nöth, E.; Niemann, H.; Haderlein, T.; Decher, M.; Eysholdt, U.; Rosanowski, F.; Wittenberg, T. Automatic stuttering recognition using Hidden Markov models. In Proceedings of the 6th International Conference on Spoken Language Processing, Beijing, China, 16–20 October 2000. [Google Scholar]
- Wiśniewski, M.; Kuniszyk-Jóźkowiak, W.; Smołka, E.; Suszyński, W. Automatic detection of disorders with the use of Hidden Markov Model. In Computer Recognition Systems 2; Part of the Advances in Soft Computing; Springer: Berlin/Heidelberg, Germany, 2007; Volume 45, pp. 445–453. [Google Scholar] [CrossRef]
- Mahesha, P.; Vinod, D. Classification of speech disfluencies using speech parameterization techniques and multiclass svm. In Proceedings of the International Conference on Heterogeneous Networking for Quality, Reliability, Security and Robustness, Greader Noida, India, 11–12 January 2013; Springer: Berlin/Heidelberg, Germany, 2013; pp. 298–308. [Google Scholar] [CrossRef]
- Szczurowska, I.; Kuniszyk-Jóźkowiak, W.; Smołka, E. The application of Kohonen and multilayer perceptron networks in the speech nonfluency analysis. Arch. Acoust. 2014, 31, 205–210. [Google Scholar]
- Czyzewski, A.; Kaczmarek, A.; Kostek, B. Intelligent Processing of Stuttered Speech. J. Intell. Inf. Syst. 2003, 21, 143–171. [Google Scholar] [CrossRef]
- Muñoz, M.; Coto-Jiménez, M. An Experimental Study on Speech Enhancement Based on a Combination of Wavelets and Deep Learning. Computation 2022, 10, 102. [Google Scholar] [CrossRef]
- Doras, G.; Teytaut, Y.; Roebel, A. A Linear Memory CTC-Based Algorithm for Text-to-Voice Alignment of Very Long Audio Recordings. Appl. Sci. 2023, 13, 1854. [Google Scholar] [CrossRef]
- Hariharan, M.; Fook, C.Y.; Sindhu, R.; Adom, A.H.; Yaacob, S. Objective evaluation of speech dysfluencies using wavelet packet transform with sample entropy. Digit. Signal Process. 2013, 23, 952–959. [Google Scholar] [CrossRef]
- Yeh, P.H.; Yang, S.L.; Yang, C.C.; Shieh, M.D. Automatic Recognition of Repetitions in Stuttered Speech: Using End-Point Detection and Dynamic Time Warping. Procedia Soc. Behav. Sci. 2017, 193, 356. [Google Scholar] [CrossRef]
- Banerjee, N.; Borah, S.; Sethi, N. Intelligent stuttering speech recognition: A succinct review. Multimed. Tools Appl. 2022, 81, 24145–24166. [Google Scholar] [CrossRef]
- Sheikh, S.; Sahidullah, M.; Hirsch, F.; Ouni, S. StutterNet: Stuttering Detection Using Time Delay Neural Network. In Proceedings of the 2021 29th European Signal Processing Conference (EUSIPCO), Dublin, Ireland, 23–27 August 2021. [Google Scholar] [CrossRef]
- Zayats, V.; Ostendorf, M.; Hajishirzi, H. Disfluency detection using a bidirectional LSTM. In Proceedings of the Interspeech 2016, San Francisco, CA, USA, 8–12 September 2016; pp. 2523–2527. [Google Scholar] [CrossRef]
- Chen, Q.; Chen, M.; Li, B.; Wang, W. Controllable time-delay transformer for real-time punctuation prediction and disfluency detection. In Proceedings of the 2020 IEEE International Conference on Acoustics, Speech and Signal Processing (ICASSP), Barcelona, Spain, 4–8 May 2020; pp. 8069–8073. [Google Scholar] [CrossRef]
- Fleiss, J. Measuring nominal scale agreement among many raters. Psychol. Bull. 1971, 76, 378–382. [Google Scholar] [CrossRef]
- Panayotov, V.; Chen, G.; Povey, D.; Khudanpur, S. Librispeech: An ASR corpus based on public domain audio books. In Proceedings of the 2015 IEEE International Conference on Acoustics, Speech and Signal Processing (ICASSP), South Brisbane, QLD, Australia, 19–24 April 2015. [Google Scholar]
- Rudicz, F.; Namasivayam, A.; Wolff, T. The TORGO database of acoustic and articulatory speech from speakers with dysarthria. Lang. Resour. Eval. 2010, 46, 523–541. [Google Scholar] [CrossRef]
- FluencyBank Database. Available online: https://fluency.talkbank.org/access/Voices-CWS.html (accessed on 4 March 2023).
- Kourkounakis, T.; Hajavi, A.; Etemad, A. FluentNet: End-to-End Detection Of Speech Disfluency with Deep Learning. arXiv 2020, arXiv:2009.11394. [Google Scholar]
- Tan, T.; Ariff, A.; Ting, C.; Salleh, S. Application of Malay speech technology in Malay speech therapy assistance tools. In Proceedings of the 2007 International Conference on Intelligent and Advanced Systems, Kuala Lumpur, Malaysia, 25–27 November 2007; pp. 330–334. [Google Scholar]
- Korvel, G.; Kostek, B. Comparison of Lithuanian and Polish Consonant Phonemes Based on Acoustic Analysis—Preliminary Results. Arch. Acoust. 2019, 44, 693–707. [Google Scholar] [CrossRef]
- Mporas, I.; Ganchev, T.; Siafarikas, M.; Fakotakis, N. Comparison of Speech Features on the Speech Recognition Task. J. Comput. Sci. 2007, 3, 608–616. [Google Scholar] [CrossRef]
- Gupta, H.; Gupta, D. LPC and LPCC method of feature extraction in Speech Recognition System. Proceedings of 2016 6th International Conference—Cloud System and Big Data Engineering (Confluence), Noida, India, 14–15 January 2016; pp. 498–502. [Google Scholar] [CrossRef]
- Ravikumar, K.; Rajagopal, R.; Nagaraj, H. An approach for objective assessment of stuttered speech using MFCC. ICGST Int. J. Digit. Signal Process. 2009, 9, 19–24. [Google Scholar]
- Pálfy, J.; Pospíchal, J. Recognition of repetitions using support vector machines. In Proceedings of the IEEE Signal Processing Algorithms, Architectures, Arrangements, and Applications SPA 2011, Poznan, Poland, 29–30 September 2011; pp. 1–6. [Google Scholar]
- Chee, L.; Chia, A.O.; Hariharan, M.; Sazali, Y. MFCC based recognition of repetitions and prolongations in stuttered speech using k-nn and lda. In Proceedings of the 2009 IEEE Student Conference on Research and Development (SCOReD), Serdang, Malaysia, 16–18 November 2009; pp. 146–149. [Google Scholar] [CrossRef]
- Chee, L.; Chia, A.O.; Hariharan, M.; Sazali, Y. Automatic detection of prolongations and repetitions using LPCC. In Proceedings of the 2009 International Conference for Technical Postgraduates (TECHPOS), Kuala Lumpur, Malaysia, 14–15 December 2009; pp. 1–4. [Google Scholar]
- Ghonem, S.; Abdou, S.; Esmael, M.; Ghamry, N. Classification of stuttering events using i-vector. Egypt. J. Lang. Eng. 2017, 4, 11–19. [Google Scholar] [CrossRef]
- Howell, P.; Sackin, S.; Glenn, K. Development of a two-stage procedure for the automatic recognition of dysfluencies in the speech of children who stutter: II. ANN recognition of repetitions and prolongations with supplied word segment markers. J. Speech Lang. Hear. Res. 1997, 40, 1085–1096. [Google Scholar] [CrossRef]
- Geetha, Y.; Pratibha, K.; Ashok, R.; Ravindra, S. Classification of childhood disfluencies using neural networks. J. Fluen. Disord. 2000, 25, 99–117. [Google Scholar] [CrossRef]
- Mahesha, P.; Vinod, D. LP-Hilbert transform based MFCC for effective discrimination of stuttering dysfluencies. In Proceedings of the 2017 International Conference on Wireless Communications, Signal Processing and Networking (WiSPNET), Chennai, India, 22–24 March 2017; pp. 2561–2565. [Google Scholar]
- Bayerl, S.P.; Wagner, D.; Nöth, E.; Bocklet, T.; Riedhammer, K. The Influence of Dataset Partitioning on Dysfluency Detection Systems. In Text, Speech, and Dialogue; TSD 2022; Lecture Notes in Computer Science; Sojka, P., Horák, A., Kopeček, I., Pala, K., Eds.; Springer: Cham, Switzerland, 2022; Volume 13502. [Google Scholar] [CrossRef]
- Sheikh, S.A.; Sahidullah, M.; Hirsch, F.; Ouni, S. Robust Stuttering Detection via MULTI-task and Adversarial Learning. In Proceedings of the 30th European Signal Processing Conference (EUSIPCO), Belgrade, Serbia, 29 August–2 September 2022; pp. 190–194. [Google Scholar] [CrossRef]
- Sheikh, S.A.; Sahidullah, M.; Hirsch, F.; Ouni, S. Advancing Stuttering Detection via Data Augmentation, Class-Balanced Loss and Multi-Contextual Deep Learning. IEEE J. Biomed. Health Inform. 2023, 27, 2553–2564. [Google Scholar] [CrossRef]
- Jolliffe, T.; Cadima, J. Principal component analysis: A review and recent developments. Philos. Trans. R. Soc. A 2016, 374, 20150202. [Google Scholar] [CrossRef]
- Ganchev, T.; Fakotakis, N.; Kokkinakis, G. Comparative evaluation of various MFCC implementations on the speaker verification task Archived 2011-07-17 at the Wayback Machine. In Proceedings of the 10th International Conference on Speech and Computer (SPECOM 2005), Patras, Greece, 17–19 October 2005; Volume 1, pp. 191–194. [Google Scholar]
- Korvel, G.; Treigys, P.; Tamulevicius, G.; Bernataviciene, J.; Kostek, B. Analysis of 2D Feature Spaces for Deep Learning-Based Speech Recognition. J. Audio Eng. Soc. 2018, 66, 1072–1081. [Google Scholar] [CrossRef]
- Müller, M.; Kurth, F.; Clausen, M. Audio Matching via Chroma-Based Statistical Features. In Proceedings of the International Conference on Music Information Retrieval (ISMIR), London, UK, 11–15 September 2005; pp. 288–295. [Google Scholar]
- Alías, F.; Socoró, J.C.; Sevillano, X. A Review of Physical and Perceptual Feature Extraction Techniques for Speech, Music and Environmental Sounds. Appl. Sci. 2016, 6, 143. [Google Scholar] [CrossRef]
- Zhu, Y.; Kankanhalli, M.S. Precise pitch profile feature extraction from musical audio for key detection. IEEE Trans. Multimedia 2006, 8, 575–584. [Google Scholar] [CrossRef]
- Baevski, A.; Zhou, H.; Abdelrahman, M.; Auli, M. wav2vec 2.0: A Framework for Self-Supervised Learning of Speech Representations. In Proceedings of the 34th Conference on Neural Information Processing Systems (NeurIPS 2020), Vancouver, Canada, 6–12 December 2020; pp. 12449–12460. [Google Scholar]


| Classes Related to Stuttering | Frequency of Occurrence [%] |
|---|---|
| Breaks | 12 |
| Prolongations | 10 |
| Repetitions of sounds | 8.3 |
| Repetitions of words or whole phrases | 9.8 |
| Any disruption of speech | 44.1 |
| Interjection | 21.2 |
| Classes not related to speech impairment | Frequency of occurrence [%] |
| Natural pause in speech | 8.5 |
| Unintelligible speech | 3.7 |
| Uncertainty of the evaluator | 0.1 |
| Lack of speech | 1.1 |
| Poor audio quality | 2.1 |
| Audible music | 1.1 |
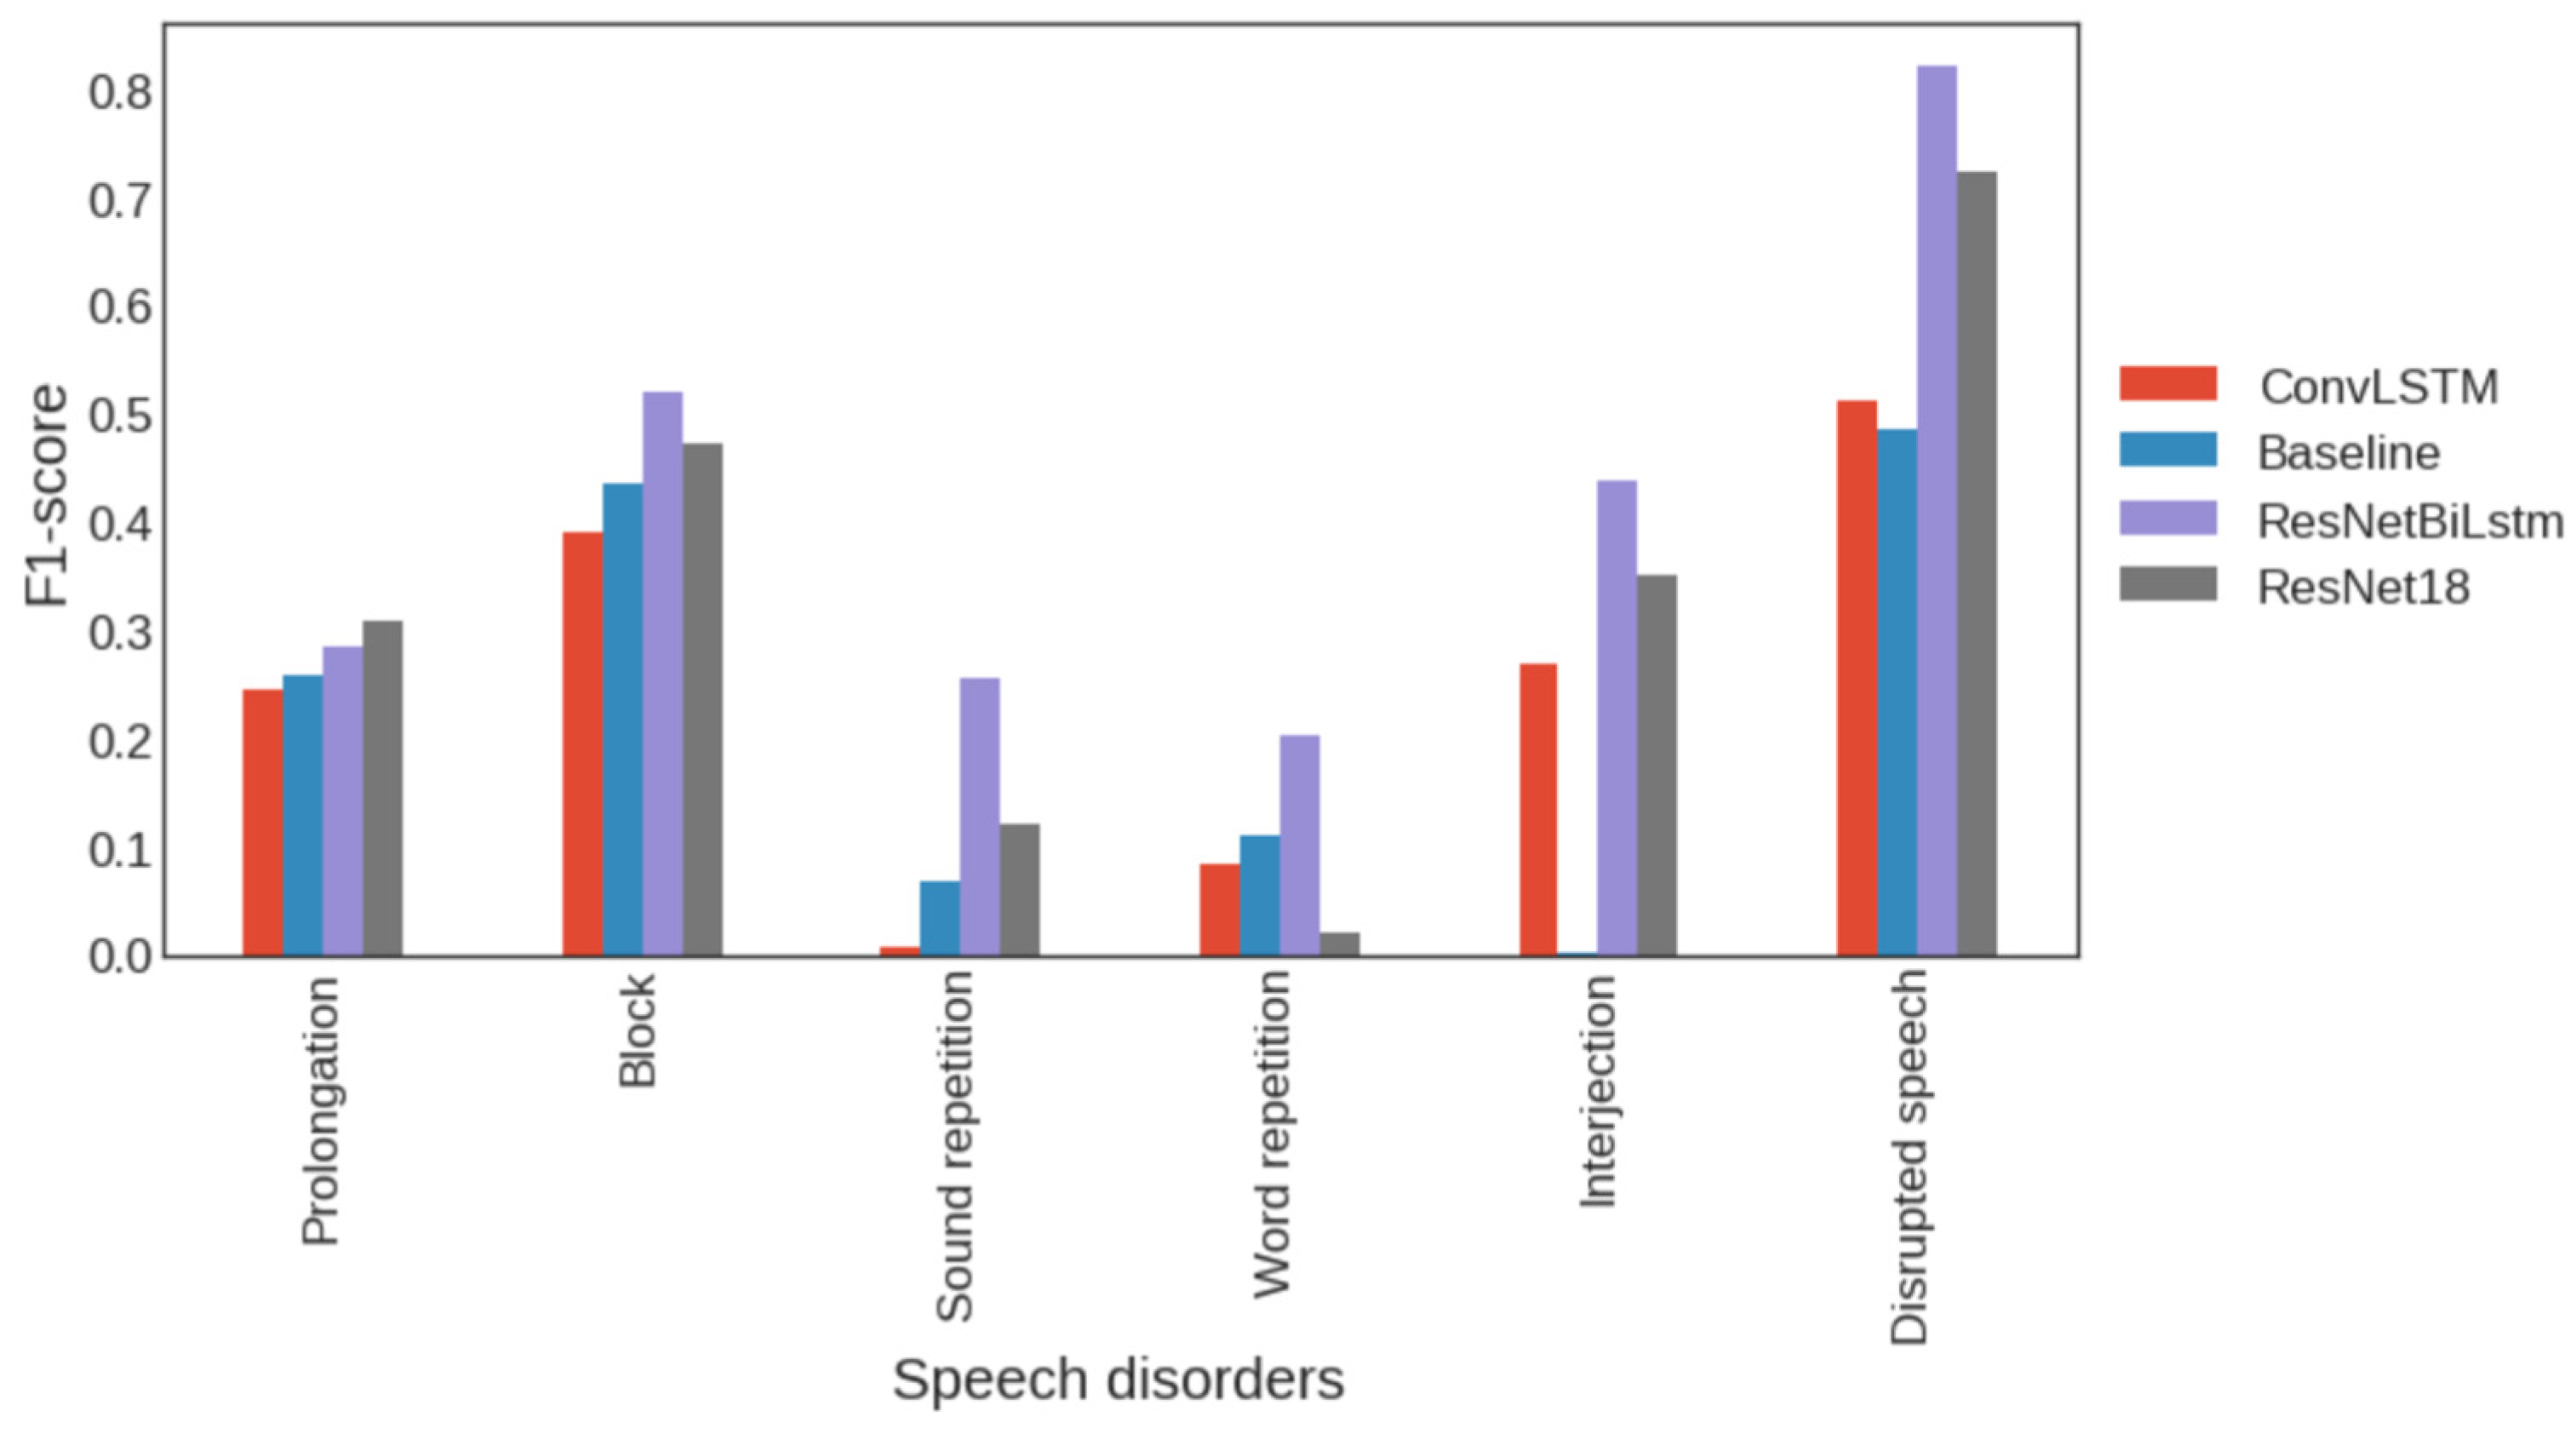
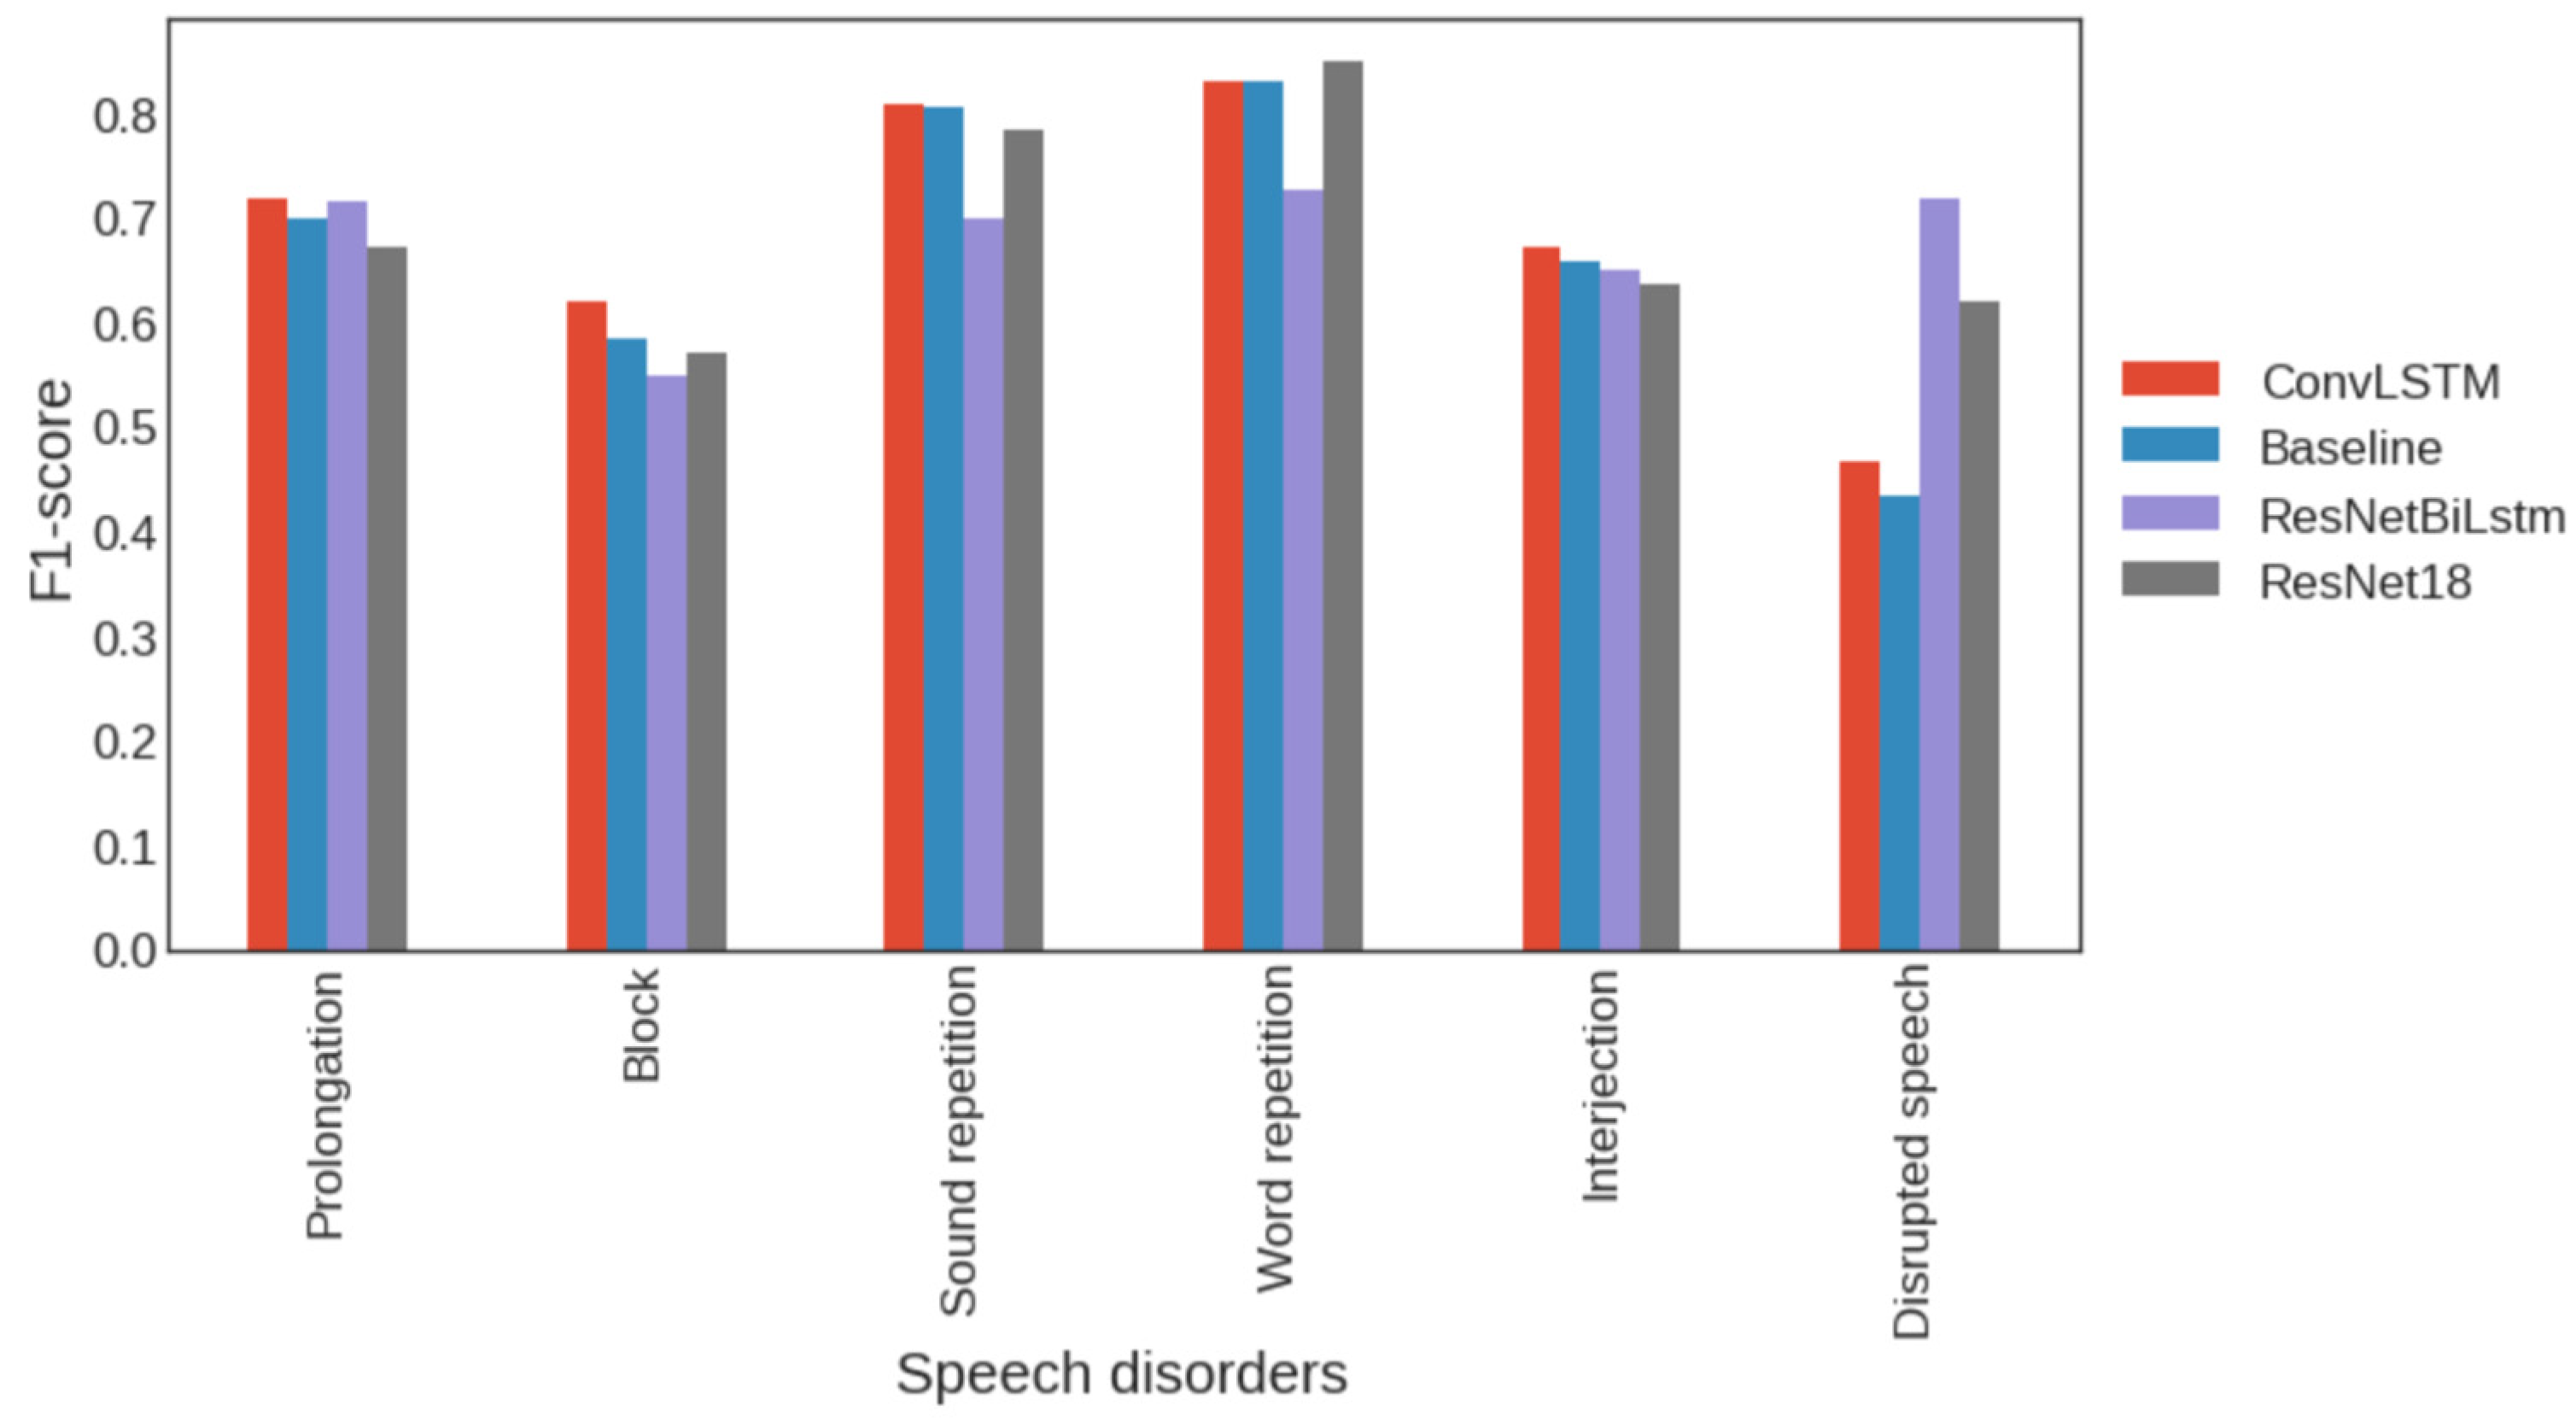
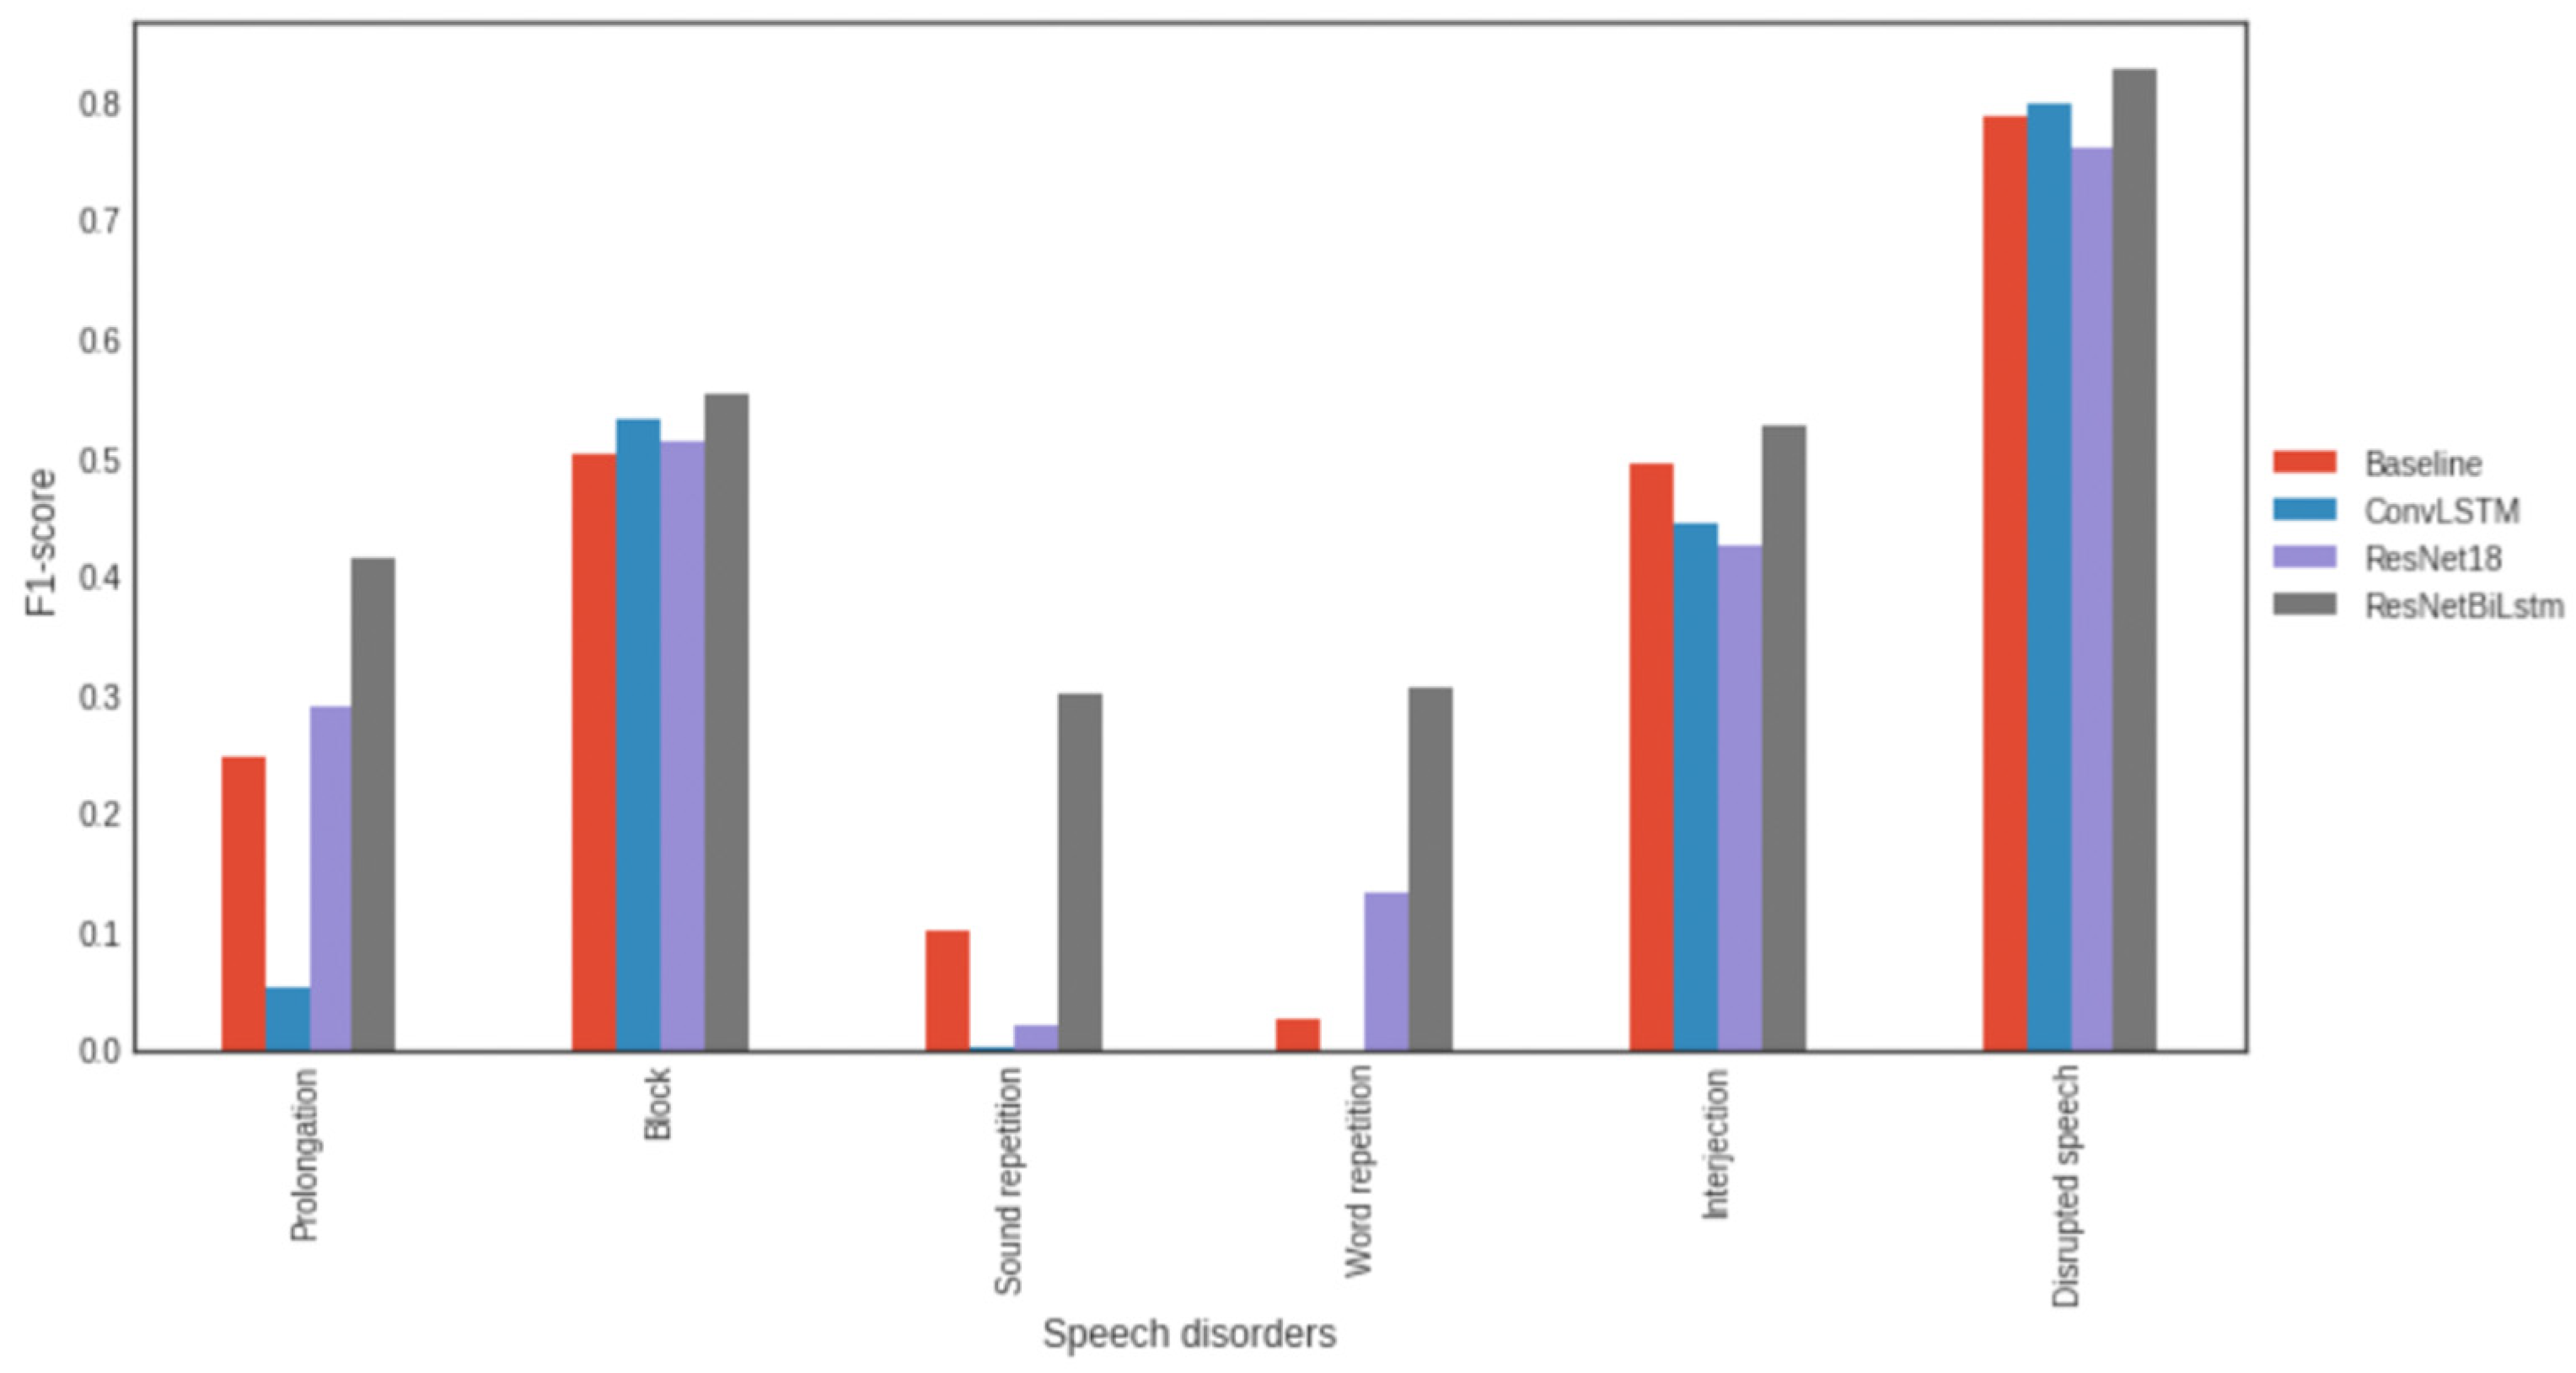
| Baseline | Prolongation | Block | Sound Repetition | Word Repetition | Interjection | Disrupted Speech |
|---|---|---|---|---|---|---|
| F1-score | 0.258863 | 0.436660 | 0.067591 | 0.109167 | 0.002066 | 0.486504 |
| Accuracy | 0.699432 | 0.583392 | 0.805891 | 0.828957 | 0.657204 | 0.432931 |
| ConvLSTM | Prolongation | Block | Sound repetition | Word repetition | Interjection | Disrupted speech |
| F1-score | 0.245714 | 0.390687 | 0.007286 | 0.083751 | 0.268041 | 0.512953 |
| Accuracy | 0.718950 | 0.619233 | 0.806600 | 0.828957 | 0.672463 | 0.466288 |
| ResNetBiLstm | Prolongation | Block | Sound repetition | Word repetition | Interjection | Disrupted speech |
| F1-score | 0.283465 | 0.519135 | 0.256705 | 0.203620 | 0.438048 | 0.845312 |
| Accuracy | 0.716290 | 0.549493 | 0.697584 | 0.725643 | 0.650039 | 0.746687 |
| ResNet18 | Prolongation | Block | Sound repetition | Word repetition | Interjection | Disrupted speech |
| F1-score | 0.307692 | 0.472831 | 0.120635 | 0.020202 | 0.349515 | 0.835989 |
| Accuracy | 0.670304 | 0.568979 | 0.784100 | 0.848792 | 0.634451 | 0.727202 |
| Split Variant | Class | Train | Val | Test |
|---|---|---|---|---|
| Split by samples | Prolongation | 6849 | 850 | 847 |
| Block | 9626 | 1183 | 1161 | |
| Sound repetition | 4485 | 582 | 547 | |
| Word repetition | 3694 | 445 | 482 | |
| Interjection | 7770 | 921 | 967 | |
| Split by episode | Prolongation | 6941 | 787 | 715 |
| Block | 9522 | 1156 | 1132 | |
| Sound repetition | 4507 | 529 | 515 | |
| Word repetition | 3678 | 441 | 444 | |
| Interjection | 7680 | 981 | 873 | |
| Split by show | Prolongation | 5723 | 1486 | 1353 |
| Block | 7848 | 2093 | 2027 | |
| Sound repetition | 4120 | 589 | 903 | |
| Word repetition | 3270 | 420 | 931 | |
| Interjection | 6780 | 1016 | 1862 |
Disclaimer/Publisher’s Note: The statements, opinions and data contained in all publications are solely those of the individual author(s) and contributor(s) and not of MDPI and/or the editor(s). MDPI and/or the editor(s) disclaim responsibility for any injury to people or property resulting from any ideas, methods, instructions or products referred to in the content. |
© 2023 by the authors. Licensee MDPI, Basel, Switzerland. This article is an open access article distributed under the terms and conditions of the Creative Commons Attribution (CC BY) license (https://creativecommons.org/licenses/by/4.0/).
Share and Cite
Filipowicz, P.; Kostek, B. Rediscovering Automatic Detection of Stuttering and Its Subclasses through Machine Learning—The Impact of Changing Deep Model Architecture and Amount of Data in the Training Set. Appl. Sci. 2023, 13, 6192. https://doi.org/10.3390/app13106192
Filipowicz P, Kostek B. Rediscovering Automatic Detection of Stuttering and Its Subclasses through Machine Learning—The Impact of Changing Deep Model Architecture and Amount of Data in the Training Set. Applied Sciences. 2023; 13(10):6192. https://doi.org/10.3390/app13106192
Chicago/Turabian StyleFilipowicz, Piotr, and Bozena Kostek. 2023. "Rediscovering Automatic Detection of Stuttering and Its Subclasses through Machine Learning—The Impact of Changing Deep Model Architecture and Amount of Data in the Training Set" Applied Sciences 13, no. 10: 6192. https://doi.org/10.3390/app13106192