Article

Cross-Subject Classification of Effectiveness in Performing Cognitive Tasks Using Resting-State EEG

1
Institute of Higher Nervous Activity and Neurophysiology of the Russian Academy of Sciences, 117485 Moscow, Russia
2
Department of Psychology, HSE University, 101000 Moscow, Russia
*
Author to whom correspondence should be addressed.
Appl. Sci. 2023, 13(11), 6606; https://doi.org/10.3390/app13116606
Submission received: 10 April 2023 / Revised: 29 May 2023 / Accepted: 29 May 2023 / Published: 29 May 2023
(This article belongs to the Special Issue Artificial Intelligence (AI) in Neuroscience)

Abstract

:

Featured Application

This study can be further extended to determine the ability of artificial intelligence to classify professional skills and success in cognitive task solutions according to EEG data.

Abstract

A high level of mathematical education is often associated with high effectiveness in solving cognitive problems and professional success. It is known that cognitive processes are accompanied by specific bioelectric activity in the brain and success in mathematical education as a behavioral phenotype is also reflected in EEG both during mental activity and at rest. This study tested the potential to distinguish volunteers with an advanced level of education in mathematics (AM) from individuals with a basic level of education in mathematics (BM) based on the frequency parameters of the resting-state electroencephalogram (EEG) recorded before the start of cognitive tasks. Further, the volunteers were divided into two groups, highly successful and moderately successful, according to their task-solving performance. The Light Gradient Boosting Machine learning algorithm was used for cross-subject classification based on the power spectral density of seven EEG frequency bands. It most accurately recognized and differentiated EEG of highly successful from highly successful BM subjects. The results indicate that success in solving tasks in combination with a high level of education in mathematics can be reflected in or predicted by the specific rhythmic activity of the brain at rest.

1. Introduction

Mathematical skills are inherent in all people and are closely related to wages and professional success [1,2]. Those who had difficulty acquiring math skills during their school years are at greater risk of developing a lifelong learning disability and economic failure as adults [3,4]. Mathematical competencies, on the other hand, lead to higher education, especially in the field of engineering, and directly contribute to a career, therefore being critical for academic and professional success [3]. Many studies have focused on the neurophysiological correlates of various aspects of mathematical cognition, including the development of mathematical skills [5,6,7,8,9]. One functional magnetic resonance imaging (fMRI) paper examined the topography of functional brain activation, particularly in mathematics professionals [10]. We have also reported that the electroencephalography (EEG) spectral pattern differed between specialists in mathematics and specialists in the humanities [11]; and different EEG patterns were induced by solving verbal and mathematic tasks that made it possible to classify subject-specific EEG [12]. However, while most studies focused on specific EEG patterns [5,9,11] and/or specific brain regions [7,8,10] playing crucial roles in mathematical cognition, only a few explored EEG features in terms of classification of individual cognitive albitites or their prediction in samples of neurotypical populations [13]. A powerful approach for early detection of cognitive abilities could be EEG classification using specific EEG pattern recognition by machine learning algorithms [14].
A promising area of research is the search for correlates of the behavioral phenotype and resting-state EEG. The spectral power of resting-state EEG frequency bands demonstrated a higher heritability in a large cohort in twin studies [15,16]. Moreover, some frequency patterns of spontaneous brain oscillations correlated with specific genotypes in healthy aging [17]. In parallel, fMRI studies showed that individual spontaneous neural activity at rest is correlated with functionally active networks and cognitive performance suggesting that patterns of resting-state activity could be explored as endophenotypes of cognitive abilities [18,19]. EEG studies also reported the predictive power of resting-state EEG patterns, for example, connectivity for attention performance [20] and spectral power for insight [21].
Resting-state EEG activity is related to various cognitive functions and could be inherited together with cognitive albitites, we assumed that success in mathematical education as a behavioral phenotype can also be reflected in resting EEG. While neuroscience applies machine learning models to different classification aims including functional state recognition, imagery movement, and brain disorder detection [22,23,24,25], the success use of subject-data-independent models remains challenging. Even in the case of significant statistical differences obtained by t- or f-statistic based permutation tests [26], the non-stationarity of EEG signals, various artifacts and the high variability between individuals lead to difficulties in training robust models [22]. Mathematical proficiency associated with both inherited and acquired cognitive skills can serve as a reliable and predictable individual trait for testing cross-subject classification algorithms of machine learning using the oscillatory patters of resting-state EEG.
In this study, we focused on the application of machine learning algorithms to detect specific frequency patterns of resting-state EEG in volunteers with an advanced level of education in mathematics (AM) and to distinguish them from individuals with a basic level of education in mathematics (BM). The level of education in the field of mathematics served as a criterion for inclusion in the AM group if the volunteers either, entered and successfully continued their education in leading national higher educational institutions or have professional activities that require daily advanced mathematical skills. Further, the volunteers were divided into the groups, highly successful (HS) and moderately successful (MS), according to their cognitive task-solving performance. In this current study, we used the cluster permutation test and machine learning approach to detect rhythmic patterns in the resting-state EEG, specific to individuals from the AM group or related to successful performance in cognitive task-solving.
In this study, we applied the Light Gradient Boosting Machine (lightGBM) learning algorithm for cross-subject classification of the level of education based on the power spectral density (PSD) of seven resting-state EEG frequency bands. One of the main novelties of GBM is that it can be used for both regression and classification problems, and it can handle a variety of loss functions such as mean squared error, mean absolute error and binary cross-entropy. GBM is also known for its ability to handle missing data and outliers, and it can be applied to high-dimensional data with a large number of features. Another key advantage of GBM is that it can automatically handle feature selection and feature engineering, making it a powerful and flexible tool for many machine learning applications [27]. To increase the interpretation of the classification results from a neuroscience perspective, the Shapley Additive Explanations (SHAP) approach was used to retrieve the average contribution of a feature: differences in PSD of the frequency band at specific electrodes. One common application of SHAP values is in the interpretation of black-box models, such as neural networks or gradient boosting machines, which are difficult to interpret using traditional methods. By using SHAP values, it is possible to gain insight into the factors that drive the model’s predictions and to identify potential areas for improvement or refinement [28].
The main purpose of this study was to show the fundamental possibility to successfully perform cross-subject classification of individuals with different levels of education in mathematics based on their resting-state EEG patterns.

2. Materials and Methods

2.1. Participants

This study involved 27 healthy right-handed volunteers. Participants were recruited through social media after completing an online questionnaire on neurological and psychiatric disorders. The questionnaire included issues related to clinical status, year of higher education, the specialty of higher education, place of work and availability of classes for in-depth study of mathematics in a secondary school and/or higher education institution. All participants were native speakers of the Russian language and were students in at least the third year or graduates of state educational universities in the specialties of technical mathematics or the humanities. Subjects with incomplete higher education were university students (third year and above) continuing their education in the field of mathematics or the humanities. We proceeded from the fact that students of mathematical specialties, as well as graduates of relevant educational programs, have developed the mathematical abilities necessary for admission to technical universities. At the same time, according to self-reports from the subjects, students of technical specialties showed early mathematical abilities and additionally studied mathematics at school. On the contrary, in the BM group, we classified the subjects by the survey since they had never studied additional mathematics, had not been involved in specialized mathematical classes and did not notice a corresponding personal inclination. One volunteer’s data were excluded from the analysis due to EEG abnormalities. The final sample included 26 participants (age 25.7 ± 4.49 years, range 19–38 years; 12 women, 14 men) divided into two groups: the AM group (12 students or professionals in mathematics, engineering or computer science) and the BM group (14 students or professionals in the arts or humanities) (Table 1).

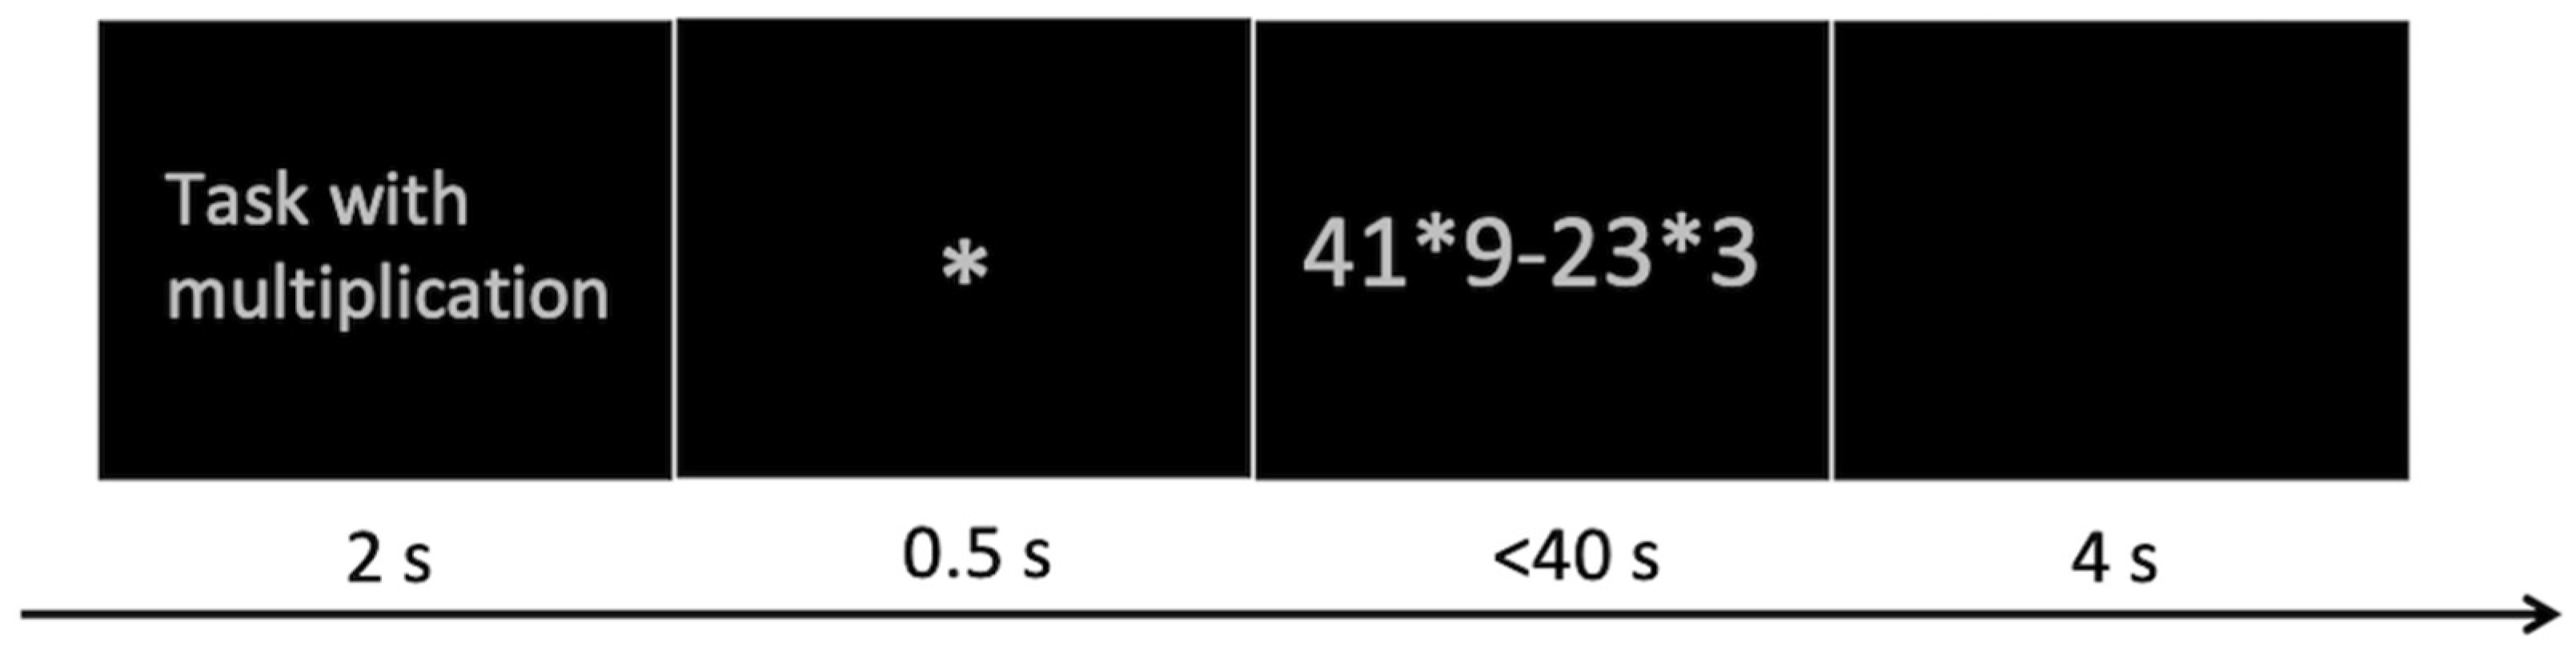
2.2. Experimental Design

Participants were seated comfortably in a soundproof room at 1 m from a 19-inch square monitor. During recording of resting-state EEG participants were instructed to sit calmly with their eyes open. After a 5-min recording of EEG, participants were asked to solve mental tasks, giving equal importance to accuracy and the shortest solution time. Tasks were displayed in gray in the center of a black screen, the size of letters and numbers was the same for all tasks. We presented three types of tasks in pseudo-random order: 60 verbal tasks (anagrams of 5–6 letter words), 60 tasks for complex mental arithmetic including two-digit multiplication and 60 logical tasks to continue arithmetic sequences (Table 2). The trial consisted of instructions for the task (2 s), a fixation cross (0.5 s), the task (<40 s), and a black screen during the participant’s response (4 s) (Figure 1). Table 1 illustrates examples of the tasks.
The tasks were presented with a duration limited to 40 s. Participants clicked the left button of the PC mouse when they were ready to respond. If no answer was given within 40 s, the task was considered unsolved and new trial started. Correctness (CA) and decision time (DT) was recorded. DT was calculated from the start of the task to the participant’s response. Additional breaks were given every 20 to 30 min or at the request of the participant. The whole experiment usually lasted 2 to 2.5 h. Behavioral data were used to divide participants into groups according to their efficiency: the highly successful (HS) group whose mean DT for correctly answered tasks was below the median (n = 13; age 25.38 ± 5.06 years, range 19–38 years; 8 men, 8 AM) and the moderately successful (MS) group with mean DT above the median (n = 13; age 26.08 ± 4.6 years, range 20–37 years; 6 men, 4 AM). Further, based on the efficiency criteria, we ranked participants inside the AM (n = 12; age 27 ± 5.36 years; 9 men, 7 HS) and BM (n = 14; age 24.6 ± 4.47 years; 5 men, 6 HS) groups. Aiming to find out whether the classification results depended on how successful subjects were at task-solving we performed cross-subject classification of the six most successful participants from the AM group (SAM) against the most successful participants from the BM group (SBM), and vice versa: the six least successful participants from the AM group (LAM) and the six least successful participants from the BM group (LBM) (Table 1).

2.3. EEG Recording and Preprocessing

Resting-state EEG was recorded from 128 channels (Geodesic Sensor Nets Inc., Eugene, OR, USA) with a 0.1 Hz–70 Hz band-pass analog filter, 50 Hz-notch filter, 1000 Hz sampling rate, and online re-reference at the vertex (channel Cz) using Net Station 4.5.1 software (Electrical Geodesics, Inc. (EGI), Eugene, OR, USA). The electrodes were placed using a 10-10 system. Impedance was kept below 50 KΩ. Further, EEG data were downsampled to 250 Hz. Then, EEG data were re-referenced offline to an average of all 128 channels. Epochs with low signal-to-noise ratio (SNR) were rejected using minimum and maximum peak-to-peak amplitudes.
Electrooculogram (EOG) artifacts were removed using independent component analysis (ICA) and the corresponding EOG channels after high-pass filtering with a cutoff frequency of 1 Hz (ICA is sensitive to low-frequency drifts), then a band-pass filter of 3–25 Hz was applied. Thirty-six EEG channels with high muscle artifacts exceeding an absolute voltage threshold of 140 μV and EOG channels were discarded from further analysis (the excluded channels were: E8, E14, E17, E21, E25, E43, E44, E48, E49, E56, E57, E63, E64, E65, E68, E69, E73, E74, E81, E82, E88, E89, E90, E94, E95, E99, E100, E107, E113, E114, E119, E120, E125, E126, E127, and E128).
Continuous recordings of resting-state EEG were segmented into 2 s epochs without overlapping. PSD values for each epoch were estimated using the multitaper method, which calculates spectral density for orthogonal tapers, then averages the values together for each channel. Individual PSD values were averaged over each of seven frequency bands: θ1 (theta1): 4–6 Hz, θ2 (theta2): 6–8 Hz, α1 (alpha1): 8–10 Hz, α2 (alpha2): 10–12 Hz, β1 (beta1): 12–16 Hz, β2 (beta2): 16–20 Hz, and β3 (beta3): 20–24 Hz. Relative power equal to the power in each frequency band divided by the total power were used as features for classification and the permutation cluster test. The feature space was X ∈ RN×K, where K is the number of frequency bands and n is the number of EEG channels.

2.4. Statistical Analysis of the Behavioral Data

Gender and age differences were compared between the groups using the Mann–Whitney U-test for non-parametric samples. Since the distribution for the remaining behavioral parameters was close to normal (according to the Shapiro–Wilcoxon test p > 0.09), Mixed model ANOVA with between-effect of groups and within-effect of tasks was applied for two types of groups: BM/AM and HS/MS and three types of tasks. All significant differences, according to ANOVA, were verified using a post-hoc Tukey test.

2.5. Cluster-Based Permutation Test

A cluster-based permutation test was used to examine differences in PSD between groups in each channel and frequency band. Two-sided T-statistics were calculated according to recommendations [26] with a threshold = 6 and correction for multiple comparisons using n = 1024 permutations and cluster-level correction based on spatial bias. Cluster-based permutation testing is a statistical method used for hypothesis testing in neuroimaging, where the goal is to identify regions of the brain that show significant differences in activity between experimental conditions or groups. This is a non-parametric method that does not rely on assumptions about the distribution of the data, making it a flexible and powerful tool for analyzing complex data. The cluster-based permutation test works by randomly permuting the labels of the data many times and calculating the test statistic for each permutation. The observed cluster-level statistic was then compared to the null distribution of the test statistic to determine its significance. If the observed cluster-level statistic is higher than a certain threshold based on the null distribution, the null hypothesis is rejected, and the cluster is deemed to be significant. Cluster-based permutation testing is a powerful method for identifying regions of the brain that show significant differences in activity between experimental conditions or groups. It is particularly useful in neuroimaging, where the data are often high-dimensional and complex, making traditional statistical methods difficult to apply [26].

2.6. Machine Learning Algorithm for Classification of EEG Patterns

Using the Light Gradient Boosting Machine (LightGMB) method and PSD features, we performed cross-subject group classification to recognize the group type to which the individual EEG data belonged. Light GBM is an advanced pipeline based on a decision tree algorithm with one partition per leaf. Gradient Boosting Machines (GBM), is a machine learning technique that involves the iterative training of decision trees. In GBM, decision trees are trained sequentially to improve the performance of the model by reducing the error of the previous tree. The algorithm works by calculating the gradient of the loss function with respect to the output of the previous tree and using this gradient to adjust the parameters of the next tree. Light GBM hyperparameter simulations were performed using cross-validation grid analysis. For subject-independent classification of the group of participants, epochs were labeled according to the group to which the subject belongs. EEG epochs of two participants, which were selected from different groups, were used for the test set. The validation set picked EEG epochs of another two participants also from different groups. Both sets were selected randomly. EEG epochs of other subjects were utilized for training. This process was repeated ten times, creating ten different folds for group classifications. The balanced accuracy (BA), receiver operating characteristic (ROC) curve, and area under the curve (AUC) were used to assess the performance of LightGMB. The Mann–Whitney U-test was applied for statistical comparison of classification performance in different comparisons.
The Shapley Additive Explanations (SHAP) approach was used for the interpretation of the classification results and to retrieve the average contribution of a feature among all possible coalitions [28]. SHAP values are a model-agnostic method for explaining the output of any machine learning model. The SHAP approach is based on game theory and provides a way to estimate the contribution of each feature to the final prediction made by the model. The basic idea behind SHAP values is to calculate the expected value of the model output when a certain feature is included in the model, compared to the expected value of the model output when the feature is not included. This is completed by calculating the average prediction for all possible combinations of features, and then computing the difference between the average prediction with and without the feature of interest. This difference represents the contribution of that feature to the model prediction. The SHAP value for a given feature can be thought of as the average marginal contribution of that feature across all possible feature subsets. This means that SHAP values capture not only the main effect of a feature, but also its interactions with other features. SHAP values provide several advantages over other methods for explaining machine learning models. First, they are model-agnostic, meaning that they can be applied to any type of model, including deep learning models and ensemble models. Second, they provide a local explanation for each individual prediction, which can be helpful for understanding the factors that influence a specific outcome. Finally, SHAP values can be used to compare the importance of different features in the model, which can be useful for feature selection or feature engineering [28].

3. Results

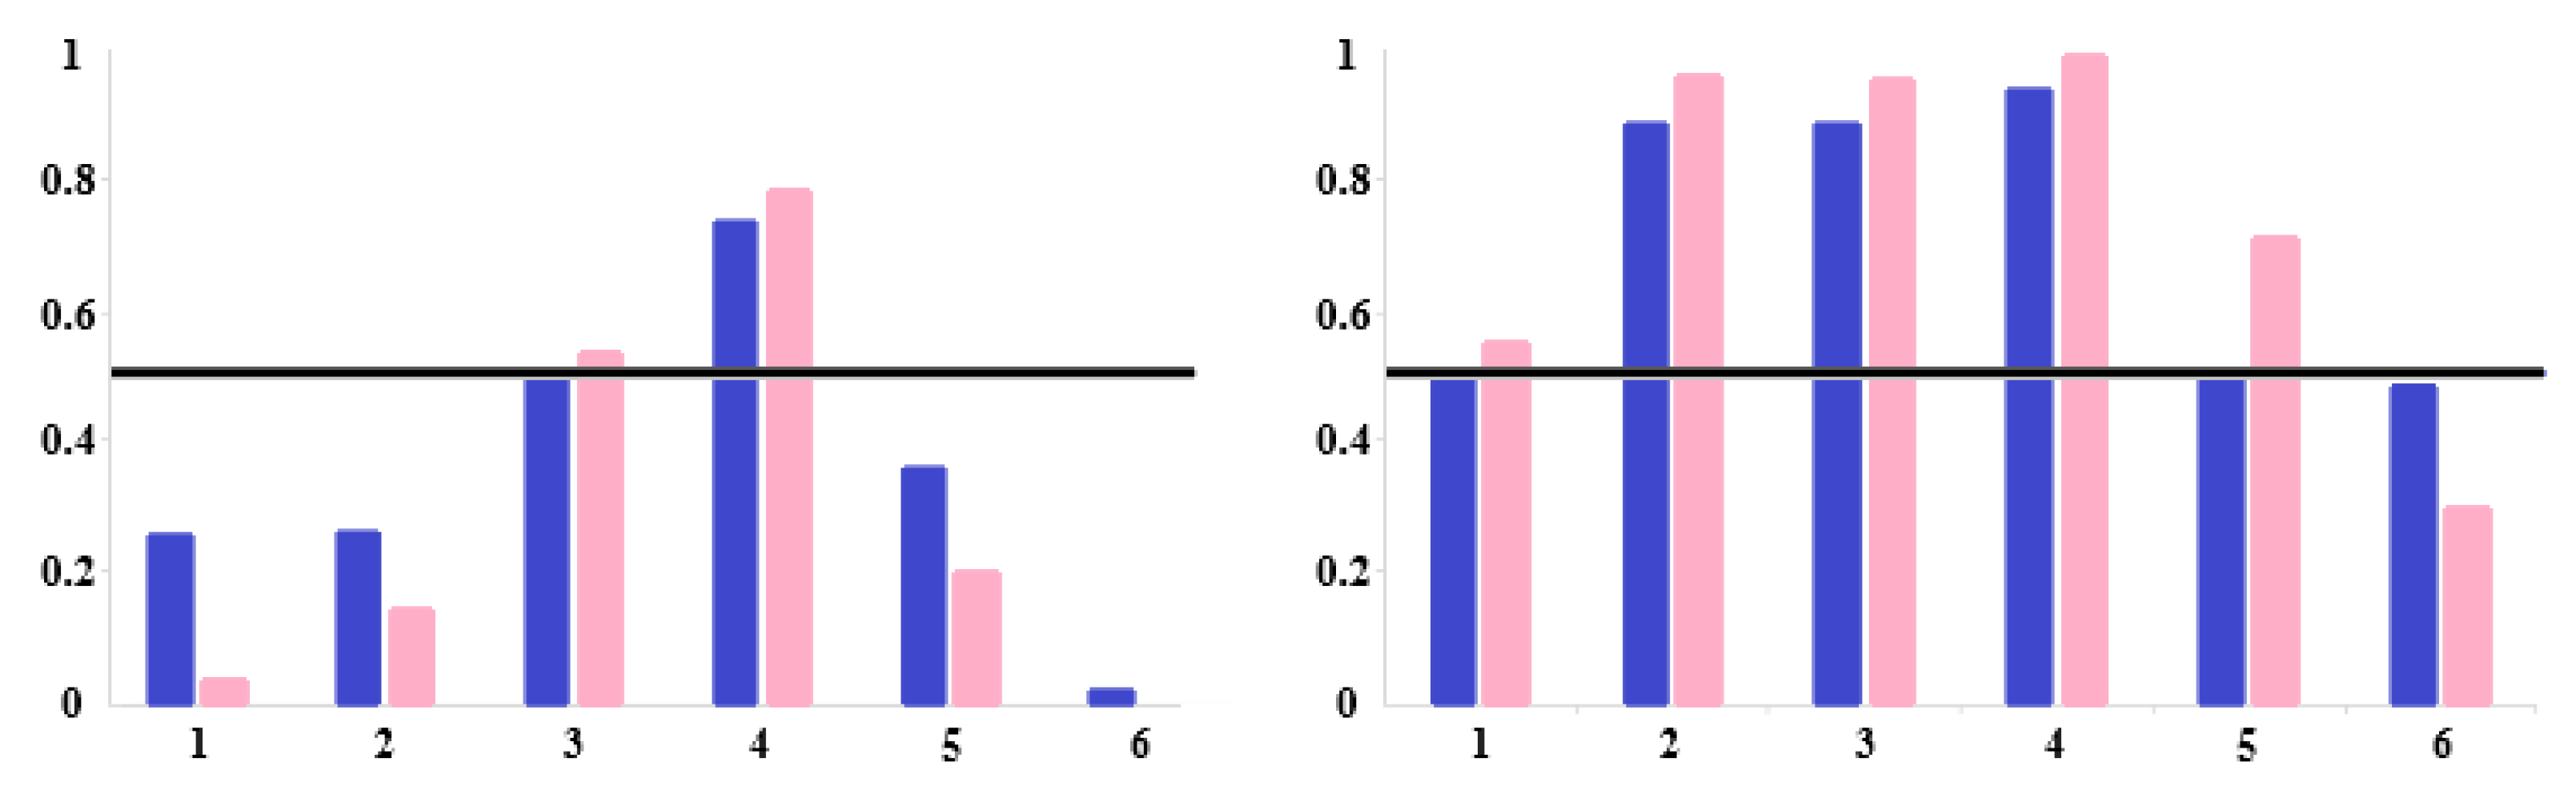
3.1. Behavioral Performance

There were neither differences in gender nor age between the mathematical group and the humanitarian group, nor between the highly successful group and the moderately successful group. Further, there were no statistical differences between the AM and BM groups in any parameter of the effectiveness of problem-solving. The HS and MS groups, as expected, differed from each other in DT and CA without the effect of tasks. According to DT: F(1, 22) = 37.74, ηr2 = 0.63, 1 − β = 0.99, p < 0.00003 and to CA: F(1, 22) = 7.75, ηr2 = 0.26, 1 − β = 0.76, p < 0.01, the participants of the HS group coped significantly better (Table 3).

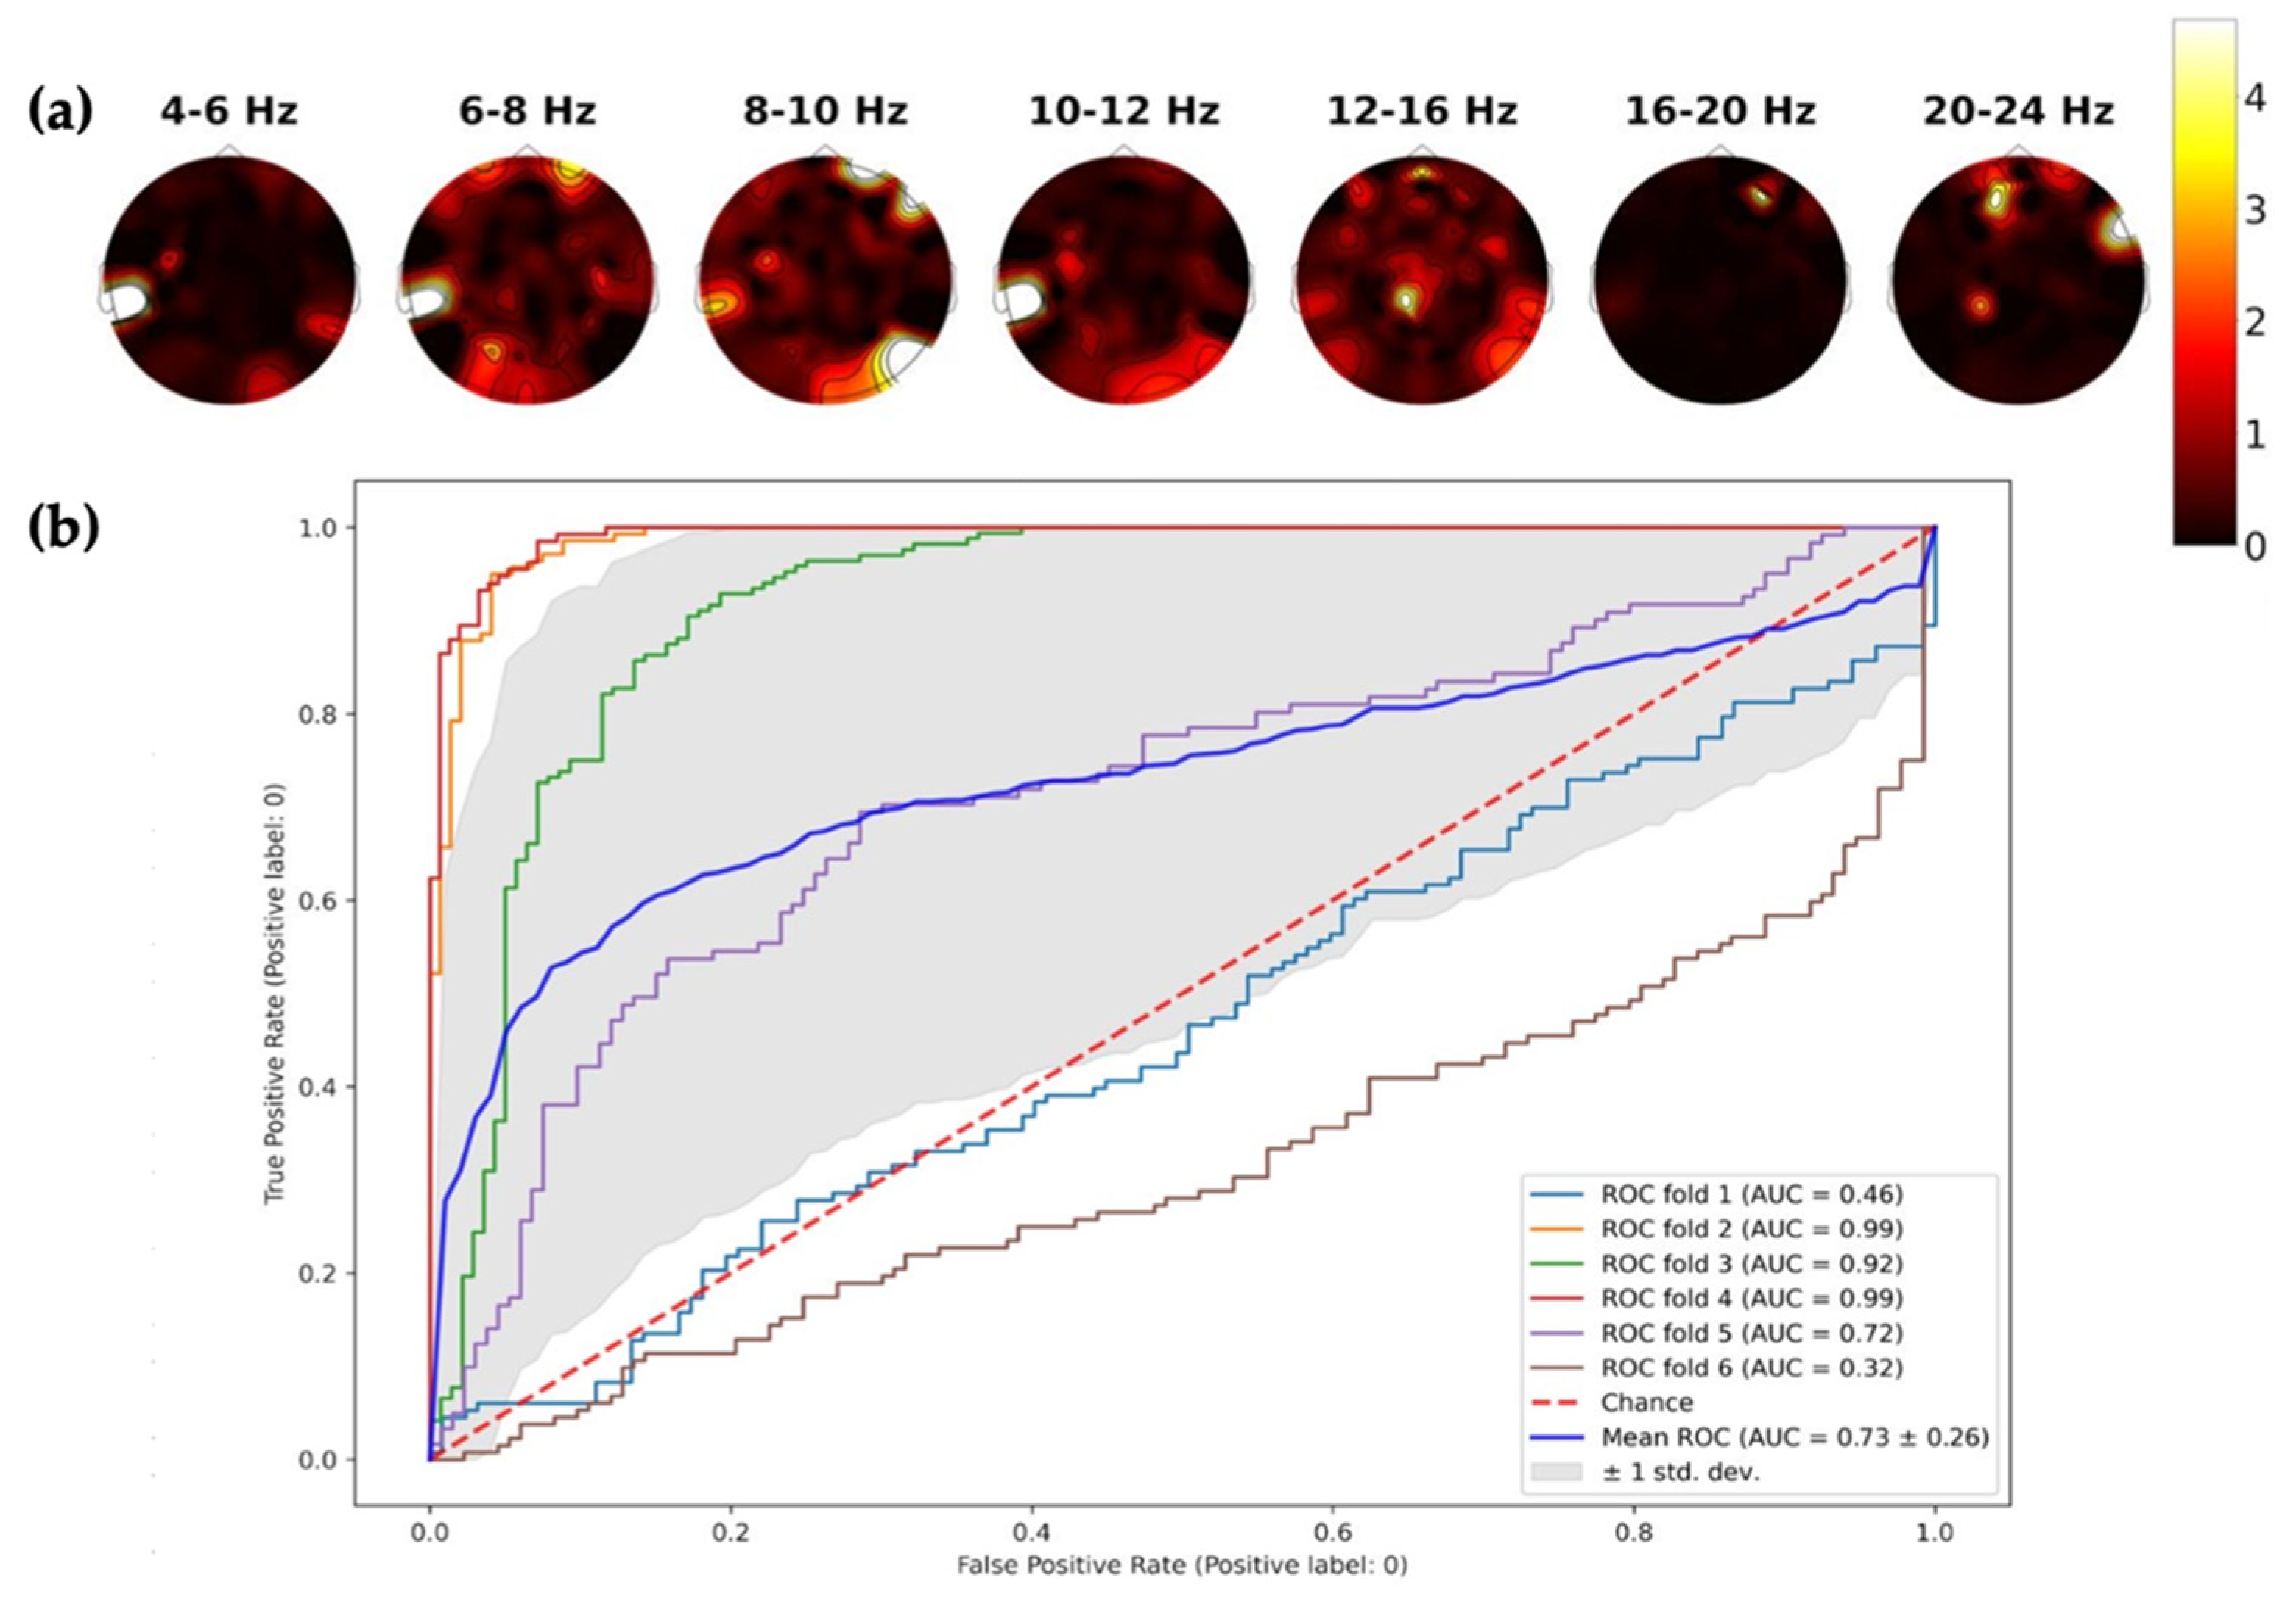
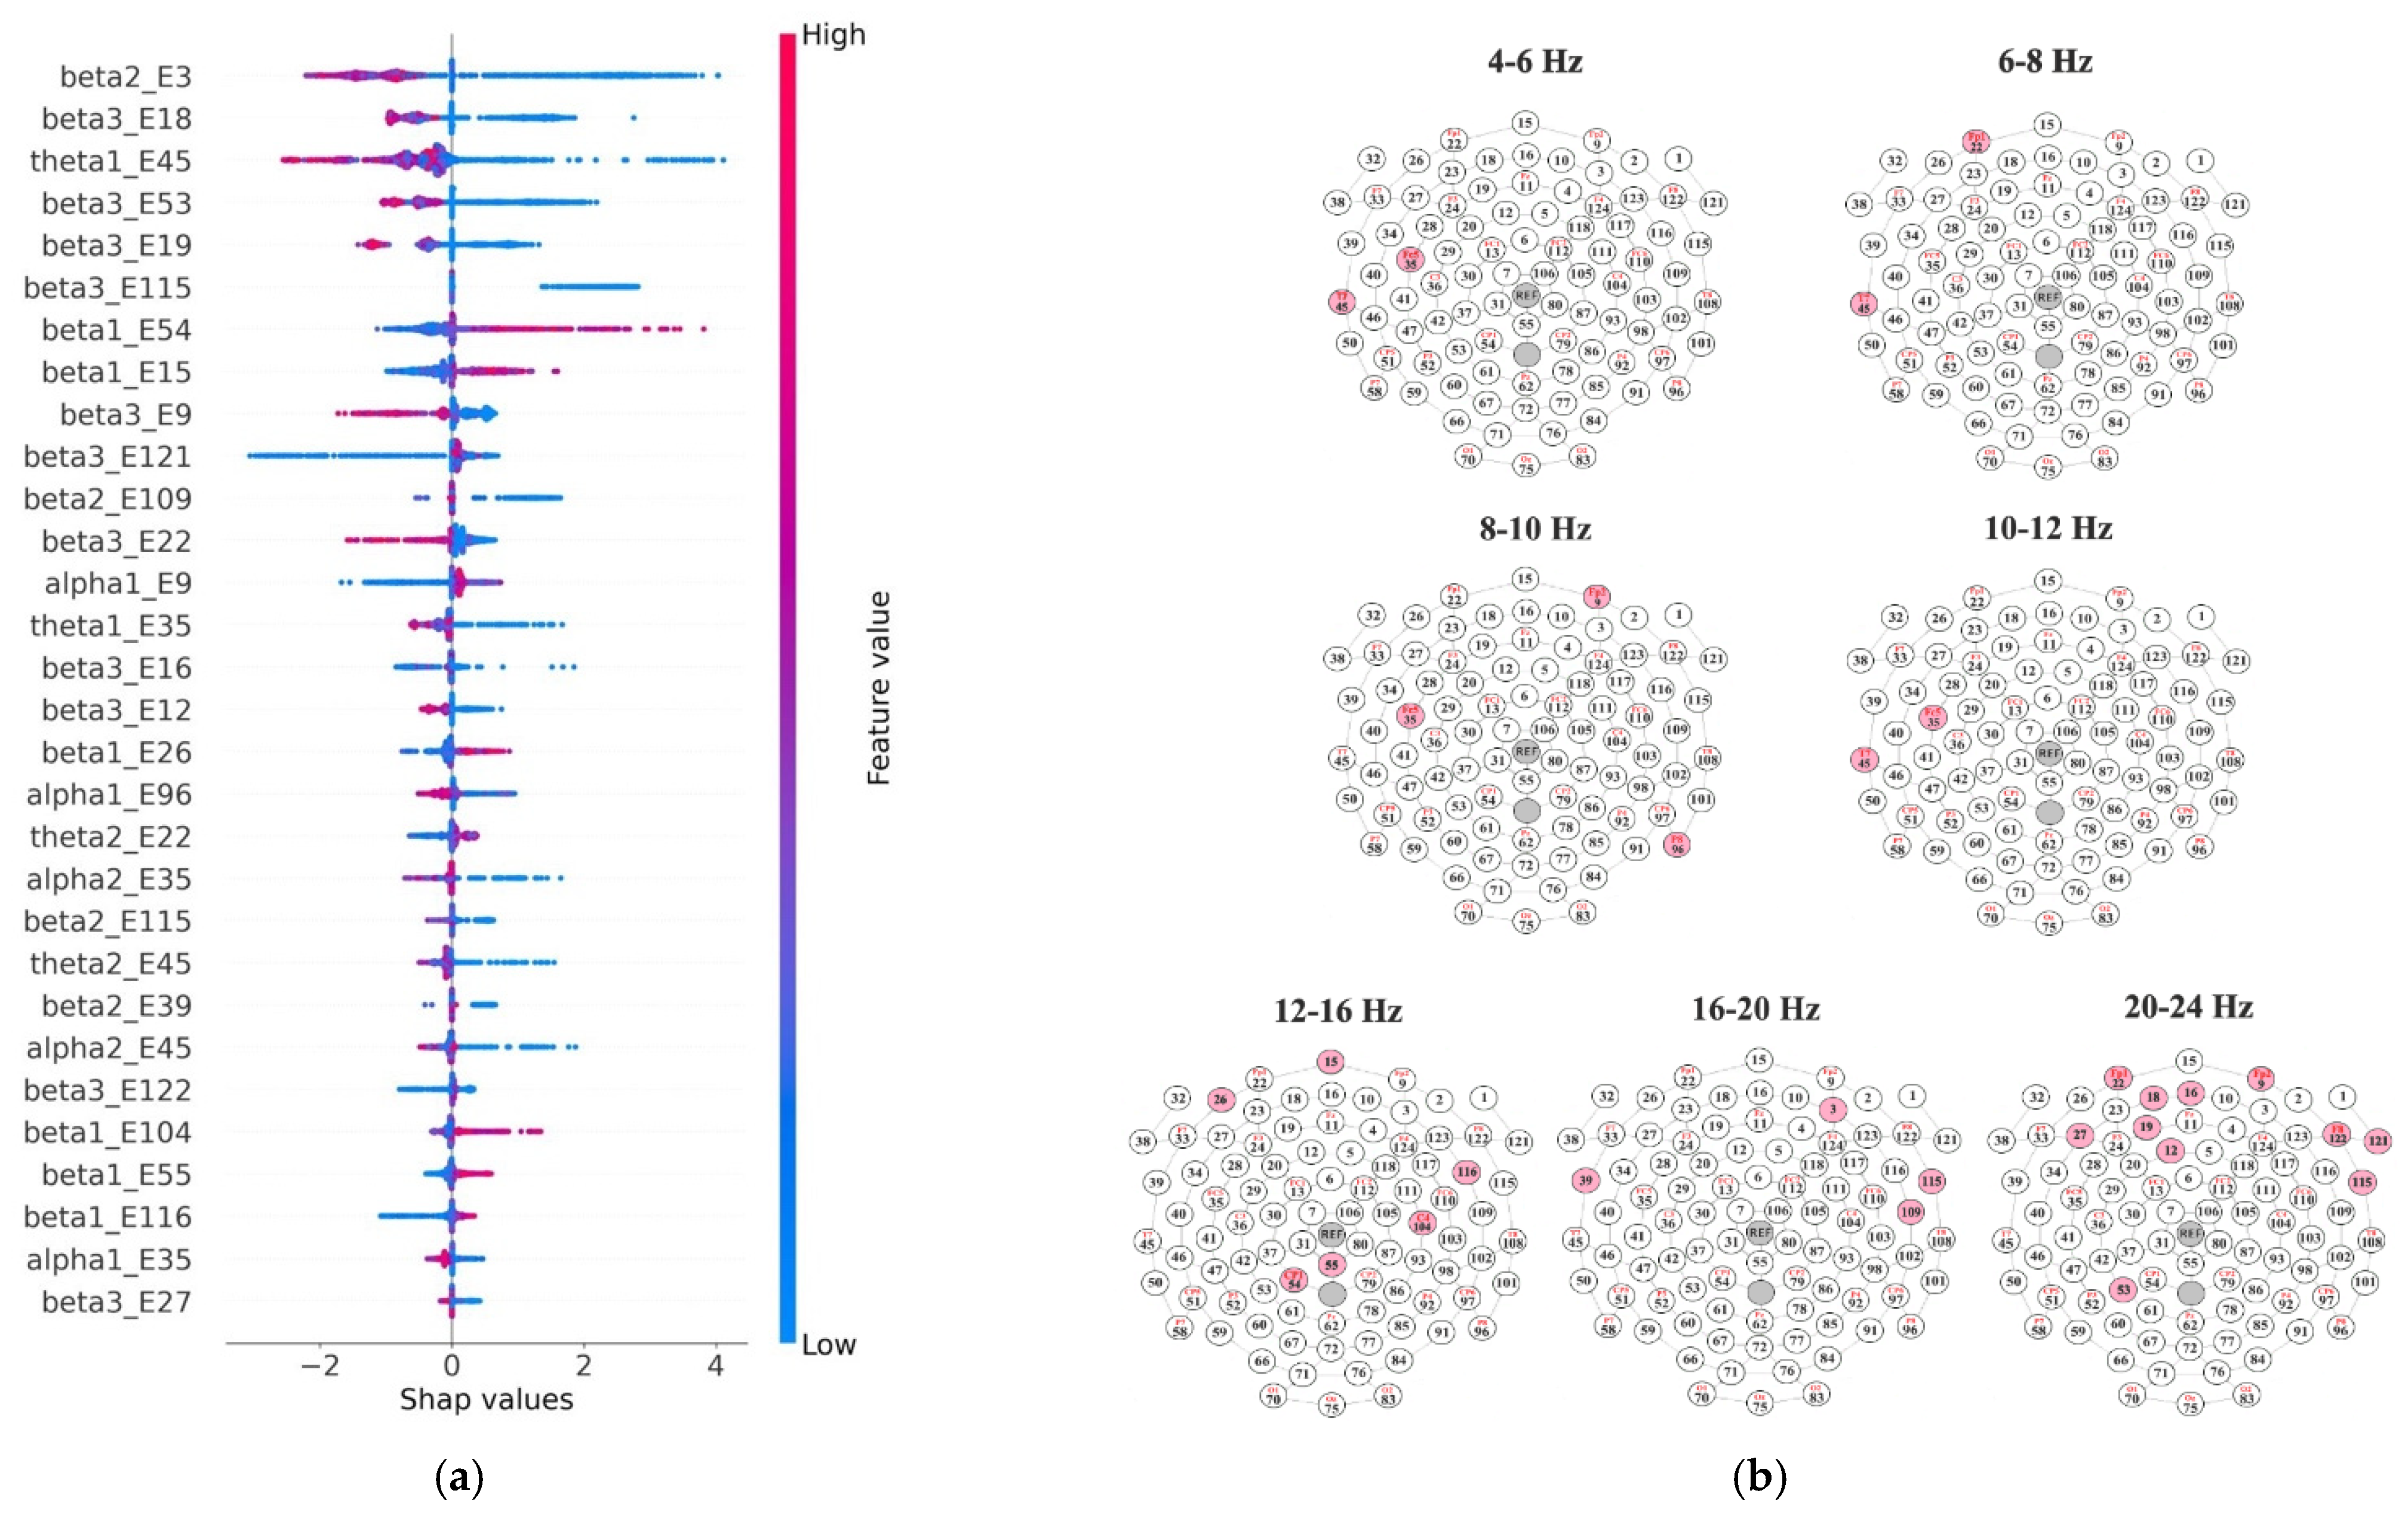
3.2. Group Differences and Cross-Subject Group Classification

The permutation cluster test did not show significant differences in the PSD of resting-state EEG between the HS and MS groups nor between the AM and BM groups.
The BA of cross-subject classification of two different types of comparisons (M vs. BM and HS vs. MS) was almost random. Intrasubject classification BA for LAM and LBM was below chance: BA = 0.36 ± 0.24, AUC = 0.28 ± 0.31. Only the classification of SAM and SBM subjects was successful: BA = 0.7 ± 0.23, AUC = 0.75 ± 0.24. The results of LAM versus LBM and SAM versus SBM are depicted in Figure 2.
Figure 3 illustrates SHAP values of feature contributions and their topography, and the ROC–AUC for SAM and SBM classification.
The SHAP approach yielded information about the contributions of all features to the classification. PSD of the high theta, alpha, and beta frequency bands at specific electrodes had a significant impact on the correct recognition of the classes (SAM or SBM). Figure 4 illustrates the 30 most important features (out of 600 in total) for the classification according to SHAP values and localizations of sensors.
The SHAP feature values indicate the following differences in PSD of resting-state EEG and their distribution over the scalp, which played a substantial role in the classification performance: theta1 band in the left temporal lobe; theta2 in the temporal and left prefrontal cortex; alpha1 in the left junction of central and temporal areas, above the right prefrontal and right parietal regions; alpha2 band in the left temporal lobe; beta1 band in the prefrontal region; left frontal area, central parietal area, and dorsolateral frontal areas; beta2 in the bilateral junctions of the frontal and temporal regions, and above the right frontal lobe; and beta3 predominantly in the bilateral anterior frontal regions, central areas, and right dorsolateral cortex.

4. Discussion

This study tested the possibility of distinguishing volunteers with an advanced level of education in mathematics from individuals with a basic level of education in mathematics based on the frequency parameters of the resting-state EEG recorded before the start of cognitive tasks. Additionally, the volunteers were divided into groups of highly successful and moderately successful according to their task-solving performance. The Light Gradient Boosting Machine Learning algorithm was used for cross-subject classification based on the power spectral density of seven EEG frequency bands. The classification accuracy was about or below the chance level in recognition of classes depending on the education or success in task-solving. The subject-specific EEG was accurately classified (>70%) only for classes of individuals with advanced math education and participants with basic math education who showed the most successful performance in task-solving (a high rate of correct answers with quick decision time).
It is known that EEG signals vary greatly not only from person to person but even from session to session [29]. The high inter and intrasubject variability of EEG impedes the effective transfer of features obtained by machine learning models from one person’s data to another that is required for cross-subject EEG classification [22,30]. Several studies attempted to perform cross-subject individual classification where test and training EEG samples belonged to different individuals. A cross-subject classifier based on common special pattern recognition was developed to separate two mental states with an accuracy of up to 75.30%: the emotion of happiness and the imagination of movement [23]. In 2021, [22] the ability of artificial neural networks to produce cross-subject classification of fatigue with high performance, up to 91.63%, was reported. Unlike previous studies, our results firstly demonstrate the possibility to recognize individuals with specific education based on their resting-state EEG oscillatory patterns. At the example of classes labeled depending on specific education and performance in cognitive task-solving, this current study showed the possibility to perform rather successful cross-subject classification and perspectives for further research in this direction.
We did not find any differences between the AM and BM groups either by cluster permutation test or by a machine learning approach when we used the resting-state EEG data of all participants. Moreover, a classification model failed to distinguish resting-state EEG of individuals who showed worse performance in task-solving. However, light GBM showed good accuracy in labeling the data of the AM and BM group participants only with high/successful performance in task-solving (6 SAM and 6 SBM). The average accuracy and AUC were above chance for 4 folds out of 6 (Figure 2), which gave a mean ROC–AUC higher than 0.73. We may hypothesize that higher performance in task-solving resulted from more focused attention, mental concentration, and motivation that could be reflected in the brain rhythmic activity in the resting-state as well. Wherein patterns of this brain activity differed in individuals with advanced math education and without it sufficiently for the machine learning model to distinguish EEG of subjects from AM and BM groups.
The obtained results are partially consistent with previous findings showing differences in the spectral power of the theta rhythm between AM and BM groups [11]. In this study, a group statistical comparison did not show any between-group difference in resting-state EEG. Despite the absence of significant group differences in the PSD of resting-state EEG in this study, SHAP values interpret the significant impact of features of the light GLM results of cross-subject classification to lie in the frontal midline theta band. The frontal midline theta rhythm is usually associated with executive control functions [31] and complex cognitive activity [32]. Event-related theta rhythm power showed a positive association with polygenic scores of educational attainments in a large twin/family sample (n = 4893) [33].
SHAP value analysis estimated almost all central frontal regions in the beta3 band (20–24 Hz) and to a lesser extent in the other beta ranges as very important features for classification. Similarly to the frontal midline theta, the beta rhythm in the frontal areas is closely related to the processes of executive control and working memory [34,35]. A study by Rogala et al. 2020 [20] also showed that the beta band power (22–29 Hz) of the resting-state EEG correlated with the strength of frontoparietal connectivity and subsequent behavioral performance.
However, we cannot claim that the EEG patterns revealed by lightGBM and estimated by SHAP analysis specifically reflect mathematical education. Rather, we would like to draw attention to the interpretive methods of machine learning models for studying the cognitive functions of the brain, as well as to the possibility and prospects of inter-subject EEG classification. The small sample size should be noted as a limitation of the current study. The sample size was probably sufficient to test the performance of the classifier but not enough to make reliable psychophysiological statements.

5. Conclusions

In the current study light GBM was used to perform cross-subject classification of EEG of individuals with different levels of education in mathematics with high accuracy despite the high individual variability of brain electrical patterns of resting-state EEG. This result implies that individuals with specific education and similarly high cognitive engagement in the subsequent task performance, might have common resting-sate EEG patterns. Using the SHAP approach we found that the most significant patterns ensuring the successful classification of resting-state EEG correspond to differences in theta and beta ranges, located mainly in the frontal and central areas of the brain. The results indicate that success in solving tasks in combination with a high level of education in mathematics can be reflected or predicted by the specific rhythmic activity of the brain at rest. Summing up, we can assume that the patterns of rhythmic activity of the brain are associated with specific cognitive skills acquired in the process of education.

Author Contributions

Conceptualization, H.S. and O.M.; methodology, H.S. and I.M.; analysis, I.M.; data recording, H.S.; writing—original draft preparation, H.S.; writing—review and editing, O.M. All authors have read and agreed to the published version of the manuscript.

Funding

This research was implemented as a part of the State Assignment of Ministry of Science and Higher Education of the Russian Federation at the Institute of Higher Nervous Activity and Neurophysiology of the Russian Academy of Sciences.

Institutional Review Board Statement

This study was conducted in accordance with the Declaration of Helsinki and approved by the Ethics Committee of the Institute of Higher Nervous Activity and Neurophysiology of the Russian Academy of Sciences (protocol №3 from 24 August 2017).

Informed Consent Statement

Informed consent was obtained from all subjects involved in this study.

Data Availability Statement

The data that support the findings of this study are available on request from the corresponding author, O.M.

Acknowledgments

This study was carried out using the equipment of the Research Resource Center # 40606 of IHNA and NPh RAS ‘Functional Brain Mapping’.

Conflicts of Interest

The authors declare no conflict of interest.

References

  1. Webbink, D.; Hartog, J. Can students predict starting salaries? Yes! Econ. Educ. Rev. 2004, 23, 103–113. [Google Scholar] [CrossRef]
  2. Cox, D.D.; Percival, D.B.; Walden, A.T. Spectral Analysis for Physical Applications: Multitaper and Conventional Univariate Techniques. J. Am. Stat. Assoc. 1997, 92, 1226. [Google Scholar] [CrossRef]
  3. Ritchie, S.J.; Bates, T.C. Enduring Links From Childhood Mathematics and Reading Achievement to Adult Socioeconomic Status. Psychol. Sci. 2013, 24, 1301–1308. [Google Scholar] [CrossRef]
  4. Anzalone, C.; Luedke, J.C.; Green, J.J.; Decker, S.L. QEEG coherence patterns related to mathematics ability in children. Appl. Neuropsychol. Child. Oct. 2020, 11, 328–338. [Google Scholar] [CrossRef] [PubMed]
  5. Wang, L.; Cao, C.; Zhou, X.; Qi, C. Spatial abilities associated with open math problem solving. Appl. Cogn. Psychol. 2022, 36, 306–317. [Google Scholar] [CrossRef]
  6. Roik, A.O.; Ivanitskii, G.A. A Neurophysiological Model of the Cognitive Space. Neurosci. Behav. Physiol. 2013, 43, 193–199. [Google Scholar] [CrossRef]
  7. Núñez-Peña, M.I.; González-Gómez, B.; Colomé. Spatial processing in a mental rotation task: Differences between high and low math-anxiety individuals. Biol. Psychol. 2019, 146, 107727. [Google Scholar] [CrossRef]
  8. Arsalidou, M.; Pawliw-Levac, M.; Sadeghi, M.; Pascual-Leone, J. Brain areas associated with numbers and calculations in children: Meta-analyses of fMRI studies. Dev. Cogn. Neurosci. 2018, 30, 239–250. [Google Scholar] [CrossRef]
  9. Alnajashi, S. Alpha and theta oscillations in mental addition for high and low performers. Cogn. Process. 2021, 22, 609–626. [Google Scholar] [CrossRef] [PubMed]
  10. Amalric, M.; Dehaene, S. Origins of the brain networks for advanced mathematics in expert mathematicians. Proc. Natl. Acad. Sci. USA 2016, 113, 4909–4917. [Google Scholar] [CrossRef]
  11. Steiner, H.; Martynova, O. Task-related and Resting-state EEG Correlates of Mathematical Skills. In Proceedings of the Fourth International Conference Neurotechnologies Neurointerfaces (CNN)/Neurotechnologies Neurointerfaces (CNN), Kaliningrad, Russia, 14–16 September 2022. [Google Scholar] [CrossRef]
  12. Chemerisova, E.V.; Atanov, M.S.; Mikheev, I.N.; Martynova, O.V. Classification of verbal and mathematical mental operations based on power spectral density of EEG. Pscyhology. J. High. Sch. Econ. 2018, 15, 268–278. [Google Scholar] [CrossRef]
  13. Hinault, T.; Lemaire, P. What does EEG tell us about arithmetic strategies? A review. Int. J. Psychophysiol. 2016, 106, 115–126. [Google Scholar] [CrossRef] [PubMed]
  14. Amin, H.U.; Mumtaz, W.; Subhani, A.R.; Saad, M.N.M.; Malik, A.S. Classification of EEG Signals Based on Pattern Recognition Approach. Front. Comput. Neurosci. 2017, 11, 103. [Google Scholar] [CrossRef] [PubMed]
  15. Anokhin, A.P. Genetic psychophysiology: Advances, problems, and future directions. Int. J. Psychophysiol. 2014, 93, 173–197. [Google Scholar] [CrossRef]
  16. Iacono, W.G.; Malone, S.M.; Vrieze, S.I. Endophenotype best practices. Int. J. Psychophysiol. 2017, 111, 115–144. [Google Scholar] [CrossRef] [PubMed]
  17. Ponomareva, N.V.; Andreeva, T.V.; Protasova, M.; Konovalov, R.N.; Krotenkova, M.V.; Kolesnikova, E.P.; Malina, D.D.; Kanavets, E.V.; Mitrofanov, A.A.; Fokin, V.F.; et al. Genetic association of apolipoprotein E genotype with EEG alpha rhythm slowing and functional brain network alterations during normal aging. Front. Neurosci. 2022, 16, 931173. [Google Scholar] [CrossRef]
  18. Mennes, M.; Kelly, C.; Zuo, X.-N.; Di Martino, A.; Biswal, B.B.; Castellanos, F.X.; Milham, M.P. Inter-individual differences in resting-state functional connectivity predict task-induced BOLD activity. Neuroimage 2010, 50, 1690–1701. [Google Scholar] [CrossRef]
  19. Cole, M.W.; Yarkoni, T.; Repovs, G.; Anticevic, A.; Braver, T.S. Global Connectivity of Prefrontal Cortex Predicts Cognitive Control and Intelligence. J. Neurosci. 2012, 32, 8988–8999. [Google Scholar] [CrossRef]
  20. Rogala, J.; Kublik, E.; Krauz, R.; Wróbel, A. Resting-state EEG activity predicts frontoparietal network reconfiguration and improved attentional performance. Sci. Rep. 2020, 10, 5064. [Google Scholar] [CrossRef]
  21. Kounios, J.; Fleck, J.I.; Green, D.L.; Payne, L.; Stevenson, J.L.; Bowden, E.M.; Jung-Beeman, M. The origins of insight in resting-state brain activity. Neuropsychologia 2008, 46, 281–291. [Google Scholar] [CrossRef]
  22. Zeng, H.; Li, X.; Borghini, G.; Zhao, Y.; Aricò, P.; Di Flumeri, G.; Sciaraffa, N.; Zakaria, W.; Kong, W.; Babiloni, F. An EEG-Based Transfer Learning Method for Cross-Subject Fatigue Mental State Prediction. Sensors 2021, 21, 2369. [Google Scholar] [CrossRef] [PubMed]
  23. Ray, A.M.; Sitaram, R.; Rana, M.; Pasqualotto, E.; Buyukturkoglu, K.; Guan, C.; Ang, K.-K.; Tejos, C.; Zamorano, F.; Aboitiz, F.; et al. A subject-independent pattern-based Brain-Computer Interface. Front. Behav. Neurosci. 2015, 9, 269. [Google Scholar] [CrossRef] [PubMed]
  24. Babiloni, F.; Cincotti, F.; Lazzarini, L.; Millan, J.; Mourino, J.; Varsta, M.; Heikkonen, J.; Bianchi, L.; Marciani, M.G. Linear classification of low-resolution EEG patterns produced by imagined hand movements. IEEE Trans. Rehabil. Eng. 2000, 8, 186–188. [Google Scholar] [CrossRef] [PubMed]
  25. Gysels, E.; del Chiappa, S.R.M.J.; Celka, P. Studying Phase Synchrony for Classification of Mental Tasks in Brain Machine Interfaces. In Proceedings of the Conference of the International Society for Brain Electromagnetic Topography, Santa Fe, CA, USA, 19–23 November 2003. [Google Scholar]
  26. Maris, E.; Oostenveld, R. Nonparametric statistical testing of EEG- and MEG-data. J. Neurosci. Methods 2007, 164, 177–190. [Google Scholar] [CrossRef] [PubMed]
  27. Wan, W.; Cui, X.; Gao, Z.; Gu, Z. Frontal EEG-Based Multi-Level Attention States Recognition Using Dynamical Complexity and Extreme Gradient Boosting. Front. Hum. Neurosci. 2021, 15, 673955. [Google Scholar] [CrossRef]
  28. Lundberg, S.; Su-In, L. A Unified Approach to Interpreting Model Predictions. In Proceedings of the Conference on Neural Information Processing Systems, Long Beach, CA, USA, 4–9 December 2017. [Google Scholar] [CrossRef]
  29. Krauledat, M.; Dornhege, G.; Blankertz, B.; Müller, K.-R. Robustifying EEG data analysis by removing outliers. Chaos Comple. Lett. 2007, 2, 259–274. [Google Scholar]
  30. Saha, S.; Ahmed, K.I.; Mostafa, R.; Khandoker, A.H.; Hadjileontiadis, L. Enhanced inter-subject brain computer interface with associative sensorimotor oscillations. Health. Technol. Lett. 2017, 4, 39–43. [Google Scholar] [CrossRef]
  31. Ishii, R.; Canuet, L.; Ishihara, T.; Aoki, Y.; Ikeda, S.; Hata, M.; Katsimichas, T.; Gunji, A.; Takahashi, H.; Nakahachi, T.; et al. Frontal midline theta rhythm and gamma power changes during focused attention on mental calculation: An MEG beamformer analysis. Front. Hum. Neurosci. 2014, 8, 406. [Google Scholar] [CrossRef]
  32. Cavanagh, J.F.; Frank, M.J. Frontal theta as a mechanism for cognitive control. Trends Cogn. Sci. 2014, 18, 414–421. [Google Scholar] [CrossRef]
  33. Harper, J.; Liu, M.; Malone, S.M.; McGue, M.; Iacono, W.G.; Vrieze, S.I. Using multivariate endophenotypes to identify psychophysiological mechanisms associated with polygenic scores for substance use, schizophrenia, and education attainment. Psychol. Med. 2022, 52, 3913–3923. [Google Scholar] [CrossRef]
  34. Sherfey, J.; Ardid, S.; Miller, E.K.; Hasselmo, M.E.; Kopell, N.J. Prefrontal oscillations modulate the propagation of neuronal activity required for working memory. Neurobiol Learn. Mem. 2020, 173, 107228. [Google Scholar] [CrossRef] [PubMed]
  35. Bastos, A.M.; Loonis, R.; Kornblith, S.; Lundqvist, M.; Miller, E.K. Laminar recordings in frontal cortex suggest distinct layers for maintenance and control of working memory. Proc. Natl. Acad. Sci. USA 2018, 115, 1117–1122. [Google Scholar] [CrossRef] [PubMed]
Figure 1. Timeline of trial presentation with an example of an arithmetic task. * represents the fixation image.
Applsci 13 06606 g001
Figure 2. Results of the cross-subject classification: the left panel shows the least successful individuals with an advanced level of education in mathematics versus the least successful individuals with a basic level of education in mathematics; the right panel shows the most successful individuals with an advanced level of education in mathematics versus the most successful individuals with a basic level of mathematics. The Y-axis represents values of balanced accuracy of classification (blue bars) and values of the area under the curve (pink bars). The black line is the chance level.
Applsci 13 06606 g002
Figure 3. Classification of resting-state EEG belonging to the most successful participants with advanced math skills (SAM) versus resting-state EEG belonging to the most successful participants with basic math skills (SBM): (a) Mean Shapley Additive Explanations (SHAP) values for power spectral density (PSD) feature contributions and their locations in the sensor space for six frequency bands; the color bar reflects that the more intensive yellow-white color corresponds to greater contribution of this feature in the classification accuracy; (b) receiver operating characteristics area under curve (ROC–AUC) illustrates the probability of true positive rate against false positive rate in recognition of two classes for cross-subject classification of SAM versus SBM subject pairs restrings-state EEG (six different folds are reflected in different colors and the bold blue line corresponds to mean ROC–AUC based on PSD). The dashed red line corresponds to the chance level to distinguish SAM versus SBM subject EEG, the gray area shows 1 standard deviation of ROC probability.
Applsci 13 06606 g003
Figure 4. The thirty mean Shapley Additive Explanations (SHAP) values for power spectral density (PSD) features, which had the most significant impact on the accuracy of resting-state EEG belonging to the most successful participants with advanced math skills (SAM) versus resting-state EEG belonging to the most successful participants with basic math skills (SBM): (a) top 30 highest SHAP values for frequency bands/electrodes; (b) electrode positions with the top 30 highest SHAP feature values.
Applsci 13 06606 g004
Table 1. Social-demographic data for the studied groups (DT—decision time).
Group/Social-Demographic StatusTotal, nMale, nAge, Mean ± StDevAM, nBM, n
AM12927.00 ± 5.36--
BM14524.64 ± 4.47--
HS: DT < median 13925.15 ± 5.1676
MS: DT > median 13526.31 ± 4.8558
SAM: DT < median in AM group6523.83 ± 4.17--
SBM: DT < median in BM group6324.33 ± 3.27--
LAM: DT > median in AM group6430.17 ± 4.67--
LBM: DT > median in BM group6222.50 ± 1.97--
Acronyms for the groups: AM—advanced math, BM—basic math, HS—highly successful, MS—moderately successful, SAM—the most successful participants from the AM group, SBM—the most successful participants from the BM group, LAM—the least successful participants from the AM group, LBM—the most successful participants from the BM group.
Table 2. Examples of three types of cognitive tasks.
Task GroupTask SpecificationExampleNumber of Tasks
VerbalFive-letters anagramsO E S G O (goose)30
Six-letters anagramsR L O F E D (folder)30
ArithmeticAddition44 + 66 + 12 + 712
Subtraction6435−484612
Multiplication27 × 9 + 5 × 624
Fraction7/12–4/1012
LogicalArithmetic sequences93; 82; 41; 30; 1560
Table 3. Averaged results (mean ± standard deviation) of behavioral performance (CA—correct answers in % and DT—decision time) for the studied groups.
GroupVerbalArithmeticLogical
CADTCADTCADT
AM78.19 ± 11.1611.59 ± 3.8078.61 ± 10.5118.83 ± 3.7977.22 ± 17.4015.75 ± 4.45
BM76.19 ± 13.2812.14 ± 4.5065.71 ± 17.5722.71 ± 4.1669.64 ± 21.0118.21 ± 3.53
HS49.77 ± 5.339.58 ± 3.4049.15 ± 4.5817.04 ± 2.8549.00 ± 9.3012.80 ± 2.06
MS42.77 ± 7.4613.67 ± 3.3036.85 ± 9.2822.35 ± 2.3838.77 ± 11,8318.23 ± 2.28
SAM50.33 ± 5.399.66 ±4.0950.33 ± 5.6515.49 ± 2.4349.00 ± 12.9511.42 ± 1.61
SBM50.50 ± 5.098.92 ± 2.8548.17 ± 3.9218.44 ± 2.8649.83 ± 5.8514.15 ± 1.74
LAM43.50 ± 6.4413.11 ± 2.6944.00 ± 5.6220.43 ± 2.32 43.67 ± 7.4217.01 ± 3.76
LBM38.67 ± 5.7915.34 ± 2.8732.50 ± 10.4423.50 ± 2.4332.50 ± 13.6918.81 ± 1.17
Acronyms for the groups: AM—advanced math, BM—basic math, HS—highly successful, MS—moderately successful, SAM—the most successful participants from the AM group, SBM—the most successful participants from the BM group, LAM—the least successful participants from the AM group, LBM—the most successful participants from the BM group. Numbers highlighted in bold differed significantly for the HS and MS group.
Disclaimer/Publisher’s Note: The statements, opinions and data contained in all publications are solely those of the individual author(s) and contributor(s) and not of MDPI and/or the editor(s). MDPI and/or the editor(s) disclaim responsibility for any injury to people or property resulting from any ideas, methods, instructions or products referred to in the content.

