Article

Development of a New Eye Movement Measurement Device Using Eye-Tracking Analysis Technology

1
Department of Orthoptics and Visual Sciences, Faculty of Medical Technology, Niigata University of Health and Welfare, Niigata 950-3198, Japan
2
Department of Vision Science, Faculty of Sensory and Motor Control, Kitasato University Graduate School of Medical Science, Sagamihara 252-0373, Japan
3
Department of Rehabilitation, Orthoptics and Visual Science Course, School of Allied Health Sciences, Kitasato University, Sagamihara 252-0373, Japan
*
Author to whom correspondence should be addressed.
Appl. Sci. 2023, 13(10), 5968; https://doi.org/10.3390/app13105968
Submission received: 13 April 2023 / Revised: 10 May 2023 / Accepted: 11 May 2023 / Published: 12 May 2023
(This article belongs to the Special Issue Applied Optics and Vision Science)

Abstract

:
Smooth pursuit eye movements and saccadic eye movements are vital for precise vision. Therefore, tests for eye movement are important for assessing nervous or muscular diseases. However, objective measurements are not frequently performed due to the need for a polygraph system, electrodes, amplifier, and personal computer for data analysis. To address this, we developed an all-in-one eye-movement-measuring device that simultaneously presents visual stimuli, records eye positions, and examines its feasibility for evaluating eye movements. This device generates stimulus that induces eye movements and records those movements continuously. The horizontal or vertical eye movements of 16 participants were measured at various visual target speeds of 20–100 deg/s. The maximum cross-correlation coefficient (rho max) between the eye and visual target positions was used as an index of eye movement accuracy. A repeated-measures multi-way analysis of variance was performed, with the main effect being that rho max significantly decreased as the visual target speed increased. The average (±standard deviation) rho max values across all velocities were 0.995 ± 0.008 and 0.967 ± 0.062 in the horizontal and vertical directions, respectively, and were significantly higher for horizontal eye movements than for vertical eye movements. Moreover, rho max and saccadic frequency were significantly correlated for the slowest and fastest visual target motions. These suggest that our device enables accurate measurements of eye movements. We believe our new measurement device can be applied clinically for easily and objectively evaluating eye movements.

1. Introduction

Stable fixation on a visual target and stabilization of retinal images are crucial for achieving precise binocular vision. The stabilization of retinal images is supported by several types of eye movements, including reflex eye movements, such as vestibular-ocular reflex and optokinetic nystagmus, smooth pursuit eye movements (pursuit), and voluntary eye movements, such as saccadic eye movements (saccades) and vergence eye movements [1]. Each eye movement is controlled by several brain regions [2]. Eye movement measurements are used to assess brain and extraocular muscle damage. Moreover, saccades and pursuits in patients with amblyopia [3,4] and low vision [5] differ from those in healthy individuals. A recent study reported that patients with macular degeneration exhibited misdirected saccades and misalignment with the target trajectory during pursuit [6].
Eye movements are typically only measured in patients with brain injury or paralysis of the extraocular muscles in routine ophthalmological practice. Several methods for measuring eye movements exist, such as the search coil [7] and electro-oculography (EOG) [8]. The search coil method is accurate but is highly invasive, as it uses contact-lens electrodes. EOG is performed by attaching electrodes around the eyes. However, body movements, fluctuating test room illumination, and electrode misalignment may cause artifacts that lead to inaccurate measurement results [9,10]. Common disadvantages of both methods include the need for a polygraph system, electrodes, amplifier, and personal computer for data analysis [11]. Given the lack of all-in-one equipment, these methods require complex and large-scale measurement equipment. Therefore, eye movements are not routinely measured in ophthalmology. Recently, video-based eye trackers have emerged, which enable the determination of gaze direction with a high degree of accuracy. This approach measures the position of the corneal reflex of an infrared light relative to the pupil, which can be observed in both table and head-mounted configurations and allows eye-tracking in real time, thus enabling a much wider range of experimentation than was previously possible [12].
Reports suggest that measurement accuracy is similar between mobile and stationary video-based eye trackers, and eye trackers have the advantage of high measurement accuracy regardless of the model [13]. By measuring eye movements using an eye-tracking system, one study demonstrated the feasibility of measuring saccade reaction times and saccades in 115 children between 5 and 42 months of age [14], which was previously intractable using conventional methods. These developments indicate that eye movement measurements using eye trackers are accurate and simple. However, in current measurements using eye trackers, the stimulus-presenting monitor and recording device are separate devices, and the measurement conditions are not standardized. Therefore, it is difficult to measure eye movements using eye-tracking in ophthalmology clinics, which are limited to laboratory measurements.
We have developed a new all-in-one eye movement measuring device by modifying an eye-tracking-based ophthalmic examination device (ORTe EYENAC; NAC Image Technology Inc., Tokyo, Japan) [15]. This device simultaneously presents visual stimuli internally and records bilateral eye positions. Our device (referred to as “EyeScore”) (Figure 1) comprises a visual simulation generator, stimulus-presenting monitor, and two eye-tracking systems (for both eyes) within a single body. In addition, the device is portable and standalone, similar to many ophthalmic examination devices, which enables the same experiment to be performed in different facilities without any additional apparatus (e.g., personal computers). Experiments using original stimuli tend to be conducted at a single facility and are prone to bias [16]; however, this device facilitates the reproducibility of experiments. Therefore, we hypothesized that the eye movements measured by EyeScore reflected the characteristics of eye movements which had been discovered using the conventional eye movement measurement methods. In this study, we aimed to examine the validity of this new device for evaluating eye movements by examining whether the data measured using this device reflect eye movement characteristics.

2. Materials and Methods

2.1. Participants

Study participants comprised 16 university student volunteers (5 male and 11 female) who had been examined by a medical doctor and had no eye diseases. Sixteen participants were enrolled between 18 November 2021 and 1 June 2022. The mean age of the study participants was 21.3 years (standard deviation, 0.8 years; range, 20.1–22.9 years). The cut-off values for exclusion of participants were stereoacuity worse than 100 s and visual acuity worse than 0.0 logMAR units. Stereoacuity measured using the Stereo Fly test (Stereo Optical Co., Inc., Chicago, IL, USA) was better than 60 s, and visual acuity was 0.0 logMAR units or better for all participants. The data were de-identified before any analysis.

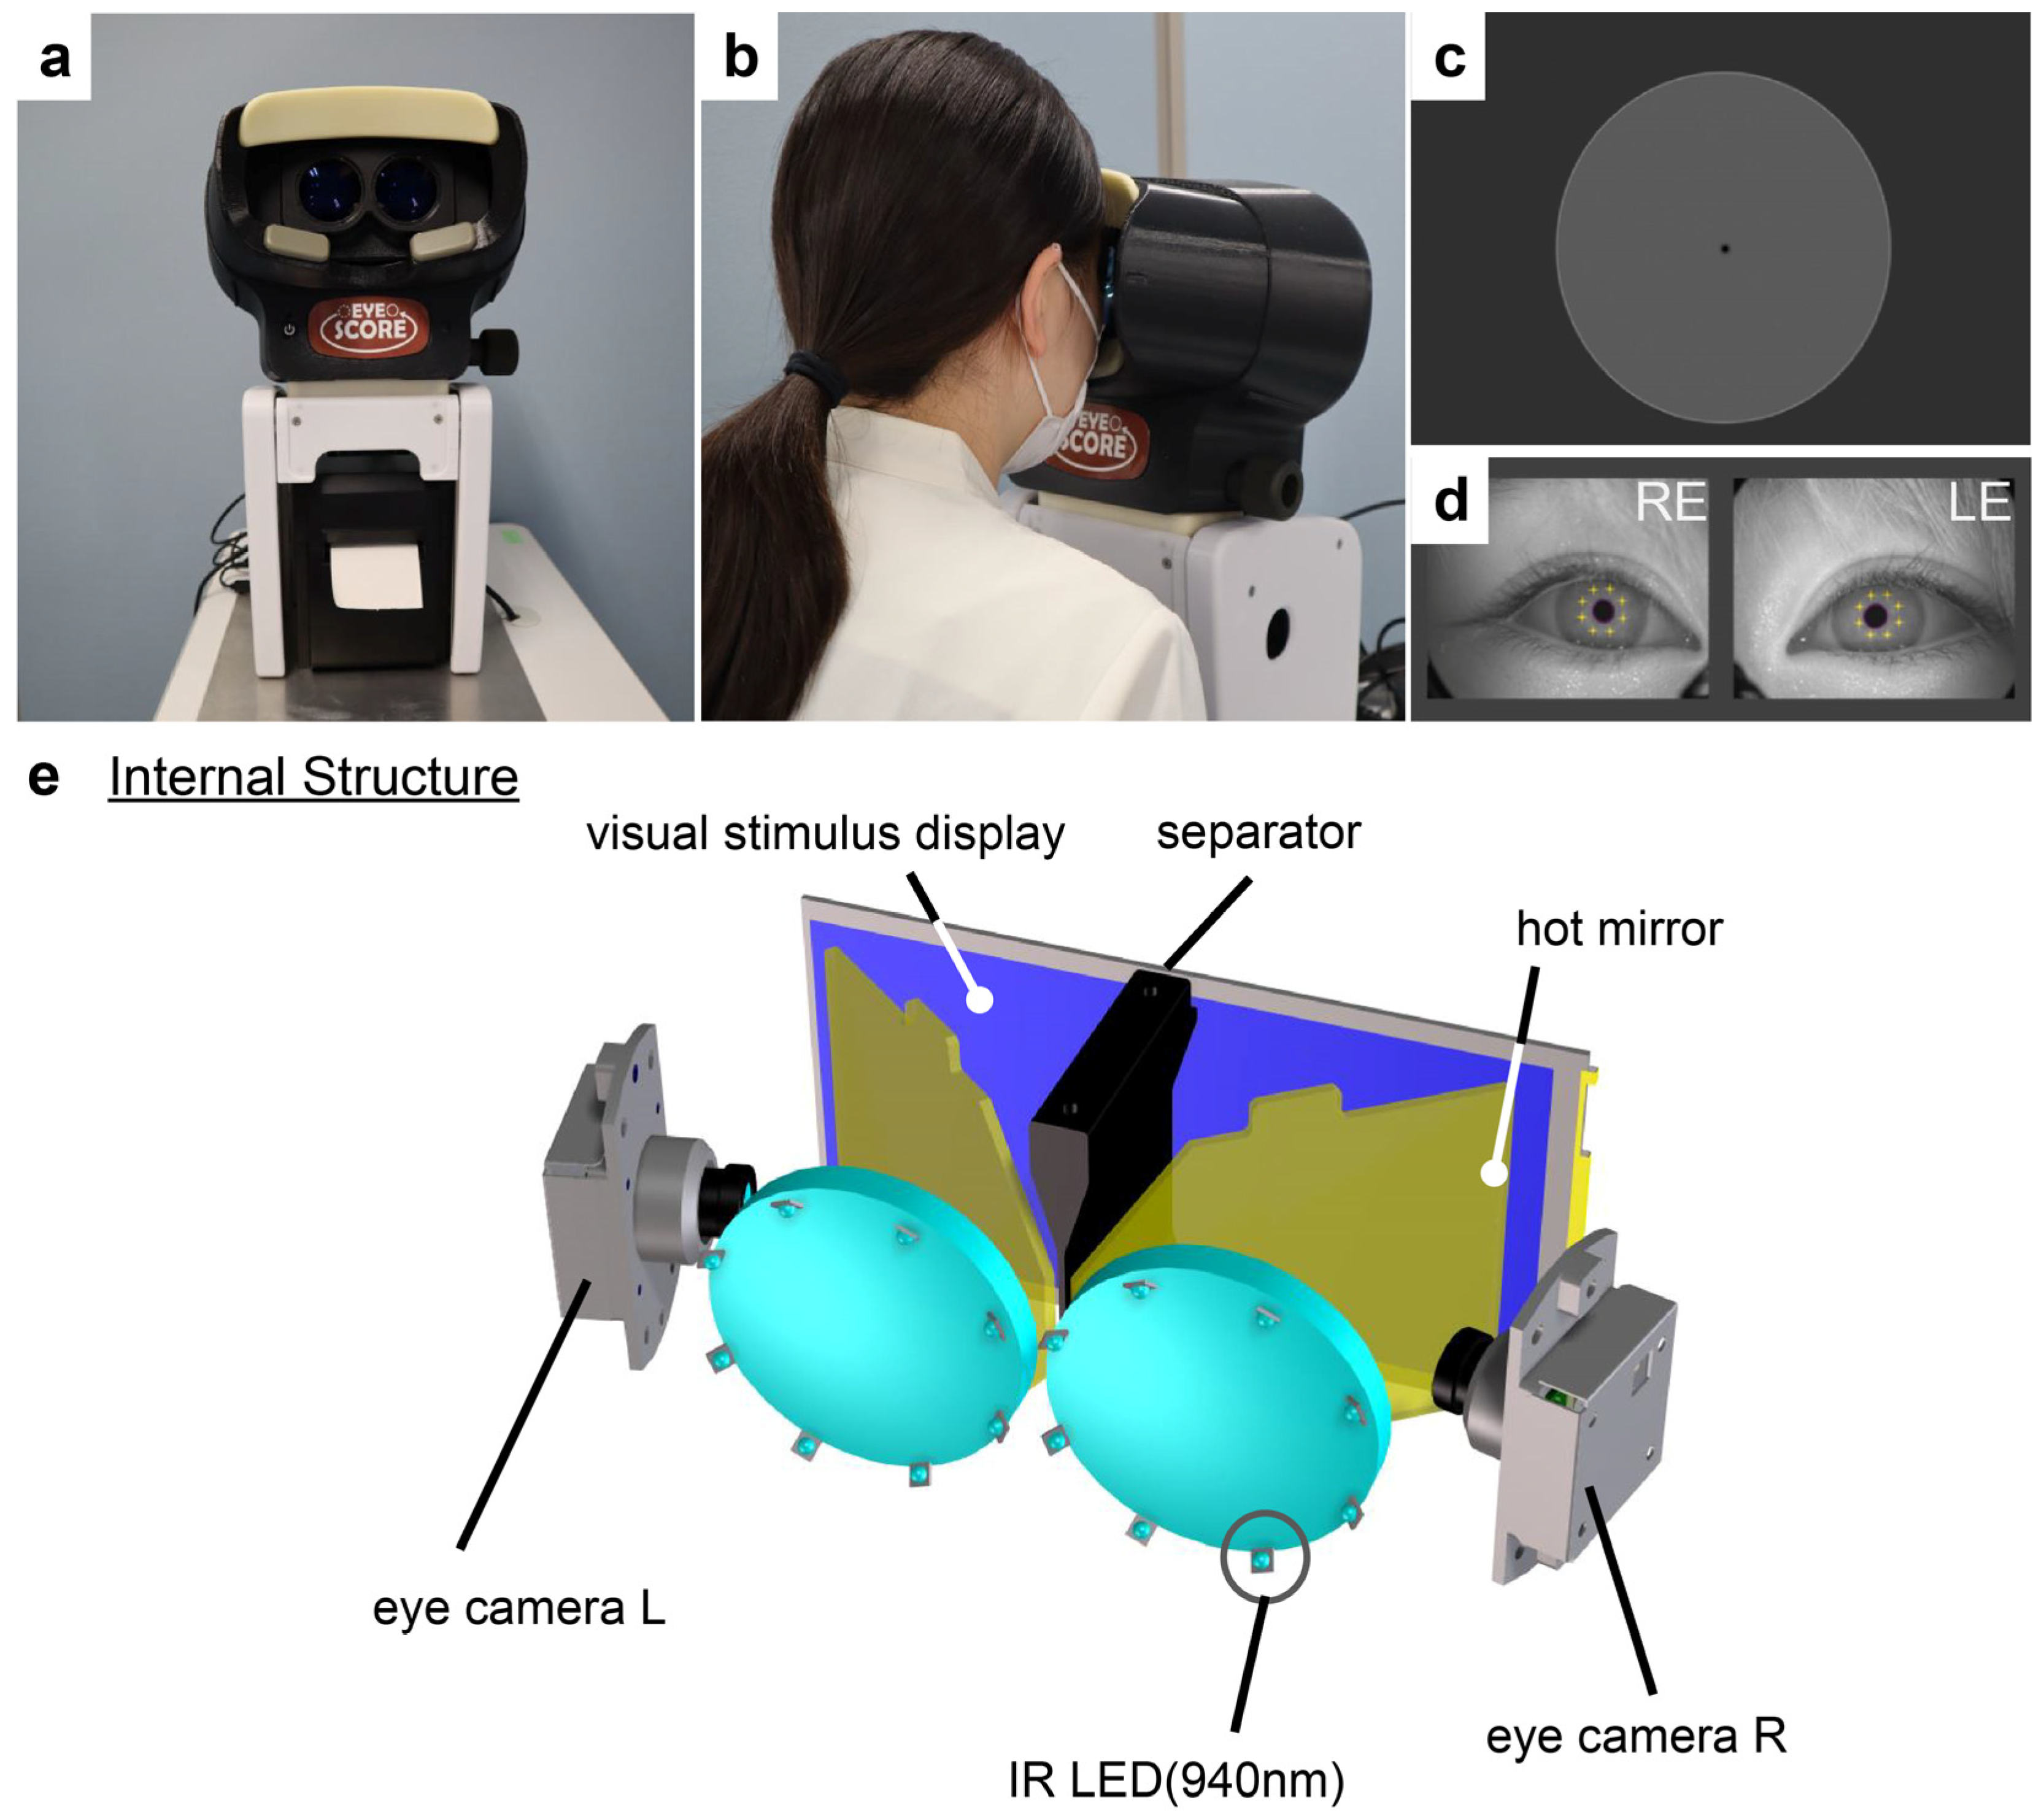
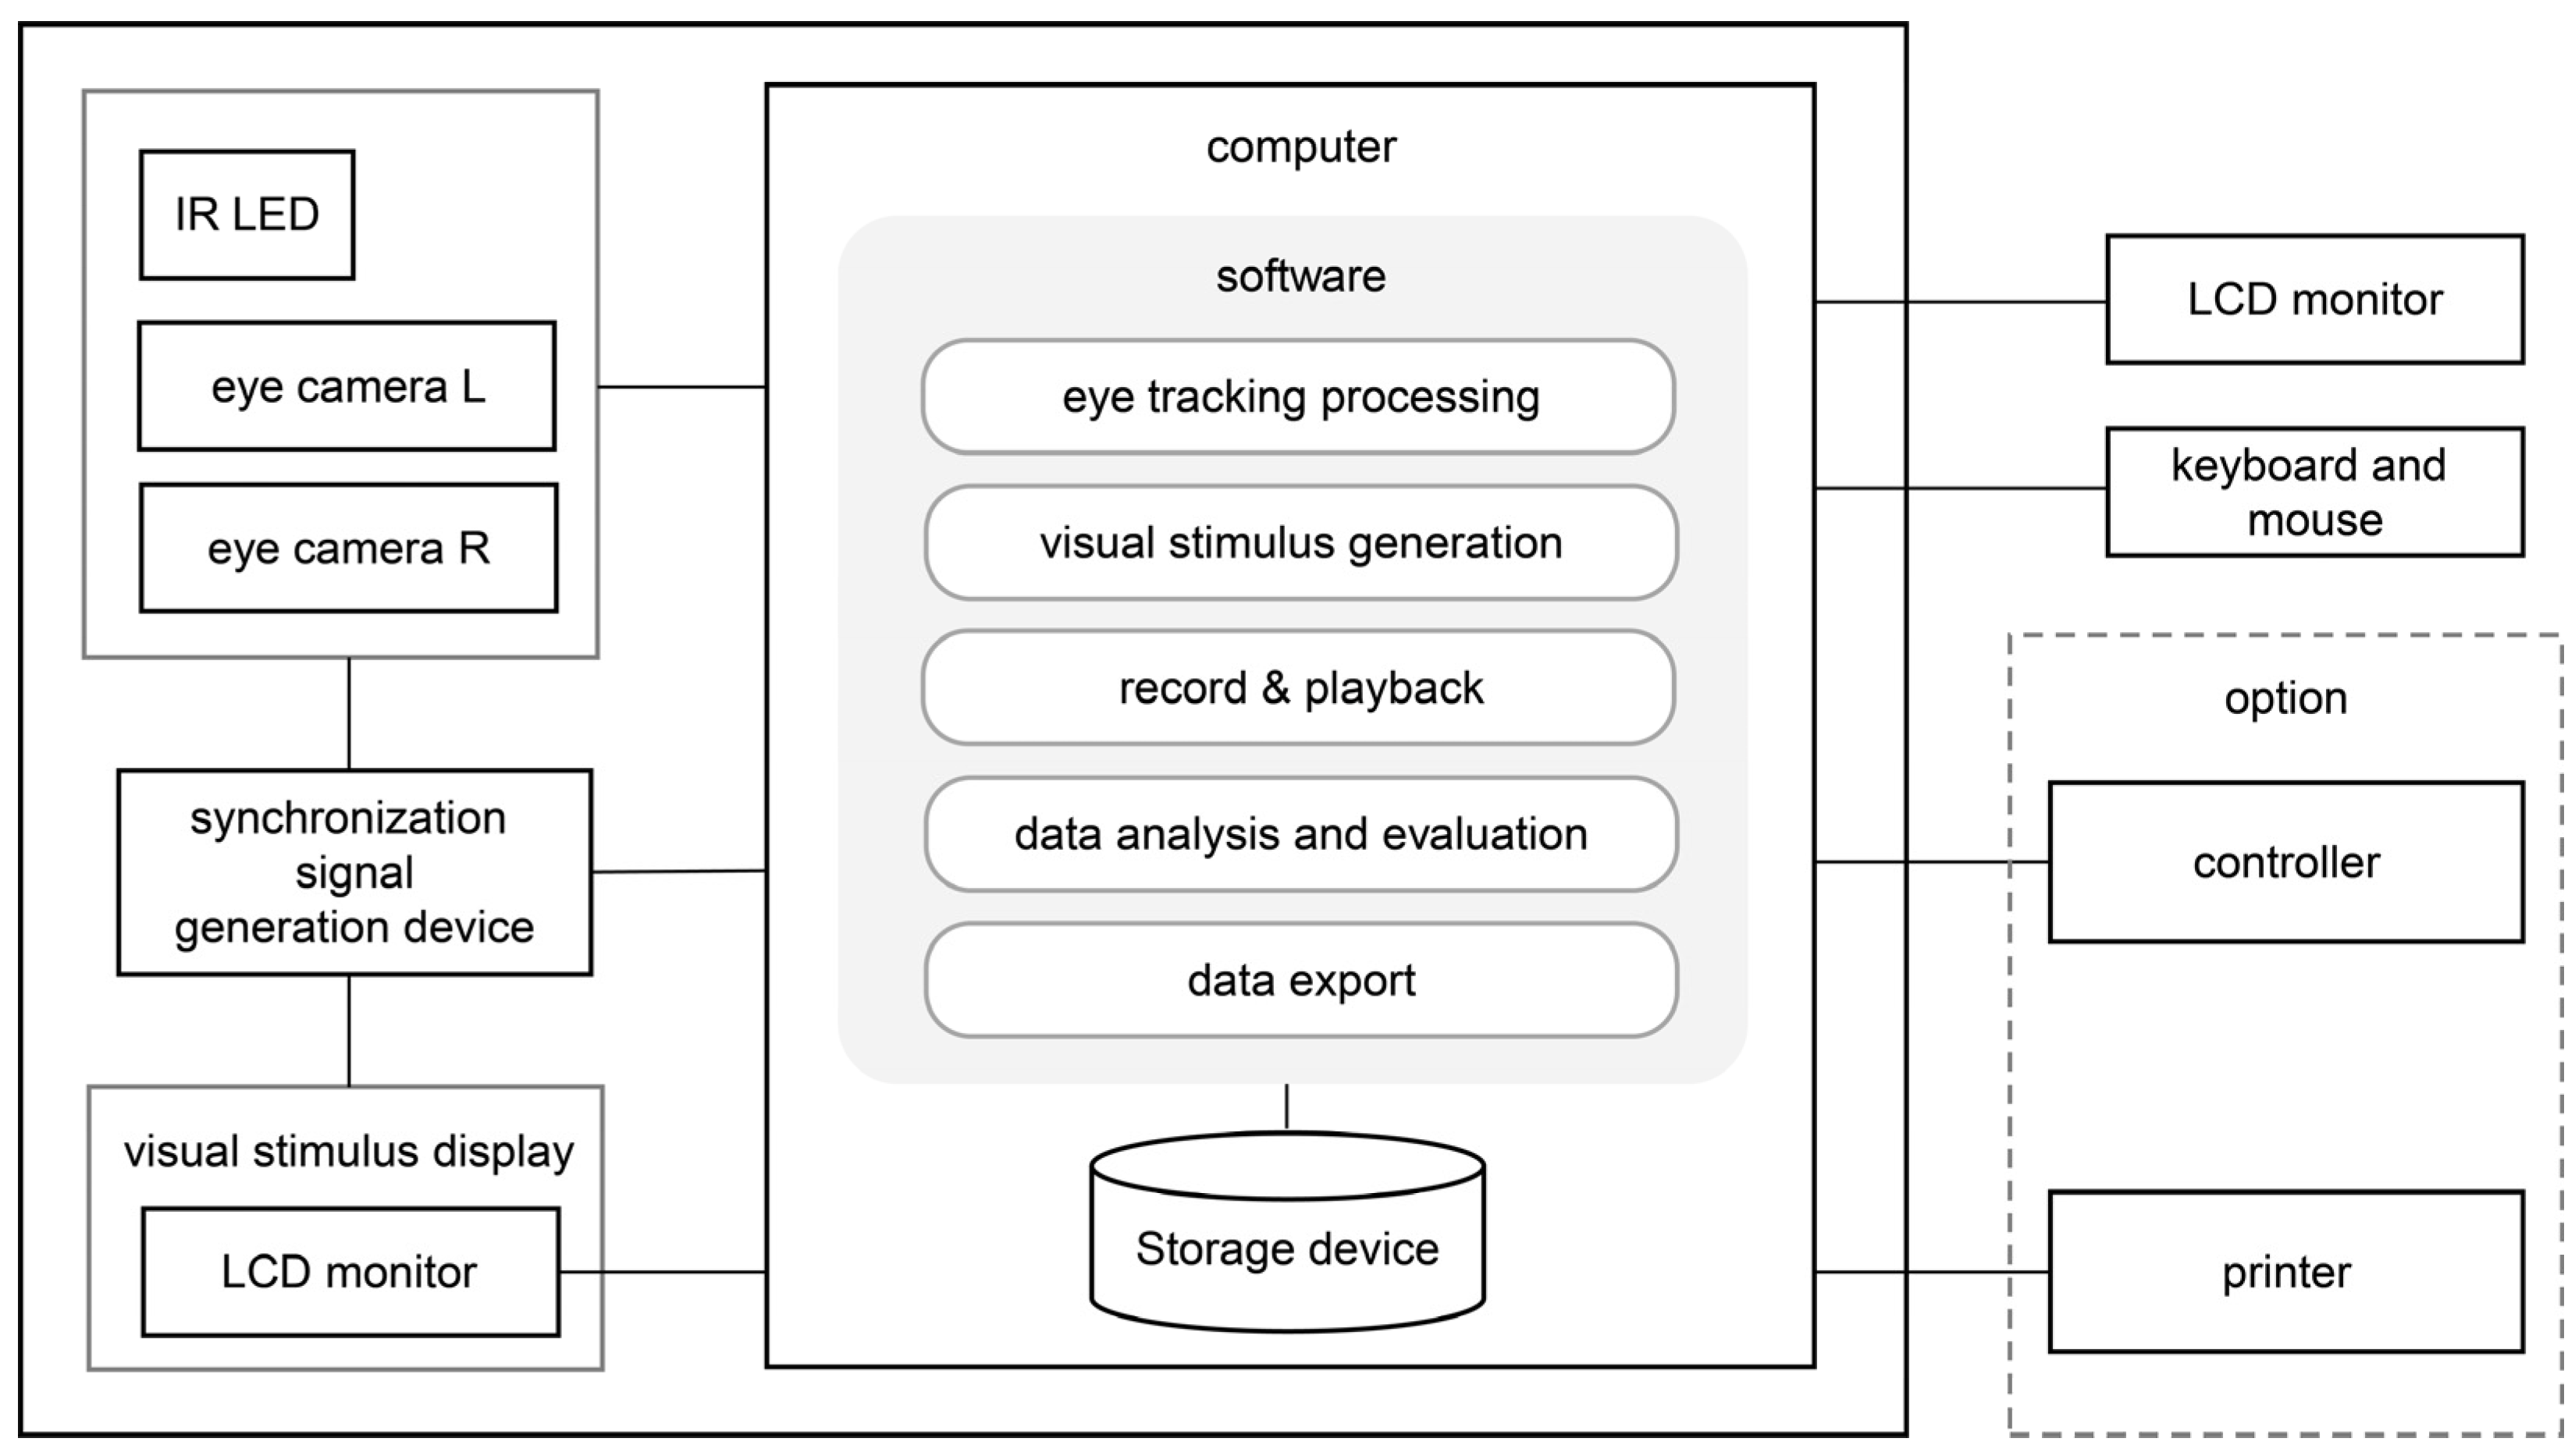
2.2. Device and Measurements

We developed a new measurement device (“EyeScore”, Figure 1) by modifying the commercially available eye-tracking device ORTe EYENAC (NAC Image Technology Inc., Tokyo, Japan). The EyeScore presents stimuli on an internal liquid crystal display (LCD) monitor and simultaneously measures the gaze of both eyes. With separator, EyeScore presents images to the left and right eyes independently (Figure 1e). The size of the internal monitor was 6 inches, with a resolution of 2560 × 1440 pixels. The image on the LCD monitor was designed to be viewed through the eyepiece at 33 cm. EyeScore has a built-in computer that generates visual stimuli, detects eye position, and records data (Figure 2). In addition, there are two cameras that record the right and the left eye at the same time, and both eye positions are detected independently. The sampling rate for eye position measurement was 30 Hz. There was a delay of 3–5 frames (mean 4.5) between the stimulation subsystem and eye-position-measuring subsystem. Accordingly, eye position data were delayed by approximately 0.15 s to the visual target presentation.
The stimulus was a circle, and the visual angle of the circle was 0.775 deg. The target generated regular triangular wave-like movements in the horizontal or vertical direction within a viewing angle of 20 deg for 20 s. The target speeds were 20, 40, 60, 80, and 100 deg/s for both horizontal and vertical movements. For every target speed, a pair of trials was performed in the horizontal and vertical directions. In each trial, participants were instructed to follow the target as smoothly as possible. The eye-tracking and calibration method was the same as that of ORTe EYENAC [15].

2.3. Analysis

The eye movement component corresponding to the target motion (i.e., horizontal component in trials with horizontal visual target motion and vice versa) was analyzed. Bode plots were used to estimate the transfer functions of the visuomotor relationships. In our study, methods based on frequency domains were inappropriate due to missing data caused by blinking. Accordingly, we calculated cross-correlation coefficients for 575–600 sample pairs between the eye position data and visual target positions that were recorded simultaneously to evaluate the accuracy of gaze pursuit of the visual target. Given the delay between movements of the visual target and eyes, we sought the maximum correlation (rho max) within a time window of ±25 frames. The relationship between rho max and visual target speed was examined using repeated measures and multi-way analysis of variance (ANOVA) by including the factors of each eye (left and right eyes) and direction of target movements (horizontal and vertical). Shaffer’s Modified Sequentially Rejective Bonferroni test was performed as a post hoc analysis for the difference in target speed, which was defined as the main effect.
Eye movement velocity was obtained by subtracting the adjacent data. Based on previous studies [17,18], we defined saccades as those with eye movements of 100 deg/s or more and examined the frequency of occurrence of saccades during horizontal eye movements. We examined the Pearson product–moment correlation coefficient between rho max and frequency of saccades at each target speed. Two-sided tests were used to determine statistical significance, and the significance level was set at p < 0.05. All eye movement data were analyzed using GNU R (https://www.r-project.org/, accessed on 1 November 2022). ANOVA was performed using ANOVA-kun (http://riseki.php.xdomain.jp/index.php, accessed on 1 November 2022) on GNU R.

2.4. Ethics Approval and Consent to Participate

This study was approved by the Niigata University of Health and Welfare committee (18508-201019). The experiment was conducted in accordance with the Declaration of Helsinki, and written informed consent was obtained from all participants.

3. Results

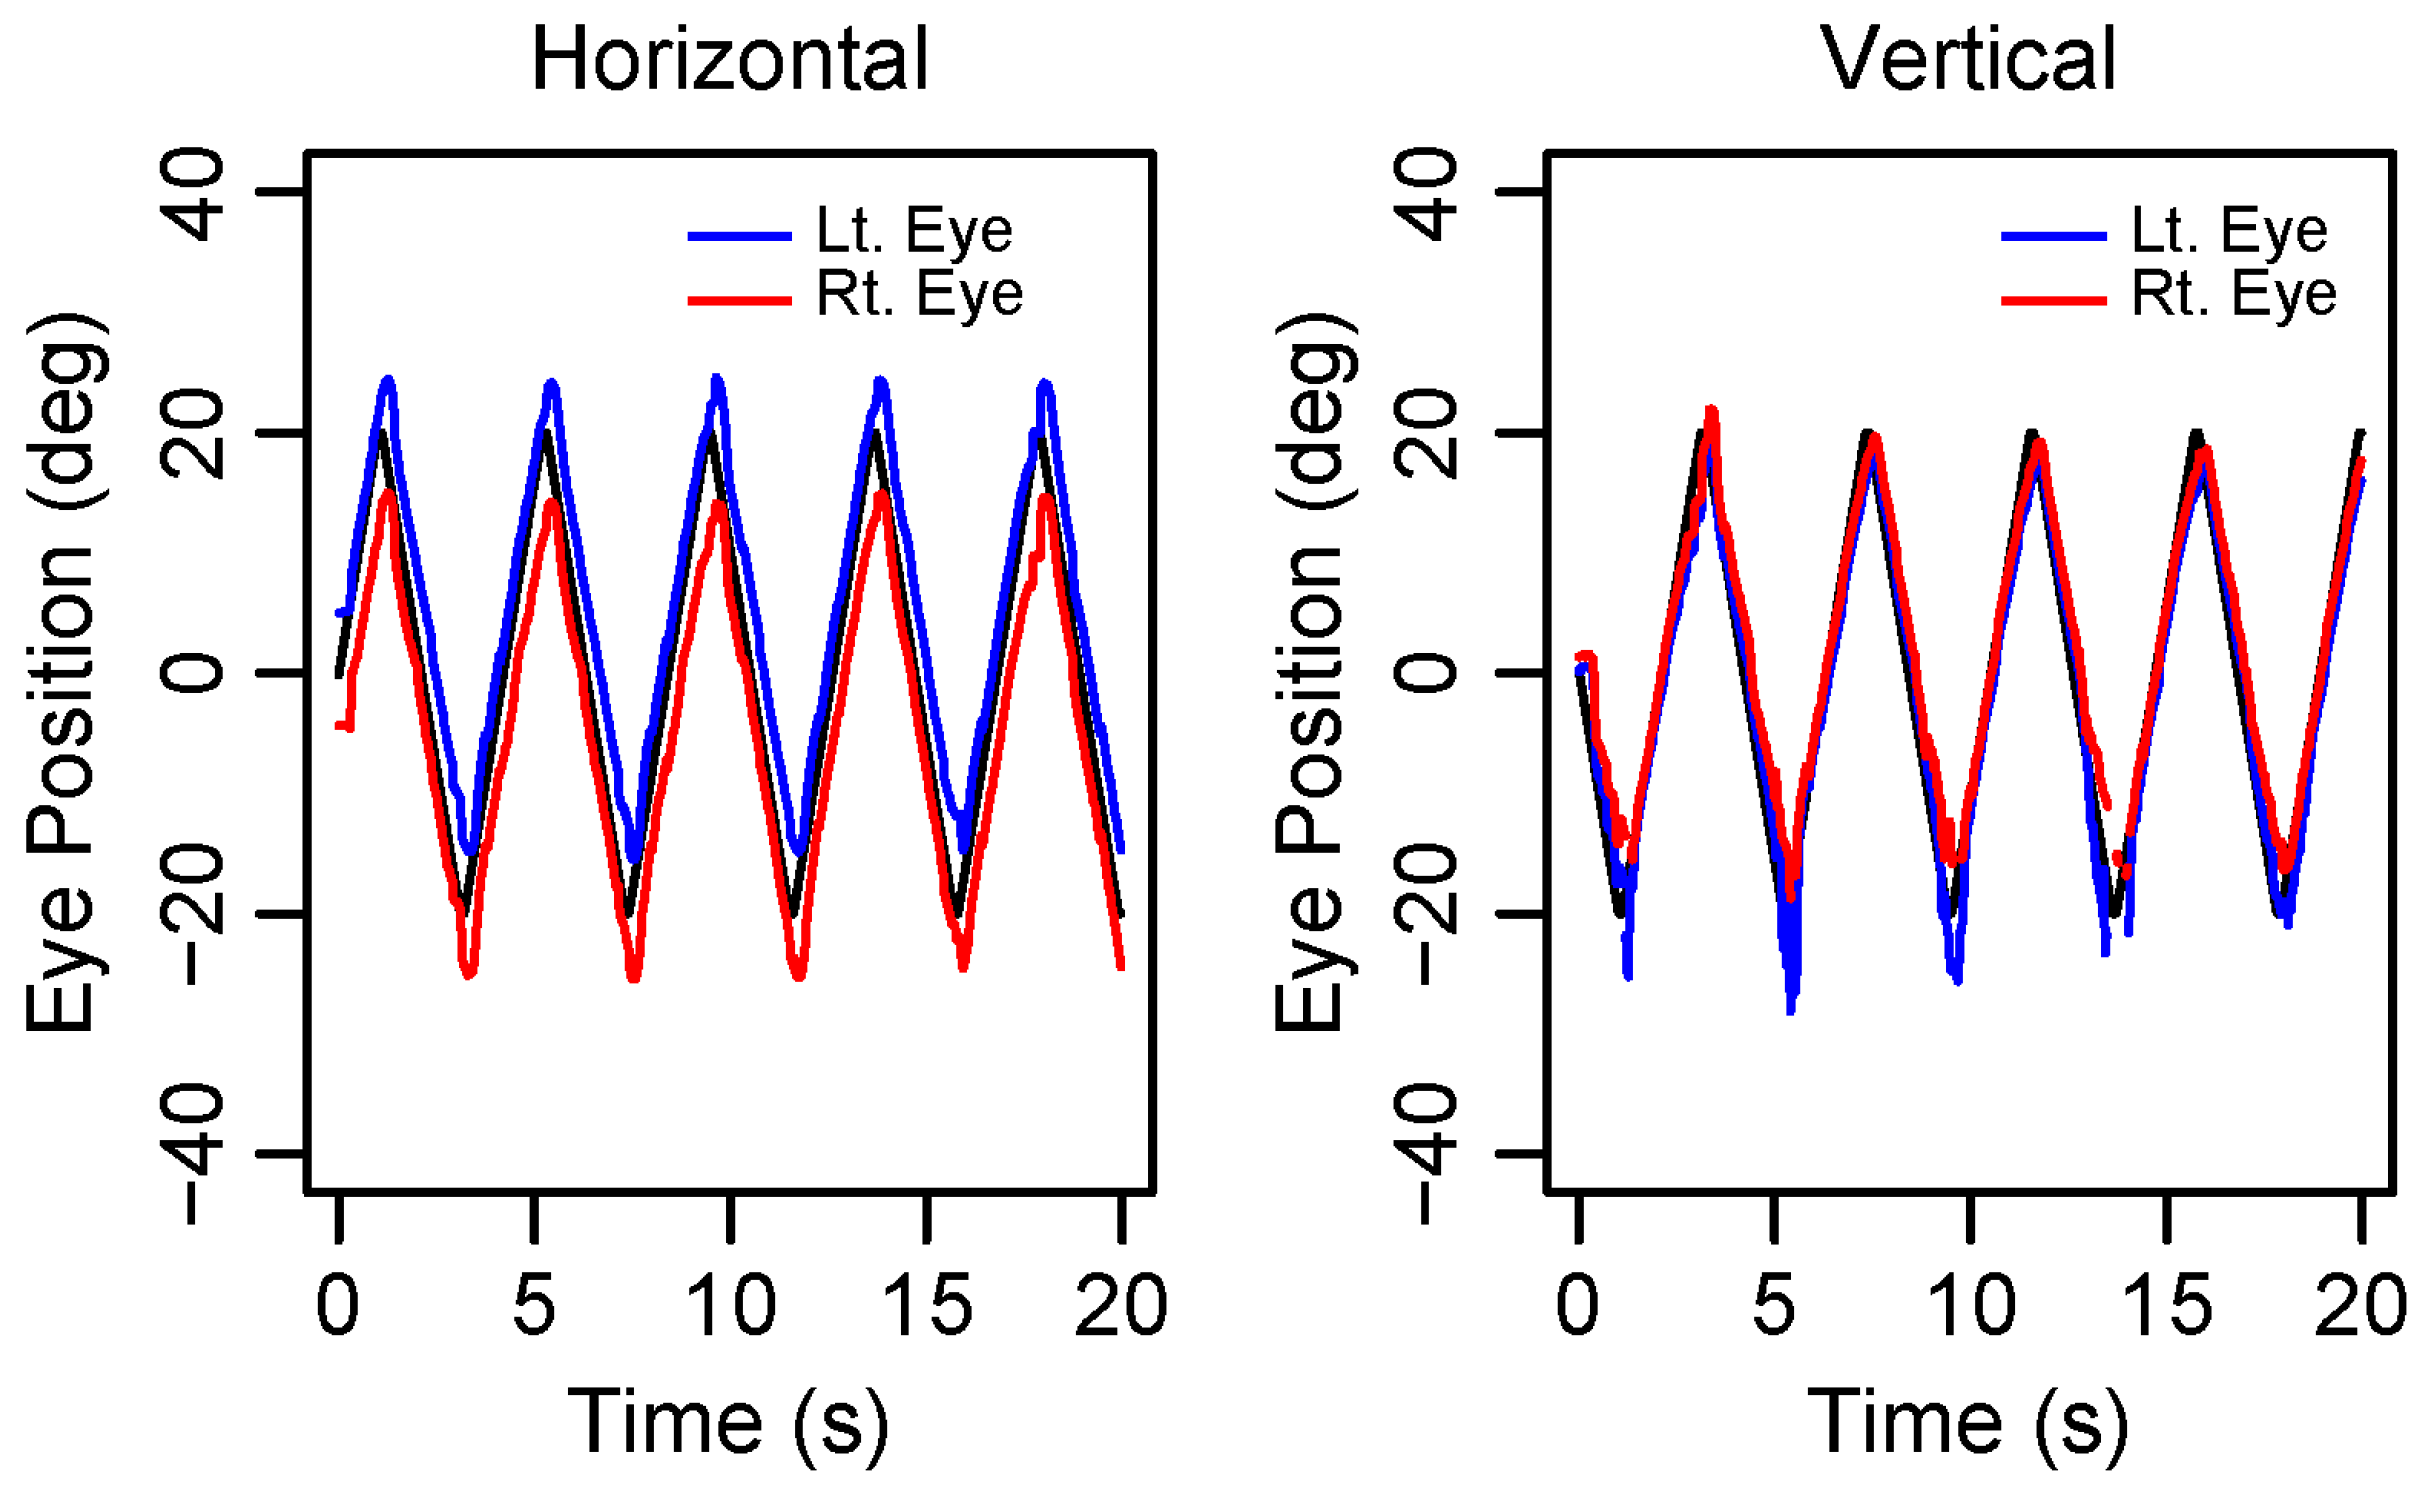
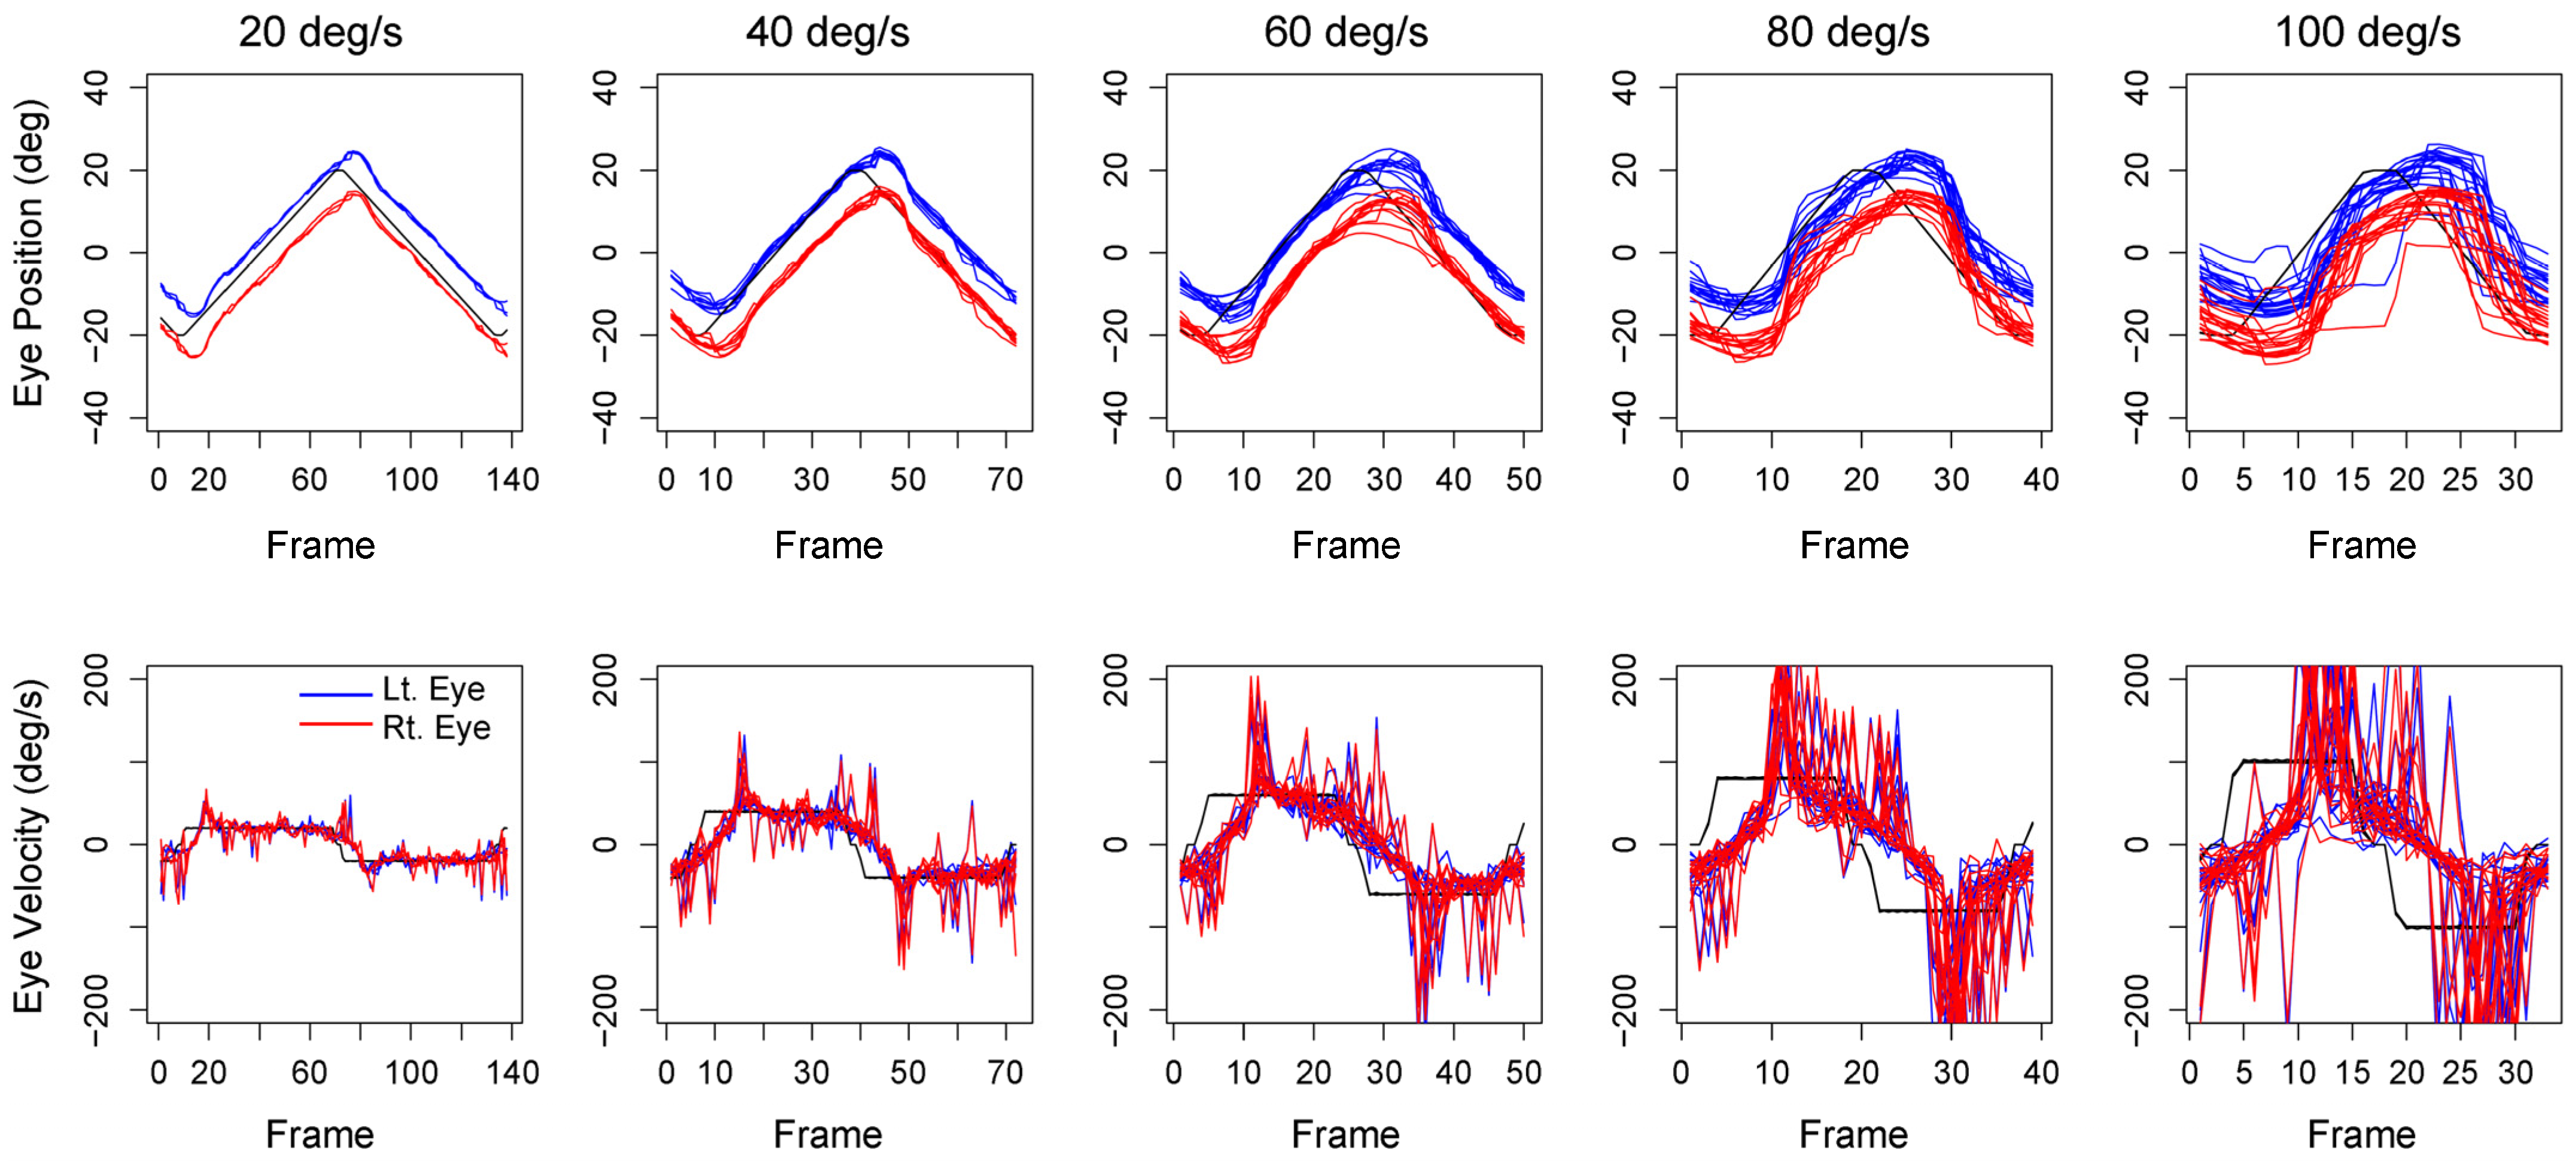
3.1. Simultaneous Measurement of Visual Target and Eye Positions

No participants were excluded, and all 16 subjects were recorded. Using the EyeScore, the positions of the target and both eyes were recorded simultaneously. As shown in Figure 3, these three components were in good agreement, except for a small bilateral deviation in horizontal eye position (“Horizontal”) and transient detection errors at downward gaze (“Vertical”). As the visual target moved in a front-parallel plane, the recorded traces of both eyes should theoretically be the same. To confirm the similarity between the movements of both eyes, cross-correlations were calculated for each participant. The mean maximum values (mean ± standard deviation) of the cross-correlation coefficients between the right and left eyes were 0.995 ± 0.008 and 0.967 ± 0.062 for horizontal and vertical eye movements, respectively, indicating appropriate recording of fronto-parallel eye movements eliciting visual target movements on an LCD (Figure 4).

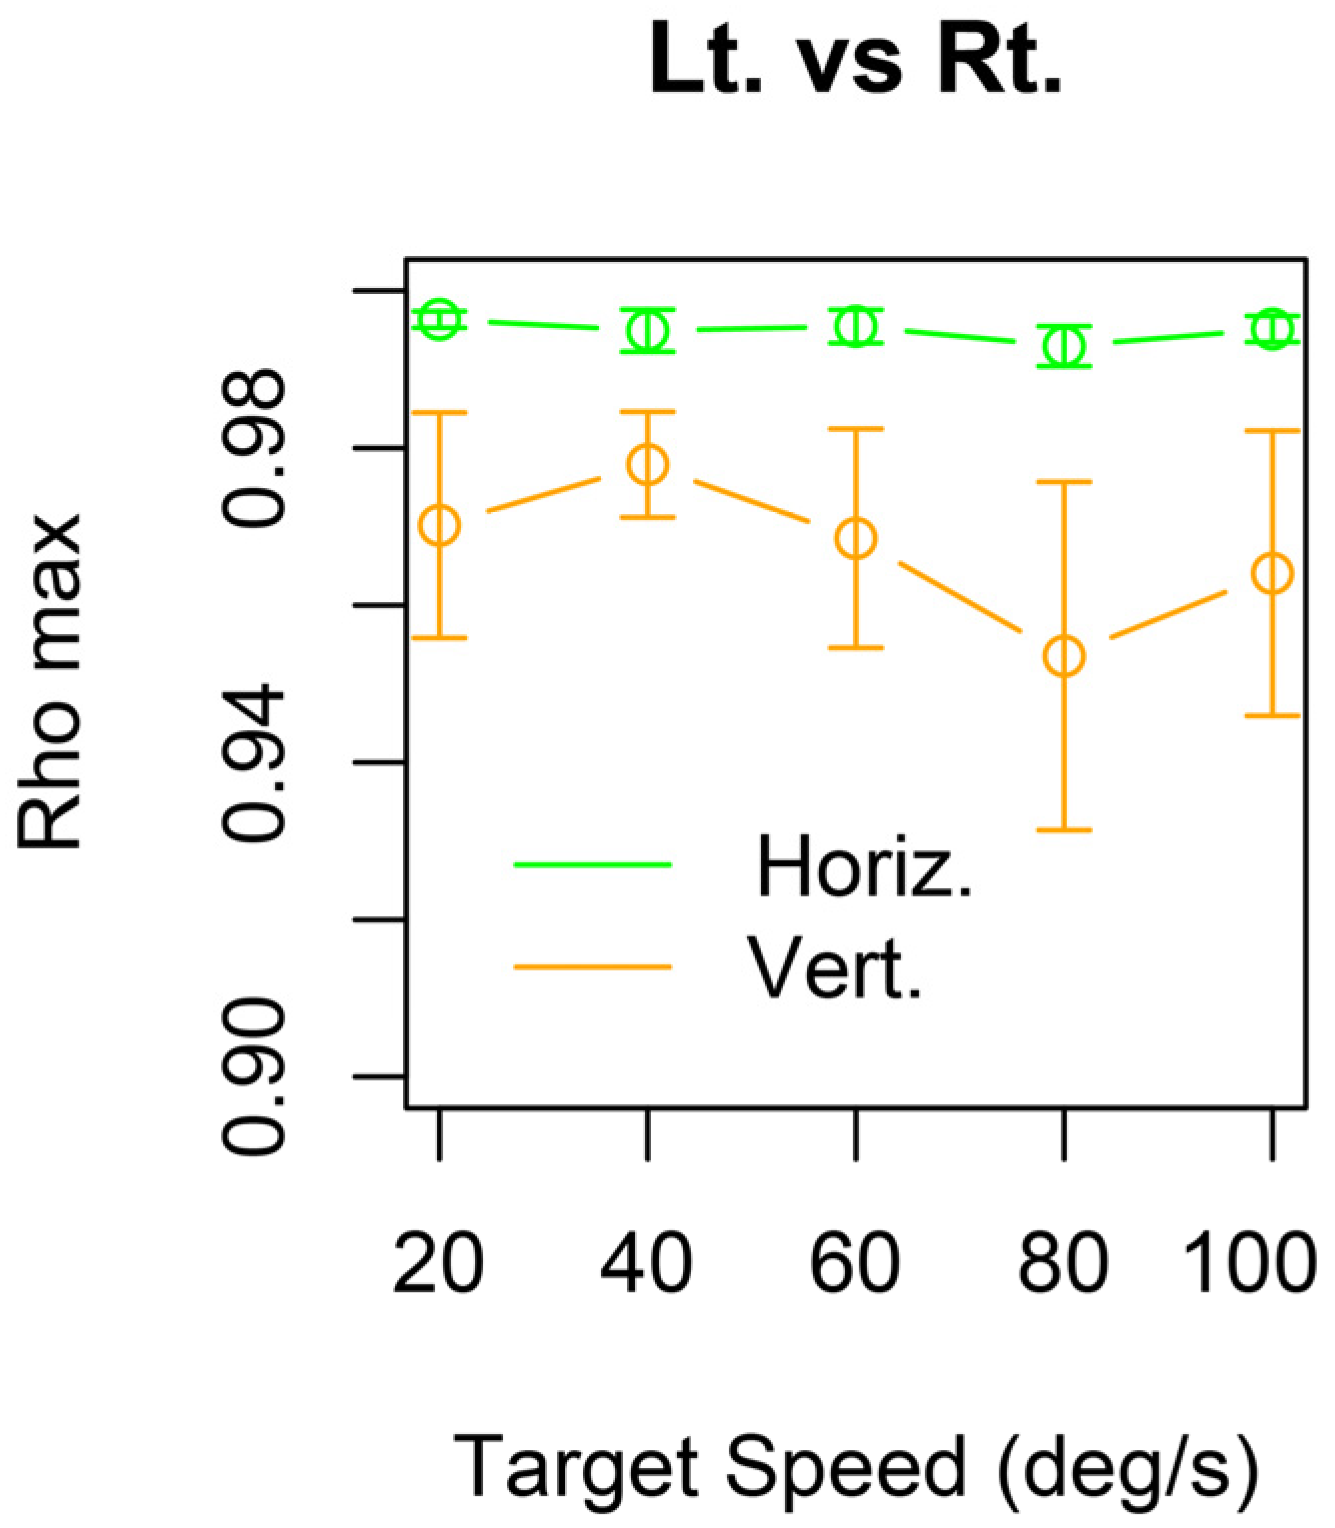
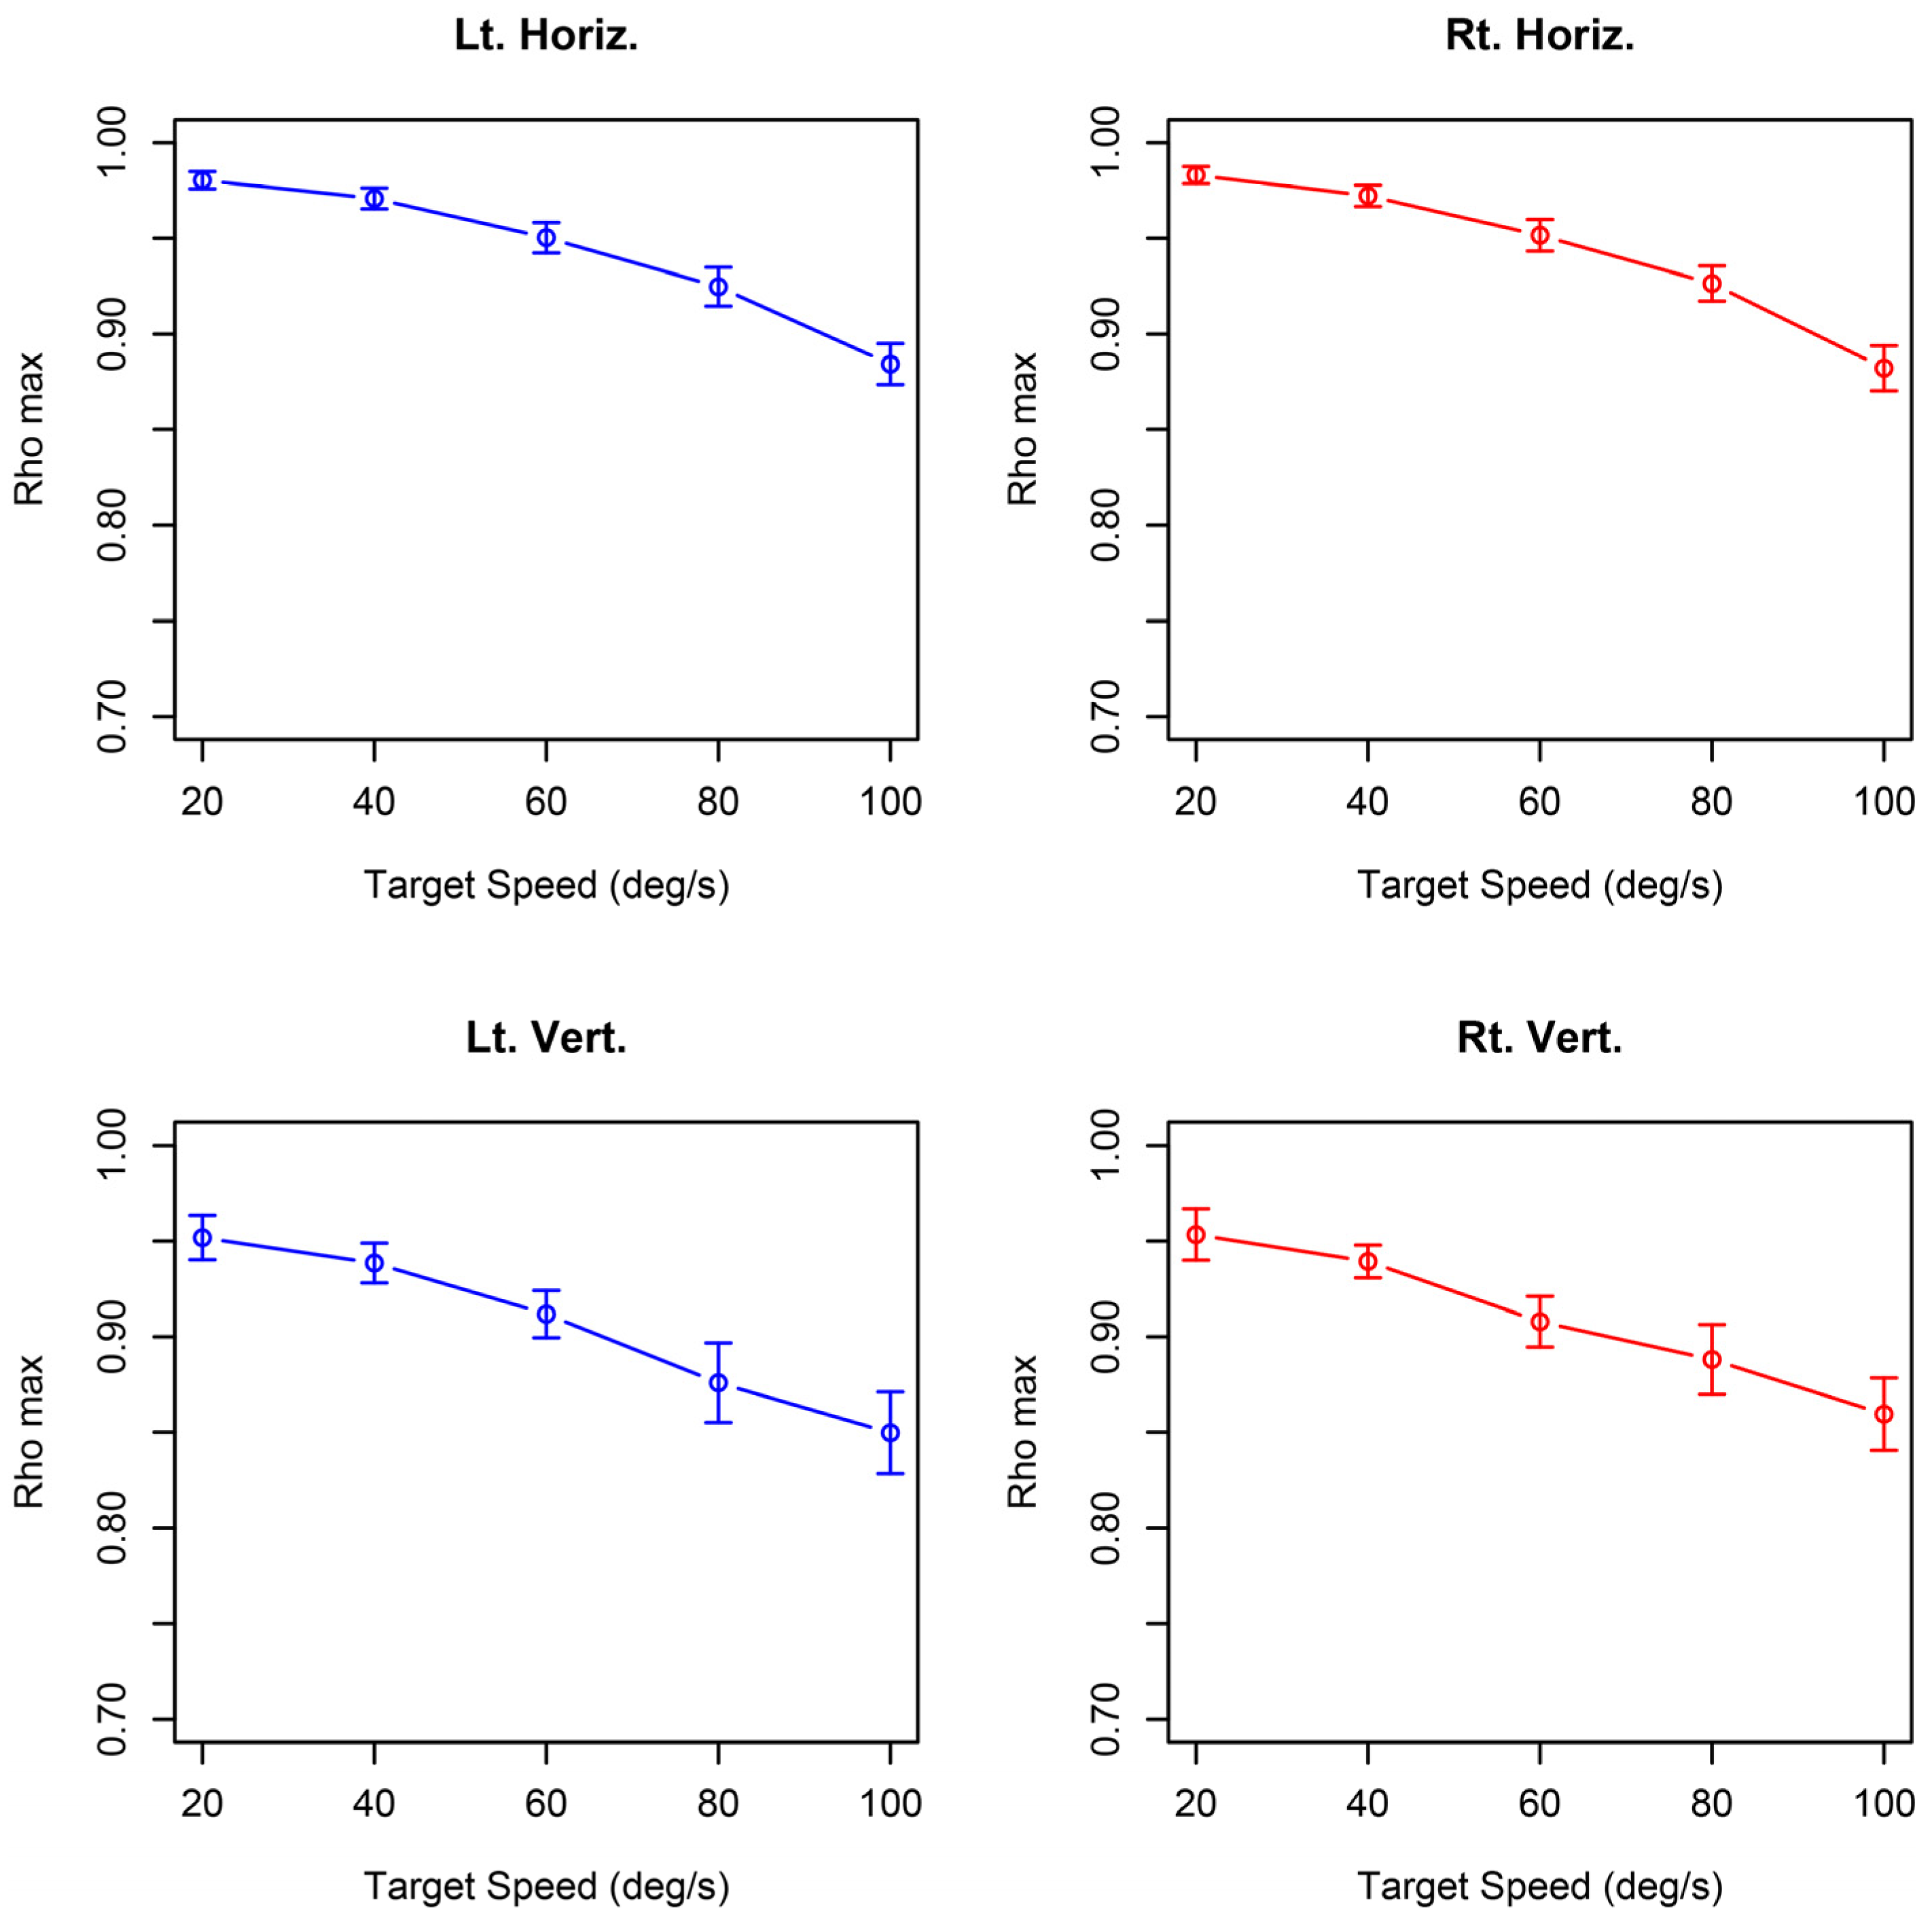
3.2. Degree of Agreement between the Visual Target and Eye Position

Rho max between the eye position data and visual target positions was used as an index to evaluate eye movement accuracy. The average rho max values of the horizontal and vertical eye movements were plotted against the visual target speeds (Figure 5). A multi-way ANOVA was performed, with the main effect indicating that rho max tended to decrease with increasing visual target speed (F [4, 60] = 32.50, p < 0.0001). Rho max was higher for horizontal eye movements than vertical eye movements (F [1, 15] = 22.59, p = 0.0003). There was no significant difference in rho max between the right and left eyes (F [1, 15] = 0.84, p = 0.3749). There was no significant interaction between visual target speed, direction of eye movement, and right and left eyes (p = 0.5832 to 0.9060). Bonferroni’s post hoc analysis revealed no significant difference (p = 0.0839) in rho max between visual velocities of 20 deg/s and 40 deg/s; however, a significant difference was observed (p = 0.0117 to <0.0001) between the other groups. These results indicate that the accuracy of eye movements decreased as visual target speed increased.

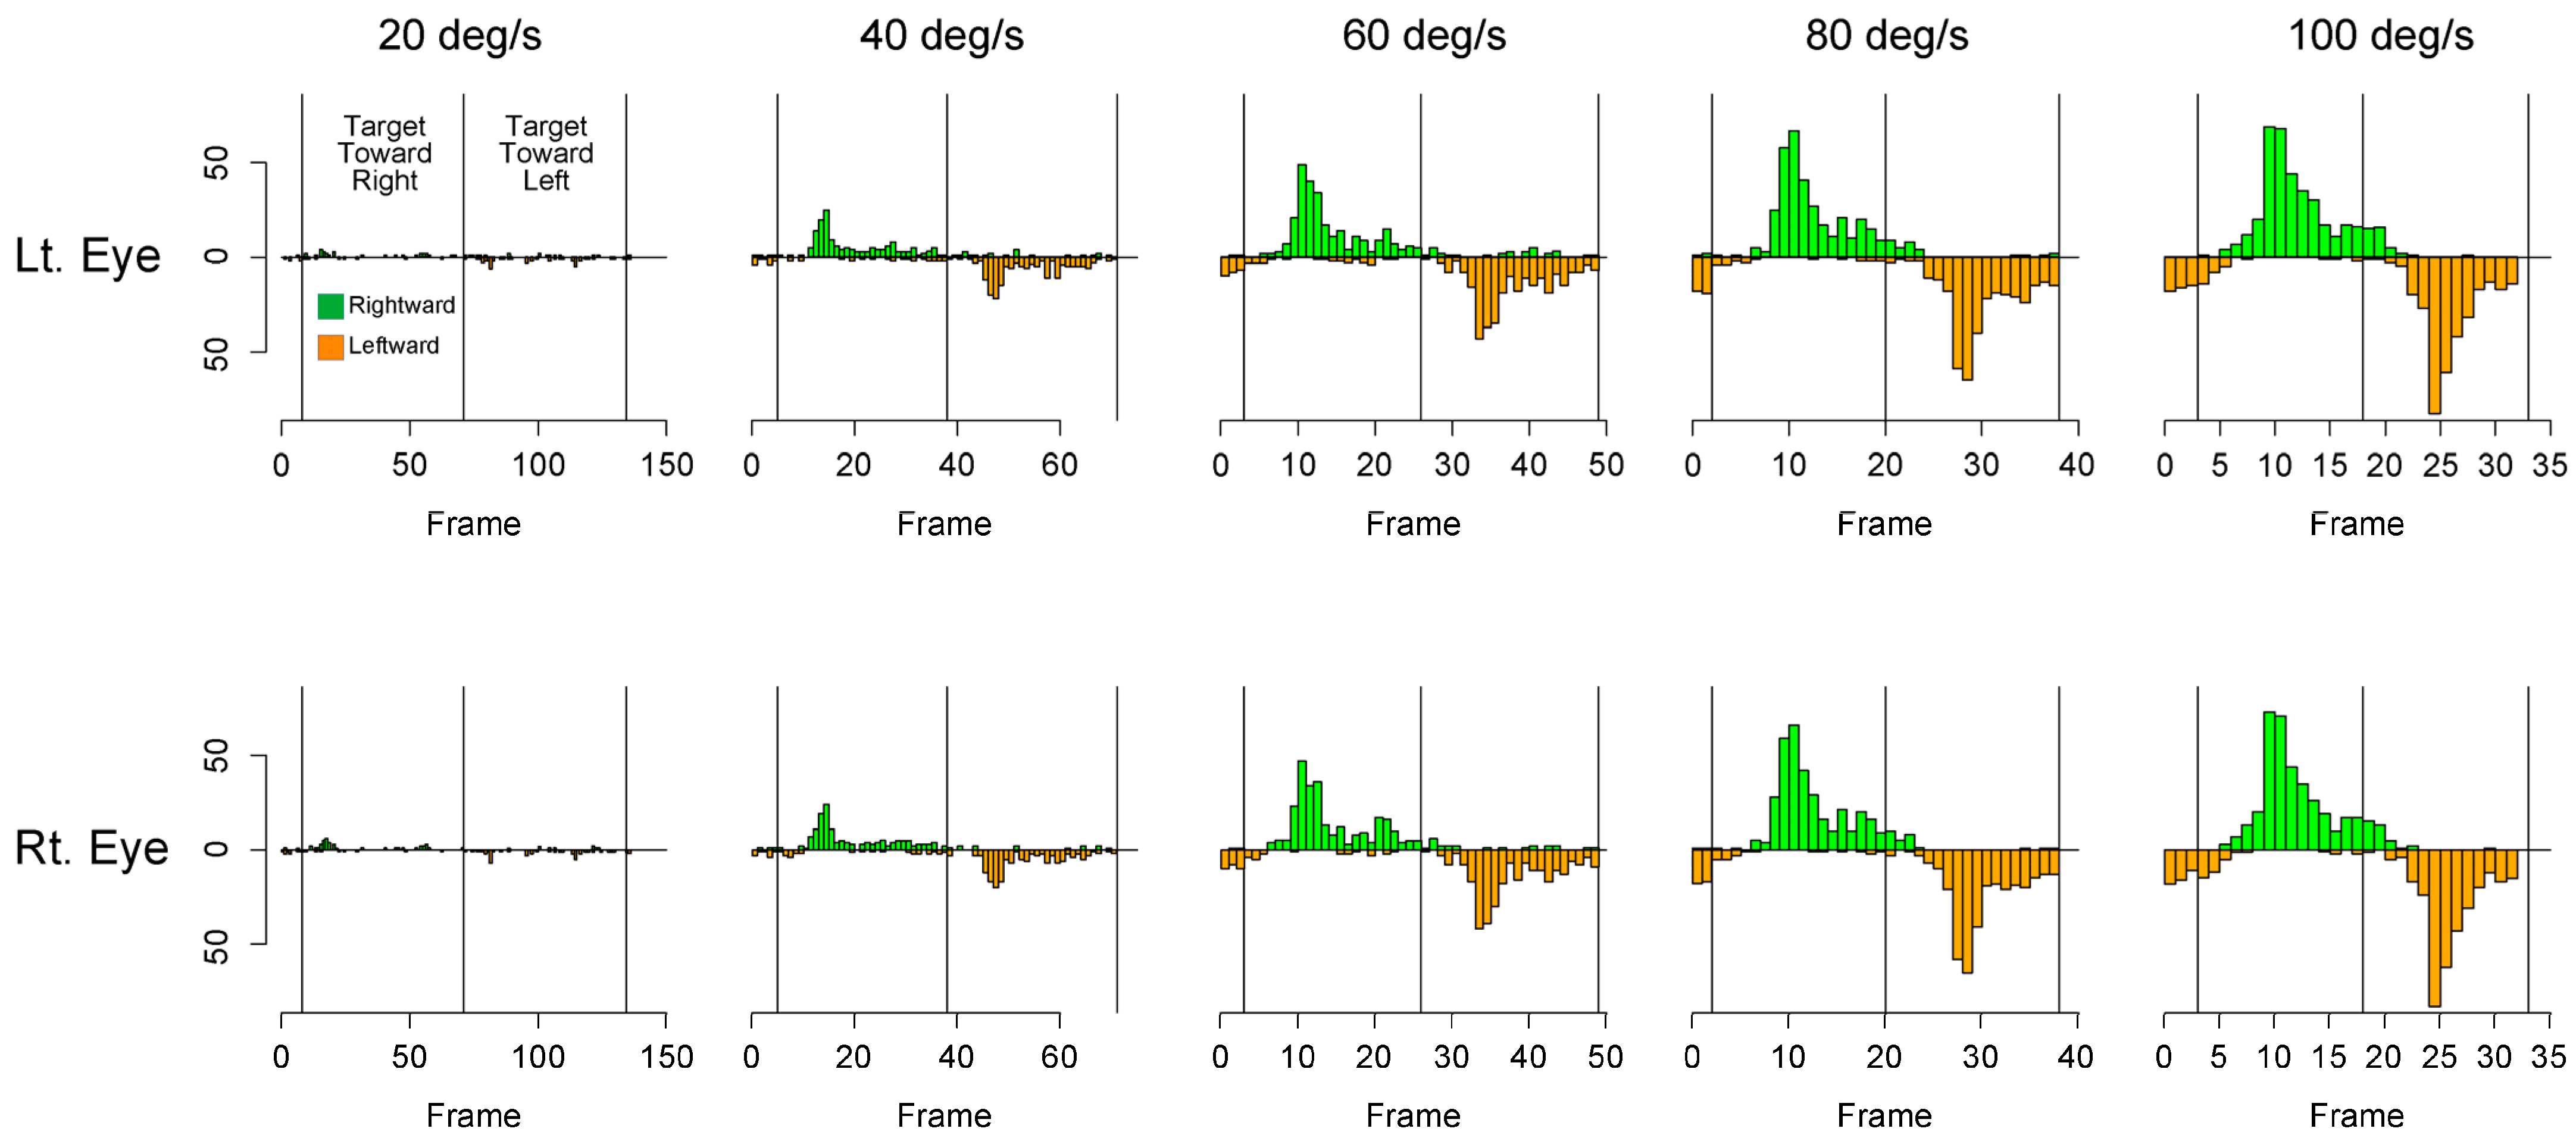
3.3. Horizontal Eye Movement Velocity

As tracking by saccades is critical for fast target speeds, we investigated the timing and frequency of saccades relative to the to-and-fro motion of a visual target. Examples of eye position and eye velocity obtained at each visual target speed are superimposed on one cycle, as shown in the upper part of Figure 6. The velocity waveforms corresponding to the positions of the cycles in the upper part of Figure 6 are shown in the lower part of Figure 6. For low visual target speeds, eye movement velocity was generally less than 40 deg/s, which was within the pursuit range. However, as the visual target speed increased, spike-like waveforms with higher eye velocities were observed more frequently. In this study, we defined saccades as eye movements of 100 deg/s or more [17,18], and the frequency with which saccades appeared was examined. The results showed that saccades tended to appear most frequently about 10–14 frames (0.30–0.42 s) after the onset of target motion at any visual target speed (Figure 7). The real timing of saccades was 5.5–9.5 frames (0.17–0.29 s) after the onset of target motion due to the sampling delay of eye position measurement (3–5 frames, mean of 4.5) in this device.
The correlation between the frequency of saccades and rho max at each target speed was analyzed. The correlation coefficients for visual target speeds of 20, 40, 60, 80, and 100 deg/s were −0.75 (p < 0.001), −0.42 (p = 0.102), −0.24 (p = 0.367), 0.09 (p = 0.745), and 0.66 (p = 0.005), respectively. At the lowest visual target speed (20 deg/s, Figure 8a), rho max was negatively correlated with the frequency of saccades. Conversely, positive correlations were observed at the highest visual target speeds (100 deg/s, Figure 8b). A negative correlation was observed between the frequency of saccades at the lowest and highest visual target speeds (Figure 8c).

4. Discussion

We developed an all-in-one device based on eye tracking to evaluate the accuracy of eye movements to a moving target and tested its feasibility by measuring eye movements at various visual target speeds, including those faster than human pursuit eye movements. Because the device consists of eye-tracking systems to record data of both eyes and an internal monitor to display the visual target, it allows us to easily record eye movement responses of both eyes simultaneously. We examined whether the data measured using this device reflect eye movement characteristics. When the lag was zero, the rho max between both eye positions was maximum (0.995 ± 0.008 and 0.967 ± 0.062 for horizontal and vertical eye movements, respectively; Figure 4). From these results, it was clarified that this device can accurately record fronto-parallel eye movements and that simultaneous measurement of both eyes is possible.
Rho max significantly decreased for target movements faster than 40 deg/s (Figure 5). Since pursuit was possible with a gain close to 1.00 at target speeds up to 30 deg/s [19], our data may reflect the characteristics of smooth pursuit and saccades in humans. In addition, the frequency of saccades increased as the visual target speed increased, suggesting increased compensation by saccades in addition to pursuit as target speed increased. At all visual target speeds, saccades occurred most frequently at 5.5 to 9.5 frames (0.17 to 0.29 s) after the target moves (Figure 7). This result was considered reasonable, as the saccade latency was approximately 0.20 s [20].
The correlation between the visual target and gaze was significantly lower for vertical target movements than for horizontal target movements. Vertical eye movements have been reported to have a lower gain and higher acceleration compared to horizontal eye movements [21]. In our study, even at a target speed of 100 deg/s, the rho max of the target and eye position was as high as 0.85 for both horizontal and vertical gaze movements. Schalén [22] reported that the maximum velocity gain of smooth pursuit was, on average, 0.98–0.75, gradually diminishing with increasing target velocities of 10–60 deg/s. Meyer et al. [18] reported that the gain for targets with predictable movements was as high as approximately 90%, even at 100 deg/s for 4/5 participants. The results of this study are in good agreement with those obtained using conventional methods.
In our study, when examining the correlation between the frequency of saccades and rho max, we identified a negative correlation when the fixation target speed was 20 deg/s and a positive correlation when the target speed was 100 deg/s (Figure 8a,b). This indicated that participants who could follow the target with pursuit when the target speed was slow had a high rho max, whereas participants who could use saccades frequently when the target speed was fast had a high rho max. Notably, in participants who used fewer saccades at low speeds, a negative correlation was observed with more saccades at high speeds (Figure 8c). These findings demonstrated the applicability of the EyeScore for characterizing eye movements. In this regard, the two following types of visual behavior may exist: (1) saccades for a slowly moving target (lower-right corner in Figure 8c) and (2) saccades for faster-moving targets (upper-left corner in Figure 8c). Of note, eye movement accuracies were higher for participants who made more saccades for faster-moving targets. Collectively, participants with high rho max values, regardless of the target speeds, made more saccades when the target speed was fast and appropriately suppressed them when the target speed was slow. On the other hand, participants with low rho max made more saccades when they were not needed (i.e., the target speed was slow), while they made fewer saccades for rapidly moving visual targets compared to the participants with high rho max values. Pursuits are important for accurate tracking when the target speed is low, whereas repeated saccades are important when the target speed is high. We observed that only a proportion of participants were able to switch eye movement systems appropriately depending on the speed of the visual target.
Conventionally, eye movements are measured using EOG. However, in clinical ophthalmology, eye movements are measured only in patients with brain or extraocular muscle disorders. Patients with amblyopia [3,4] and low vision [5] are also known to have different saccades and pursuits compared to healthy individuals, but eye movements are generally not measured. One underlying reason is that complex and large-scale measurement equipment is needed because a polygraph system, electrodes, amplifier, and personal computer are required for data analysis. In addition, since the corneo-retinal potential can fluctuate with time due to factors such as the alertness of subjects or environmental influences such as ambient light, it is necessary to wait for 10–15 min after electrode placement until sufficient light adaptation has occurred [23]. Therefore, eye movement measurements are performed less often compared to other ophthalmologic examinations. The EyeScore comprises a visual simulation generator, stimulus-presenting monitor, and two eye-tracking systems (for both eyes) within a single body (Figure 1). Measurements can be performed with minimal inconvenience to the patient and measurer.
However, EyeScore has several limitations. First, due to the sampling rate (30 Hz), a detailed evaluation of saccades was not possible, while saccades can be detected based on the eye movement velocity. Second, the gaze of each eye was indicated by an angle based on the pupil center of each eye. Therefore, the eye position for horizontal eye movements had a deviation corresponding to the parallax between the left and right eyes, and there were transient detection errors for downward gaze in vertical measurements. However, the rho max values of the left and right eyes were 0.995 ± 0.008 and 0.967 ± 0.062 in the horizontal and vertical directions, respectively, and fronto-parallel eye movements were measured. Third, although the positions of both eyes were completely synchronized, the gaze record was 3–5 frames (mean, 4.5) behind the visual target. Although this did not pose issues for examination using rho max, the frames in the cycle presented in Figure 6 and Figure 7 should consider the lag. In addition, the narrow age range and measurement at a single institution may have introduced bias.
Since EyeScore has a binocular separation structure, it is possible to measure the convergence and divergence of eye movements in addition to conjugating eye movements. In addition, since the movement range and movement speed of the stimulus can be freely set, there is a high degree of freedom in measurement.

5. Conclusions

In this study, we newly developed a device, EyeScore, for generating stimulus that induces eye movements and recording those movements over time.
EyeScore comprises a visual simulation generator, stimulus-presenting monitor, and two eye-tracking systems (for both eyes) within a single body. Using EyeScore, it was possible to measure eye movements without the need for a polygraph system, electrodes, or amplifier. Leigh et al. [5] reported limited success with EOG for patients with low vision since corneo-retinal potential was typically attenuated in most patients due to ocular diseases. Using EyeScore, it is possible to measure eye movements in ophthalmological examinations. This approach may enable routine measurement of eye movements in patients with amblyopia and low vision, which were previously only measured in the laboratory.
The faster the target speed, the lower the rho max, and the more frequently saccades appeared. The saccades were frequently observed at 5.5–9.5 frames (0.17–0.29 s) after the onset of target motion. The participants who could properly follow the slowly moving targets with pursuit eye movements had high rho max values, whereas for rapidly moving targets, participants who performed saccades frequently had high rho max values. The data are similar to other eye movement studies, suggesting the measurement with EyeScore was sufficiently accurate to grasp the nature of the participant’s eye movements.

Author Contributions

Conceptualization, S.T., H.T., F.M. and T.H.; methodology, S.T. and H.T.; software, T.H.; validation, S.T. and H.T.; formal analysis, H.T.; investigation, S.T. and F.M.; resources, S.T.; data curation, S.T. and H.T.; writing—original draft preparation, S.T.; writing—review and editing, H.T., F.M. and T.H.; visualization, S.T. and H.T.; supervision, T.H.; project administration, S.T. and T.H.; funding acquisition, S.T. All authors have read and agreed to the published version of the manuscript.

Funding

This research was funded by JSPS KAKENHI, grant number JP22K02470.

Institutional Review Board Statement

This study was conducted in accordance with the Declaration of Helsinki and approved by the Niigata University of Health and Welfare committee (18508-201019).

Informed Consent Statement

Informed consent was obtained from all subjects involved in the study.

Data Availability Statement

The data presented in this study are available on request from the corresponding author. The data are not publicly available to protect the privacy of the subjects.

Conflicts of Interest

T.H. borrowed equipment free of charge from NAC Image Technology Inc.

References

  1. Gegenfurtner, K.R. The interaction between vision and eye movements. Perception 2016, 45, 1333–1357. [Google Scholar] [CrossRef] [PubMed]
  2. Krauzlis, R.J.; Goffart, L.; Hafed, Z.M. Neuronal control of fixation and fixational eye movements. Philos. Trans. R. Soc. Lond. B. Biol. Sci. 2017, 372, 20160205. [Google Scholar] [CrossRef] [PubMed]
  3. von Noorden, G.K.; Mackensen, G. Pursuit movements of normal and amblyopic eyes. An electro-ophthalmographic study. II. Pursuit movements in amblyopic patients. Am. J. Ophthalmol. 1962, 53, 477–487. [Google Scholar] [CrossRef] [PubMed]
  4. Schor, C. A directional impairment of eye movement control in strabismus amblyopia. Investig. Ophthalmol. 1975, 14, 692–697. [Google Scholar]
  5. Leigh, R.J.; Zee, D.S. Eye movements of the blind. Investig. Ophthalmol. Vis. Sci. 1980, 19, 328–331. [Google Scholar]
  6. Shanidze, N.M.; Lively, Z.; Lee, R.; Verghese, P. Saccadic contributions to smooth pursuit in macular degeneration. Vis. Res. 2022, 200, 108102. [Google Scholar] [CrossRef] [PubMed]
  7. Robinson, D.A. A method of measuring eye movement using a scleral search coil in a magnetic field. IEEE Trans. Biomed. Eng. 1963, 10, 137–145. [Google Scholar] [CrossRef] [PubMed]
  8. Marg, E. Development of electro-oculography; standing potential of the eye in registration of eye movement. AMA Arch. Ophthalmol. 1951, 45, 169–185. [Google Scholar] [CrossRef] [PubMed]
  9. Lappe-Osthege, M.; Talamo, S.; Helmchen, C.; Sprenger, A. Overestimation of saccadic peak velocity recorded by electro-oculography compared to video-oculography and scleral search coil. Clin. Neurophysiol. 2010, 121, 1786–1787. [Google Scholar] [CrossRef] [PubMed]
  10. Ciuffreda, K.J.; Tannen, B. Methods to assess eye position and movement. In Eye Movement Basics for the Clinician; Sasser, M., Ed.; Mosby-Year Book, Inc.: Saint Louis, MO, USA, 1995; pp. 184–206. [Google Scholar]
  11. Eggert, T. Eye movement recordings: Methods. Dev. Ophthalmol. 2007, 40, 15–34. [Google Scholar] [CrossRef] [PubMed]
  12. Carter, B.T.; Luke, S.G. Best practices in eye tracking research. Int. J. Psychophysiol. 2020, 155, 49–62. [Google Scholar] [CrossRef] [PubMed]
  13. Dowiasch, S.; Wolf, P.; Bremmer, F. Quantitative comparison of a mobile and a stationary video-based eye-tracker. Behav. Res. Methods 2020, 52, 667–680. [Google Scholar] [CrossRef] [PubMed]
  14. Alahyane, N.; Lemoine-Lardennois, C.; Tailhefer, C.; Collins, T.; Fagard, J.; Doré-Mazars, K. Development and learning of saccadic eye movements in 7- to 42-month-old children. J. Vis. 2016, 16, 6. [Google Scholar] [CrossRef] [PubMed]
  15. Iwata, Y.; Handa, T.; Ishikawa, H. Objective measurement of nine gaze-directions using an eye-tracking device. J. Eye Mov. Res. 2020, 13, jemr.13.6.4. [Google Scholar] [CrossRef] [PubMed]
  16. Vergilino-Perez, D.; Fayel, A.; Lemoine, C.; Senot, P.; Vergne, J.; Doré-Mazars, K. Are there any left-right asymmetries in saccade parameters? Examination of latency, gain, and peak velocity. Investig. Ophthalmol. Vis. Sci. 2012, 53, 3340–3348. [Google Scholar] [CrossRef] [PubMed]
  17. Tochikura, I.; Sato, D.; Imoto, D.; Nuruki, A.; Yamashiro, K.; Funada, R.; Maruyama, A. Baseball players’ eye movements and higher coincident-timing task performance. Percept. Mot. Skills 2020, 127, 571–586. [Google Scholar] [CrossRef] [PubMed]
  18. Meyer, C.H.; Lasker, A.G.; Robinson, D.A. The upper limit of human smooth pursuit velocity. Vis. Res. 1985, 25, 561–563. [Google Scholar] [CrossRef] [PubMed]
  19. Leigh, R.J.; Zee, D.S. (Eds.) Smooth pursuit and visual fixation. In The Neurology of Eye Movements; Contemporary Neurology Series; Oxford University Press: Oxford, UK, 2006; Volume 70, pp. 188–240. [Google Scholar]
  20. Leigh, R.J.; Zee, D.S. (Eds.) The saccadic system. In The Neurology of Eye Movements; Contemporary Neurology Series; Oxford University Press: Oxford, UK, 2006; Volume 70, pp. 108–187. [Google Scholar]
  21. Rottach, K.G.; Zivotofsky, A.Z.; Das, V.E.; Averbuch-Heller, L.; Discenna, A.O.; Poonyathalang, A.; Leigh, R.J. Comparison of horizontal, vertical and diagonal smooth pursuit eye movements in normal human subjects. Vis. Res. 1996, 36, 2189–2195. [Google Scholar] [CrossRef] [PubMed]
  22. Schalén, L. Quantification of tracking eye movements in normal subjects. Acta Otolaryngol. 1980, 90, 404–413. [Google Scholar] [CrossRef] [PubMed]
  23. Terao, Y.; Fukuda, H.; Sugiyama, Y.; Inomata-Terada, S.; Tokushige, S.I.; Hamada, M.; Ugawa, Y. Recording horizontal saccade performances accurately in neurological patients using electro-oculogram. J. Vis. Exp. 2018, 133, e56934. [Google Scholar] [CrossRef]
Figure 1. (a,b) The newly developed device “EyeScore”. When the participant looked into the device, the target was displayed on an internal monitor. (c) Examples of visual targets displayed on the internal monitor. (d) Images obtained by the eye cameras correspond to the target positions shown in the upper panel. The eye position of each participant was determined based on the pupil center and corneal reflex. (e) The scheme of the internal structure of EyeScore. The images for the left and right eyes are separated by a separator.
Applsci 13 05968 g001
Figure 2. System block diagram of EyeScore.
Applsci 13 05968 g002
Figure 3. Eye positions for horizontal and vertical eye movements. Examples of (left) horizontal and (right) vertical eye movements elicited by horizontal and vertical target motions, respectively. The target was moved at a rate of 20 deg/s. The black line indicates the trajectory of the visual target, and the red and blue lines represent the right and left eye positions, respectively. Positive values indicate a rightward gaze for horizontal eye movements and upward gaze for vertical eye movements. The target position was indicated by an angle centered on the root of the nose, and the gaze of each eye was indicated by an angle centered on the pupil center. Therefore, slight deviations were observed between the left and right eyes during horizontal eye movements.
Applsci 13 05968 g003
Figure 4. Rho max between both eye positions at each target speed. The cross-correlation coefficient reached a maximum (rho max) when the time lag was zero for both (green) horizontal and (orange) vertical eye movements. The average rho max values across all velocities were 0.995 ± 0.008 and 0.967 ± 0.062 in the horizontal and vertical directions, respectively (mean ± standard deviation).
Applsci 13 05968 g004
Figure 5. Rho max decreased for faster visual target motions. The upper and lower figures show the horizontal and vertical gazes, respectively. The left and right figures show the results for the left and right eyes, respectively. Error bars represent standard errors.
Applsci 13 05968 g005
Figure 6. Example of eye position and eye velocity. (Upper) Horizontal eye movement waveforms measured continuously for 20 s are superimposed on one to-and-fro cycle of the target motion. (Lower) Eye velocity at the position corresponding to the upper panel. The black line indicates the (upper) position or (lower) velocity of the visual target, and the red and blue lines indicate those of the right and left eyes, respectively.
Applsci 13 05968 g006
Figure 7. Frequency of saccades at each visual target speed. The number of saccades within a frame during horizontal eye movements at each target speed. The data are summed across all the participants. The first and second halves of the histograms depict the results when the target moved to the right (green) and left (orange), respectively. The horizontal axis represents the frames of the cycle. Note: The center of the ordinate represents zero (no saccades). The upper and lower scales are for rightward motion (green) and leftward motion (orange), respectively.
Applsci 13 05968 g007
Figure 8. Characterization of participants by saccade frequency. (a,b) The average number of saccades per cycle was calculated from the data shown in Figure 7. Rho max against the frequency of saccades at (a) the lowest visual target speed (20 deg/s) and (b) highest visual target speed (100 deg/s). (c) Correlation between frequency of saccades at the lowest and highest visual target speeds. In (ac), each data point represents a participant.
Applsci 13 05968 g008
Disclaimer/Publisher’s Note: The statements, opinions and data contained in all publications are solely those of the individual author(s) and contributor(s) and not of MDPI and/or the editor(s). MDPI and/or the editor(s) disclaim responsibility for any injury to people or property resulting from any ideas, methods, instructions or products referred to in the content.

