Article

Analysis of Breath-Holding Capacity for Improving Efficiency of COPD Severity-Detection Using Deep Transfer Learning

1
Department of Computer Science, Rajendra University, Balangir 767002, India
2
School of Computer Science & Engineering, Lovely Professional University, Phagwara 144411, India
3
Computer Science and Engineering, National Institute of Technology Srinagar, Srinagar 190006, India
4
Department of CSE, SRM University, Amaravati 522240, India
5
School of Computer Science, SCS Taylors University, Subang 47500, Malaysia
6
Department of Computer Science, College of Computers and Information Technology, Taif University, Taif 21944, Saudi Arabia
7
Department of Information Technology, College of Computers and Information Technology, Taif University, Taif 21944, Saudi Arabia
*
Author to whom correspondence should be addressed.
Appl. Sci. 2023, 13(1), 507; https://doi.org/10.3390/app13010507
Submission received: 28 November 2022 / Revised: 20 December 2022 / Accepted: 26 December 2022 / Published: 30 December 2022
(This article belongs to the Special Issue Advance in Deep Learning-Based Medical Image Analysis)

Abstract

:
Air collection around the lung regions can cause lungs to collapse. Conditions like emphysema can cause chronic obstructive pulmonary disease (COPD), wherein lungs get progressively damaged, and the damage cannot be reversed by treatment. It is recommended that these conditions be detected early via highly complex image processing models applied to chest X-rays so that the patient’s life may be extended. Due to COPD, the bronchioles are narrowed and blocked with mucous, and causes destruction of alveolar geometry. These changes can be visually monitored via feature analysis using effective image classification models such as convolutional neural networks (CNN). CNNs have proven to possess more than 95% accuracy for detection of COPD conditions for static datasets. For consistent performance of CNNs, this paper presents an incremental learning mechanism that uses deep transfer learning for incrementally updating classification weights in the system. The proposed model is tested on 3 different lung X-ray datasets, and an accuracy of 99.95% is achieved for detection of COPD. In this paper, a model for temporal analysis of COPD detected imagery is proposed. This model uses Gated Recurrent Units (GRUs) for evaluating lifespan of patients with COPD. Analysis of lifespan can assist doctors and other medical practitioners to take recommended steps for aggressive treatment. A smaller dataset was available to perform temporal analysis of COPD values because patients are not advised continuous chest X-rays due to their long-term side effects, which resulted in an accuracy of 97% for lifespan analysis.

1. Introduction

Chronic obstructive pulmonary disease (COPD) causes over 31.7 lakh deaths globally every year [1] and affects over 2.51 crore individuals. Over 90% of these deaths occur in developing countries such as India, Bangladesh, Sri Lanka, etc., wherein patients cannot go for high-cost repetitive tests. Due to conditions such as emphysema going undetected for a long duration, chronic lung conditions such as COPD are caused. Patients with COPD have an average life expectancy of 5 years, which is another major cause of concern, because these patients require continuous medical care, which causes burden on the entire healthcare staff. These conditions can be detected in their early stages from single X-ray scans via complex image processing models. These models perform the following steps in order to evaluate presence of COPD and other chest related diseases.
High efficiency image acquisition & processing, wherein effective pre-processing models are deployed for noise reduction, filtering and image enhancement. These models aim at reducing effects of gaussian, power line and other noise types from the image. Moreover, any kind of enhancement which is needed is also done via these models. The enhancements assist in effective region of interest extraction from input images, which can be used for improving classification efficiency of the system. Pre-processed images are given to segmentation models, wherein all the regions of interest are extracted. Algorithms such as saliency maps, adaptive threshold-based models, clustering models, texture-based segmentation models, etc. are used. These algorithms are applied depending upon image types, and are selected to be application specific for improved segmentation performance. A sample image depicting difference between healthy and COPD affected tissues can be observed in Figure 1.
Each of the segmented regions are given to feature extraction blocks. These blocks represent these regions into numerical vectors, showing that vectors of one type of lung disease are different from other types of lung disease; while vectors of similar lung disease types have minimum difference. In order to evaluate this difference, variance, standard deviation, and correlation values are evaluated using the following Equations,
V = f i f N N 1
where V is the variance, f is the feature vector and N are the number of images taken for training the system.
C = f 1 i f 1 N f 2 i f 2 N f 1 i f 1 N 2   f 2 i f 2 N 2
where C is the correlation coefficient, while f 1 and f 2 are the feature vectors of same or different lung disease types. The contribution of the paper are as follows:
In order to maximize variance and minimize correlation between features of different lung disease types, a feature selection engine is deployed. This engine uses algorithms such as principal component analysis (PCA), independent component analysis (ICA), etc.
The selected features are given to classification models like convolutional neural networks (CNNs), random forests (RF), support vector machines (SVMs), etc., for identification of disease types.
The results of these models are post-processed via complex models like long-short-term-memory (LSTM) and gated recurrent units (GRUs) for performing temporal analysis on the classification results. These models aim at finding out results such as life expectancy and progression of disease.
Upon post-processing, results are verified from medical practitioners, and depending upon their feedback, the system is retuned to improve its internal performance. Retuning involves modification of system weights, changing the algorithms used for processing, etc., and is continuously done until a specified threshold performance is achieved. A review of retuning and lung disease analysis techniques can be observed in the next section. From this review, different state-of-the-art algorithms along with their nuances, advantages, and drawbacks can be studied, and it assists in evaluating the best models for segmentation, feature extraction, classification, and post-processing. This is followed by design of the proposed system that utilizes various design components from the review in order to develop a highly accurate lung disease classification system. Finally, this text concludes with the results analysis and its inference as applied to different datasets, and recommends interesting ways to improve the existing system performance.

2. Literature Review

Extracting and identifying malignant tissues from chest X-ray images requires a series of highly efficient image processing modules to work in tandem. These modules use complex computational models such as convolutional neural networks (CNNs), recurrent neural networks (RNNs), Gated Recurrent Units (GRUs), etc., to perform this identification with high accuracy. For example, the work in [2] uses a VGGNet based CNN model along with Deep Convolutional Generative Adversarial Network for creation of augmented images. Using this model, an average accuracy of 99.34% is achieved for pneumonia detection across 12k images. This high accuracy is possible because of augmentation, due to which a larger image dataset is available for training. This concept can be extended to other lung diseases in order to improve their internal accuracy performance. For instance, the work in [3] again proposes use of VGGNet based CNN for detection of pneumonia in children with an accuracy of 96.47%, which is very high and can be used for real-time purposes. This work can also use augmentation for improving its internal performance. Apart from VGGNet architecture, other CNN models such as InceptionResNet, MobileNet_V2, and ResNet50 can also be used for pneumonia detection. The work in [4] proposes combination of all these architectures in order to produce an accuracy of 94.84% for classification into lung disease classes such as viral/normal, bacteria, and COVID-19. A total of 6000 images were used for this evaluation, which can be further extended in order to evaluate real-time performance of the system. This is needed because the study in [5] suggests that recent work in COVID-19 detection using X-ray images has limited accuracy due to unavailability of image datasets. Thus, in order to evaluate any classification model, it is necessary to identify prevailing datasets for the given application. For instance, the work in [6] does a comparative analysis of different COVID-19 based lung disease detection models, and suggest that using a large COVID-19 lung image dataset (such the one available at https://github.com/rgbnihal2/COVID-19-X-ray-Dataset, accessed on 10 May 2022), CNN models like DenseNet201 combined with Quadratic SVM classifier as the fully connected layer, can achieve accuracy levels of 98.16% for a wide variety of images.
The accuracy of CNN models can be improved via the use of transfer learning, wherein training information obtained from one dataset can be used to accurately classify images from other datasets. Work in [7] proposes use of Haralick features with transfer learning in order to learn from pneumonia classification models, and train them to perform COVID-19 detection. Architecture of this transfer learning model can be observed from Figure 2, wherein chest X-ray images are fed to a data augmentation layer. Operations like histogram equalization and wiener filtering are used for extraction region of interest. These regions are given to Haralick texture feature extraction model, which extracts highly efficient Haralick coefficients from the input image. Using values of these coefficients, and via VGGNet, ResNet, and Inception models, training models that match the given coefficients are evaluated. Classification is done by the evaluated models, and detection of pneumonia and other diseases is done. Learnings about these diseases are transferred for COVID-19 prediction, and the underlying infected regions are detected with 93% accuracy.
A multi-feature CNN model for COVID-19 detection is proposed in [8], which can evaluate presence of the disease with 99% accuracy. The model uses a combination of original chest X-ray and enhanced chest X-ray images and trains a multi-feature CNN network based on AlexNet, ResNet50, SonoNet64, XNet, InceptionV4, and EfficientNetB4 models for improved classification performance. This accuracy can be further improved by using a transfer learning model similar to [7] which is proposed in [9], that uses ResNet101, ResNet18, SqueezeNet, and ResNet50 models for transfer learning. Accuracy of 99.82% is observed via the use of ResNet18 model with wavelet feature decomposition. This high accuracy is due to the use of 90% data for training, and only 10% for testing, it is recommended that researchers and system engineers should balance this dataset to 70:30 from 90:10 in order to evaluate the true performance of this model. Similar architectures based on CNN for detection of COVID-19 disease are described in [10,11,12]. Each of these architectures use a different variant of CNN like generative adversarial network (GAN), GoogLeNet, Quantitative pleural line analysis, etc. in order to detect traces of COVID-19 disease in the patient chest X-ray imagery.
Segmentation of pulmonary lobe is of high significance when it comes to evaluation of lung diseases. The work in [13] proposes use of dual-attention V-network (DAVNet) for performing this task. The DAVNet uses a combination of encoders to extract features and uses a combination of decoding blocks for generation of segmentation results. An accuracy of 93.9% is achieved via the use of this model, which can be further improved by incorporation of transfer learning in the system. Such transfer learning and deep learning models are suggested in [14,15,16], wherein disease severity, ventilation issues and other lung diseases are predicted with more than 91% accuracy using standard CNN architectures.
Lung diseases can also be evaluated using markers in Point-of-Care ultra-sound imagery. The work in [17] proposes a dual CNN model with Spatial Transformers Network (STN) in order to identify COVID-19 markers in lung ultrasounds. An accuracy of 75% is achieved using this method, which can be improved via transfer learning mechanisms. It can also be observed that ultrasounds do not contain enough visual information in order to identify lung diseases with expected accuracy levels for real-time applications. X-ray scans are a must for such applications, and their performance with CNNs is good even for highly complex conditions such as interstitial diseases as observed in [18]. Here, CNNs are used for identification of micronodules, ground glass opacity (GGO), consolidation, honeycombing reticulation, and a combination of GGO/reticulation with over 85% accuracy. The architecture uses combinations of Leaky Rectilinear Units (ReLU) with average pooling and fully connected softmax layers in order to perform this task. The accuracy of this system can also be improved via deep transfer learning, data augmentation or via 3D CNN models. Such 3D CNN models are proposed in [19], and are able to identify lung cancer at early stages via Gradient weighted class activation. An accuracy of 97.17% is achieved using this model on the standard LUNA 16 dataset. Hyperspectral imagery is captured from this dataset, and given to a 3D CNN as observed from Figure 3, wherein a cascaded combination of convolution and pooling is connected with dense neural networks in order to classify between healthy and disease classes. Other medical applications can also take advantage of this 3D CNN model, in order to improve their classification performance. The work in [20] lists out some of these applications related to COVID-19, and suggests that CNNs and their variants are fully capable of identification of these diseases with utmost accuracy.
A generalized architecture for medical image classification using CNNs is described in [21]. In this work, researchers have used Visual Attention Mechanism based Multiscale network which is effective in extracting visual features from images. These features are given to a Mahalanobis distance vector function for obtaining an accuracy of 99.89% for classification lung nodules and breast cancer diseases. Another application for detection of COVID-19 and other lung diseases using CNNs is described in [22,23], the proposed architecture uses VGGNet model in order to obtain an accuracy between 85 to 93% across different datasets. Lung diseases can also be detected using effective content-based image retrieval (CBIR) models. The work in [24] proposes use of s vector machine (SVM) with adaptive thresholding-based segmentation in order to retrieve lung disease images similar to query image from a database of over 20,000 images. The system uses nodule filtering with linear feature extraction engine to perform image ranking for effective retrieval. An accuracy of 90% is achieved with the help of this classification-based retrieval engine. This accuracy can be improved via the use of modular CNN architectures, wherein each architecture is responsible for identification of a different lung disease. The work in [25,26,27], propose the use of such architectures in a wide variety of lung diseases, which include but are not limited to interstitial lung disease, pulmonary diseases, and COVID-19 disease and its variants with more than 91% accuracy. Apart from using these generalized architectures for detection of lung diseases, the work in [28] proposes designs of an infection-based convolutional neural network or Inf-Net.
This network is specifically designed to detect and localize lung diseases, and uses combination convolutional layers with reverse attention (RA) blocks and upsampling in order to perform the final prediction. Architecture for this system can be observed from Figure 4, wherein a cascaded and fully connected version of this network is shown. The architecture is able to detect lung diseases with an accuracy of 89%, which is low considering generalized CNN architectures have higher accuracy than this specialized architecture. The accuracy can be improved by integration of transfer learning and multi dimension attention mechanism, in order to reduce the probability of classification error in this network. Such a network can be observed in [29], wherein fine-grained lung cancer detection is done using Multidimensional Attention Mechanism that uses an extensive feedback mechanism via dense networks in order to obtain a classification accuracy of 92% across one million images. These images are handled using a big-data image management system as described in [30], wherein Hadoop architecture is used in order to improve the efficiency of handling a large number of images.
Chronic obstructive pulmonary disease or COPD is another deadly lung disease which can be detected using X-ray scans. The work in [31] proposes a Deep CNN architecture that uses Multi-View imagery from lung airway tree in order to identify presence of COPD. A total of nine different CNN architectures are deployed, each of which uses either a different view or a different pixel level for classification.
The architecture decomposes captured images into colored, gray, and binary levels. These images are captured via different views, namely ventral, dorsal, and isometric. A singular VGGNet based CNN architecture is reused by all these different image variants, and classification is done into COPD and healthy chest X-ray classes. An accuracy of 91% is achieved using this model, which is moderate considering the fact that the architecture passes input imagery through 9 different CNN processing units for final classification. It is recommended that this architecture be replaced by a less complex and high accuracy Generative Adversarial Network (GAN) as suggested in [32]. This architecture is also based on CNNs, and is able to identify lung diseases via segmentation with an accuracy of over 95%. Other architectures as suggested in [33,34,35] use similar variants of CNNs in order to detect pulmonary lung diseases with more than 90% accuracy. This accuracy performance can be improved by adding multimodality in CNN models for lung image classification. The work in [36] proposes an architecture that uses standard LeNet model that is deployed for three different types of images in order to classify lung disease. These images are computer tomography (CT) scans, positron emission tomography (PET) scans, and a combination of CT and PET scans. An accuracy of 99.33% is observed via the use of such a multimodal architecture for classification.
Data from this highly accurate classification model can be used for post processing in order to identify progressive lung disease spreading. The work in [37] proposes use of classification and regression tree and iterative dichotomiser 3 (ID3) classifiers in order to identify progression of lung diseases. This work combines image processing with physiological parameters such as smoking history, number of hospitalizations, pulse rate, systolic & diastolic pressure, pulmonary heart disease, bronchiectasis, hypertension, coronary heart disease, malignant tumor, viral hepatitis, temperature, respiratory rate, chronic kidney disease, hypertension, cerebrovascular disease, and cirrhosis in order to identify disease progression. An accuracy of 94% is obtained via the use of this model, which is high enough to be used for real-time purposes. This concept can be used with other systems for improving the effectiveness of their application in lung disease detection. For instance, the work in [38,39,40] can use physiological parameters to identify present lung condition, and then correlate this data with chest X-ray scans in order to improve the efficiency for classification of COVID-19, Chronic Obstructive Pulmonary Disease, and lung cancer, respectively. Efficiency of systems can also be improved by modifying the manner in which chest X-ray scans are captured. The work in [41,42,43] identifies classification accuracy difference between deep-breathing and breath-holding scans. From this study, it is observed that breath holding scans showcase higher accuracy, and can be used for identification of any kind of respiratory diseases. Other novel methods like inter & intra-software reproducibility using lung density measurements, and elastography are defined in [44,45,46,47,48,49]. These methods can be used for fine tuning accuracy measures for lung disease detection systems, and can be applied to both CNN and non-CNN architectures. Similar architectures are used in the underlying research, wherein breath holding with data augmentation are extensively utilized along with transfer learning in order to improve overall accuracy of lung disease detection. The next section demonstrates the proposed model based on transfer learning and deep nets.

3. Gated Recurrent Unit (GRU) Based Transfer Learning Model with Deep Convolutional Neural Networks (DCNNs) for COPD Analysis

The proposed model for COPD analysis uses an ensemble of VGGNet, AlexNet, ResNet18, and GoogLeNet CNN models. These models are selected based on the advantages and shortcomings in each of them. The VGGNet model is capable of high accuracy coarse classification, wherein images of different visual appearance can be classified with accuracies in the range of 95 to 98%. However, for minor changes in the images, the accuracy of VGGNet model reduces drastically. For instance, if lung nodule locations are widely separated as shown in Figure 5a, then VGGNet model works perfectly, but if the lung nodule locations for different disease types change infinitesimally as shown in Figure 5b, then the accuracy of the VGGNet model is not guaranteed.
In order to remove this drawback, ResNet18 architecture of CNN is used, this architecture provides good accuracy for any kind of lung images, but this accuracy is saturated to 94 to 95% depending upon the dataset being used. In order to improve this accuracy further, the GoogLeNet model is fused with the ResNet18 model. This is done by replacing the convolutional layers of ResNet18 architecture with inception layers as suggested by the GoogLeNet architecture. Both the architectures (i.e., VGGNet and GoogLeNet powered ResNet18) might produce different results during classification, thus as a decision maker in case of different results, the AlexNet architecture is used. This architecture is able to produce accuracy values in the range of 90 to 95%, which is high enough for verification purposes. The overall architecture of the proposed CNN based classification model can be observed from Figure 6, wherein all the 4 CNN models are combined to obtain the final COPD status. The proposed architecture is effective for classifying dataset imagery taken from LUNA 16 and Kaggle Chest X-ray datasets. However, the performance reduces when real-time image data is used for classification. In order to improve the classification performance of the proposed CNN model, a GRU based transfer learning approach is applied. Using this approach and the feature vectors extracted via loosely connected GRU based RNN layers, feature mapping is done.
Via this feature mapping, the real-time X-ray features are mapped with the features of images already stored in the database. Based on this mapping, the real-time X-ray images are matched with similar dataset images, and the proposed CNN model is used for further classification. In order to improve the accuracy of this mapping, the real-time images are augmented, and the following new images are generated from the new input image:
  • Horizontal flip and horizontal shift augmentation
  • Vertical flip and vertical shift augmentation
  • 2N Random rotation augmentation (N is the augmentation level)
  • 2N Random Zoom Augmentation
  • (2N) Random Brightness Augmentation
Images from all of these augmentation processes is given to the transfer learning model, wherein classification of each of these augmented images is combined in order to find the final COPD status of the person. The proposed model works using the following process:
  • Real time input images are given to an image augmentation layer, wherein 6N + 5 images are generated. These images are given to a feature extraction unit.
  • The feature extraction unit is a combination of bidirectional GRU with recurrent neural networks, and produces a feature vector as shown in Figure 7.
  • All of these features are given to a feature mapping unit that uses Quadratic support vector machine (QSVM) in order to find out the best matching training set image for the given input features as shown from Figure 8.
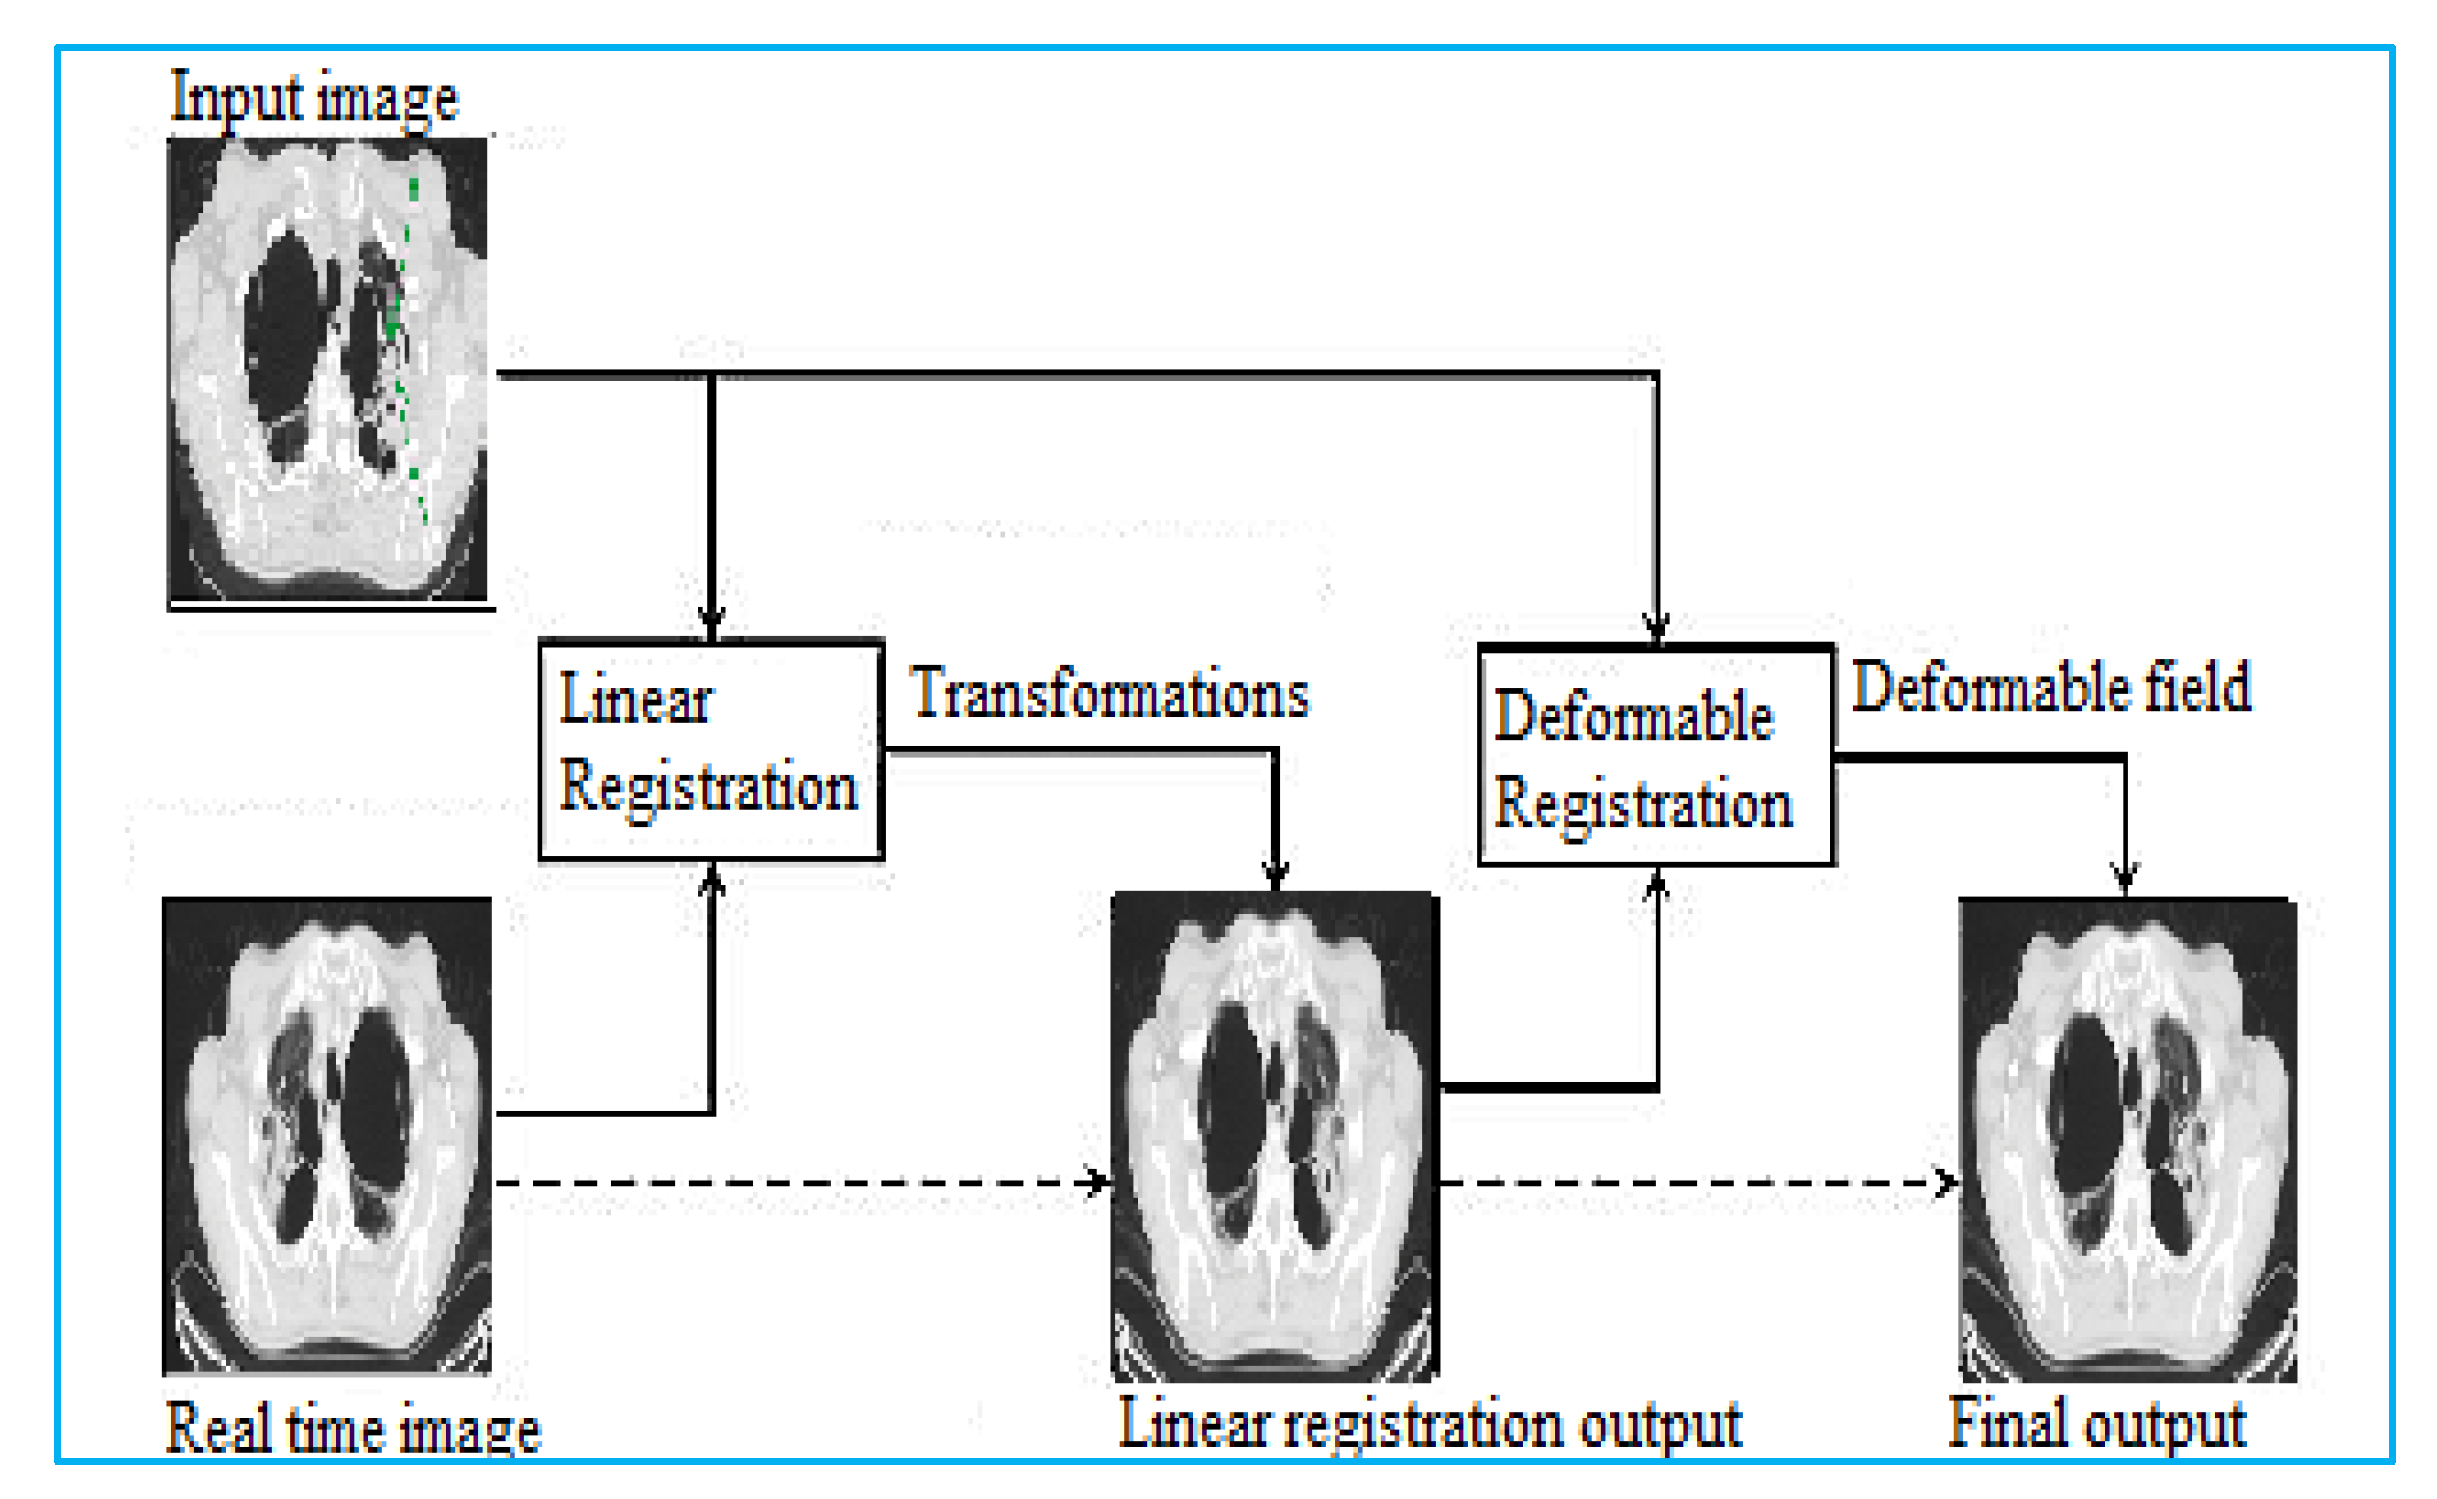
  • Features of this selected training set image are merged with the input image using a linear & deformable image registration engine.
  • The registration engine evaluates the input image (image from dataset) and the real time image (image to be classified), and passes them through linear registration model.
  • The output of linear registration model is given to deformable registration model, wherein a deformable field is evaluated.
  • Result of this field, is the deformable registered image, which can be further used for classification purposes as can be seen from Figure 9, where the entire registration process is shown.
  • This registered image is given to the proposed ensemble CNN Model for final classification.
In order to perform final classification, the proposed classifier uses a combination of GoogLeNet and ResNet18 architectures as already described. The modified architecture of this model can be observed from Figure 10a, wherein all the internal convolutional layers of the ResNet18 architecture are replaced by the Inception Net layers from GoogLeNet. The inception layer can also be observed from Figure 10b, wherein inception V2 is used for effective classification. In order to enhance classification accuracy, inception module uses the following equation for internal pooling,
P q , p = log C p , q B q , p
where ‘P’ is the output of Pooling, ‘C’ is the convolutional operation on the image patch (p, q), and ‘B’ is the base image patch (q, p).
The result of this equation is given to a filter concatenation unit, which operates using the following Equation,
F p , q = P q , p k + d × a B p , q + c 4
where ‘F’ is the filtered output, ‘P’ is the pooling output, ‘B’ is the base image patch for (p, q), while ‘a’, ‘c’, ‘d’ and ‘k’ are inception constants, which have the value between 0 to 255 depending upon the level of inception. The filtered output is then used by the ResNet18 architecture in order to obtain the final classification results. The GRU model was again used with aggregated COPD data and person’s expected life expectancy was evaluated. This expectancy evaluation was done for people whose life expectancy values are known. In order to evaluate accuracy of the proposed model, the next section evaluates the model on LUNA 16, Kaggle Chest X-ray and a real-time custom dataset. The accuracy of classification is compared with different state-of-the-art models.

4. Results and Statistical Comparison

Evaluation of performance for the proposed model requires a large variety of input images to be used for training, testing, and validation purposes. To gather these images, the LUng Nodule Analysis (LUNA) 2016 dataset imagery is combined with Kaggle Chest X-ray dataset and real-time images taken from ‘Modern Lab & X-ray’, Pune. A total of 15,000 images were collected for this purpose, and each of these images are categorized into either COPD or non-COPD classes. Accuracy, precision, recall, and fMeasure values were compared for COPD detection for the proposed model and the models defined in [7,19,28]. The following Table 1 indicates the accuracy performance of the proposed model w.r.t. number of images used for testing. The image dataset was divided into 70:30, wherein 10.5k images were used for training the model, while remaining 4.5k images were used for testing the model and evaluating its performance. The following Table 1 showcases the test accuracy (TA) performance of all the models.
From the test accuracy, it can be observed that the proposed model is highly efficient, and has a better performance when compared to state-of-the-art classification models. Average accuracy is around 8% higher when compared to these models, and can be observed from the following Figure 11, wherein these accuracy values are plotted.
The following Table 2 showcases the test precision (TP) performance of all the models. From the test precision values, it can be observed that the proposed model is highly efficient and as better performance when compared to state-of-the-art classification models. Average precision is around 9% higher when compared to these models, and can be observed from the following Figure 12, wherein these precision values are plotted.
The following Table 3 showcases the test recall (TR) performance of all the models. From the test recall, it can be observed that the proposed model is highly efficient and as better performance when compared to state-of-the-art classification models. Average recall is around 6% higher when compared to these models, and can be observed from the following Figure 13, wherein these recall values are plotted.
The following Table 4 showcases the test fMeasure (TF) performance of all the models. From the test fMeasure, it can be observed that the proposed model is highly efficient, and as better performance when compared to state-of-the-art classification models. Average fMeasure is around 8% higher when compared to these models, and can be observed from the following Figure 14, wherein these fMeasure values are plotted.
Similar accuracy is observed for life expectancy evaluation, and can be observed from the following Table 5, wherein average accuracy (AAL) values for life expectancy are tabulated.
It can be observed that the proposed algorithm is superior in terms of all the performance parameters when compared on different datasets with different algorithms. The accuracy of this model is saturated, and thus can only be improved infinitesimally by using superior deep learning models for the same datasets.

5. Conclusions & Future Work

A combination of GRU based transfer learning model with an ensemble CNN algorithm is able to classify presence of COPD disease with 99.95% accuracy. Binary classification is also one of the reasons for such a high accuracy, but considering the fact that the system was evaluated on a real-time dataset taken from X-ray laboratory, it is safe to conclude that the proposed model can be used for real-time COPD detection. Moreover, precision performance is also superior, so as recall performance for the proposed algorithm. This ensures that the proposed algorithm is consistent and can perform with high efficiency for a wide variety of images. However, due to combination of GRU, ResNet18, VGGNet, AlexNet, and GoogLeNet with image augmentation, the delay of processing is very high. It is recommended that researchers should work on minimizing this delay via parallel computation models, and by identifying redundant calculations in the network. Moreover, researchers can also test the system for other lung diseases and evaluate its performance for different applications.

Author Contributions

Conceptualization: N.K.R., N.P. and R.K.R.; methodology: N.K.R., N.P. and K.S.S.; result analysis: N.K.R., N.P. and K.S.S.; simulation: N.K.R. and N.P.; draft preparation: N.K.R., N.P. and K.S.S.; supervised the project: N.Z.J., M.A.A., M.M. and K.S.S. All authors have read and agreed to the published version of the manuscript.

Funding

Taif University Researchers Supporting Project number (TURSP-2020/98), Taif University, Taif, Saudi Arabia.

Institutional Review Board Statement

Not applicable.

Informed Consent Statement

Not applicable.

Data Availability Statement

Will be available on request.

Conflicts of Interest

The authors declare no conflict of interest.

Ethical Approval

Ethical approval not required for this study. Human or animal subjects’ data is not used in this study.

References

  1. Chronic Obstructive Pulmonary Disease (COPD). Available online: https://www.who.int/news-room/fact-sheets/detail/chronic-obstructive-pulmonary-disease-(copd) (accessed on 10 May 2022).
  2. Rajasenbagam, T.; Jeyanthi, S.; Pandian, J.A. Detection of pneumonia infection in lungs from chest X-ray images using deep convolutional neural network and content-based image retrieval techniques. J. Ambient Intell. Humaniz. Comput. 2021, 1–8. [Google Scholar] [CrossRef] [PubMed]
  3. Chagas, J.V.; Rodrigues, D.d.A.; Ivo, R.F.; Hassan, M.M.; de Albuquerque, V.H.; Filho, P.P. A new approach for the detection of pneumonia in children using CXR images based on an real-time IOT system. J. Real-Time Image Process. 2021, 18, 1099–1114. [Google Scholar] [CrossRef] [PubMed]
  4. El Asnaoui, K. Design ensemble deep learning model for pneumonia disease classification. Int. J. Multimed. Inf. Retr. 2021, 10, 55–68. [Google Scholar] [CrossRef] [PubMed]
  5. López-Cabrera, J.D.; Orozco-Morales, R.; Portal-Diaz, J.A.; Lovelle-Enríquez, O.; Pérez-Díaz, M. Current limitations to identify COVID-19 using artificial intelligence with chest X-ray imaging. Health Technol. 2021, 11, 411–424. [Google Scholar] [CrossRef]
  6. Rahman, S.; Sarker, S.; Miraj, M.A.; Nihal, R.A.; Nadimul Haque, A.K.; Noman, A.A. Deep learning–driven automated detection of COVID-19 from Radiography Images: A Comparative Analysis. Cogn. Comput. 2021. [Google Scholar] [CrossRef]
  7. Perumal, V.; Narayanan, V.; Rajasekar, S.J. Detection of COVID-19 using CXR and CT images using transfer learning and Haralick features. Appl. Intell. 2020, 51, 341–358. [Google Scholar] [CrossRef] [PubMed]
  8. Qi, X.; Brown, L.G.; Foran, D.J.; Nosher, J.; Hacihaliloglu, I. Chest X-ray image phase features for improved diagnosis of COVID-19 using Convolutional Neural Network. Int. J. Comput. Assist. Radiol. Surg. 2021, 16, 197–206. [Google Scholar] [CrossRef]
  9. Ahuja, S.; Panigrahi, B.K.; Dey, N.; Rajinikanth, V.; Gandhi, T.K. Deep transfer learning-based automated detection of COVID-19 from lung CT scan slices. Appl. Intell. 2020, 51, 571–585. [Google Scholar] [CrossRef] [PubMed]
  10. Rasheed, J.; Hameed, A.A.; Djeddi, C.; Jamil, A.; Al-Turjman, F. A machine learning-based framework for diagnosis of COVID-19 from chest X-ray images. Interdiscip. Sci. Comput. Life Sci. 2021, 13, 103–117. [Google Scholar] [CrossRef]
  11. Ma, J.; Song, Y.; Tian, X.; Hua, Y.; Zhang, R.; Wu, J. Survey on deep learning for pulmonary medical imaging. Front. Med. 2019, 14, 450–469. [Google Scholar] [CrossRef]
  12. Sultan, L.R.; Chen, Y.T.; Cary, T.W.; Ashi, K.; Sehgal, C.M. Quantitative pleural line characterization outperforms traditional lung texture ultrasound features in detection of COVID-19. JACEP Open 2021, 2, e12418. [Google Scholar] [CrossRef] [PubMed]
  13. Zheng, S.; Nie, W.; Pan, L.; Zheng, B.; Shen, Z.; Huang, L.; Pei, C.; She, Y.; Chen, L. A dual-attention v-network for pulmonary lobe segmentation in CT scans. IET Image Process. 2021, 15, 1644–1654. [Google Scholar] [CrossRef]
  14. Irmak, E. COVID-19 Disease Severity Assessment using CNN model. IET Image Process. 2021, 15, 1814–1824. [Google Scholar] [CrossRef] [PubMed]
  15. Doddavarapu, V.N.; Kande, G.B.; Rao, B.P. Rotational invariant fractional derivative filters for lung tissue classification. IET Image Process. 2021, 15, 2202–2212. [Google Scholar] [CrossRef]
  16. Klimeš, F.; Voskrebenzev, A.; Gutberlet, M.; Kern, A.L.; Behrendt, L.; Grimm, R.; Suhling, H.; Crisosto, C.G.; Kaireit, T.F.; Pöhler, G.H.; et al. 3D phase-resolved functional lung ventilation MR imaging in healthy volunteers and patients with chronic pulmonary disease. Magn. Reson. Med. 2020, 85, 912–925. [Google Scholar] [CrossRef]
  17. Roy, S.; Menapace, W.; Oei, S.; Luijten, B.; Fini, E.; Saltori, C.; Huijben, I.; Chennakeshava, N.; Mento, F.; Sentelli, A.; et al. Deep learning for classification and localization of COVID-19 markers in point-of-care lung ultrasound. IEEE Trans. Med. Imaging 2020, 39, 2676–2687. [Google Scholar] [CrossRef]
  18. Anthimopoulos, M.; Christodoulidis, S.; Ebner, L.; Christe, A.; Mougiakakou, S. Lung pattern classification for interstitial lung diseases using a deep convolutional neural network. IEEE Trans. Med. Imaging 2016, 35, 1207–1216. [Google Scholar] [CrossRef]
  19. Neal Joshua, E.S.; Bhattacharyya, D.; Chakkravarthy, M.; Byun, Y.-C. 3D CNN with visual insights for early detection of lung cancer using gradient-weighted class activation. J. Healthc. Eng. 2021, 2021, 6695518. [Google Scholar] [CrossRef]
  20. Bhattacharya, S.; Reddy Maddikunta, P.K.; Pham, Q.-V.; Gadekallu, T.R.; Krishnan, S.S.R.; Chowdhary, C.L.; Alazab, M.; Jalil Piran, M. Deep learning and medical image processing for coronavirus (COVID-19) pandemic: A survey. Sustain. Cities Soc. 2021, 65, 102589. [Google Scholar] [CrossRef]
  21. An, F.; Li, X.; Ma, X. Medical Image Classification algorithm based on visual attention mechanism-MCNN. Oxid. Med. Cell. Longev. 2021, 2021, 6280690. [Google Scholar] [CrossRef]
  22. Salem Salamh, A.B.; Salamah, A.A.; Akyüz, H.I. A study of a new technique of the CT Scan View and Disease Classification Protocol based on level challenges in cases of coronavirus disease. Radiol. Res. Pract. 2021, 2021, 5554408. [Google Scholar] [CrossRef] [PubMed]
  23. Zak, M.; Krzyżak, A. Classification of lung diseases using Deep Learning Models. In Proceedings of the International Conference on Computational Science, Amsterdam, The Netherlands, 3–5 June 2020; Lecture Notes in Computer Science. Springer: Berlin, Germany, 2020; pp. 621–634. [Google Scholar] [CrossRef]
  24. Muthazhagan, B.; Ravi, T.; Rajinigirinath, D. An enhanced computer-assisted lung cancer detection method using content based image retrieval and data mining techniques. J. Ambient Intell. Humaniz. Comput. 2020. [Google Scholar] [CrossRef]
  25. Trusculescu, A.A.; Manolescu, D.; Tudorache, E.; Oancea, C. Deep learning in interstitial lung disease—How long until daily practice. Eur. Radiol. 2020, 30, 6285–6292. [Google Scholar] [CrossRef]
  26. Farhat, H.; Sakr, G.E.; Kilany, R. Deep learning applications in Pulmonary Medical Imaging: Recent updates and insights on COVID-19. Mach. Vis. Appl. 2020, 31, 53. [Google Scholar] [CrossRef]
  27. Elaziz, M.A.; Hosny, K.M.; Salah, A.; Darwish, M.M.; Lu, S.; Sahlol, A.T. New Machine Learning Method for image-based diagnosis of COVID-19. PLoS ONE 2020, 15, e0235187. [Google Scholar] [CrossRef] [PubMed]
  28. Zhou, T.; Ji, G.P.; Zhou, Y.; Chen, G.; Fu, H.; Shen, J.; Shao, L. Inf-Net: Automatic COVID-19 Lung Infection Segmentation from CT Images. arXiv 2020, arXiv:2004.14133. [Google Scholar]
  29. Qin, R.X.; Wang, Z.; Jiang, L.Y.; Qiao, K.; Hai, J.; Chen, J.; Xu, J.; Shi, D.; Yan, B. Fine-grained lung cancer classification from PET and CT images based on multidimensional attention mechanism. Complexity 2020, 2020, 6153657. [Google Scholar] [CrossRef] [Green Version]
  30. Gupta, Y.K.; Agrawal, S. A Study of Lung Disease Using Image Processing in Big Data Environment. IOP Conf. Ser. Mater. Sci. Eng. 2021, 1022, 012030. Available online: https://iopscience.iop.org/article/10.1088/1757-899X/1022/1/012030/ (accessed on 2 June 2022).
  31. Du, R.; Qi, S.; Feng, J.; Xia, S.; Kang, Y.; Qian, W.; Yao, Y.-D. Identification of COPD from multi-view snapshots of 3D lung airway tree via Deep CNN. IEEE Access 2020, 8, 38907–38919. [Google Scholar] [CrossRef]
  32. Munawar, F.; Azmat, S.; Iqbal, T.; Gronlund, C.; Ali, H. Segmentation of lungs in chest x-ray image using generative adversarial networks. IEEE Access 2020, 8, 153535–153545. [Google Scholar] [CrossRef]
  33. Suzuki, K. Overview of deep learning in medical imaging. Radiol. Phys. Technol. 2017, 10, 257–273. [Google Scholar] [CrossRef] [PubMed]
  34. Li, X.; Zhou, Y.; Du, P.; Lang, G.; Xu, M.; Wu, W. A deep learning system that generates quantitative CT reports for diagnosing pulmonary tuberculosis. Appl. Intell. 2020, 51, 4082–4093. [Google Scholar] [CrossRef]
  35. Mlodzinski, E.; Stone, D.J.; Celi, L.A. Machine learning for pulmonary and Critical Care Medicine: A narrative review. Pulm. Ther. 2020, 6, 67–77. [Google Scholar] [CrossRef] [PubMed] [Green Version]
  36. Shi, H.; Zhang, N.D.; Wu, X.; Zhang, Y.D. Multimodal Lung Tumor Image recognition algorithm based on integrated convolutional Neural Network. Concurr. Comput. Pract. Exper. 2018, 32, e4965. [Google Scholar] [CrossRef]
  37. Peng, J.; Chen, C.; Zhou, M.; Xie, X.; Zhou, Y.; Luo, C.-H. A machine-learning approach to forecast aggravation risk in patients with acute exacerbation of chronic obstructive pulmonary disease with clinical indicators. Sci. Rep. 2020, 10, 3118. [Google Scholar] [CrossRef] [PubMed] [Green Version]
  38. Mei, X.; Lee, H.-C.; Diao, K.-y.; Huang, M.; Lin, B.; Liu, C.; Xie, Z.; Ma, Y.; Robson, P.M.; Chung, M.; et al. Artificial Intelligence–enabled rapid diagnosis of patients with COVID-19. Nat. Med. 2020, 26, 1224–1228. [Google Scholar] [CrossRef] [PubMed]
  39. Parsa Hosseini, M.; Soltanian-Zadeh, H.; Akhlaghpoor, S. Detection and severity scoring of chronic obstructive pulmonary disease using volumetric analysis of lung CT images. Iran. J. Radiol. 2012, 9, 22–27. [Google Scholar] [CrossRef] [PubMed] [Green Version]
  40. Liu, C.; Zhao, R.; Pang, M. A fully automatic segmentation algorithm for CT lung images based on random forest. Med. Phys. 2019, 47, 518–529. [Google Scholar] [CrossRef] [PubMed]
  41. Yamamoto, S.; Hasebe, T.; Tomita, K.; Kamei, S.; Matsumoto, T.; Imai, Y.; Takahashi, G.; Kondo, Y.; Ito, Y.; Sakamaki, F. Pulmonary perfusion by Chest Digital Dynamic Radiography: Comparison between breath-holding and Deep-breathing acquisition. J. Appl. Clin. Med. Phys. 2020, 21, 247–255. [Google Scholar] [CrossRef]
  42. Kirby, M.; Hatt, C.; Obuchowski, N.; Humphries, S.M.; Sieren, J.; Lynch, D.A.; Fain, S.B. Inter- and intra-software reproducibility of computed tomography lung density measurements. Med. Phys. 2020, 47, 2962–2969. [Google Scholar] [CrossRef]
  43. Hasse, K.; Hsieh, S.S.; O’Connell, D.; Stiehl, B.; Min, Y.; Neylon, J.; Low, D.A.; Santhanam, A.P. Systematic feasibility analysis of performing elastography using reduced dose CT Lung Image pairs. Med. Phys. 2020, 47, 3369–3375. [Google Scholar] [CrossRef] [PubMed]
  44. Hossain, S.; Umer, S.; Asari, V.; Rout, R.K. A unified framework of deep learning-based facial expression recognition system for diversified applications. Appl. Sci. 2021, 11, 9174. [Google Scholar] [CrossRef]
  45. Rout, R.K.; Choudhury, P.P.; Sahoo, S.; Ray, C. Partitioning 1-variable boolean functions for various classification of n-variable boolean functions. Int. J. Comput. Math. 2015, 92, 2066–2090. [Google Scholar] [CrossRef]
  46. Umer, S.; Mondal, R.; Pandey, H.M.; Rout, R.K. Deep features based convolutional neural network model for text and non-text region segmentation from document images. Appl. Soft Comput. 2021, 113, 107917. [Google Scholar] [CrossRef]
  47. Rout, R.K.; Hassan, S.S.; Sheikh, S.; Umer, S.; Sahoo, K.S.; Gandomi, A.H. Feature-extraction and analysis based on spatial distribution of amino acids for SARS-CoV-2 Protein sequences. Comput. Biol. Med. 2022, 141, 105024. [Google Scholar] [CrossRef] [PubMed]
  48. Hassan, S.S.; Rout, R.K.; Sahoo, K.S.; Jhanjhi, N.; Umer, S.; Tabbakh, T.A.; Almusaylim, Z.A. A Vicenary analysis of SARS-CoV-2 genomes. CMC-Comput. Mater. Contin. 2021, 3477–3493. [Google Scholar] [CrossRef]
  49. Sitaula, C.; Hossain, M.B. Attention-based VGG-16 model for COVID-19 chest X-ray image classification. Appl. Intell. 2021, 51, 2850–2863. [Google Scholar] [CrossRef]
Figure 1. Difference between healthy and damaged lung tissues.
Applsci 13 00507 g001
Figure 2. Transfer learning from pneumonia classification models to detect COVID-19 disease [7].
Applsci 13 00507 g002
Figure 3. Model of 3D CNN for effective classification [19].
Applsci 13 00507 g003
Figure 4. PInfection net (InfNet) architecture specialized for disease detection [28].
Applsci 13 00507 g004
Figure 5. (a) Lung nodule positions for COPD (right) and non-COPD images. (b) Small changes in lung nodule positions for COPD and non-COPD images.
Applsci 13 00507 g005
Figure 6. Proposed architecture for effective COPD classification using fused CNN.
Applsci 13 00507 g006
Figure 7. Bidirectional GRU with RNN for feature extraction.
Applsci 13 00507 g007
Figure 8. Data augmented transfer learning model for real time COPD classification.
Applsci 13 00507 g008
Figure 9. Registration process.
Applsci 13 00507 g009
Figure 10. (a) Proposed GoogLeNet injected ResNet18 model for high accuracy classification. (b) Architecture of the inception module injected in ResNet18.
Applsci 13 00507 g010aApplsci 13 00507 g010b
Figure 11. Average accuracy for different algorithms from [7,19,28], and proposed work.
Applsci 13 00507 g011
Figure 12. Average precision for different algorithms from [7,19,28], and proposed work.
Applsci 13 00507 g012
Figure 13. Average recall for different algorithms from [7,19,28], and proposed work.
Applsci 13 00507 g013
Figure 14. Average fMeasure for different algorithms from [7,19,28], and proposed work.
Applsci 13 00507 g014
Table 1. Test accuracy for combined dataset.
No. of ImagesTA (%)
[7]
TA (%)
[19]
TA (%)
[28]
TA (%)
Proposed
10079.5079.8579.9891.50
20080.2080.3580.4191.70
30080.5080.6080.6591.90
50080.7080.8080.8192.30
70080.9080.8380.8592.50
90080.7680.8980.9492.60
100081.0281.1081.1392.70
120081.1881.2581.2892.90
150081.3281.3882.3793.10
180081.4485.3586.5693.40
200089.2690.1990.4993.80
225091.1391.3991.7493.90
250091.6592.7893.0794.60
280093.9193.9394.2796.90
300093.9595.2795.5598.15
325096.5896.4196.3998.85
350096.2596.3096.3298.81
380096.3696.3696.4298.95
400096.3696.6196.7599.32
425096.8697.1597.2799.86
450097.4597.6297.8599.95
Table 2. Test precision for combined dataset.
No. of ImagesTP (%)
[7]
TP (%)
[19]
TP (%)
[28]
TP (%)
Proposed
10077.9078.1578.2489.37
20078.3978.5178.5789.56
30078.6378.7378.7689.85
50078.8378.8478.8690.15
70078.8678.8978.9290.29
90078.9279.0279.0690.39
100079.1279.1979.2390.54
120079.2779.3379.8390.73
150079.3981.3382.4090.98
180083.2785.6386.3791.32
200087.9988.5888.8991.56
225089.1689.8490.1591.95
250090.5291.0891.3893.42
280091.6492.2992.5995.15
300092.9493.5093.6396.09
325094.0694.0194.0096.42
350093.9593.9894.0296.47
380094.0194.1394.2396.72
400094.2694.5294.6497.16
425094.7895.0195.1897.47
450094.8295.6695.6898.95
Table 3. Test recall for combined dataset.
No. of ImagesTR (%)
[7]
TR (%)
[19]
TR (%)
[28]
TR (%)
Proposed
10076.7877.0777.1888.23
20077.3677.4977.5588.42
30077.6377.7277.7688.66
50077.8277.8877.8889.00
70077.9377.9177.9389.17
90077.8978.0078.0589.26
100078.1178.1978.2389.38
120078.2778.3378.5989.58
150078.3979.3780.3889.79
180080.3483.4084.3590.11
200086.4687.2087.5090.42
225087.9488.4088.7390.66
250088.8689.6989.9891.72
280090.5290.8491.1593.68
300091.1792.0892.2894.75
325093.0092.8992.8795.25
350092.7892.8292.8595.26
380092.8692.9293.0095.45
400092.9993.2393.3695.84
425093.4893.7493.8896.26
450093.7994.2894.4097.02
Table 4. Test fMeasure for combined dataset.
No. of ImagesTF (%)
[7]
TF (%)
[19]
TF (%)
[28]
TF (%)
Proposed
10077.3477.6177.7088.79
20077.8778.0078.0688.99
30078.1378.2278.2689.25
50078.3278.3678.3789.57
70078.3978.4078.4289.73
90078.4078.5178.5589.82
100078.6178.6978.7289.96
120078.7678.8379.2090.15
150078.8980.3481.3890.38
180081.7884.5085.3590.71
200087.2287.8888.1990.99
225088.5589.1289.4391.30
250089.6990.3890.6892.56
280091.0891.5691.8794.41
300092.0592.7992.9595.42
325093.5393.4593.4395.83
350093.3693.4093.4395.86
380093.4393.5393.6196.08
400093.6293.8794.0096.50
425094.1394.3794.5296.86
450094.3094.9795.0497.98
Table 5. Average accuracy for life expectancy prediction.
AAL (%) [7]AAL (%) [19]AAL (%) [28]AAL (%) Proposed
89.5091.3591.9897.21
Disclaimer/Publisher’s Note: The statements, opinions and data contained in all publications are solely those of the individual author(s) and contributor(s) and not of MDPI and/or the editor(s). MDPI and/or the editor(s) disclaim responsibility for any injury to people or property resulting from any ideas, methods, instructions or products referred to in the content.

