
Automated Hybrid Model for Detecting Perineural Invasion in the Histology of Colorectal Cancer

Abstract
:1. Introduction
2. Materials and Methods
2.1. Data Acquisition
2.2. Patch Generation
2.3. Image Preprocessing
2.4. Segmentation Network Development
2.5. PNI Classifier
2.6. Evaluation Metrics
2.7. Inference Timing
3. Results
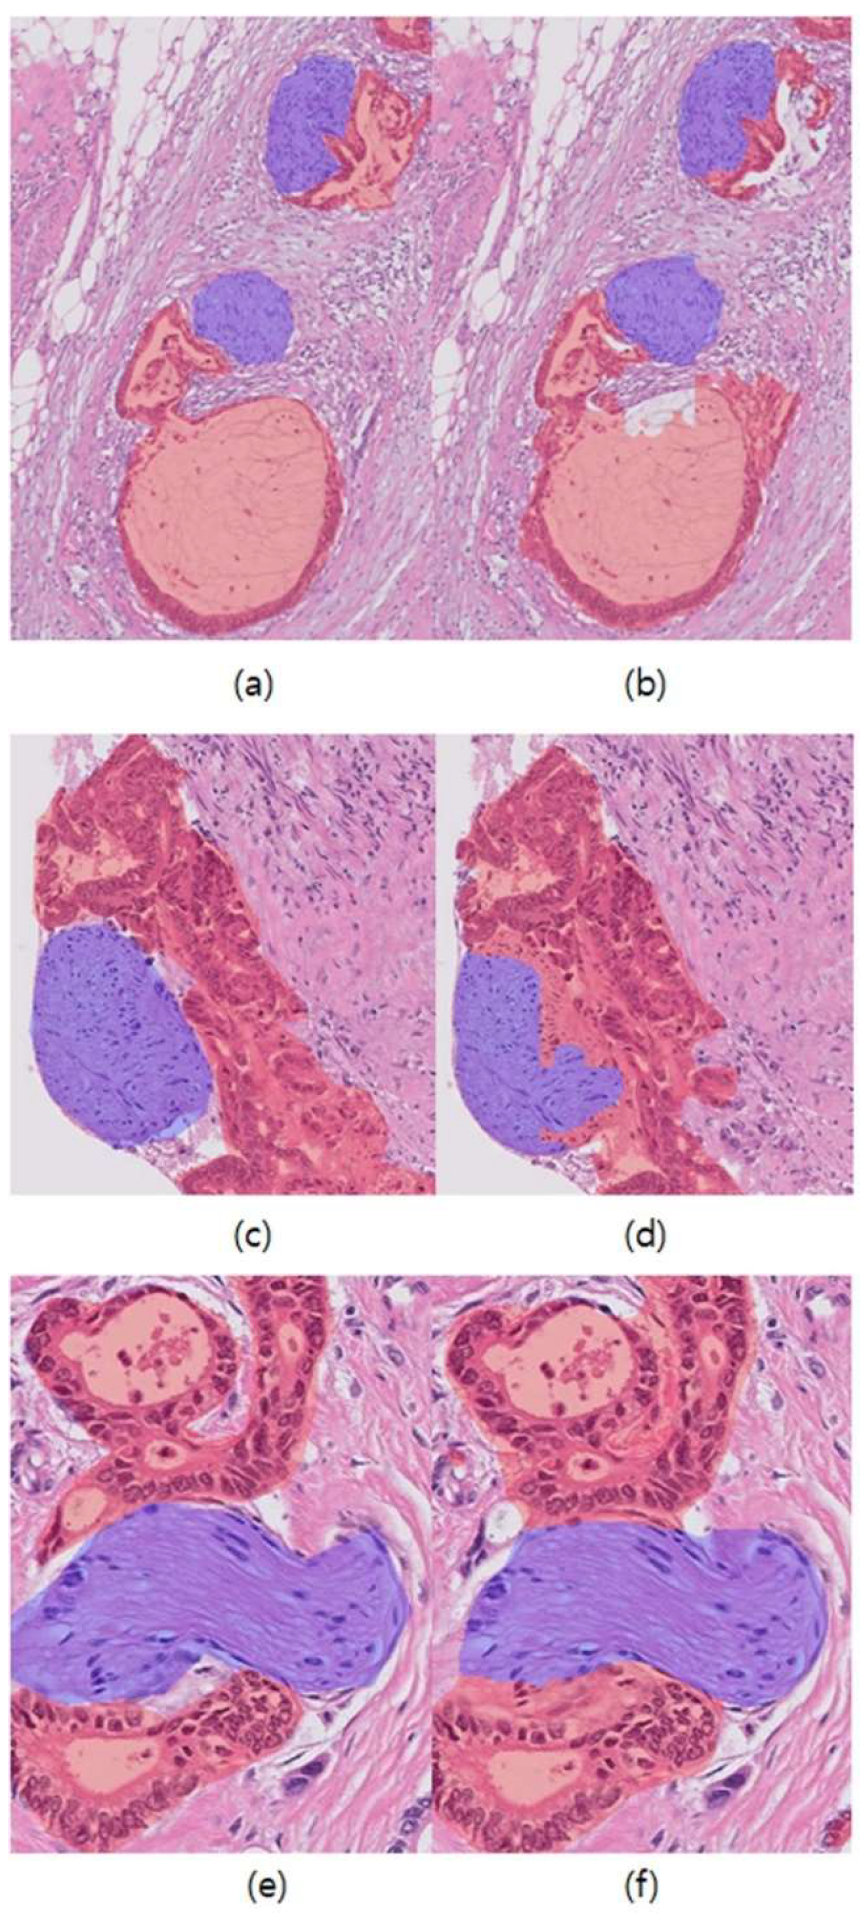
3.1. Results of Segmentation Networks
3.2. Region-Wise Performance
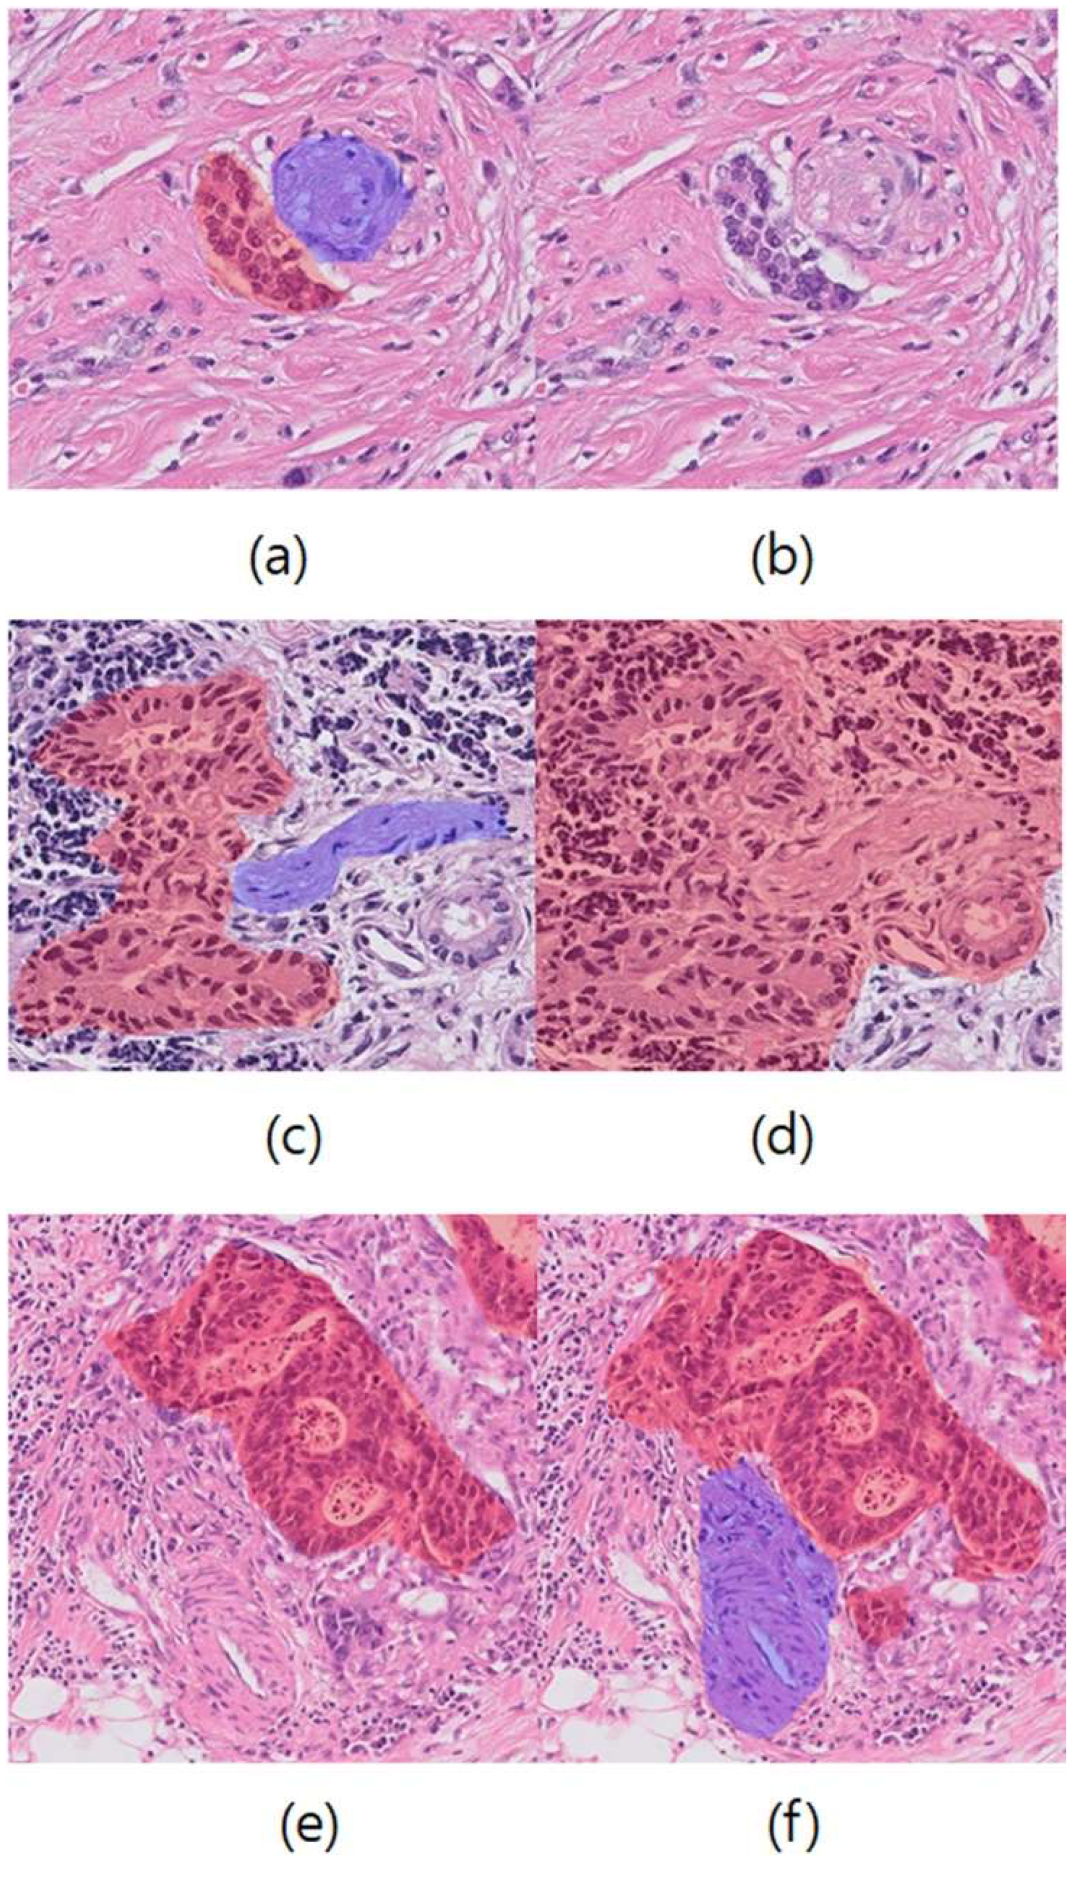
3.3. Analysis of False Results
3.4. Effects of Pre-Training Tasks
3.5. Inference Time Comparison
4. Discussion
5. Conclusions
Supplementary Materials
Author Contributions
Funding
Institutional Review Board Statement
Informed Consent Statement
Data Availability Statement
Acknowledgments
Conflicts of Interest
References
- Knijn, N.; Mogk, S.C.; Teerenstra, S.; Simmer, F.; Nagtegaal, I.D. Perineural Invasion is a Strong Prognostic Factor in Colorectal Cancer: A systematic review. Am. J. Surg. Pathol. 2016, 40, 103–112. [Google Scholar] [CrossRef] [PubMed]
- Liebig, C.; Ayala, G.; Wilks, J.; Verstovsek, G.; Liu, H.; Agarwal, N.; Berger, D.H.; Albo, D. Perineural invasion is an inde-pendent predictor of outcome in colorectal cancer. J. Clin. Oncol. 2009, 27, 5131–5137. [Google Scholar] [CrossRef] [PubMed]
- Tsai, H.L.; Cheng, K.I.; Lu, C.Y.; Kuo, C.H.; Ma, C.J.; Wu, J.Y.; Chai, C.Y.; Hsieh, J.S.; Wang, J.Y. Prognostic significance of depth of invasion, vascular invasion and numbers of lymph node retrievals in combination for patients with stage II colorectal cancer undergoing radical resection. J. Surg. Oncol. 2007, 97, 383–387. [Google Scholar] [CrossRef] [PubMed]
- Hu, G.; Li, L.; Hu, K. Clinical implications of perineural invasion in patients with colorectal cancer. Medicine 2020, 99, e19860. [Google Scholar] [CrossRef]
- Batsakis, J.G. Nerves and neurotropic carcinomas. Ann. Otol. Rhinol. Laryngol. 1985, 94, 426–427. [Google Scholar]
- Liebig, C.; Ayala, G.; Wilks, J.A.; Berger, D.H.; Albo, D. Perineural invasion in cancer: A review of the literature. Cancer 2009, 115, 3379–3391. [Google Scholar] [CrossRef]
- Marchesi, F.; Piemonti, L.; Mantovani, A.; Allavena, P. Molecular mechanisms of perineural invasion, a forgotten pathway of dissemination and metastasis. Cytokine Growth Factor Rev. 2010, 21, 77–82. [Google Scholar] [CrossRef]
- Sun, Q.; Liu, T.; Liu, P.; Luo, J.; Zhang, N.; Lu, K.; Ju, H.; Zhu, Y.; Wu, W.; Zhang, L.; et al. Perineural and lymphovascular invasion predicts for poor prognosis in locally advanced rectal cancer after neoadjuvant chemoradiotherapy and surgery. J. Cancer 2019, 10, 2243–2249. [Google Scholar] [CrossRef]
- Kim, B.H.; Kim, J.M.; Kang, G.H.; Chang, H.J.; Kang, D.W.; Kim, J.H.; Bae, J.M.; Seo, A.N.; Park, H.S.; Kang, Y.K.; et al. Standardized Pathology Report for Colorectal Cancer, 2nd Edition. J. Pathol. Transl. Med. 2020, 54, 1–19. [Google Scholar] [CrossRef]
- Compton, C.; Fenoglio-Preiser, C.M.; Pettigrew, N.; Fielding, L.P. American Joint Committee on Cancer prognostic factors consensus conference: Colorectal Working Group. Cancer 2000, 88, 1739–1757. [Google Scholar] [CrossRef]
- Chi, A.C.; Katabi, N.; Chen, H.S.; Cheng, Y.S.L. Interobserver Variation Among Pathologists in Evaluating Perineural Invasion for Oral Squamous Cell Carcinoma. Head Neck Pathol. 2016, 10, 451–464. [Google Scholar] [CrossRef] [Green Version]
- Peng, J.; Sheng, W.; Huang, D.; Venook, A.P.; Xu, Y.; Guan, Z.; Cai, S. Perineural invasion in pT3N0 rectal cancer: The incidence and its prognostic effect. Cancer 2011, 117, 1415–1421. [Google Scholar] [CrossRef]
- Bonert, M.; Zafar, U.; Maung, R.; El-Shinnawy, I.; Kak, I.; Cutz, J.C.; Naqvi, A.; Juergens, R.A.; Finley, C.; Salama, S.; et al. Evolution of anatomic pathology workload from 2011 to 2019 assessed in a regional hospital laboratory via 574,093 pathology reports. PLoS ONE 2021, 16, e0253876. [Google Scholar] [CrossRef]
- Metter, D.M.; Colgan, T.J.; Leung, S.T.; Timmons, C.F.; Park, J.Y. Trends in the US and Canadian Pathologist Workforces from 2007 to 2017. JAMA Netw. Open 2019, 2, e194337. [Google Scholar] [CrossRef]
- Bodalal, Z.; Trebeschi, S.; Beets-Tan, R. Radiomics: A critical step towards integrated healthcare. Insights Imaging 2018, 9, 911–914. [Google Scholar] [CrossRef]
- Gillies, R.J.; Kinahan, P.E.; Hricak, H. Radiomics: Images Are More than Pictures, They Are Data. Radiology 2016, 278, 563–577. [Google Scholar] [CrossRef]
- Kaiming, H.; Xiangyu, Z.; Shaoqing, R.; Jian, S. Deep Residual Learning for Image Recognition. In Proceedings of the IEEE Conference on Computer Vision and Pattern Recognition (CVPR), Las Vegas, NV, USA, 27–30 June 2016. [Google Scholar]
- Echle, A.; Rindtorff, N.T.; Brinker, T.J.; Luedde, T.; Pearson, A.T.; Kather, J.N. Deep learning in cancer pathology: A new generation of clinical biomarkers. Br. J. Cancer 2020, 124, 686–696. [Google Scholar] [CrossRef]
- Lu, M.Y.; Chen, T.Y.; Williamson DF, K.; Zhao, M.; Shady, M.; Lipkova, J.; Mahmood, F. AI-based pathology predicts origins for cancers of unknown primary. Nature 2021, 594, 106–110. [Google Scholar] [CrossRef]
- Van der Laak, J.; Litjens, G.; Ciompi, F. Deep learning in histopathology: The path to the clinic. Nat. Med. 2021, 27, 775–784. [Google Scholar] [CrossRef]
- Kartasalo, K.; Ström, P.; Ruusuvuori, P.; Samaratunga, H.; Delahunt, B.; Tsuzuki, T.; Eklund, M.; Egevad, L. Detection of perineural invasion in prostate needle biopsies with deep neural networks. Virchows Arch. 2022, 481, 73–82. [Google Scholar] [CrossRef]
- Nateghi, R.; Pourakpour, F. Perineural invasion detection in multiple organ cancer based on deep convolutional neural network. arXiv 2021, arXiv:2110.12283. [Google Scholar]
- Ching, T.; Himmelstein, D.S.; Beaulieu-Jones, B.K.; Kalinin, A.A.; Do, B.T.; Way, G.P.; Ferrero, E.; Agapow, P.M.; Zietz, M.; Hoffman, M.M.; et al. Opportunities and obstacles for deep learning in biology and medicine. J. R. Soc. Interface 2018, 15, 20170387. [Google Scholar] [CrossRef] [PubMed] [Green Version]
- Madabhushi, A.; Lee, G. Image analysis and machine learning in digital pathology: Challenges and opportunities. Med. Image Anal. 2016, 33, 170–175. [Google Scholar] [CrossRef] [PubMed]
- Buslaev, A.; Iglovikov, V.I.; Khvedchenya, E.; Parinov, A.; Druzhinin, M.; Kalinin, A.A. Albumentations: Fast and flexible image augmentations. Information 2020, 11, 125. [Google Scholar] [CrossRef]
- Ronneberger, O.; Fischer, P.; Brox, T. U-net: Convolutional networks for biomedical image segmentation. In Proceedings of the International Conference on Medical Image Computing and Computer-Assisted Intervention (MICCAI 2015), Munich, Germany, 18–22 September 2022; Navab, N., Hornegger, J., Wells, W., Frangi, A., Eds.; Springer: Cham, Switzerland, 2015; Volume 9351, pp. 234–241. [Google Scholar]
- Chen, L.C.; Papandreou, G.; Kokkinos, I.; Murphy, K.; Yuille, A.L. DeepLab: Semantic Image Segmentation with Deep Con-volutional Nets, Atrous Convolution, and Fully Connected CRFs. IEEE Trans. Pattern Anal. Mach. Intell. 2018, 40, 834–848. [Google Scholar] [CrossRef]
- Xie, E.; Wang, W.; Yu, Z.; Anandkumar, A.; Alvarez, J.M.; Luo, P. SegFormer: Simple and efficient design for semantic segmentation with transformers. Adv. Neural Inf. Process. Syst. 2021, 34, 12077–12090. [Google Scholar]
- Deng, J.; Dong, W.; Socher, R.; Li, L.J.; Kai, L.; Li, F.-F. ImageNet: A large-scale hierarchical image database. In Proceedings of the 2009 IEEE Conference on Computer Vision and Pattern Recognition, Miami, FL, USA, 20–25 June 2009; pp. 248–255. [Google Scholar]
- Egevad, L.; Delahunt, B.; Samaratunga, H.; Tsuzuki, T.; Olsson, H.; Ström, P.; Lindskog, C.; Häkkinen, T.; Kartasalo, K.; Eklund, M.; et al. Interobserver reproducibility of perineural invasion of prostatic adenocarcinoma in needle biopsies. Virchows Arch. 2021, 478, 1109–1116. [Google Scholar] [CrossRef]
- Samek, W.; Wiegand, T.; Müller, K.R. Explainable artificial intelligence: Understanding, visualizing and interpreting deep learning models. arXiv 2017, arXiv:1708.08296. [Google Scholar]
- Zhang, Y.; Weng, Y.; Lund, J. Applications of Explainable Artificial Intelligence in Diagnosis and Surgery. Diagnostics 2022, 12, 237. [Google Scholar] [CrossRef]
- Ahmad, Z.; Rahim, S.; Zubair, M.; Abdul-Ghafar, J. Artificial intelligence (AI) in medicine, current applications and future role with special emphasis on its potential and promise in pathology: Present and future impact, obstacles including costs and acceptance among pathologists, practical and philosophical considerations. A comprehensive review. Diagn. Pathol. 2021, 16, 1–16. [Google Scholar] [CrossRef]
- Pantanowitz, L.; Sinard, J.H.; Henricks, W.H.; Fatheree, B.L.A.; Carter, A.B.; Contis, L.; Beckwith, B.A.; Evans, A.J.; Lal, A.; Parwani, A.V. Validating Whole Slide Imaging for Diagnostic Purposes in Pathology: Guideline from the College of American Pathologists Pathology and Laboratory Quality Center. Arch. Pathol. Lab. Med. 2013, 137, 1710–1722. [Google Scholar] [CrossRef]
- Chong, Y.; Kim, D.C.; Jung, C.K.; Kim, D.C.; Song, S.Y.; Joo, H.J.; Yi, S.Y.; Medical Informatics Study Group of the Korean Society of Pathologists. Recommendations for pathologic practice using digital pathology: Consensus report of the Korean Society of Pathologists. J. Pathol. Transl. Med. 2020, 54, 437–452. [Google Scholar] [CrossRef]
- Federal Association of German Pathologists Bundesverband Deutscher Pathologen (FAGP-BDP). Guidelines Digital Pathology for Diagnosis on (And Reports of) Digital Images; Federal Association of German Pathologists Bundesverband Deutscher Pathologen (FAGP-BDP): Berlin, Germany, 2018. [Google Scholar]
- Digital Pathology Assessment Committee. Technical Standards for Digital Pathology System for Pathologic Diagnosis; Japanese Society of Pathology: Tokyo, Japan, 2015. [Google Scholar]
- Schömig-Markiefka, B.; Pryalukhin, A.; Hulla, W.; Bychkov, A.; Fukuoka, J.; Madabhushi, A.; Achter, V.; Nieroda, L.; Büttner, R.; Quaas, A.; et al. Quality control stress test for deep learning-based diagnostic model in digital pathology. Mod. Pathol. 2021, 34, 2098–2108. [Google Scholar] [CrossRef]


| No. of Regions | No. of Patches | ||
|---|---|---|---|
| PNI | 100 | 362 | |
| Non-PNI | Nerve | 204 | 687 |
| Tumor | 207 | 7547 | |
| Normal | 19 | 880 | |
| Total | 530 | 9476 | |
| Accuracy | IoU | Sensitivity | Precision | F1-Score | ||
|---|---|---|---|---|---|---|
| Nerve | U-Net a | 0.987 | 0.887 | 0.943 | 0.937 | 0.940 |
| DeepLabv3+ a | 0.985 | 0.837 | 0.892 | 0.931 | 0.911 | |
| U-Net (m) b | 0.893 | 0.801 | 0.867 | 0.924 | 0.891 | |
| SegFormer (m) b | 0.921 | 0.829 | 0.921 | 0.893 | 0.907 | |
| Tumor | U-Net a | 0.900 | 0.676 | 0.887 | 0.740 | 0.805 |
| DeepLabv3+ a | 0.922 | 0.769 | 0.903 | 0.839 | 0.869 | |
| U-Net (m) b | 0.893 | 0.611 | 0.856 | 0.681 | 0.757 | |
| SegFormer (m) b | 0.838 | 0.686 | 0.838 | 0.791 | 0.814 | |
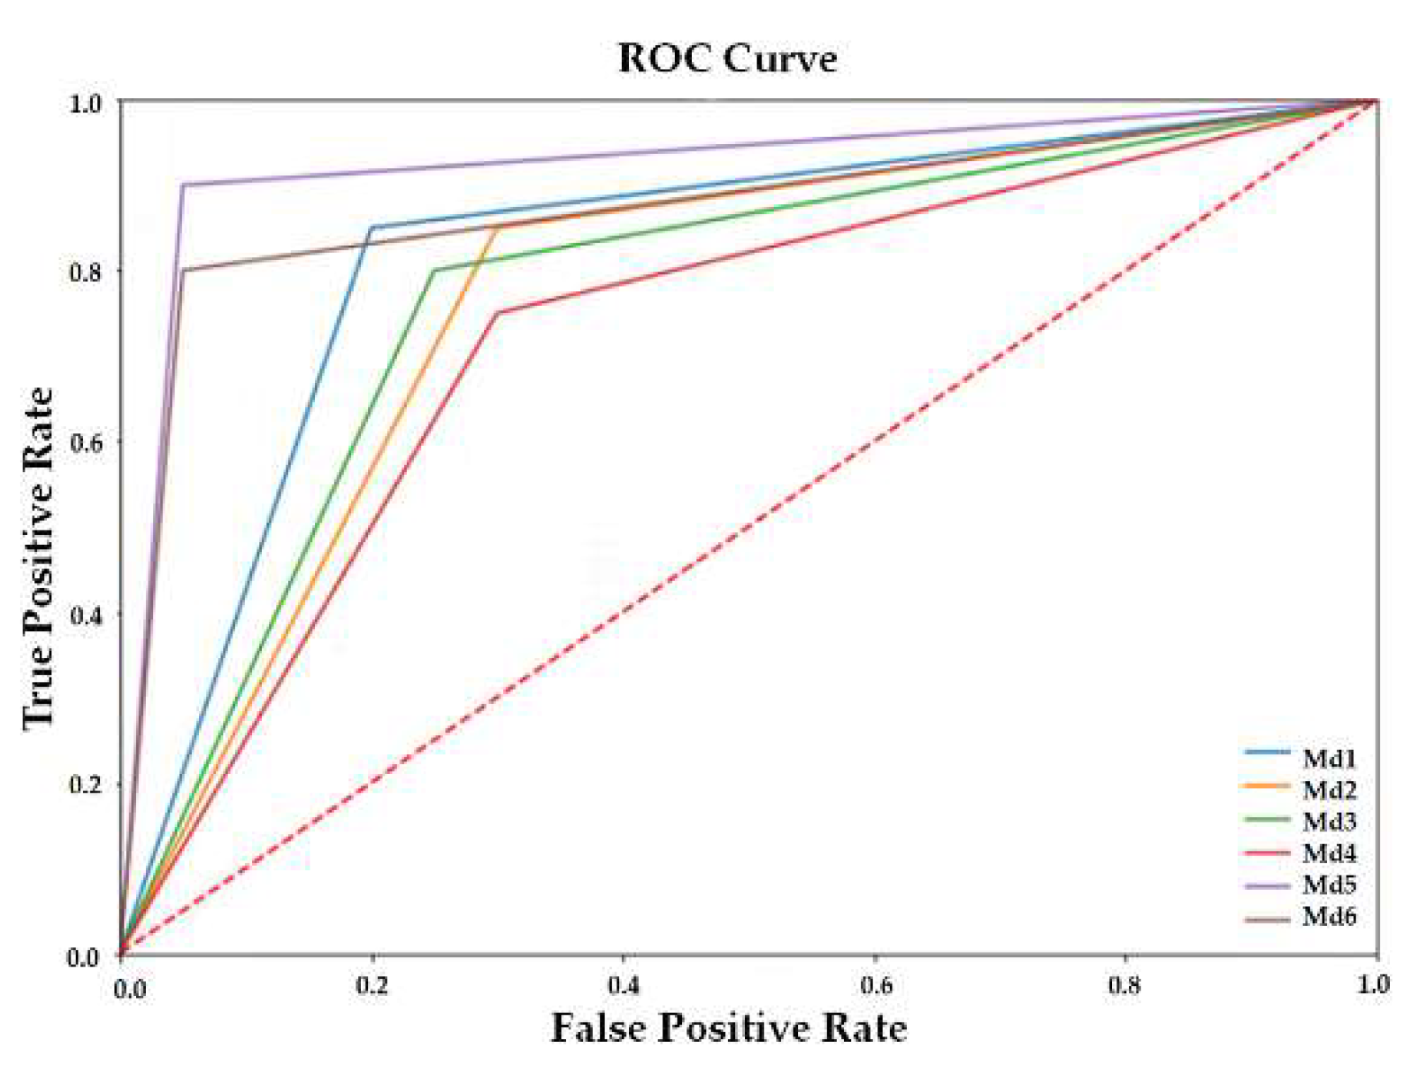
| Module a | AccuracyR | SensitivityR | SpecificityR | NPVR b | PrecisionR | F1-ScoreR | AUC (95% CI) |
|---|---|---|---|---|---|---|---|
| Md1 | 0.85 | 0.85 | 0.85 | 0.85 | 0.85 | 0.85 | |
| Md2 | 0.80 | 0.85 | 0.75 | 0.83 | 0.77 | 0.81 | |
| Md3 | 0.80 | 0.75 | 0.85 | 0.77 | 0.83 | 0.79 | |
| Md4 | 0.72 | 0.75 | 0.70 | 0.74 | 0.71 | 0.73 | |
| Md5 | 0.92 | 0.90 | 0.95 | 0.90 | 0.95 | 0.92 | |
| Md6 | 0.88 | 0.80 | 0.95 | 0.83 | 0.94 | 0.87 | 0.88 |
Publisher’s Note: MDPI stays neutral with regard to jurisdictional claims in published maps and institutional affiliations. |
© 2022 by the authors. Licensee MDPI, Basel, Switzerland. This article is an open access article distributed under the terms and conditions of the Creative Commons Attribution (CC BY) license (https://creativecommons.org/licenses/by/4.0/).
Share and Cite
Jung, J.; Kim, E.; Lee, H.; Lee, S.H.; Ahn, S. Automated Hybrid Model for Detecting Perineural Invasion in the Histology of Colorectal Cancer. Appl. Sci. 2022, 12, 9159. https://doi.org/10.3390/app12189159
Jung J, Kim E, Lee H, Lee SH, Ahn S. Automated Hybrid Model for Detecting Perineural Invasion in the Histology of Colorectal Cancer. Applied Sciences. 2022; 12(18):9159. https://doi.org/10.3390/app12189159
Chicago/Turabian StyleJung, Jiyoon, Eunsu Kim, Hyeseong Lee, Sung Hak Lee, and Sangjeong Ahn. 2022. "Automated Hybrid Model for Detecting Perineural Invasion in the Histology of Colorectal Cancer" Applied Sciences 12, no. 18: 9159. https://doi.org/10.3390/app12189159