
A Novel Monocular Vision Technique for the Detection of Electric Transmission Tower Tilting Trend

Abstract
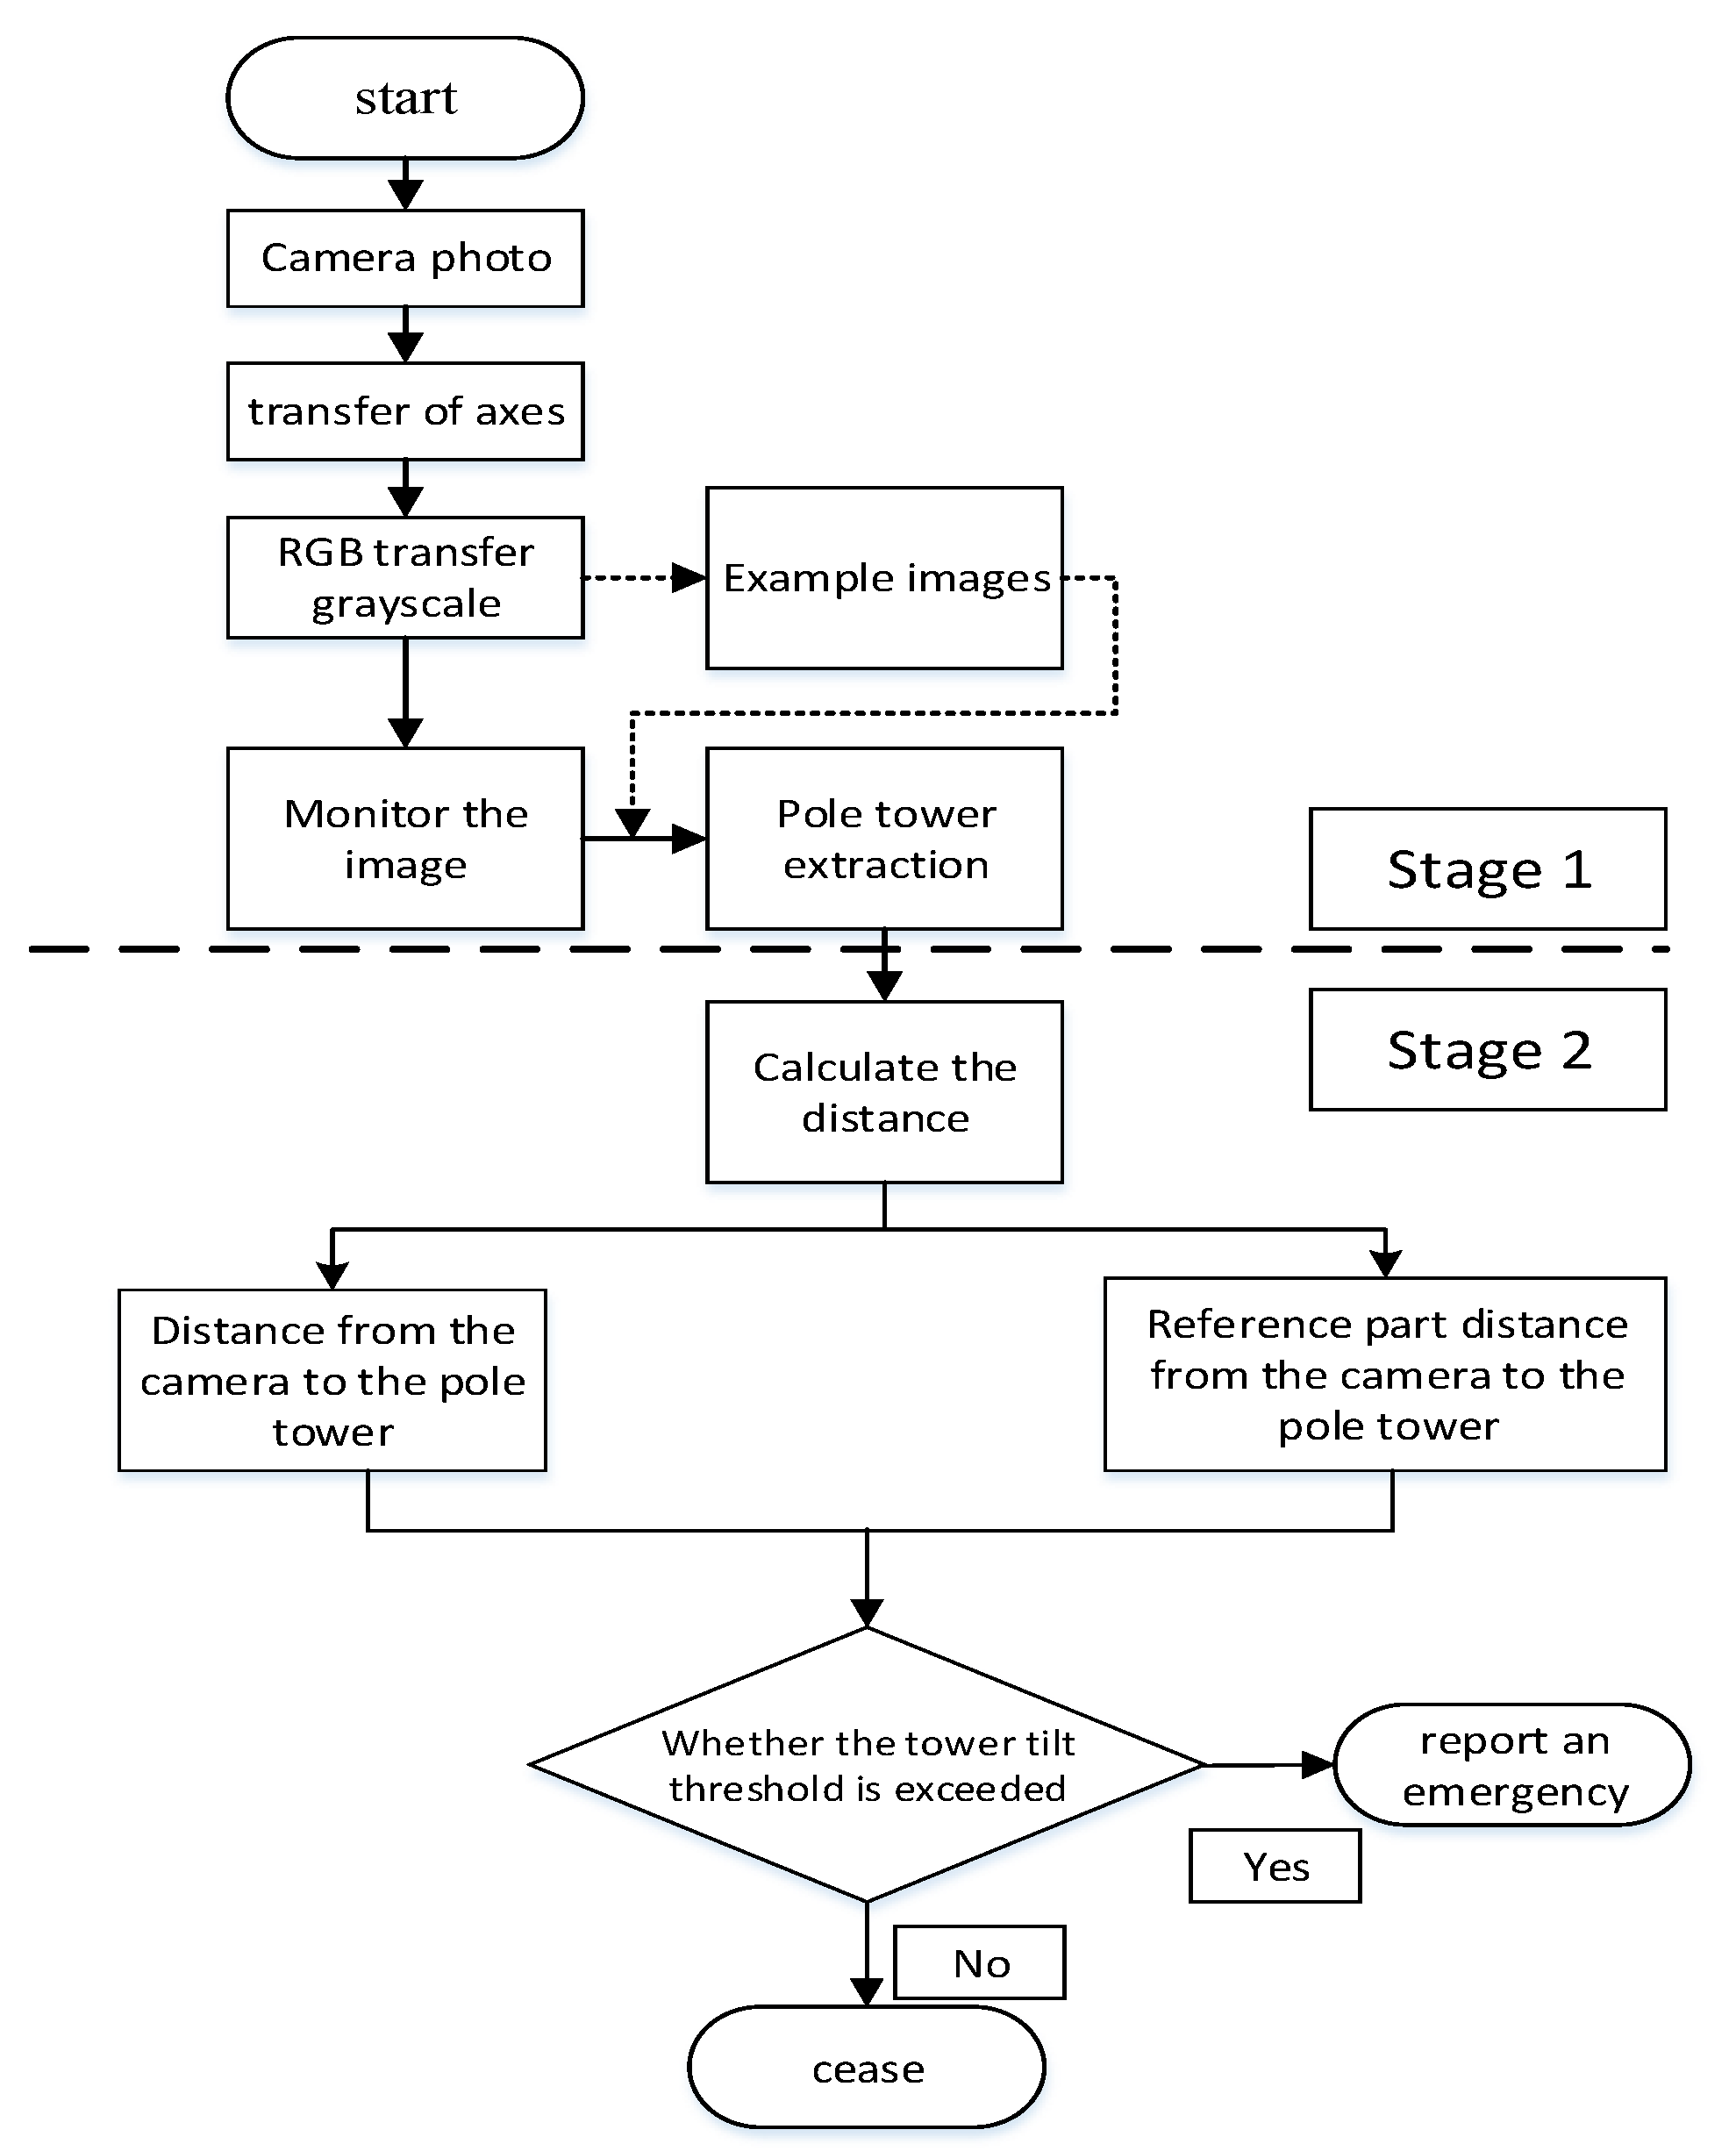
:1. Introduction
- Manual measurement requires on-site measurement with instruments, which is cumbersome and requires a lot of workforce and material resources. It is also complex and poses specific security risks due to the geographical conditions of transmission lines. UAV monitoring uses airborne laser radar to build three-dimensional point clouds, which are then projected onto two-dimensional planes and analyzed using correlation algorithms [15]. However, this method has a high cost and does not provide real-time monitoring. Video monitoring has a strong real-time capability and can offer the intuitive perception of external force intrusion and other field conditions. It can timely detect abnormal conditions of transmission channels, such as external force damage. However, it requires manual monitoring and manual analysis for multi-directional distance monitoring of transmission channels. Further, it cannot accurately obtain real-time data and timely collection of spatial status data of conductors [16].
- For distance monitoring of tree barriers, commonly used methods include ranging with an airborne laser scanning device, setting up radar or laser ranging device, processing aerial inspection video, building a tree line model to predict distance, and binocular vision image ranging [17]. These methods improve the efficiency of distance measurement of tree barriers but also have some problems [18]. For example, 3D modeling requires regular updating and reconstruction, and the workload is significant. The tree growth cycle model construction is complex, while the stereo matching of binocular vision ranging is complicated [19]. Moreover, these tree barrier ranging methods have high costs and cannot provide real-time dynamic data of transmission lines.
- The traditional multi-directional distance monitoring method for a transmission channel cannot provide real-time analysis and processing, abnormal alarm, and trend warning [20].
2. Contour Extraction of Transmission Tower
2.1. Edge Detection of the Modified Canny Algorithm
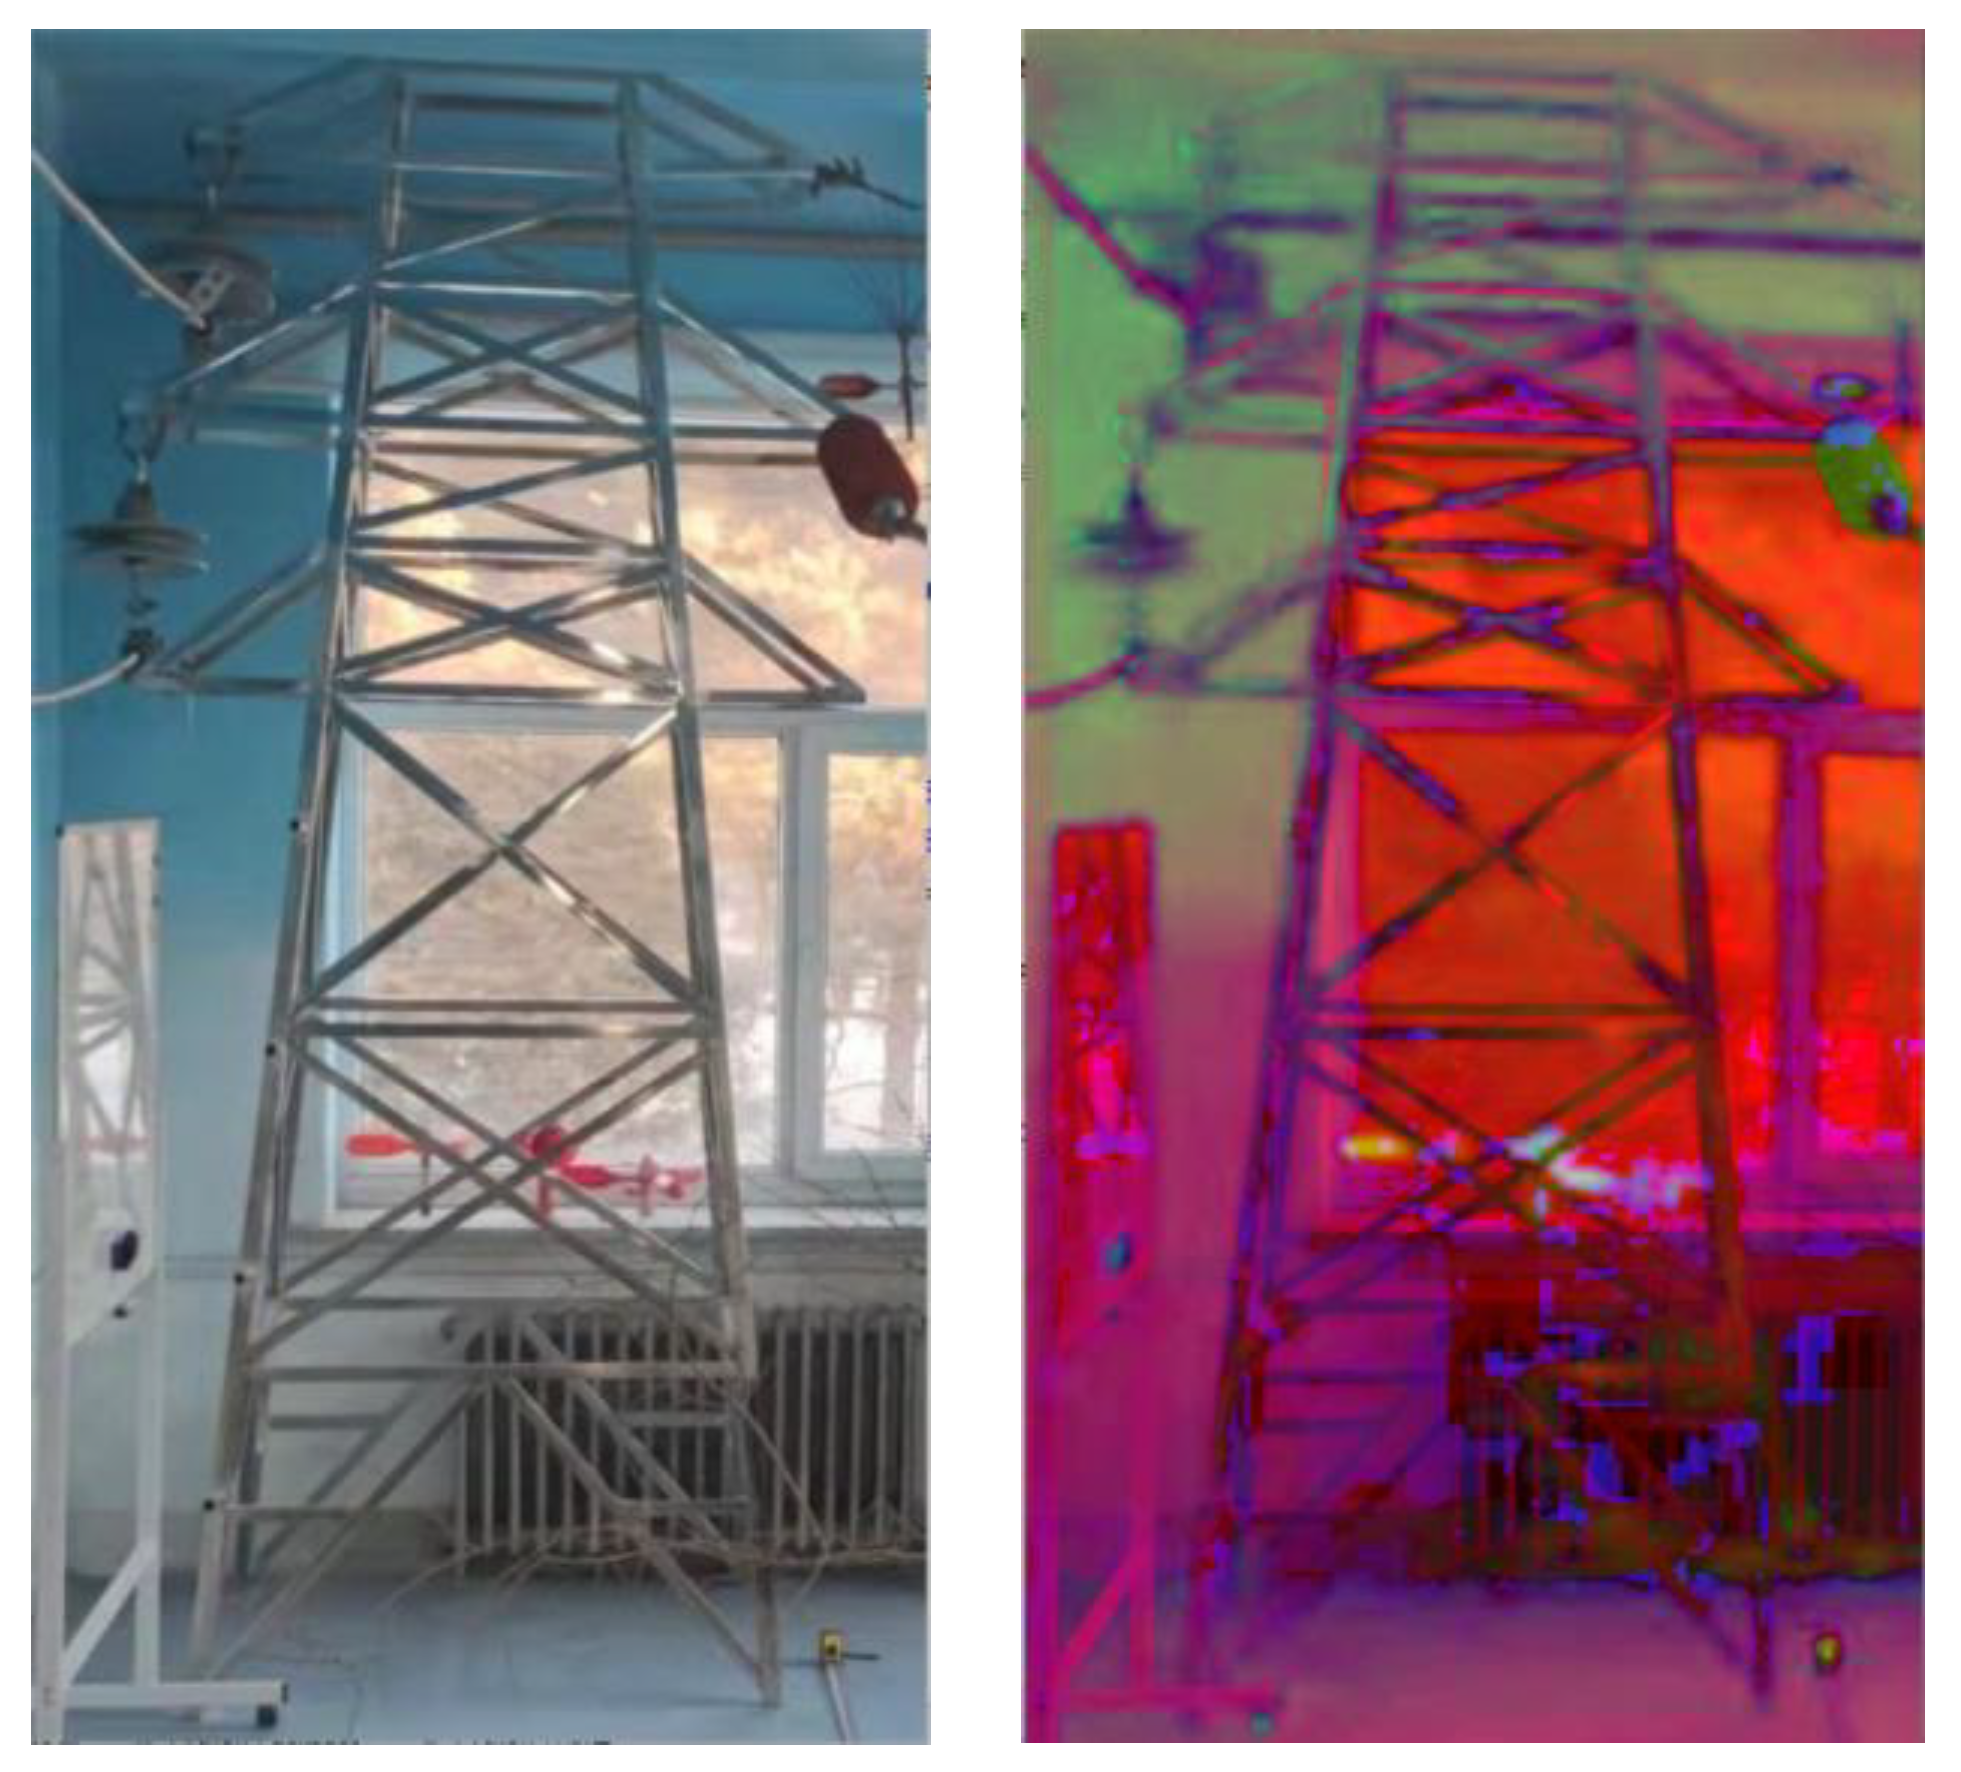
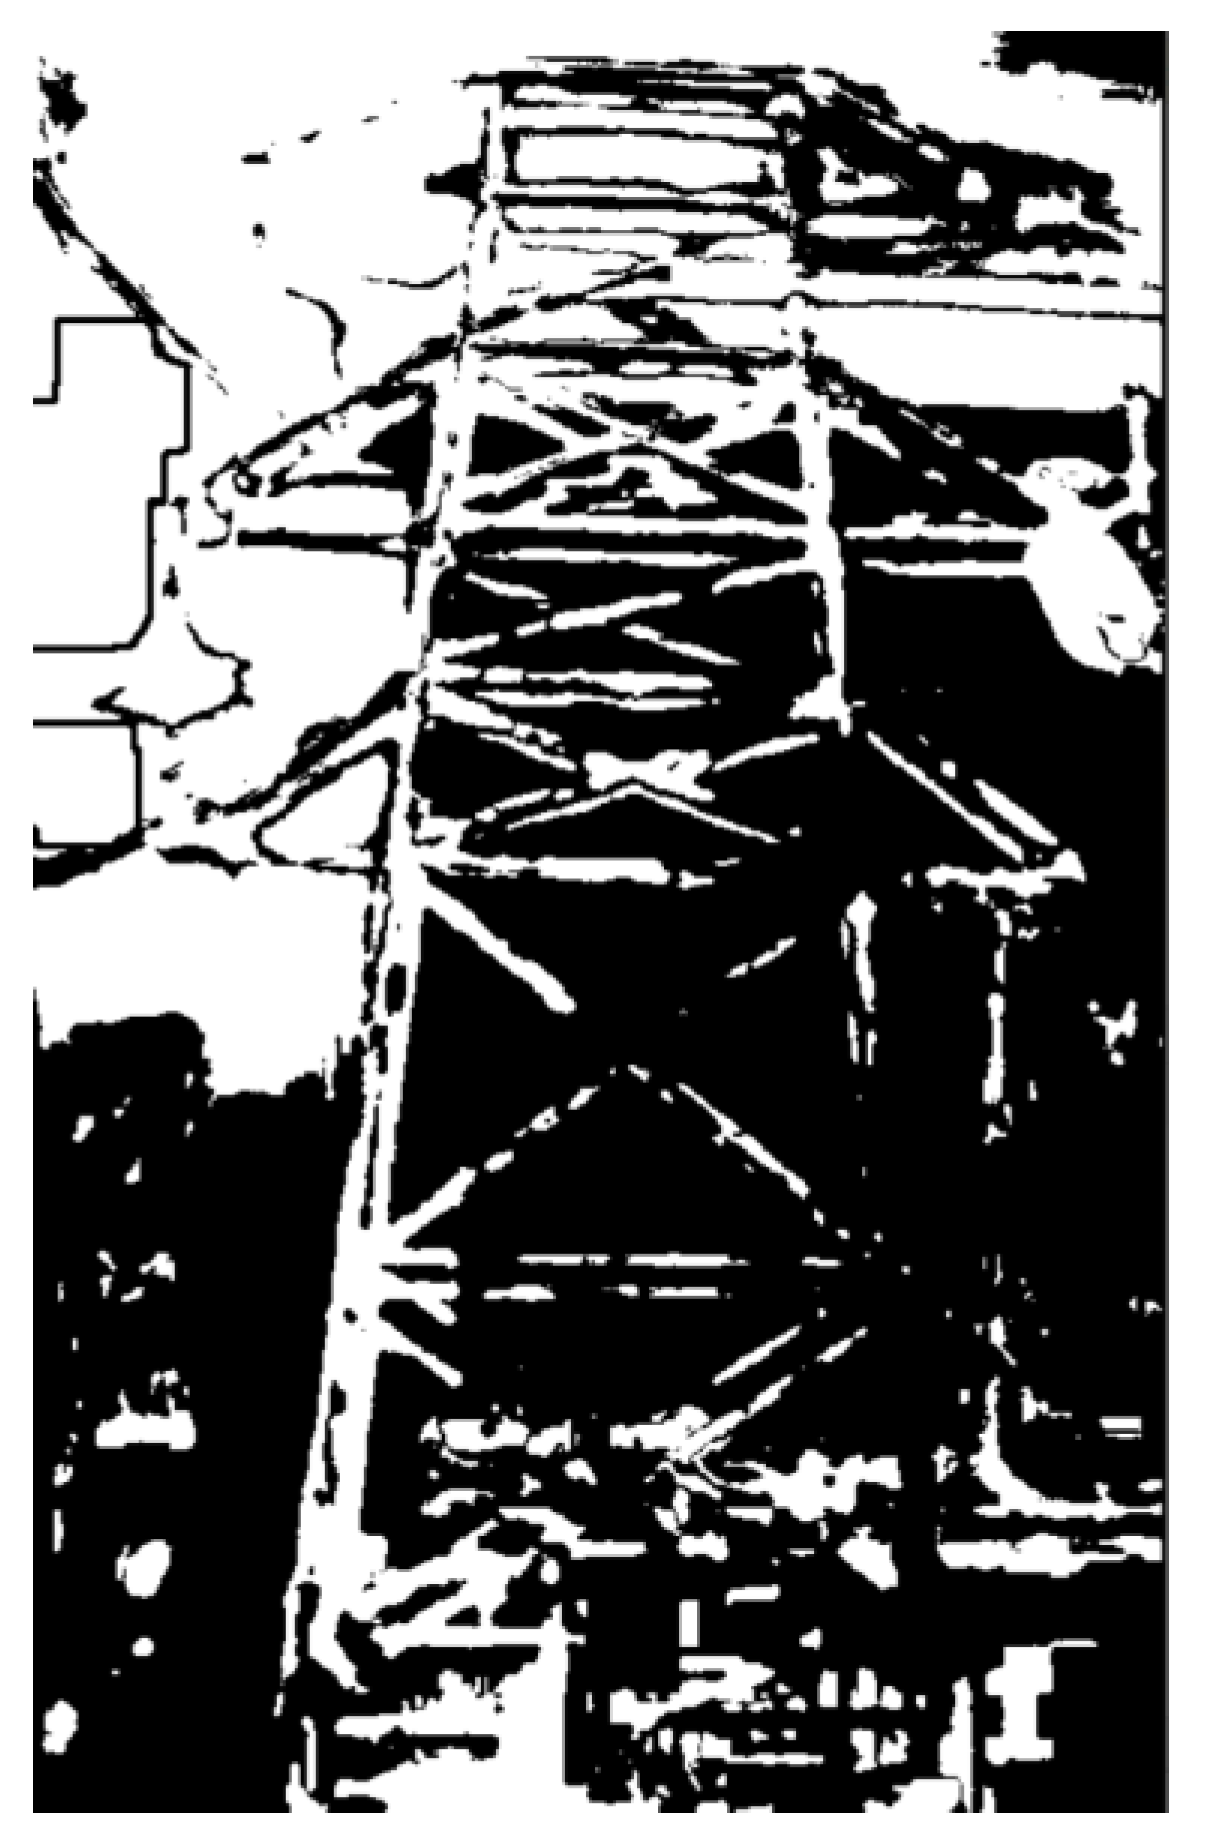
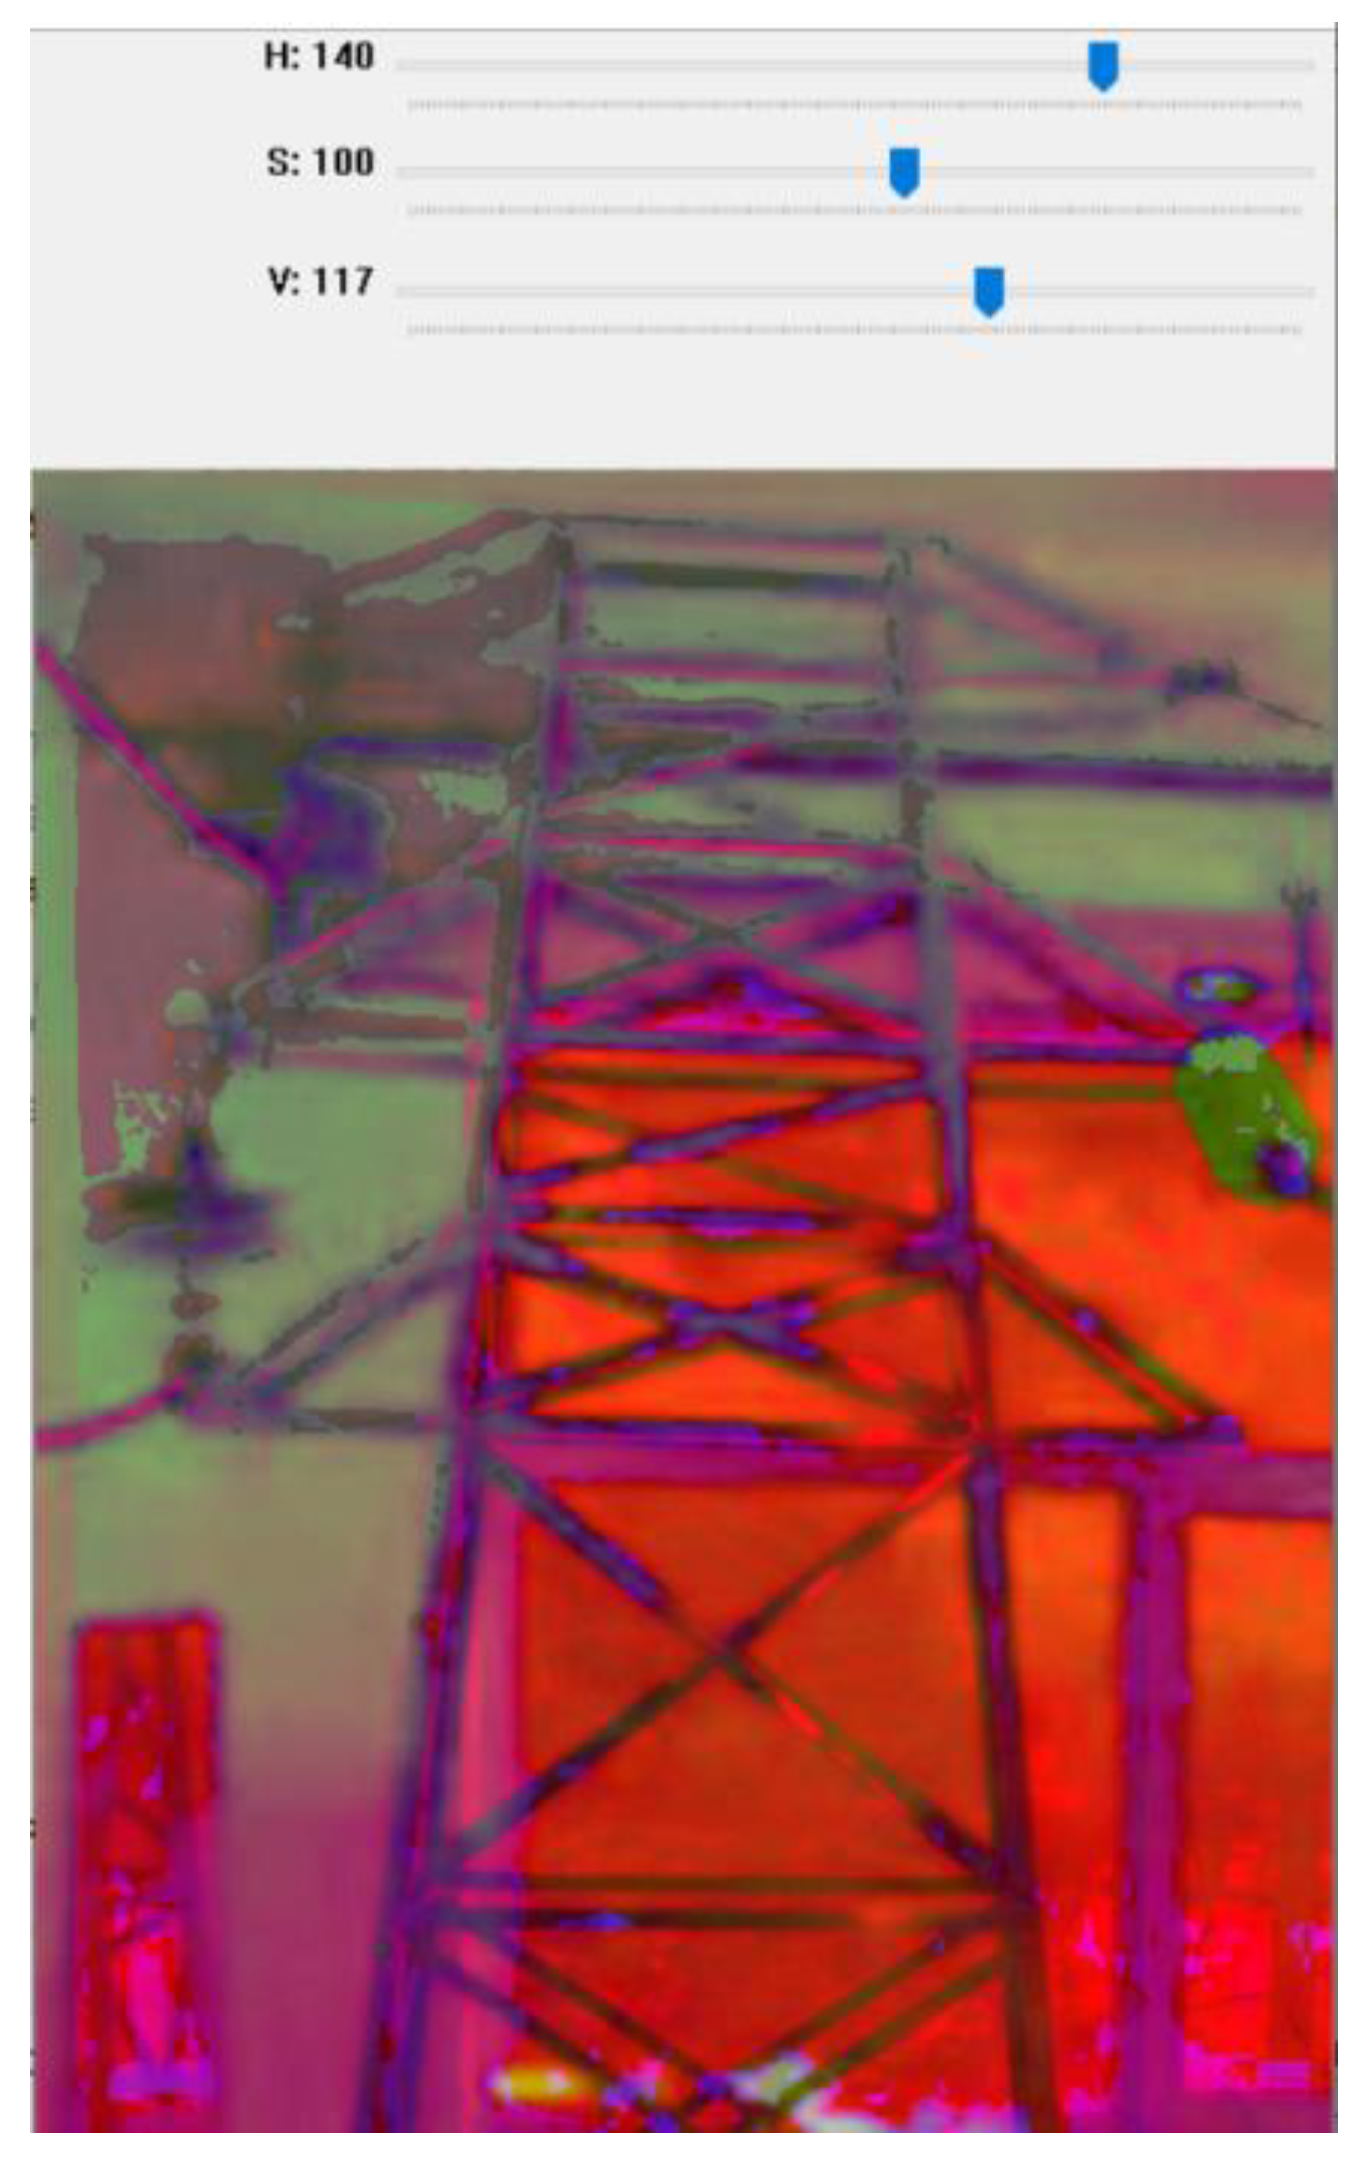
2.2. The RGB Converted to HSV Color Space
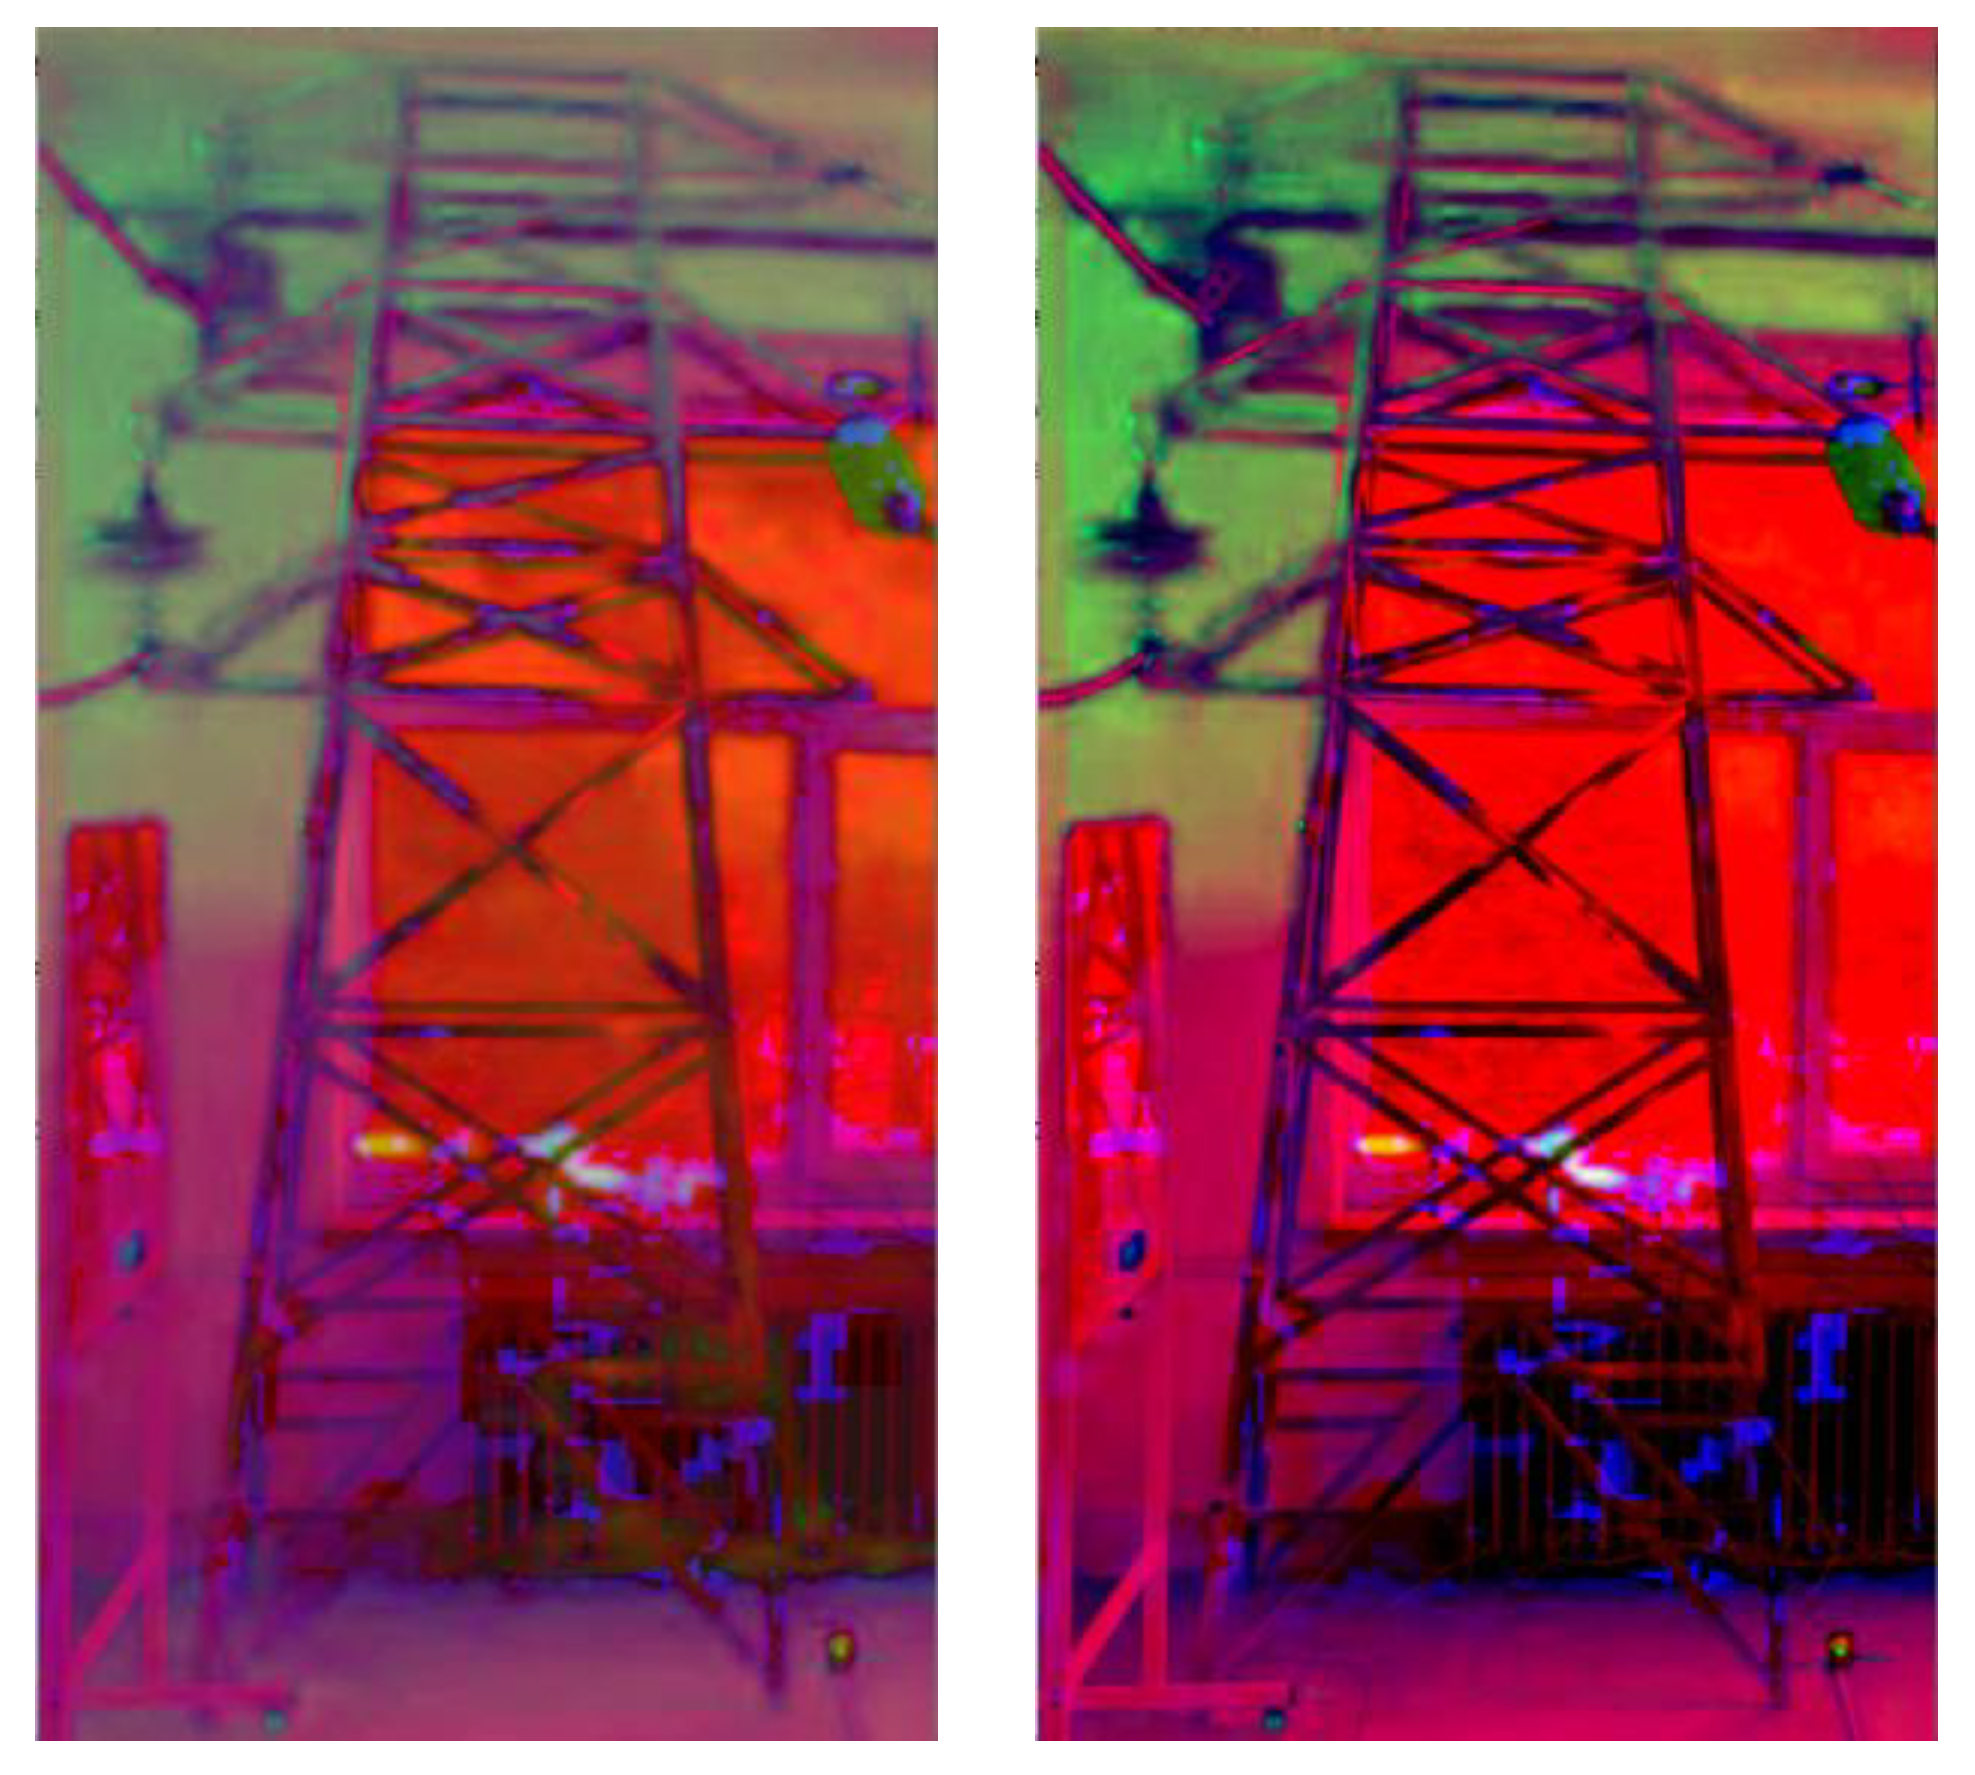
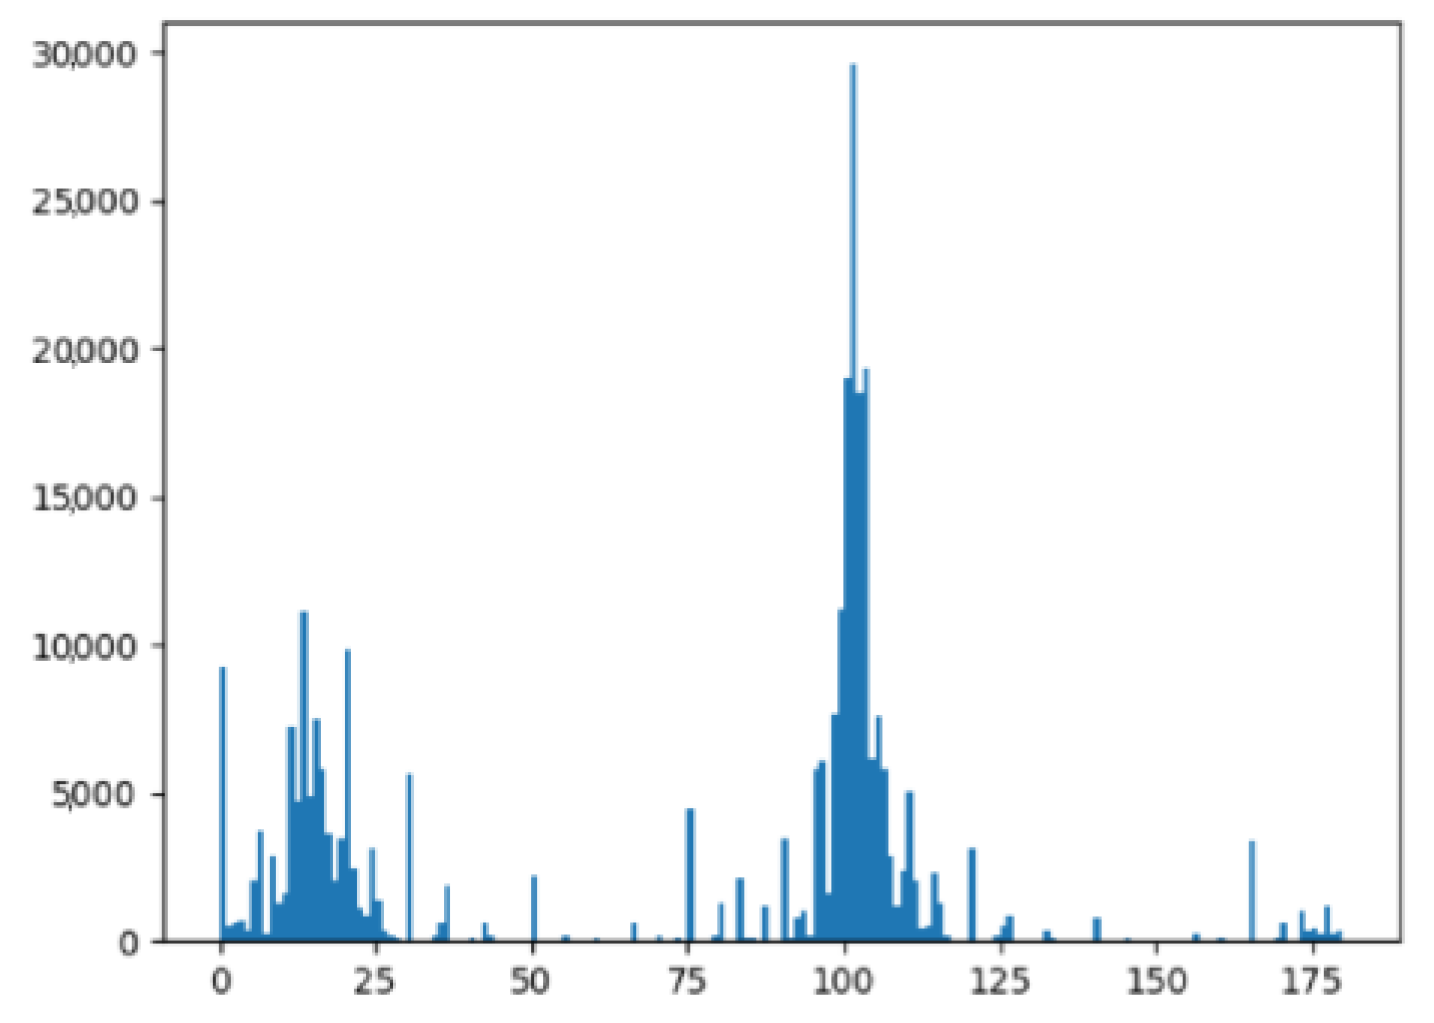
2.3. Tower Contour Extraction
2.4. Construction and algorithm
3. Establishment of Tower Tilt Calculation Model
3.1. Model Building
3.1.1. Camera Imaging Model
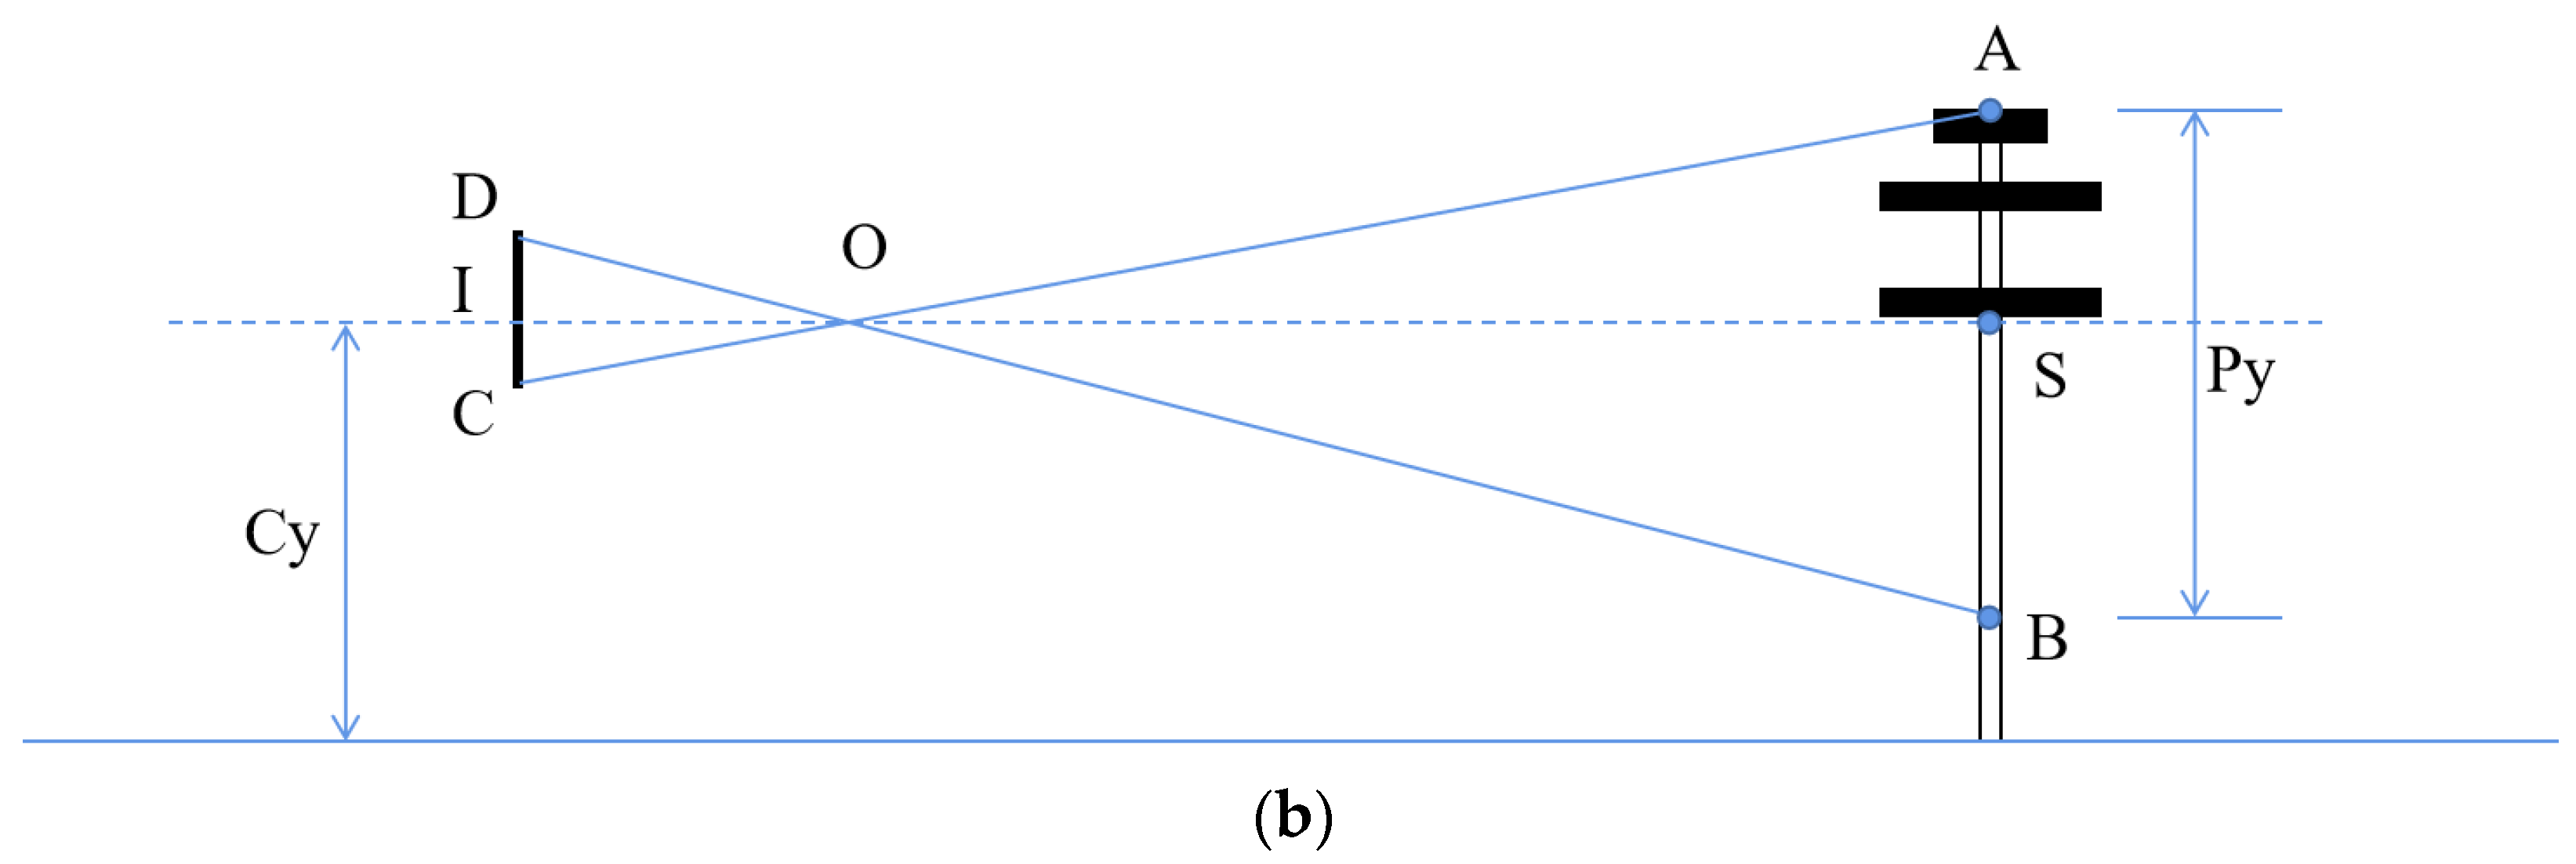
3.1.2. Pole-Tower Imaging Model
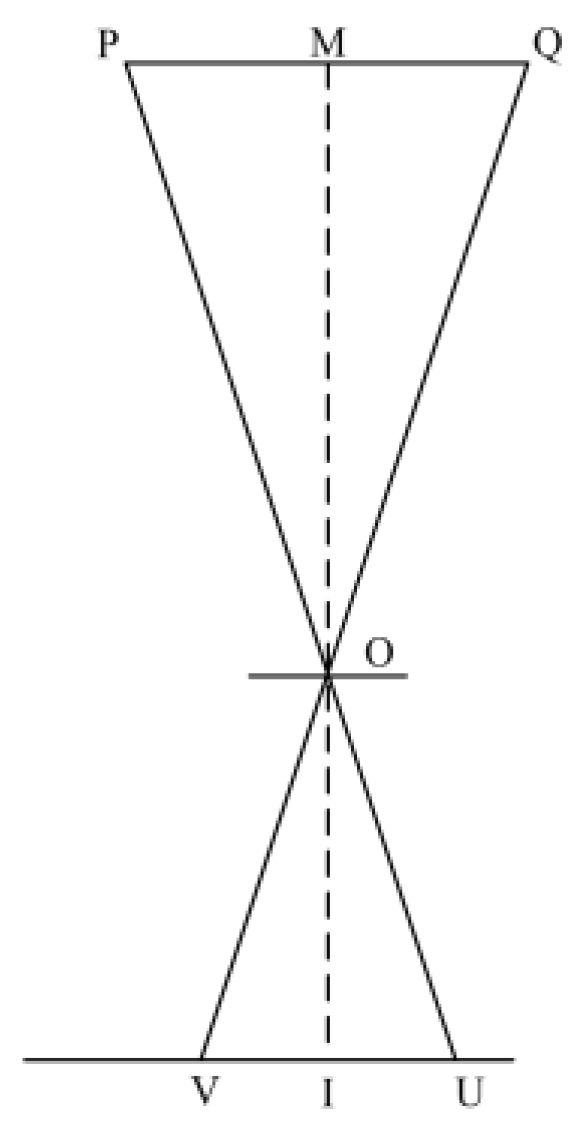
3.1.3. Tower Overlooking Imaging Model
3.2. Establishment and Analysis Model of the Distance from the Center of the Tower
- (1)
- According to the standard “Operation Regulations of Overhead territorial Lines (DS/CLC/TR 50412-1)”, set the tilt range of the pole and tower, and divide the dangerous image area;
- (2)
- Convert the pole and tower images to grayscale and binary image transformation;
- (3)
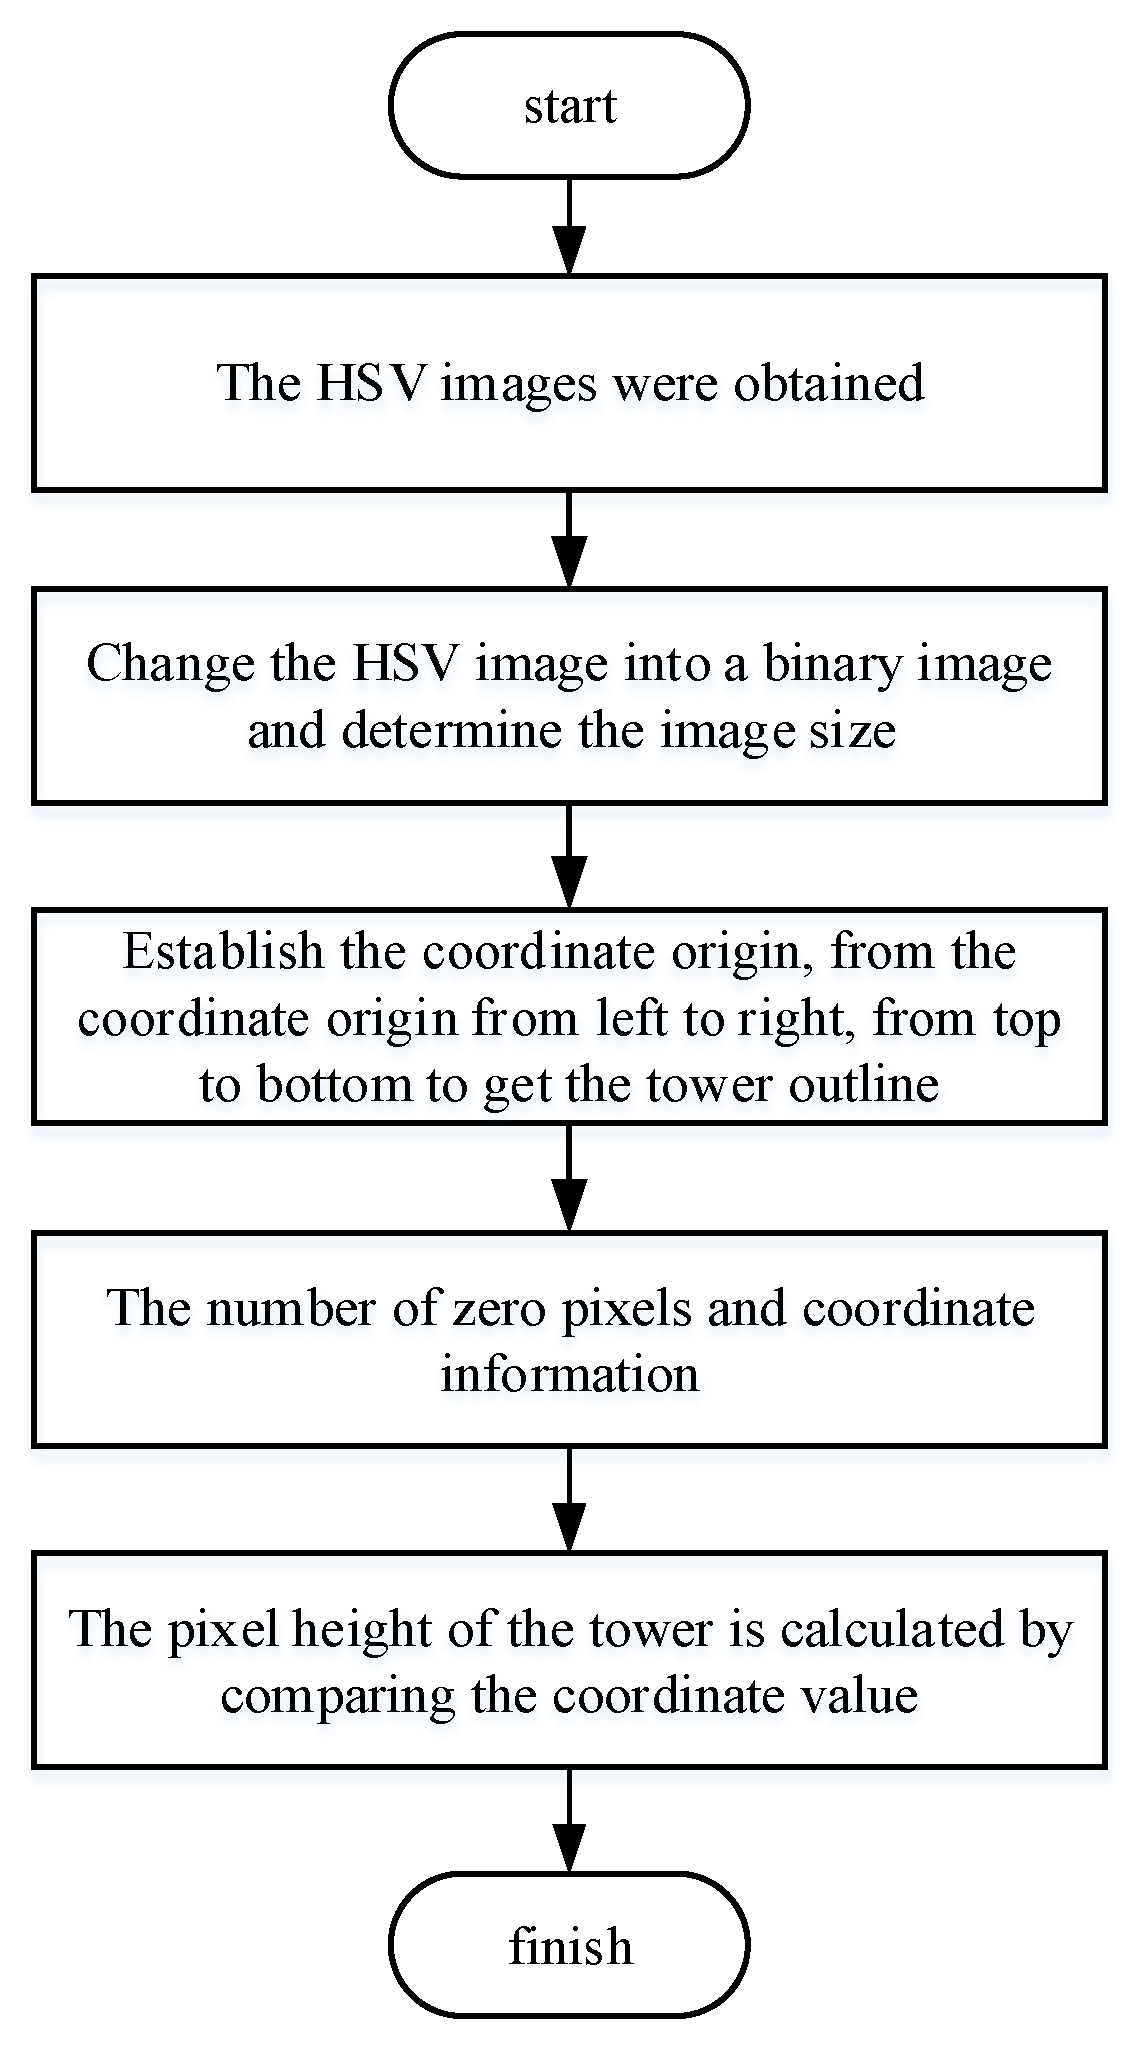
- Define the upper left corner of the binary image as the coordinate origin (0, 0), go through the fixed interval from left to right and from top to bottom, determine the pixel coordinates of the tower, and judge the top and bottom positions of the tower according to the y-axis pixel coordinates:
- (4)
- Perverse the outline of the tower, take any point on it as the high point and the bottom of the tower as the lowest point, and calculate the tower outline’s pixel height at any point from the bottom;
- (5)
- Calculate the actual height of the outline of the tower, the distance between the camera and the tower, and the distance from the known horizontal parts;
- (6)
- Compare the desired distance with the set distance threshold, determine the danger point, and mark it.
4. Experimental Results
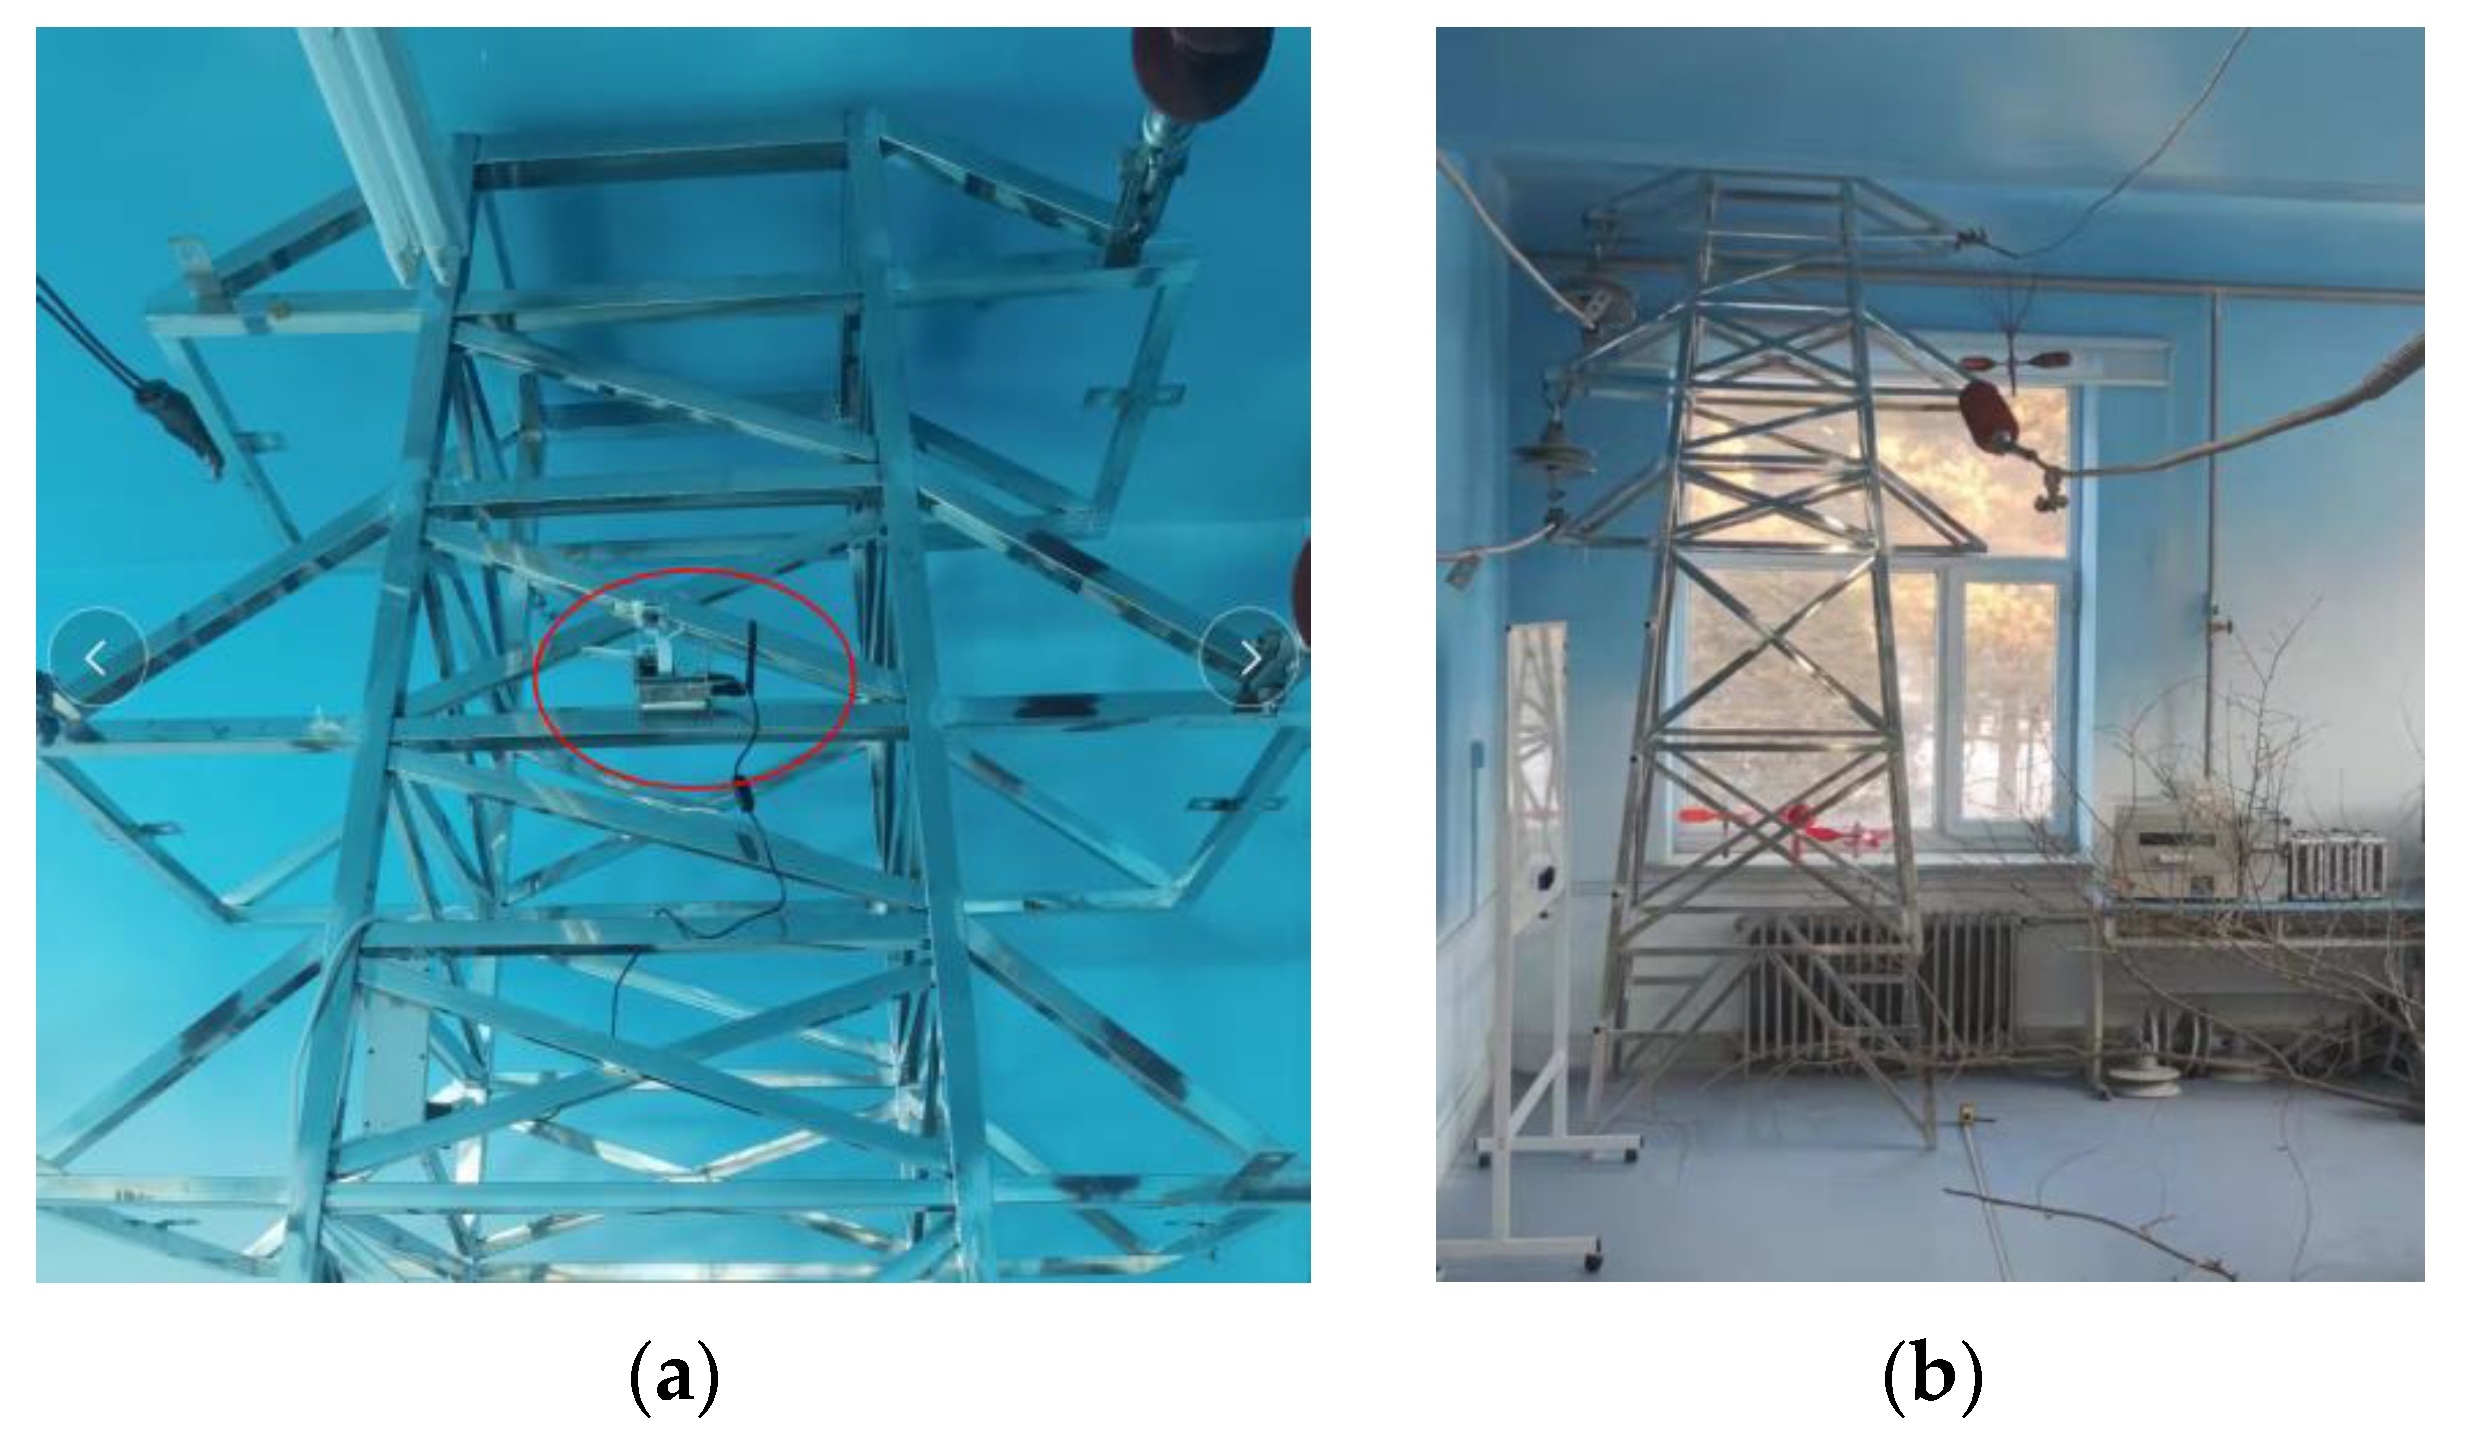
4.1. Subjects and Apparatus
- (1)
- Obtain the first picture and use it as the reference image to find the vertical distance between the camera and the tower (P1) and the horizontal distance between the camera and the tower components (P2) using a laser rangefinder.
- (2)
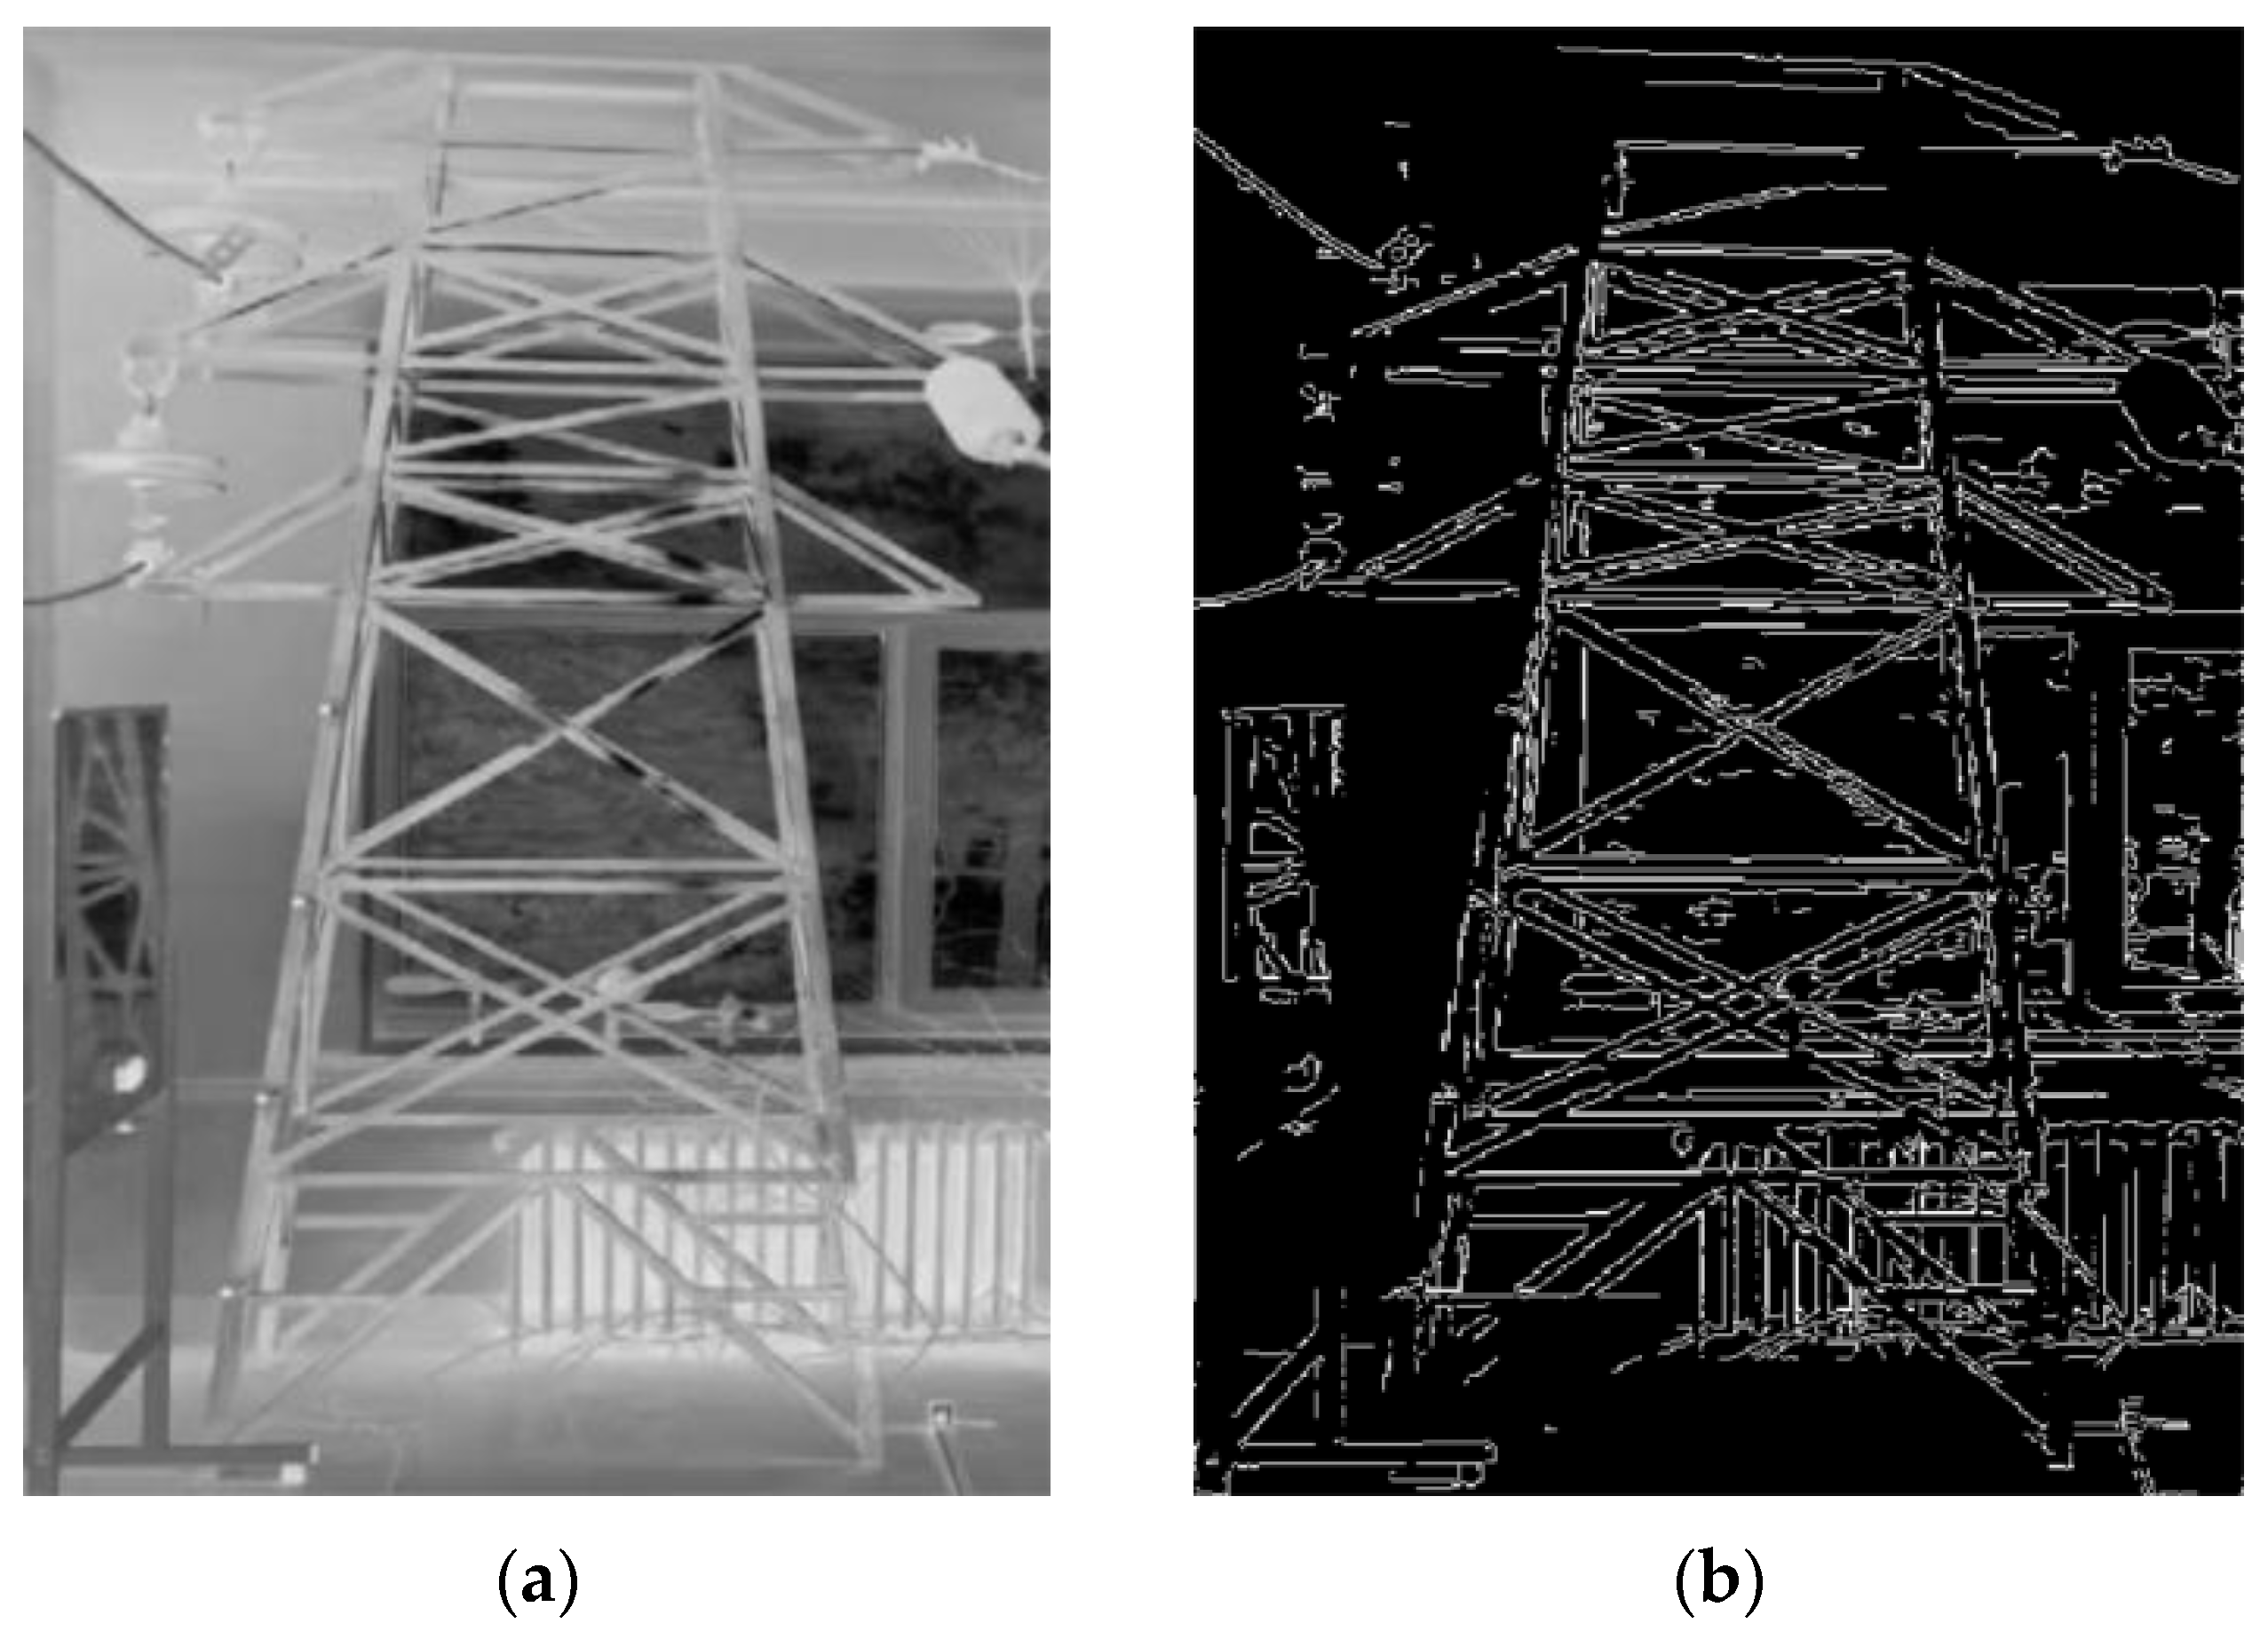
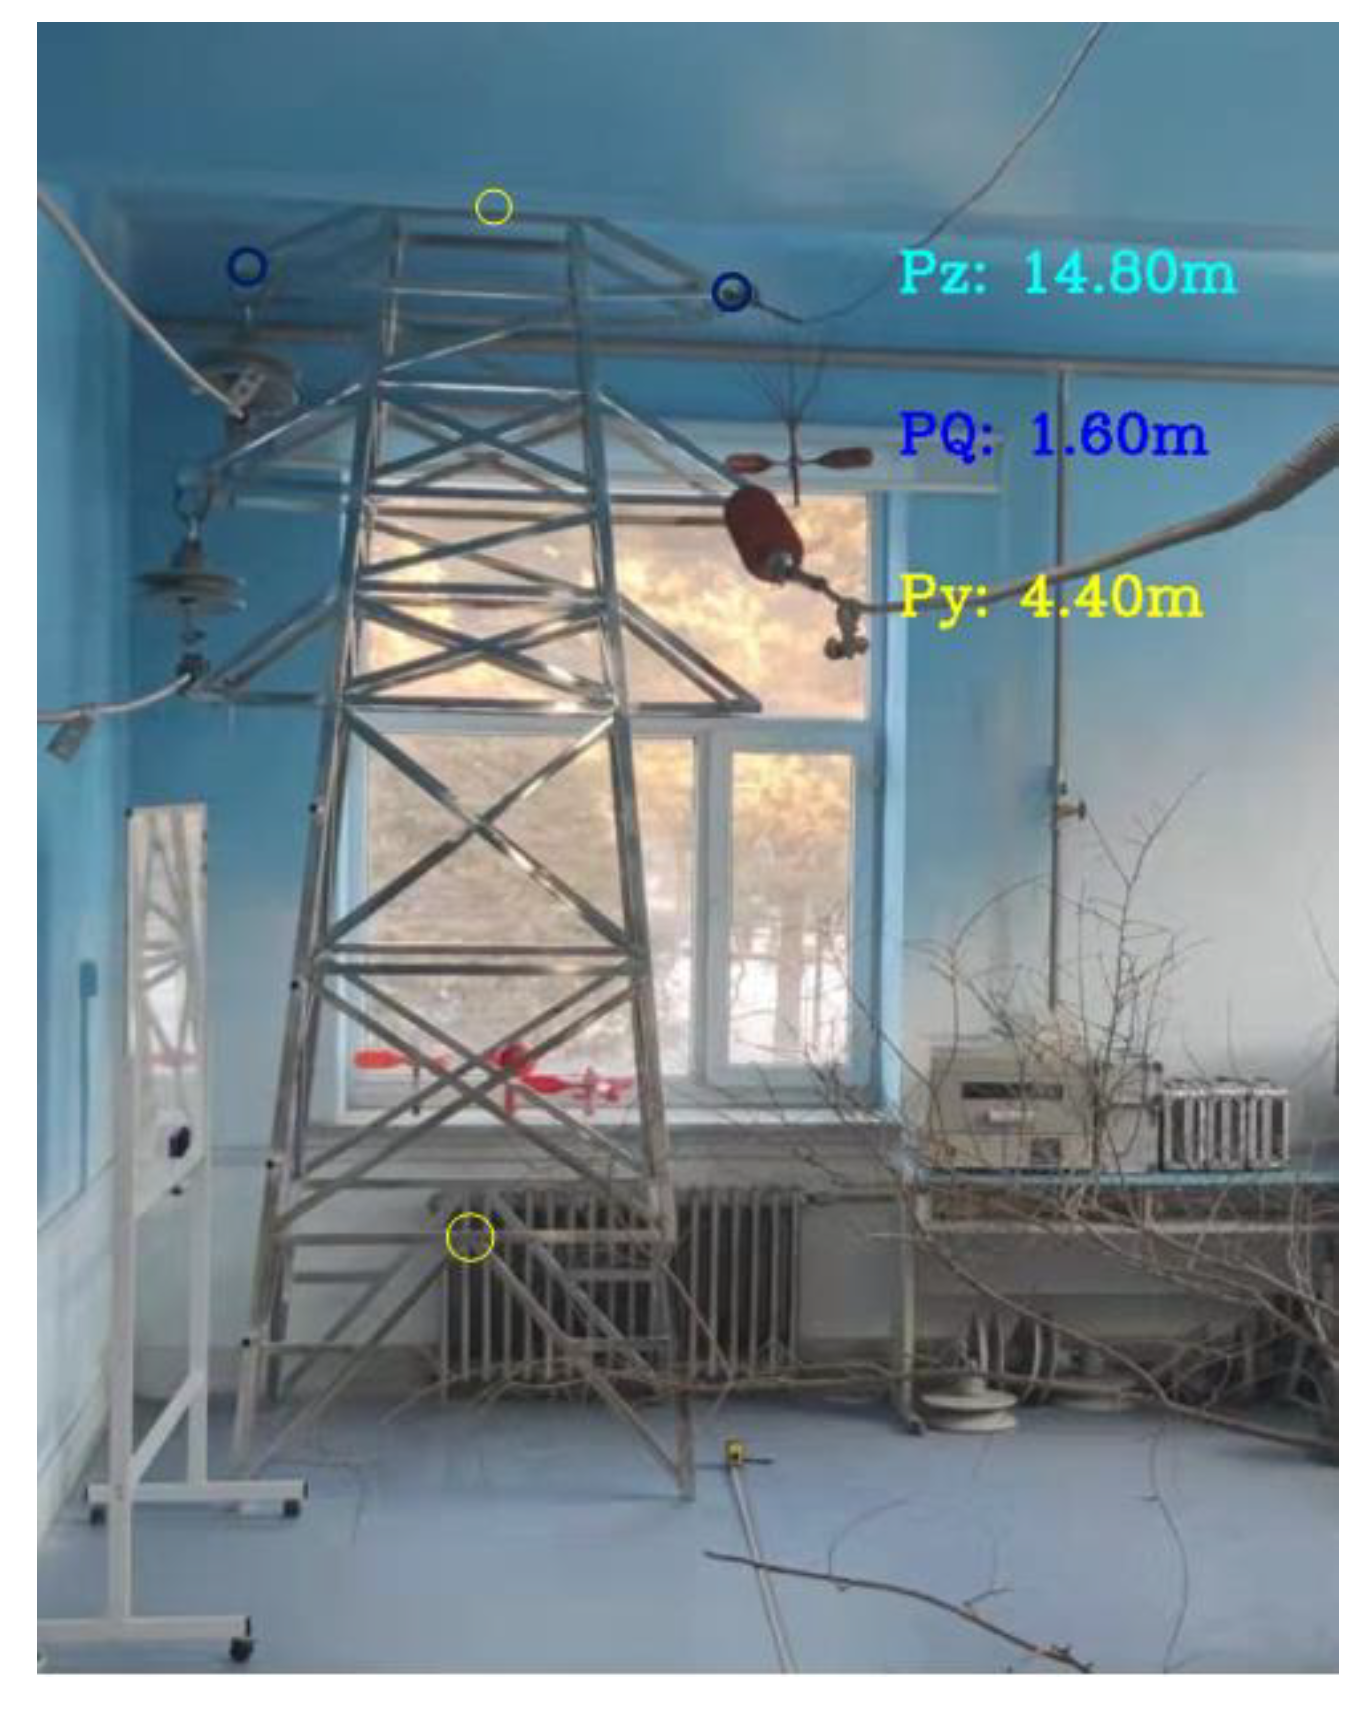
- Process the captured image, calibrate the pixels, and find the pixel distance. The processed pictures are shown in Figure 11. After traversing, the coordinates obtained for the top of the tower and the base point are (277, 309) and (240, 590), respectively. Thus, the pixel height of the tower can be found according to the formula.
- (3)
- Obtain the camera installation and tower heights and find the vertical distance between the camera and the pole and tower (PZ) using the distance combined with the pole and tower imaging model obtained in Step 2.
- (4)
- Find the distance between the camera and the horizontal component (PQ) using OI;
- (5)
- Compare the desired distance PZ and PQ with P1 and P2 and find the error rate.
4.2. Results
4.3. Field Test
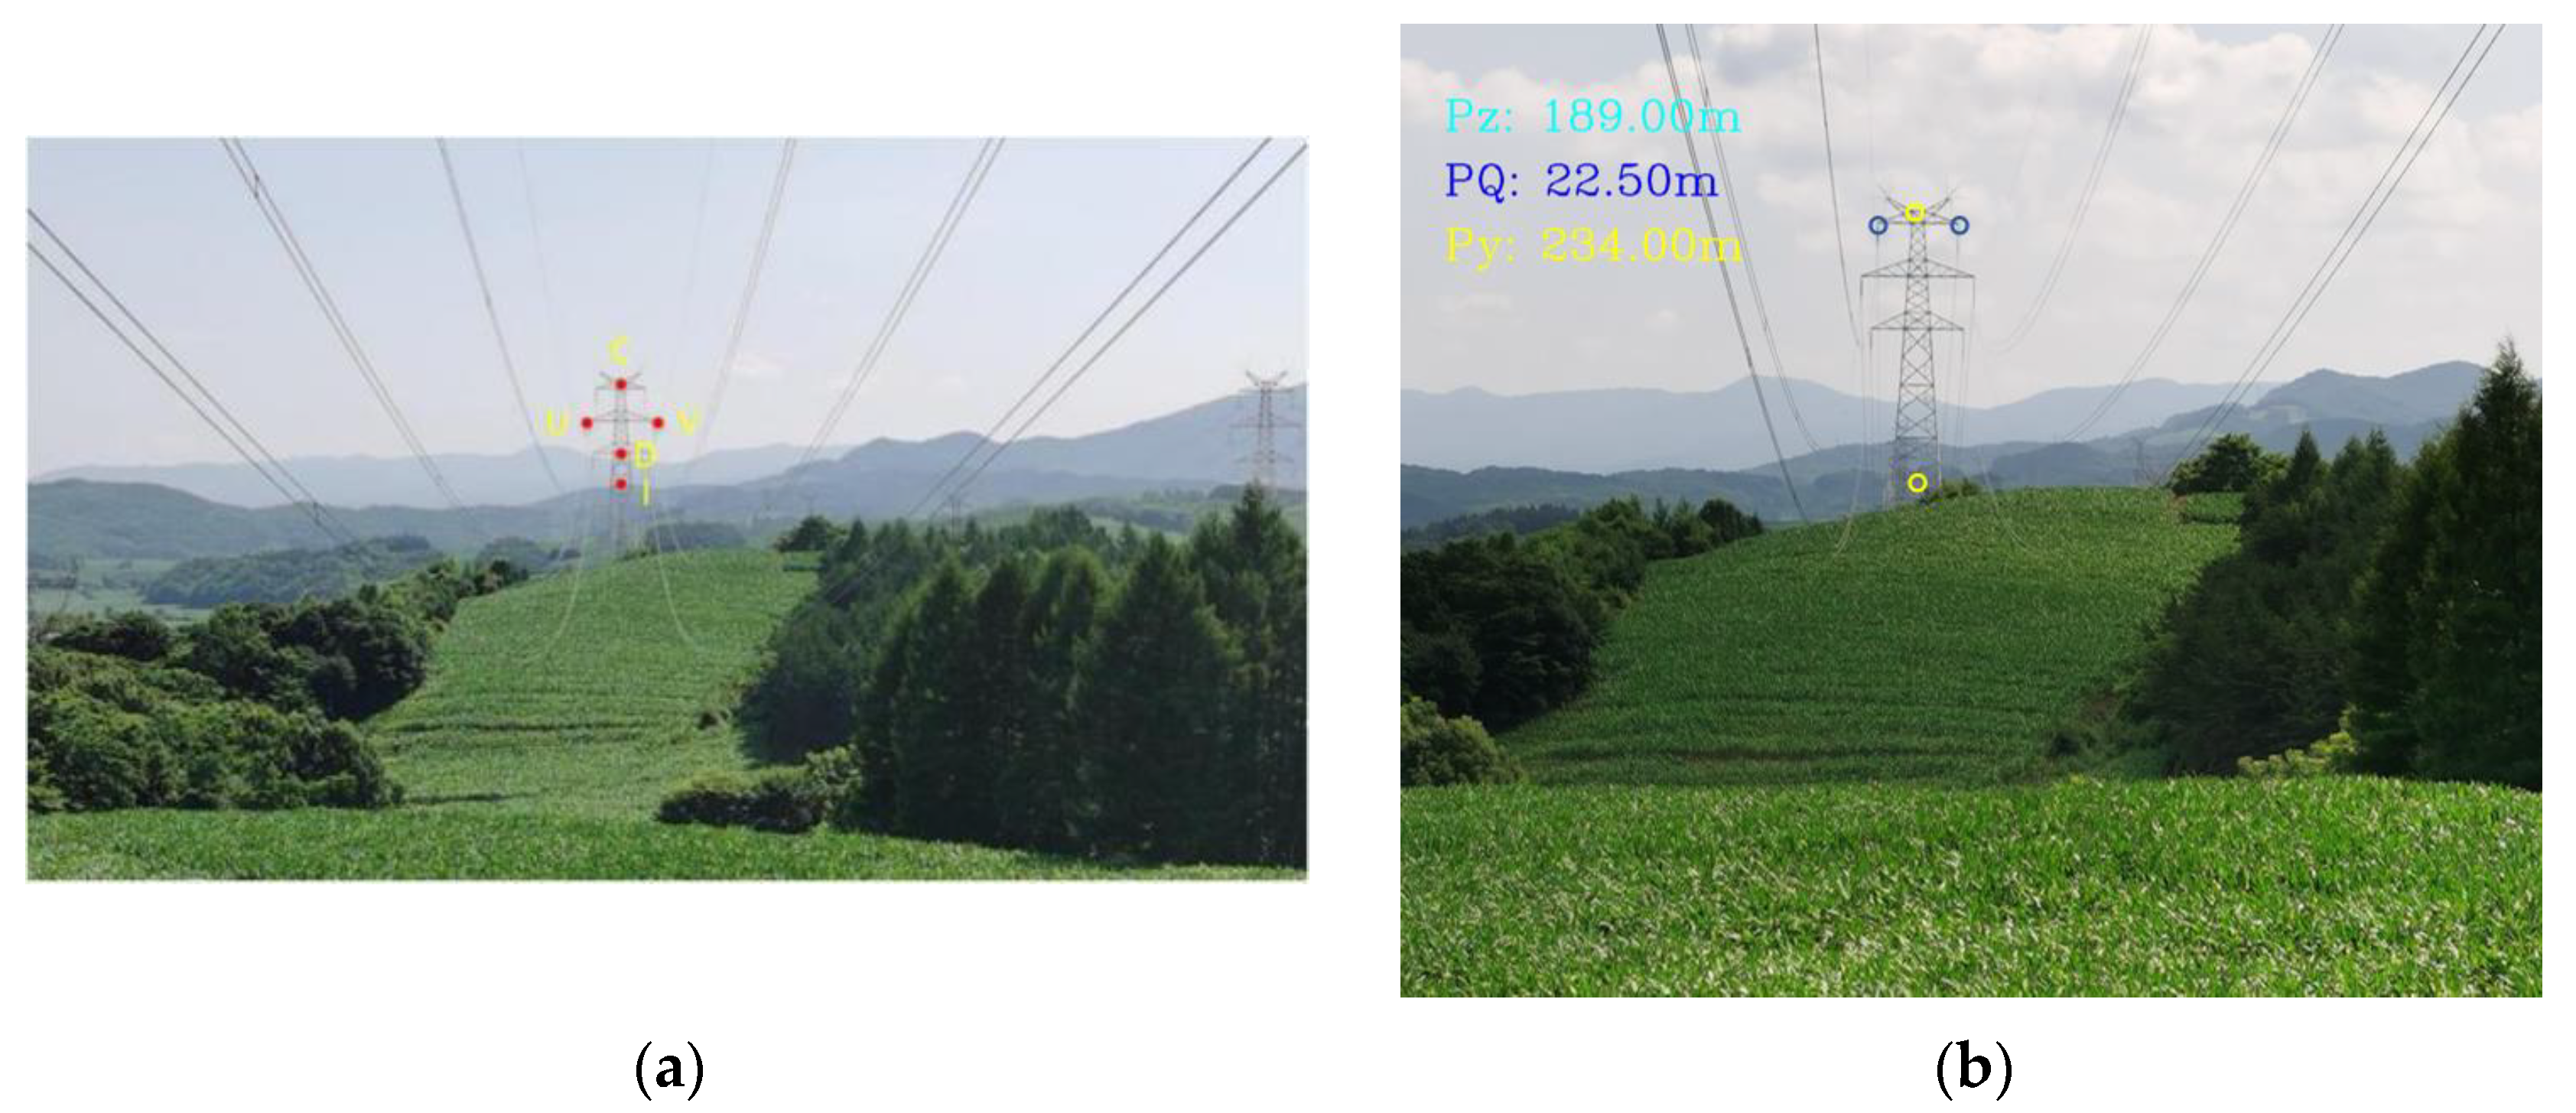
- (1)
- Collect the parameters such as gear pitch, tower height, and tower width;
- (2)
- Measure the field data through the rangefinder;
- (3)
- Calculate the distance between the tower and the camera and the distance between its own horizontal components according to the tower tilt model and algorithm, combined with the parameters of the tower;
- (4)
- Compare the calculated data with the measured data, and correct the distance based on the comparison results.
5. Conclusions
Author Contributions
Funding
Institutional Review Board Statement
Informed Consent Statement
Data Availability Statement
Conflicts of Interest
References
- Alhassan, A.B.; Zhang, X.; Shen, H.; Xu, H. Power transmission line inspection robots: A review, trends and challenges for future research. Int. J. Electr. Power Energy Syst. 2020, 118, 105862. [Google Scholar] [CrossRef]
- Safdarinezhad, A.; Abdollahifard, M.J.; Ganjali, A. A photogrammetric solution for measurement of power lines sag via integration of image and accelerometer data of a smartphone. Measurement 2022, 199, 111493. [Google Scholar] [CrossRef]
- Zhu, Y.; Zhou, R.; Zhang, Y.; Dong, X.; Huang, X. Review on flashover risk prediction method of iced insulator based on icing monitoring technology. Cold Reg. Sci. Technol. 2021, 185, 103252. [Google Scholar] [CrossRef]
- Mridha, S.; Maity, D. Experimental investigation on nonlinear dynamic response of concrete gravity dam-reservoir system. Eng. Struct. 2014, 80, 289–297. [Google Scholar] [CrossRef]
- Popoli, A.; Sandrolini, L.; Cristofolini, A. Inductive coupling on metallic pipelines: Effects of a nonuniform soil resistivity along a pipeline-power line corridor. Electr. Power Syst. Res. 2020, 189, 106621. [Google Scholar] [CrossRef]
- Ye, H. Research on the Reliability Evaluation of Transmission Line on-Line Monitoring Device Based on the Comprehensive Evaluation Method. Sci. Discov. 2018, 6, 199. [Google Scholar] [CrossRef]
- Chen, B.; Miao, X. Distribution line pole detection and counting based on YOLO using UAV inspection line video. J. Electr. Eng. Technol. 2020, 15, 441–448. [Google Scholar] [CrossRef]
- Yang, G. Deformation similarity characteristics-considered hybrid panel model for multi-point deformation monitoring of super-high arch dams in operating conditions. Measurement 2022, 192, 110908. [Google Scholar] [CrossRef]
- Yang, C.H.; Zhang, Y.S. Research on the Architecture of Iot Middleware Platform Based on BeiDou Navigation Satellite System. Procedia Comput. Sci. 2020, 166, 46–50. [Google Scholar] [CrossRef]
- Hu, Y.; Liu, K. Devices and technology for monitoring transmission lines. In Inspection and Monitoring Technologies of Transmission Lines with Remote Sensing; CHINA ELECTRIC POWER PRESS: Beijing, China, 2017; pp. 281–508. [Google Scholar] [CrossRef]
- Liu, Z.; Wu, G.; He, W.; Fan, F.; Ye, X. Key target and defect detection of high-voltage power transmission lines with deep learning. Int. J. Electr. Power Energy Syst. 2022, 142, 108277. [Google Scholar] [CrossRef]
- Yu, P.; Dong, B.G.; Xue, Y.J. Electric power tower inclination angle detection method based on SIFT feature matching. Appl. Mech. Mater. 2012, 236, 759–764. [Google Scholar] [CrossRef]
- Liang, C.; Liu, Z.; Qian, J. Airborne LIDAR point cloud tower inclination judgment. IOP Conf. Ser. Earth Environ. Sci. 2016, 46, 012013. [Google Scholar] [CrossRef] [Green Version]
- Gaoming, Z.; Zhengang, L.Y. Research on the Monitoring of Transmission Line Based on Fiber Sensing. J. Electron. Meas. Instrum. 2018, 32, 51–59. [Google Scholar]
- Wang, Y.; Han, J.; Zhao, Q. Power pole and tower tilt detection based on UAV image. Comput. Simul. 2017, 34, 426–433. [Google Scholar]
- Cao, H.; Yang, L.; Yin, P. Ultra-high power transmission tower deformation monitoring technology based on smart antenna. Power Autom. Equip. 2010, 30, 38–41. [Google Scholar]
- Luo, J.; Lu, J.; Li, B.; Zhao, C.; Zhang, H. Research on the unbalance tension and tilt monitoring device of the transmission line pole and tower. Hunan Electr. Power 2011, 31, 13. [Google Scholar]
- Han, C.; Zhang, H.; Chen, Q.; Li, T.; Kong, L.; Zhao, H.; He, L. A directional piezoelectric sensor based on anisotropic PVDF/MXene hybrid foam enabled by unidirectional freezing. Chem. Eng. J. 2022, 450, 138280. [Google Scholar] [CrossRef]
- Zhou, Q.; Zhang, H.; Ma, B.; Huang, Y. Wind loads on transmission tower bodies under skew winds with both yaw and tilt angles. J. Wind. Eng. Ind. Aerodyn. 2019, 187, 48–60. [Google Scholar] [CrossRef]
- Yongfan, X.; Guoqing, Z.; Qingyang, W.; Ruhao, S.; Mengyuan, L. Fisheye Camera Calibration with Indoor 3D Calibration Field. In Proceedings of the 2021 IEEE International Geoscience and Remote Sensing Symposium IGARSS, Brussels, Belgium, 11–16 July 2021; pp. 5461–5464. [Google Scholar]


| Order Number | The Camera Is Far away from the Pole and Tower Pz (m) | Range Error (%) | Axial Eccentric Distance (cm) | Range Error (%) |
|---|---|---|---|---|
| 1 | 14.8 | 1.33 | 1.6 | 2 |
| 2 | 14.6 | 2.67 | 1.7 | 1.5 |
| 3 | 14.8 | 1.33 | 1.8 | 1 |
| 4 | 14.5 | 3.33 | 1.7 | 1.5 |
| 5 | 14.6 | 2.67 | 1.5 | 2.5 |
| 6 | 14.7 | 2 | 1.6 | 2 |
| 7 | 14.6 | 2.67 | 1.8 | 1 |
| 8 | 14.5 | 3.34 | 1.7 | 1.5 |
| 9 | 14.6 | 2.67 | 1.7 | 1.5 |
| 10 | 14.7 | 2 | 1.8 | 1 |
| 11 | 14.8 | 1.33 | 1.5 | 2.5 |
| Measuring Position | Measured Value (m) | Actual Value (m) | Error (%) |
|---|---|---|---|
| The camera is far away from the pole and tower (Pz) | 189 | 190 | 0.5% |
| Distance of the horizontal parts of the tower (PQ) | 22.5 | 23.0 | 2.2% |
| Pole tower height (Py) | 234.0 | 235.0 | 0.4% |
| Actual Tilt Angle/° | Angular Mean Calculated from Acceleration/° | A = 0.25 | Relative Accuracy/% | A = 0.5 | Relative Accuracy/% | A = 0.75 | Relative Accuracy/% |
|---|---|---|---|---|---|---|---|
| 0 | 0.13 | 0.19 | 0.20 | 0.33 | |||
| 5 | 4.88 | 4.93 | 0.75% | 4.85 | 2.2% | 5.02 | 2.35% |
| 10 | 10.13 | 9.32 | 1.06% | 9.95 | 0.26% | 10.14 | 2.11% |
| 15 | 14.61 | 15.25 | 0.32% | 14.52 | 0.76% | 15.26 | 1.12% |
| 20 | 20.32 | 20.21 | 0.11% | 20.08 | 0.12% | 20.23 | 0.12% |
| 25 | 25.02 | 24.96 | 0.06% | 24.93 | 0.08% | 25.07 | 0.04% |
| 30 | 29.96 | 30.11 | 0.14% | 30.04 | 0.05% | 30.02 | 0.01% |
| 35 | 35.12 | 35.07 | 0.09% | 35.03 | 0.01% | 35.05 | 0.02% |
| 40 | 40.24 | 40.13 | 0.08% | 40.26 | 0.18% | 40.03 | 0.01% |
| 45 | 45.35 | 45.19 | 0.13% | 45.21 | 0.13% | 45.14 | 0.12% |
| 50 | 50.25 | 50.15 | 0.13% | 50.12 | 0.19% | 50.17 | 0.11% |
| 55 | 55.06 | 55.03 | 0.01% | 55.15 | 0.23% | 55.12 | 0.09% |
| 60 | 59.91 | 60.02 | 0.01% | 60.14 | 0.20% | 60.06 | 0.02% |
| Position | Measurements in the x-Axis Direction | Measurements in the y-Axis Direction | Measurements in the z-Axis Direction | Synthesis Error | Error Correction Results | |||
|---|---|---|---|---|---|---|---|---|
| x-Axis Direction Error | y-Axis Direction Error | z-Axis Direction Error | Synthesis Error after Correction | |||||
| 0 | 26.50 | 42.45 | 0.00 | 0.344 | 0.025 | −0.016 | 0.035 | 0.043 |
| 20 | 49.42 | 55.65 | 0.04 | −0.404 | −0.065 | −0.039 | −0.075 | −0.179 |
| 40 | 42.04 | −56.91 | 0.03 | −0.213 | −0.092 | 0.001 | −0.009 | −0.100 |
| 60 | −39.47 | 55.12 | −0.03 | −0.347 | 0.024 | 0.061 | 0.064 | 0.149 |
| 80 | 10.17 | 41.46 | −0.04 | −0.232 | −0.009 | 0.051 | −0.034 | 0.008 |
| 100 | 47.17 | −25.63 | 0.03 | −0.343 | 0.072 | −0.063 | 0.016 | 0.026 |
| 120 | 23.31 | −46.86 | −0.06 | −0.308 | −0.060 | −0.036 | −0.024 | −0.120 |
| 140 | −48.87 | 23.59 | −0.03 | 0.022 | 0.018 | 0.072 | 0.026 | 0.116 |
| 160 | −9.06 | 49.00 | −0.07 | −0.371 | 0.031 | 0.049 | 0.093 | 0.173 |
| 180 | −34.47 | 3.39 | −0.09 | −0.331 | 0.045 | 0.042 | 0.080 | 0.167 |
| 200 | 38.60 | −15.25 | −0.09 | 0.247 | −0.098 | −0.051 | 0.056 | −0.093 |
| 220 | 41.16 | −54.55 | 0.03 | −0.236 | 0.085 | 0.012 | −0.010 | 0.087 |
| 240 | 22.61 | 2.53 | −0.08 | −0.146 | 0.064 | −0.065 | 0.080 | 0.079 |
| 260 | 45.58 | −41.30 | 0.05 | 0.113 | −0.084 | −0.049 | −0.026 | −0.159 |
| 280 | −58.62 | 40.45 | 0.02 | −0.313 | −0.092 | 0.049 | −0.013 | −0.056 |
| 300 | −32.48 | −45.63 | 0.05 | 0.400 | 0.028 | 0.014 | −0.002 | 0.041 |
| 320 | −1.69 | −22.75 | 0.10 | 0.268 | −0.068 | 0.069 | −0.026 | −0.024 |
| 340 | −24.19 | 43.16 | −0.03 | 0.177 | −0.080 | −0.066 | −0.053 | −0.199 |
| Average value | 5.43 | 2.66 | −0.01 | −0.093 | −0.01 | 0.00 | 0.01 | −0.002 |
Disclaimer/Publisher’s Note: The statements, opinions and data contained in all publications are solely those of the individual author(s) and contributor(s) and not of MDPI and/or the editor(s). MDPI and/or the editor(s) disclaim responsibility for any injury to people or property resulting from any ideas, methods, instructions or products referred to in the content. |
© 2022 by the authors. Licensee MDPI, Basel, Switzerland. This article is an open access article distributed under the terms and conditions of the Creative Commons Attribution (CC BY) license (https://creativecommons.org/licenses/by/4.0/).
Share and Cite
Yang, Y.; Wang, M.; Wang, X.; Li, C.; Shang, Z.; Zhao, L. A Novel Monocular Vision Technique for the Detection of Electric Transmission Tower Tilting Trend. Appl. Sci. 2023, 13, 407. https://doi.org/10.3390/app13010407
Yang Y, Wang M, Wang X, Li C, Shang Z, Zhao L. A Novel Monocular Vision Technique for the Detection of Electric Transmission Tower Tilting Trend. Applied Sciences. 2023; 13(1):407. https://doi.org/10.3390/app13010407
Chicago/Turabian StyleYang, Yongsheng, Minzhen Wang, Xinheng Wang, Cheng Li, Ziwen Shang, and Liying Zhao. 2023. "A Novel Monocular Vision Technique for the Detection of Electric Transmission Tower Tilting Trend" Applied Sciences 13, no. 1: 407. https://doi.org/10.3390/app13010407