Article

A New Maximum Power Point Tracking Framework for Photovoltaic Energy Systems Based on Remora Optimization Algorithm in Partial Shading Conditions

1
Department of Electrical Engineering, College of Engineering, Northern Border University, Arar 73222, Saudi Arabia
2
Department of Electrical Engineering, College of Engineering, Jouf University, Sakaka 72341, Saudi Arabia
3
Institute of Research Sciences, Power and Energy Group, Johor Bahru 81310, Malaysia
4
Department of Manufacturing and Civil Engineering, Norwegian University of Science and Technology (NTNU), 2815 Gjøvik, Norway
*
Author to whom correspondence should be addressed.
Appl. Sci. 2022, 12(8), 3828; https://doi.org/10.3390/app12083828
Submission received: 13 March 2022 / Revised: 4 April 2022 / Accepted: 7 April 2022 / Published: 10 April 2022
(This article belongs to the Special Issue Power Electronic Applications in Power and Energy Systems)

Abstract

:
In this paper, a new maximum power point tracking (MPPT) framework for photovoltaic (PV) systems is presented based on the remora optimization algorithm (ROA) subjected to standard and partial shading conditions. The studied system includes a PV array, a DC/DC converter, and a load and MPPT control system. The control variable is the voltage, and the optimization variable is the converter duty cycle, which is optimally determined using the ROA that is inspired based on the parasitic behavior of remora for achieving the maximum power of the PV system. In this study, the ability of the ROA is compared with manta ray foraging optimization (MRFO) and particle swarm optimization (PSO) methods for the MPPT solving of different shading patterns in view of extracted power, efficiency, and tracking rate. The results show that the ROA is a competitive method with higher efficiency in maximum power tracking and convergence accuracy than the MRFO and PSO for the MPPT solving of different patterns with higher exploration power. Moreover, an examination of the two partial shading patterns also showed that the power extracted using the ROA is higher than the MRFO and PSO while also reaching the global power value more quickly. The ROA achieved a tracking efficiency of 99.97% in a partial shading condition, with faster tracking in comparison with the MRFO and PSO methods. Therefore, the ROA is a high-speed tracking optimization method for enhancing the PV system’s efficiency in standard and especially in shading conditions.

1. Introduction

In recent years, the use of renewable energy due to an increasing energy demand has been one of the areas of concern around the world along with environmental issues [1,2]. Among all the renewable energy resources, photovoltaic (PV) systems have attracted the most attention due to their ease of access, non-pollution, and endless nature. Moreover, due to the rather low efficiency of the PV systems, it is better to use them at the maximum power point (MPP) in order to have maximum power [3]. Tracing the MPP of PV systems is a difficult task because of its non-linear V-I characteristic [3]. The power generated by PV systems changes with variations in atmospheric conditions such as irradiance and the temperature of PVs. The generation capacity of the PV systems also changes with changes in weather conditions. Therefore, to obtain the MPP, the PV system must be utilized at a voltage in accordance with the MPP [4,5,6].
The V-I characteristic of the PV cell changes with the variation of irradiance and operating temperature, and this has a great effect on the optimal MPP. Additionally, under specific irradiance, there is a single operational point for the PV plate where the output power is maximized [7,8,9,10]. Therefore, to achieve the MPP of the PV system, controlling the maximum power point tracking (MPPT) is important to improve the efficiency of PV systems [8]. Moreover, partial shading conditions (PSCs) lead to multiple peaks in the characteristics of the PV configuration [8,9]. Hence, it is vital to evaluate the acquisition of the MPP under the PSCs. Among these peaks, the point with the highest value is called the global MPP (GMPP). The others are called local MPPs (LMPPs) [8,9]. Traditional MPPT methods, which assume only one peak, are unable to obtain convergence to the GMPP; these methods are often trapped with one peak because of their instability in distinguishing between local and global points [9]. This requires the application of robust optimization methods that are able to achieve the MPP under PSCs [7,8,9,10].
Today, intelligent optimization methods have replaced traditional methods due to their high tracking power and efficiency in achieving the GMPP; these methods have been widely welcomed. In [11], an MPPT algorithm for a PV system is studied to track the MPP under PSC while considering the maximum voltage corresponding to the GMPP. In [12], a two-stage method is proposed. At first, the MPP close to the GMPP is moved via the load line. Then, convergence of the exploitation point is performed for the GMPP. When the GMPP is on the left side of the load line, the method is ineffective. In [13], a variable step using the P&O method is suggested, and the step size is found through the Fibonacci sequence. In this method, the GMPP is not traceable under all conditions. In [14], the MPPT algorithm is presented as a two-step process, and a sweeping process is used to identify the GMPP in the first step and then implemented using the P&O technique to converge to the GMPP. This method needs more time to determine the GMPP because all MPPs have to be identified to find the GMPP. In [15], a control algorithm for finding the GMPP is presented under different PSC conditions. This method has better capability and efficiency in different test conditions, but it depends on the system.
The artificial neural network (ANN)-based MPPT algorithm [16] is applied in order to use ANN PSC data for finding the GMPP. In [17], an MPPT method is proposed, and each PV configuration connected to the converter is integrated into the MPP detector. The results show that the tracking efficiency is good but the cost of implementation is high. In [18], a fast GMPPT method is presented based on the PSO for a photovoltaic (PV) string under PSC using a boost DC/DC converter. In [19], the Bat Algorithm (BA) is used to track the MPP of the PV systems in different PSCs. The BA is a suitable algorithm for achieving the GMPP of a PV system. In [20], the MPPT of the PV system via the gray wolf optimizer (GWO) method, inspired by gray wolf hunting behavior, is used to achieve the GMPP. The results indicate the optimal performance of the MPPT method with the GWO in extracting the MPP. In [21], the MPPT problem is developed using the flower pollution algorithm (FPA) to increase the efficiency of the PV system MPPT in partial shading conditions. In [22], type2-fuzzy is presented to perform the MPPT in standard and PSCs. The obtained results demonstrate the desirable performance of the proposed method in the maximum extraction of the PV power. In [23], the MPPT algorithm is developed using atom search optimization (ASO) to improve the GMPP tracking efficiency of the PV system. In [24], the multi-verse optimizer (MVO) and in [25], the manta ray foraging optimization (MRFO) are performed with MPPT solving for the PV system in order to achieve the GMPP in standard and shading conditions.
Different models of PV cells are proposed for solving the MPPT problem. The literature review showed that the single-diode model for PV cells is frequently used as a conventional model for MPPT problems. Therefore, the evaluation of the single-diode model as one of the desirable models for MPPT solving in PSCs is considered in this study.
In MPPT solving, the maximum power of PV systems should be obtained. Thus, based on the ratio of the power extracted from the photovoltaic system to the global power of the photovoltaic configuration, and based on the use of converters, we increase the efficiency of this type of system. However, some systems may not be easily traceable due to their complexity and control structure. Therefore, tracking such systems is associated with high tracking costs, and the intended goal of improving their efficiency may not be achieved. In studying the tracking of the maximum power point of photovoltaic systems based on some traditional methods such as the observation disturbance method, short circuit current method, open circuit voltage method, and climbing method, in most cases, these are able to achieve the optimal global solution although they are not tracking systems. Efforts have been made to combine these methods with optimization algorithms to enhance their performance. Therefore, using traditional methods, in addition to spending money and wasting it, cannot guarantee a significant improvement in the efficiency of photovoltaic systems. For this reason, this paper uses a new intelligent optimization method to solve the tracking problem.
Moreover, the investigation of a literature review demonstrated that the application of meta-heuristic algorithms with high capability in optimization is still required to enhance the PV systems’ GMPP tracking in PSCs. This is because one meta-heuristic algorithm may operate desirably in some optimization problems, but the same method in solving another problem may not achieve the optimal global solution and does not work well even in the face of system condition changes. It is also better to use algorithms with fewer control parameters. By increasing the number of control variables of optimization algorithms and their high sensitivity to these parameters, the global optimal solution is not achieved, and the local optimal is also trapped. In this research, a new optimization method named remora optimization algorithm (ROA) [26], with a low number of control parameters, is applied for MPPT solving. The reasons for using the ROA to solve the MPPT problem are the high power of the ROA in preventing trapping in the local optimal, high accuracy in achieving the global optimal, and also its simplicity. In addition, the low number of control parameters of this algorithm is another reason for using this method in MPPT solving (see Table 1).
In this study, a new meta-heuristic algorithm named the ROA is applied to track the PV system GMPP in different PSCs. The studied system includes the PV configuration, the DC/DC boost converter, and the load and MPPT control system. Its output power is calculated based on the sampled voltage multiplied by the calculated PV current at each time and in proportion to its difference with the global peak power, the DC/DC converter duty cycle is optimally determined by the ROA to extract power in these conditions and transfer the PV maximum power to the load. In this research, the superiority of the ROA is examined and compared with the manta ray foraging optimizer (MRFO) [25] and particle swarm optimization (PSO) in different standard and PSCs conditions. The simulation results include the current–voltage and power–voltage characteristics of the PV system drawn in each of the PSCs as well as the PV power and voltage variations based on the proposed method in the different PSCs.
In Section 2, PV cell and PSC is modeled. The proposed MPPT method based on the ROA is formulated in Section 3. The simulation results are explained and discussed in Section 4, and finally, conclusion is described in Section 5.

2. PV Cell and PSC Modeling

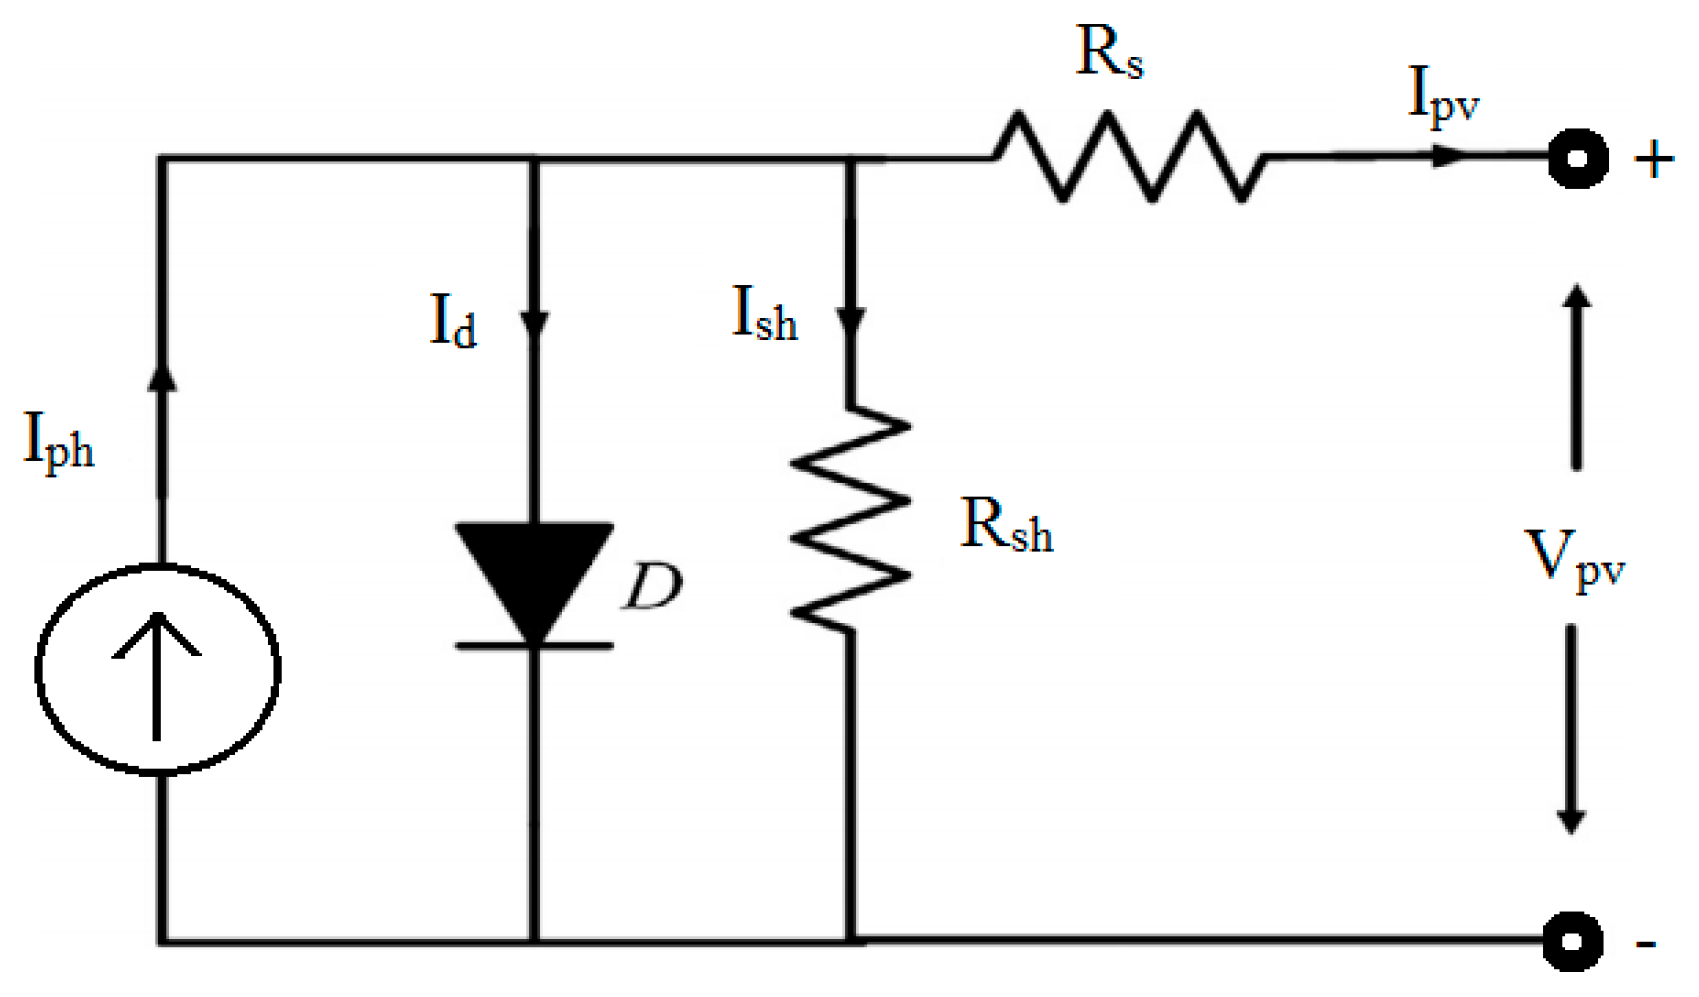
2.1. PV Cell Modeling

A PV cell, as illustrated in Figure 1, is made of a combination of PV cells. Various models have been proposed for a PV cell based on the single-diode model. A mathematical single-diode model of the PV cell is defined as follows:
The PV cell current based on the mentioned model is defined by [9,10] as follows:
I p v = I p h I o × ( exp ( q ( V p v + R s I p v ) a k T 1 ) ) ( V p v + R s I p v ) R s h
where Rs and Rsh represent the ohmic values of series and parallel resistors, Io indicates the saturation current of the diode, Iph represents the current source, Ipv and Vpv define the current and voltage of the PV cell, k represents the Boltzmann constant, and T refers to the temperature at °C.

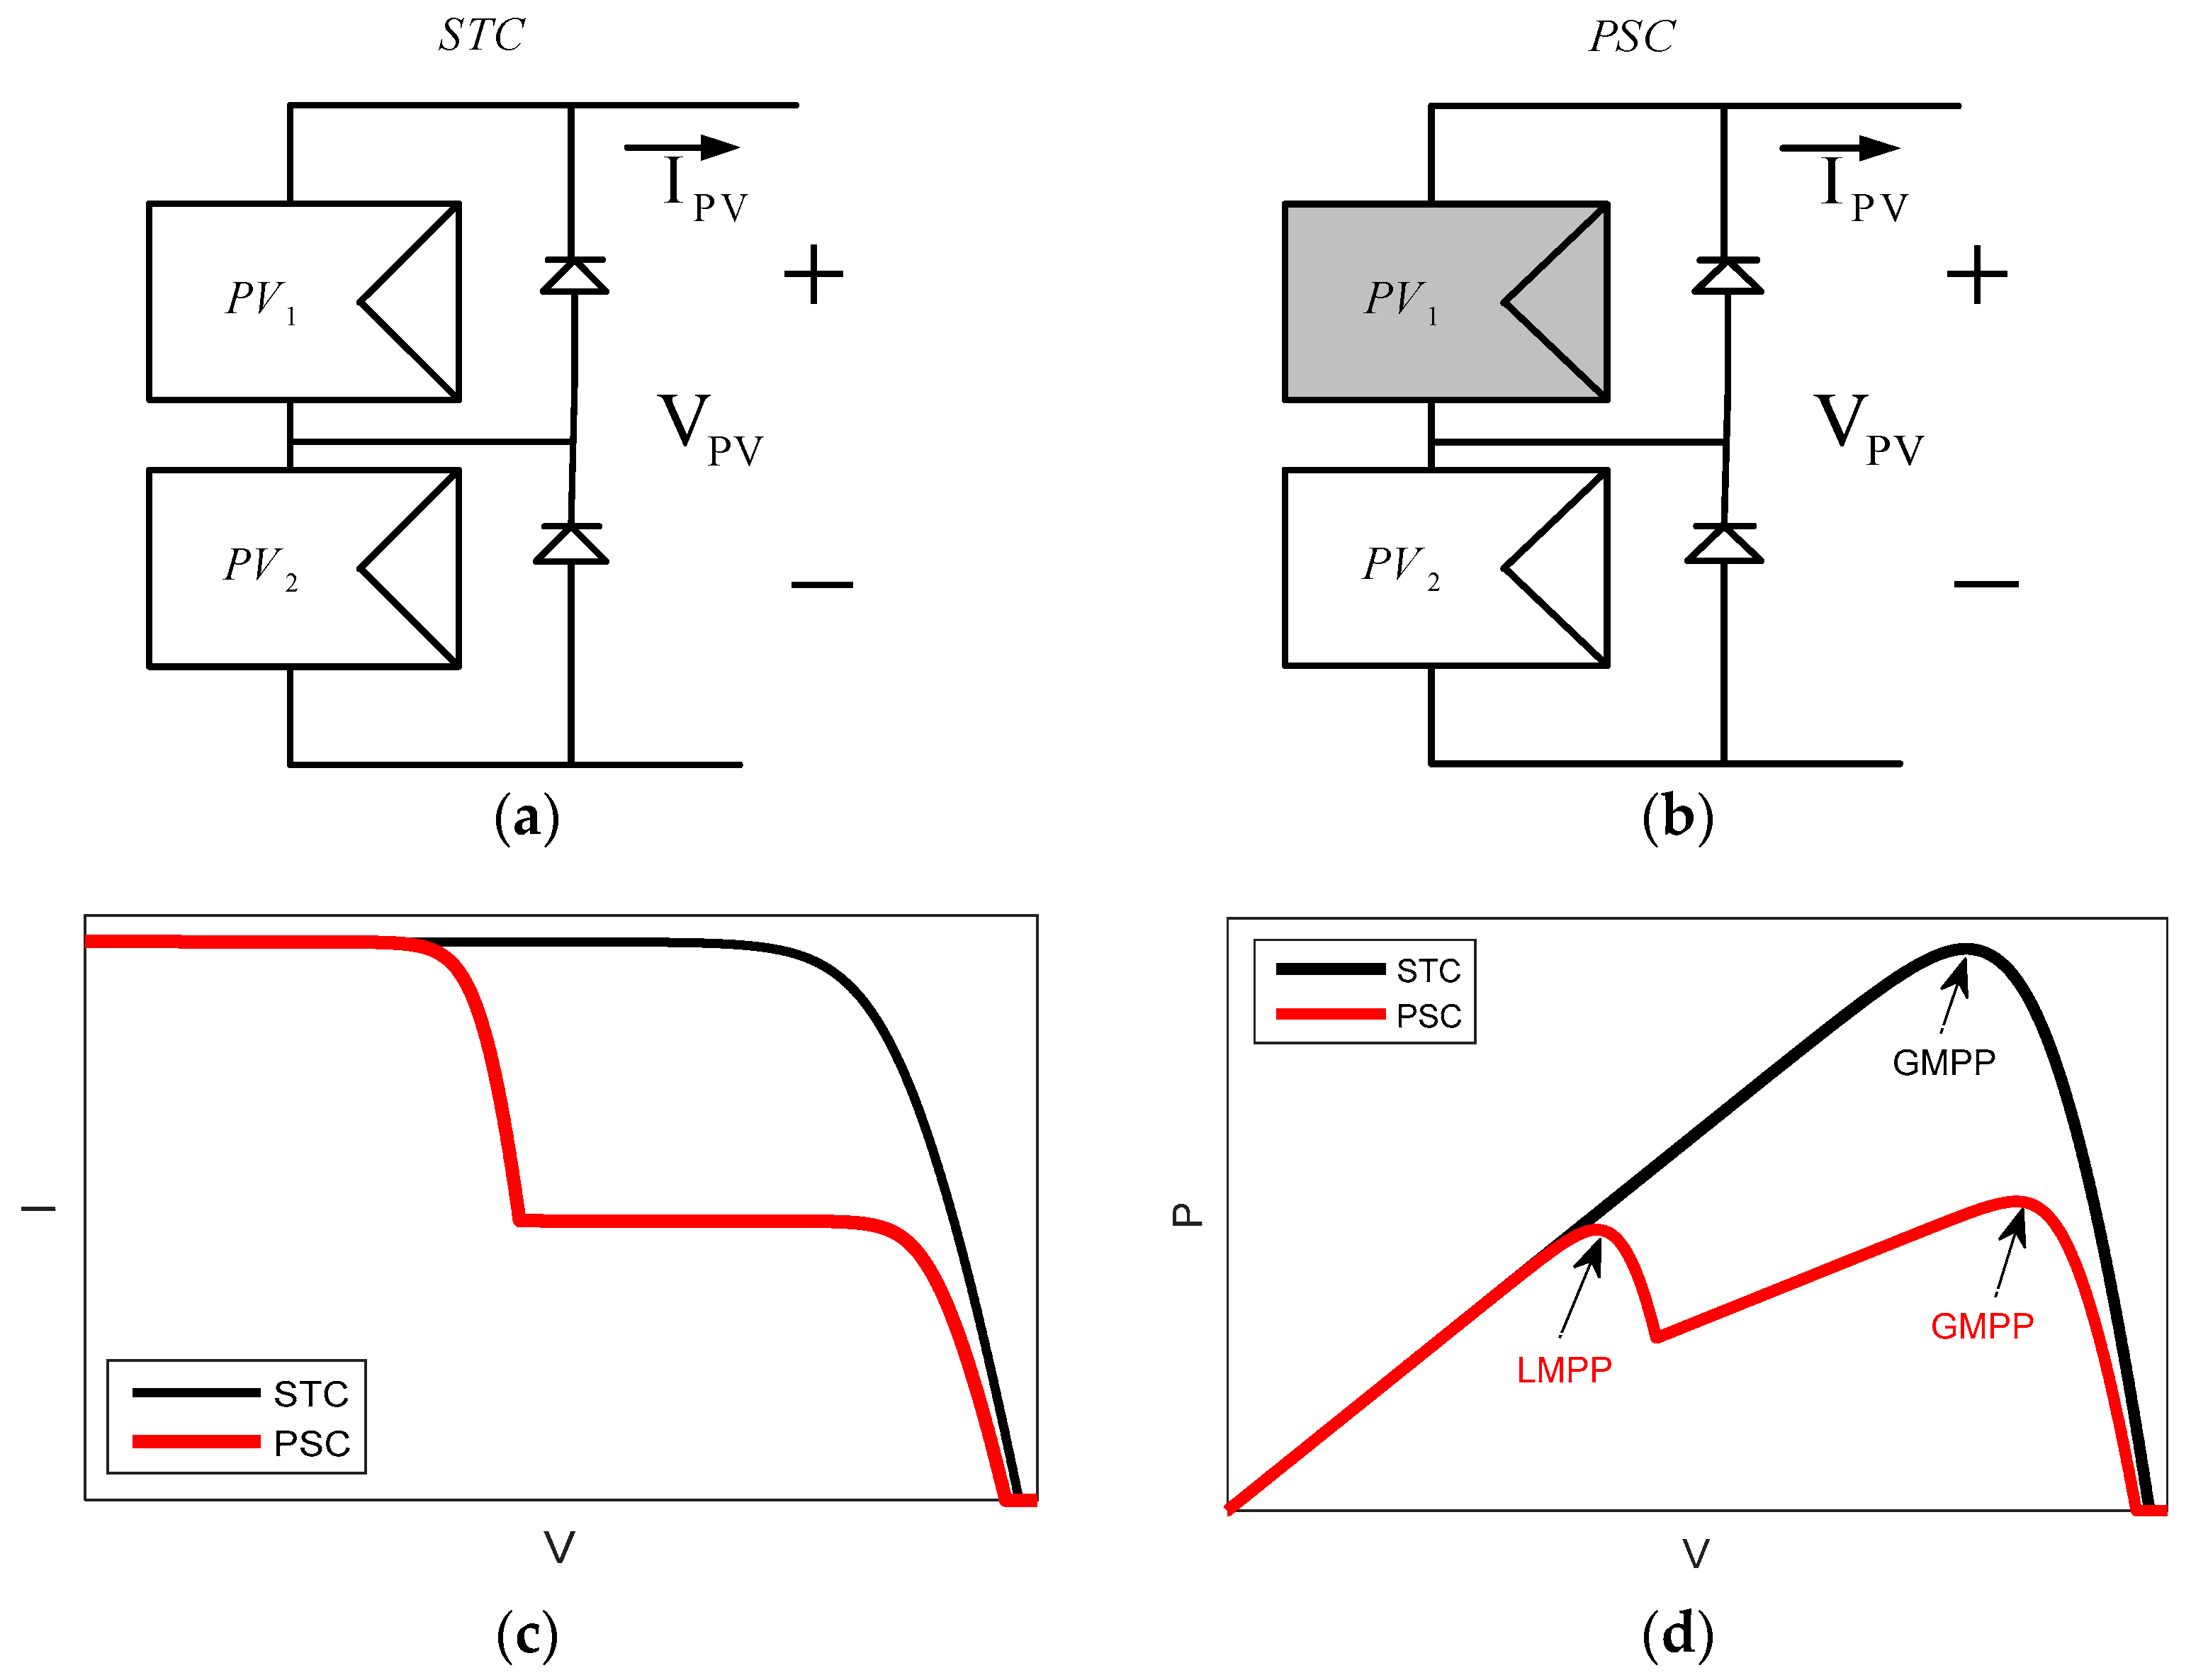
2.2. MPPT and the Effect of PSC

The power–voltage characteristic of a PV cell is illustrated in Figure 2, with an irradiance of 1000 W/m2 and a temperature of 25 °C. The black point in the curve indicates the MPP of the PV cell in standard condition. At this point, the cell voltage and current are the highest. The performance of a PV cell is proportional to environmental conditions such as PSCs. The PV cell is often partially or completely shaded by the passing clouds of adjacent buildings as well as towers and clouds. Under the PSC, the PV characteristic becomes very complex and has several peaks [9,10]. Among multiple peaks, one peak is named global MPP (GMPP), and the other peaks are called local MPP (LMPP). On the other hand, the maximum power of a PV cell occurs at the GMPP.

3. The Proposed ROA Based MPPT

In this section, the formulation of the ROA based on the initialization, exploration (Swordfish optimization strategy and Attack experience), and exploitation phases are described. Additionally, the pseudo-code of the ROA and its implementation in MPPT solving are presented.

3.1. Overview of ROA

Remora has the ability to swim on the whales, which leads to less energy consumption, and also stays safe from enemy threats. In a situation in the sea that is full of food, the remora is separated from its host (whale), and after eating and digesting the food, it is placed on the new level again and is thus transferred to another part of the sea [26]. The following sections describe free travel modeling and the thoughtful feeding of remora according to different situations of remora, as depicted in Figure 3.

3.1.1. Preparation (Initialization)

In the ROA, the candidate’s response is considered as a remora, and its position (R) in the search space is selected as a problem variable. As the remora in the one-dimensional space floats to the top, its position changes. The remora’s current position is as follows: R i = ( R i 1 , R i 2 , , R i d ) [26], where i and d refer to the remora number and its dimension, respectively.
In other words, R B e s t = ( R 1 * , R 2 * , , R d * ) refers to the food (target) in the biological behavior of the remora, which indicates the optimal solution to the ROA. In the ROA, each solution has competency fitness. The competency fitness is defined as f ( R i ) = f ( R i 1 , R i 2 , , R i d ) . f ( R B e s t ) = f ( R 1 * , R 2 * , , R d * ) refers to the best amount of merit corresponding to the best position of the remora [26].

3.1.2. Free Travel (Exploration)

  • Swordfish optimization strategy
In case the remora sticks to the swordfish, its position is updated. Its position update model is defined as follows [26]:
R i t + 1 = R B e s t t ( r a n d ( 0 , 1 ) × ( R B e s t t + R r a n d t 2 ) R r a n d t )
where t is the present iteration, T represents the number of maximum iterations, and Rrand refers to a position taken randomly.
The random selection of remora also requires an exploration of the search space. The choice of host by the remora depends on whether the host has eaten the prey or not. In other words, the current eligibility rate is better in comparison with the previous generation. Therefore, the present value of competency is obtained based on the history of the attack [26].
  • Attack experience
To change or not to change the host according to the amount of fitness, the remora must constantly take small steps in the vicinity of the host. This behavior is modeled as follows [26]:
R a t t = R i t + ( R i t R p r e ) × r a n d n
where Rpre and Ratt refer to the position of the previous generation and the test step, respectively. Likewise, randn represents the small global step of the remora taken randomly.
The remora then randomly evaluates whether the host should change. In other words, a comparison is made between the fitness value of the current response f(Rit) and the tested response f(Ratt). If the tested fitness value is less than the current response competency value [26], then:
f ( R i t ) > f ( R a t t )
In this condition, the remora chooses one of the feeding methods for local optimization.
If the tested fitness value is greater than the current response fitness value, then the remora selects the host [26]:
f ( R i t ) < f ( R a t t )

3.1.3. Thoughtful Nutrition (Exploitation)

  • Whale Optimization Algorithm (WOA) Strategy
According to the WOA, the update of the position of the attached remora to the whale is presented as follows [26]:
R i + 1 = D × exp a × cos ( 2 π α ) + R i
α = r a n d ( 0 , 1 ) × ( a 1 ) + 1
a = ( 1 + t T )
D = | R B e s t R i |
where D refers to the distance within the hunter and the prey, α is a random number between 1 and −1, a represents a linear number between −1 and −2 and is the number of maximum iterations.
  • Host nutrition
The response space can be limited to the host position space. Considering movement in the host space with small steps is defined as follows [26]:
R i t = R i t + A
A = B × ( R i t C × R B e s t )
B = 2 × V × r a n d ( 0 , 1 ) V
V = 2 × ( 1 t T )
where the parameter A represents the small step between the fish adhesive and the host. C represents the coefficient of stickiness to indicate its position and is in the range of [0, 0.3]. The ROA pseudo-code is described in Algorithm 1.
Algorithm 1 Pseudo-code of the ROA
1: Initiate the population and memory location Ri and Rpre;
2: Initiate the RBest as optimal solution and f(RBest) as its optimal fitness;
3: While t < T do
4:    Compute the fitness value of each ROA population;
5:    Investigate if any remora goes beyond the search space and amend it;
6:    Update a,α and V;
7:   For each remora indexed by i do
8:    If H(i) = 0 then
9:    Based on Equation (6), update the whales position;
10:    Elseif H(i) = 1 then
11:    Based on Equation (2) update the Sailfishes position;
12:    Endif
13:    Make a prediction via Equation (3);
14:    Calculate the H(i) value via Equations (4) and (5) to evaluate whether host replacement is vital;
15:    In case of non-replacement of the host, Equation (10) is applied as the host feeding state;
16:   End for
17: End while

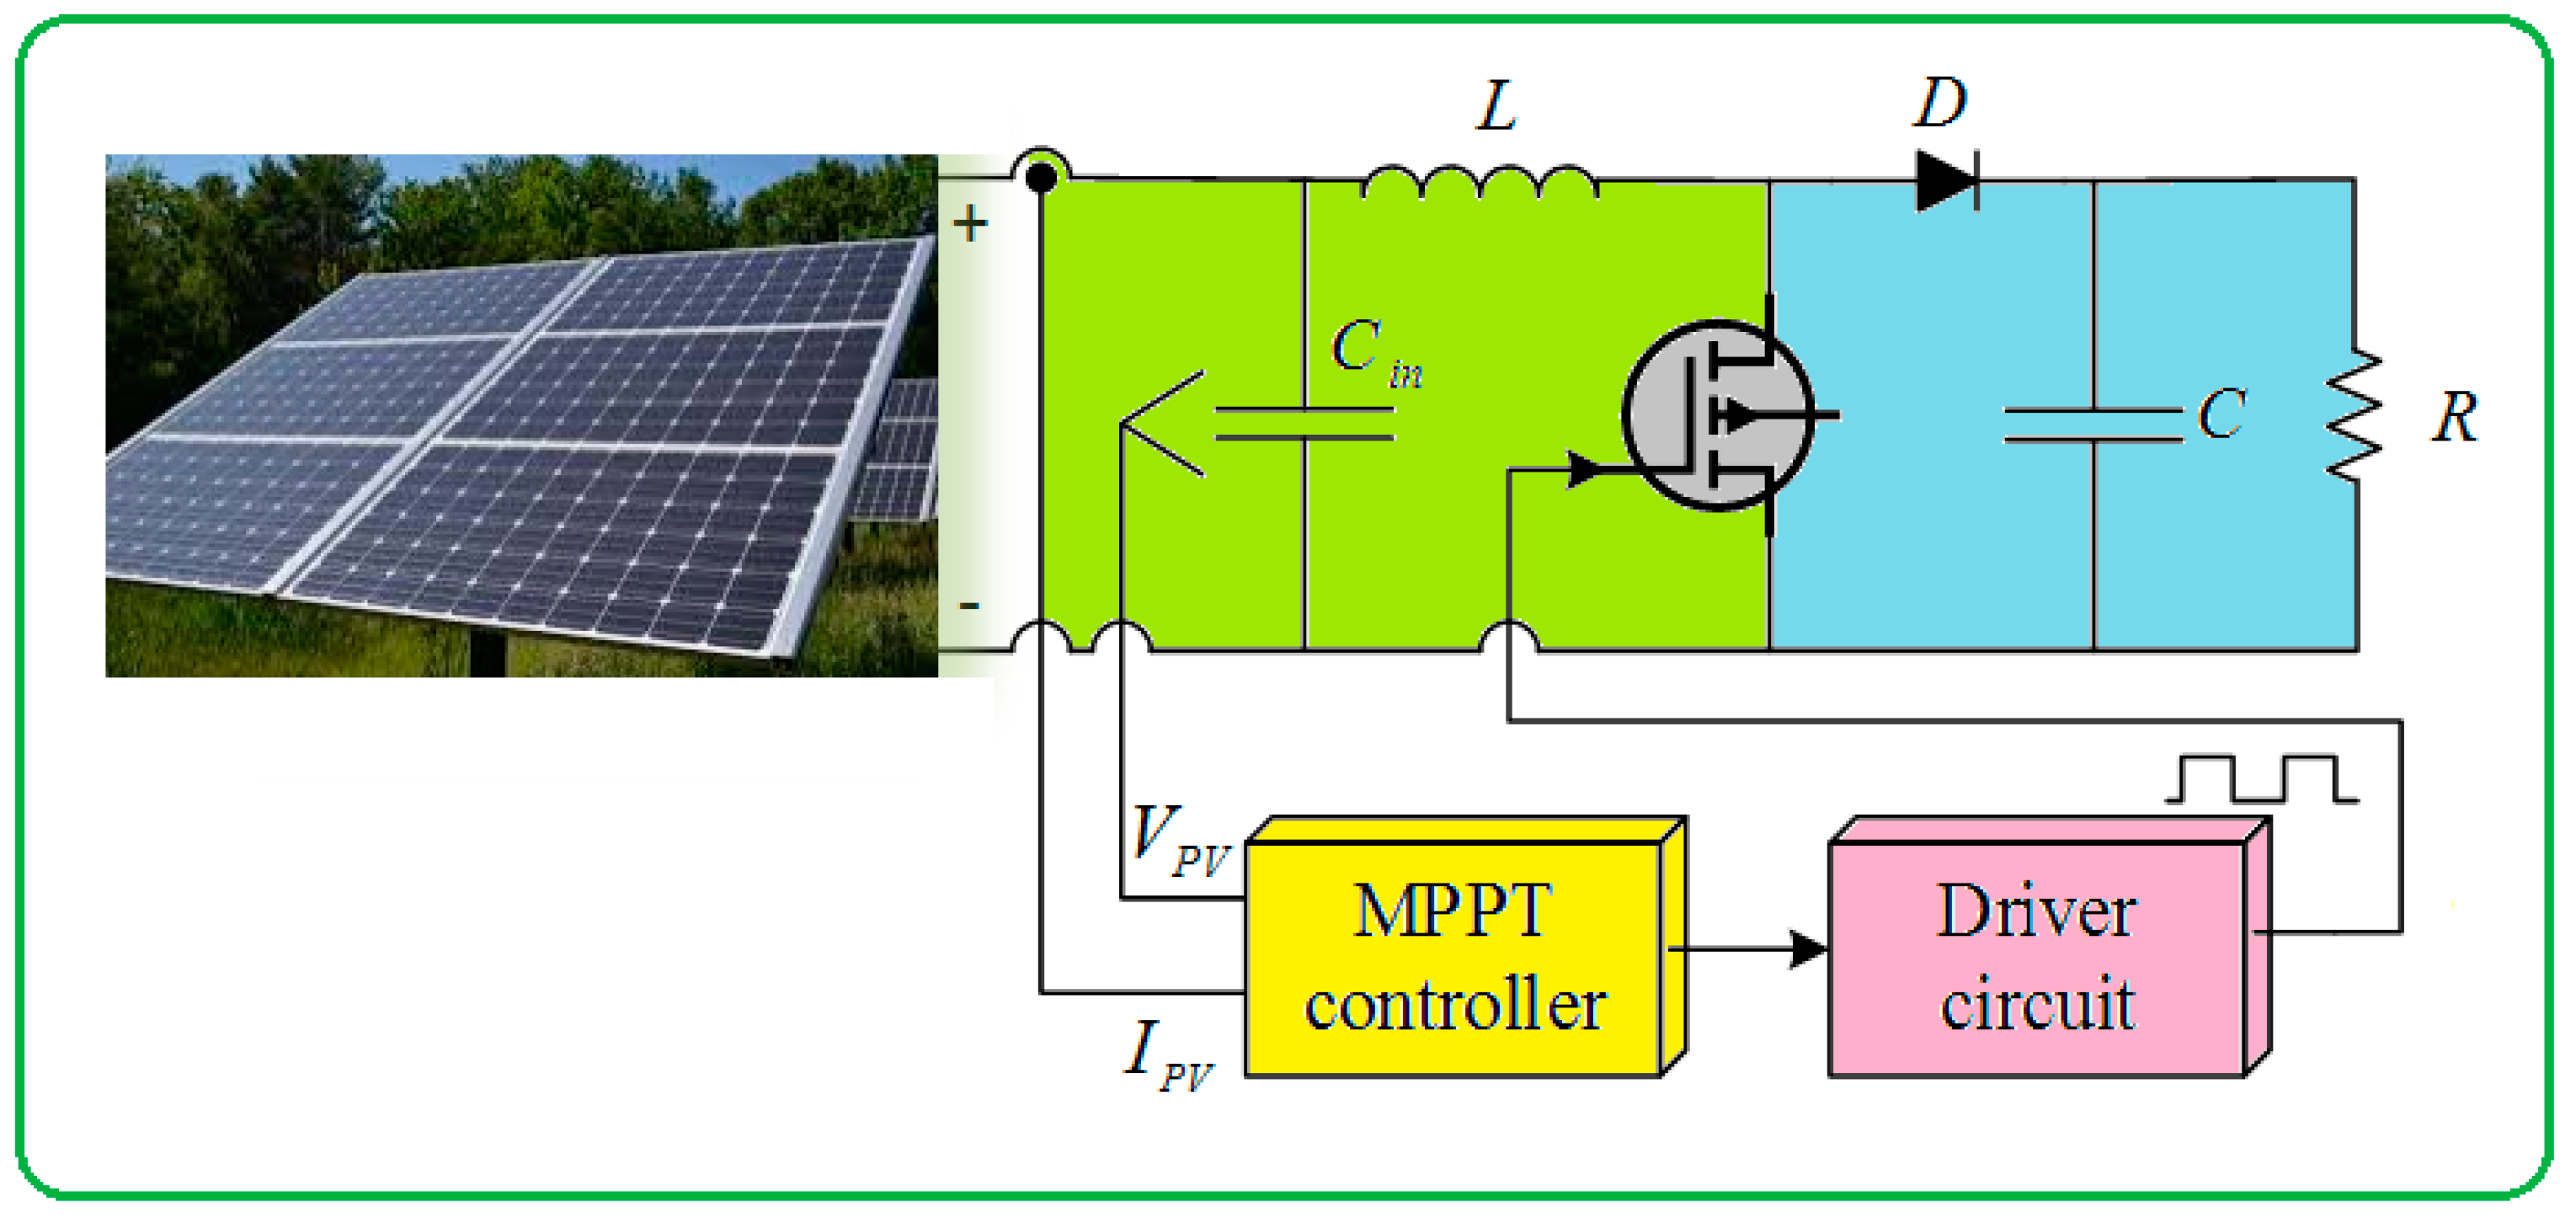
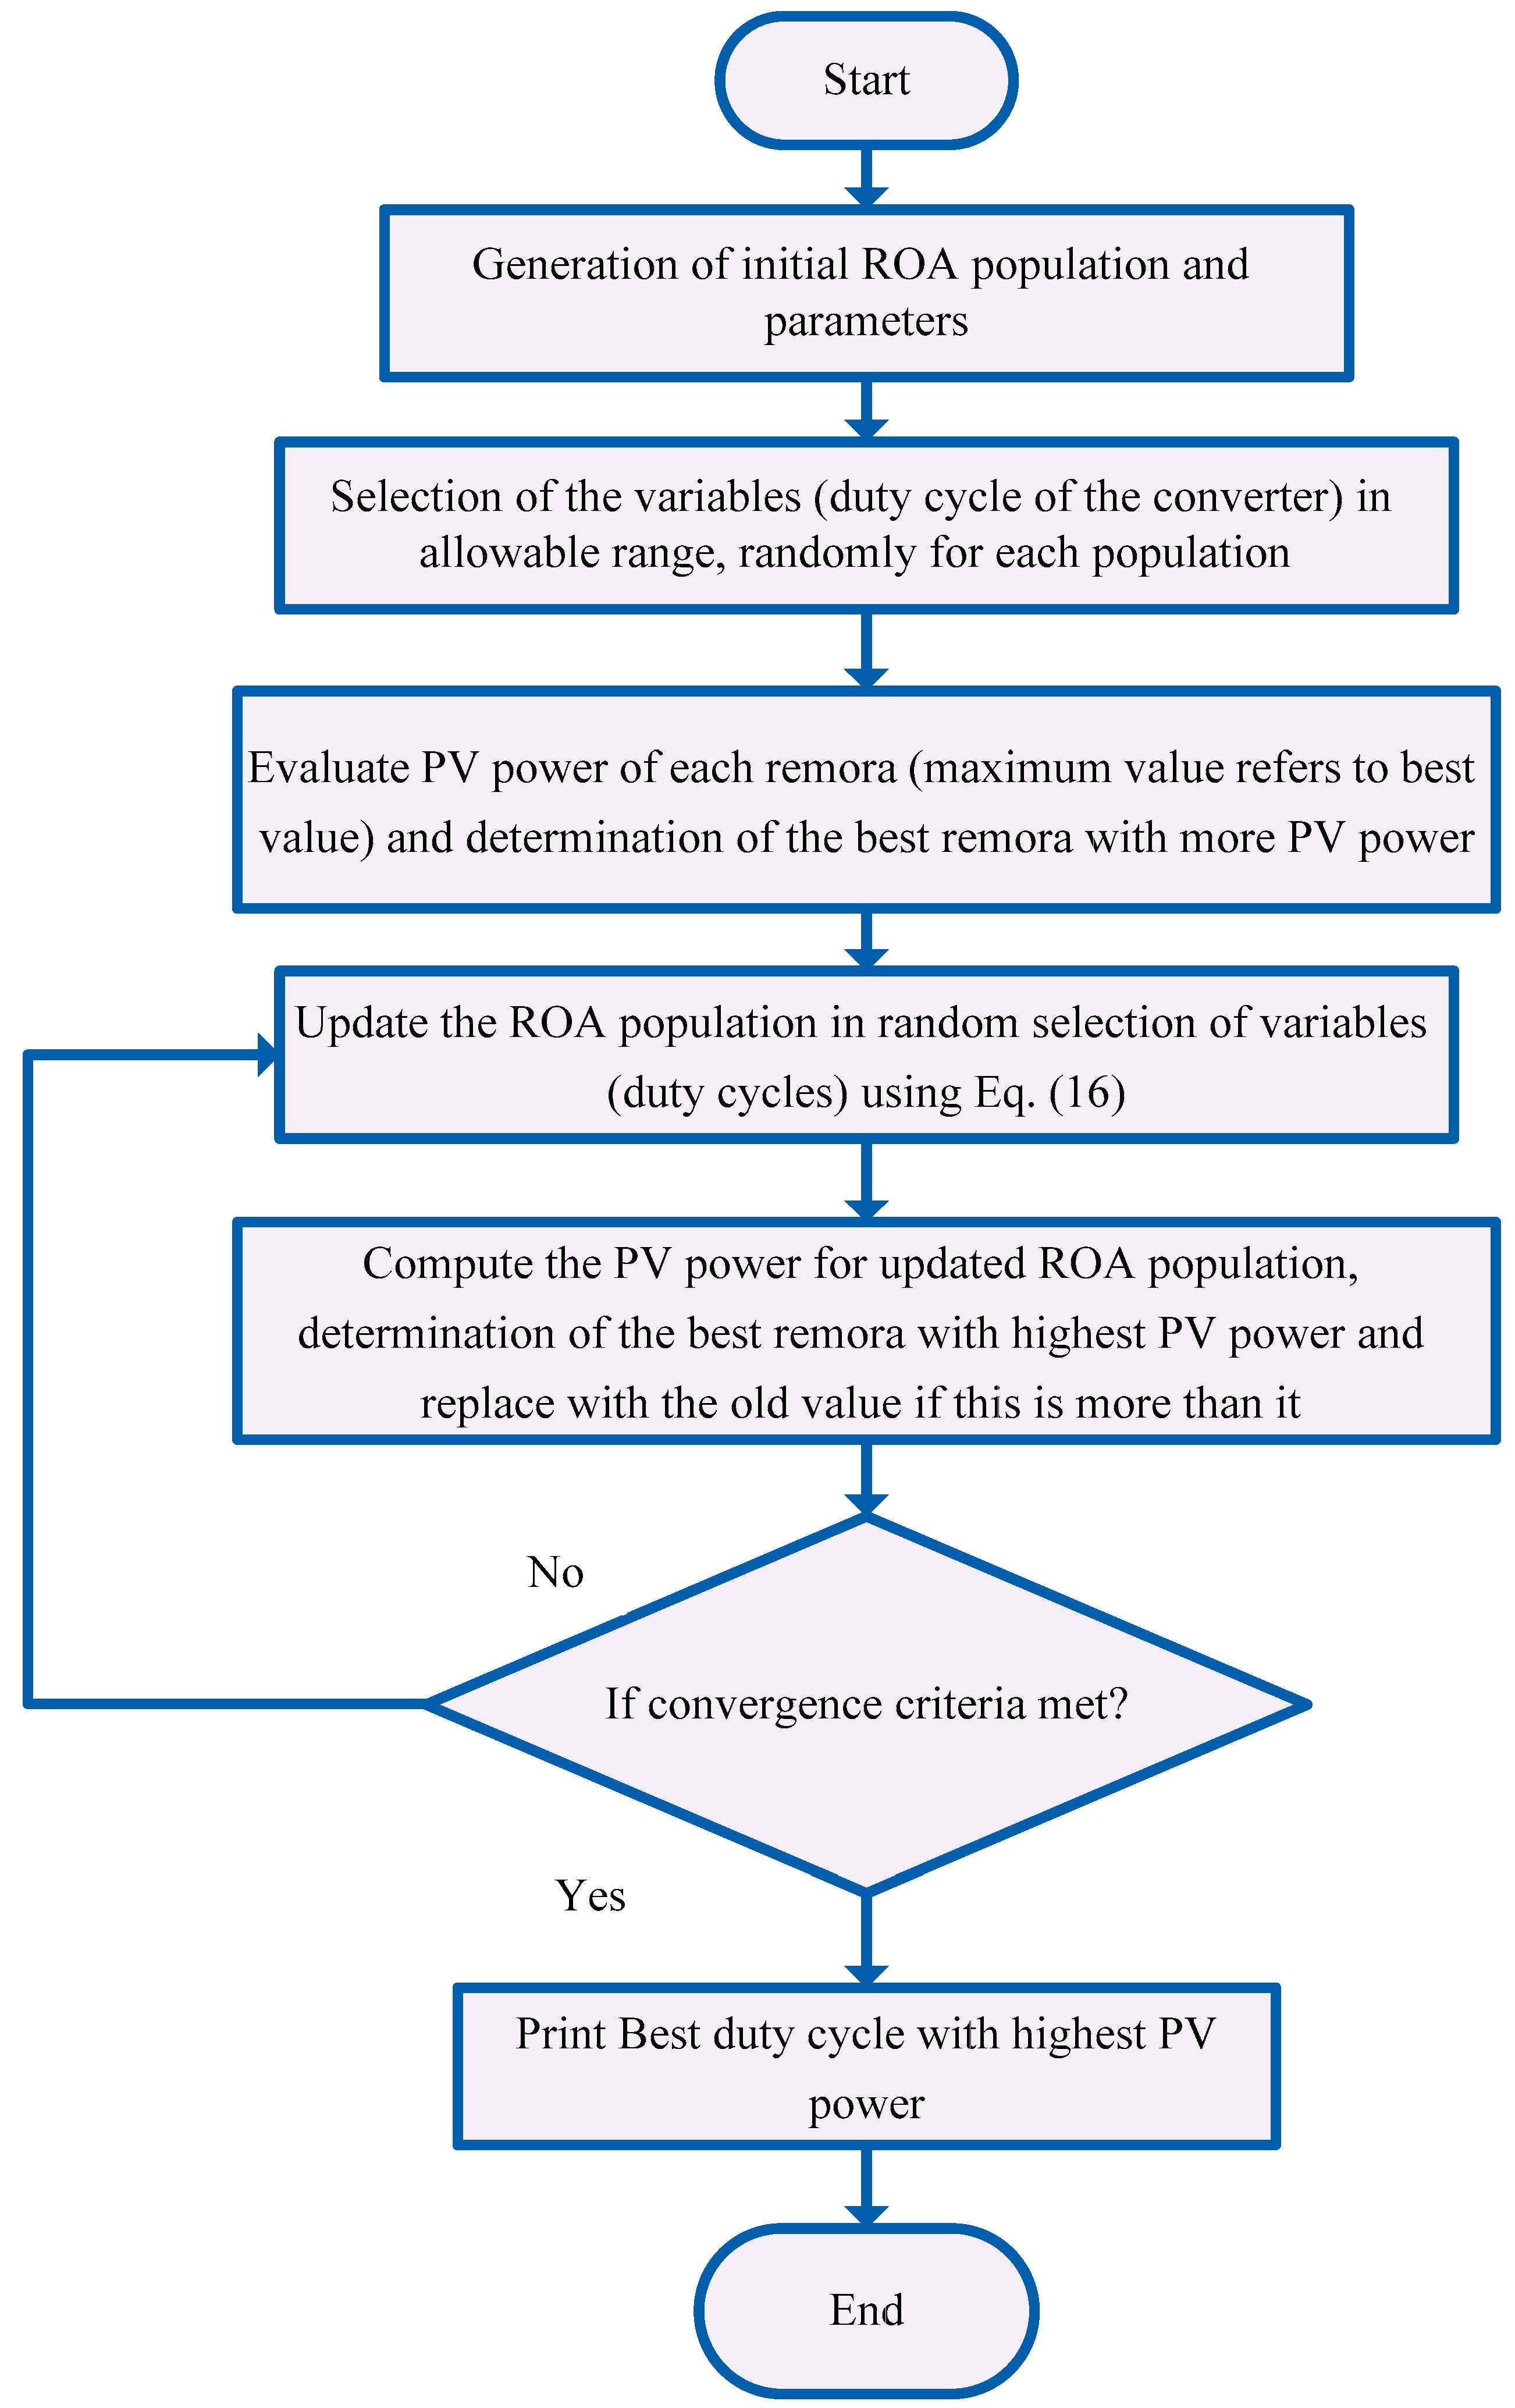
3.2. Application of the ROA for MPPT

The MPPT system is demonstrated in Figure 4. The PV power is computed with a multiplier based on voltage and current obtained values. The MPPT based on the ROA generates a duty cycle (d) and activates the converter. The d value is taken as the agent position, and the corresponding extracted power is taken as the agent optimization probability. Thus, the ROA determines the optimal d to maximize the PV system power and its efficiency.
In MPPT solving via the ROA, power of the PV system is formulated as follows:
M a x i m i z e P P V ( d )
The optimization variable (d) is constrained by:
d min < d < d max
where dmin and dmax are the low and high values of d, respectively.
In this study, the ROA has been used as a direct control method to optimally adjust the d of the converter of the PV system and reduce the fluctuations of the system steady state.
The steps to implement the ROA in solving the MPPT problem are as follows:
Step (1) In this step, ROA information is entered (population number 5 and number of iterations 330). Additionally, the minimum and maximum intervals of the duty cycle are applied.
Step (2) For each of the population, the duty cycle in its allowable range is randomly selected by the ROA and the voltage, while the current and consequently the PV power are calculated for it.
Step (3) The agent corresponding to the best PV power in step 2 is selected as the best agent of the algorithm.
Step (4) The ROA population set (d) is updated according to the exploration and exploitation phases of the ROA based on the following equations:
d i t + 1 = d i t + ( 2 × ( 1 t T ) ) × ( 2 × r a n d ( 0 , 1 ) 1 ) × ( d i t × ( 1 C ) )
where d i t + 1 refers to the duty cycle in t + 1 iteration related to ith remora and t is the ROA iteration number.
In addition, the PV system power using the ROA-based MPPT problem is defined as follows:
P ( d i , j ( t + 1 ) ) > P ( d i , j ( t ) )
Step (5) For the updated population (selection of new duty cycles), the objective function, i.e., PV power, is calculated.
Step (6) The best agent with maximum power is selected as the population representative in step 5. If the solution is better compared to step 3, replace it.
Step (7) If the convergence conditions are achieved, which are to achieve maximum power and perform maximum repetitions of the ROA, go to step 8; otherwise, go to step 4.
Moreover, at this stage, because of the variations in environmental conditions, the output power of the PV system changes. Hence, the ROA population must be re-quantified to achieve the GMPP according to the following logic:
P P V ( C _ I t e r + 1 ) P P V ( C _ I t e r ) P P V ( C _ I t e r ) Δ P
Step (8) End (achieving maximum power and determining the optimal duty cycle).
Flowchart of ROA implementation in problem solving is demonstrated in Figure 5.

4. Simulation Results

The capability of the ROA in MPPT solving is evaluated in different patterns of PV configurations. Additionally, the capability of the ROA is compared with that of the MRFO and PSO algorithms in achieving the GMPP. The PV module parameters are given in Table 2. The peak power of a PV module is 56.75 W [9]. A DC/DC boost converter is applied to the MPPT system and its data are presented in Table 3. The size of the population and the maximum iteration of the ROA and PSO methods are 8 and 200, respectively.
In order to implement the proposed method, the following patterns are considered in STC (pattern 1) and PSC (patterns 2 and 3). It should be noted that the PV configuration consists of two modules in series as a 2S structure.
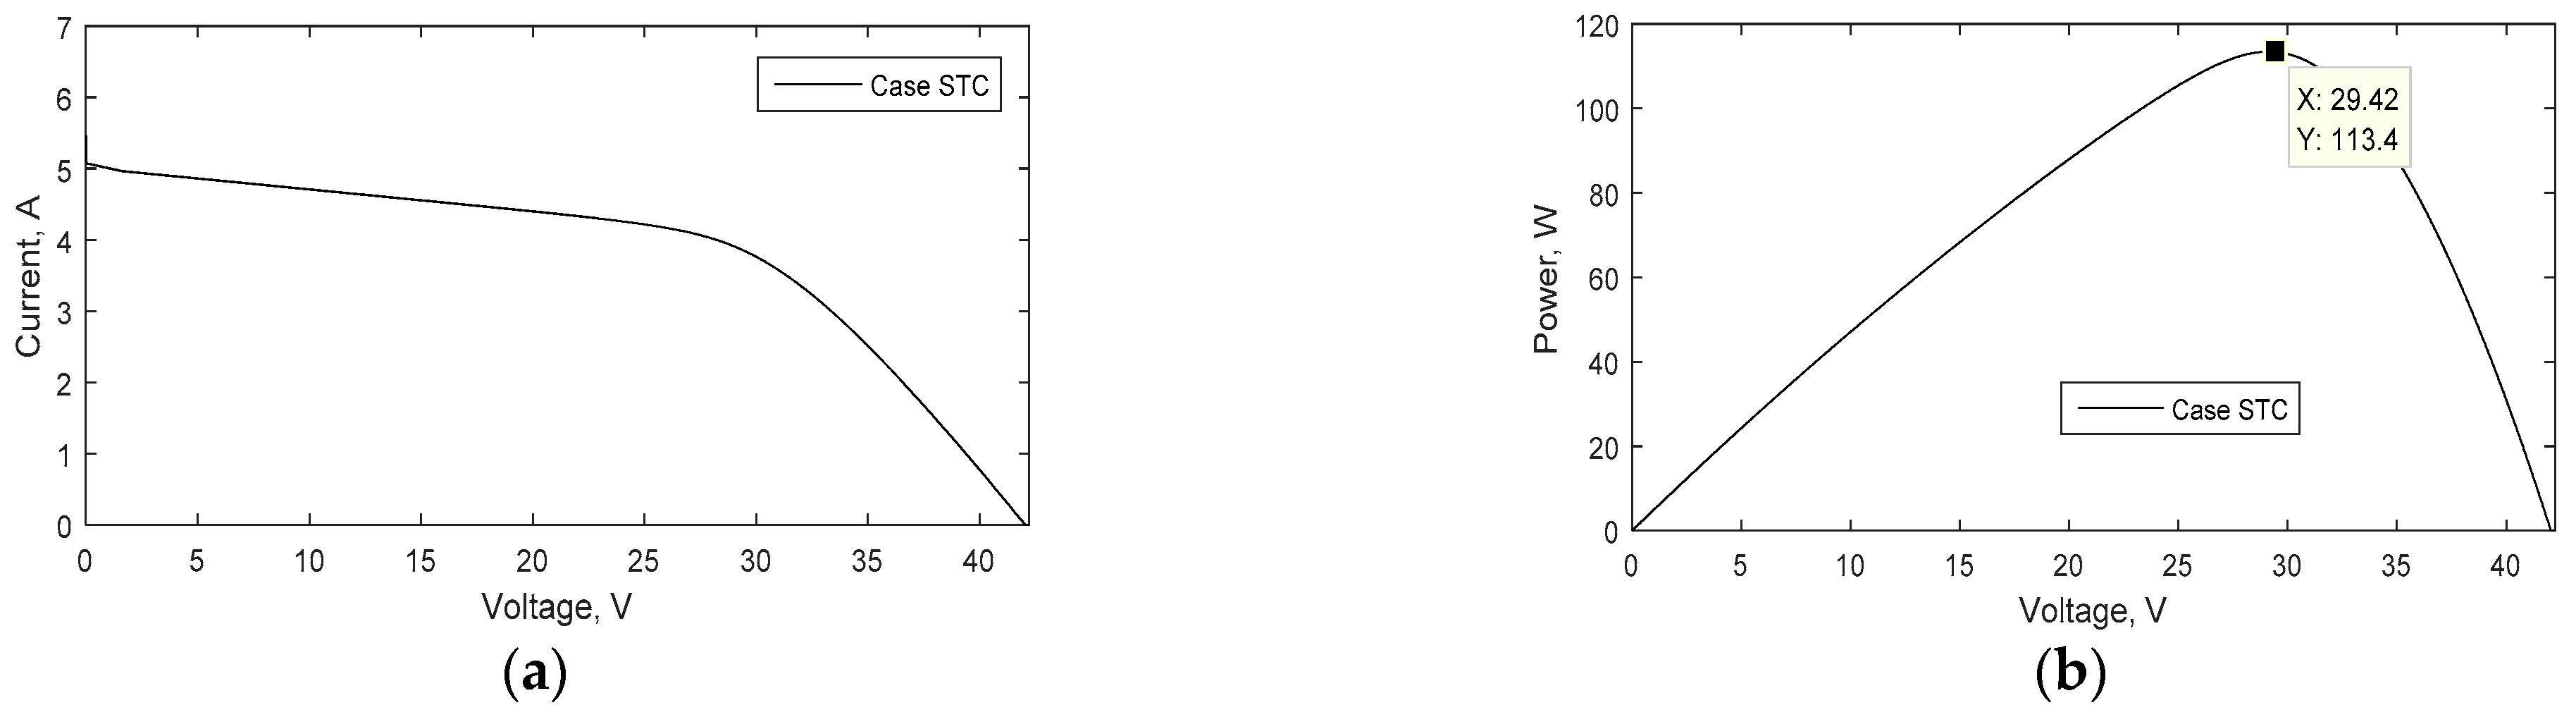
  • Pattern (1) STC with uniform radiation of 1000 W/m2;
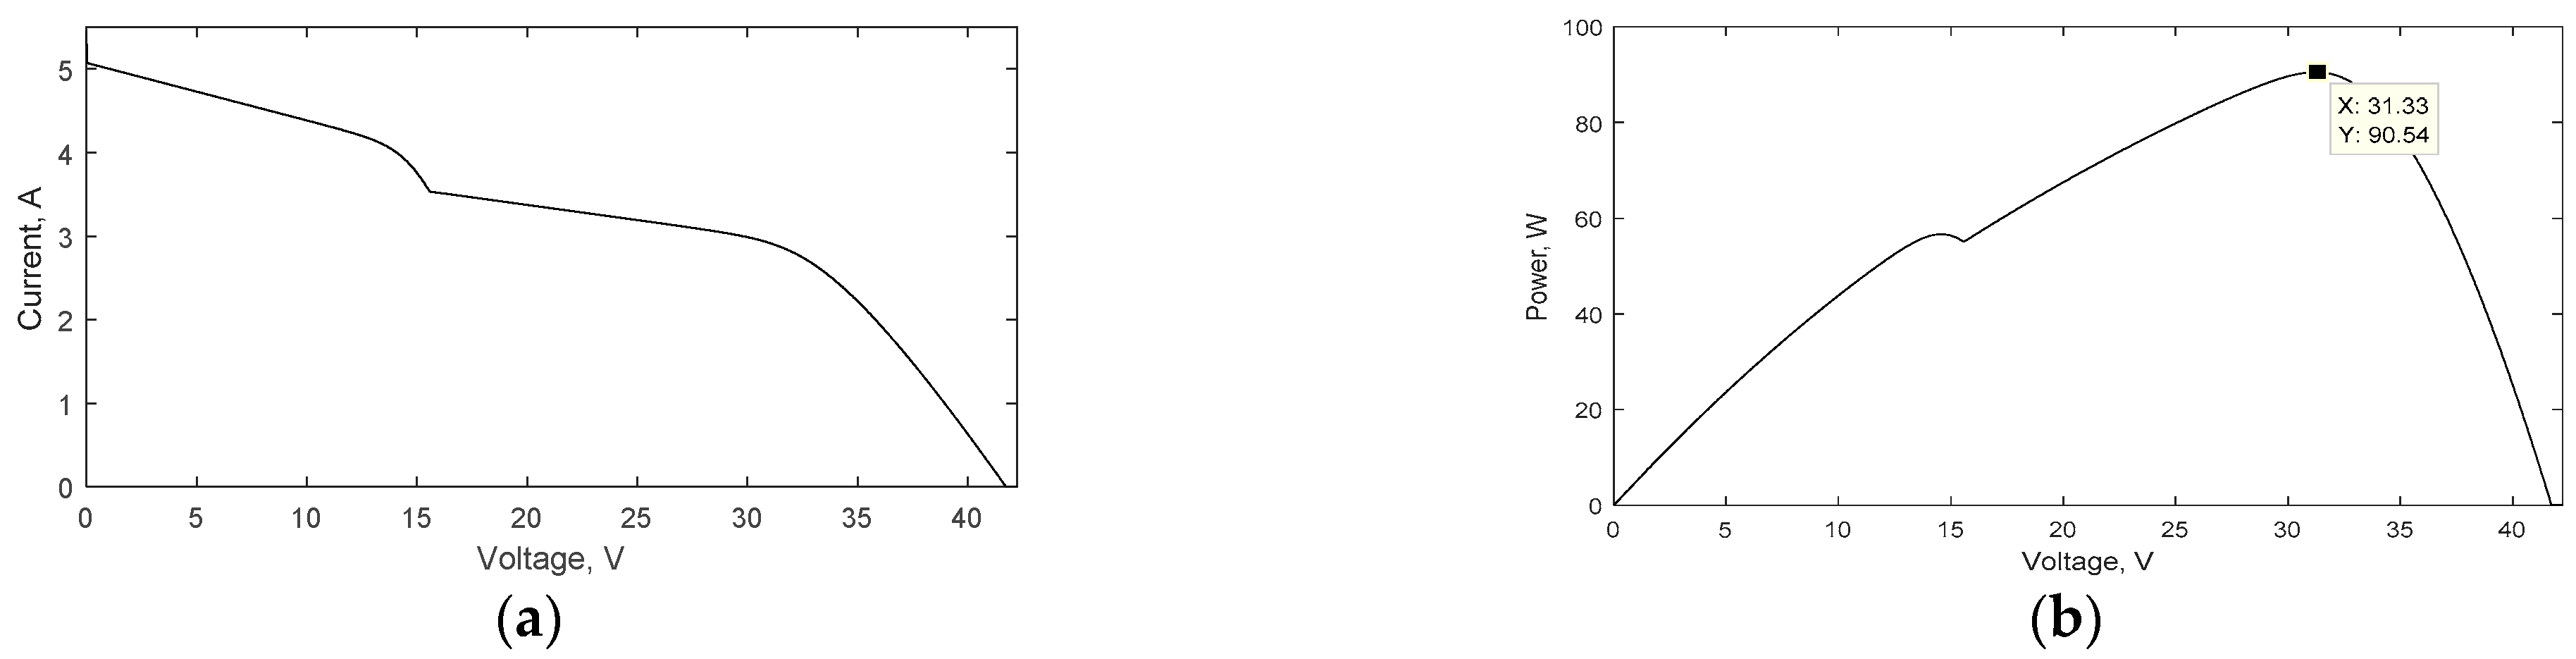
  • Pattern (2) PSC with non-uniform radiation of 1000 and 700 W/m2;
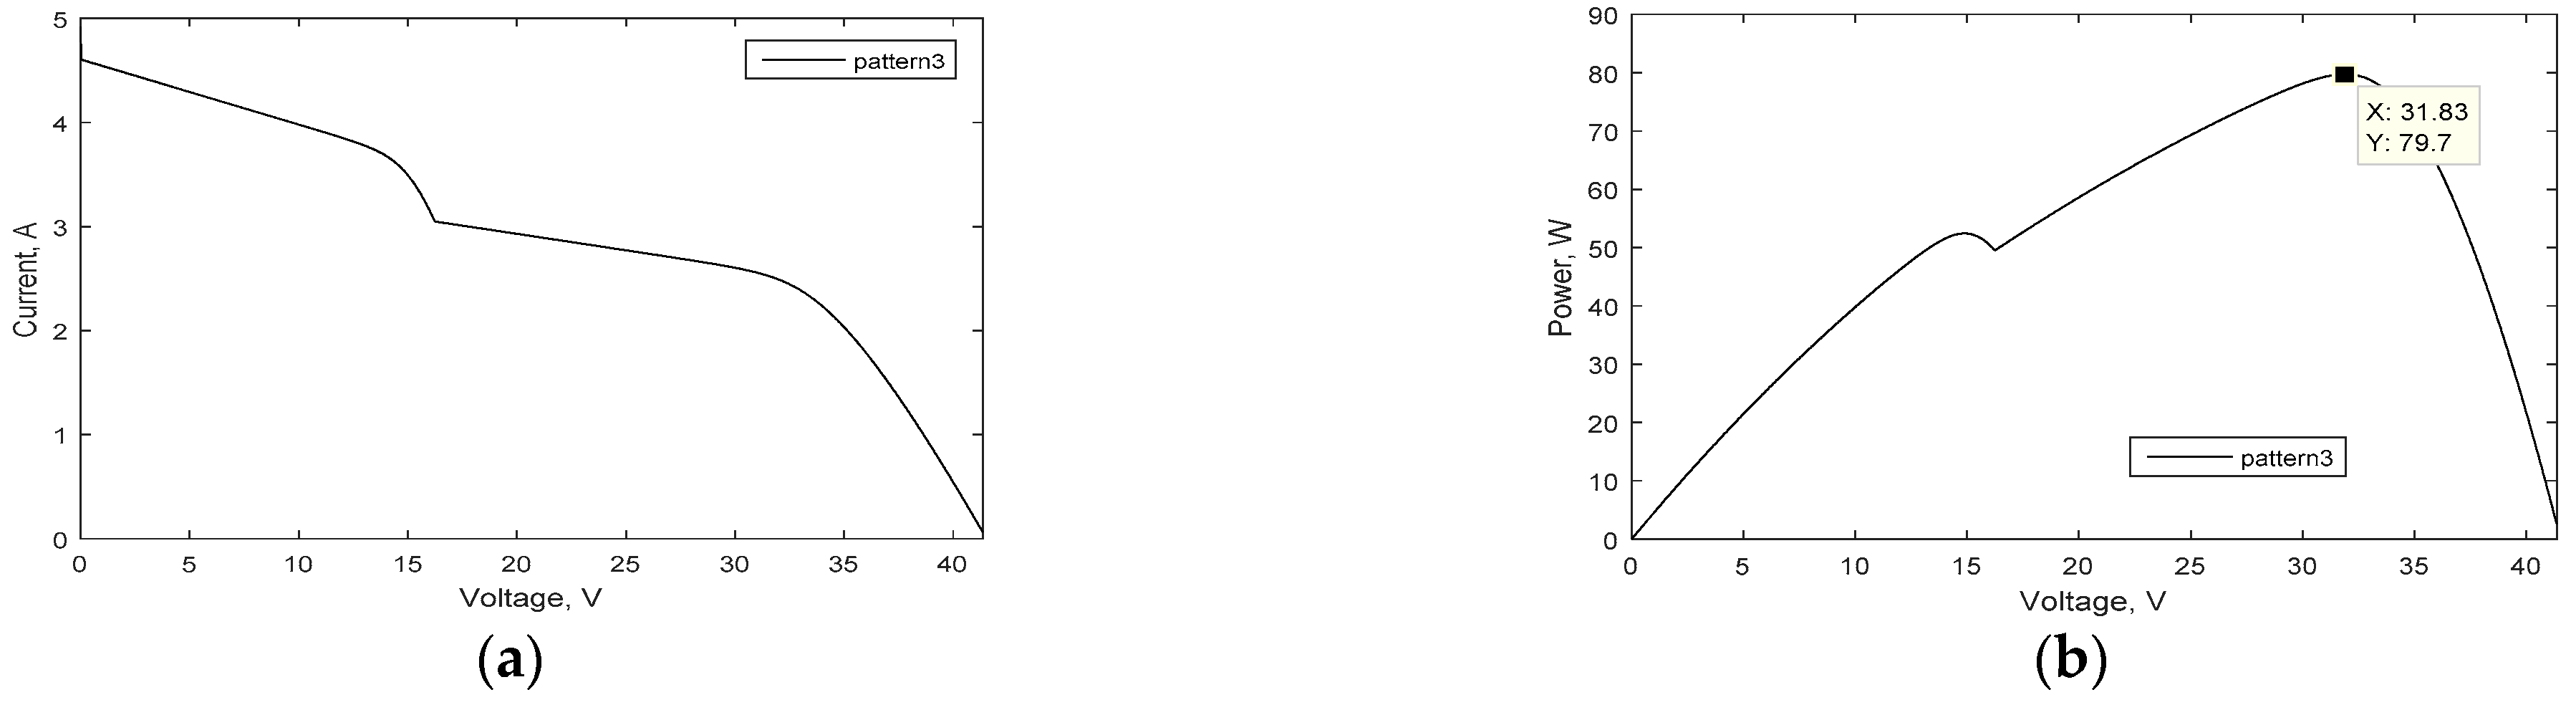
  • Pattern (3) PSC with non-uniform radiation of 900 and 600 W/m2.
The characteristic curves of the all patterns are depicted in Figure 6, Figure 7 and Figure 8. As can be seen, characteristic curves of pattern 1 has one peak and patterns 2–3 have two peaks due to PSC. The obtained peak power of patterns 1–3 are 113.42 W, 90.54 W, and 79.7 W.

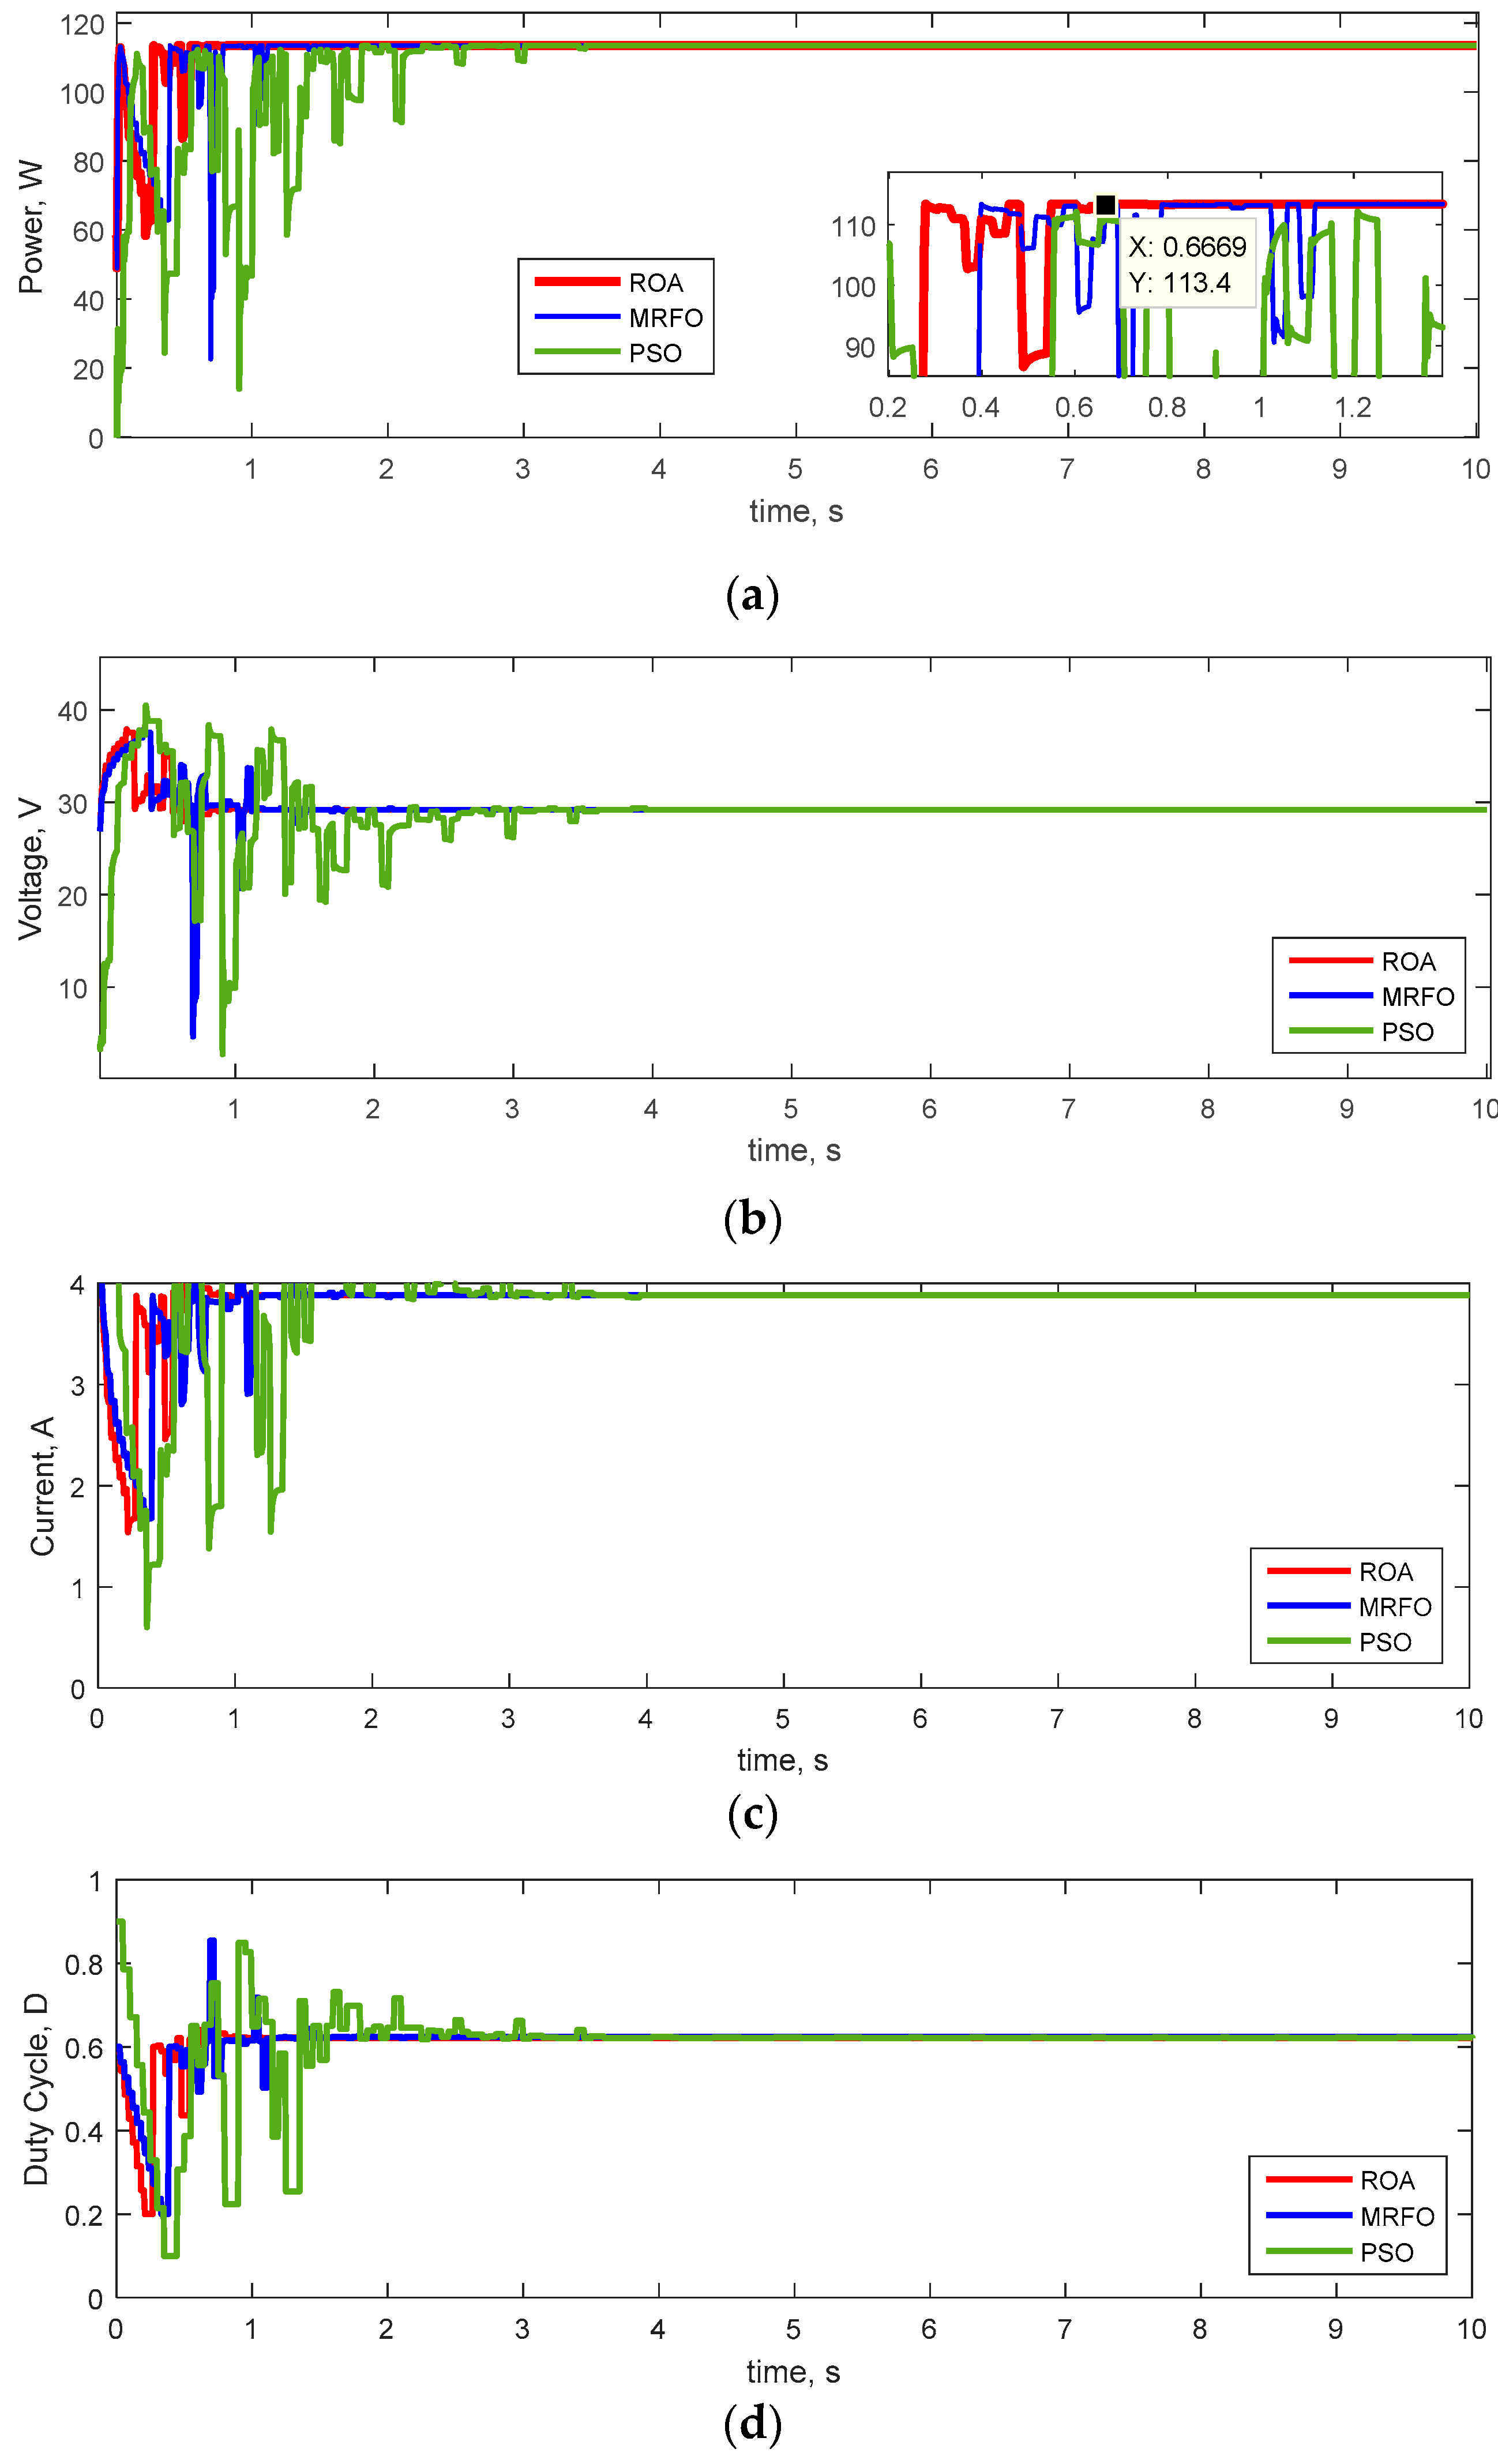
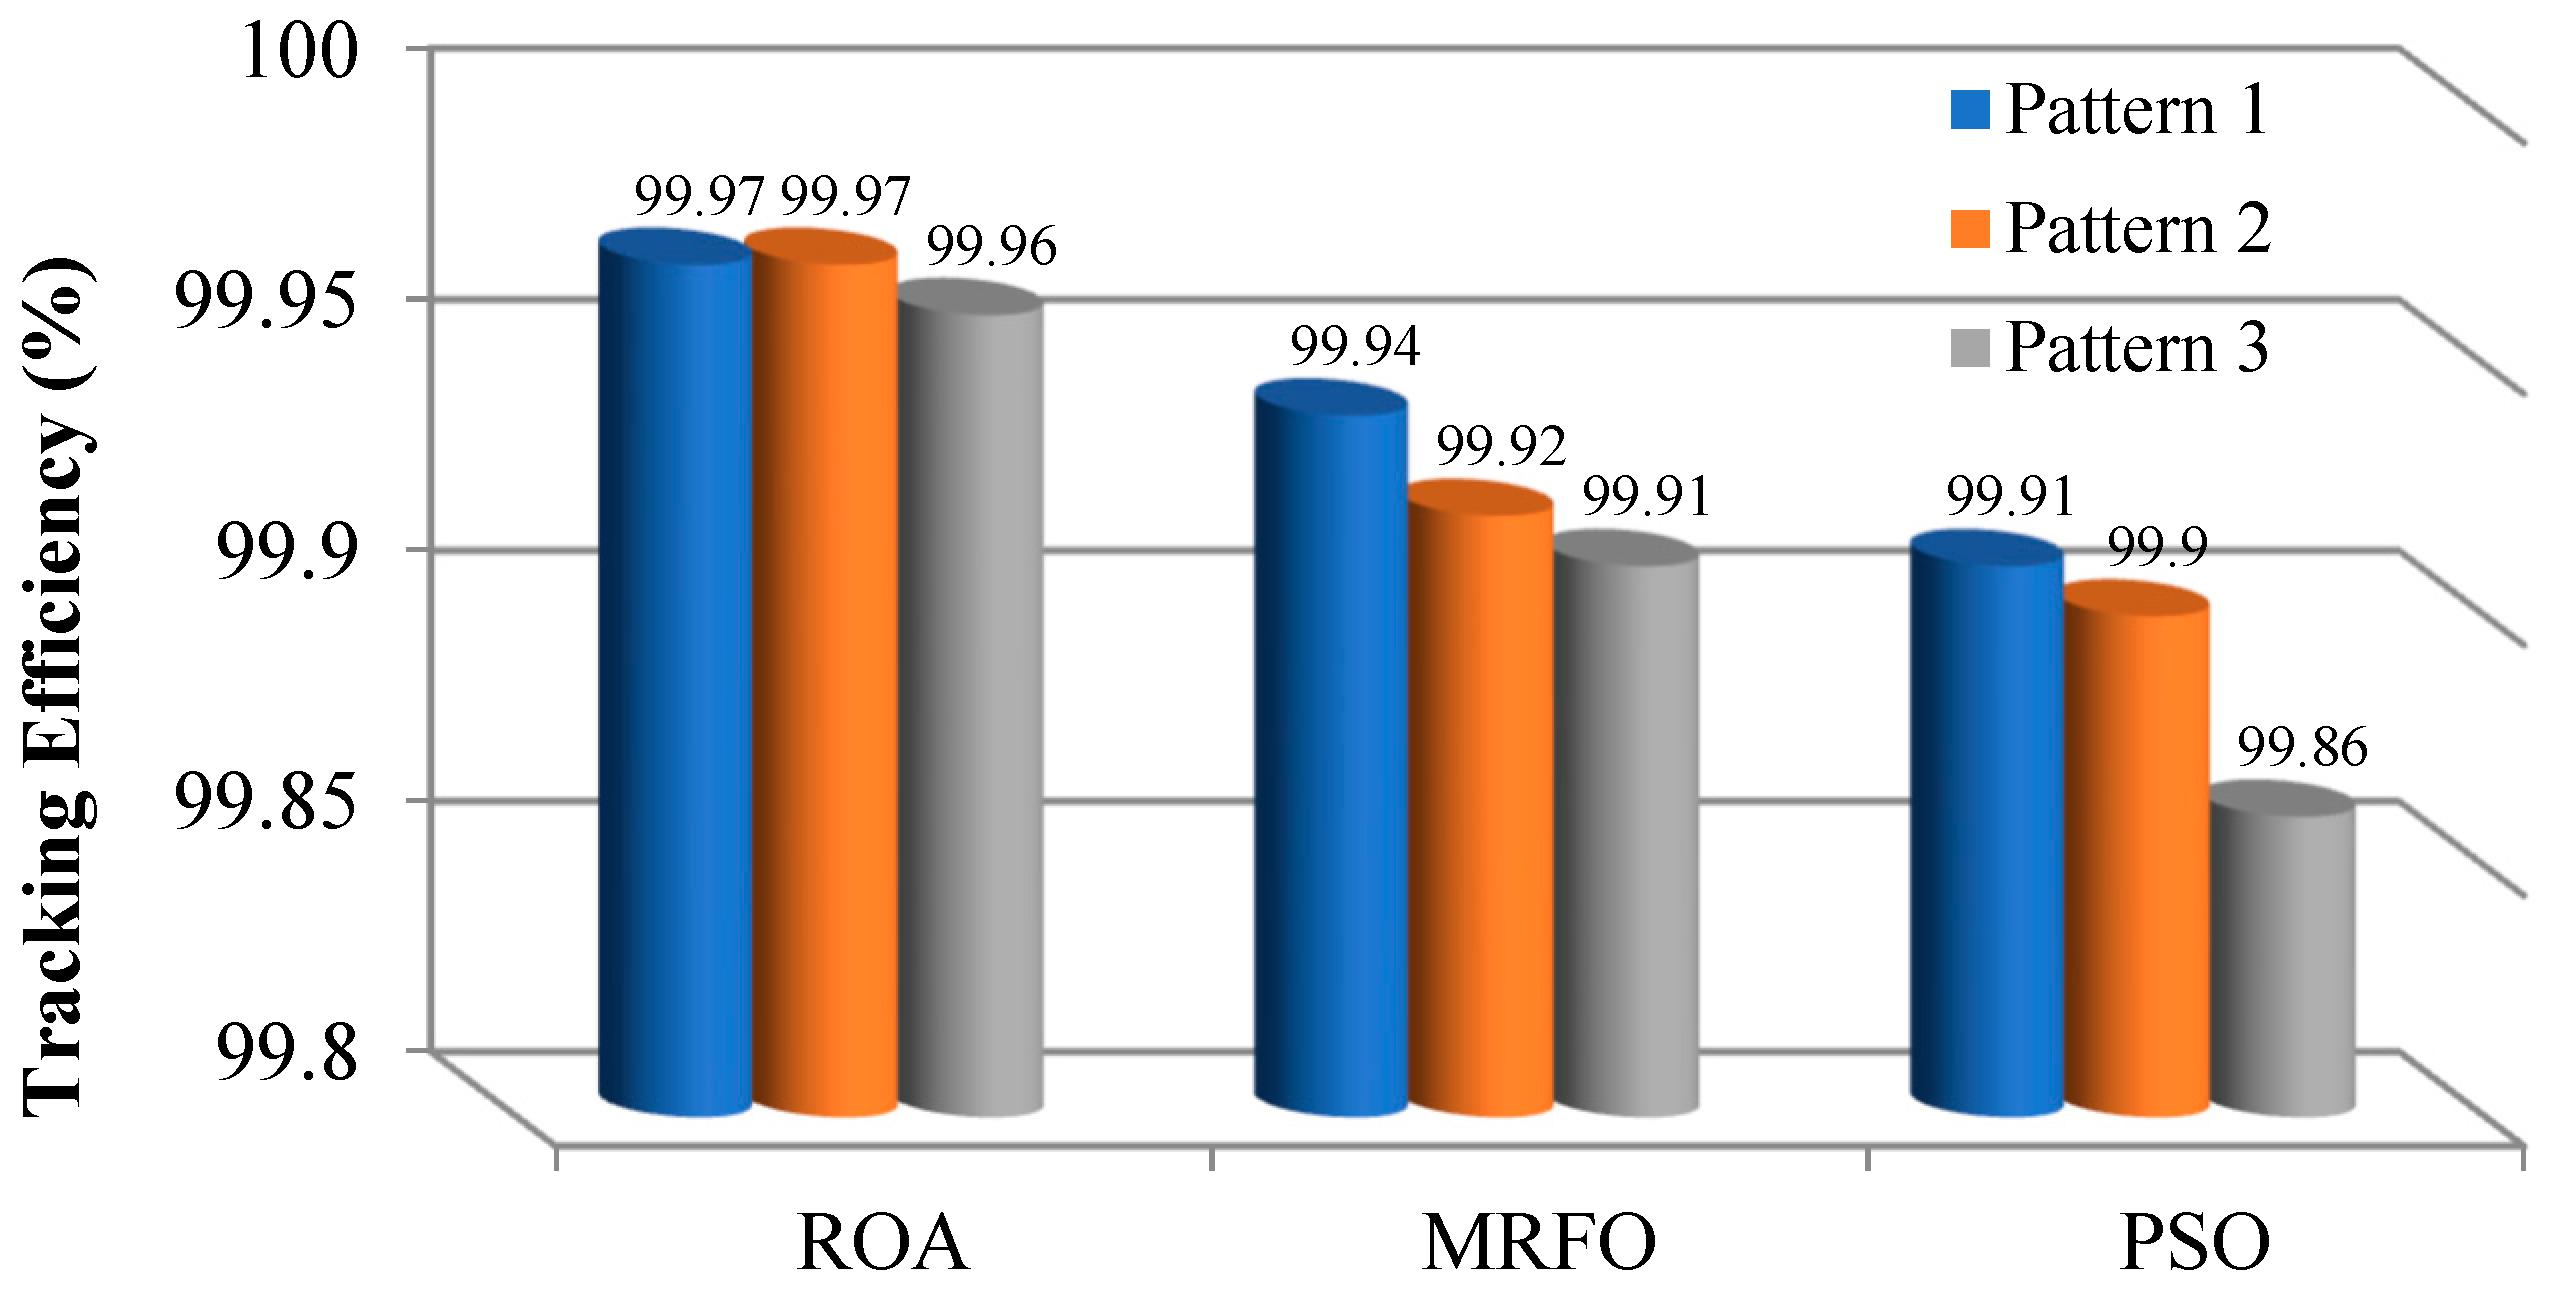
4.1. Results of Pattern 1

The performance of the ROA in solving the MPPT problem is evaluated in pattern 1 (STC). In addition, the ROA results are compared with MRFO and PSO. The PV power, current, voltage, and duty cycle curves obtained using the ROA, MRFO, and PSO are showed in Figure 9. The peak power of pattern 1 is 113.42 W. According to the obtained figures, it is clear that the steady-state fluctuations of the ROA-based MPPT are very low compared to those of the MRFO and PSO methods. The MPPT method based on the ROA is a fast method that reaches the global peak value with small transient fluctuations. In contrast, the transient fluctuations of the MRFO and PSO are high compared to the ROA.
Table 4, shows the numerical results of ROA, MRFO, and PSO performance in MPPT solving for the PV system in view of output power, efficiency, and tracking speed for different methods. As seen in Table 4, extracted PV power equal to 113.39 W, 113.36 W, and 113.32 W were obtained for the ROA, MRFO, and PSO as well as a tracking efficiency equal to 99.97 %, 99.94 %, and 99.91 % also for these methods. On the other hand, it is obvious that the ROA obtained higher peak power value with higher tracking efficiency at a higher tracking speed compared with the MRFO and PSO. The tracking rate achieved was 0.66 S, 1.12 S, and 3.01 S for the ROA, MRFO, and PSO, respectively. Therefore, the results proved ROA superiority for MPPT solving in pattern 1, with higher capability for obtaining the GMPP with higher tracking efficiency and rate.

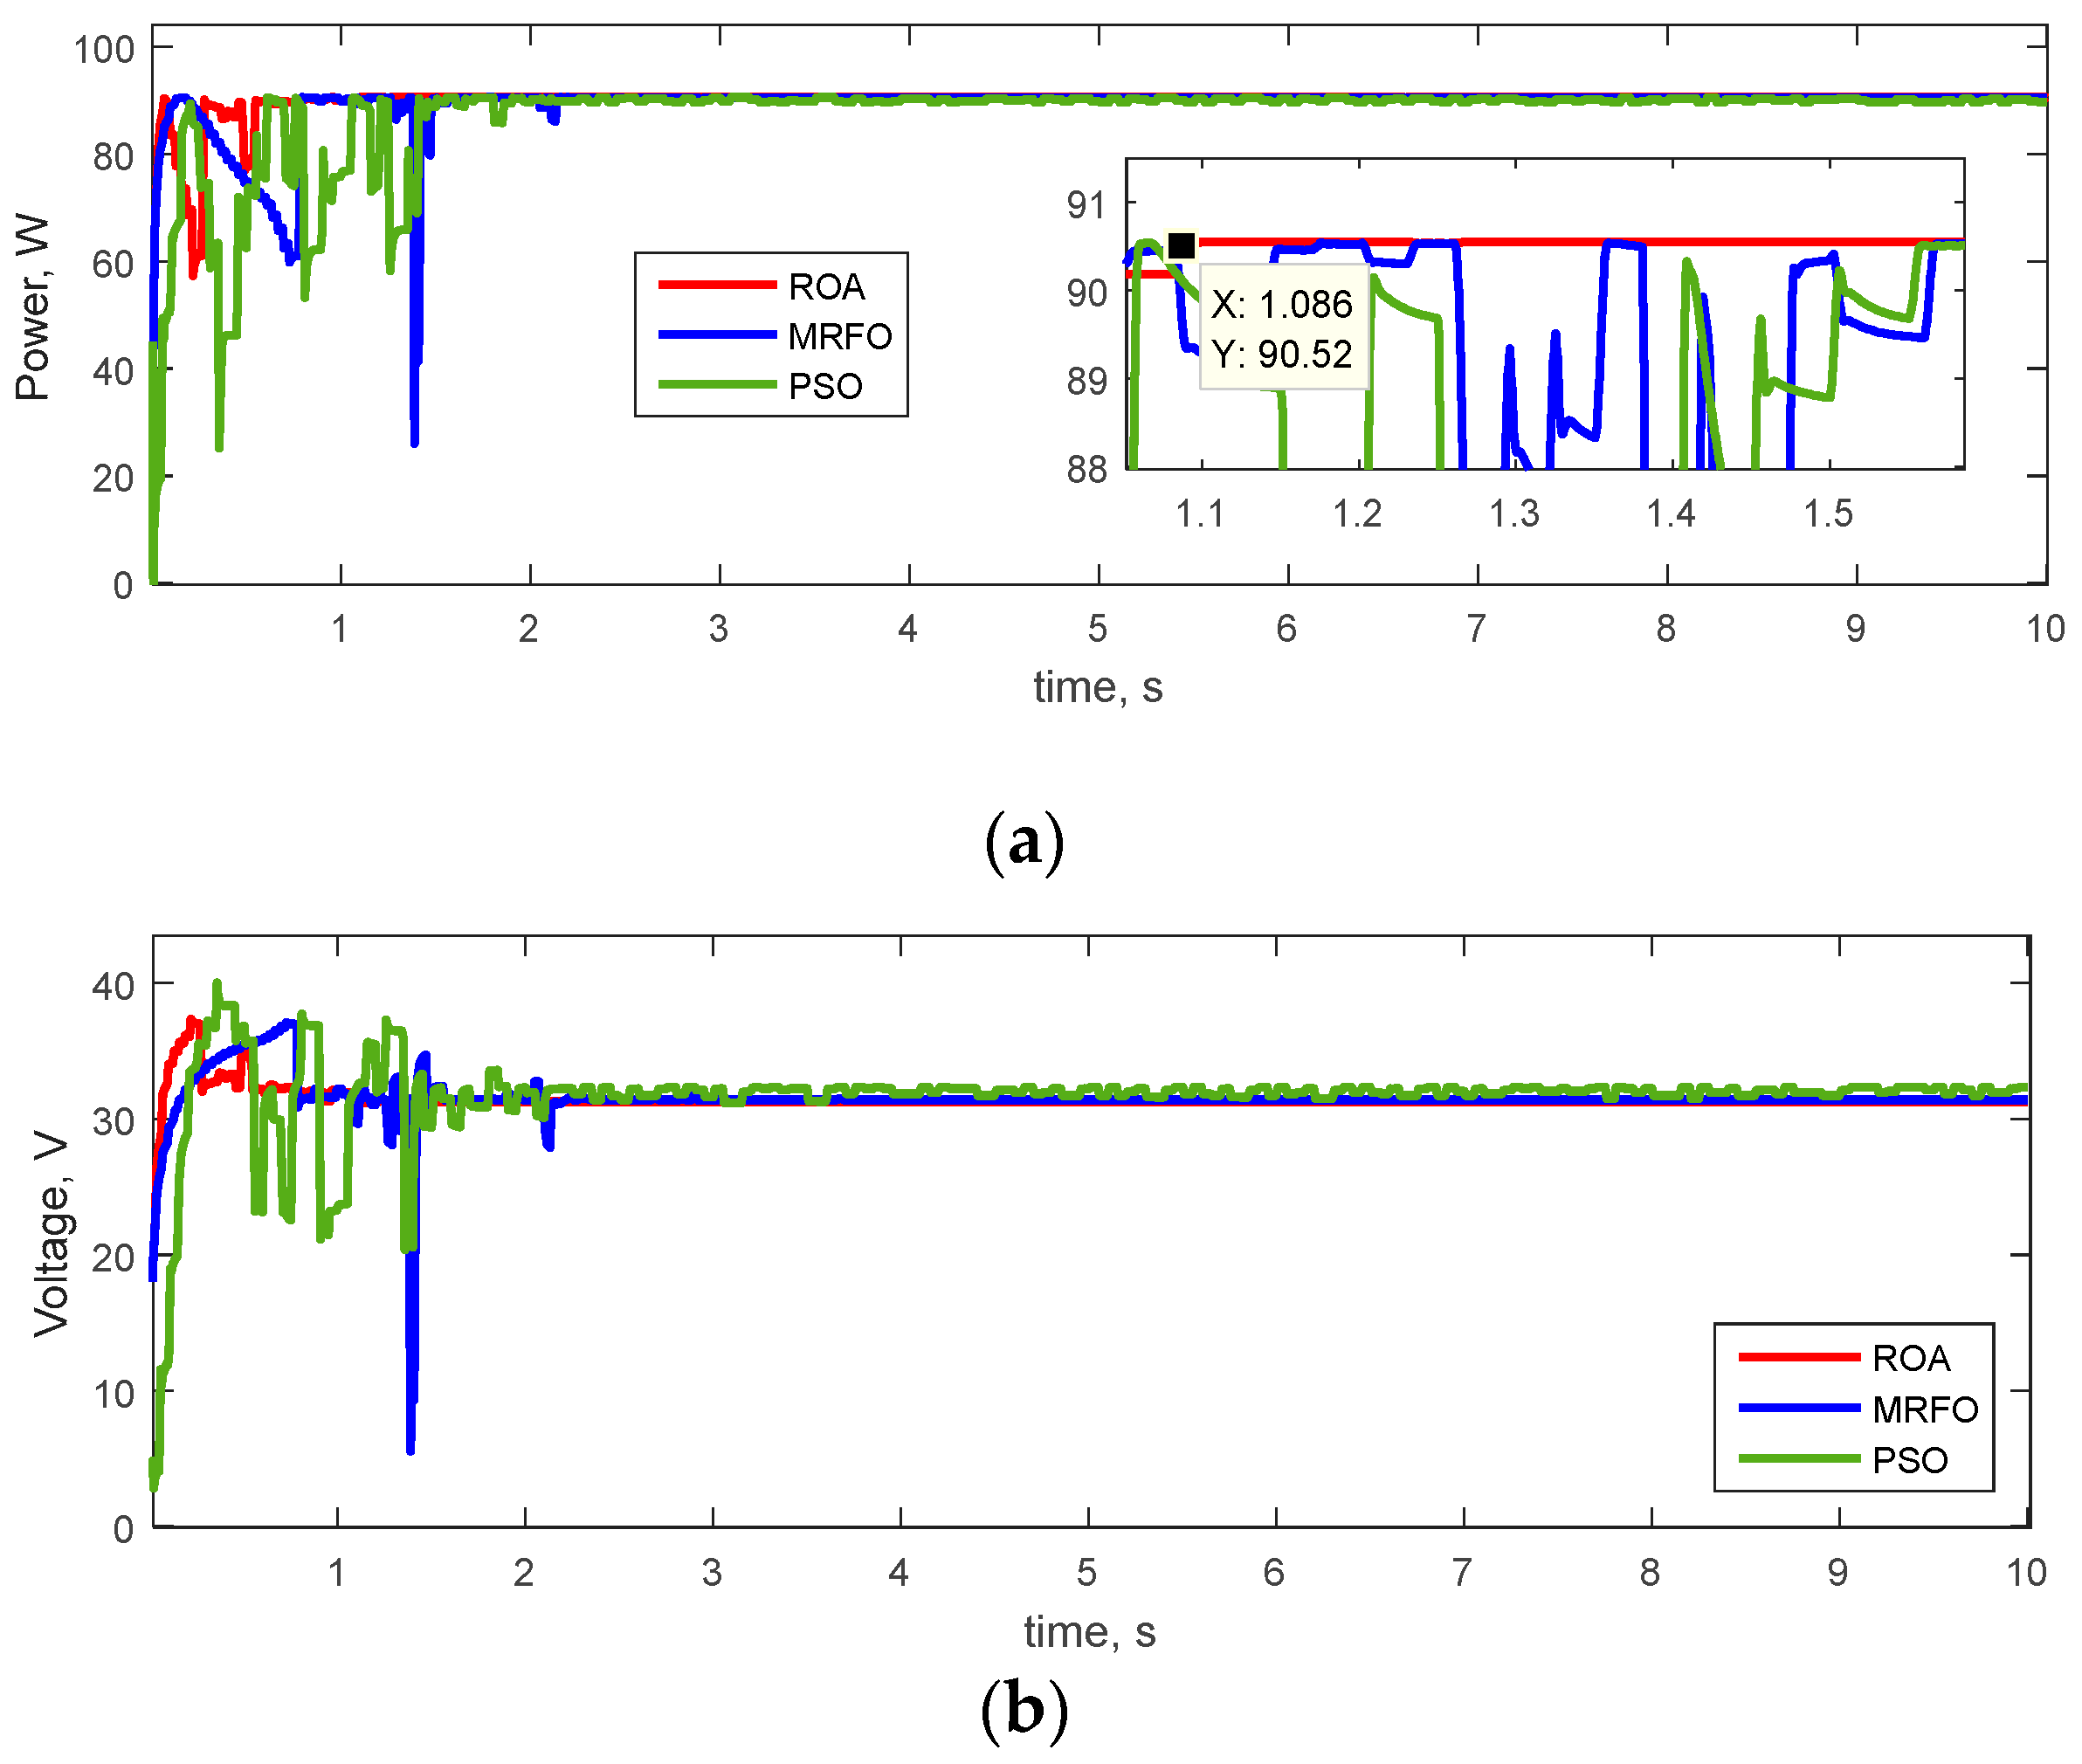
4.2. Results of Pattern 2

In this section, the results of ROA capability in MPPT solving in PSC in pattern 2 is presented and its capability is also compared with that of the PSO. The PV configuration is 2S, with radiations of 1000 and 700 W/m2. Curves for the power, voltage, and current of PV system as well as the duty cycle in MPPT solving are illustrated in Figure 10. Furthermore, ROA performance is compared with the MRFO and PSO methods in these figures. The maximum extracted power of the PV system obtained in pattern 2 were 90.52 W, 90.47 W, and 99.45 W from a GMP equal to 90.54 W using the ROA, MRFO, and PSO methods, respectively. These figures demonstrate that the ROA has better capability in obtaining more PV power with less steady-state fluctuations, and more tracking efficiency and speed than the MRFO and PSO. Thus, the ROA is superior to the MRFO and PSO in MPPT solving in pattern 2, in partial shading condition with higher global power.
In Table 5, the numerical results of ROA implementation in pattern 2 solving in terms of PV output power, tracking efficiency, and speed for different methods are presented and also compared with the MRFO and PSO. In Table 5, the tracking efficiency of the ROA, MRFO, and PSO are given as 99.97%, 99.92%, and 99.90%, and the tracking rate is at 1.08 S, 2.25 S, and 2.78 S, respectively. These prove the superior capability of the ROA in MPPT solving in pattern 2, and in achieving more power and efficiency with a better tracking rate. Therefore, the proposed ROA is more efficient compared to the MRFO and PSO.

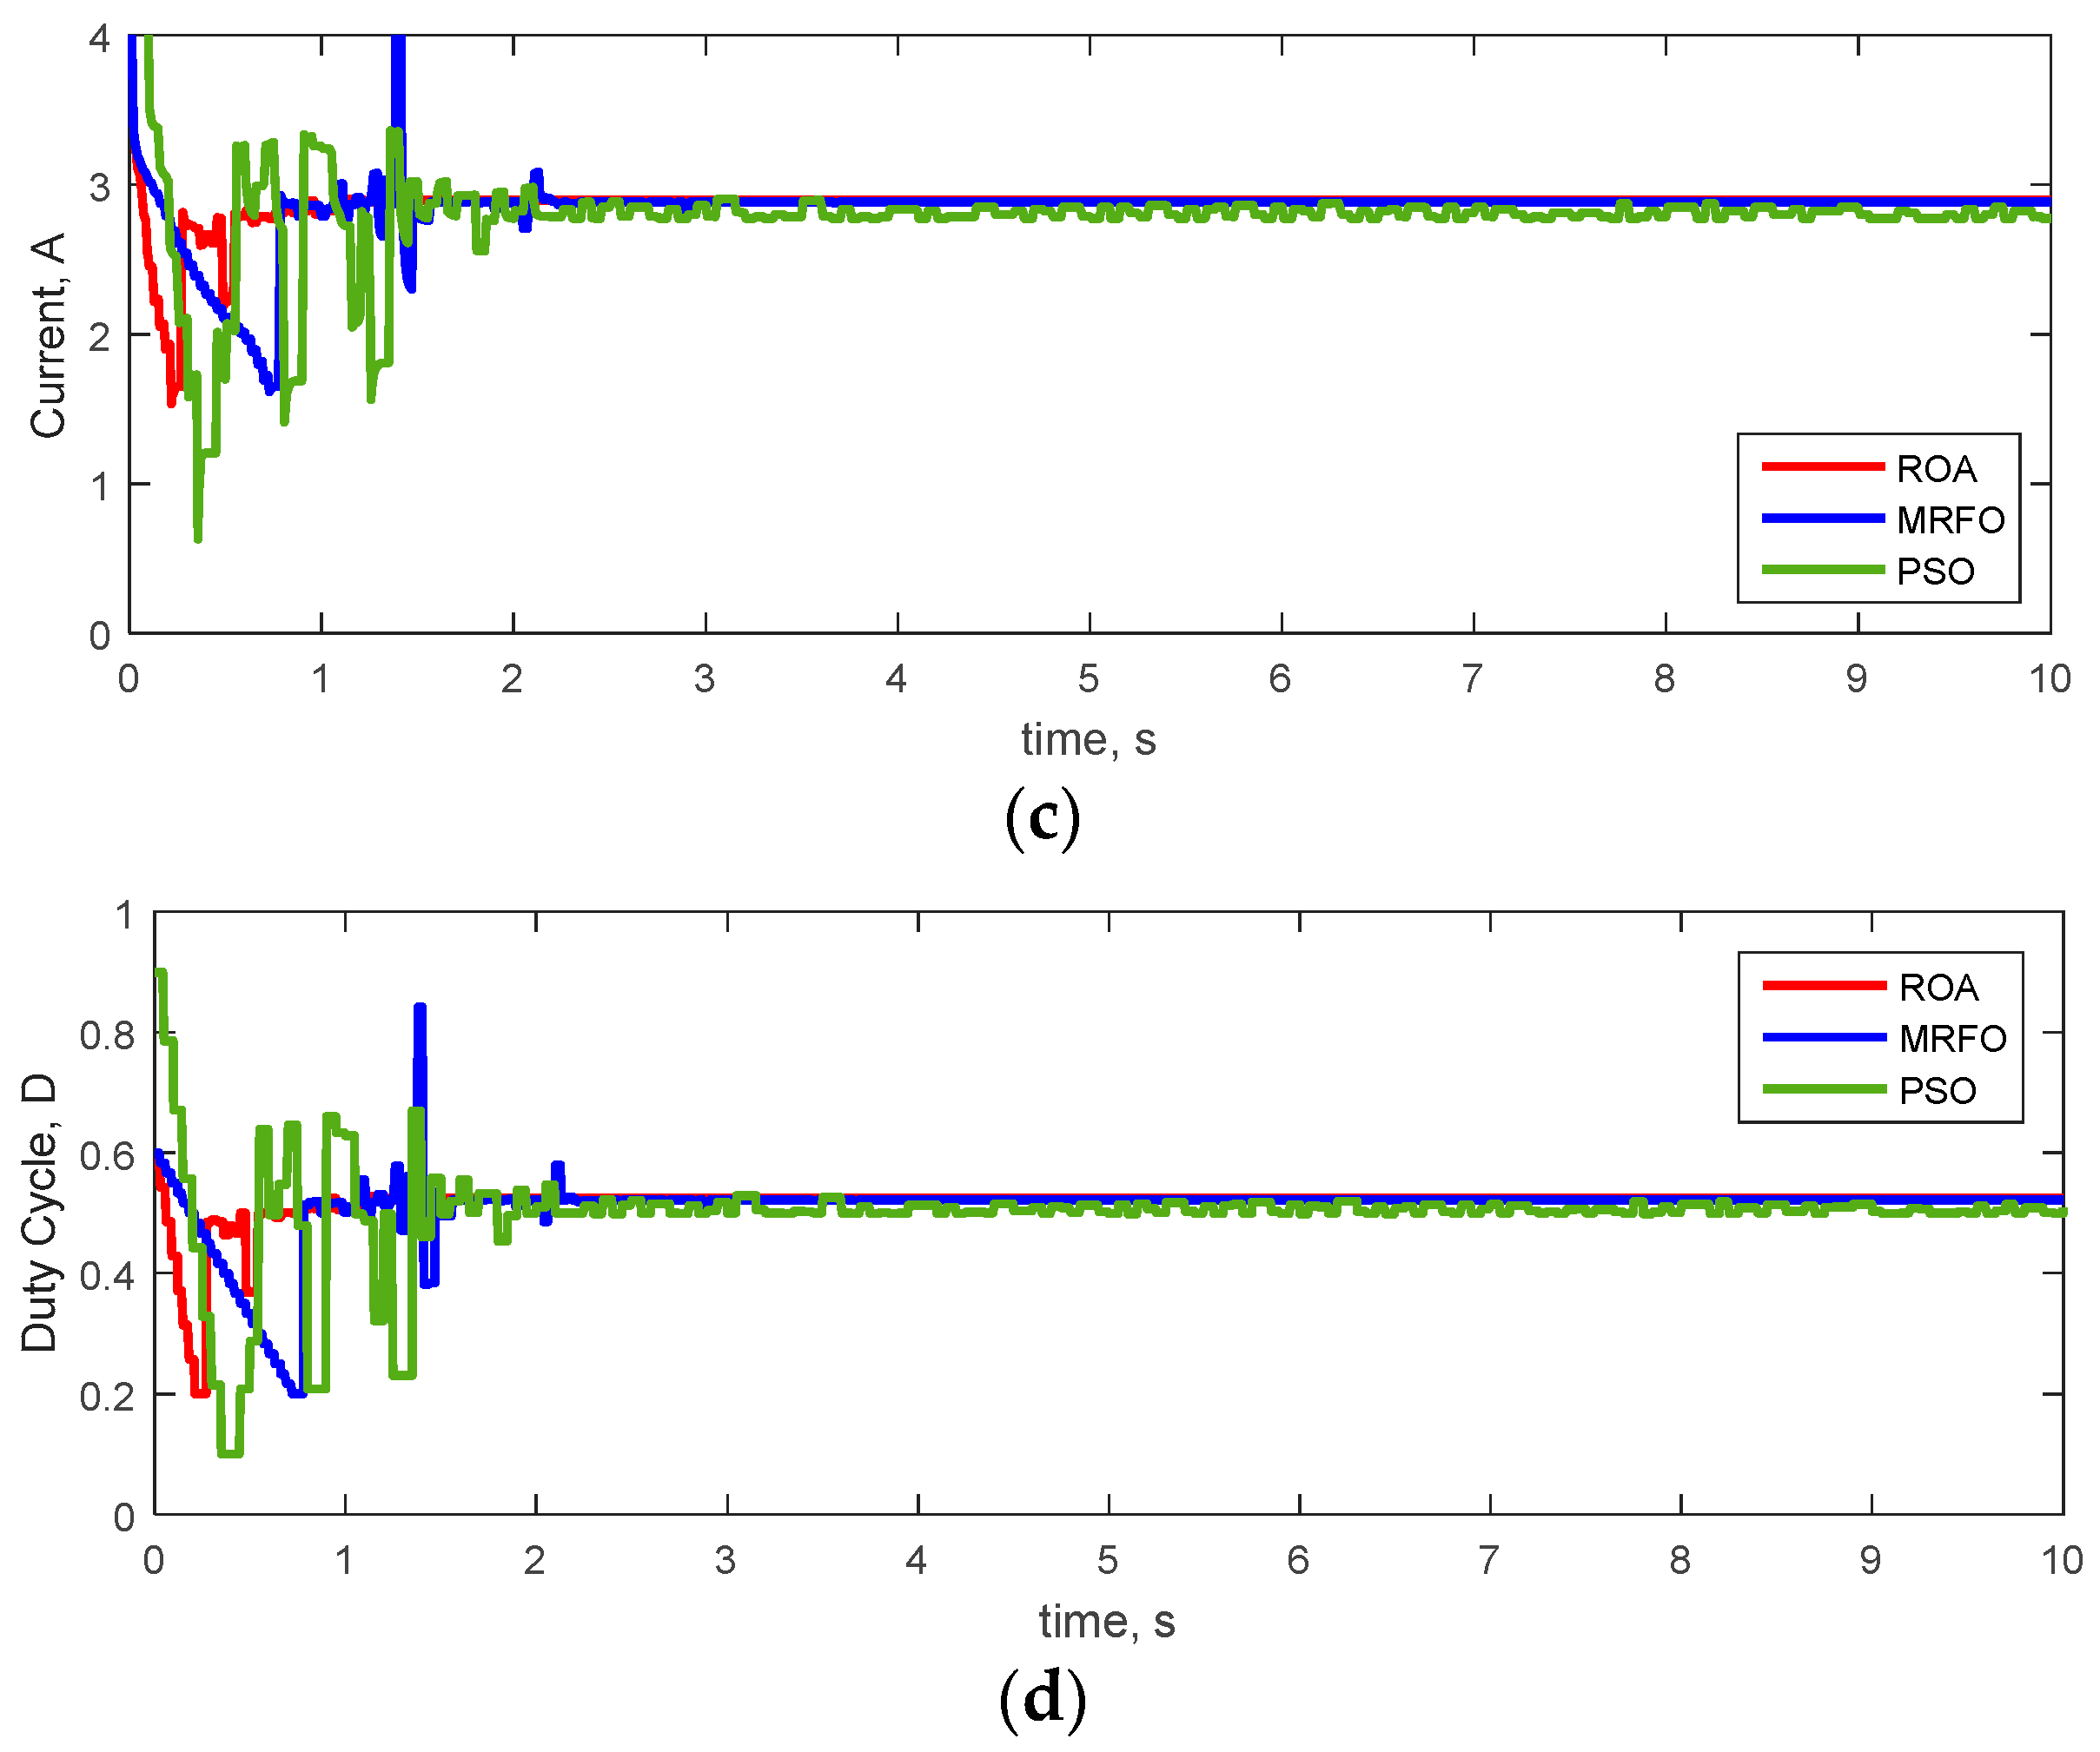
4.3. Results of Pattern 3

In this section, the PSC condition with non-uniform radiation values of 900 and 600 W/m2 (Pattern 3) for the 2S PV configuration is considered to evaluate the ROA’s ability to obtain the GMPP and also the results compared with the MRFO and PSO in this pattern. Changing the PV power, voltage, and current and also the converter duty cycle in tracking process are demonstrated in Figure 11. The GMPP in this pattern is equal to 79.72 W. The obtained results show that the extracted power using the ROA, MRFO, and PSO are 79.69 W, 79.65 W, and 79.61 W, respectively. Figure 11 confirmed the better capability of the ROA in achieving GMPP with lower fluctuations and more tracking efficiency and speed in comparison with the MRFO and PSO. Hence, the ROA is a competitive method with lower control parameters compared to the MRFO and PSO in MPPT solving.
The numerical results of ROA application for tracking the PV system’s GMPP in pattern 3 is presented in Table 6. As shown, the ROA is achieved to maximum power, with a tracking efficiency equal to 99.96%; the values obtained for the MRFO and PSO methods are 99.91% and 99.86%. Furthermore, the results clarify that the ROA is a fast tracking method in comparison with the MRFO and PSO in achieving the PV maximum power. The ROA reached the GMPP in 0.90 S, but the MRFO and PSO obtained this point in 2.20 S and 3.10 S. Thus, the results confirm the better capability of the ROA in comparison with the MRFO and PSO in terms of higher tracking efficiency and rate.

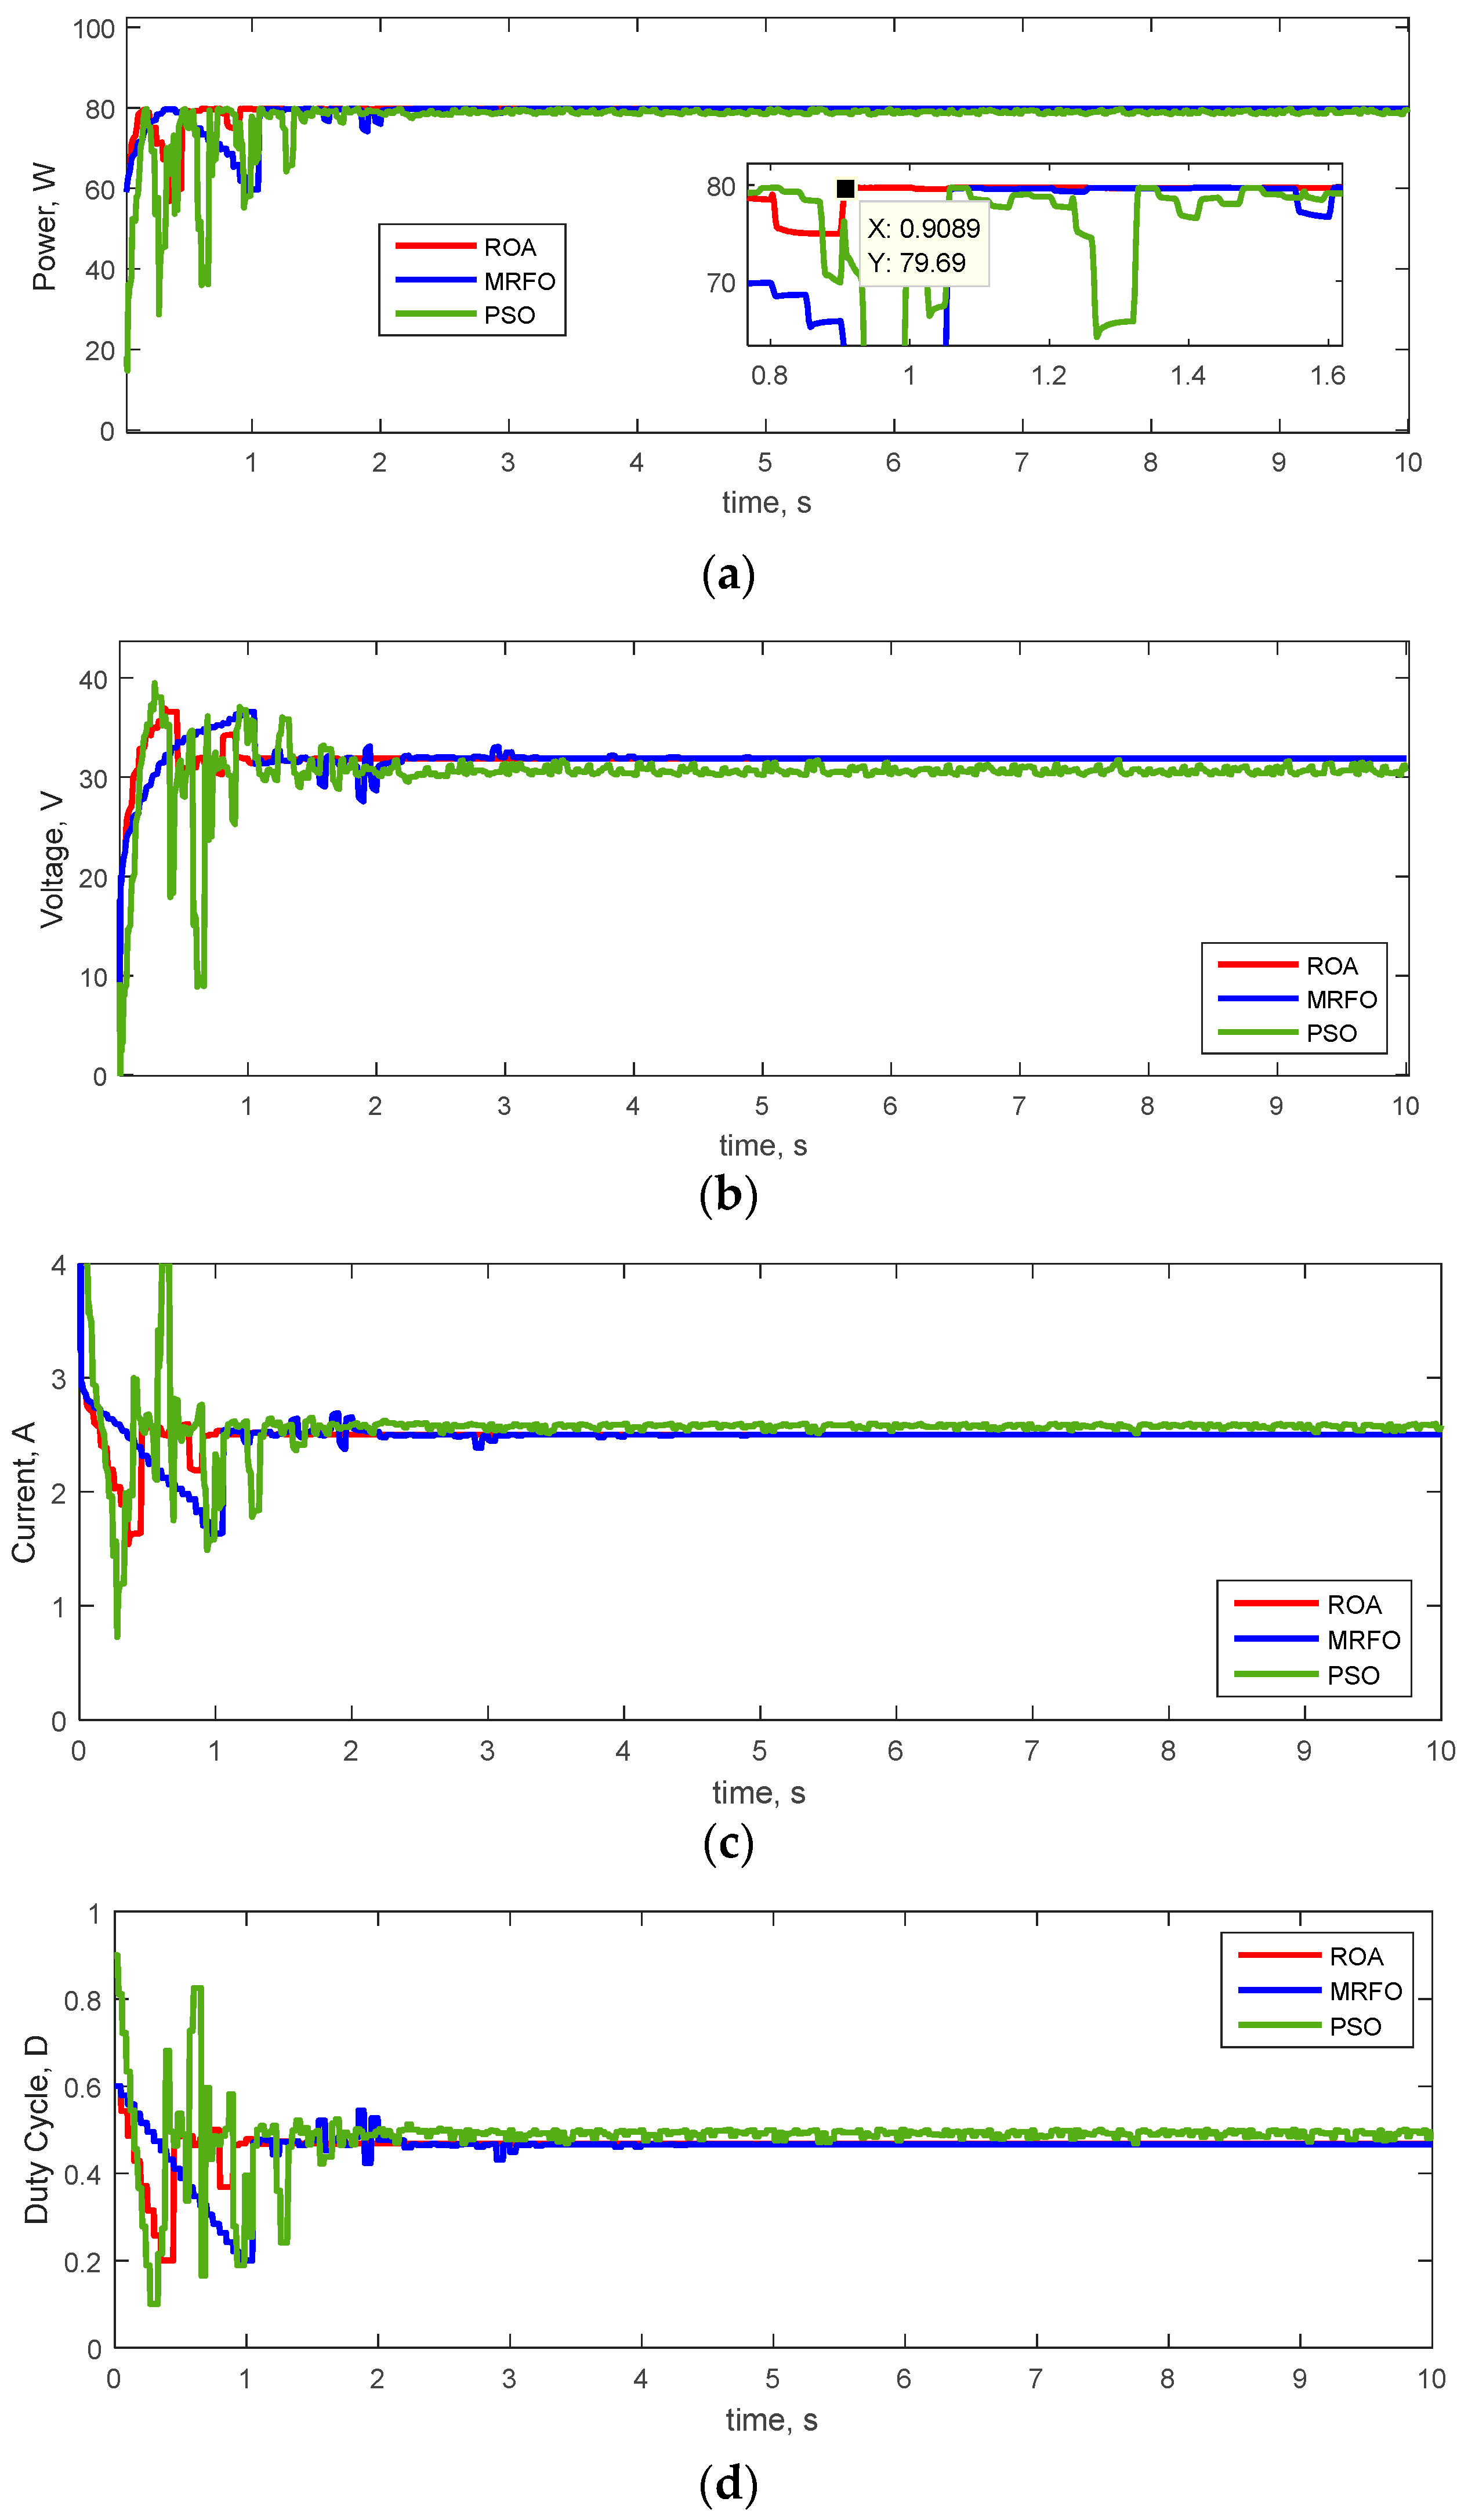
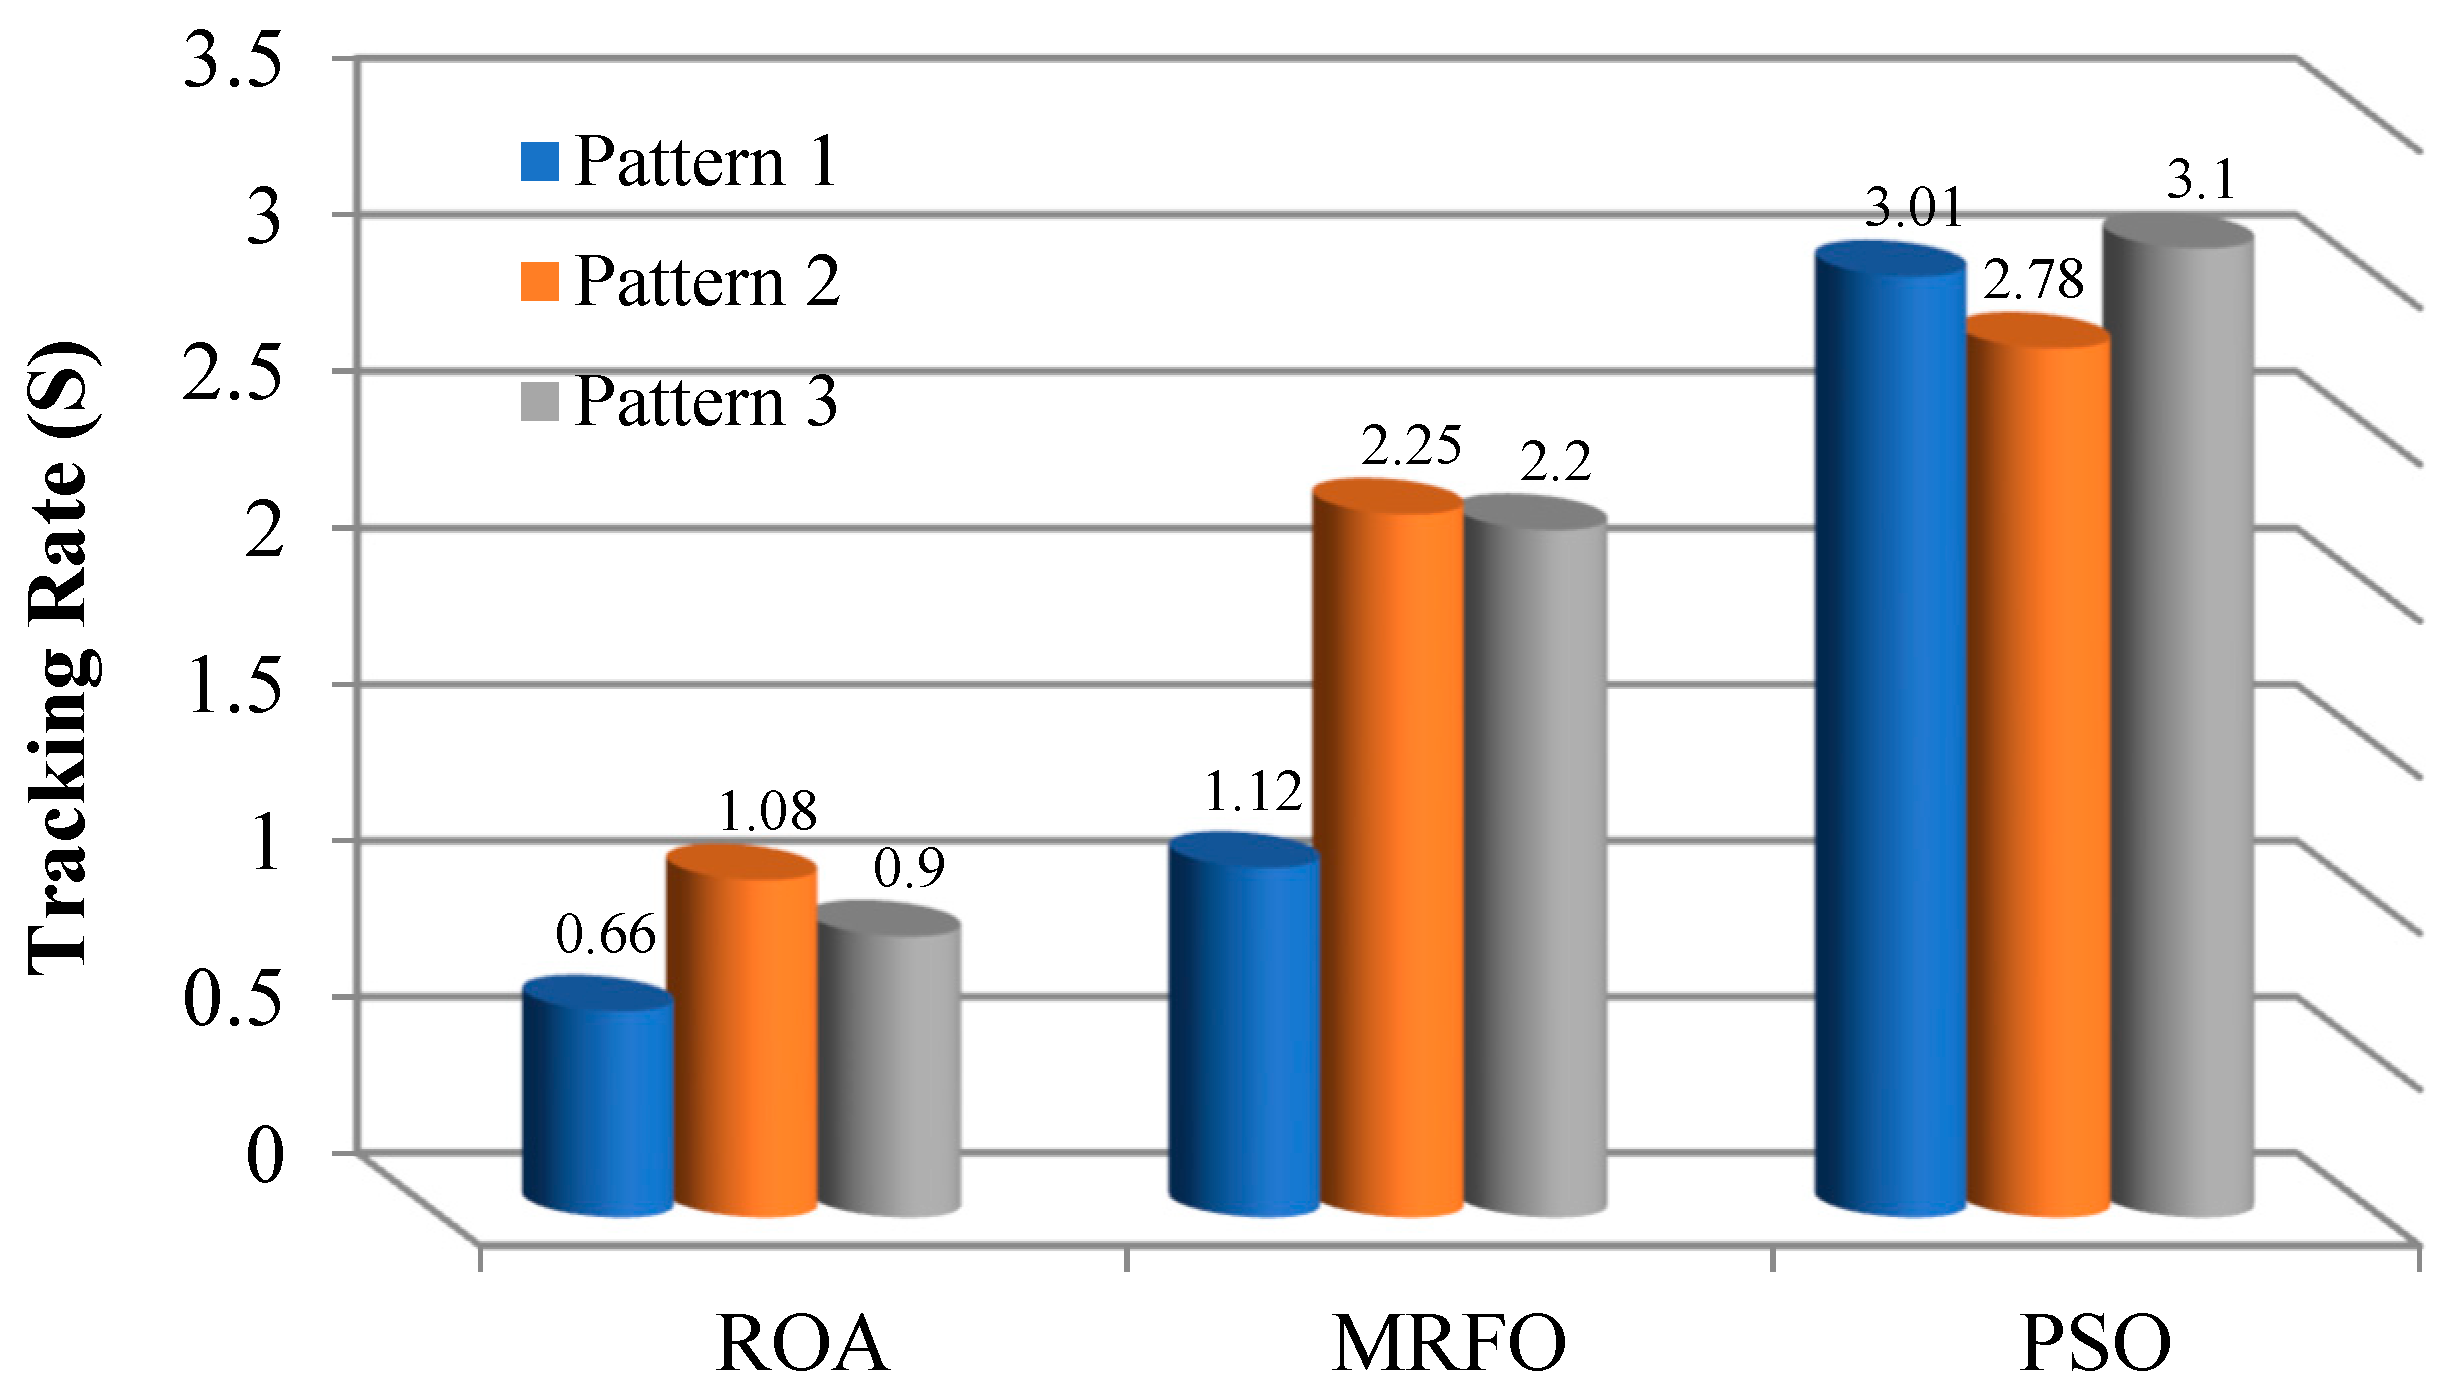
4.4. Results Comparison of Patterns 1–3

The results of MPPT solving based on the ROA, MRFO, and PSO methods in STC and PSC conditions in three patterns are compared in view of tracking efficiency and rate in Figure 12 and Figure 13, respectively. The main findings are presented as follows:
  • The implementation of the ROA in MPPT solving is easy, its complexity is low, and it is also not trapped in the local optimal solution.
  • The ROA achieved global power in all patterns with desirable exploration power.
  • The ROA extracted more PV maximum power in all patterns than the MRFO and PSO methods. The PSO algorithm is an optimization method that may be involved in premature convergence and trapped with a local optimal solution in solving the optimization problem. The random selection of reference points in the early iterations weakens the exploitation capability of MRFO. Furthermore, hain foraging tends to lead the algorithm into local optimum. However, the ROA has high exploitative, exploratory, and local optimal avoidance capabilities. Therefore, these cases increase the accuracy of tracking and reduce state steady errors in a shorter time than other methods. The above cases are the reasons for the superiority of the ROA over other methods.
  • The ROA with highly competitive capability has been able to solve the PV MPPT problem for different patterns with higher efficiency and tracking rate.

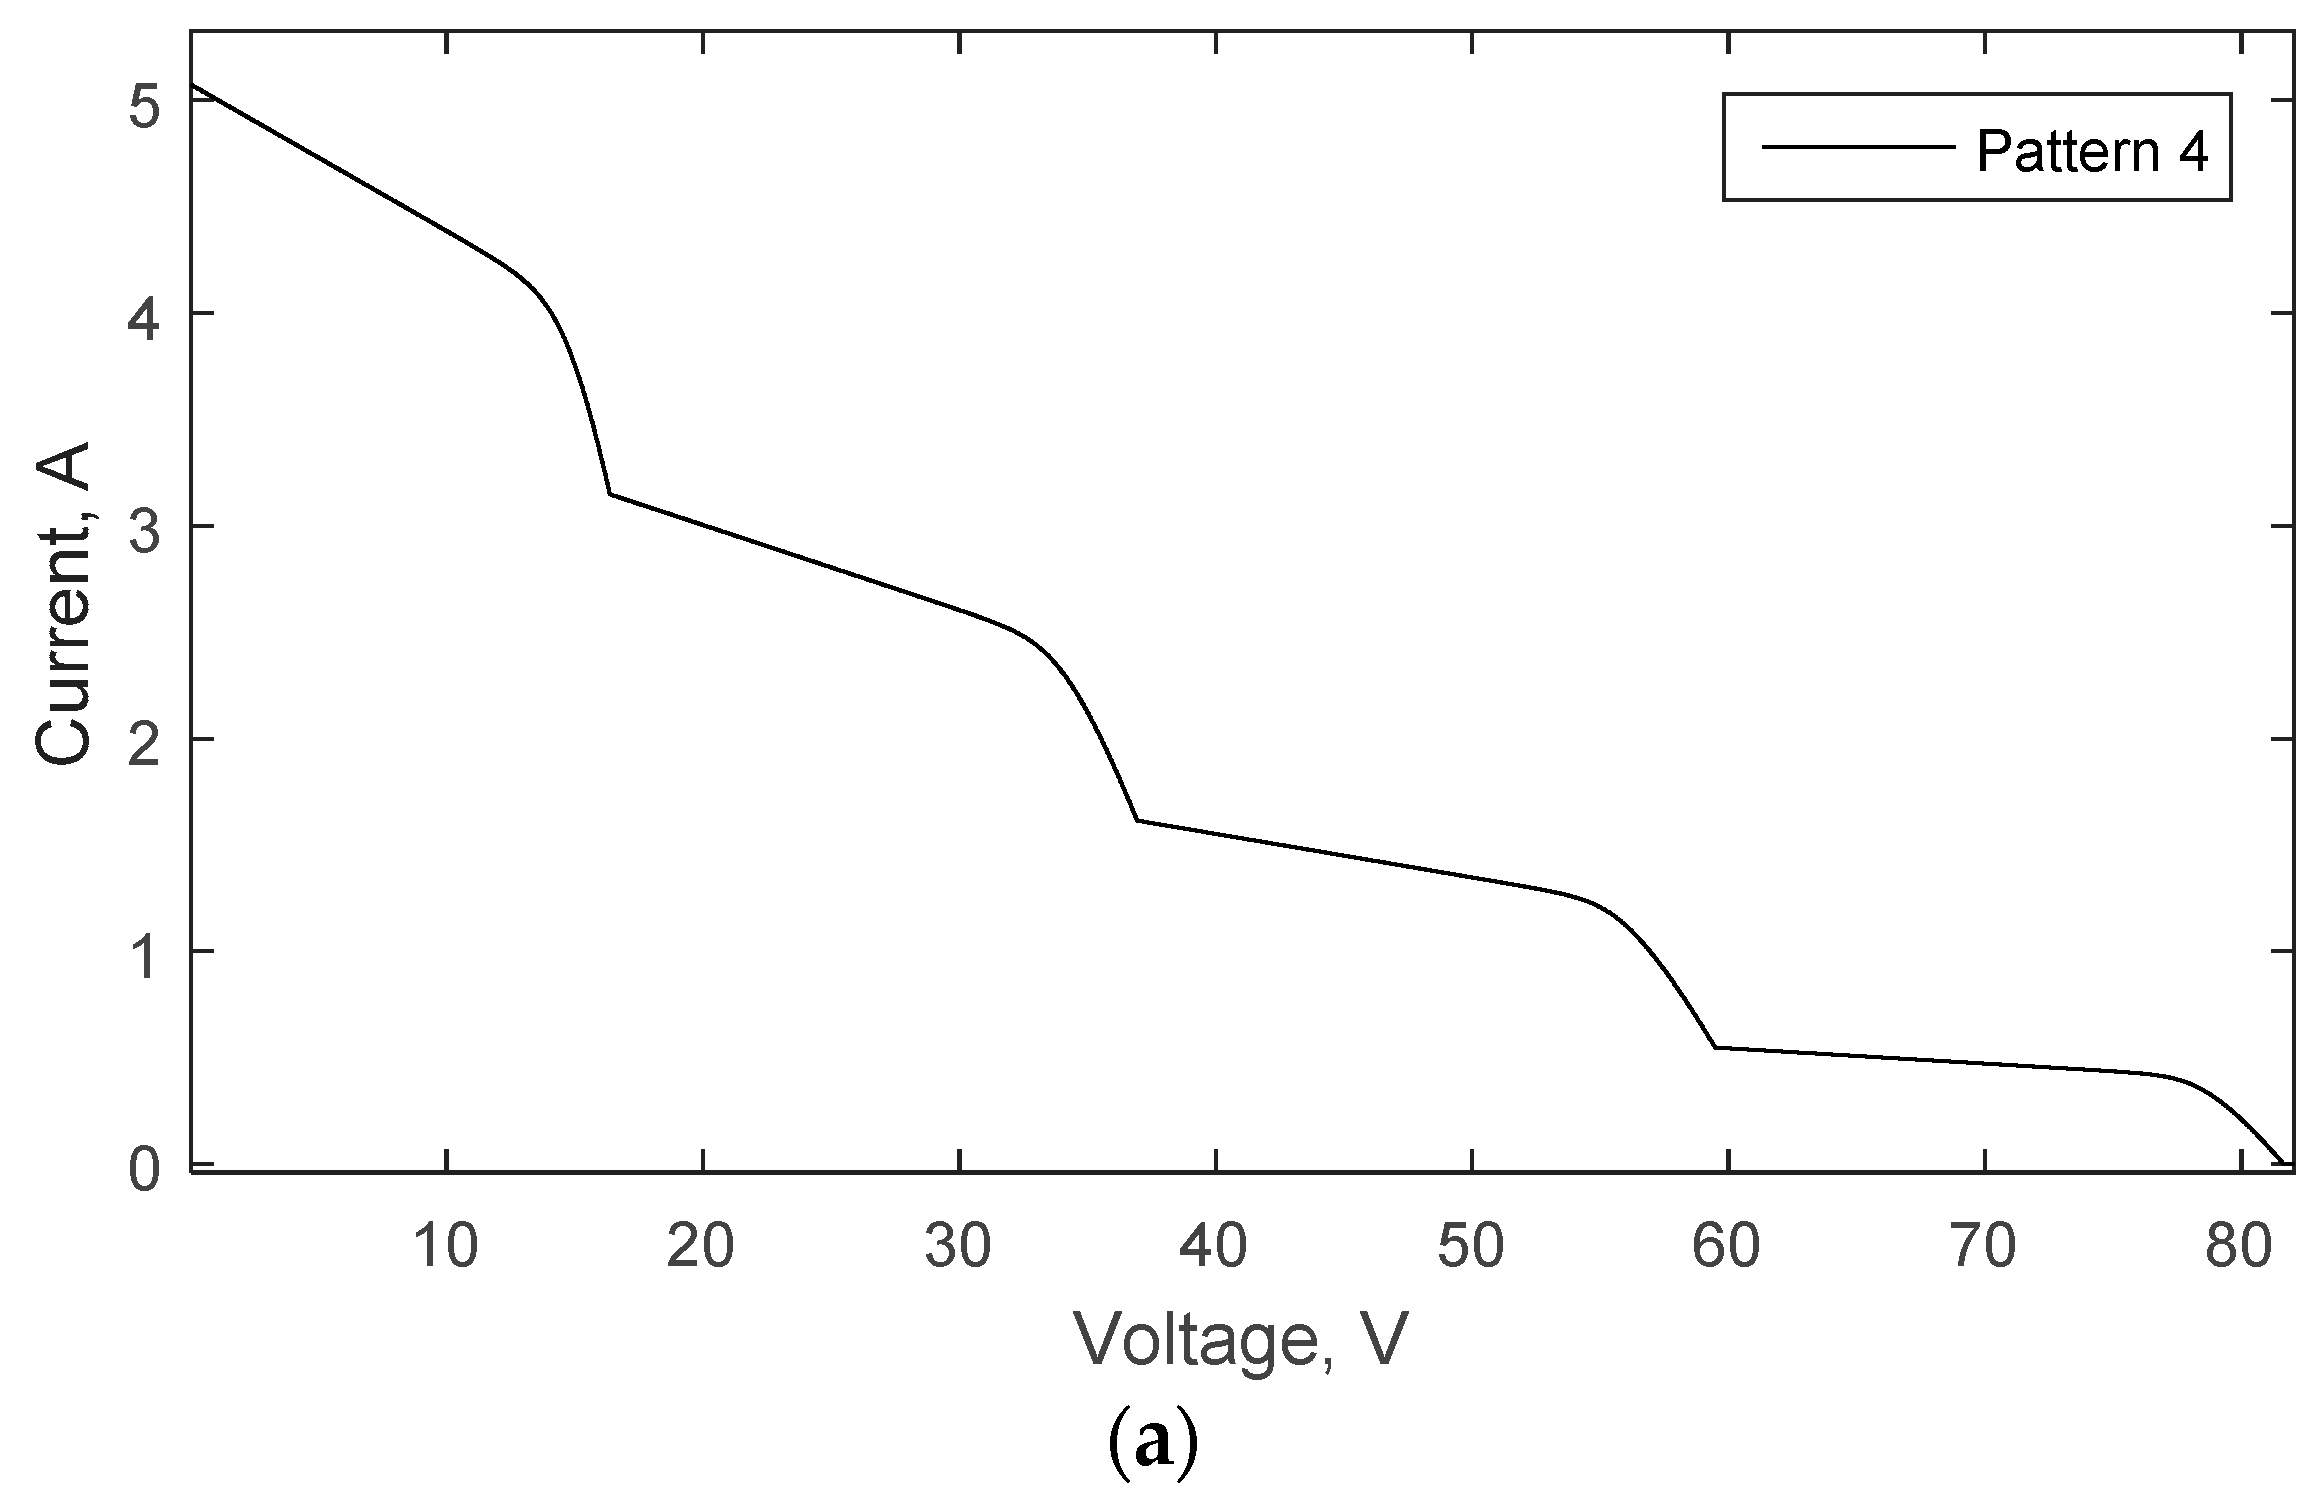
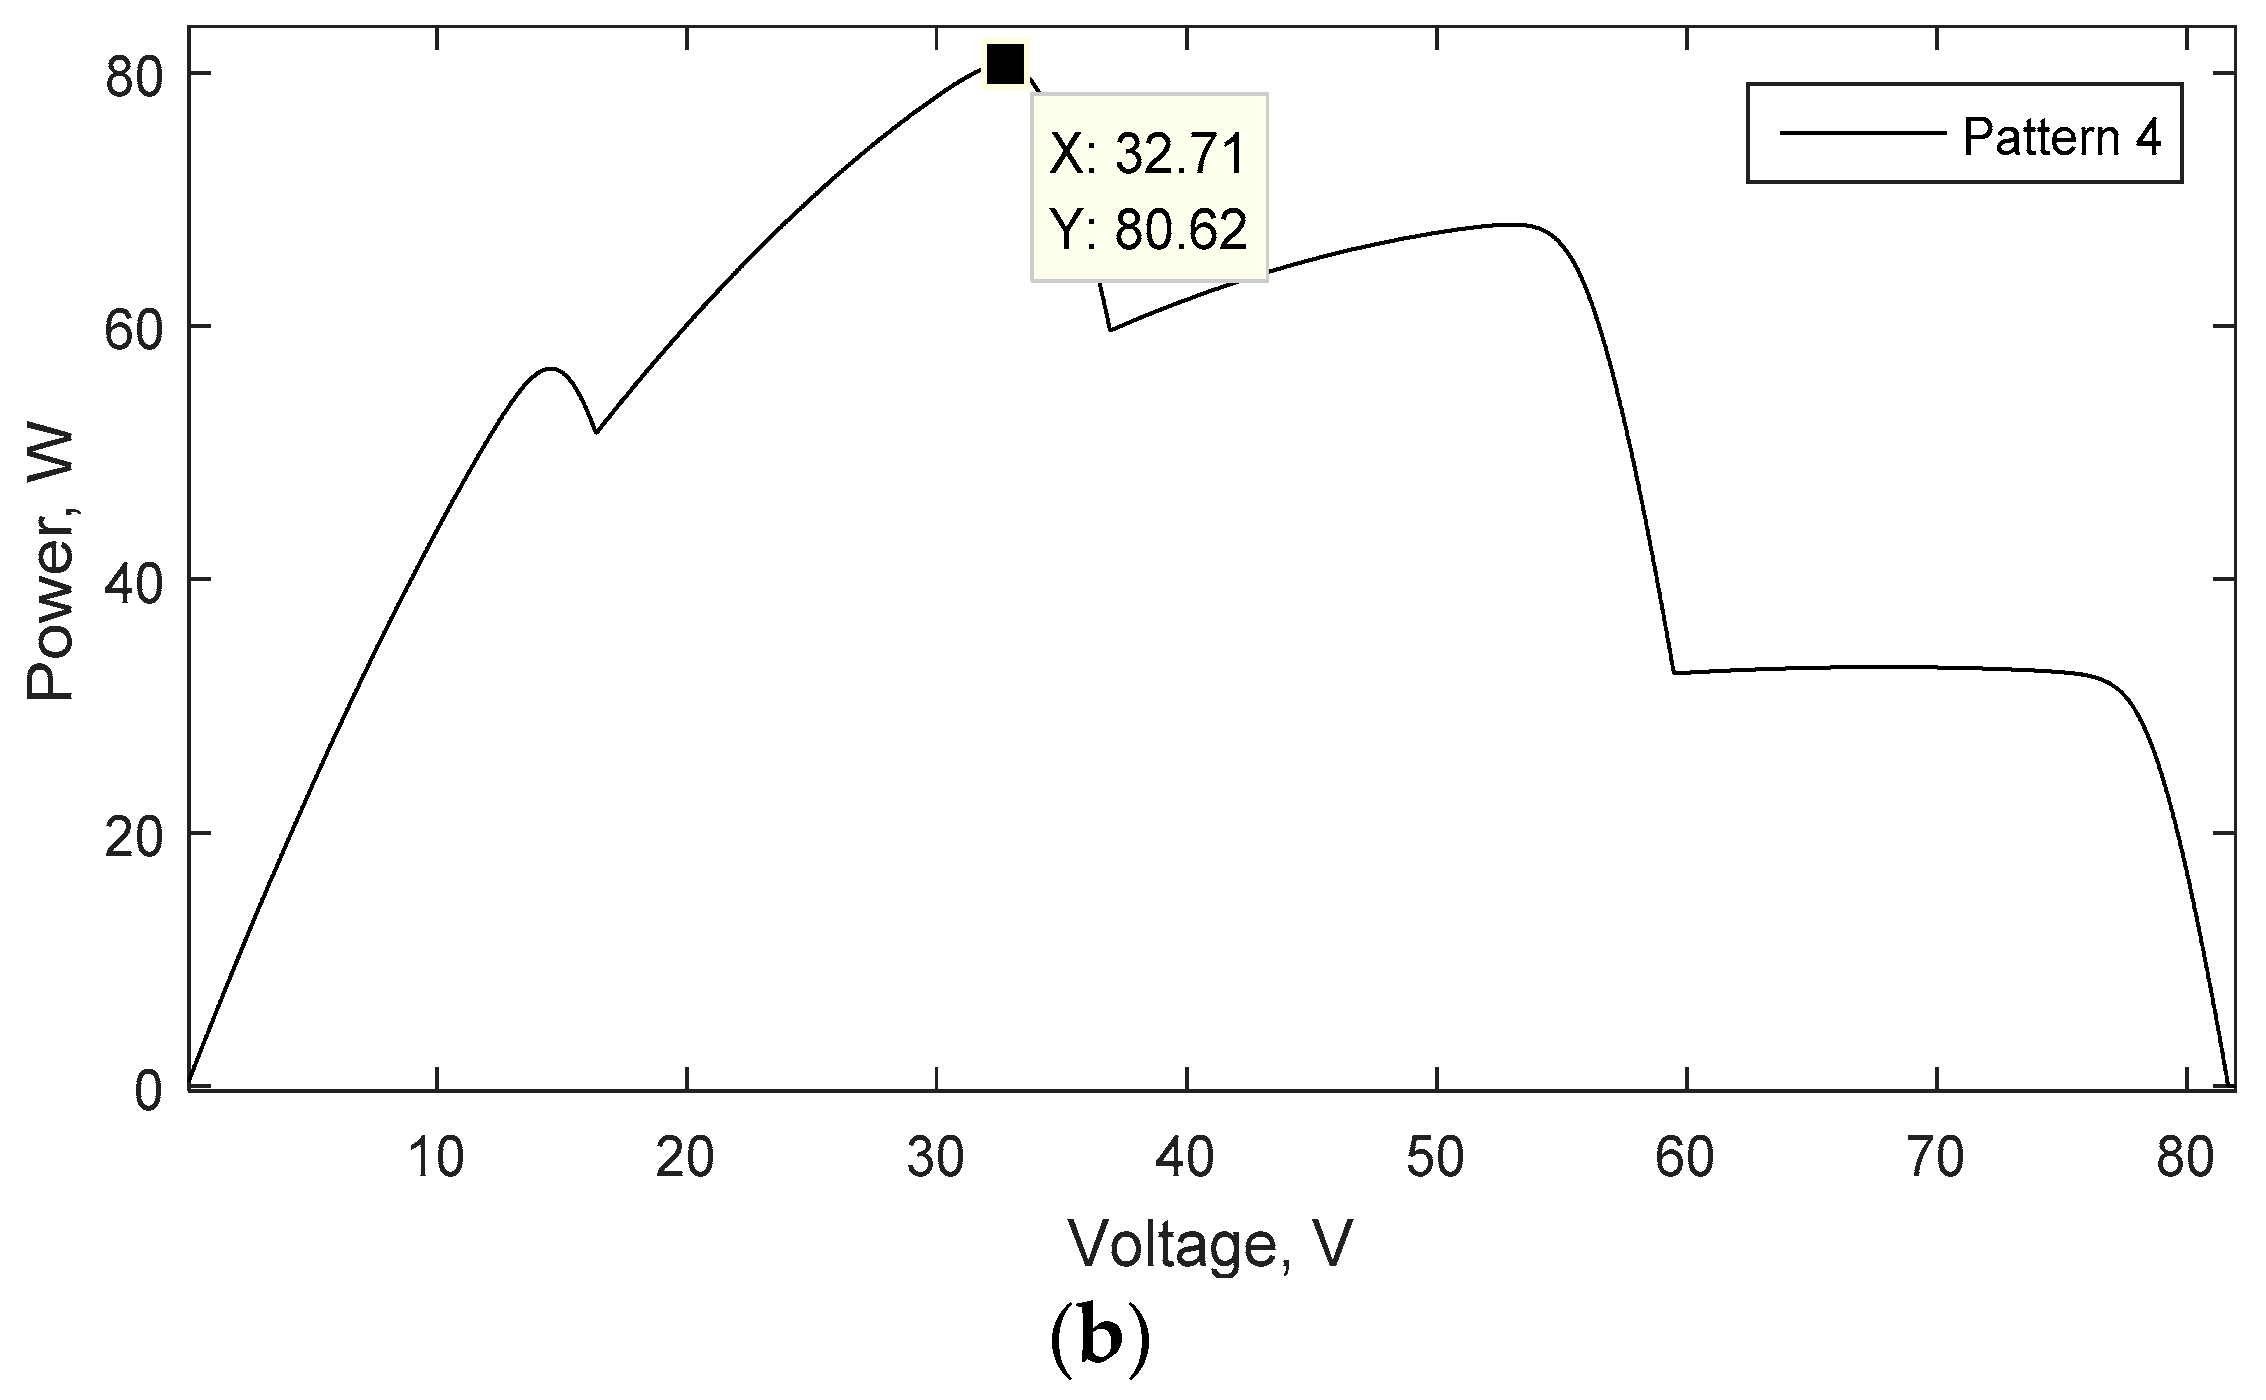
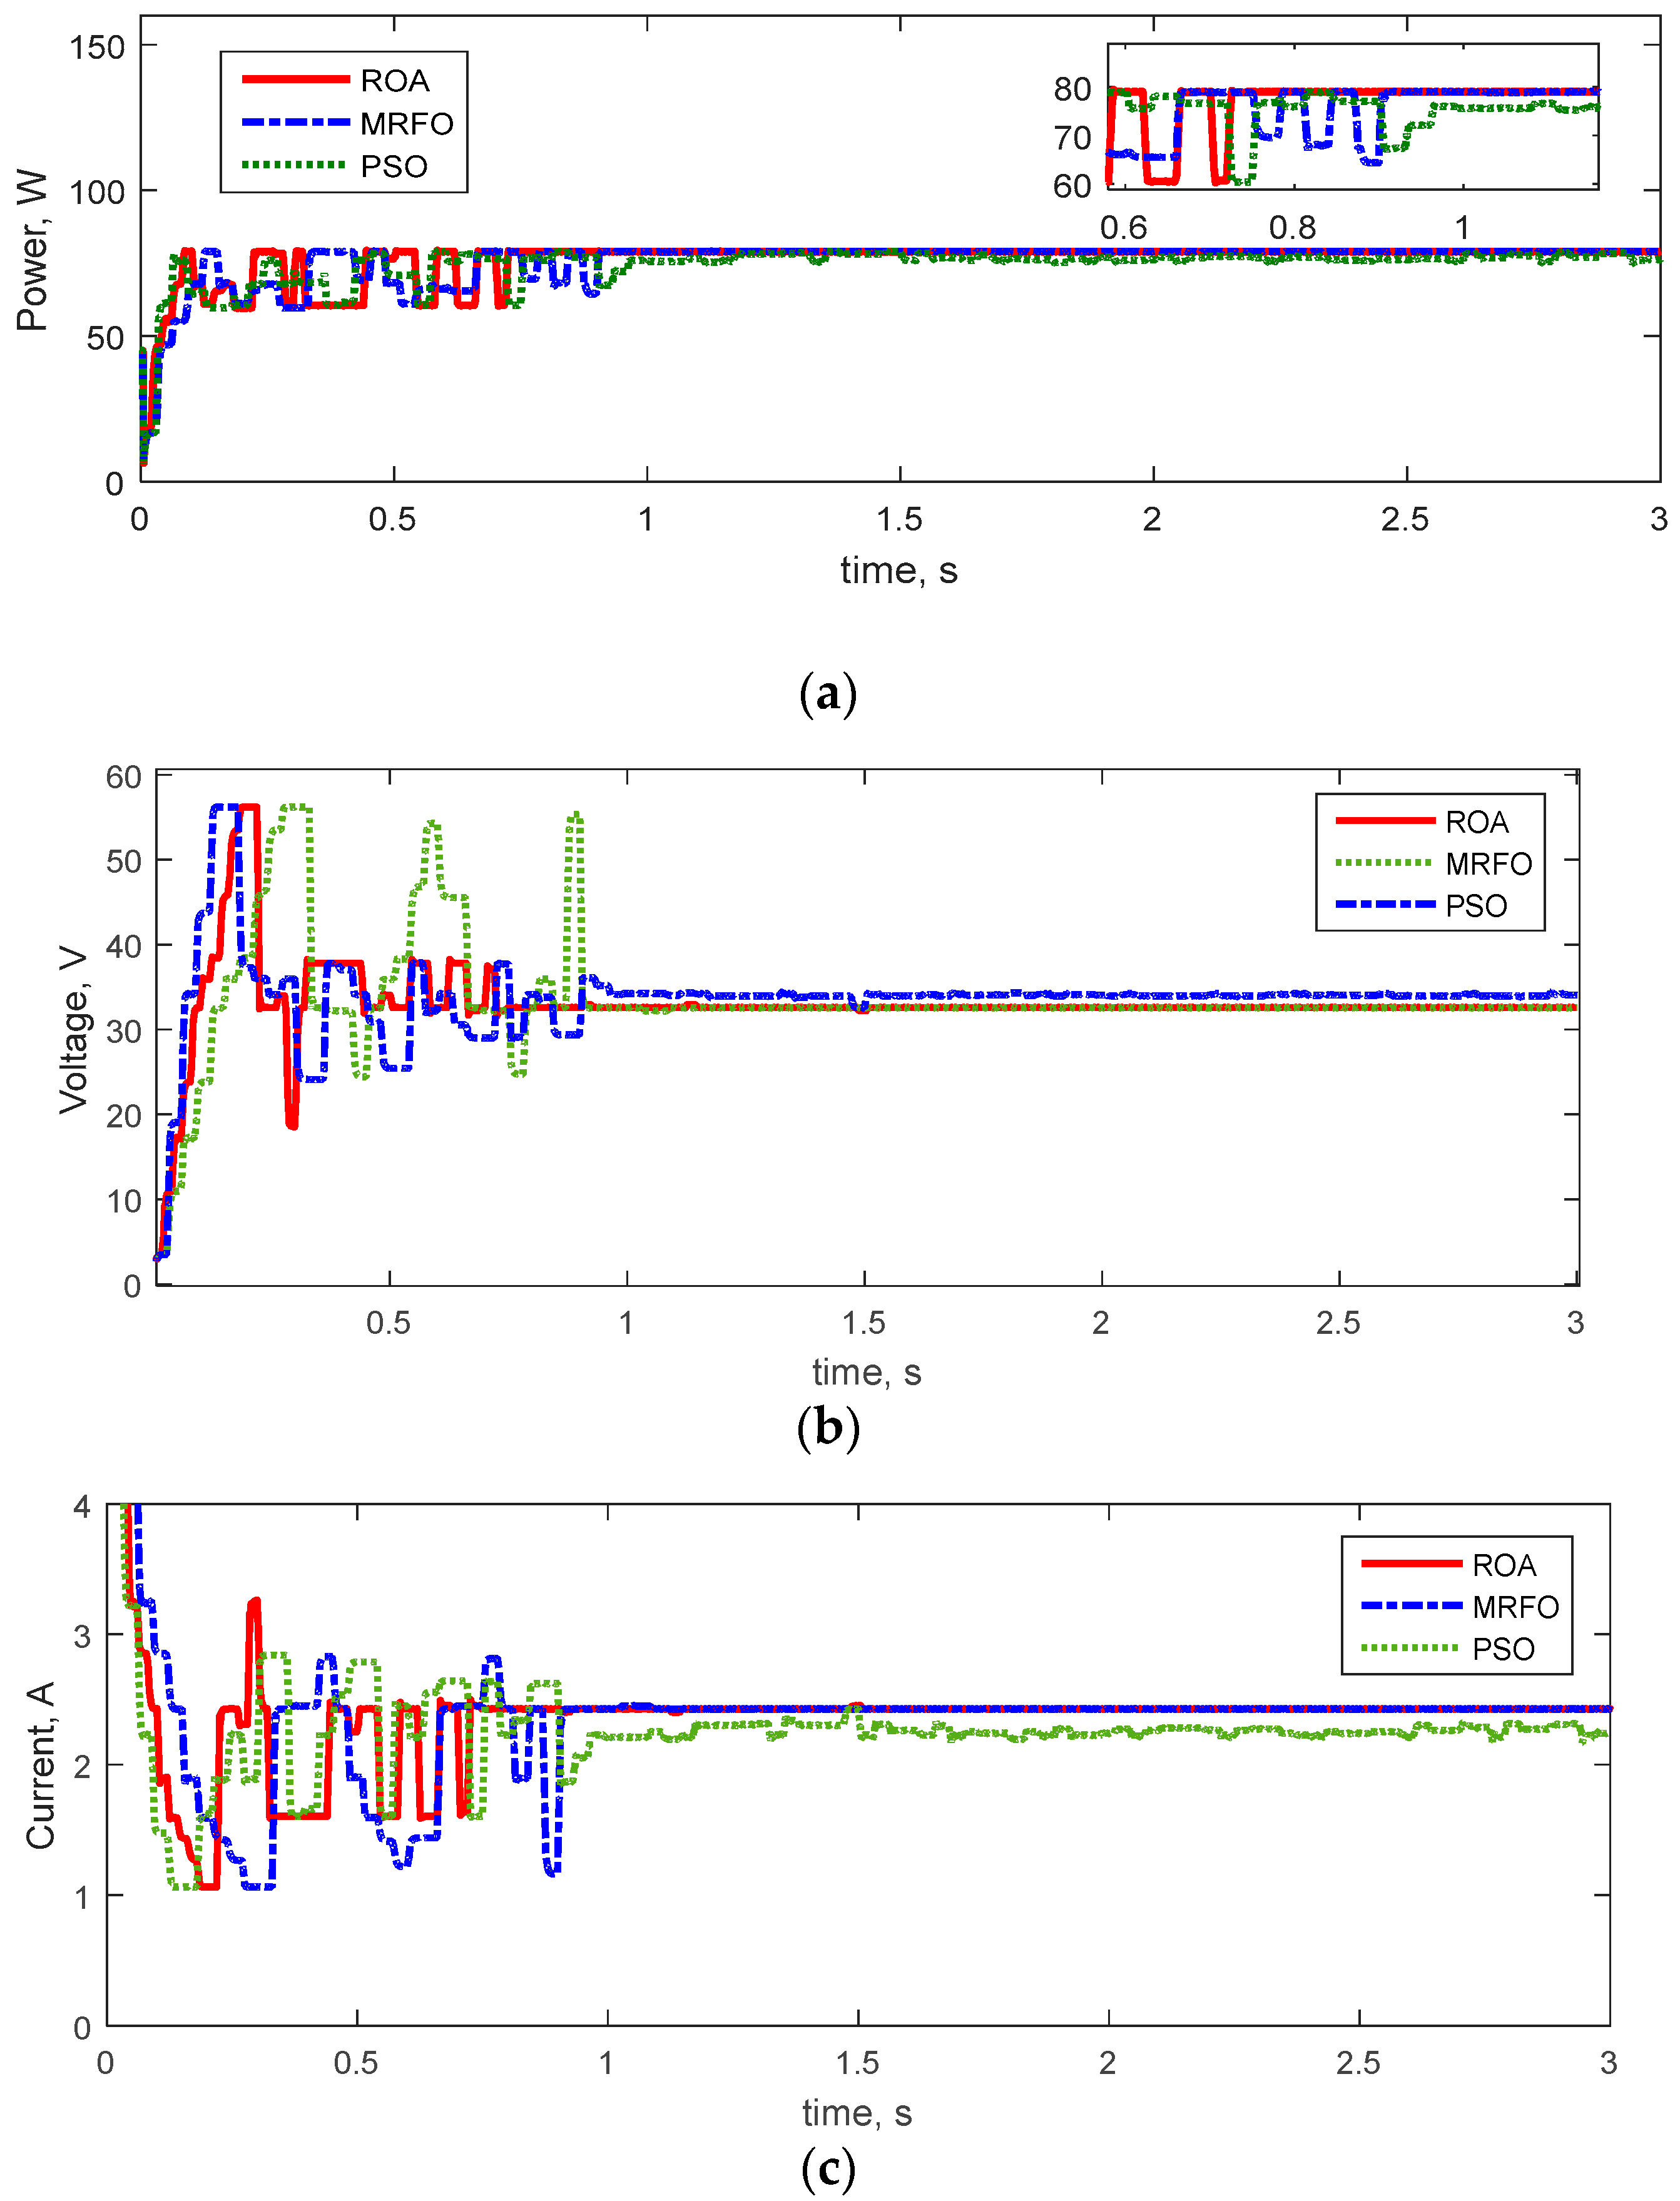
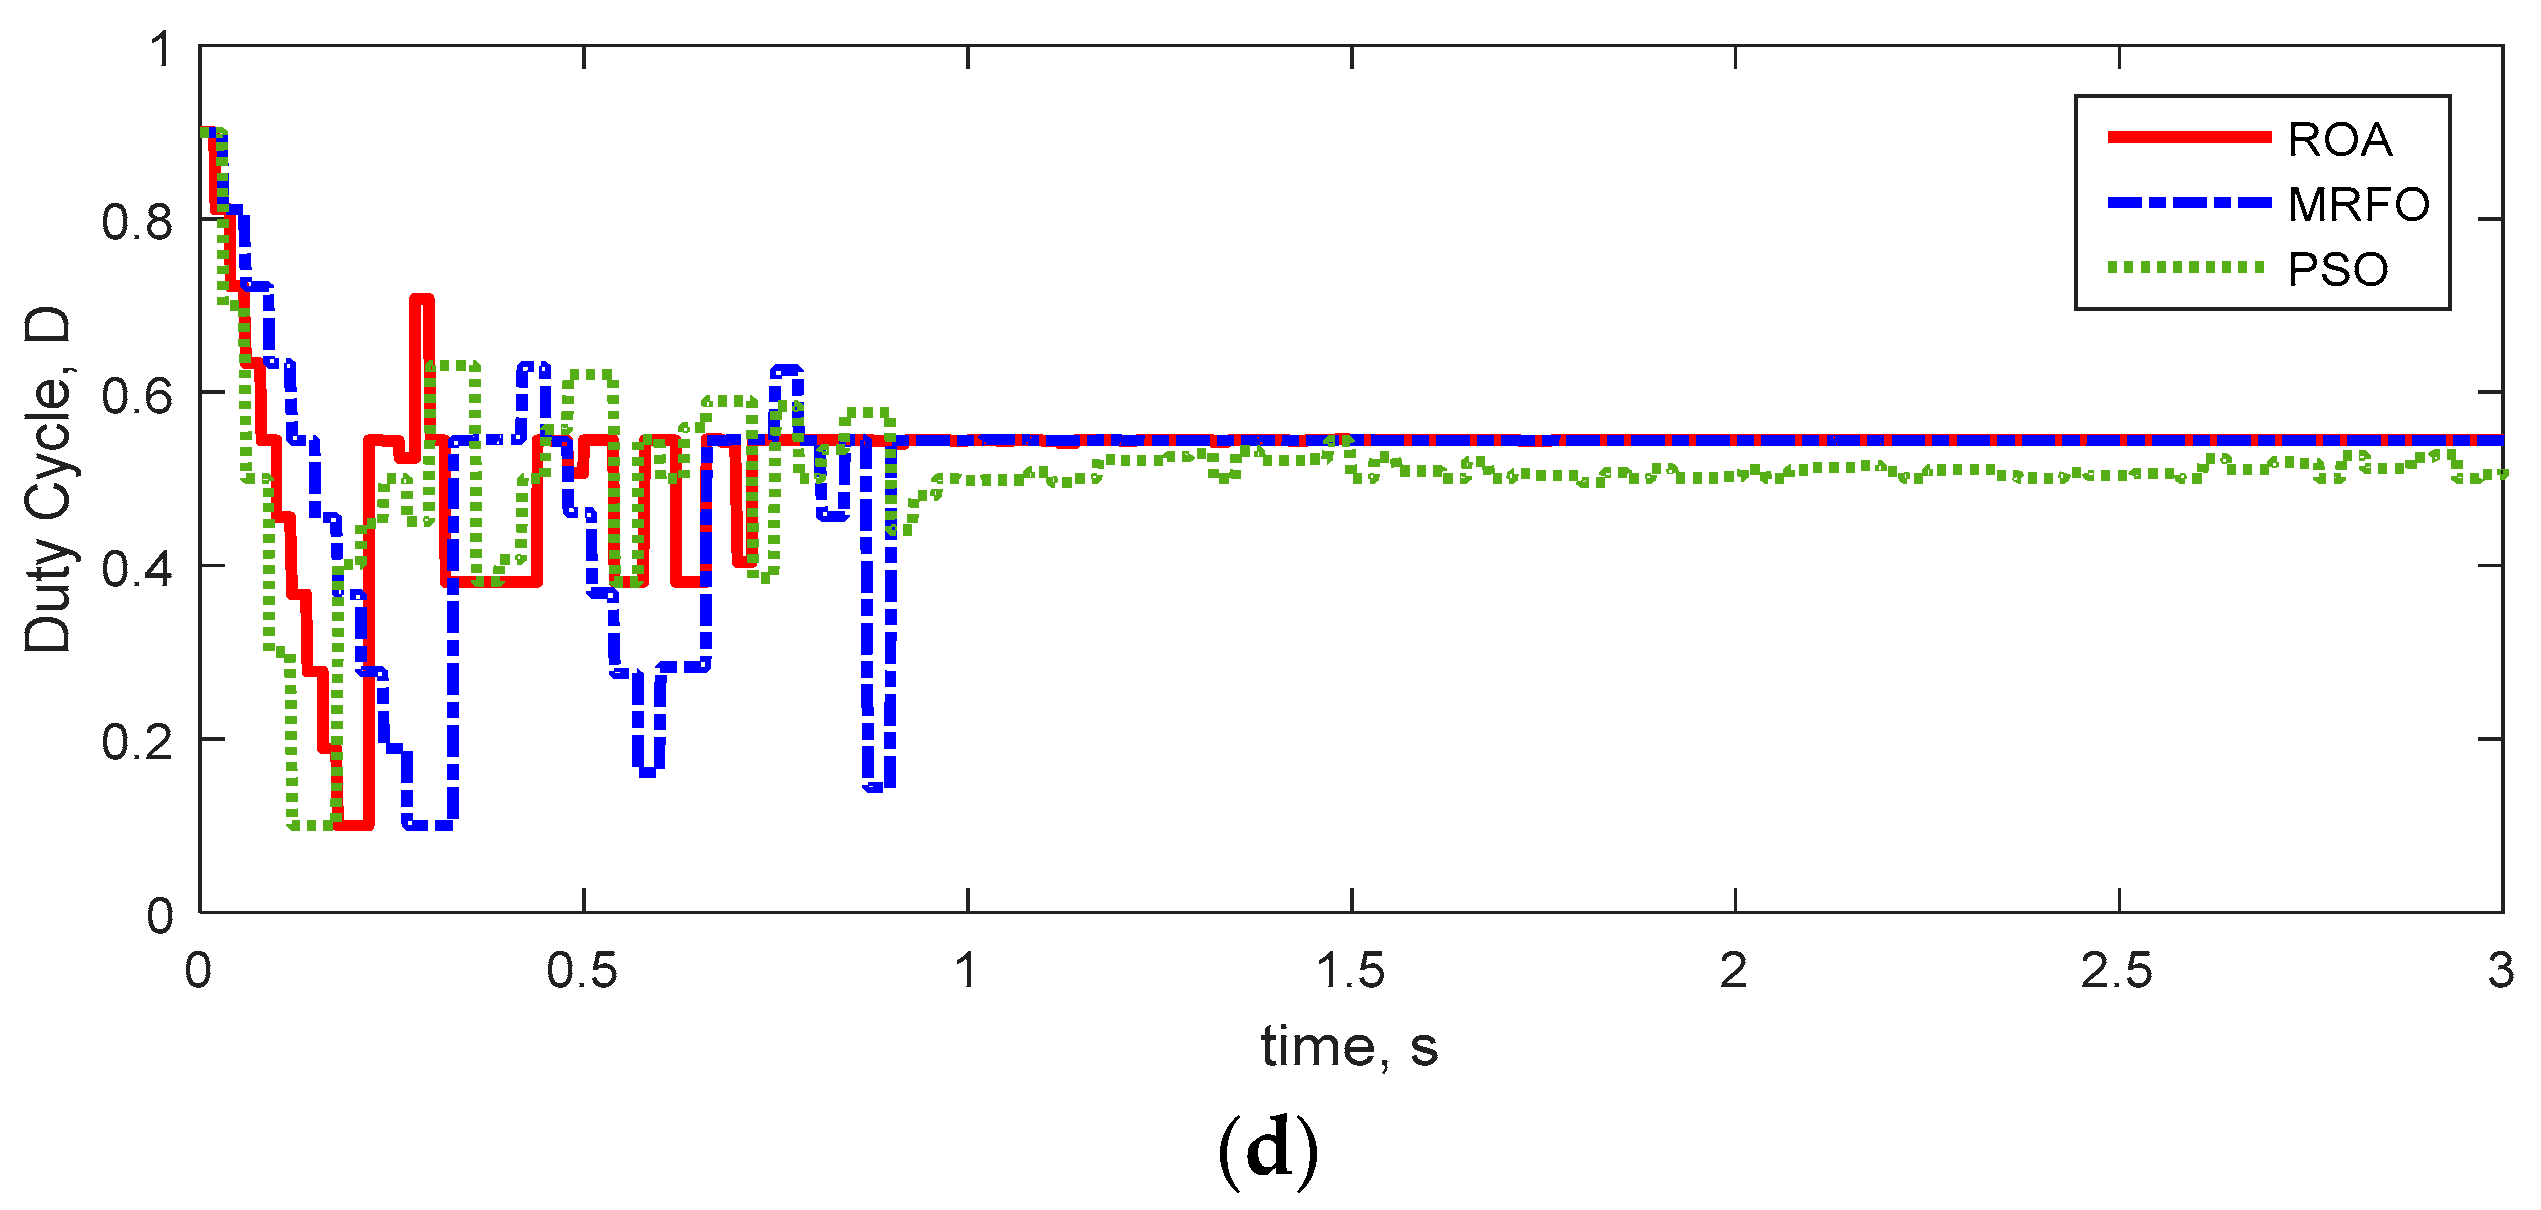
4.5. Results of Pattern 4

In this section, the performance of different methods is evaluated, considering patterns with three local optimal points, as demonstrated on the P-V and I-V curves in Figure 14. Pattern 4 includes four PV cells with different radiation values of 1000, 600, 300, and 100 W/m2 (Pattern 4) for the 4S PV configuration. Pattern 4 is a more difficult pattern for tracking than the other patterns. The GMPP in this pattern is equal to 80.62 W. Based on the obtained results shown in Table 7, the extracted power using the ROA, MRFO, and PSO are at 80.37 W, 80.25 W, and 79.68 W, respectively. In addition, the tracking efficiency of ROA, MRFO, and PSO are at 99.68%, 99.54%, and 98.83%, respectively. Figure 15 shows the better performance of the ROA in obtaining GMPP with lower tolerance and more tracking efficiency in comparison with the MRFO and PSO.

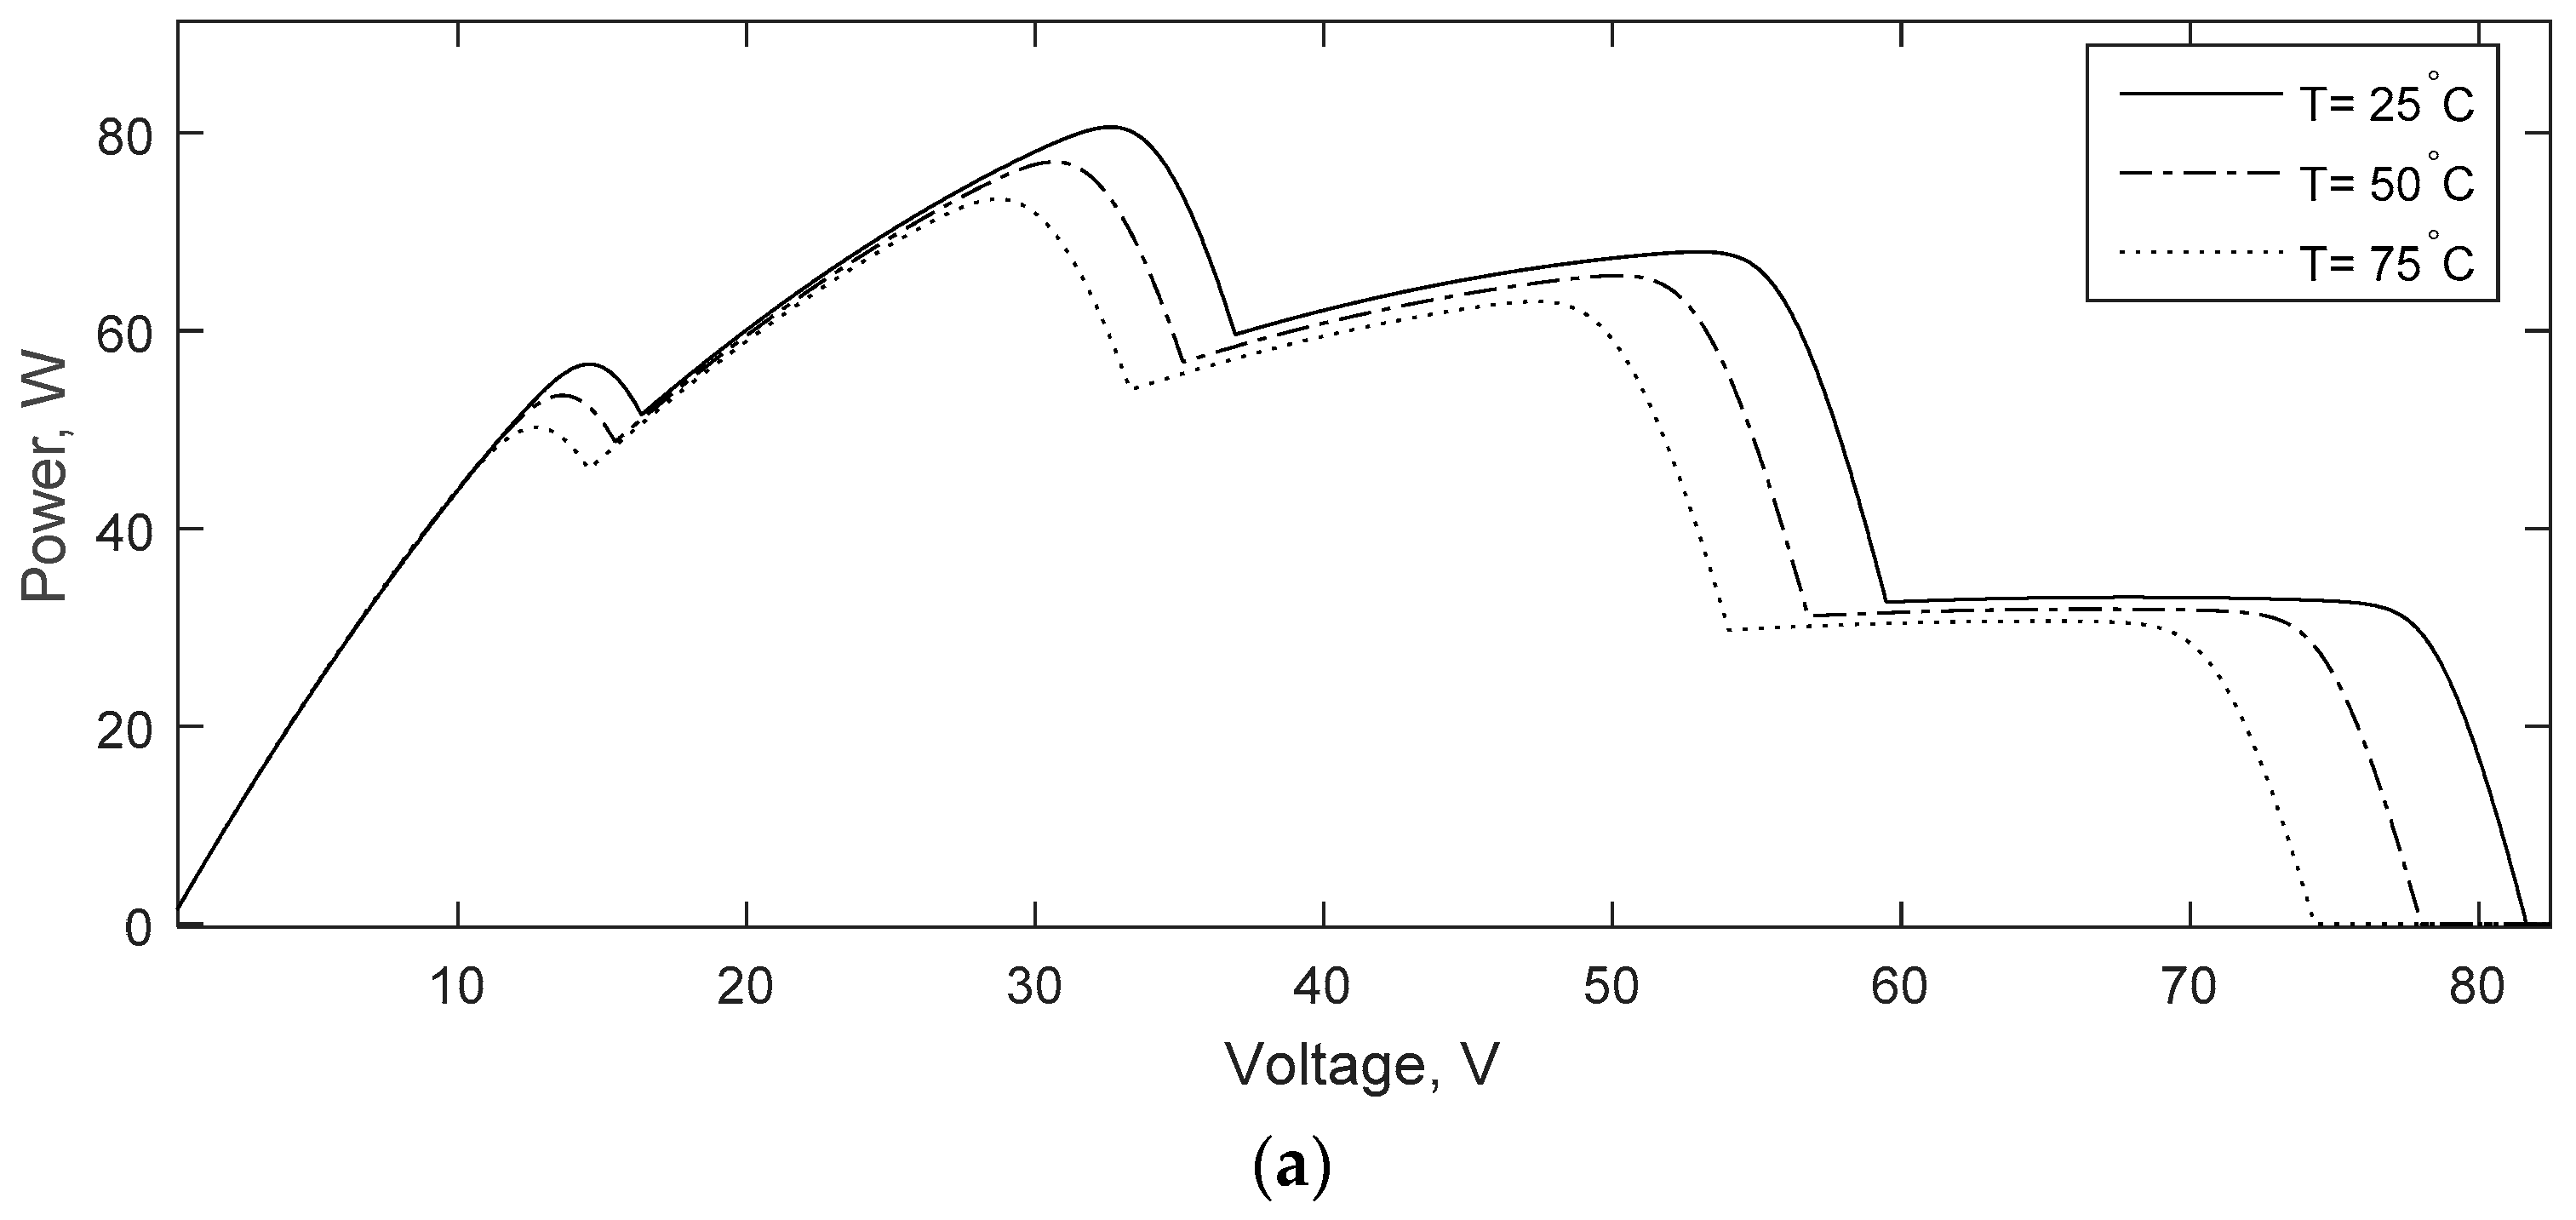
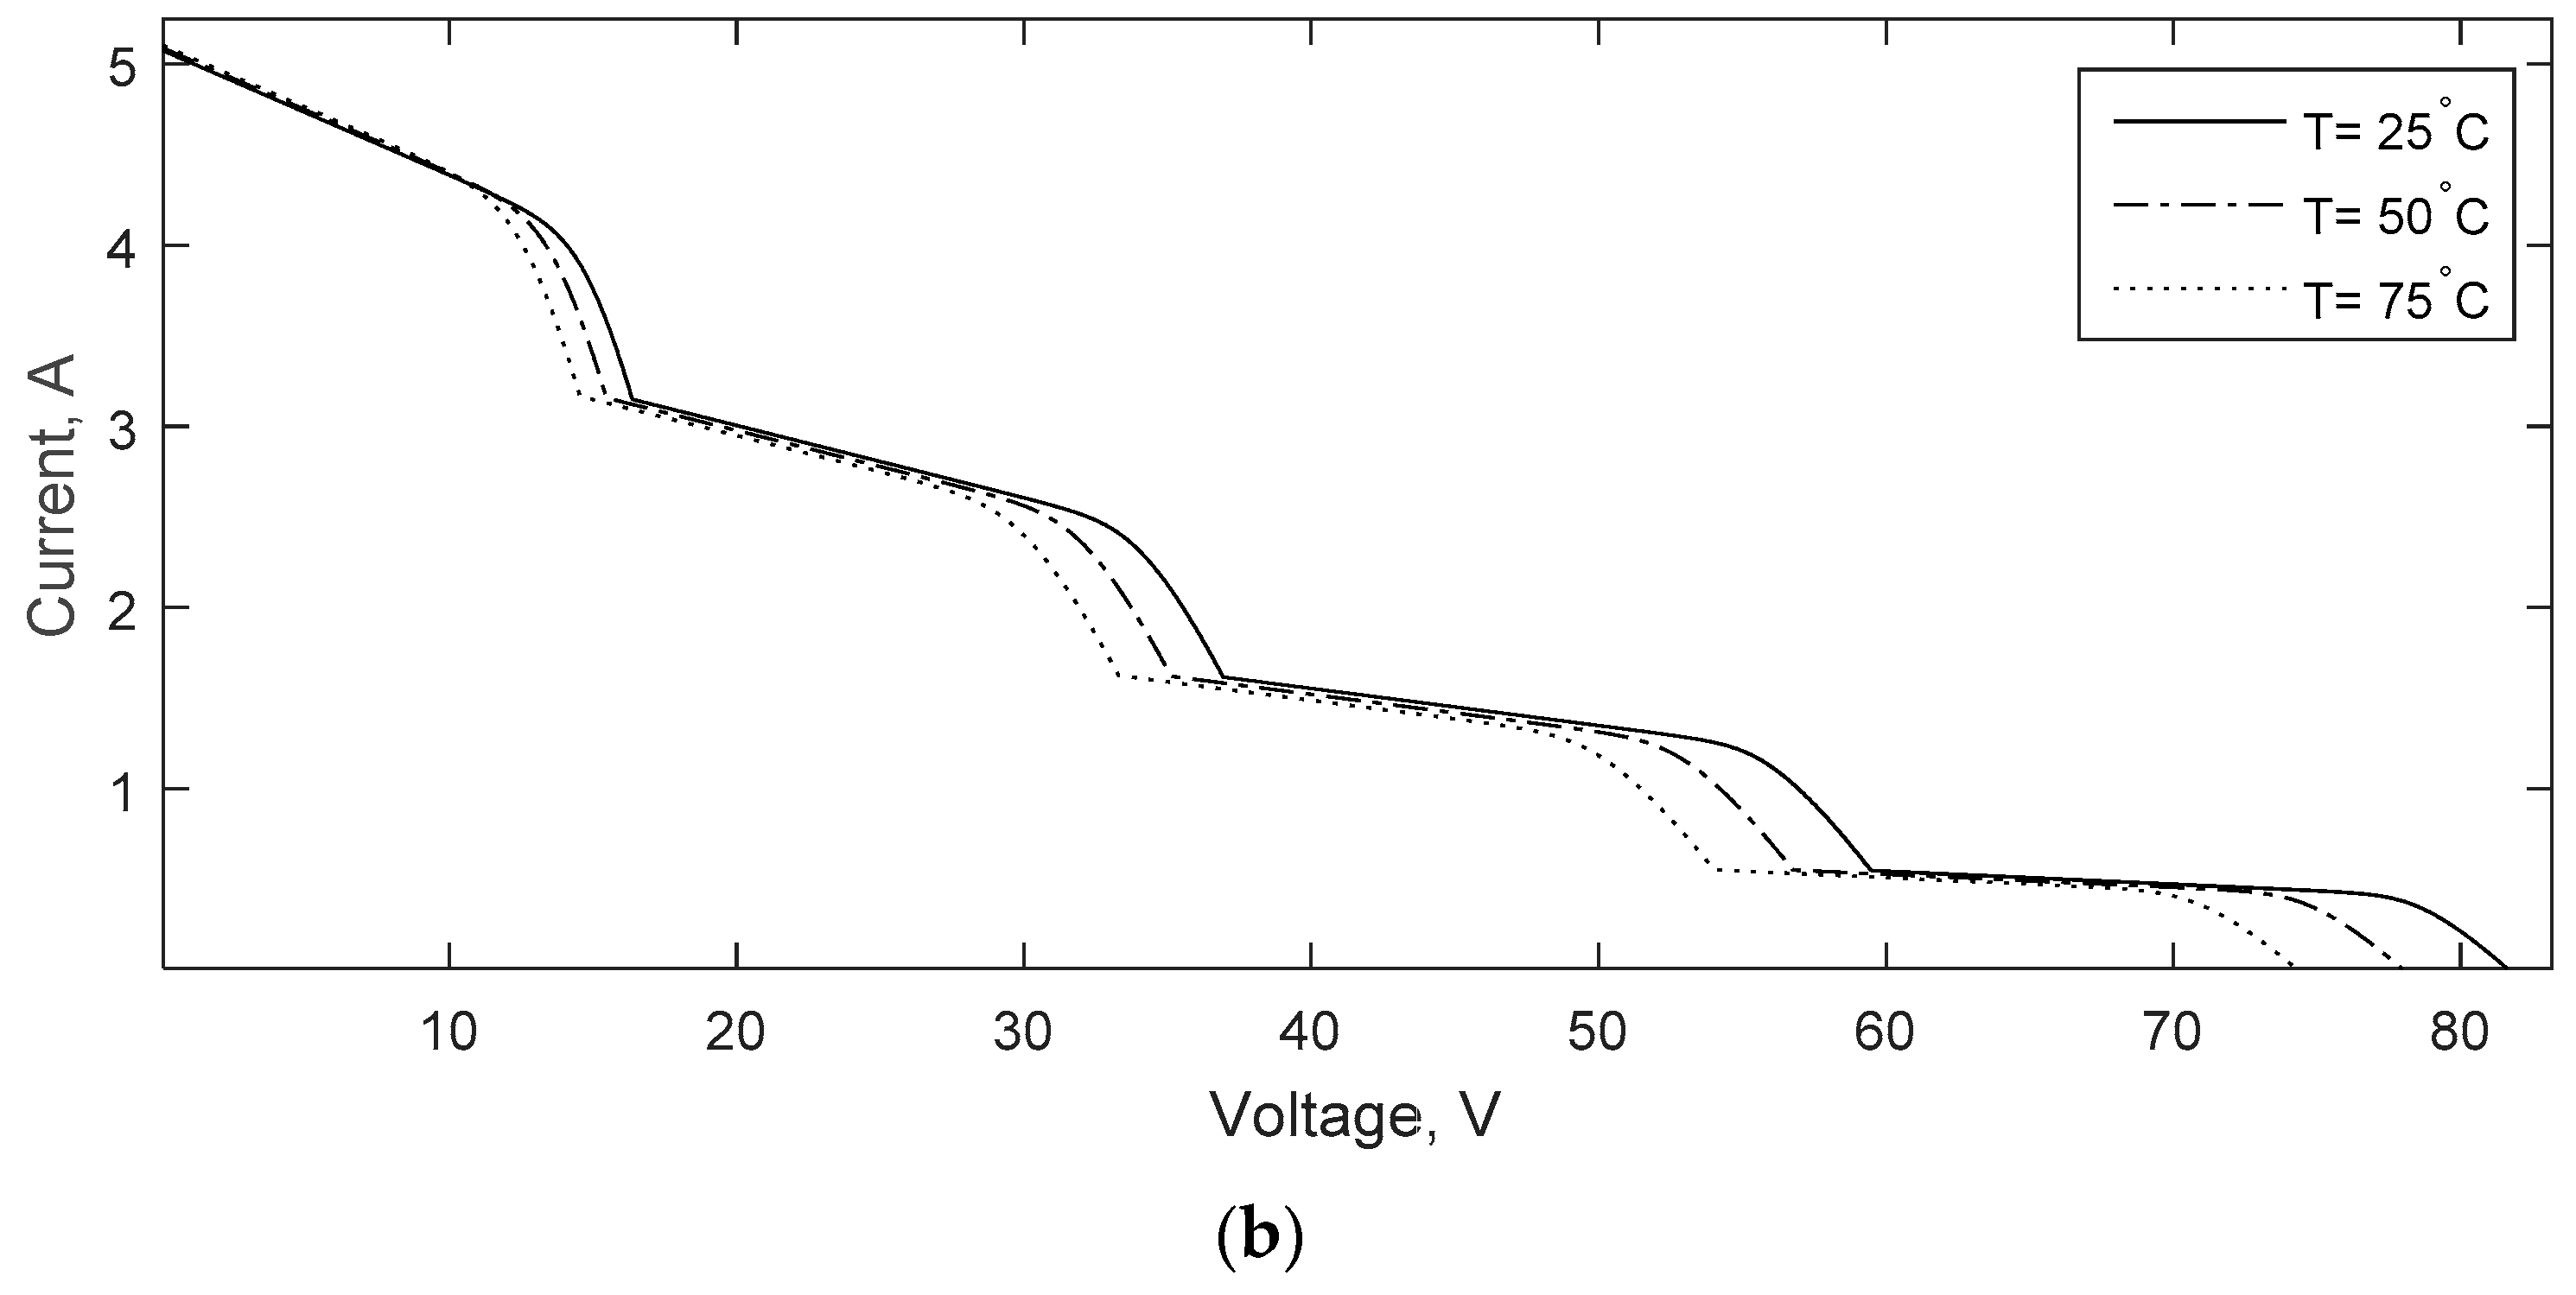
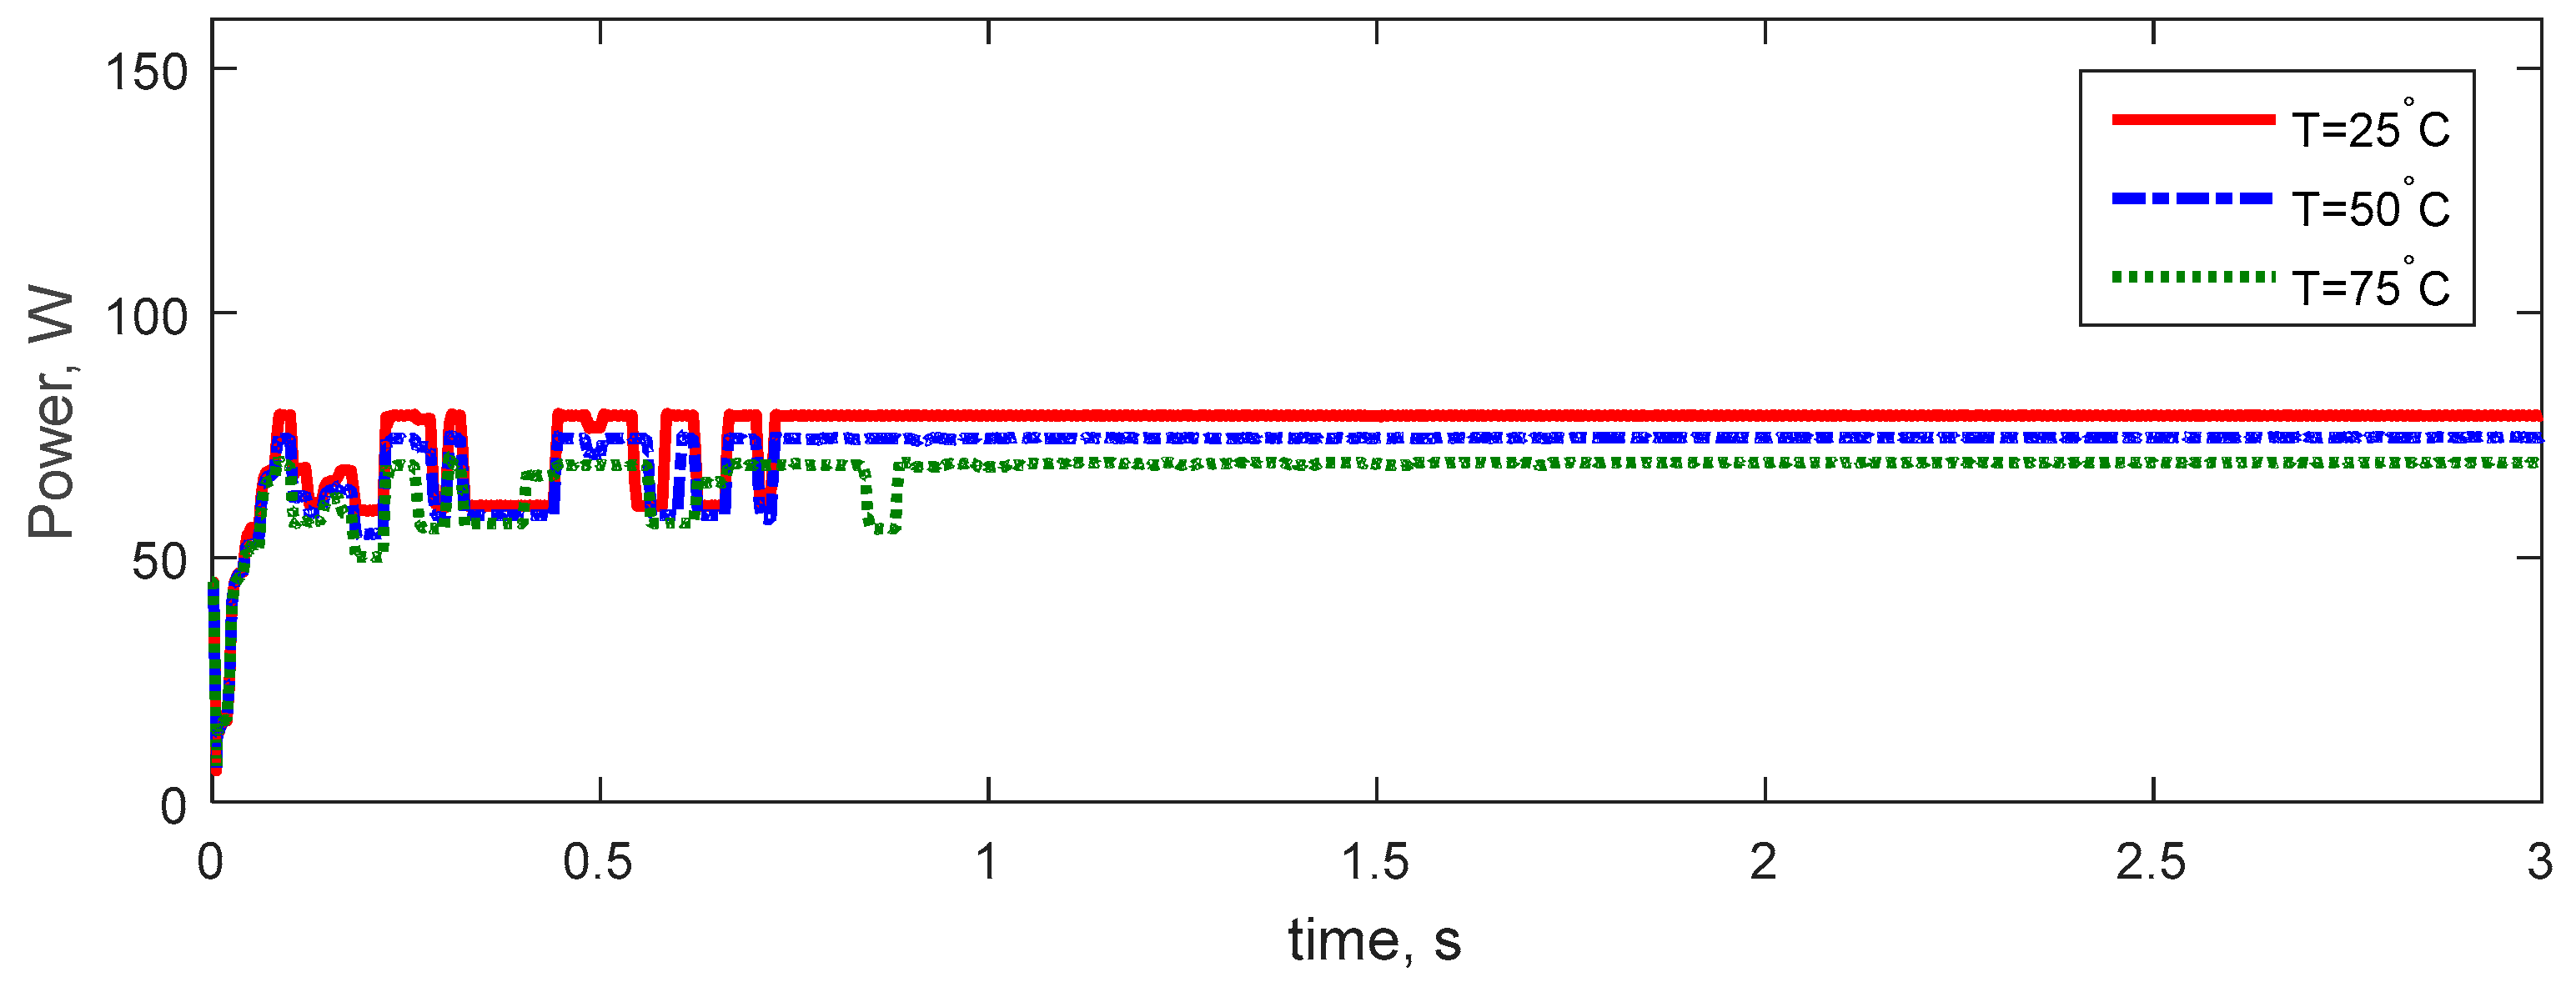
4.6. Results of Temperature Variations

In this section, the effect of temperature changes on the characteristic curves of PV cells (Figure 16) as well as MPPT solving based on the ROA to achieve maximum power at different temperatures (Figure 17) are evaluated for pattern 4. As can be seen, with increasing temperature values (25, 50, and 75 °C), the power of the PV module decreases and vice versa. Additionally, with increasing temperature, PV module voltage decreases and the current increases. As shown in Figure 17, with increasing temperature, the amount of maximum power extracted decreases.

4.7. Results Comparison with Previous Studies

The obtained results of MPPT solving via ROA in partial shading conditions is compared with some previous studies in Table 7. In [27,28,29], the cuckoo search (CS) algorithm, PSO, and whale optimization algorithm were implemented to solve the PV with MPPT solving. According to Table 8, better performance for the ROA is proved in PV with MPPT solving in the PSC in comparison with the CS, PSO, and WOA with higher tracking efficiency.

5. Conclusions

In this study, a new meta-heuristic algorithm named ROA was performed to track the PV system’s GMPP in different patterns of standard and PSCs. The studied system consists of the PV panel, boost converter, and the load and MPPT control system. The control variable was voltage while the optimization variable was the converter duty cycle, which was optimally determined using the ROA to maximize the PV system power. The capability of the ROA with lower control parameters was compared with the MRFO and PSO methods in MPPT solving in different standard and partial shading patterns, in views of maximum extracted power, tracking efficiency, and rate. The results showed that the ROA is a competitive and robust high-speed tracking method for the extraction of the PV system’s maximum power than the MRFO and PSO in standard and shading conditions with higher tracking efficiency and rate. Access to accurate radiation data is one of the limitations in this study, prompting the authors to use smart measuring devices to access this data more accurately and realistically. MMPT solving with the use of a hybrid ROA-PSO method is suggested for future work subjected to partial shading conditions.

Author Contributions

A.A.: Conceptualization, methodology, software, writing—original draft; M.A.: Conceptualization, methodology, software, writing—original draft; S.A.: Methodology, coding, writing and investigation; S.S.: Investigation, supervision, validation, writing—review and editing. All authors have read and agreed to the published version of the manuscript.

Funding

The authors extend their appreciation to the Deputyship for Research and Innovation, Ministry of Education in Saudi Arabia for funding this research work through project number “IF_2020_NBU_413”.

Institutional Review Board Statement

Not applicable.

Informed Consent Statement

Not applicable.

Data Availability Statement

Not applicable.

Acknowledgments

The authors are grateful to the Prince Faisal bin Khalid bin Sultan Research Chair in Renewable Energy Studies and Applications (PFCRE) at Northern Border University for its support and assistance.

Conflicts of Interest

The authors declare no conflict of interest.

References

  1. Arabi-Nowdeh, S.; Nasri, S.; Saftjani, P.B.; Naderipour, A.; Abdul-Malek, Z.; Kamyab, H.; Jafar-Nowdeh, A. Multi-criteria optimal design of hybrid clean energy system with battery storage considering off-and on-grid application. J. Clean. Prod. 2021, 290, 125808. [Google Scholar] [CrossRef]
  2. Nasri, S.; Nowdeh, S.A.; Davoudkhani, I.F.; Moghaddam, M.J.H.; Kalam, A.; Shahrokhi, S.; Zand, M. Maximum Power Point Tracking of Photovoltaic Renewable Energy System Using a New Method Based on Turbulent Flow of Water-Based Optimization (TFWO) Under Partial Shading Conditions. In Fundamentals and Innovations in Solar Energy, 1st ed.; Singh, S.N., Tiwari, P., Tiwari, S., Eds.; Springer: Singapore, 2021; pp. 285–310. [Google Scholar]
  3. Davoodkhani, F.; Nowdeh, S.A.; Abdelaziz, A.Y.; Mansoori, S.; Nasri, S.; Alijani, M. A new hybrid method based on gray wolf optimizer-crow search algorithm for maximum power point tracking of photovoltaic energy system. In Modern Maximum Power Point Tracking Techniques for Photovoltaic Energy Systems; E-Book; Eltamaly, A.M., Abdelaziz, A.Y., Eds.; Springer: Cham, Switzerland, 2020; pp. 421–438. [Google Scholar]
  4. Rezk, H.; Eltamaly, A.M. A comprehensive comparison of different MPPT techniques for photovoltaic systems. Sol. Energy 2015, 112, 1–11. [Google Scholar] [CrossRef]
  5. Shaiek, Y.; Smida, M.B.; Sakly, A.; Mimouni, M.F. Comparison between conventional methods and GA approach for maximum power point tracking of shaded solar PV generators. Sol. Energy 2013, 90, 107–122. [Google Scholar] [CrossRef]
  6. Li, S. A MPPT control strategy with variable weather parameter and no DC/DC converter for photovoltaic systems. Sol. Energy 2014, 108, 117–125. [Google Scholar] [CrossRef]
  7. Salas, V.; Olias, E.; Barrado, A.; Lazaro, A. Review of the maximum power point tracking algorithms for stand-alone photovoltaic systems. Sol. Energy Mater. Sol. Cells 2006, 90, 1555–1578. [Google Scholar] [CrossRef]
  8. Nowdeh, S.A.; Moghaddam, M.J.H.; Babanezhad, M.; Davoodkhani, I.F.; Kalam, A.; Ahmadi, A.; Abdelaziz, A.Y. A novel maximum power point tracking method for photovoltaic application using secant incremental gradient based on Newton Raphson. In Solar Photovoltaic Power Plants; E-Book; Precup, R.-E., Kamal, T., Hassan, S.Z., Eds.; Springer: Singapore, 2019; pp. 71–96. [Google Scholar]
  9. Pan, J.S.; Tian, A.Q.; Snášel, V.; Kong, L.; Chu, S.C. Maximum power point tracking and parameter estimation for multiple-photovoltaic arrays based on enhanced pigeon-inspired optimization with Taguchi method. Energy 2022, 123865. [Google Scholar] [CrossRef]
  10. Nowdeh, S.A.; Moghaddam, M.J.H.; Nasri, S.; Abdelaziz, A.Y.; Ghanbari, M.; Faraji, I. A New Hybrid Moth Flame Optimizer-Perturb and Observe Method for Maximum Power Point Tracking in Photovoltaic Energy System. In Modern Maximum Power Point Tracking Techniques for Photovoltaic Energy Systems; E-Book; Eltamaly, A.M., Abdelaziz, A.Y., Eds.; Springer: Cham, Switzerland, 2020; pp. 401–420. [Google Scholar]
  11. Carannante, G.; Fraddanno, C.; Pagano, M.; Piegari, L. Experimental performance of MPPT algorithm for photovoltaic sources subject to inhomogeneous insolation. IEEE Trans. Ind. Electron. 2009, 56, 4374–4380. [Google Scholar] [CrossRef]
  12. Kobayashi, K.; Takano, I.; Sawada, Y. A study on a two stage maximum power point tracking control of a photovoltaic system under partially shaded insolation conditions. In Proceedings of the 2003 IEEE Power Engineering Society General Meeting, Toronto, ON, Canada, 13–17 July 2003; IEEE: Piscataway, NJ, USA, 2003; Volume 4, pp. 2612–2617. [Google Scholar]
  13. Ahmed, N.A.; Miyatake, M. A novel maximum power point tracking for photovoltaic applications under partially shaded insolation conditions. Electr. Power Syst. Res. 2008, 78, 777–784. [Google Scholar] [CrossRef]
  14. Renaudineau, H.; Houari, A.; Martin, J.P.; Pierfederici, S.; Meibody-Tabar, F.; Gerardin, B. A new approach in tracking maximum power under partially shaded conditions with consideration of converter losses. Sol. Energy 2011, 85, 2580–2588. [Google Scholar] [CrossRef]
  15. Lei, P.; Li, Y.; Seem, J.E. Sequential ESC-based global MPPT control for photovoltaic array with variable shading. IEEE Trans. Sustain. Energy 2011, 2, 348–358. [Google Scholar]
  16. Karatepe, E.; Hiyama, T. Artificial neural network-polar coordinated fuzzy controller based maximum power point tracking control under partially shaded conditions. IET Renew. Power Gener. 2009, 3, 239–253. [Google Scholar]
  17. Femia, N.; Lisi, G.; Petrone, G.; Spagnuolo, G.; Vitelli, M. Distributed maximum power point tracking of photovoltaic arrays: Novel approach and system analysis. IEEE Trans. Ind. Electron. 2008, 55, 2610–2621. [Google Scholar] [CrossRef] [Green Version]
  18. Mathi, D.K.; Chinthamalla, R. Enhanced leader adaptive velocity particle swarm optimisation based global maximum power point tracking technique for a PV string under partially shaded conditions. IET Renew. Power Gener. 2020, 14, 243–253. [Google Scholar] [CrossRef]
  19. Kaced, K.; Larbes, C.; Ramzan, N.; Bounabi, M.; elabadine Dahmane, Z. Bat algorithm based maximum power point tracking for photovoltaic system under partial shading conditions. Sol. Energy 2017, 158, 490–503. [Google Scholar] [CrossRef] [Green Version]
  20. Mohanty, S.; Subudhi, B.; Ray, P.K. A new MPPT design using grey wolf optimization technique for photovoltaic system under partial shading conditions. IEEE Trans. Sustain. Energy 2016, 7, 181–188. [Google Scholar] [CrossRef]
  21. Diab, A.A.Z.; Rezk, H. Global MPPT based on flower pollination and differential evolution algorithms to mitigate partial shading in building integrated PV system. Sol. Energy 2017, 157, 171–186. [Google Scholar] [CrossRef]
  22. Abadi, I.; Uyuniyah, Q.; Fitriyanah, D.N.; Jani, Y.; Abdullah, K. Performance Study of Maximum Power Point Tracking (MPPT) Based on Type-2 Fuzzy Logic Controller on Active Dual Axis Solar Tracker. In Proceedings of the E3S Web of Conferences, Padang, Indonesia, 12–14 November 2019; EDP Sciences: Les Ulis, France, 2020; Volume 190, p. 00016. [Google Scholar]
  23. Yang, B.; Zhang, M.; Zhang, X.; Wang, J.; Shu, H.; Li, S.; He, T.; Yang, L.; Yu, T. Fast atom search optimization based MPPT design of centralized thermoelectric generation system under heterogeneous temperature difference. J. Clean. Prod. 2020, 248, 119301. [Google Scholar] [CrossRef]
  24. Mirjalili, S.; Mirjalili, S.M.; Hatamlou, A. Multi-verse optimizer: A nature-inspired algorithm for global optimization. Neural Comput. Appl. 2016, 27, 495–513. [Google Scholar] [CrossRef]
  25. Fathy, A.; Rezk, H.; Yousri, D. A robust global MPPT to mitigate partial shading of triple-junction solar cell-based system using manta ray foraging optimization algorithm. Sol. Energy 2020, 207, 305–316. [Google Scholar] [CrossRef]
  26. Jia, H.; Peng, X.; Lang, C. Remora optimization algorithm. Expert Syst. Appl. 2021, 185, 115665. [Google Scholar] [CrossRef]
  27. Rezk, H.; Fathy, A.; Abdelaziz, A.Y. A comparison of different global MPPT techniques based on meta-heuristic algorithms for photovoltaic system subjected to partial shading conditions. Renew. Sustain. Energy Rev. 2017, 74, 377–386. [Google Scholar] [CrossRef]
  28. Dileep, G.; Singh, S.N. An improved particle swarm optimization based maximum power point tracking algorithm for PV system operating under partial shading conditions. Sol. Energy 2017, 158, 1006–1015. [Google Scholar] [CrossRef]
  29. Premkumar, M.; Sowmya, R. An effective maximum power point tracker for partially shaded solar photovoltaic systems. Energy Rep. 2019, 5, 1445–1462. [Google Scholar] [CrossRef]
Figure 1. PV Model as single-diode.
Applsci 12 03828 g001
Figure 2. PV panel (a) STC configuration, (b) PSC configuration, (c) I-V curve, (d) P-V curve.
Applsci 12 03828 g002
Figure 3. Different situations of Remora.
Applsci 12 03828 g003
Figure 4. Block diagram of an ROA−based MPPT.
Applsci 12 03828 g004
Figure 5. Flow chart of ROA implementation in proposed MPPT solutions.
Applsci 12 03828 g005
Figure 6. Characteristics of PV panel for pattern 1: (a) P-V, (b) I-V.
Applsci 12 03828 g006
Figure 7. Characteristics of PV panel for pattern 2: (a) P-V, (b) I-V.
Applsci 12 03828 g007
Figure 8. Characteristic curves of PV panel for pattern 3: (a) P-V, (b) I-V.
Applsci 12 03828 g008
Figure 9. (a) PV power, (b) PV voltage, (c) PV current, (d) Duty cycle in pattern 1 using different methods.
Applsci 12 03828 g009
Figure 10. (a) PV power, (b) PV voltage, (c) PV current, (d) Duty cycle in pattern 2 using different methods.
Applsci 12 03828 g010aApplsci 12 03828 g010b
Figure 11. (a) PV power, (b) PV voltage, (c) PV current, (d) Duty cycle in pattern 3 using different methods.
Applsci 12 03828 g011
Figure 12. Results comparison in terms of tracking efficiency for different methods and patterns.
Applsci 12 03828 g012
Figure 13. Results comparison in terms of tracking rate for different methods and patterns.
Applsci 12 03828 g013
Figure 14. Characteristics of the PV panel for pattern 4: (a) P-V, (b) I-V.
Applsci 12 03828 g014aApplsci 12 03828 g014b
Figure 15. (a) PV power, (b) PV voltage, (c) PV current, (d) Duty cycle in pattern 4 using different methods.
Applsci 12 03828 g015aApplsci 12 03828 g015b
Figure 16. Characteristics of PV considering temperature changes for pattern 4: (a) P-V, (b) I-V.
Applsci 12 03828 g016aApplsci 12 03828 g016b
Figure 17. PV power in pattern 4 considering temperature changes using the ROA.
Applsci 12 03828 g017
Table 1. Control parameters of different algorithms.
MethodControl ItemValue
Particle swarm optimization [18]Social parameters(C1 = 2, C2 = 2)
Weights of inertia0.1–0.9
Velocity10% of dimension value
Multi-verse optimizer [25]Exploitation accuracy (p)6
Grey wolf optimizer [20]Convergence control, aFrom 0 to 2
Bat algorithm [19]Qmin and Qmax0 and 2
A and r0.5 and 0.5
Flower pollution algorithm [21]Probability parameter, p0.8
Crow search algorithm [3]pa0.25
Moth flame optimizer [10] a[−2, −1]
b1
Manta ray foraging optimizer [25]a[0, 1]
w[0, 1]
r1, r2 and r3[0, 1]
Atom search optimization [23]Mining capability p1/6
Random parameters r1, r2, r3 & r4[0, 1]
Contrast parameter H0.5
Remora optimization algorithm (ROA)Remora factor C[0, 0.3]
Table 2. PV module parameters [9].
ItemValue
Maximum of PV power56.75 W
Voltage of open circuit 21 V
Maximum of PV voltage14.56 V
Current of short circuit 5 A
Maximum of PV current3.898 A
Coefficient of voltage temperature −0.085 V/°C
Coefficient of current temperature 0.0051 A/°C
Table 3. DC/DC boost converter parameters [9,10].
ItemValue
Frequency of switching 50 kHz
C440 × 10−6 6 F
L2.5 × 10³ H
R50 Ohm
Table 4. Numerical results of the ROA, MRFO, and PSO methods in pattern 1.
Parameter/MethodROAMFROPSO
Global power (W)113.42113.42113.42
Extracted power (W)113.39113.36113.32
Tracking efficiency (%)99.9799.9499.91
Tracking rate (S)0.661.123.01
Table 5. Numerical results of ROA, MRFO, and PSO methods in pattern 2.
Parameter/MethodROAMFROPSO
Global power (W)90.5490.5490.54
Extracted power (W)90.5290.4790.45
Tracking efficiency (%)99.9799.9299.90
Tracking rate (S)1.082.252.78
Table 6. Numerical results of the ROA, MRFO, and PSO methods in pattern 3.
Parameter/MethodROAMFROPSO
Global power (W)79.7279.7279.72
Extracted power (W)79.6979.6579.61
Tracking efficiency (%)99.9699.9199.86
Tracking rate (S)0.902.203.10
Table 7. Numerical results of the ROA, MRFO, and PSO methods in pattern 4.
Parameter/MethodROAMFROPSO
Global power (W)80.6280.6280.62
Extracted power (W)80.3780.2579.68
Tracking efficiency (%)99.6899.5498.83
Tracking rate (S)0.700.911.22
Table 8. Results comparison with previous studies.
Parameter/MethodROACS [27]PSO [28]WOA [29]
Global power (W)99.9699.9499.9099.70
Publisher’s Note: MDPI stays neutral with regard to jurisdictional claims in published maps and institutional affiliations.

