
Classification of Distal Growth Plate Ossification States of the Radius Bone Using a Dedicated Ultrasound Device and Machine Learning Techniques for Bone Age Assessments

 , ,
, ,
Abstract
:Featured Application
Abstract
1. Introduction
2. Materials and Methods
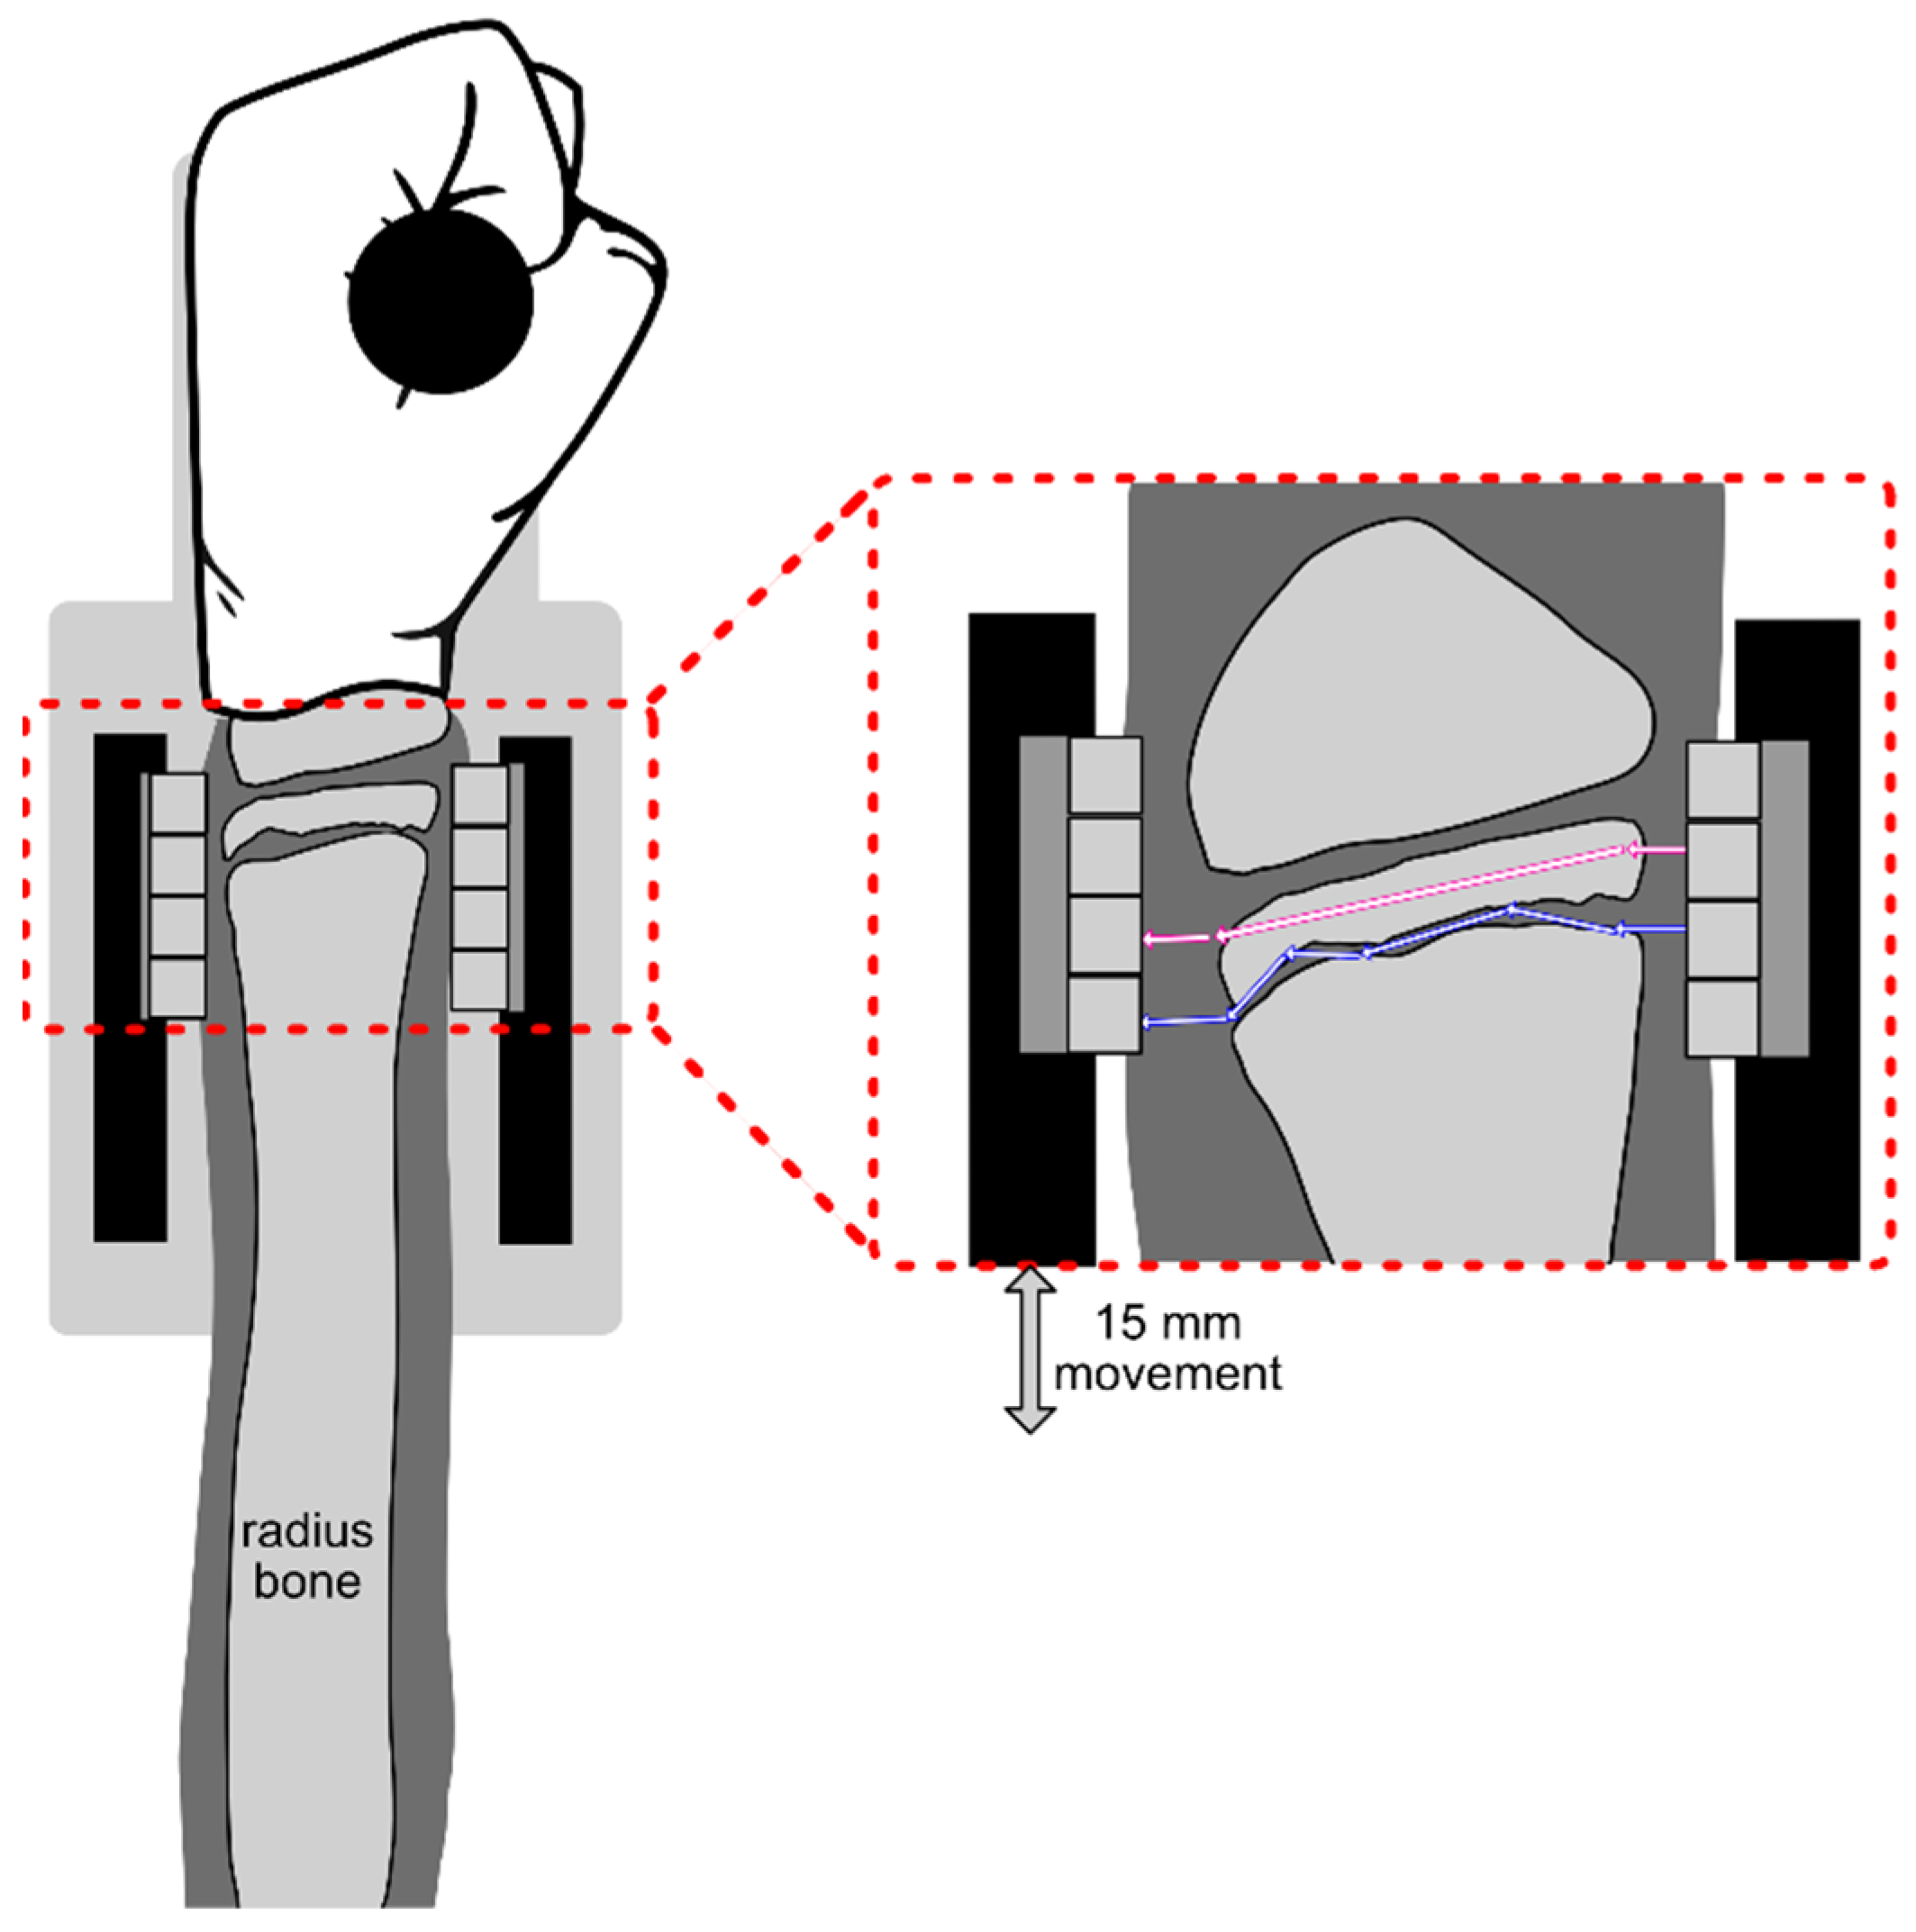
2.1. Measurement Principle
2.2. System Design
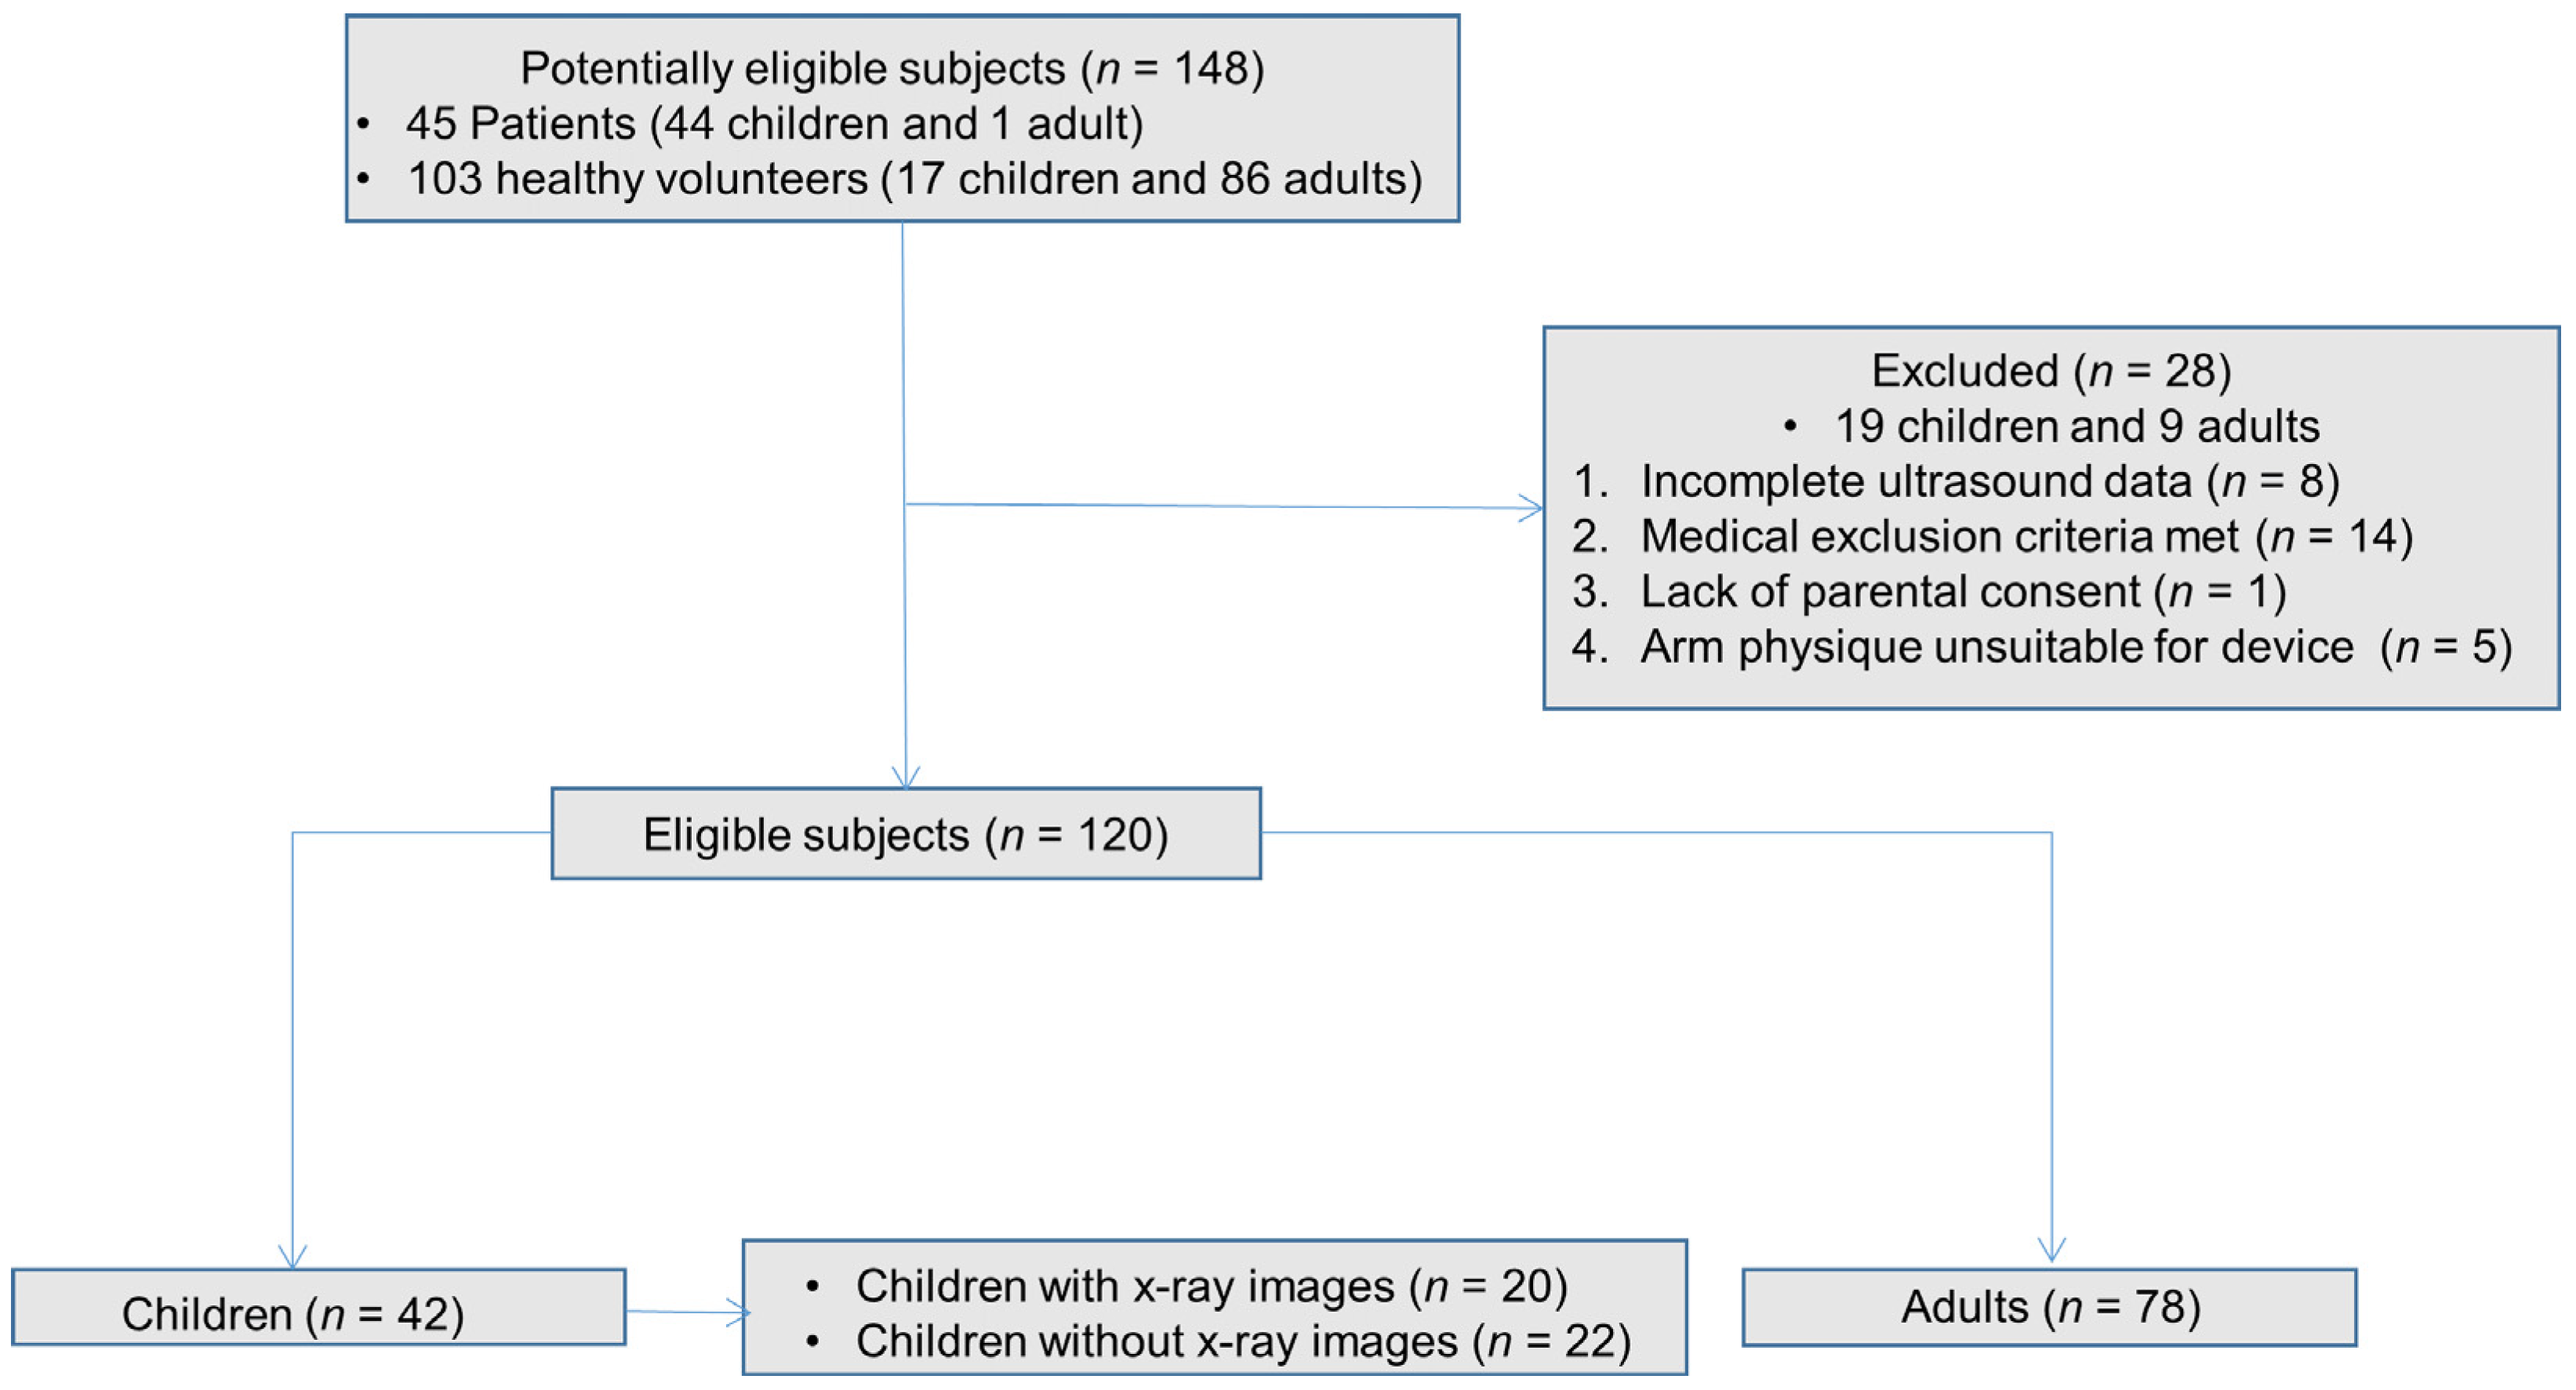
2.3. Study Design
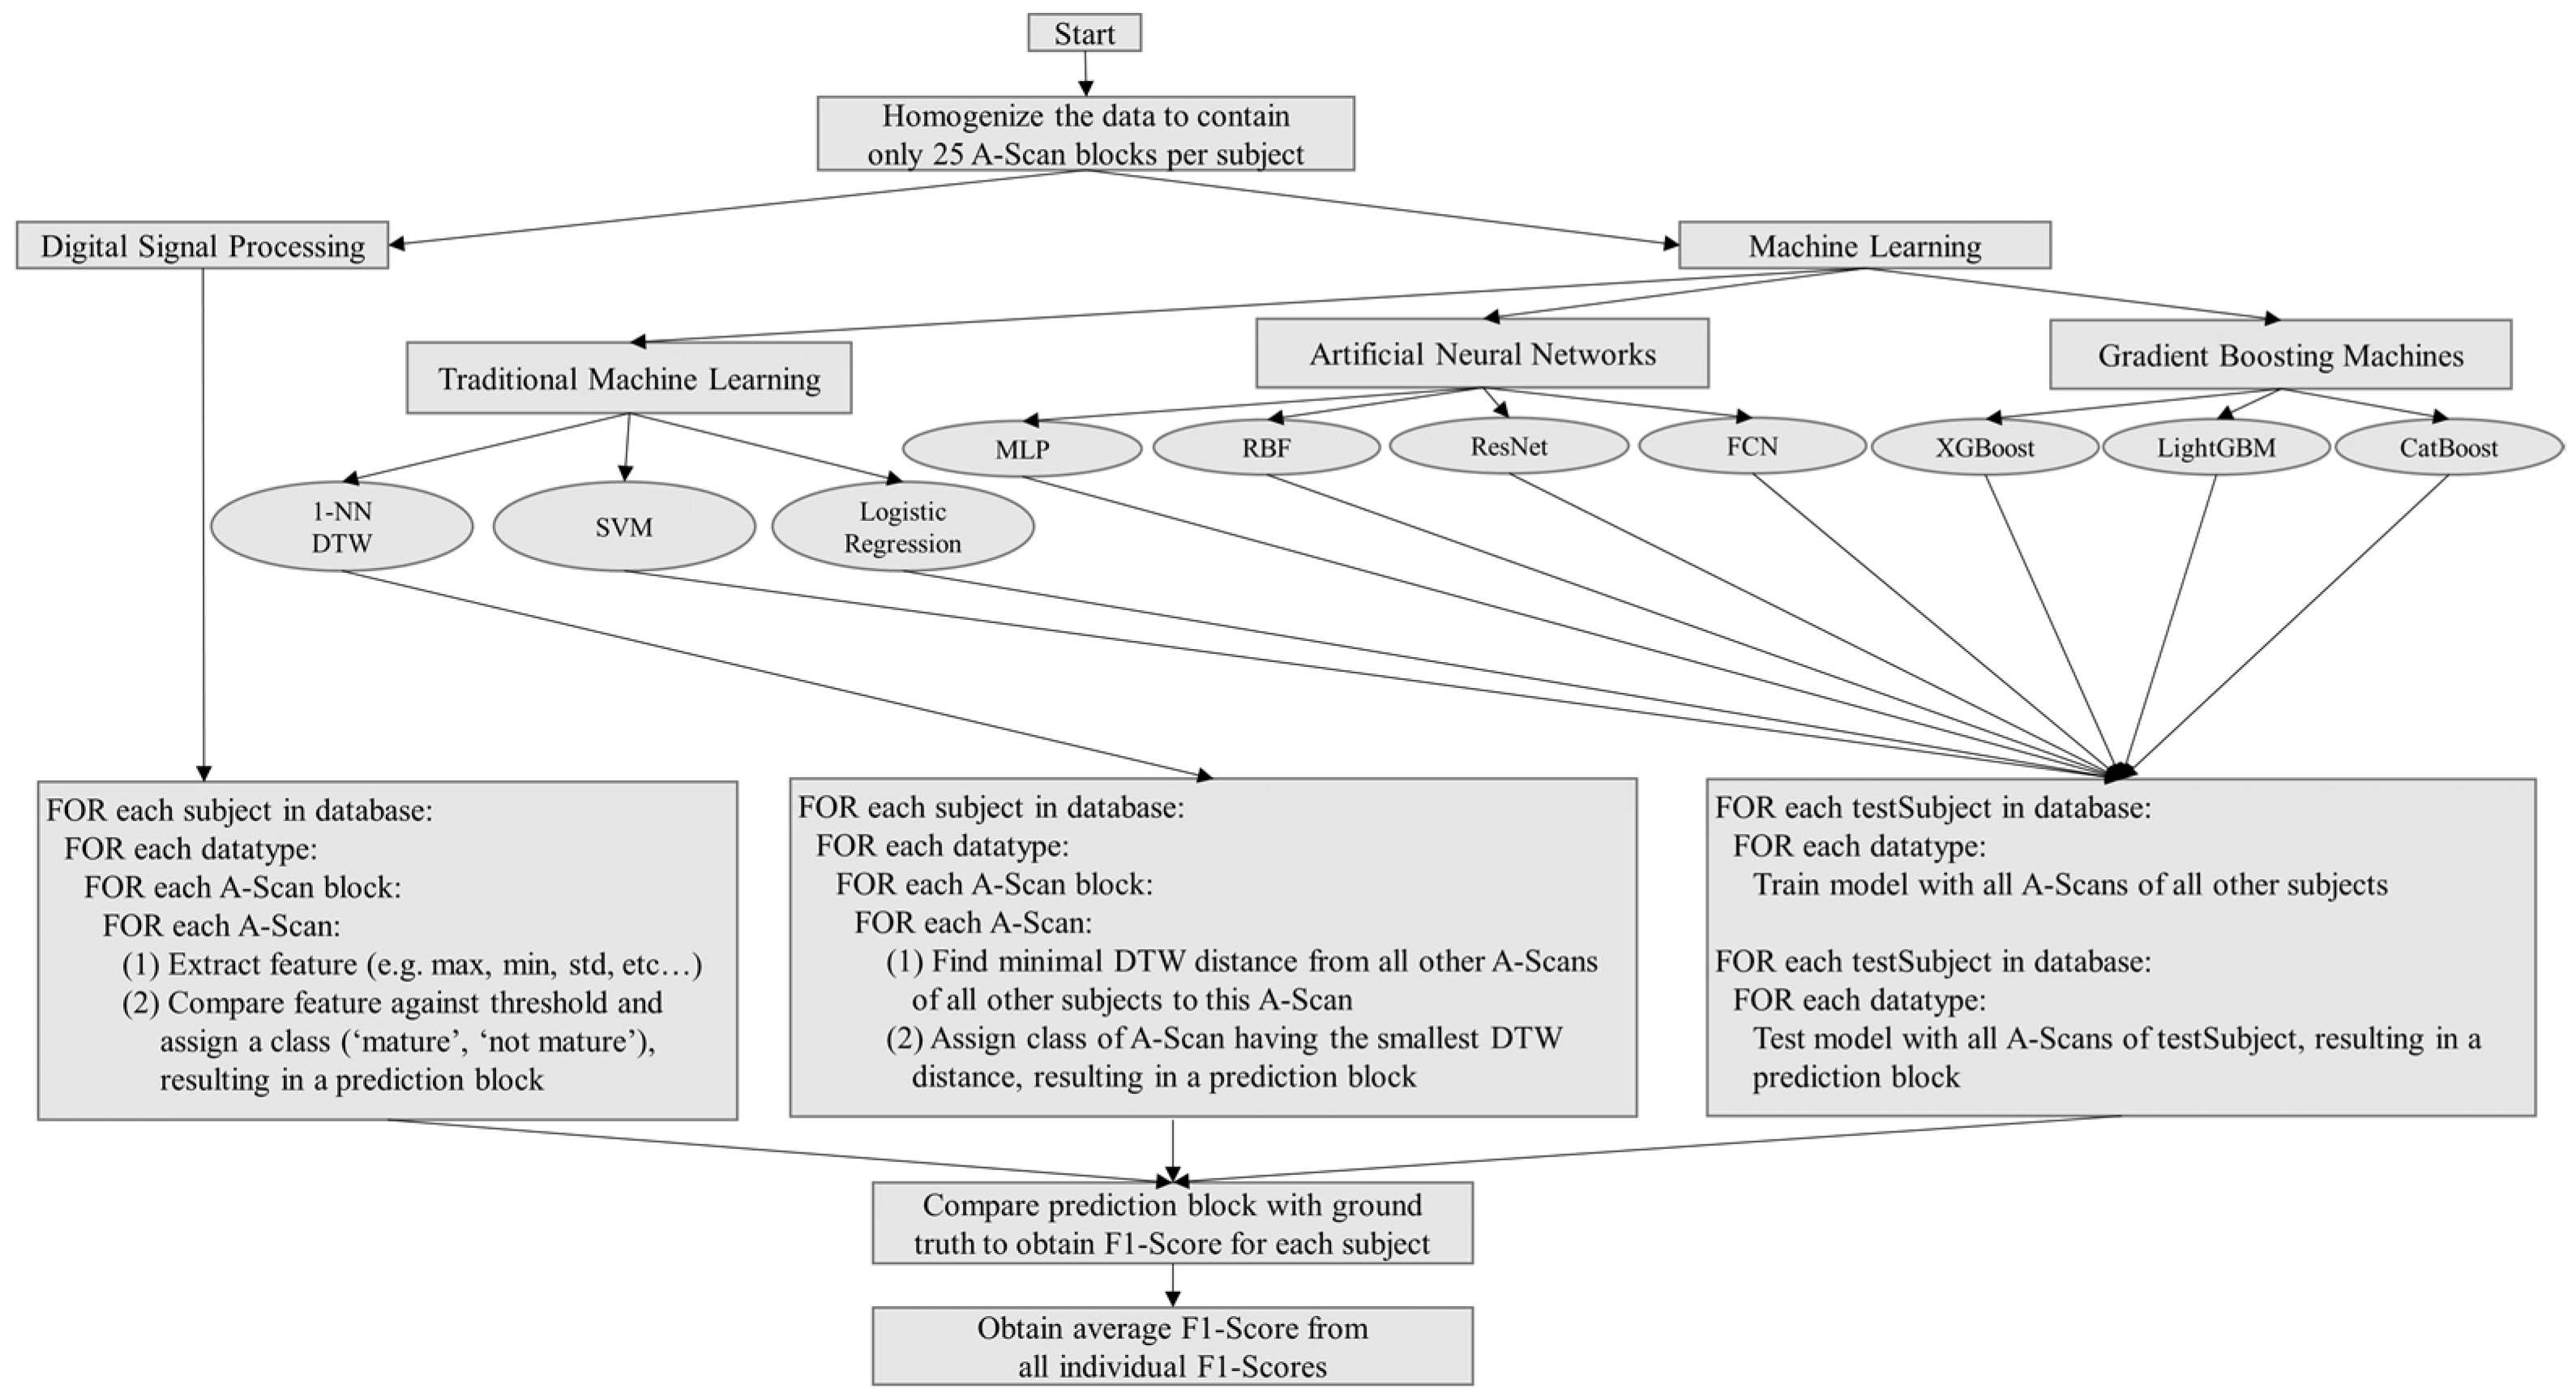
2.4. Analysis
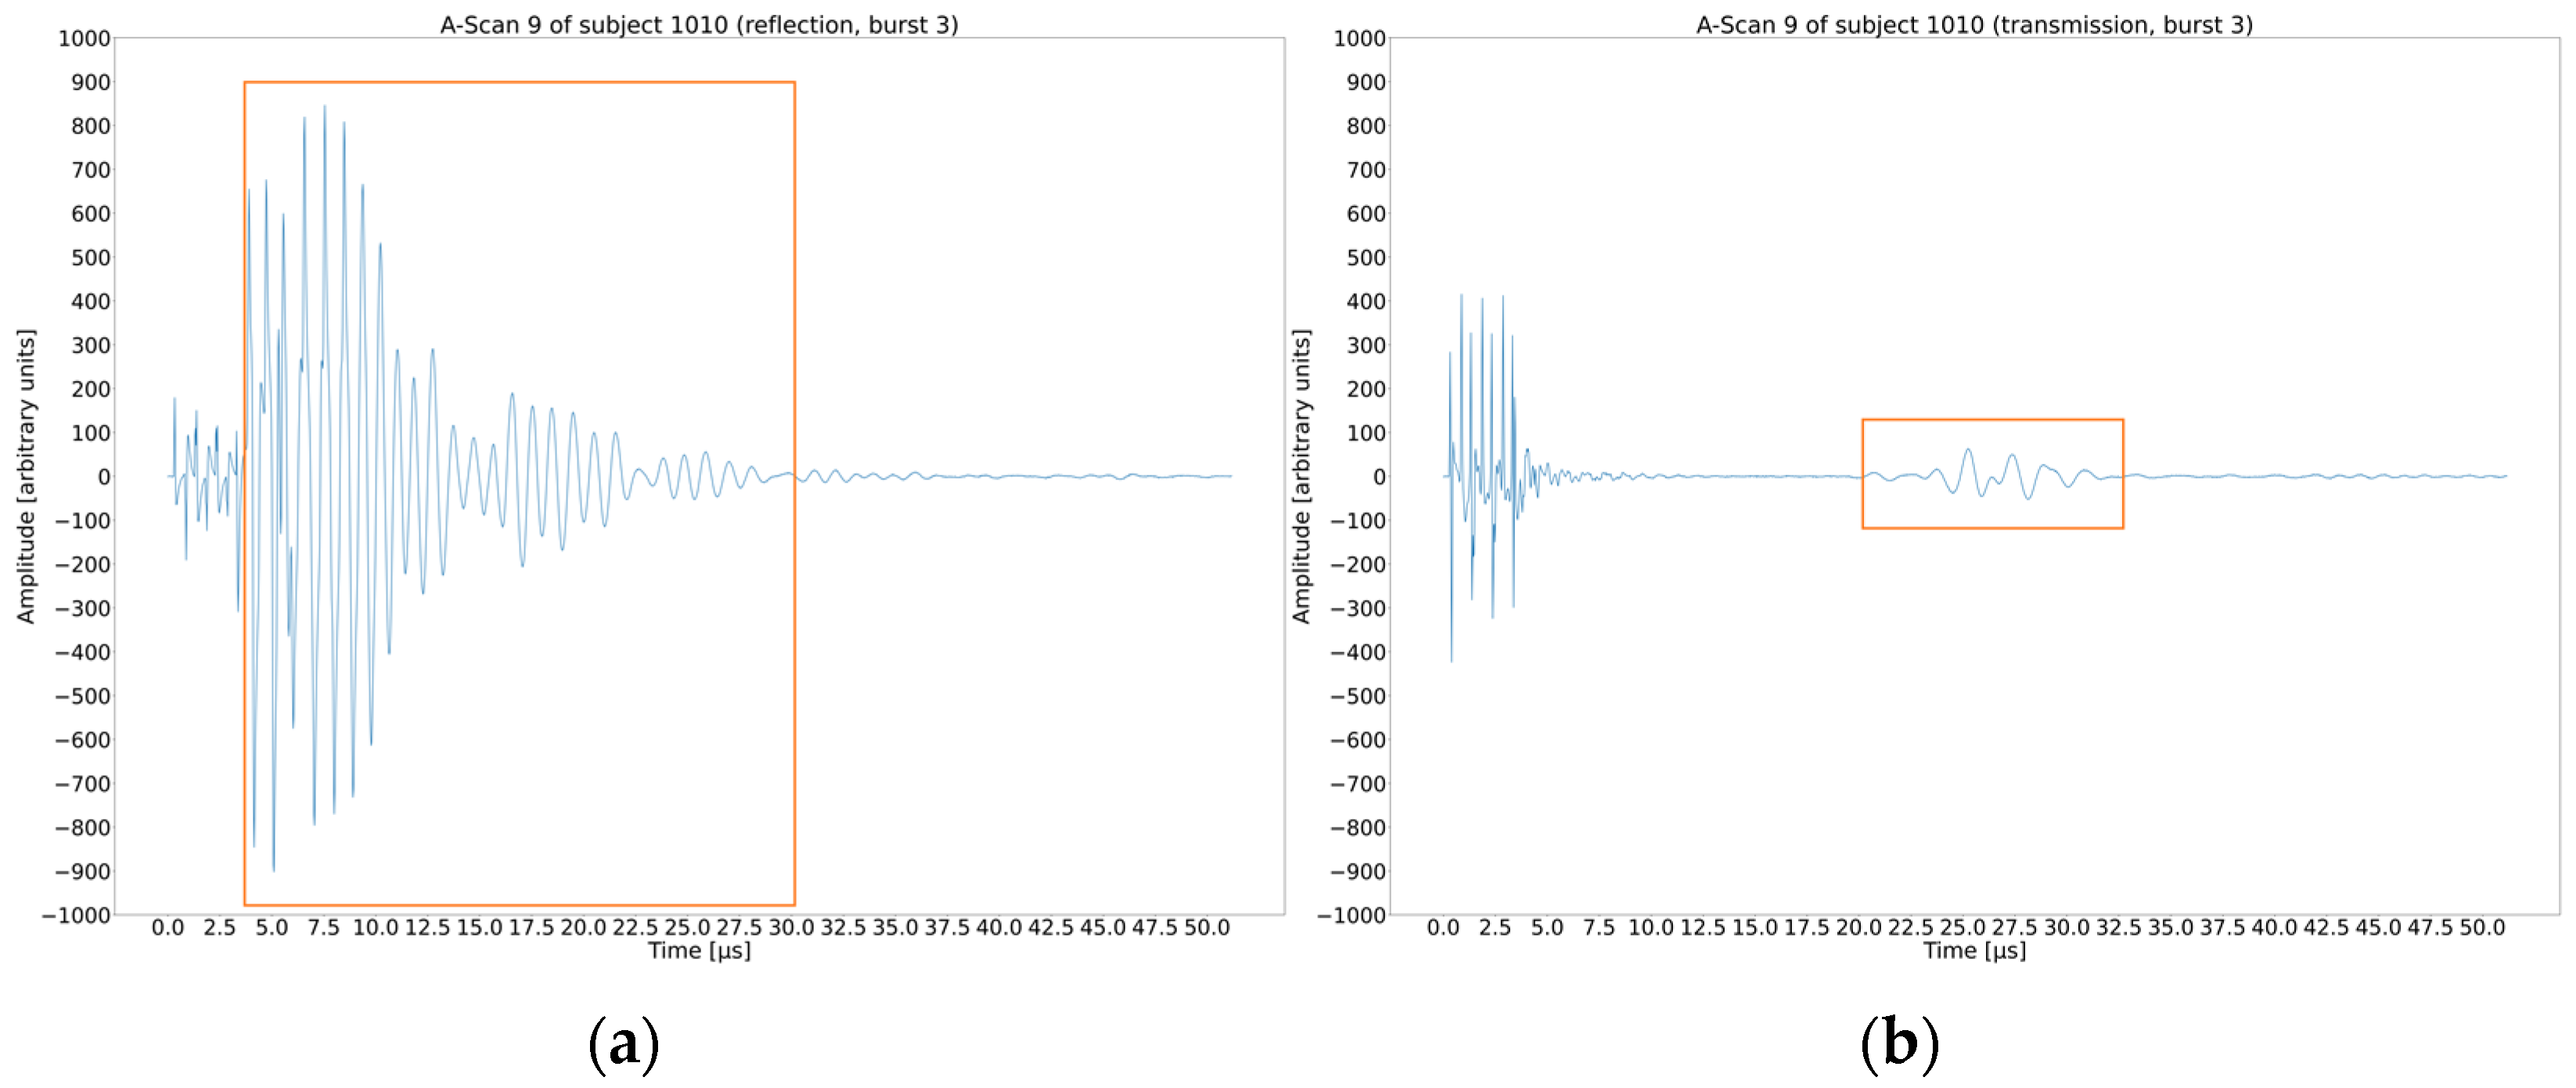
2.5. Classical Digital Signal Processing
2.6. Machine Learning
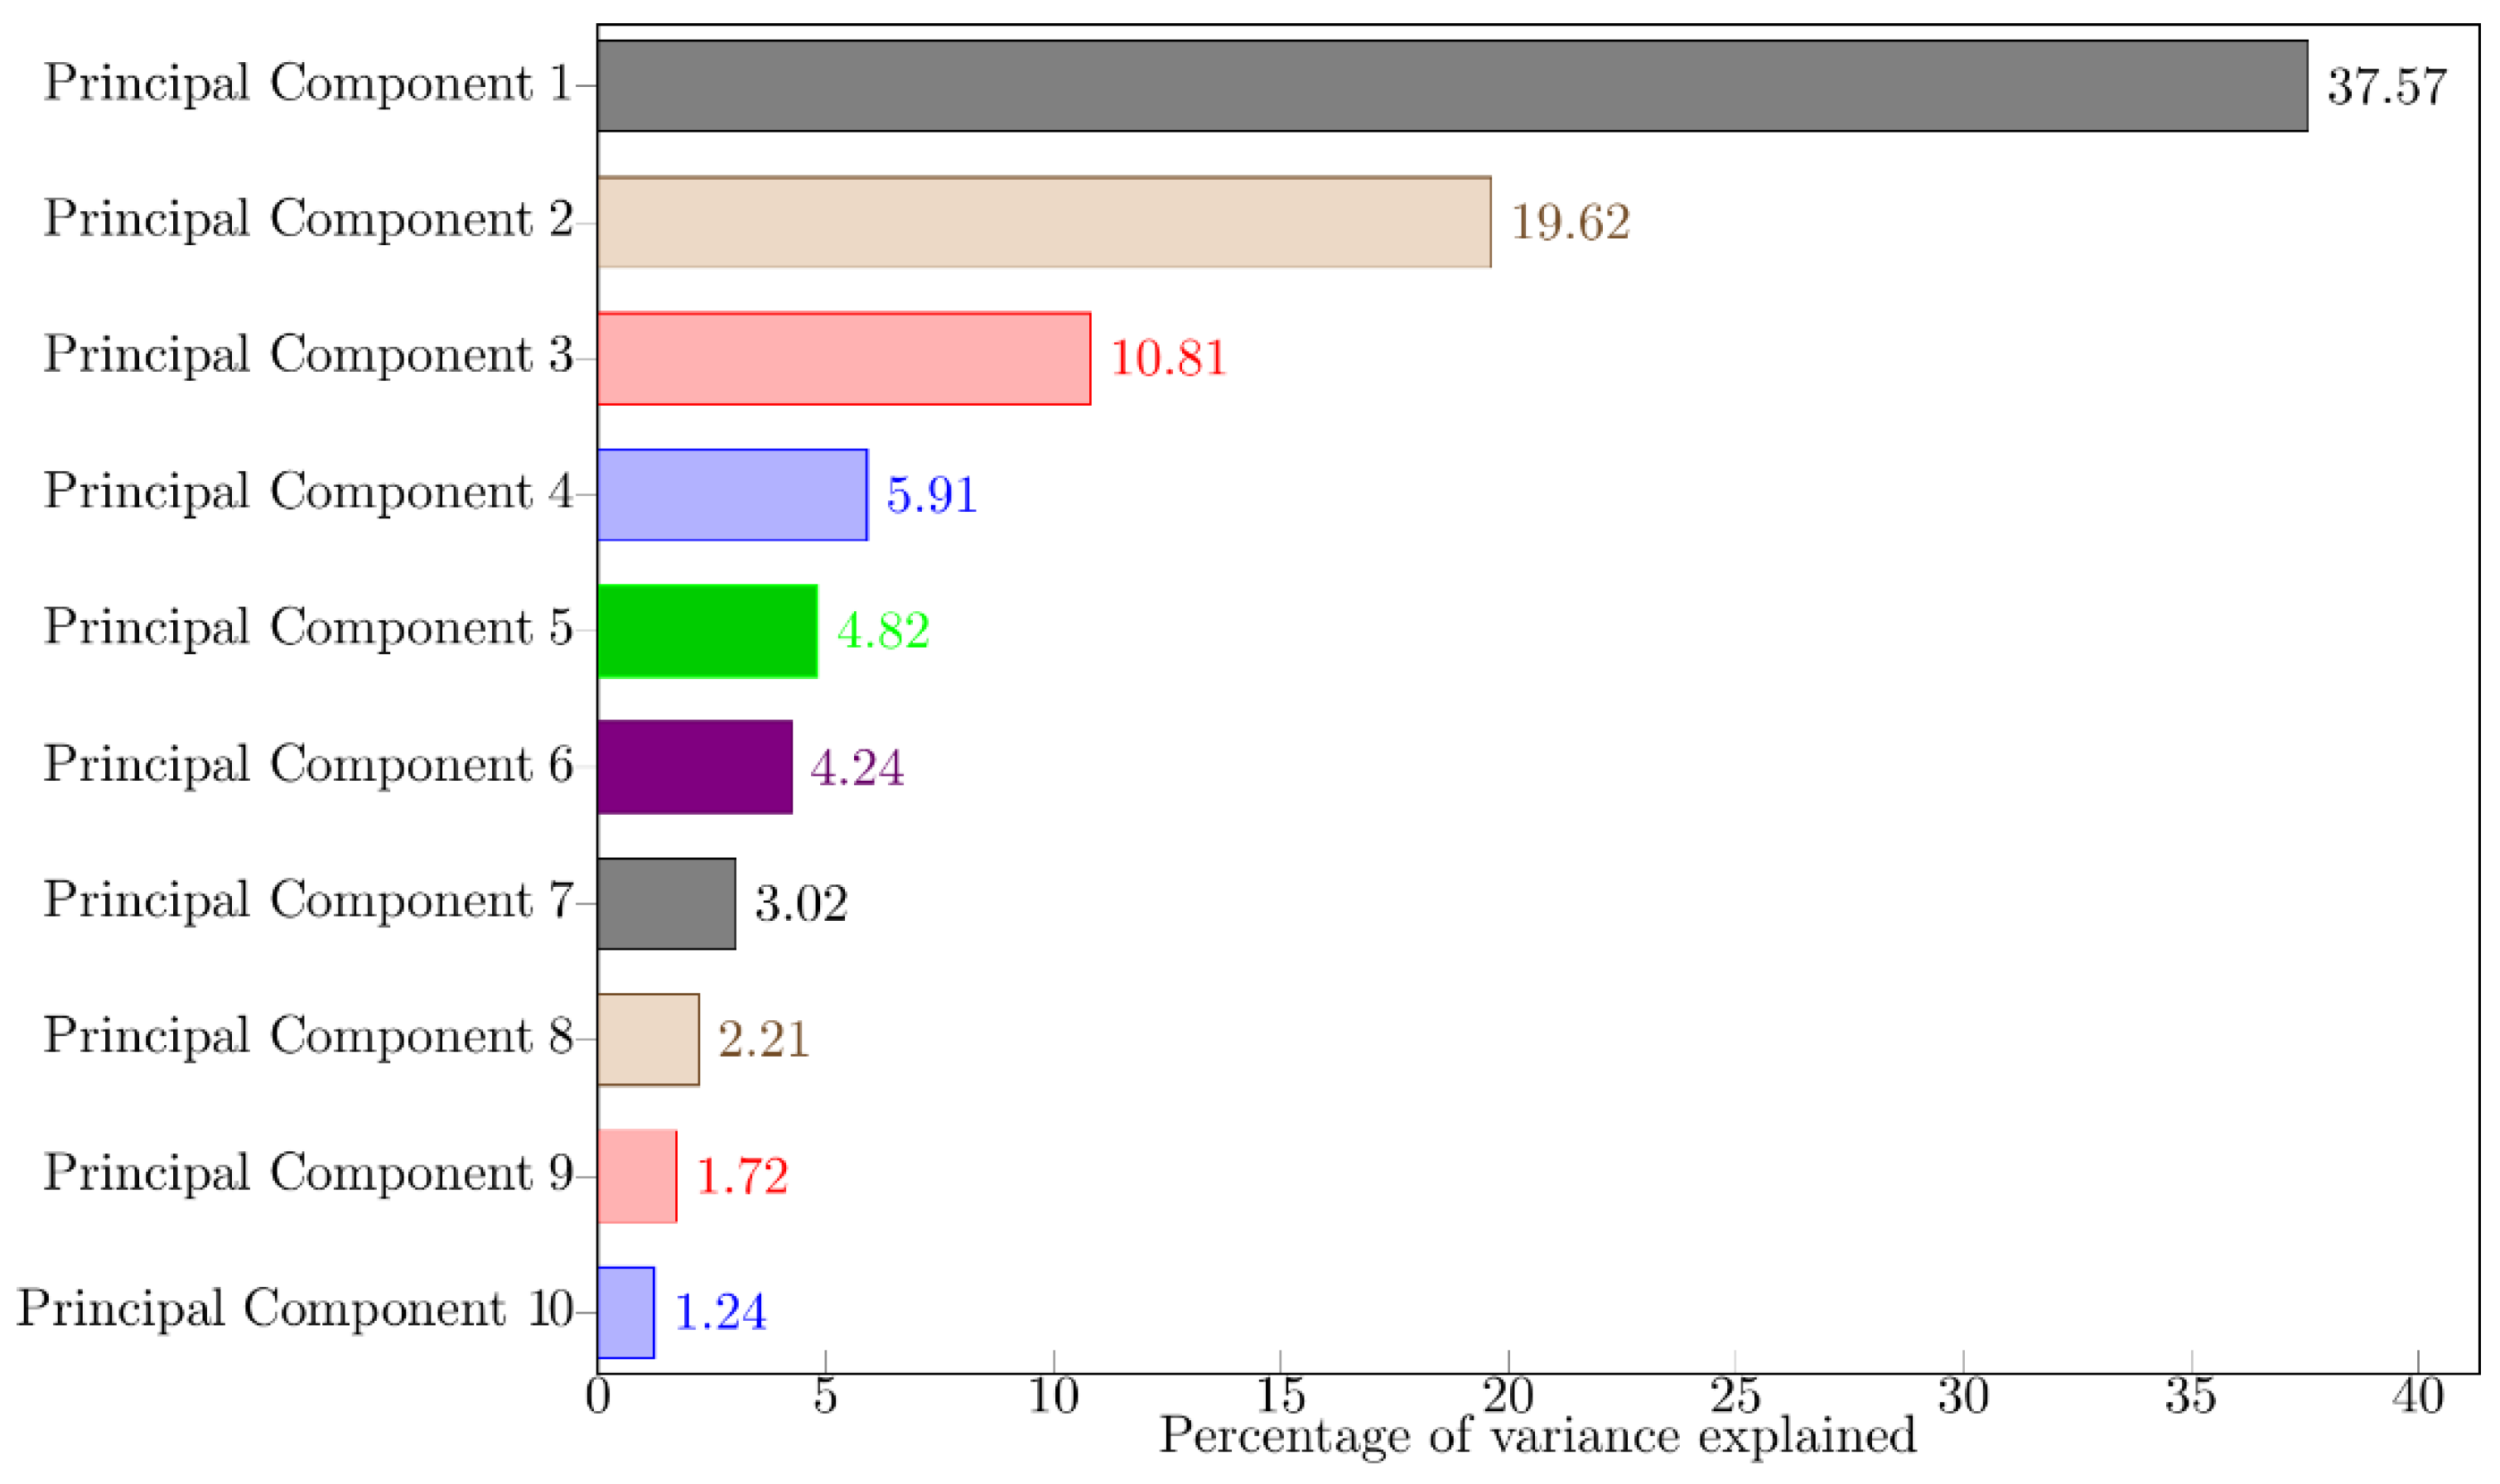
2.6.1. Dimensionality Reduction Techniques
2.6.2. Classification Methods
3. Results
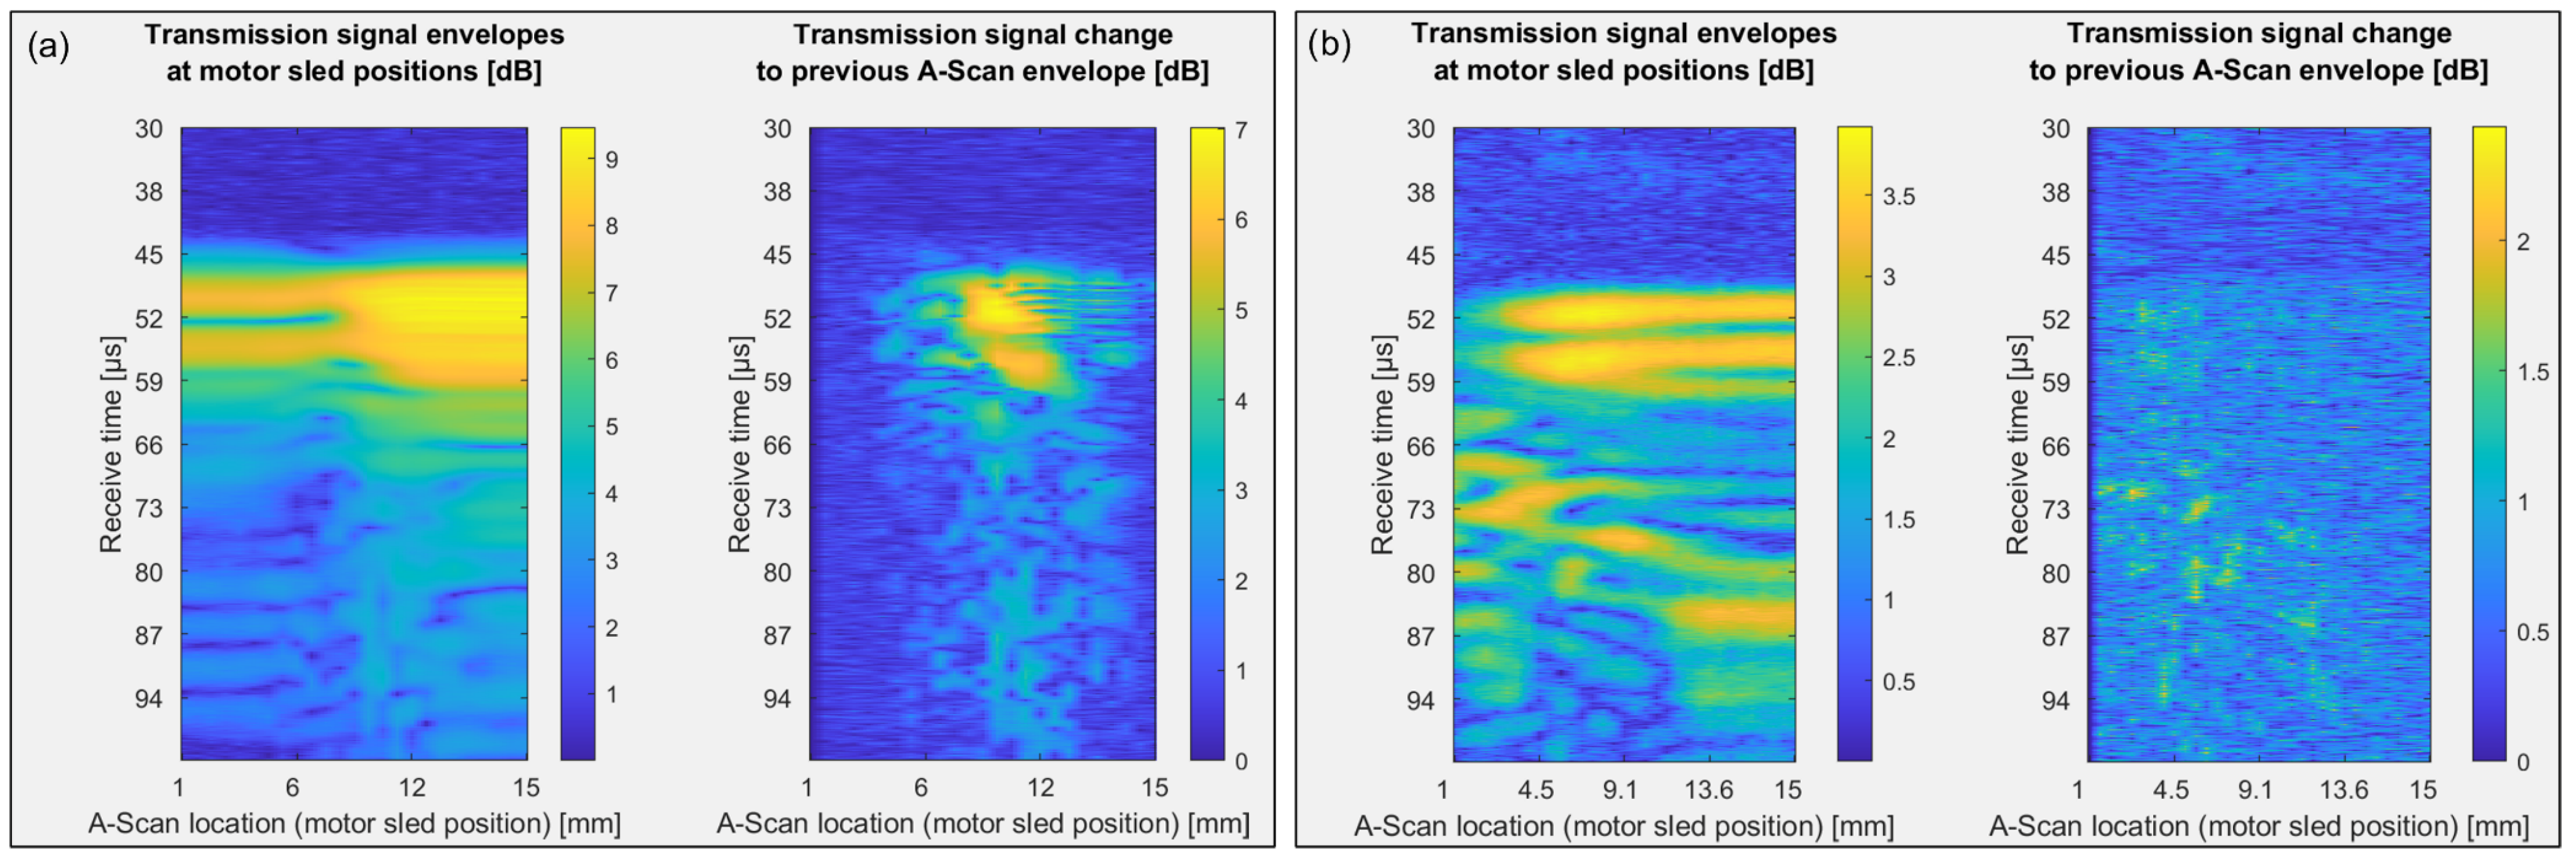
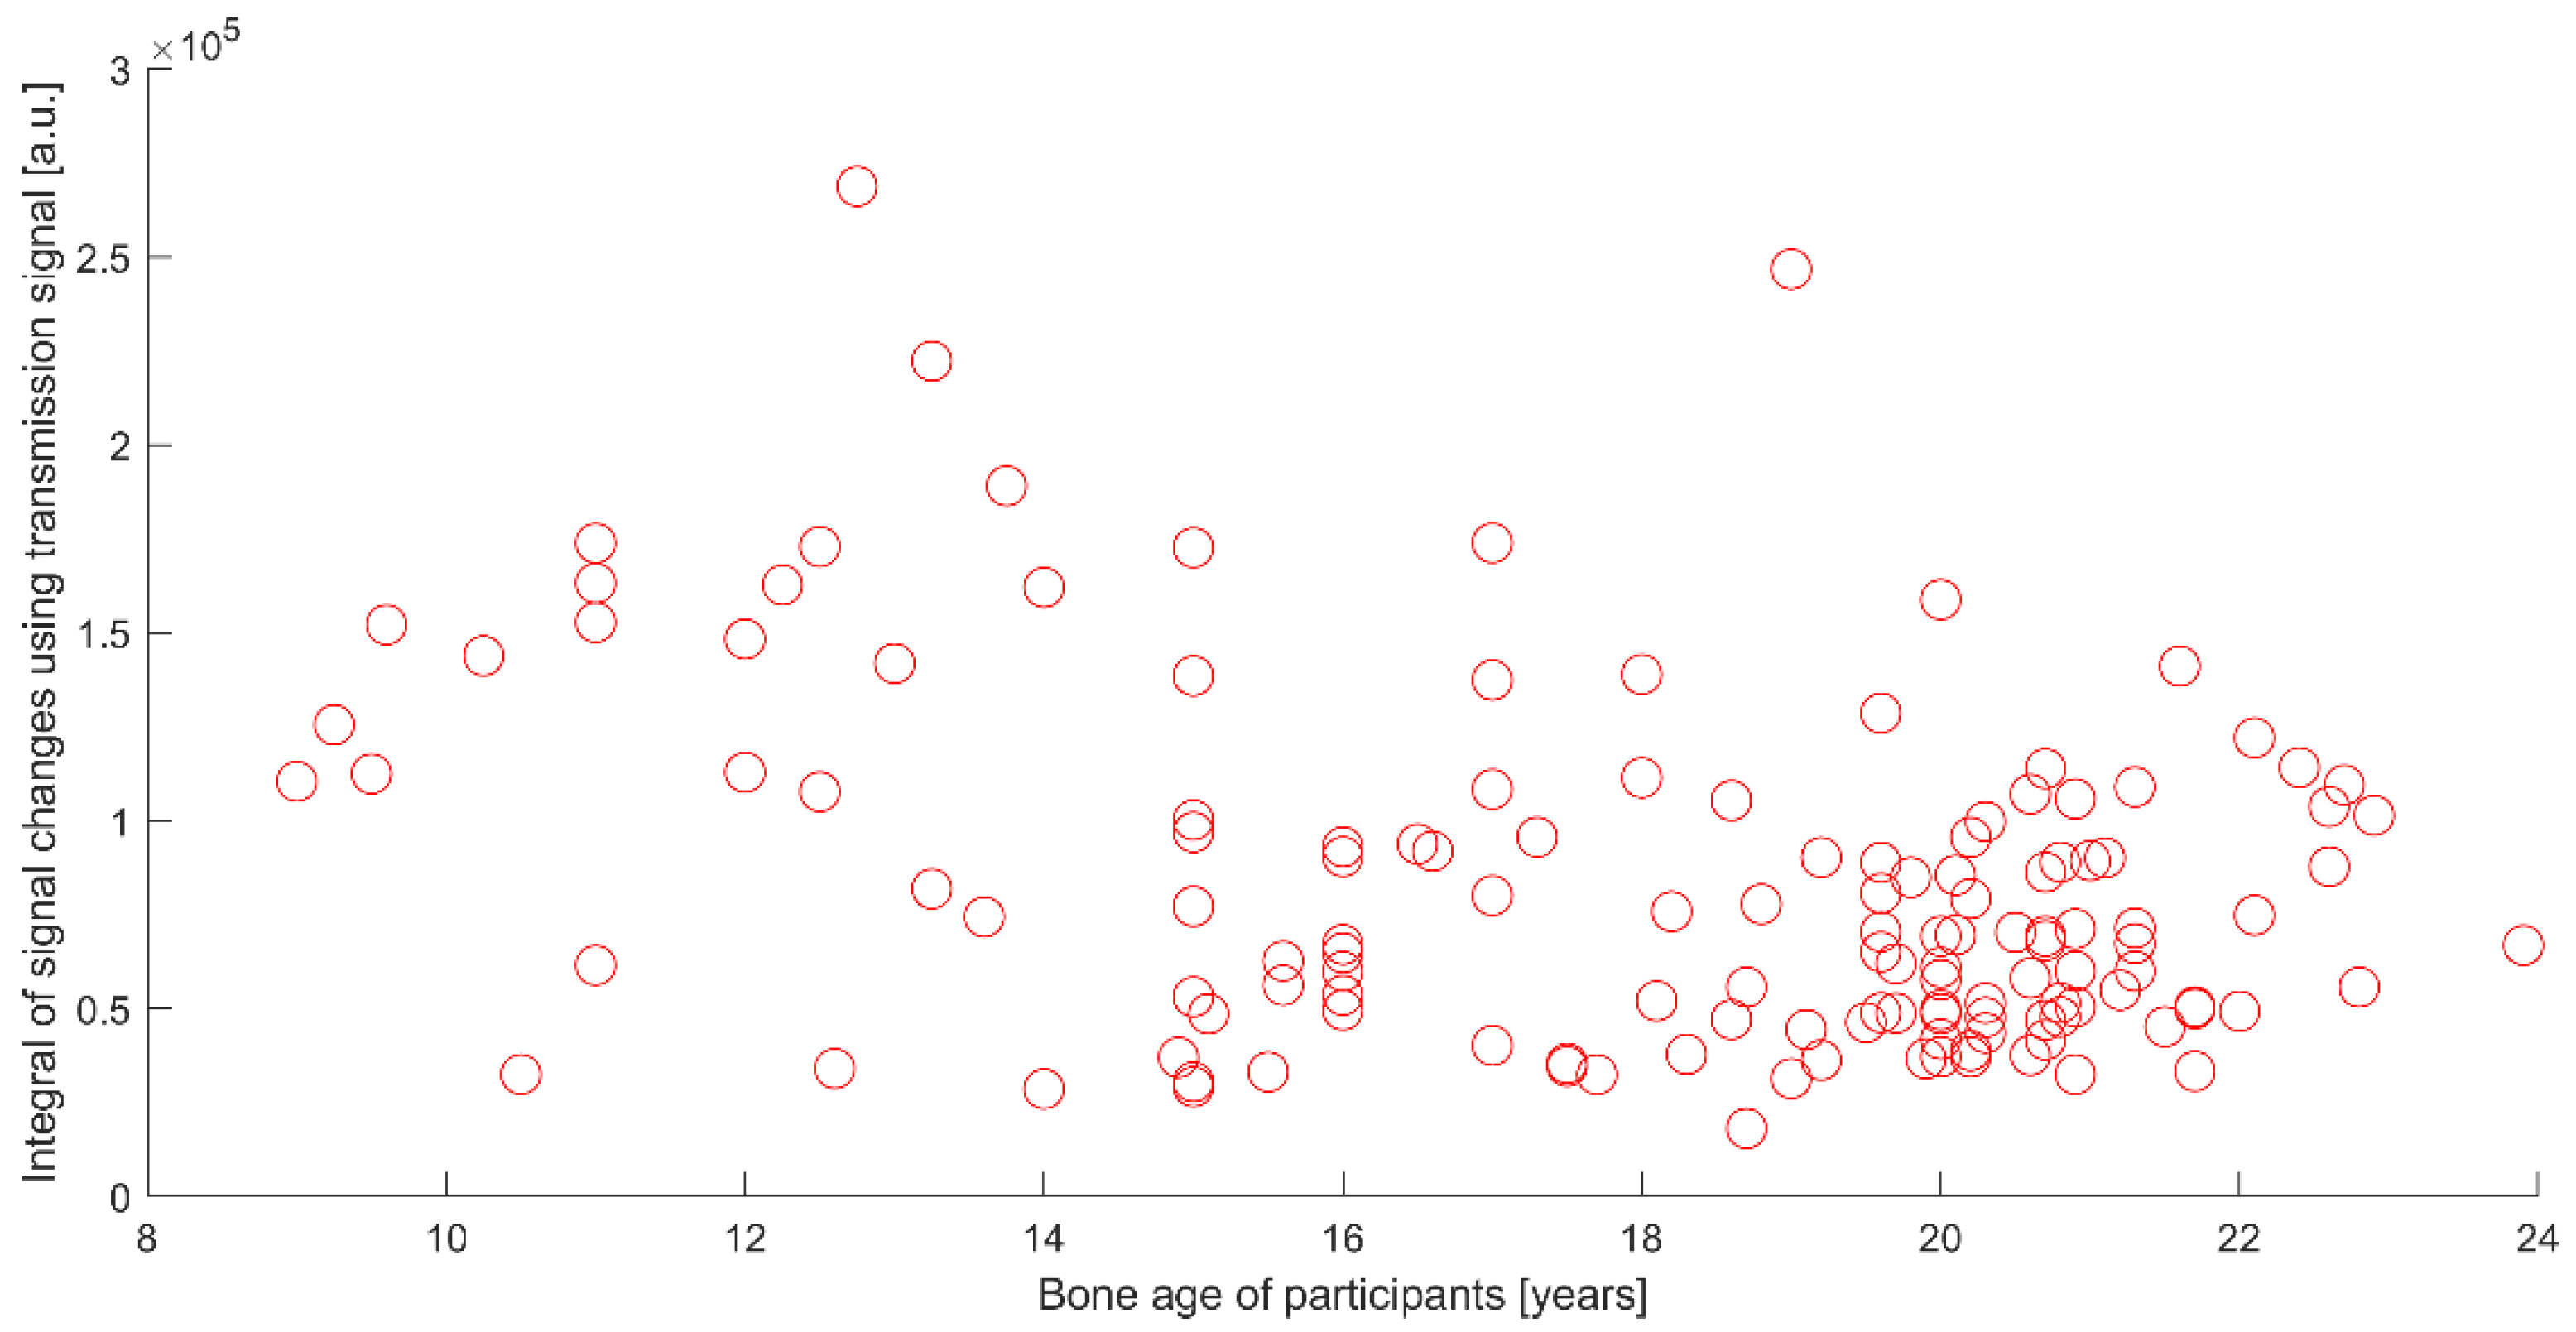
3.1. Classical Digital Signal Processing
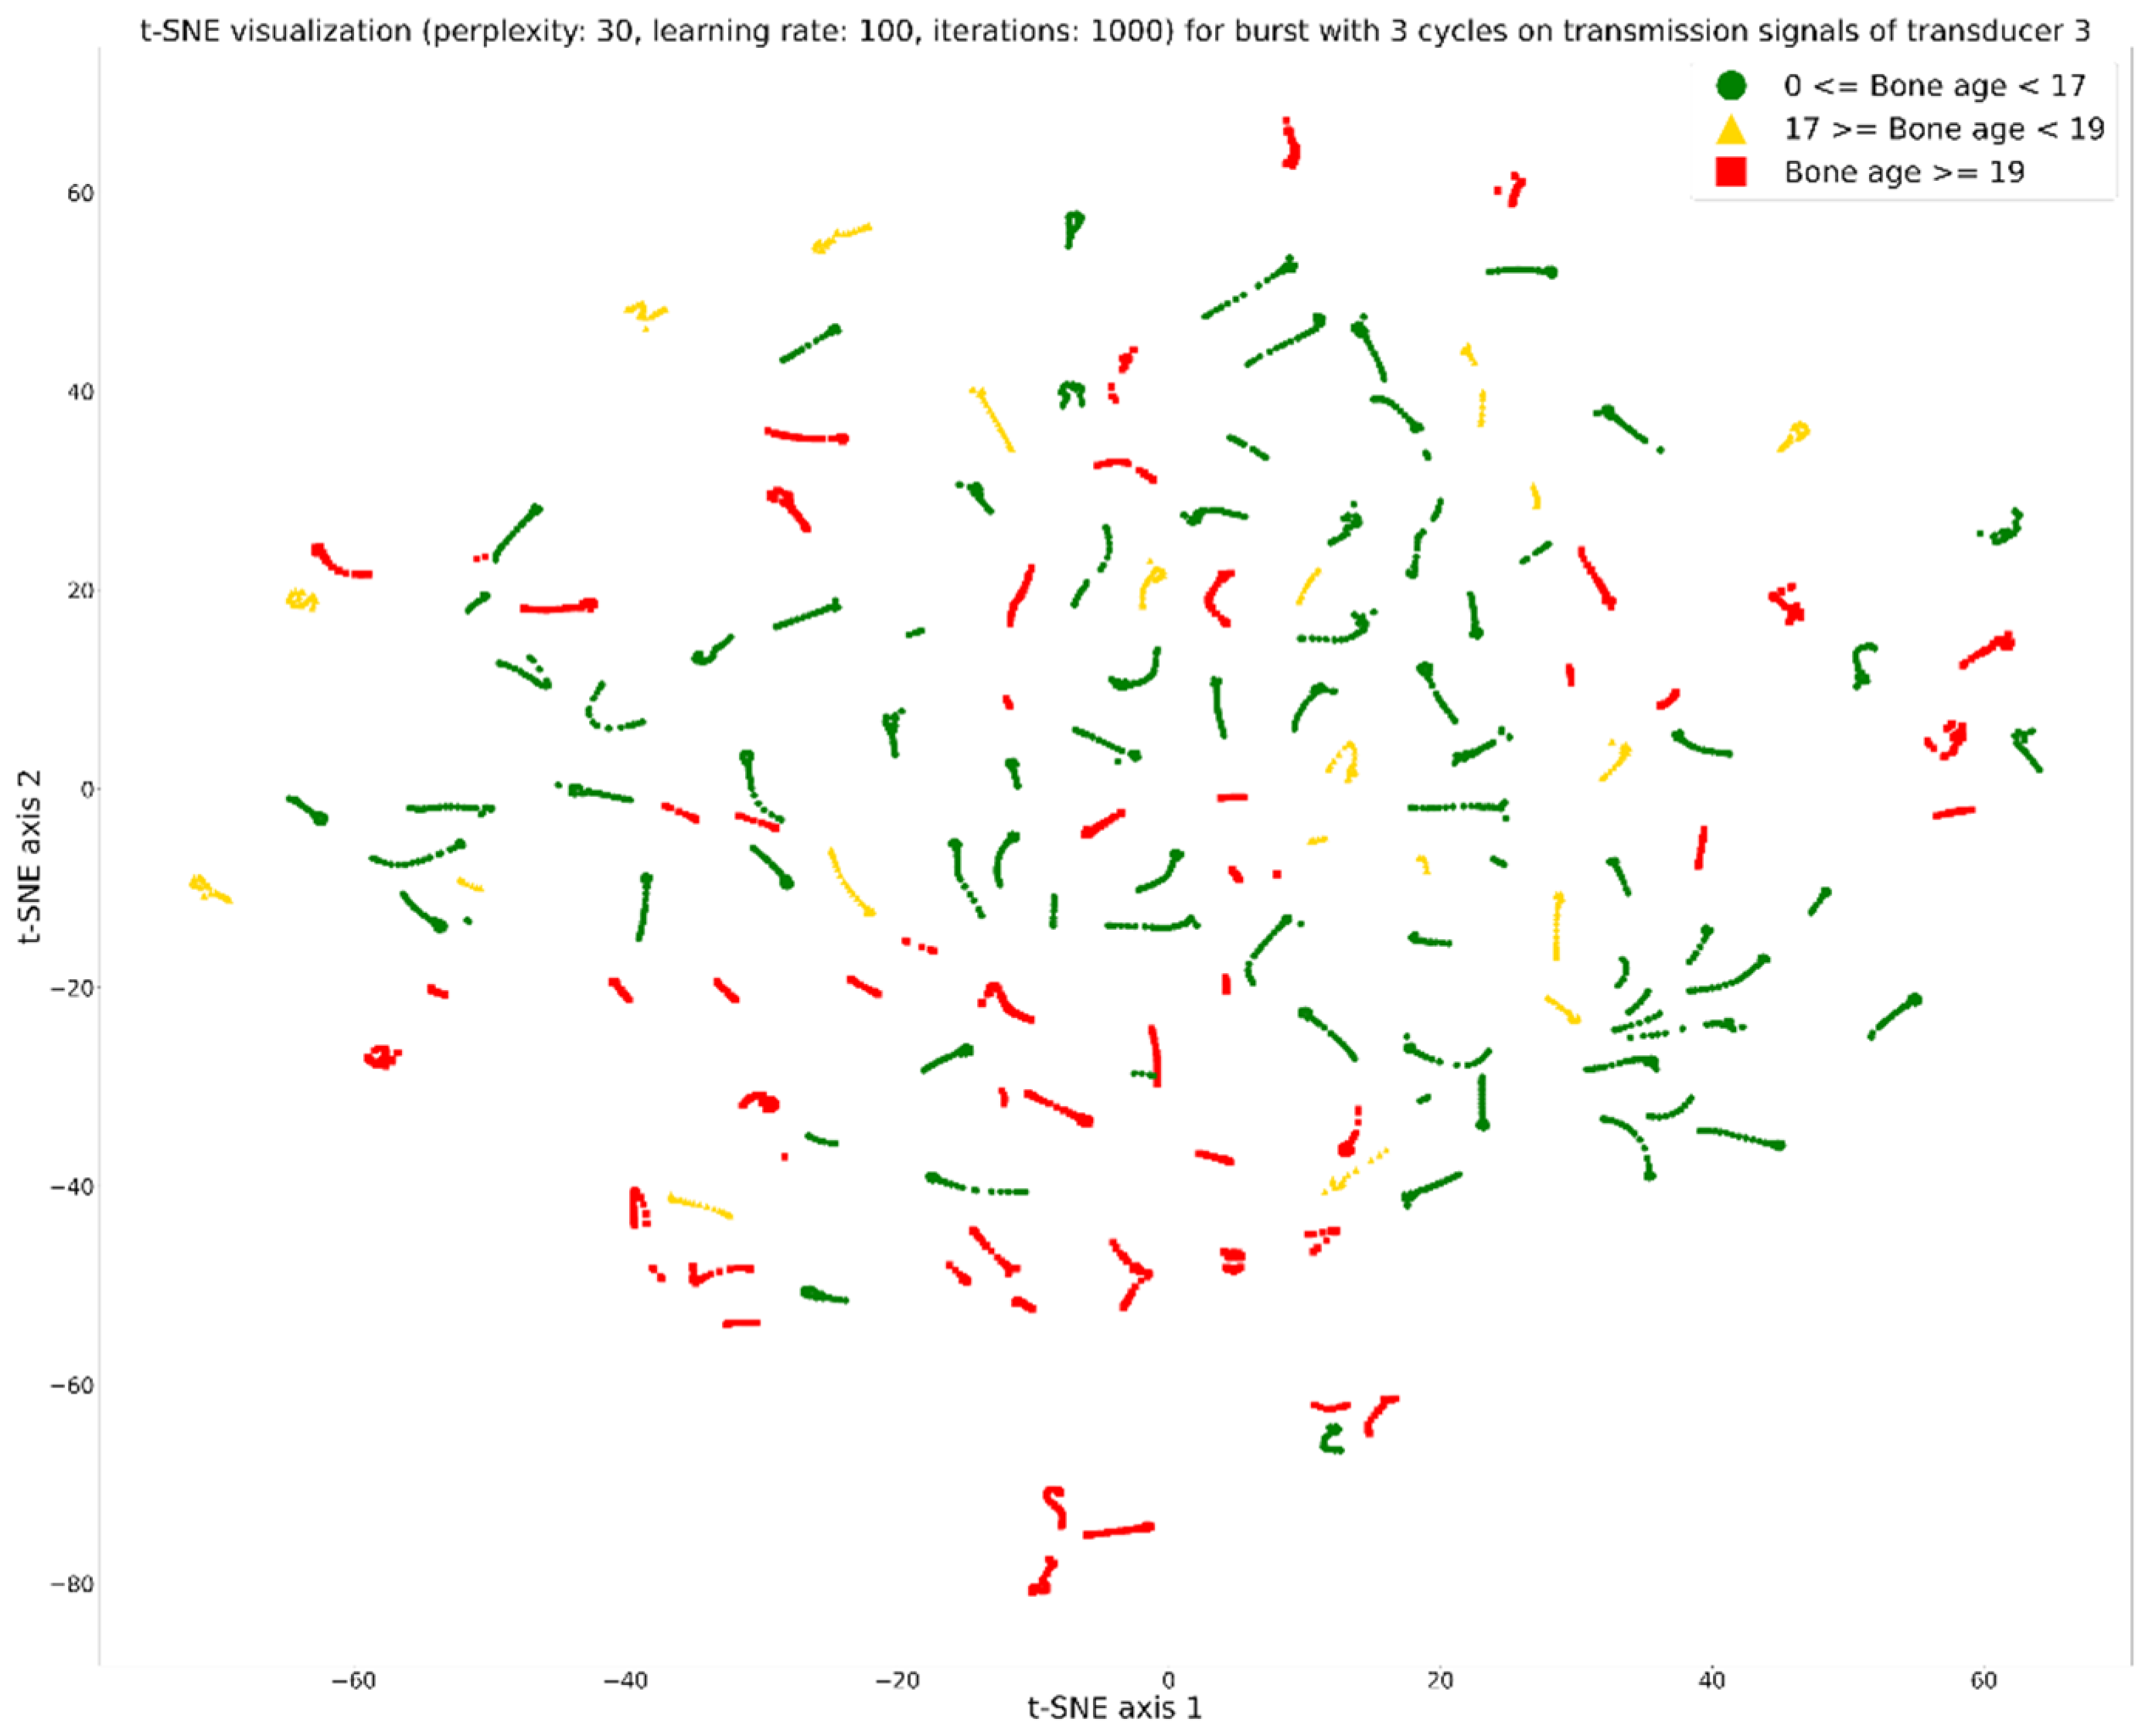
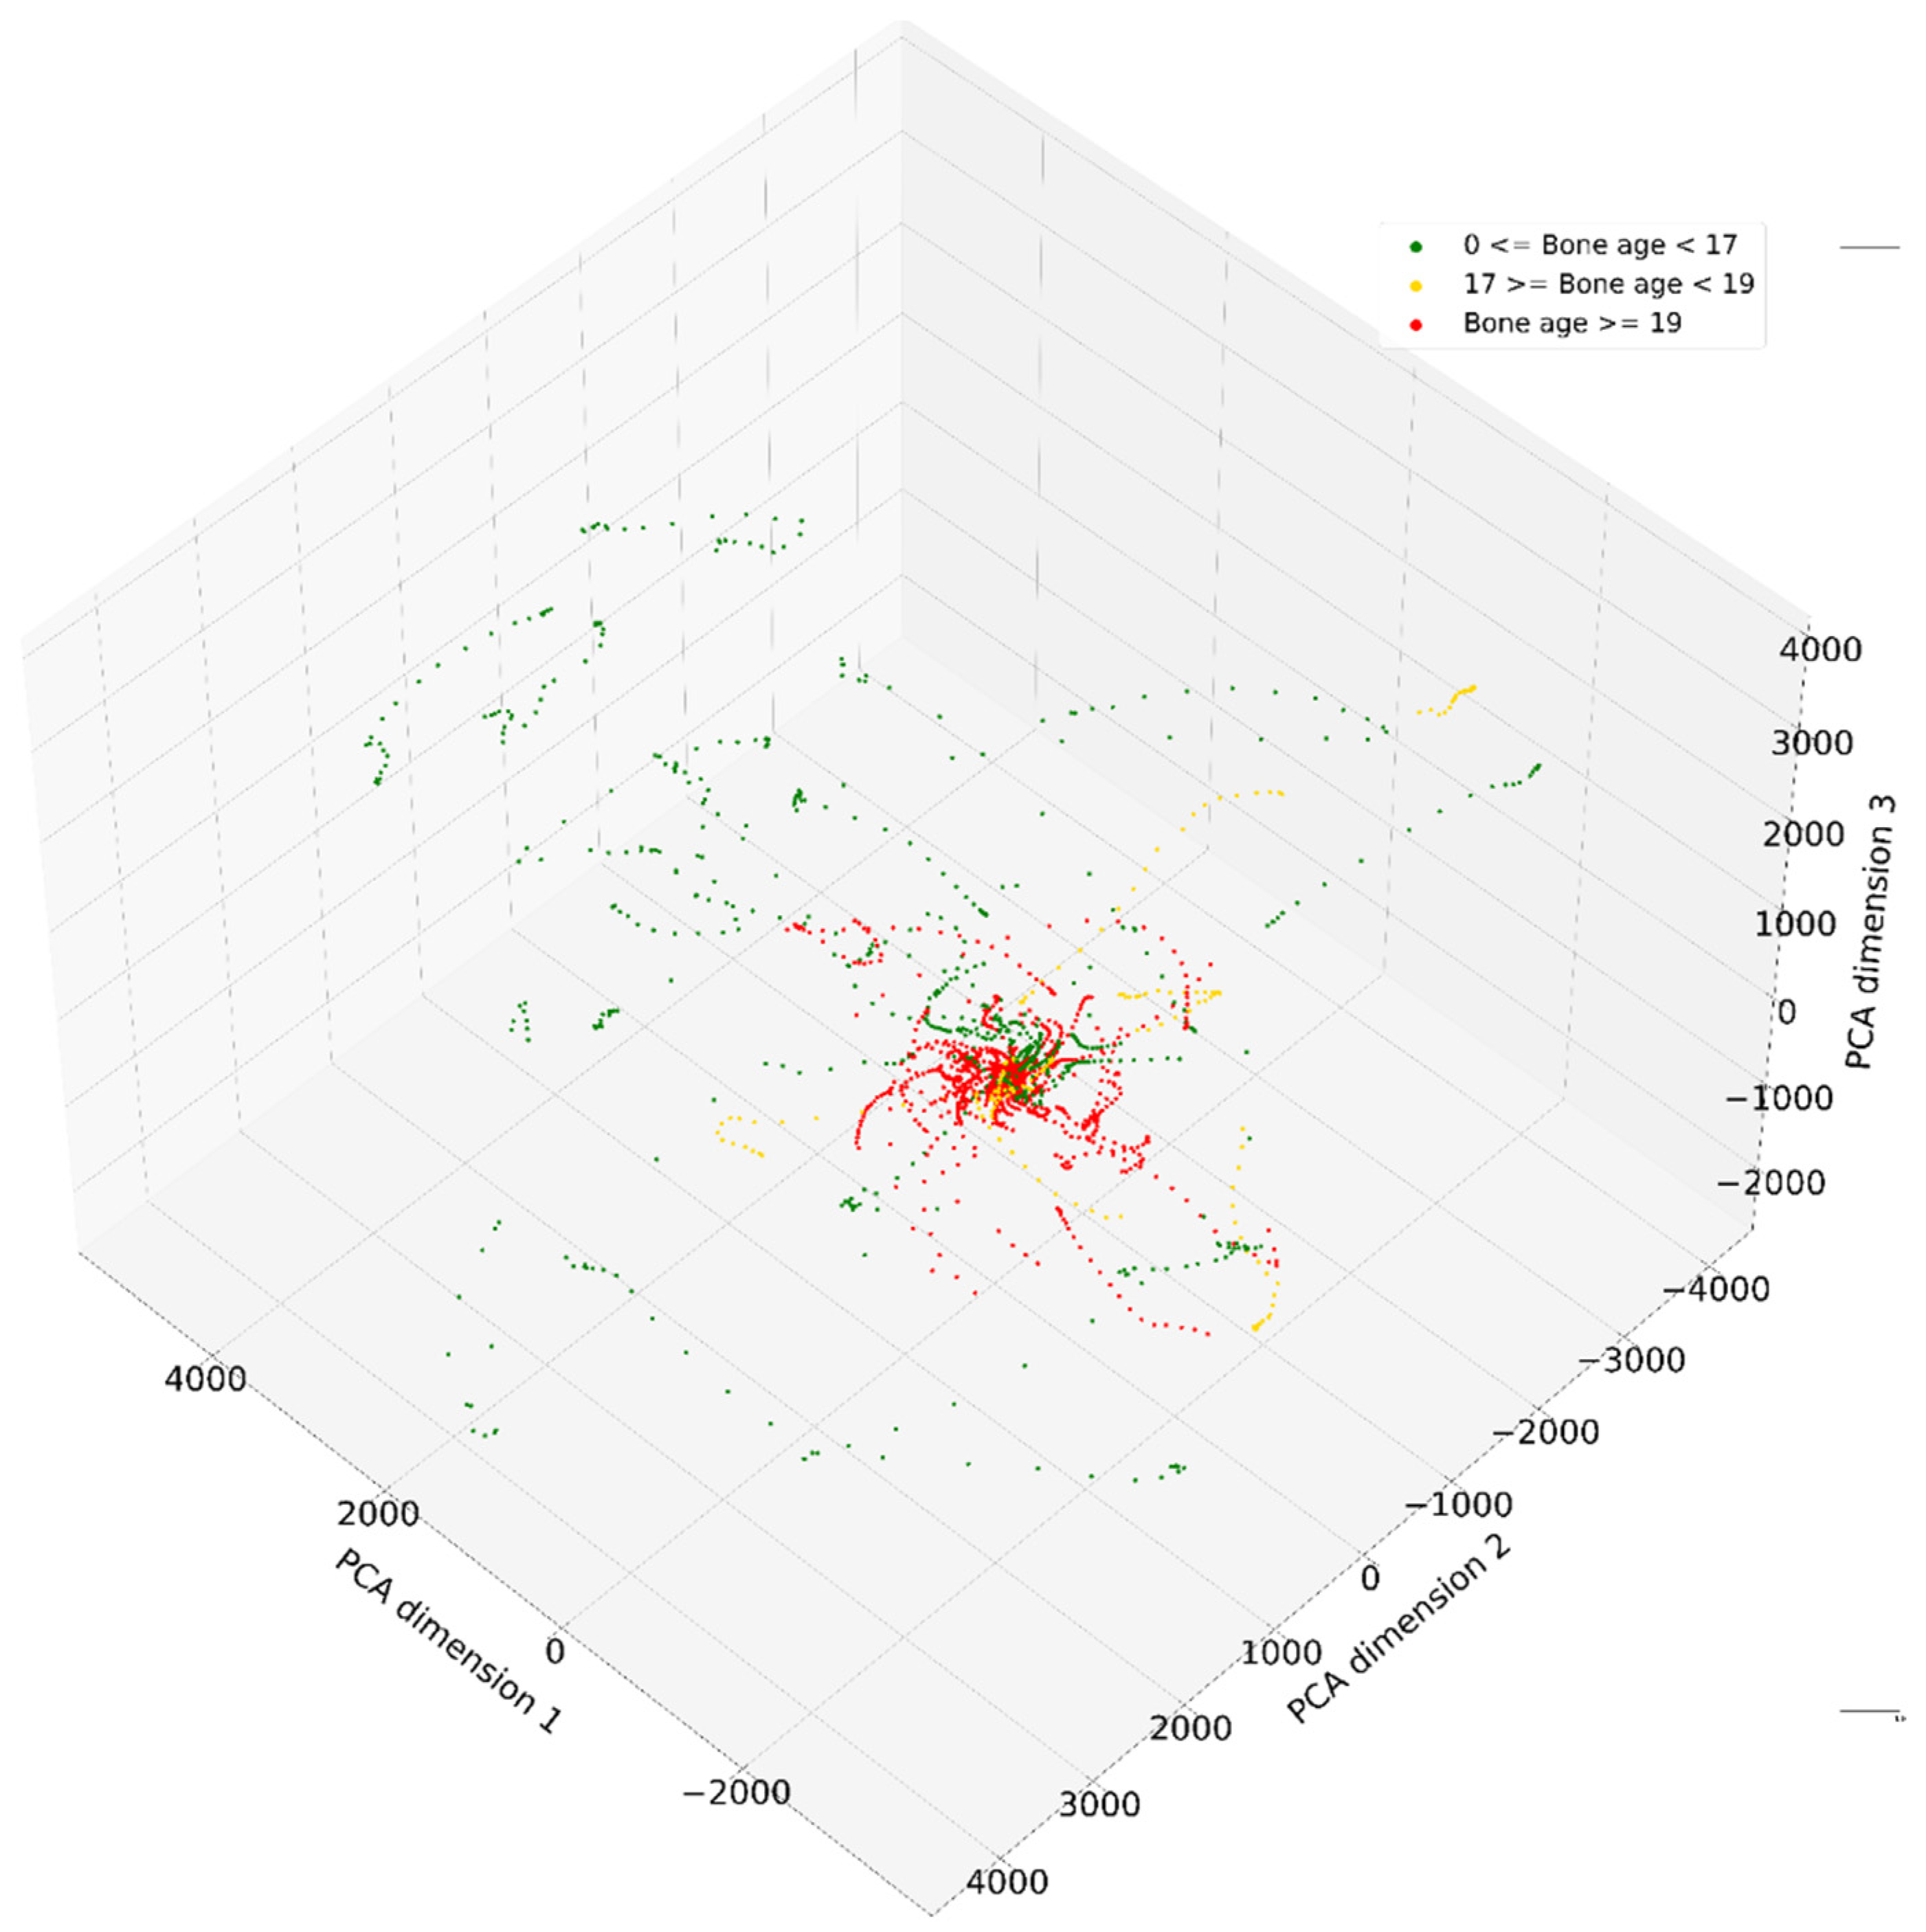
3.2. Machine Learning
4. Discussion
5. Conclusions
Author Contributions
Funding
Institutional Review Board Statement
Informed Consent Statement
Data Availability Statement
Conflicts of Interest
References
- Mughal, A.M.; Hassan, N.; Ahmed, A. Bone age assessment methods: A Critical Review. Pak. J. Med. Sci. 2014, 30, 211. [Google Scholar] [CrossRef] [PubMed]
- Creo, A.L.; Schwenk, W.F. Bone age: A Handy Tool for Pediatric Providers. Pediatrics 2017, 140, e20171486. [Google Scholar] [CrossRef] [PubMed] [Green Version]
- Ubelaker, D.H.; Khosrowshahi, H. Estimation of age in forensic anthropology: Historical Perspective and Recent Methodological Advances. Forensic Sci. Res. 2019, 4, 1–9. [Google Scholar] [CrossRef] [PubMed]
- Sauer, P.J.; Nicholson, A.; Neubauer, D. Age determination in asylum seekers: Physicians Should Not Be Implicated. Eur. J. Pediatr. 2016, 175, 299–303. [Google Scholar] [CrossRef] [Green Version]
- Hassan, N.; Noor, F.; Ahmad, S.; Fazili, K.M. Age of fusion of the distal radial and ulnar epiphyses from hand radiographs—A study in Kashmiri population. Sci. Justice 2016, 56, 431–436. [Google Scholar] [CrossRef]
- Greulich, W.; Pyle, S. Radiographic atlas of skeletal development of the hand and wrist. Am. J. Phys. Anthr. 1950, 8, 518–520. [Google Scholar] [CrossRef] [Green Version]
- Tanner, J.M.; Cameron, N. Assessment of Skeletal Maturity and Prediction of Adult Height (TW3 Method), 3rd ed.; Saunders: London, UK, 2001. [Google Scholar]
- Gilsanz, V.; Ratib, O. Hand Bone Age: A Digital Atlas of Skeletal Maturity; Springer: Berlin, Germany, 2005; pp. 11–19. [Google Scholar] [CrossRef]
- Schmidt, S.; Nitz, I.; Schulz, R.; Tsokos, M.; Schmeling, A. The digital atlas of skeletal maturity by Gilsanz and Ratib: A Suitable Alternative for Age Estimation of Living Individuals in Criminal Proceedings? Int. J. Leg. Med. 2009, 123, 489–494. [Google Scholar] [CrossRef]
- Alshamrani, K.; Messina, F.; Offiah, A.C. Is the Greulich and Pyle atlas applicable to all ethnicities? A systematic review and meta-analysis. Eur. Radiol. 2019, 29, 2910–2923. [Google Scholar] [CrossRef] [Green Version]
- Hojreh, A.; Gamper, J.; Schmook, M.T.; Weber, M.; Prayer, D.; Herold, C.J.; Noebauer-Huhmann, I.M. Hand MRI and the Greulich-Pyle atlas in skeletal age estimation in adolescents. Skelet. Radiol. 2018, 47, 963–971. [Google Scholar] [CrossRef] [Green Version]
- Pennock, A.T.; Bomar, J.D.; Manning, J.D. The creation and validation of a knee bone age atlas utilizing MRI. JBJS 2018, 100, e20. [Google Scholar] [CrossRef]
- Langton, C.M.; Palmer, S.B.; Porter, R.W. The measurement of broadband ultrasonic attenuation in cancellous bone. Eng. Med. 1984, 13, 89–91. [Google Scholar] [CrossRef] [PubMed] [Green Version]
- Chen, Z.; Luo, W.; Zhang, Q.; Lei, B.; Wang, T.; Chen, Z.; Liu, J. Osteoporosis Diagnosis Based on Ultrasound Radio Frequency Signal via Multi-channel Convolutional Neural Network. In Proceedings of the 2021 43rd Annual International Conference of the IEEE Engineering in Medicine & Biology Society (EMBC), Guadalajara, Mexico, 1–5 November 2021; IEEE: New York, NY, USA, 2021; pp. 832–835. [Google Scholar] [CrossRef]
- Castriota-Scanderbeg, A.D.M.V.; De Micheli, V. Ultrasound of femoral head cartilage: A New Method of Assessing Bone age. Skelet. Radiol. 1995, 24, 197–200. [Google Scholar] [CrossRef] [PubMed]
- Castriota-Scanderbeg, A.; Sacco, M.C.; Emberti-Gialloreti, L.; Fraracci, L. Skeletal age assessment in children and young adults: Comparison between a Newly Developed Sonographic Method and Conventional Methods. Skelet. Radiol. 1998, 27, 271–277. [Google Scholar] [CrossRef] [PubMed]
- Shimura, N.; Koyama, S.; Arisaka, O.; Imataka, M.; Sato, K.; Matsuura, M. Assessment of measurement of children’s bone age ultrasonically with Sunlight BonAge. Clin. Pediatr. Endocrinol. 2005, 14, S24_17–S24_20. [Google Scholar] [CrossRef] [Green Version]
- Mentzel, H.J.; Vilser, C.; Eulenstein, M.; Schwartz, T.; Vogt, S.; Böttcher, J.; Kaiser, W.A. Assessment of skeletal age at the wrist in children with a new ultrasound device. Pediatr. Radiol. 2005, 35, 429–433. [Google Scholar] [CrossRef]
- Mentzel, H.J.; Vogt, S.; Vilser, C.; Schwartz, T.; Eulenstein, M.; Böttcher, J.; Kaiser, W.A. Abschätzung des Knochenalters mit einer neuen Ultraschallmethode. In RöFo-Fortschritte auf dem Gebiet der Röntgenstrahlen und der bildgebenden Verfahren; Georg Thieme Verlag: New York, NY, USA, 2005; Volume 177, pp. 1699–1705. [Google Scholar] [CrossRef]
- Laugier, P.; Talmant, M.; Thien-Ly, P.H.A.M. Quo vadis, ultrasonics of bone? Present state and future trends. Arch. Acoust. 2008, 33, 553–564. [Google Scholar]
- Khan, K.M.; Miller, B.S.; Hoggard, E.; Somani, A.; Sarafoglou, K. Application of ultrasound for bone age estimation in clinical practice. J. Pediatr. 2009, 154, 243–247. [Google Scholar] [CrossRef]
- Rachmiel, M.; Naugolani, L.; Mazor-Aronovitch, K.; Levin, A.; Koren-Morag, N.; Bistritzer, T. Bone age assessment by a novel quantitative ultrasound based device (SonicBone), is comparable to the conventional Greulich and Pyle method. Horm. Res. Pediatr. 2013, 80, 35. [Google Scholar]
- Aref Elnasasra, M.D.; Hilmi Alnsasra, M.D.; Rozalia Smolyakov, M.D.; Klaris Riesenberg, M.D.; Lior Nesher, M.D. Bone age assessments by quantitative ultrasound (SonicBone) and hand X-ray based methods are comparable. Isr. Med. Assoc. J. IMAJ 2017, 9, 533–538. [Google Scholar]
- Windschall, D.; Pommerenke, M.; Haase, R. Ultrasound assessment of the skeletal development of the proximal tibial, proximal femoral, and distal femoral epiphyses in premature and mature newborns. Ultrasound Med. Biol. 2016, 42, 451–458. [Google Scholar] [CrossRef]
- Torenek Ağırman, K.; Bilge, O.M.; Miloğlu, Ö. Ultrasonography in determining pubertal growth and bone age. Dentomaxillofacial. Radiol. 2018, 47, 20170398. [Google Scholar] [CrossRef] [PubMed]
- Prokop-Piotrkowska, M.; Marszałek-Dziuba, K.; Moszczyńska, E.; Szalecki, M.; Jurkiewicz, E. Traditional and new methods of bone age assessment-an overview. J. Clin. Res. Pediatr. Endocrinol. 2021, 13, 251. [Google Scholar] [CrossRef] [PubMed]
- Ekizoglu, O.; Er, A.; Buyuktoka, A.D.; Bozdag, M.; Karaman, G.; Moghaddam, N.; Grabherr, S. Ultrasonographic assessment of ossification of the distal radial epiphysis for estimating forensic age. Int. J. Leg. Med. 2021, 135, 1573–1580. [Google Scholar] [CrossRef] [PubMed]
- Bagnall, A.; Lines, J.; Bostrom, A.; Large, J.; Keogh, E. The great time series classification bake off: A Review and Experimental Evaluation of Recent Algorithmic Advances. Data Min. Knowl. Discov. 2017, 31, 606–660. [Google Scholar] [CrossRef] [PubMed] [Green Version]
- Mitsa, T. Temporal Data Mining; Chapman and Hall/CRC: London, UK, 2010. [Google Scholar] [CrossRef]
- Susto, G.A.; Cenedese, A.; Terzi, M. Time-series classification methods: Review and Applications to Power Systems Data. Big Data Appl. Power Syst. 2018, 179–220. [Google Scholar] [CrossRef]
- Wang, Z.; Yan, W.; Oates, T. Time series classification from scratch with deep neural networks: A Strong Baseline. In Proceedings of the 2017 International Joint Conference on Neural Networks (IJCNN), Anchorage, AK, USA, 14–19 May 2017; IEEE: New York, NY, USA, 2017; pp. 1578–1585. [Google Scholar] [CrossRef] [Green Version]
- Ismail Fawaz, H.; Forestier, G.; Weber, J.; Idoumghar, L.; Muller, P.A. Deep learning for time series classification: A Review. Data Min. Knowl. Discov. 2019, 33, 917–963. [Google Scholar] [CrossRef] [Green Version]
- Vidnerová, P. RBF-Keras: An RBF Layer for Keras Library. 2019. Available online: https://github.com/PetraVidnerova/rbf_keras (accessed on 15 February 2022).
- Chen, T.; Guestrin, C. Xgboost: A Scalable Tree Boosting System. In Proceedings of the 22nd ACM Sigkdd International Conference on Knowledge Discovery and Data Mining, San Francisco, CA, USA, 13–17 August 2016; Association for Computing Machinery: New York, NY, USA, 2016; pp. 785–794. [Google Scholar] [CrossRef] [Green Version]
- Ke, G.; Meng, Q.; Finley, T.; Wang, T.; Chen, W.; Ma, W.; Liu, T.Y. Lightgbm: A Highly Efficient Gradient Boosting Decision Tree. Adv. Neural Inf. Process. Syst. 2017, 30, 3149–3157. [Google Scholar]
- Prokhorenkova, L.; Gusev, G.; Vorobev, A.; Dorogush, A.V.; Gulin, A. CatBoost: Unbiased Boosting with Categorical Features. arXiv 2018, arXiv:1706.09516. [Google Scholar]
- Hewener, H.; Risser, C.; Brausch, L.; Rohrer, T.; Tretbar, S. A mobile ultrasound system for majority detection. In Proceedings of the 2019 IEEE International Ultrasonics Symposium (IUS), Glasgow, UK, 6–9 October 2019; IEEE: New York, NY, USA, 2019; pp. 502–505. [Google Scholar] [CrossRef]
- Zadik, Z.; Price, D.; Diamond, G. Pediatric reference curves for multi-site quantitative ultrasound and its modulators. Osteoporos. Int. 2003, 14, 857–862. [Google Scholar] [CrossRef]
- van der Maaten, L.; Hinton, G. Visualizing data using t-sne. J. Mach. Learn. Res. 2008, 9, 2579–2605. [Google Scholar]
- Jolliffe, I.T.; Cadima, J. Principal component analysis: A Review and Recent Developments. Philos. Trans. R. Soc. A Math. Phys. Eng. Sci. 2016, 374, 20150202. [Google Scholar] [CrossRef] [PubMed]
- Han, A.; Byra, M.; Heba, E.; Andre, M.P.; Erdman, J.W., Jr.; Loomba, R.; O’Brien, W.D., Jr. Noninvasive diagnosis of nonalcoholic fatty liver disease and quantification of liver fat with radiofrequency ultrasound data using one-dimensional convolutional neural networks. Radiology 2020, 295, 342–350. [Google Scholar] [CrossRef] [PubMed]
- Guo, J.Y.; Zheng, Y.P.; Xie, H.B.; Koo, T.K. Towards the application of one-dimensional sonomyography for powered upper-limb prosthetic control using machine learning models. Prosthet. Orthot. Int. 2013, 37, 43–49. [Google Scholar] [CrossRef] [PubMed] [Green Version]
- Brausch, L.; Tretbar, S.; Hewener, H. Identification of advanced hepatic steatosis and fibrosis using ML algorithms on high-frequency ultrasound data in patients with non-alcoholic fatty liver disease. In Proceedings of the 2021 IEEE UFFC Latin America Ultrasonics Symposium (LAUS), Gainesville, FL, USA, 4–5 October 2021; IEEE: New York, NY, USA, 2021; pp. 1–4. [Google Scholar] [CrossRef]


| Method | Average Score for All Subjects (%) | Average Score for All Subjects under 17 years (%) | Average Score for All Subjects under 18 years (%) | Average Score for All Subjects between 17 and 19 years (%) | Average Score for All Subjects over 18 years (%) | Average Score for All Subjects over 19 years (%) | Time for Training and Evaluation (in h) |
|---|---|---|---|---|---|---|---|
| CatBoost (10,000 iterations) | 86.93 | 83.68 | 78.48 | 82.57 | 90.72 | 91.35 | 26.08 |
| CatBoost (1000 iterations) | 86.40 | 76.38 | 91.30 | 81.19 | 83.86 | 91.20 | 2.65 |
| XGBoost | 85.23 | 80.22 | 76.67 | 78.86 | 90.61 | 91.85 | 0.08 |
| CatBoost (100 iterations) | 84.77 | 77.24 | 88.41 | 81.84 | 79.43 | 89.45 | 0.23 |
| LightGBM | 82.57 | 74.70 | 72.95 | 77.71 | 90.38 | 90.33 | 0.06 |
| FCN | 82.30 | 77.62 | 72.29 | 70.00 | 89.80 | 91.71 | 186.18 |
| 1-NN DTW | 81.50 | 65.62 | 64.86 | 75.00 | 91.54 | 91.42 | 4.31 |
| ResNet | 78.53 | 61.84 | 59.43 | 74.29 | 91.19 | 91.93 | 271.75 |
| MLP | 77.73 | 66.49 | 63.81 | 66.00 | 86.14 | 85.75 | 47.99 |
| SVM | 77.00 | 70.59 | 66.95 | 67.43 | 82.97 | 85.86 | 0.18 |
| Logistic Regression | 75.20 | 61.51 | 59.71 | 71.00 | 85.74 | 86.55 | 0.82 |
| Radial Basis Functions Neural Network | 73.10 | 50.03 | 47.33 | 78.71 | 88.00 | 85.60 | 0.23 |
Publisher’s Note: MDPI stays neutral with regard to jurisdictional claims in published maps and institutional affiliations. |
© 2022 by the authors. Licensee MDPI, Basel, Switzerland. This article is an open access article distributed under the terms and conditions of the Creative Commons Attribution (CC BY) license (https://creativecommons.org/licenses/by/4.0/).
Share and Cite
Brausch, L.; Dirksen, R.; Risser, C.; Schwab, M.; Stolz, C.; Tretbar, S.; Rohrer, T.; Hewener, H. Classification of Distal Growth Plate Ossification States of the Radius Bone Using a Dedicated Ultrasound Device and Machine Learning Techniques for Bone Age Assessments. Appl. Sci. 2022, 12, 3361. https://doi.org/10.3390/app12073361
Brausch L, Dirksen R, Risser C, Schwab M, Stolz C, Tretbar S, Rohrer T, Hewener H. Classification of Distal Growth Plate Ossification States of the Radius Bone Using a Dedicated Ultrasound Device and Machine Learning Techniques for Bone Age Assessments. Applied Sciences. 2022; 12(7):3361. https://doi.org/10.3390/app12073361
Chicago/Turabian StyleBrausch, Lukas, Ruth Dirksen, Christoph Risser, Martin Schwab, Carole Stolz, Steffen Tretbar, Tilman Rohrer, and Holger Hewener. 2022. "Classification of Distal Growth Plate Ossification States of the Radius Bone Using a Dedicated Ultrasound Device and Machine Learning Techniques for Bone Age Assessments" Applied Sciences 12, no. 7: 3361. https://doi.org/10.3390/app12073361