1. Introduction
According to the latest census data, adults aged 65 and above comprise more than one-fifth (20.8%) of the European population and are the fastest-growing segment. Across the EU Member States, the highest share of the elderly in the total population in 2020 was observed in Italy (23.2%). By 2070, 30.3% of the population is projected to be aged 65 years or older and 13.2% is projected to be aged 80 years or older. The number of people in the EU potentially in need of long-term care is expected to increase from 19.5 million in 2016 to 23.6 million in 2030 and 30.5 million in 2050 [
1]. As the world’s population is living longer, age-related neurodegenerative diseases (NDs) are becoming a larger global issue. Among these disorders, dementias are responsible for the greatest burden of disease. Parkinson’s disease (PD) is the second most frequent neurological disease after Alzheimer’s disease [
2]. It affects more than 1.2 million persons in Europe and more than 6.3 million persons worldwide [
3,
4]. Neurodegenerative disorders cause worsening motor, cognitive and autonomic dysfunction over time and reduce functional abilities required for daily living. Compromised motor performance is one of the first and most evident manifestations of ND and could be objectively assessed thanks to the use of technological tools. Although PD includes both motor and non-motor manifestations, the motor aspect remains predominant. The degree of motor impairment in PD is commonly assessed by a widespread and worldwide validated scale called Movement Disorder Society Unified Parkinson’s Disease Rating Scale (MDS-UPDRS) [
5], particularly in Part III, the use of which is the basis of any PD outpatient’s clinical evaluation. Although this scale is the product of a broad consensus of experts and is validated worldwide, it includes subjective and error-prone motor examinations. For this reason, in recent years, various techniques have emerged to objectively assess motor limitations in PD patients, with interesting prospects for both clinical trials and common clinical practice.
This preliminary study plays into this scenario and proposes the use of some artificial intelligence (AI) techniques to objectively assess the signature that one of the primary neurodegenerative disorders leaves in the gait of patients, finding evaluations that correspond to those obtained using MDS-UPDRS Part III. In recent years, advancements in the field of AI have widely demonstrated the potential benefits that these techniques have in extracting information from raw data in several fields of application [
6]. In particular, their employment in medicine and healthcare has highly enhanced the capabilities of physicians in the diagnosis process. The applications of computer vision techniques in medicine are widely known in specific medical areas, such as, for example, radiology, ophthalmology and dermatology, where the main diagnostic task is represented by visual pattern recognition [
7,
8,
9]. At the same time, these techniques allow us to overcome the observation capacity on which medicine is historically based, allowing us to process a considerable amount of images or information in certainly more significant numbers than any human being could. The latest application of AI techniques allows them to effectively range from low-level tasks such as, for example, contour reconstruction to high-level tasks such as the recognition of objects or whole scenes. These advantages are due to the increased computing power made available at low cost by high-performance hardware devices (GPUs, or Graphics Processing Units) as well as the maturation of AI algorithms and wide availability of open-source datasets for their training.
Machine learning (ML) is an AI application that uses mathematical models applied to data in order to allow a computer to learn without executing direct instructions [
10,
11]. ML aims to understand the structure of data, allowing the software to manage the complexity of physical phenomena that are often too complex to be modelled effectively. When the structure of algorithms is modelled on the human brain, as in neural networks, the term deep learning (DL) is used [
12,
13]. Many ML and DL algorithms have been around for a long time and, thanks to their ability to apply complex math to big data, they are involved in many of the products and services we normally use; they have become pervasive in many aspects of our everyday life. There are three commonly used methods of learning: supervised, unsupervised and reinforcement learning. In supervised learning, a human is involved from the start, giving pre-classified examples to train the algorithms, such as inputs whose outputs are already known. In unsupervised learning, the algorithm is left to find meaning in a mass of data that is not labeled, with the aim of identifying an internal structure. Finally, in reinforcement learning, the algorithm discovers which actions generate the greatest rewards by exploring the solution space with a trial-and-error approach.
In this study, we use supervised learning to find people and their pose within images taken by a stereo vision camera: a device that tries to mimic human stereopsis to perceive depth [
14]. The phenomenon of stereopsis arises from the fact that human eyes are horizontally separated by about 65 mm, which implies that the world is seen from two slightly different points of view. By comparing these two views, our brain can infer not only depth but also three-dimensional motion in space. In the same way, from a pair of stereo images, it is possible to retrieve depth information of the viewed scene [
15,
16,
17]. Once the conjugate points in the two input images have been correctly matched, there is an extremely simple relation between the coordinate difference of a given point and its distance from the sensory device. All of the following is based on the so-called epipolar constraint, which is a commonly used constraint in stereo vision problems. It assumes that all the differences between the two images are arranged along a single direction, typically the horizontal one. Artificial stereo vision and DL are used in this study to identify people within the images taken, applying a model that uses a certain number of anatomical points (KeyPoints) to describe the human body. Through an analysis of the kinematics of the KeyPoints of the identified person, our system extracts helpful information to describe their motor skills, measuring the alterations that affect their health.
Disorders of balance and gait are a hallmark of PD. Tracking these basic features could provide meaningful and early clues towards diagnosis, as well as, for managing disease progress, aid in deploying appropriate treatment strategies and evaluating their outcome; for these reasons, these features have been heavily and deeply investigated. In PD, gait disturbances are investigated by the physician’s simple observations or using different instrumental support [
18], such as wearable sensors or treadmills [
19,
20]. Nevertheless, most studies on objective gait analysis in patients affected by PD have been based mainly on wearable sensors. The wearable sensors that are used most frequently are inertial ones: gyroscope accelerometers and magnetoresistive sensors that measure speed, acceleration, orientation and gravitational force at the points where they are applied [
21,
22,
23,
24,
25,
26]. Other wearable devices are those found in some optical motion capture systems: reflective markers are attached to the subject’s body and used to acquire movements through the different marker positions in videos shot by a set of pre-calibrated and synchronized cameras [
27,
28,
29,
30]. These sensors/markers must be worn with high precision and caution by the patient; otherwise, the data acquired are subjected to significant errors. For this reason, these systems can only be used in equipped laboratories under the strict control of specialized people. However, the use of vision systems is not limited to having to place markers to identify the joint positions of the human body. Recent advances in pose tracking algorithms have allowed the extraction of joint positions using commercial cameras and deep learning [
31]. These computer vision systems can estimate the pose and gait of multiple people with a two-digit frame rate, tracking whole-body movement in a non-intrusive and non-limiting way [
32,
33,
34,
35].
The aim of this study is to obtain detailed information on the signature that PD leaves on gait by comparing the data obtained from PD patients with those of a matched, healthy control group. In evaluating these motor-related features, some biometric parameters of the subjects, such as age and height, must be considered because they affect the measurements obtained during the test. To avoid bias, the measurements obtained must be compared with a control subject who presents physical parameters strictly related to those of the patient performing the test. To address the assessment of gait, this pilot study considers two MDS-UPDRS Part III items: gait (item 3.10) and freezing of gait (item 3.11) [
5].
2. Materials and Methods
2.1. Data Collection
The data presented in this paper were collected in the Neurology Unit of the Department of Systems Medicine at the “Tor Vergata” University of Rome. This study was part of a larger study in which 15 patients with PD and 15 healthy control subjects were recruited. All study participants gave written informed consent after receiving an extensive explanation of the study’s tools, methods and aims, and the local Ethics Committee approved the trial. For this study, the cohort was composed of five patients (three men and two women) with a PD diagnosis at different degrees of severity and five control people (three men and two women). All five patients were under PD treatment and were evaluated during their best motor response. The control subjects were selected from patients’ relatives and caregivers, a population of healthy people without medical disorders affecting gait. To obtain a reliable comparison between the test results, each control subject was paired with a patient of the same gender, each having similar age and anthropometric features, such as weight, height and foot length, that match those of the corresponding patient.
Table 1 presents the clinical features of the participants.
In this study, to collect data from the test, we used a Stereolabs ZED2 camera [
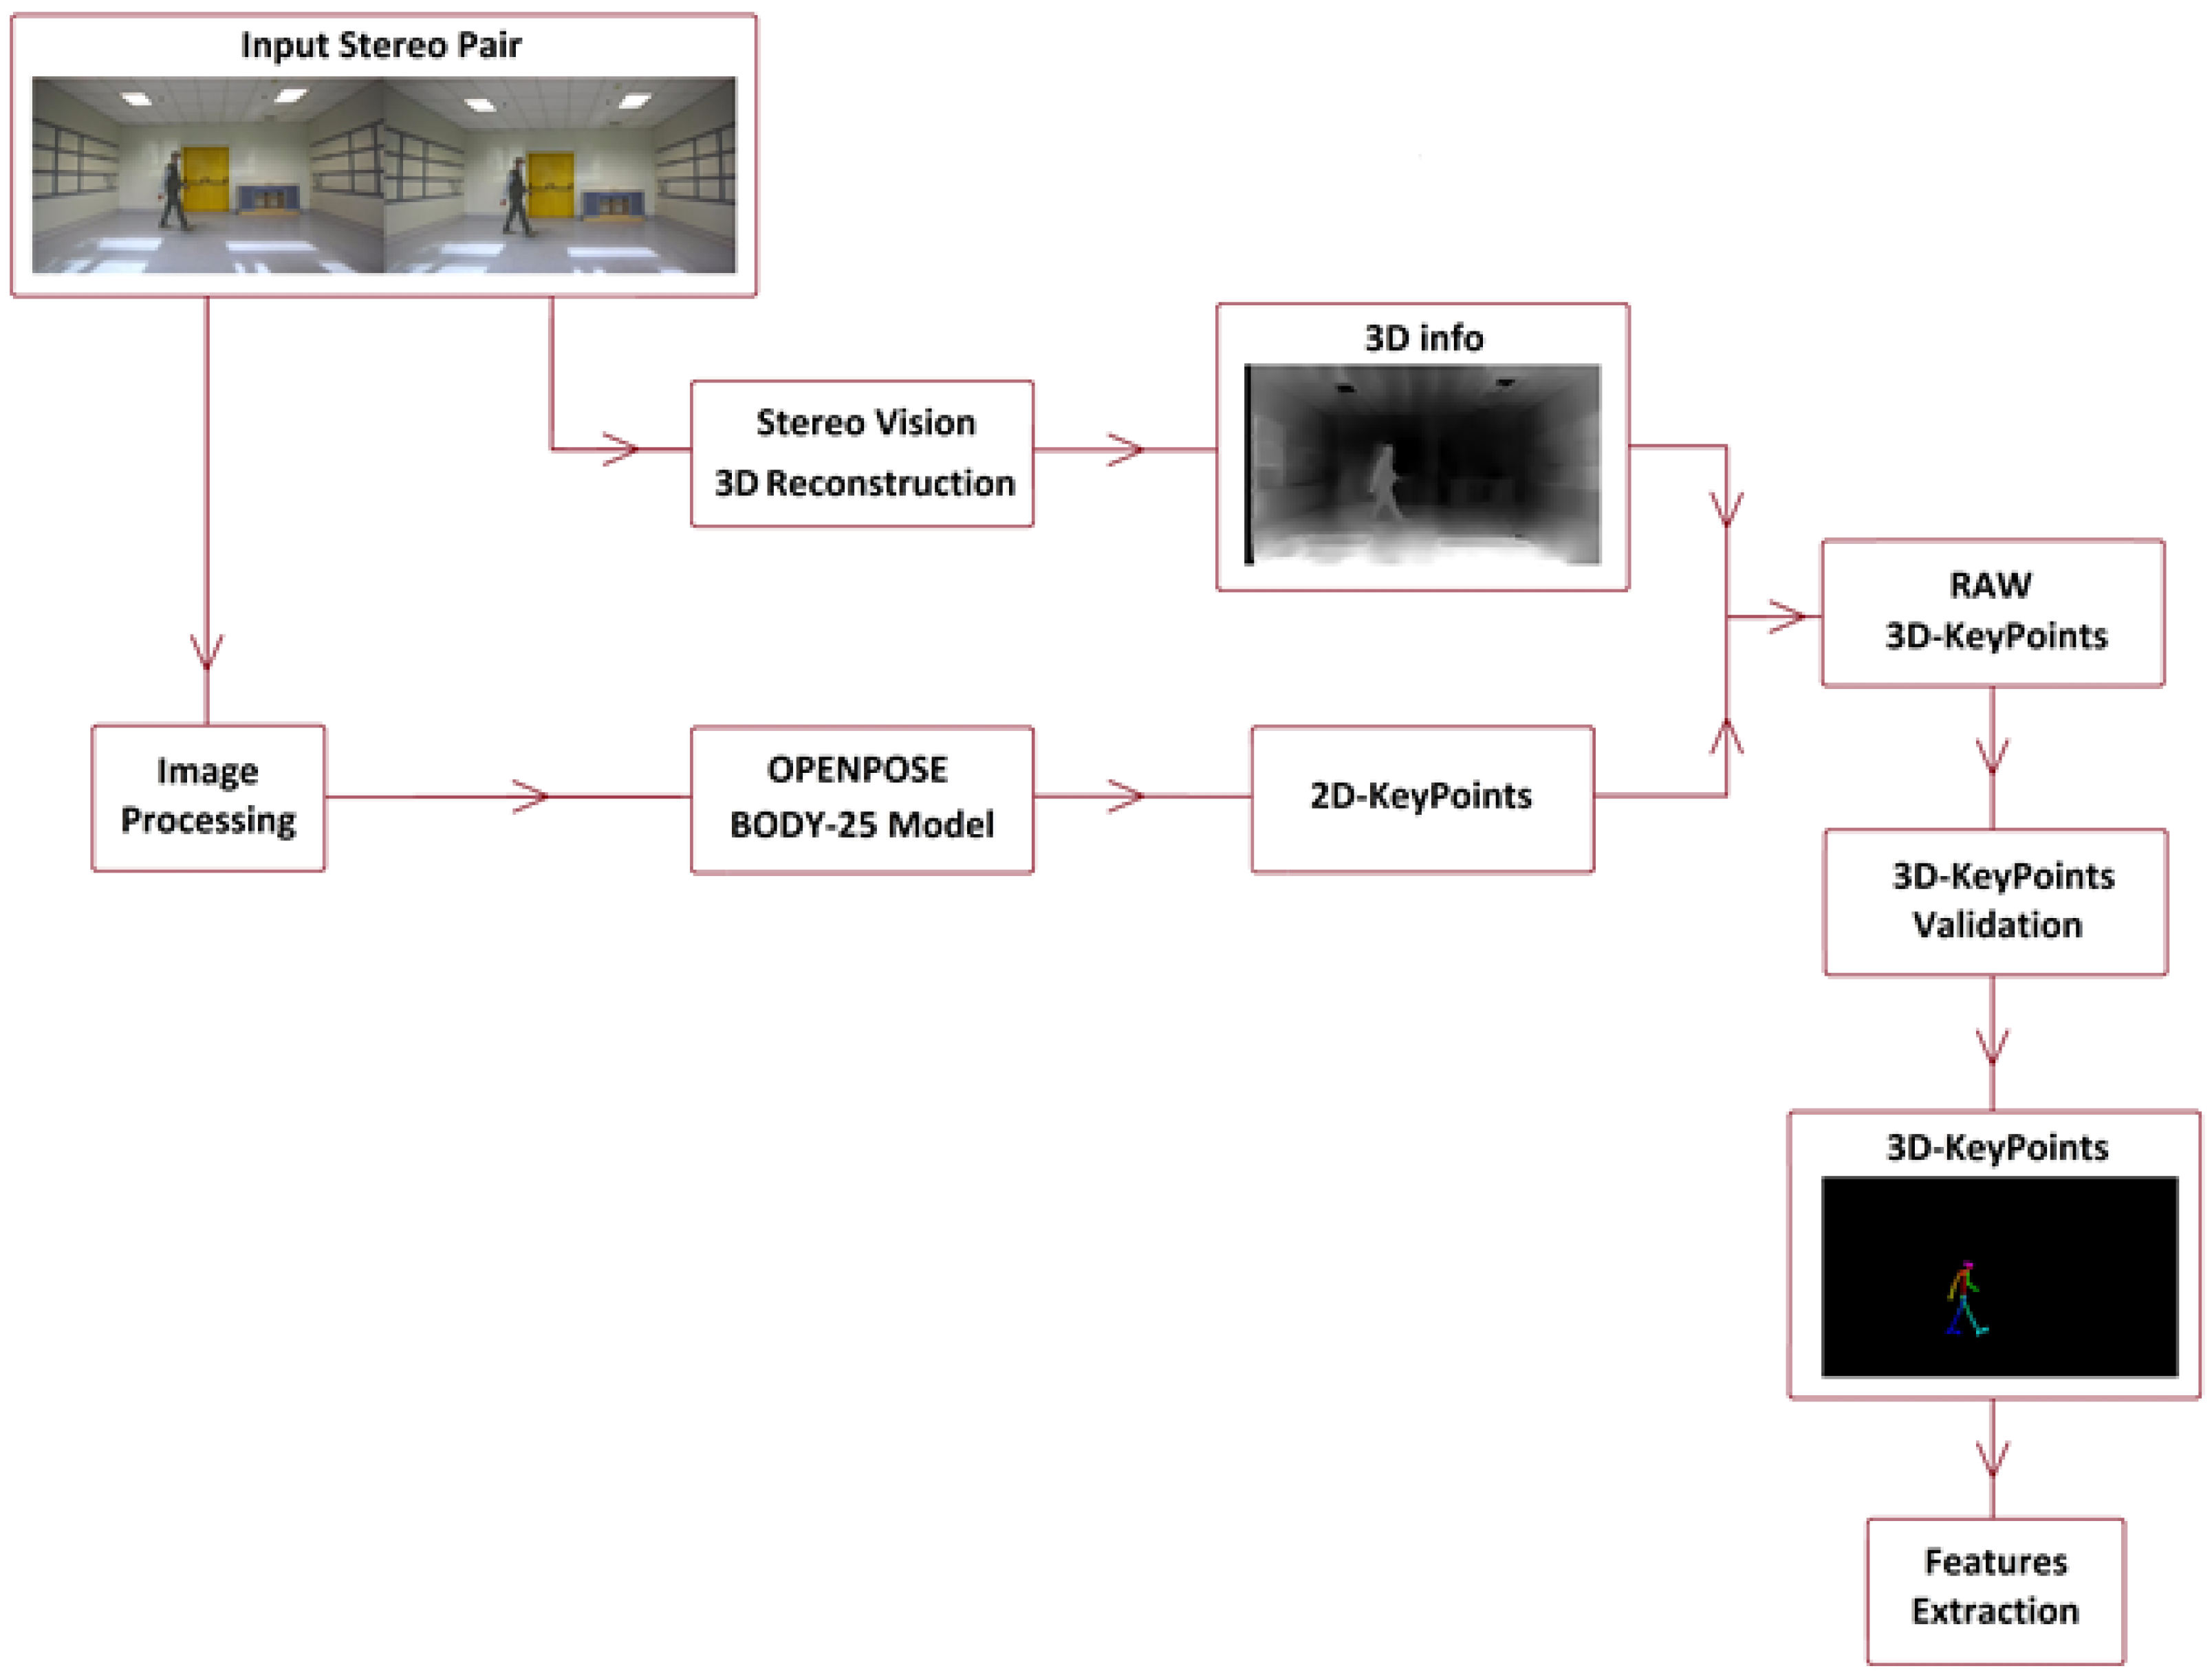
36], a stereoscopic device with a pair of cameras mounted with co-planar optical planes and co-linear sensor bases. The developed system (see
Figure 1) acquired stereoscopic video and processed them to obtain a 3D reconstruction of the scene. The two cameras were horizontally separated by 12 cm, allowing them to capture high-resolution 3D video of the scene and estimate depth and motion by comparing the displacement of pixels between the left and right images. The ZED2 uses neural networks to obtain depth information and represent it with a 3D point cloud. A point cloud is a collection of 3D points that represent the external surface and color information of a scene. Point clouds store data in four channels, using a 32-bit float for each channel: the first three channels for 3D point coordinates are x, y and z, the last is used to store color information.
The depth range of the ZED2 camera is 0.2–20 m, the highest available resolution is 4416 × 1242 pixels and the highest frame rate is 100 Hz. To obtain depth information, the ZED2 software development kit uses the NVIDIA library CUDA-Compute Unified Device Architecture [
37] to run fast artificial intelligence and computer vision tasks on a graphics processing unit.
The subjects participating in this study were asked to perform some of the standard tests to assess their gait and postural skills. For each subject involved in the tests, twelve videos were collected, featuring free walking and walking with an obstacle to be avoided. The test shooting was taken from two different points of view and each test was repeated three times. A total of 120 video sequences of the people involved in this study were recorded. The reference system had its origin position in the left camera of the stereoscopic device, which was placed on the y-axis; the x-axis being the one that crossed the optical plane and the z-axis being the one orthogonal to the previous two that pointed upwards. Image resolution was 2560 × 720 at 60 fps and the left and right images were 1280 × 720 pixels each.
2.2. Assignment of MDS-UPDRS Scores
Each test was scored according to the MDS-UPDRS Part III scale criterion by a neurologist expert in movement disorders. The MDS-UPDRS scale was developed to assess various aspects of Parkinson’s disease and has four parts: Part I (non-motor experiences of daily living), Part II (motor experiences of daily living), Part III (motor examination) and Part IV (motor complications). The scale can be used in clinical settings as well as in research. For this study, we used Part III, the portion of the scale that assesses the motor signs of PD using 18 items describing the burden of disease in its many representations. All items have an integer rating ranging from 0 to 4, with higher scores indicating more severe impairment: 0 for Normal, 1 for Slight, 2 for Mild, 3 for Moderate and 4 for Severe.
2.3. Image Processing and 2D-KeyPoints Computing
Once the videos for each participant in the test campaign were collected and the scores on the MDS-UPDRS scale noted for each of them, the locations of the KeyPoints for each subject in the acquired images had to be found to extract the subjects’ gait features.
Before being able to proceed to KeyPoint finding, it was necessary to perform pre-processing of input images to minimize mismatch and other sources of error in the following process. A combination of image enhancement filters, such as contrast enhancements, histogram equalization, sharpness and so on, was applied to the input images to increase the accuracy of OpenPose, improving the perceptibility of people in the scene by amplifying the difference between them and the backgrounds. Once the images were properly treated, we were able to proceed and detect the people in the images and recover their poses.
For this task, we used the software package OpenPose developed in 2017 by CMU-Perceptual Computing Lab [
31], a well-known tool for multi-person 2D pose estimation.
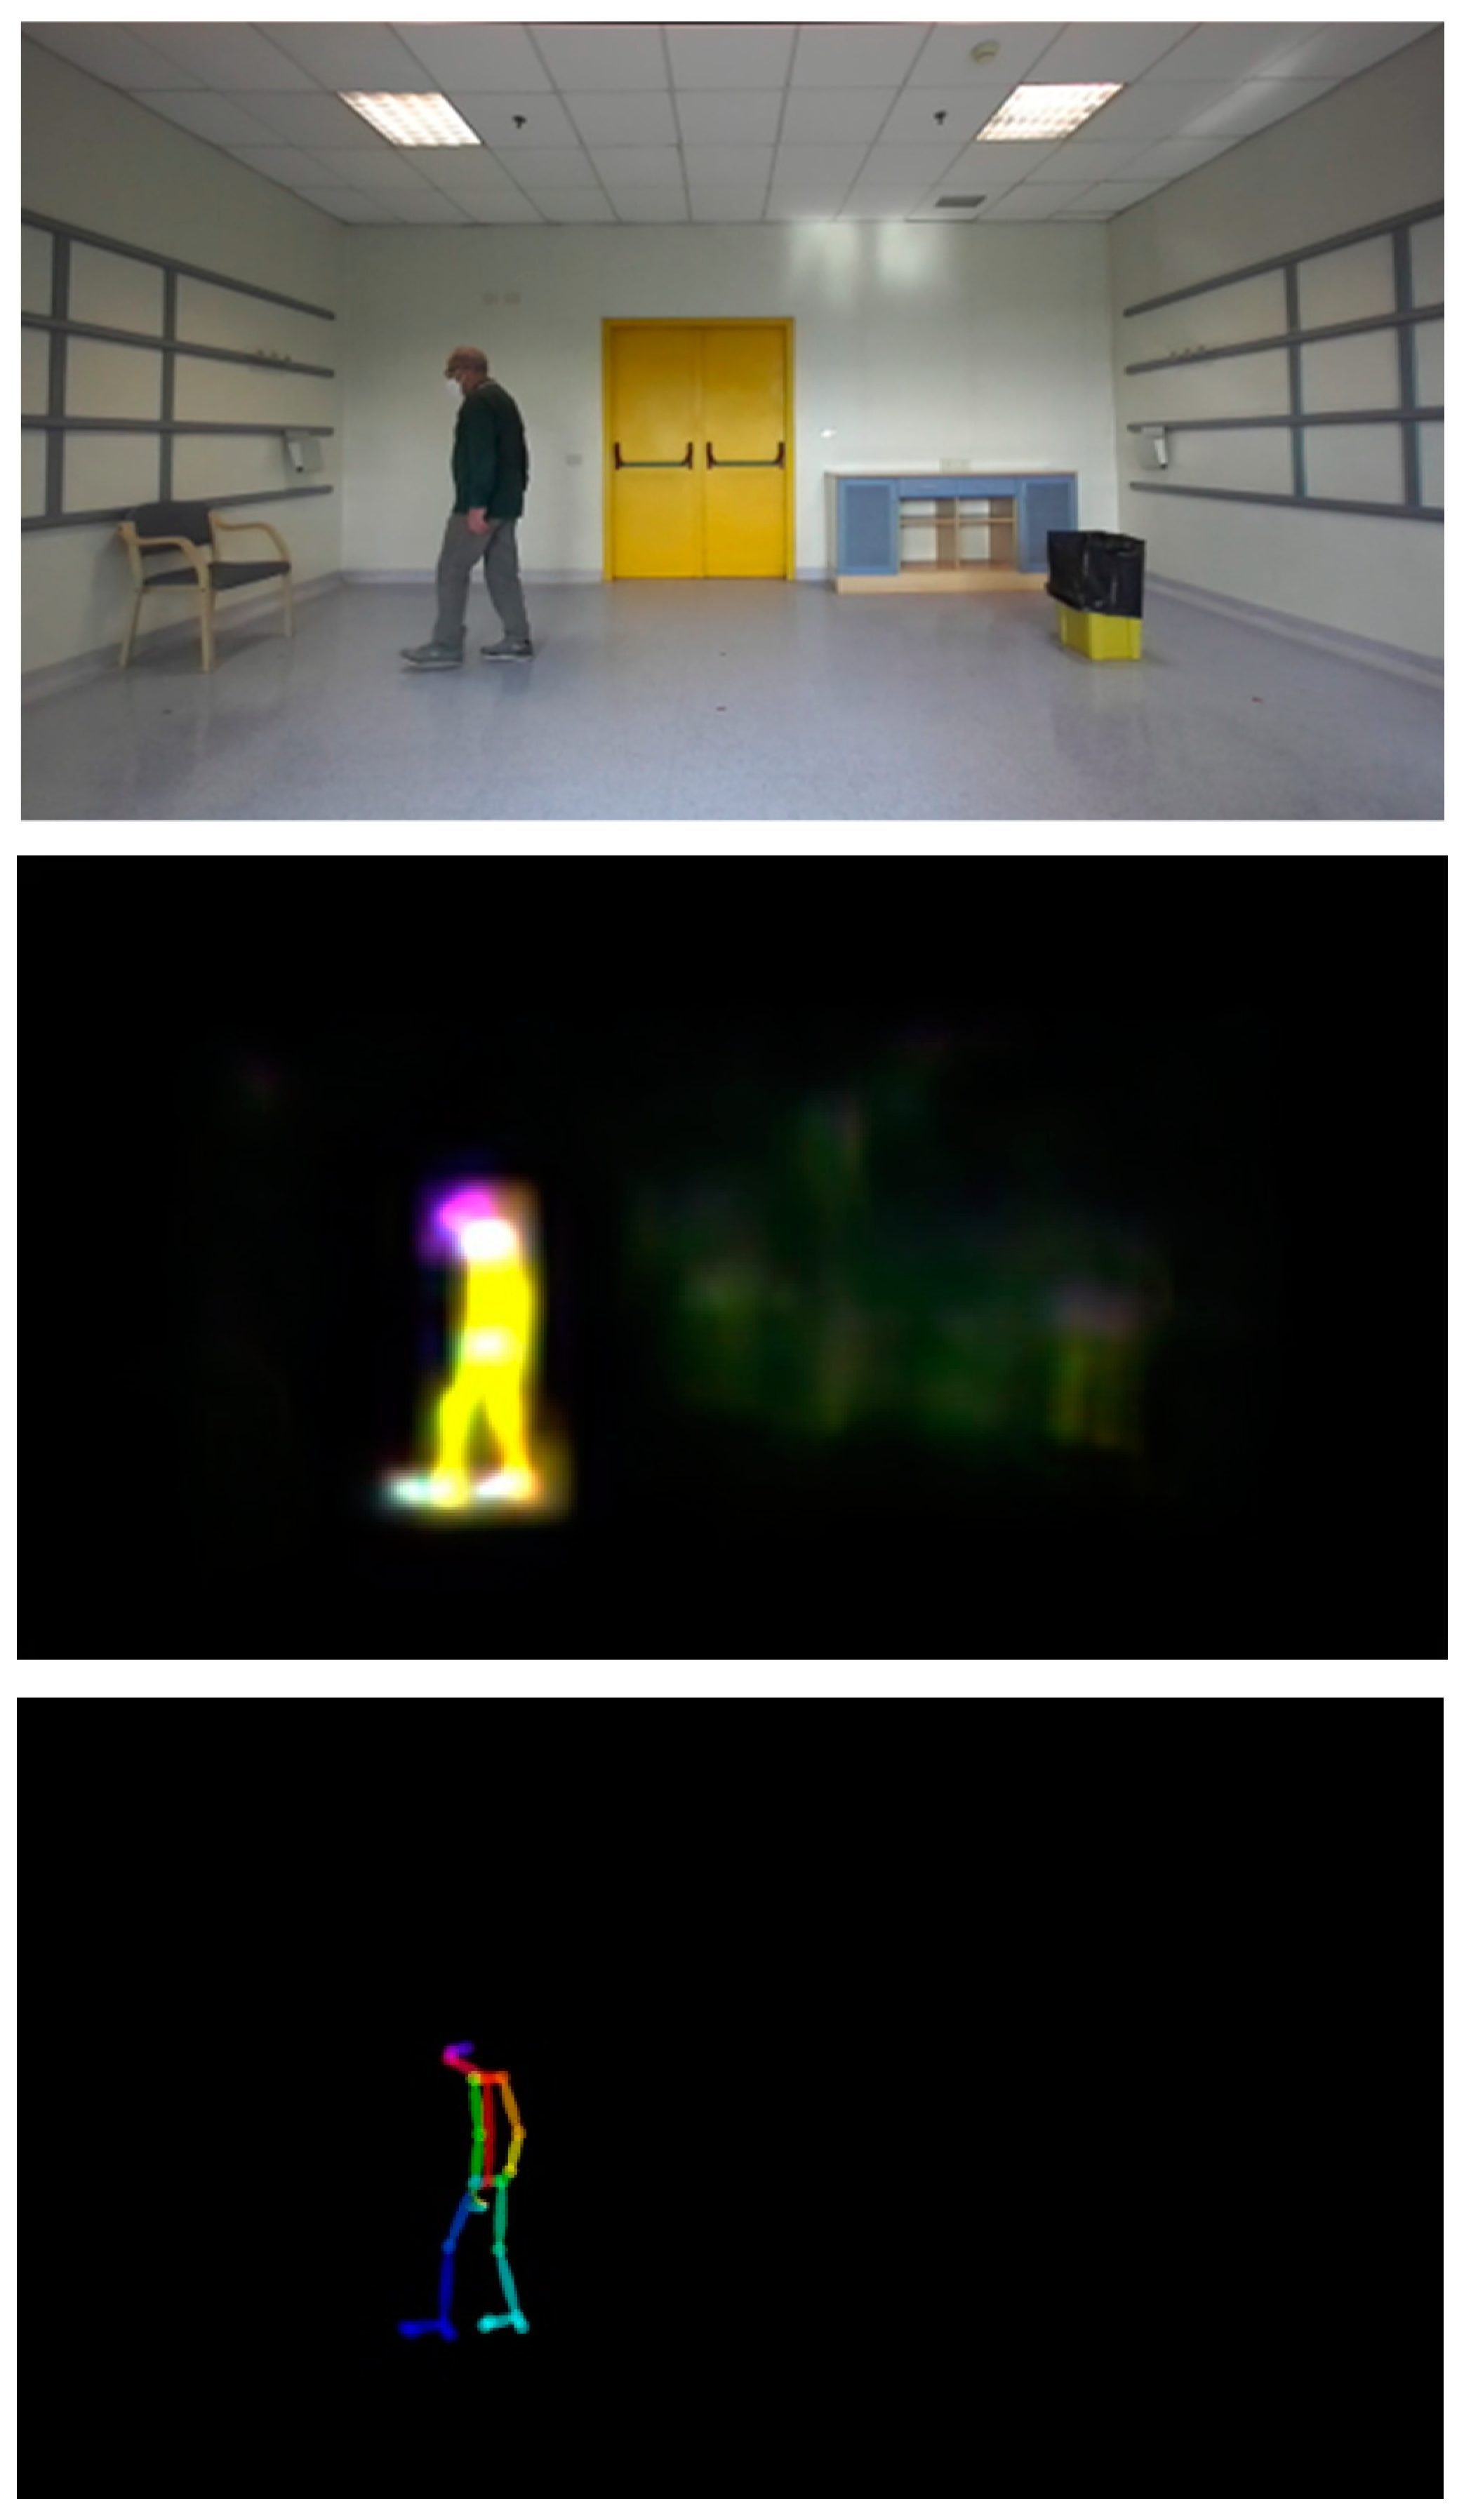
OpenPose works with a bottom-up approach and uses a feed-forward multi-stage Convolutional Neural Network (CNN) to simultaneously predict a set of 2D confidence maps of human body-part locations and a set of 2D vector fields of part affinities (PAFs), which encode the degree of association between the body parts. Architecture details of the multi-stage CNN can be found in [
31]. Finally, the confidence maps and the affinity fields are parsed by greedy inference to output the locations in the 2D image reference of the KeyPoints for each subject present in the image. There are several different models used to approximate the parts of the human body and to detect people in an image [
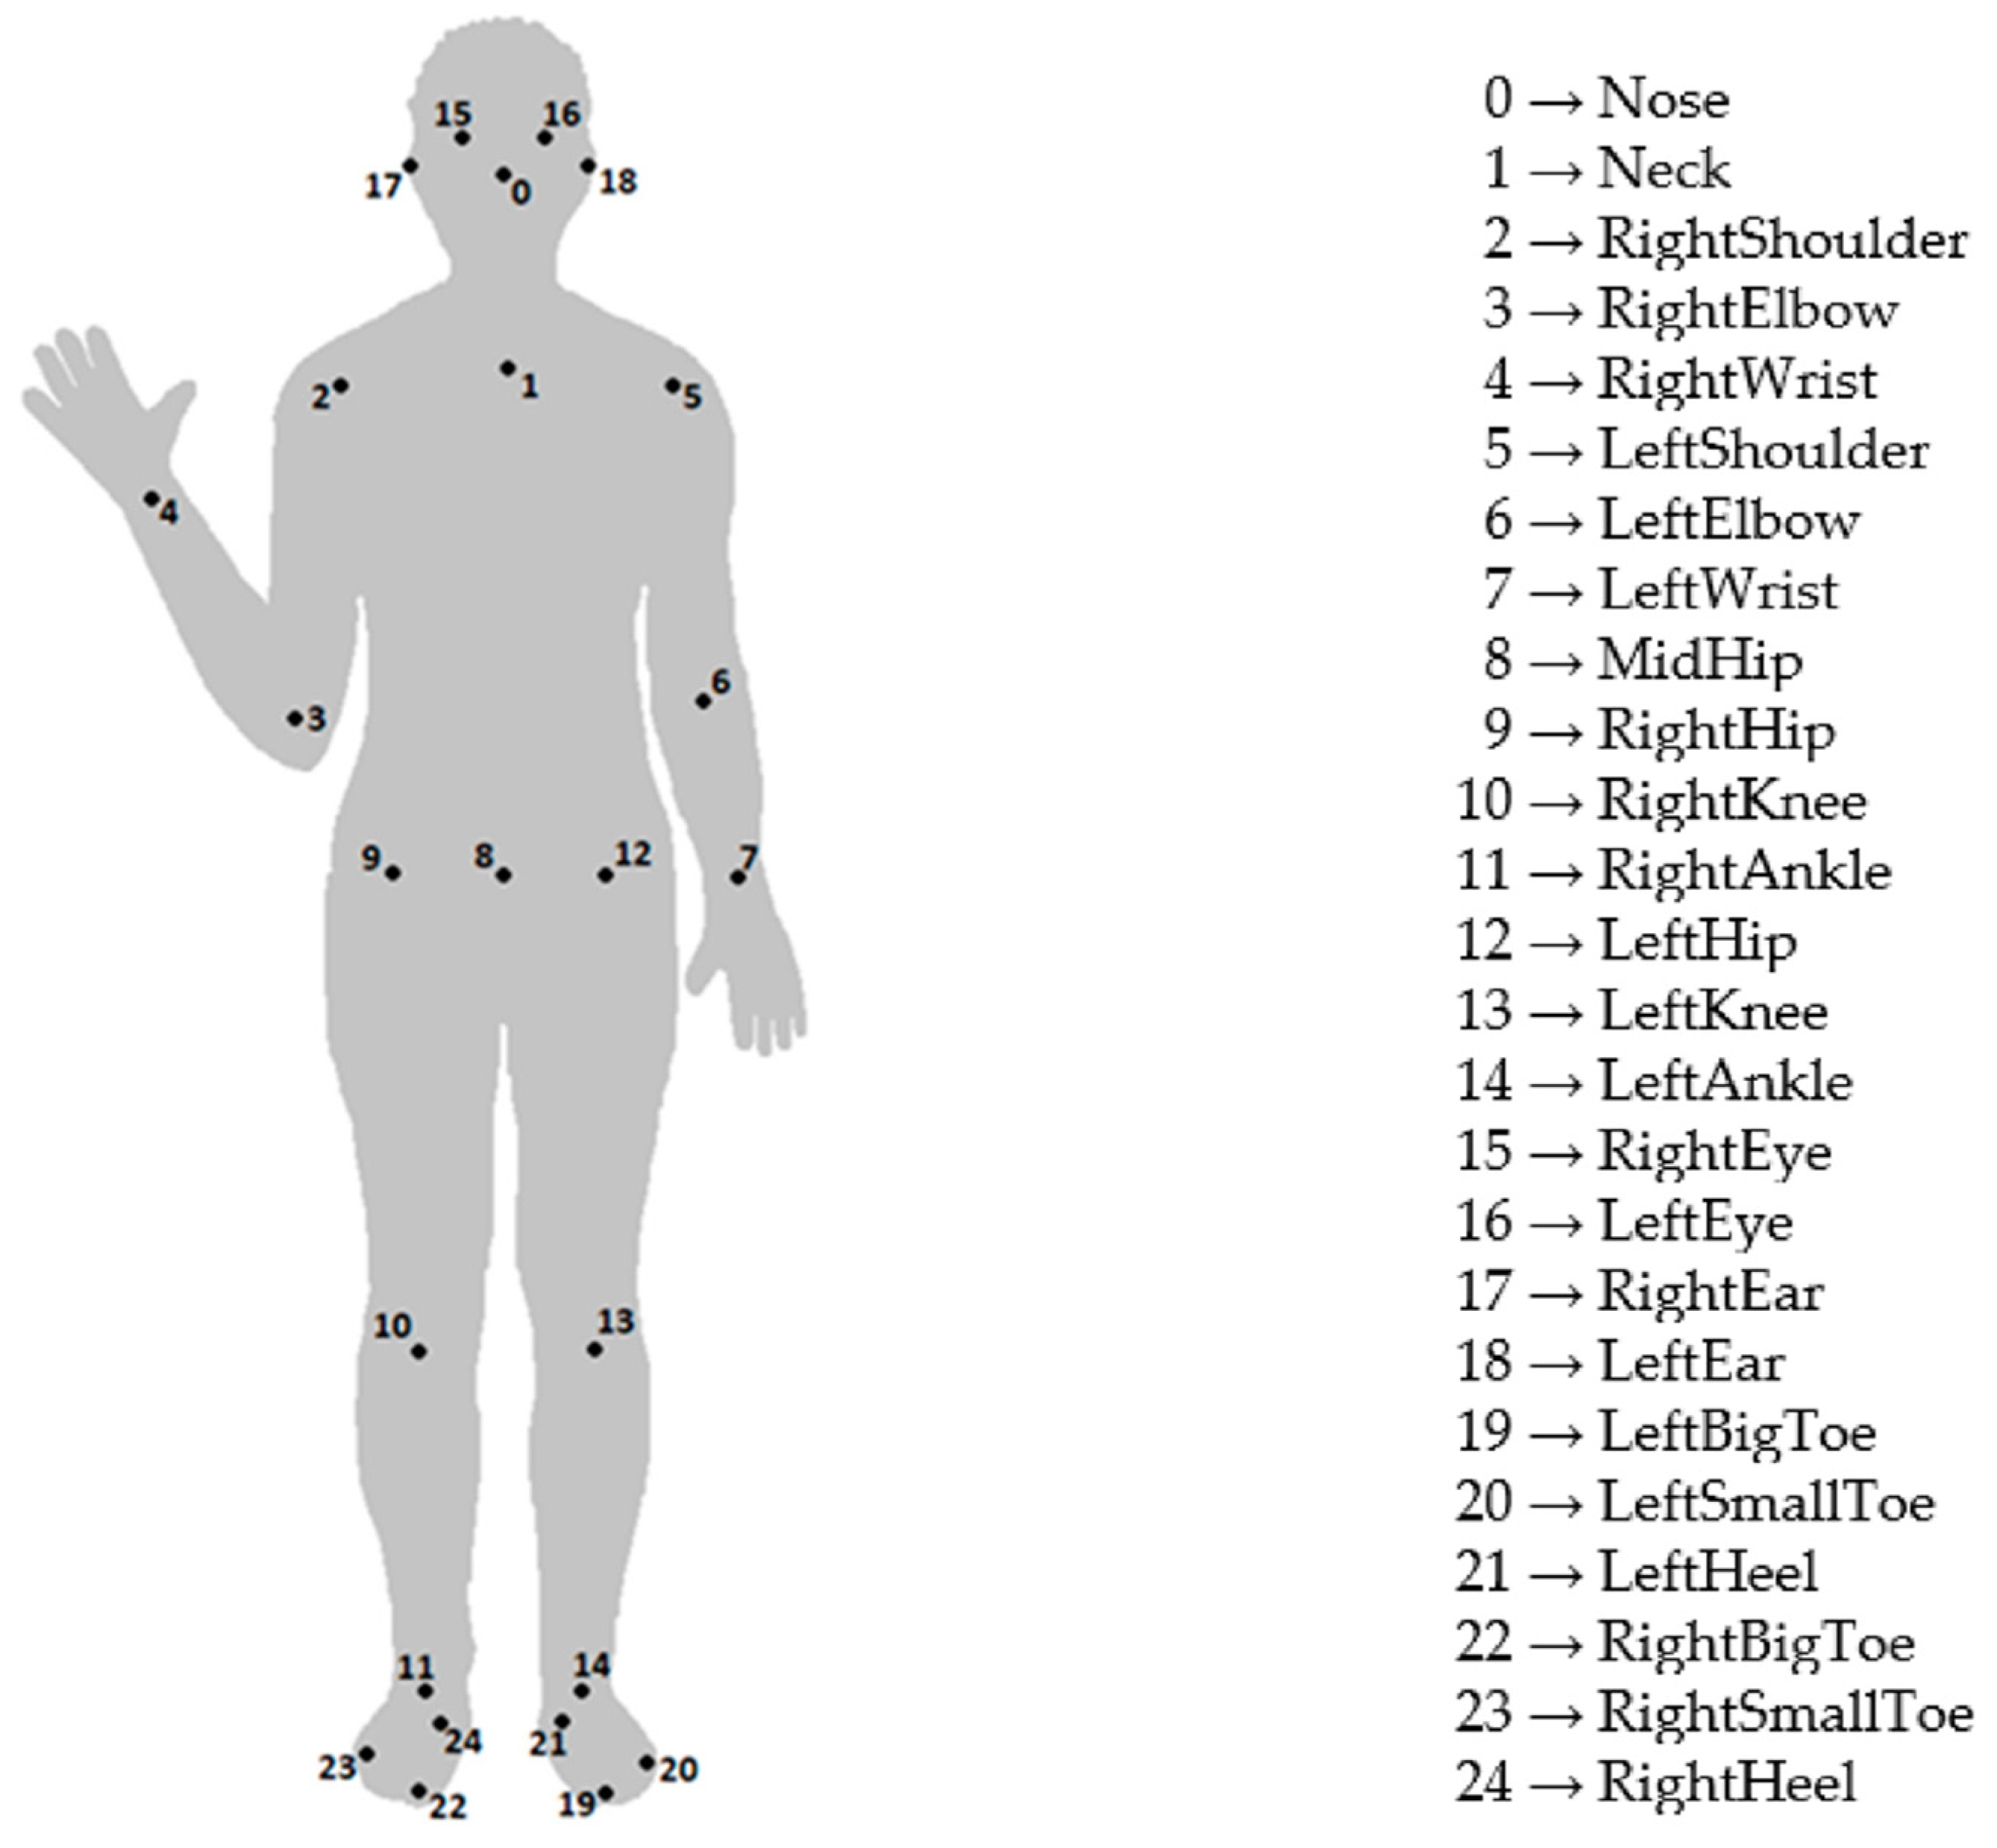
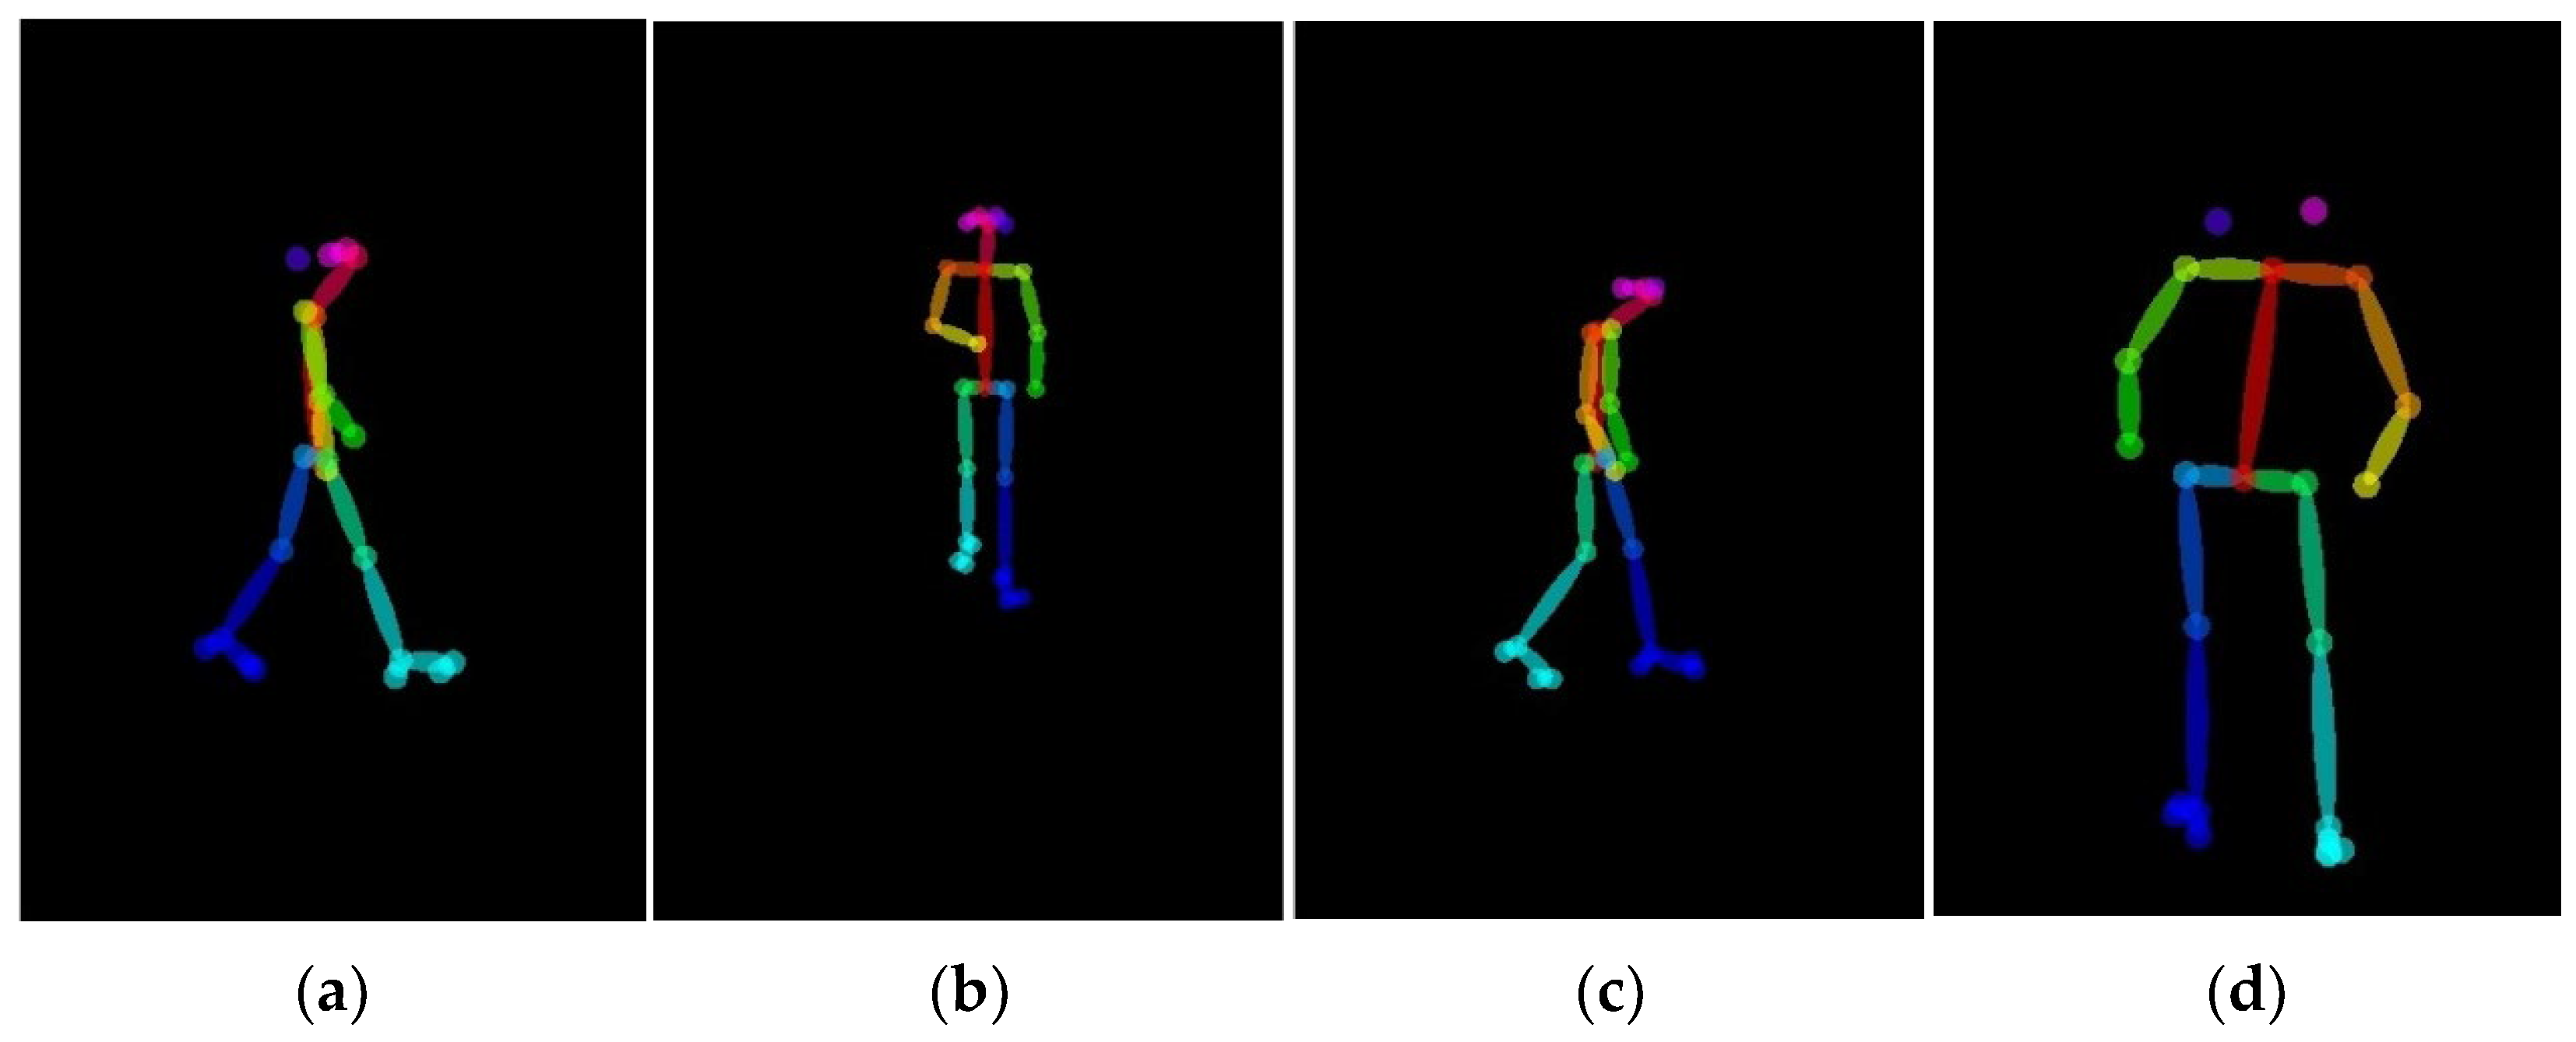
31]. In the presented application, we used the BODY-25 model, which describes the pose of a human body through 25 KeyPoints (see
Figure 2) and 24 parts that are segments that connect some of them. The accuracy of this pose estimation method depends on acquisition system calibration and the considered KeyPoint. In particular, for the estimation of the speed and types of movements taken into account in the present study, the positioning error was always considered to be below the value of 30 mm [
38].
Of particular importance to determine the parameters of the gait of the subjects involved in the tests was the correct identification of the KeyPoints of their trunk, shoulders, hips and feet. OpenPose tools use NVIDIA libraries CUDA 10.0 and cuDNN 7.2 (CUDA Deep Neural Network) [
39], a GPU-accelerated library of primitives for deep neural networks. Our system ran on an HP Z6 workstation with an Nvidia Quadro RTX 8000 and 48 GB of GDDR6 memory. The OpenPose package was pre-trained and ready to process input images. Using the OpenPose library, our system computed, for each frame, the image coordinates of the 25 KeyPoints for each person who appeared within the scene.
2.4. Feature Extraction and Parameters Assessment
Once the 2D-KeyPoints had been found in the images, we could switch from image coordinates to spatial coordinates using the cloud point information and obtain, at the end of this matching process, a set of 3D-KeyPoints. These 3D-KeyPoints had to be validated, eliminating any false positives due to objects or other elements in the test environment, adding a consistency check concerning what was previously determined and also correcting any erroneous matching that had possibly occurred in tests involving more than one subject [
40]. These post-processing tasks were carried out due to the complexity of the images taken during the test sessions and of the results of verifying whether updates of each subject’s KeyPoints positions were consistent with those previously assumed. The checks implemented in this study took into account both the location and the speed of each KeyPoint. Downstream of these elaborations, our system analyzed the kinematics of the 3D KeyPoints to compute some of the features that are currently used by clinicians for MDS-UPDRS items’ scoring.
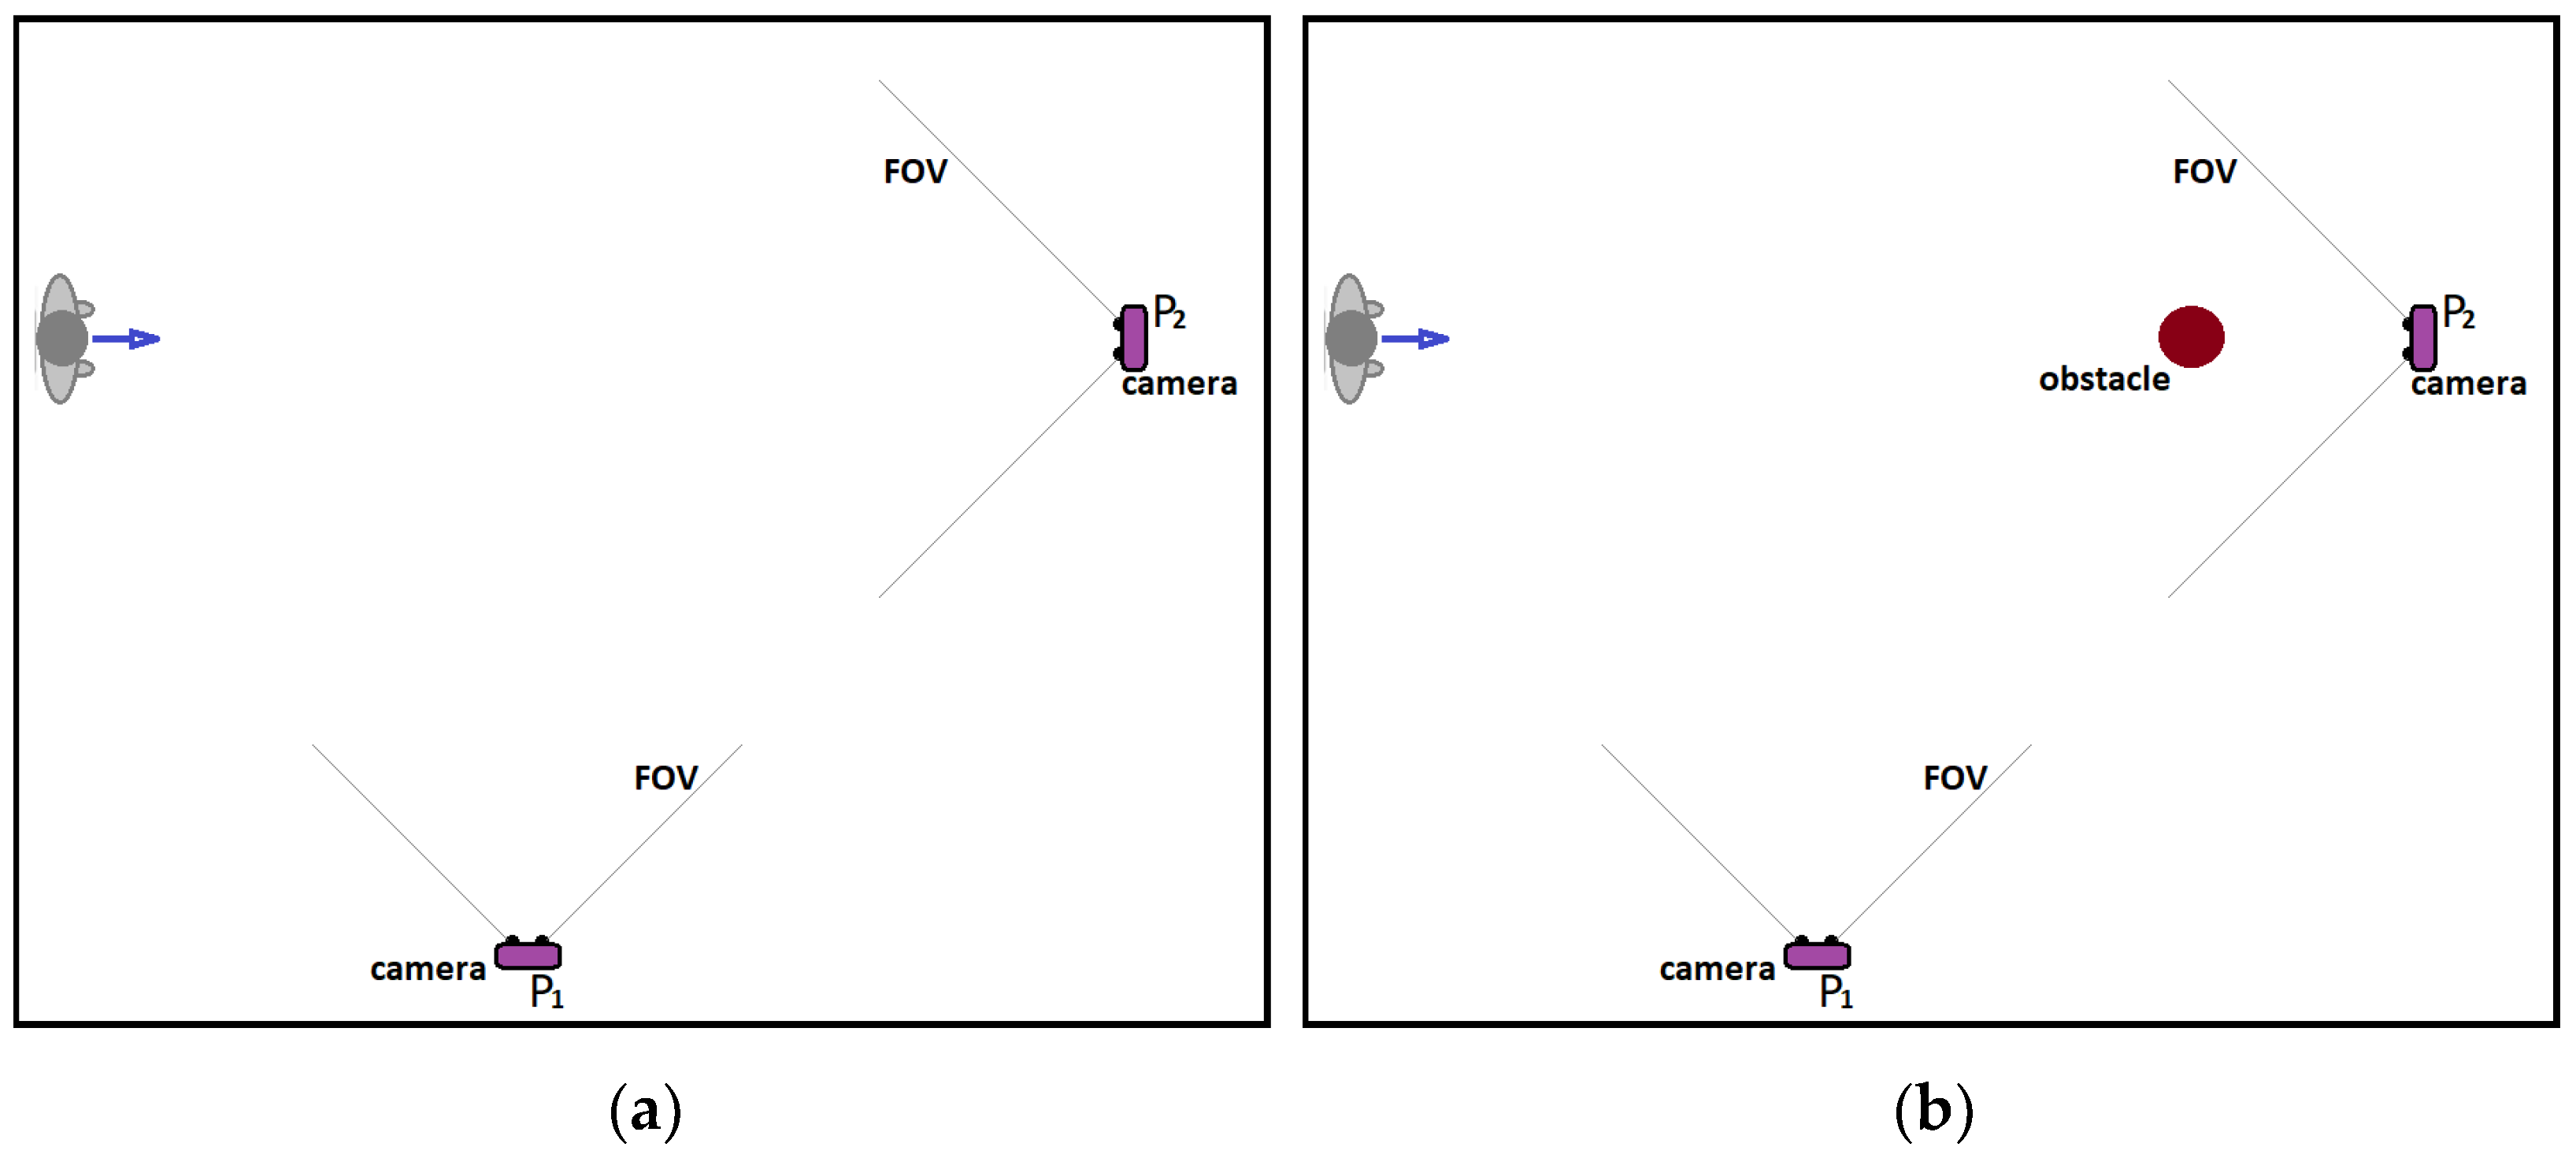
Motor impairment in PD is characterized by a reduction in walking speed due to the combination of a shorter stride length and a higher cadence, greater asymmetry of the upper and lower limbs, axial stiffness and a reduction in the excursion of the articular chains of the lower limbs, and postural instability. The setup for testing the gait of the subject consisted of arranging a free space to be walked through in a straight line, both with and without an obstacle that the subject had to navigate around. The test was conducted with video cameras placed in the frontal and side positions (
Figure 3).
The tests were carried out following this procedure: in the first walk, the subject started in a standing position and was asked to walk forward, then simply turn around and walk back. In the second walk, the subject started again in a standing position and was asked to walk forward, avoiding and moving around an obstacle clockwise, then turn around and come back, moving around the same obstacle again (this time contra-clockwise). Item 3.10 of MDS-UPDRS aims to evaluate specific characteristics of the subject’s gait that are useful for functional impairment assessment: stride amplitude and speed, turning, the height of foot lift and heel strike during walking.
Stride length is the distance between successive points of initial contact of the same foot; it adds up the lengths of two steps, for the left and the right leg respectively, which are usually equal if the person is walking in a straight line. To assess left and right step lengths, stride amplitude and speed, the cinematic characteristics of two KeyPoints, No. 21 and No. 24, were considered, corresponding respectively to the left and right heel of the subject performing the test. In addition, the distance between these two KeyPoints was computed.
People with Parkinson’s disease have difficulty with turning, which is particularly challenging due to the significant number of additional steps and longer time required to turn. To assess turning, the cinematic characteristics of KeyPoint No. 8, corresponding to the middle point of the hips, was considered.
Walking in PD is often characterized by short and stiff steps whose height becomes shorter. To assess the height of the foot lift, was possible to consider again the cinematic characteristics of the two KeyPoints corresponding to the left and right heel (No. 21 and No. 24) and analyze the height of the heels from the ground during walking. To minimize errors due to the presence of occlusions (e.g., when the nearest leg covers the farthest one) in the images recorded by the camera at the laterally viewed angle, only the section of the path travelled by the foot closest to the camera (and visible to it) was taken into consideration. For example, for the left foot, the kinematic characteristics of KeyPoint No. 21 were studied in the sections of the walk that traveled, with respect to camera orientation, from right to left. In contrast, for the right foot, KeyPoint No. 24 was considered in the sections of the walk that traveled from left to right.
While assessing the subject’s gait, an examiner should also pay attention to the presence of any gait freezing episodes [
41,
42]. Freezing of gait can be a clinical hallmark of PD. It is an abnormal gait pattern in which there are sudden, short and temporary episodes of an inability to move the feet forward, despite an intention to walk. Freezing of gait episodes tend to occur less often when subjects walk a straight path, but rather when they start walking, take a turn or go around an obstacle. The setup for this test was the same as the previous one. The examiner watched for start hesitation and stuttering movements, especially when turning and reaching the end of the task. To assess a freezing of gait episode, we looked for the presence of an anomalous pattern in the subject’s gait when computing stride features, as done previously.
3. Results
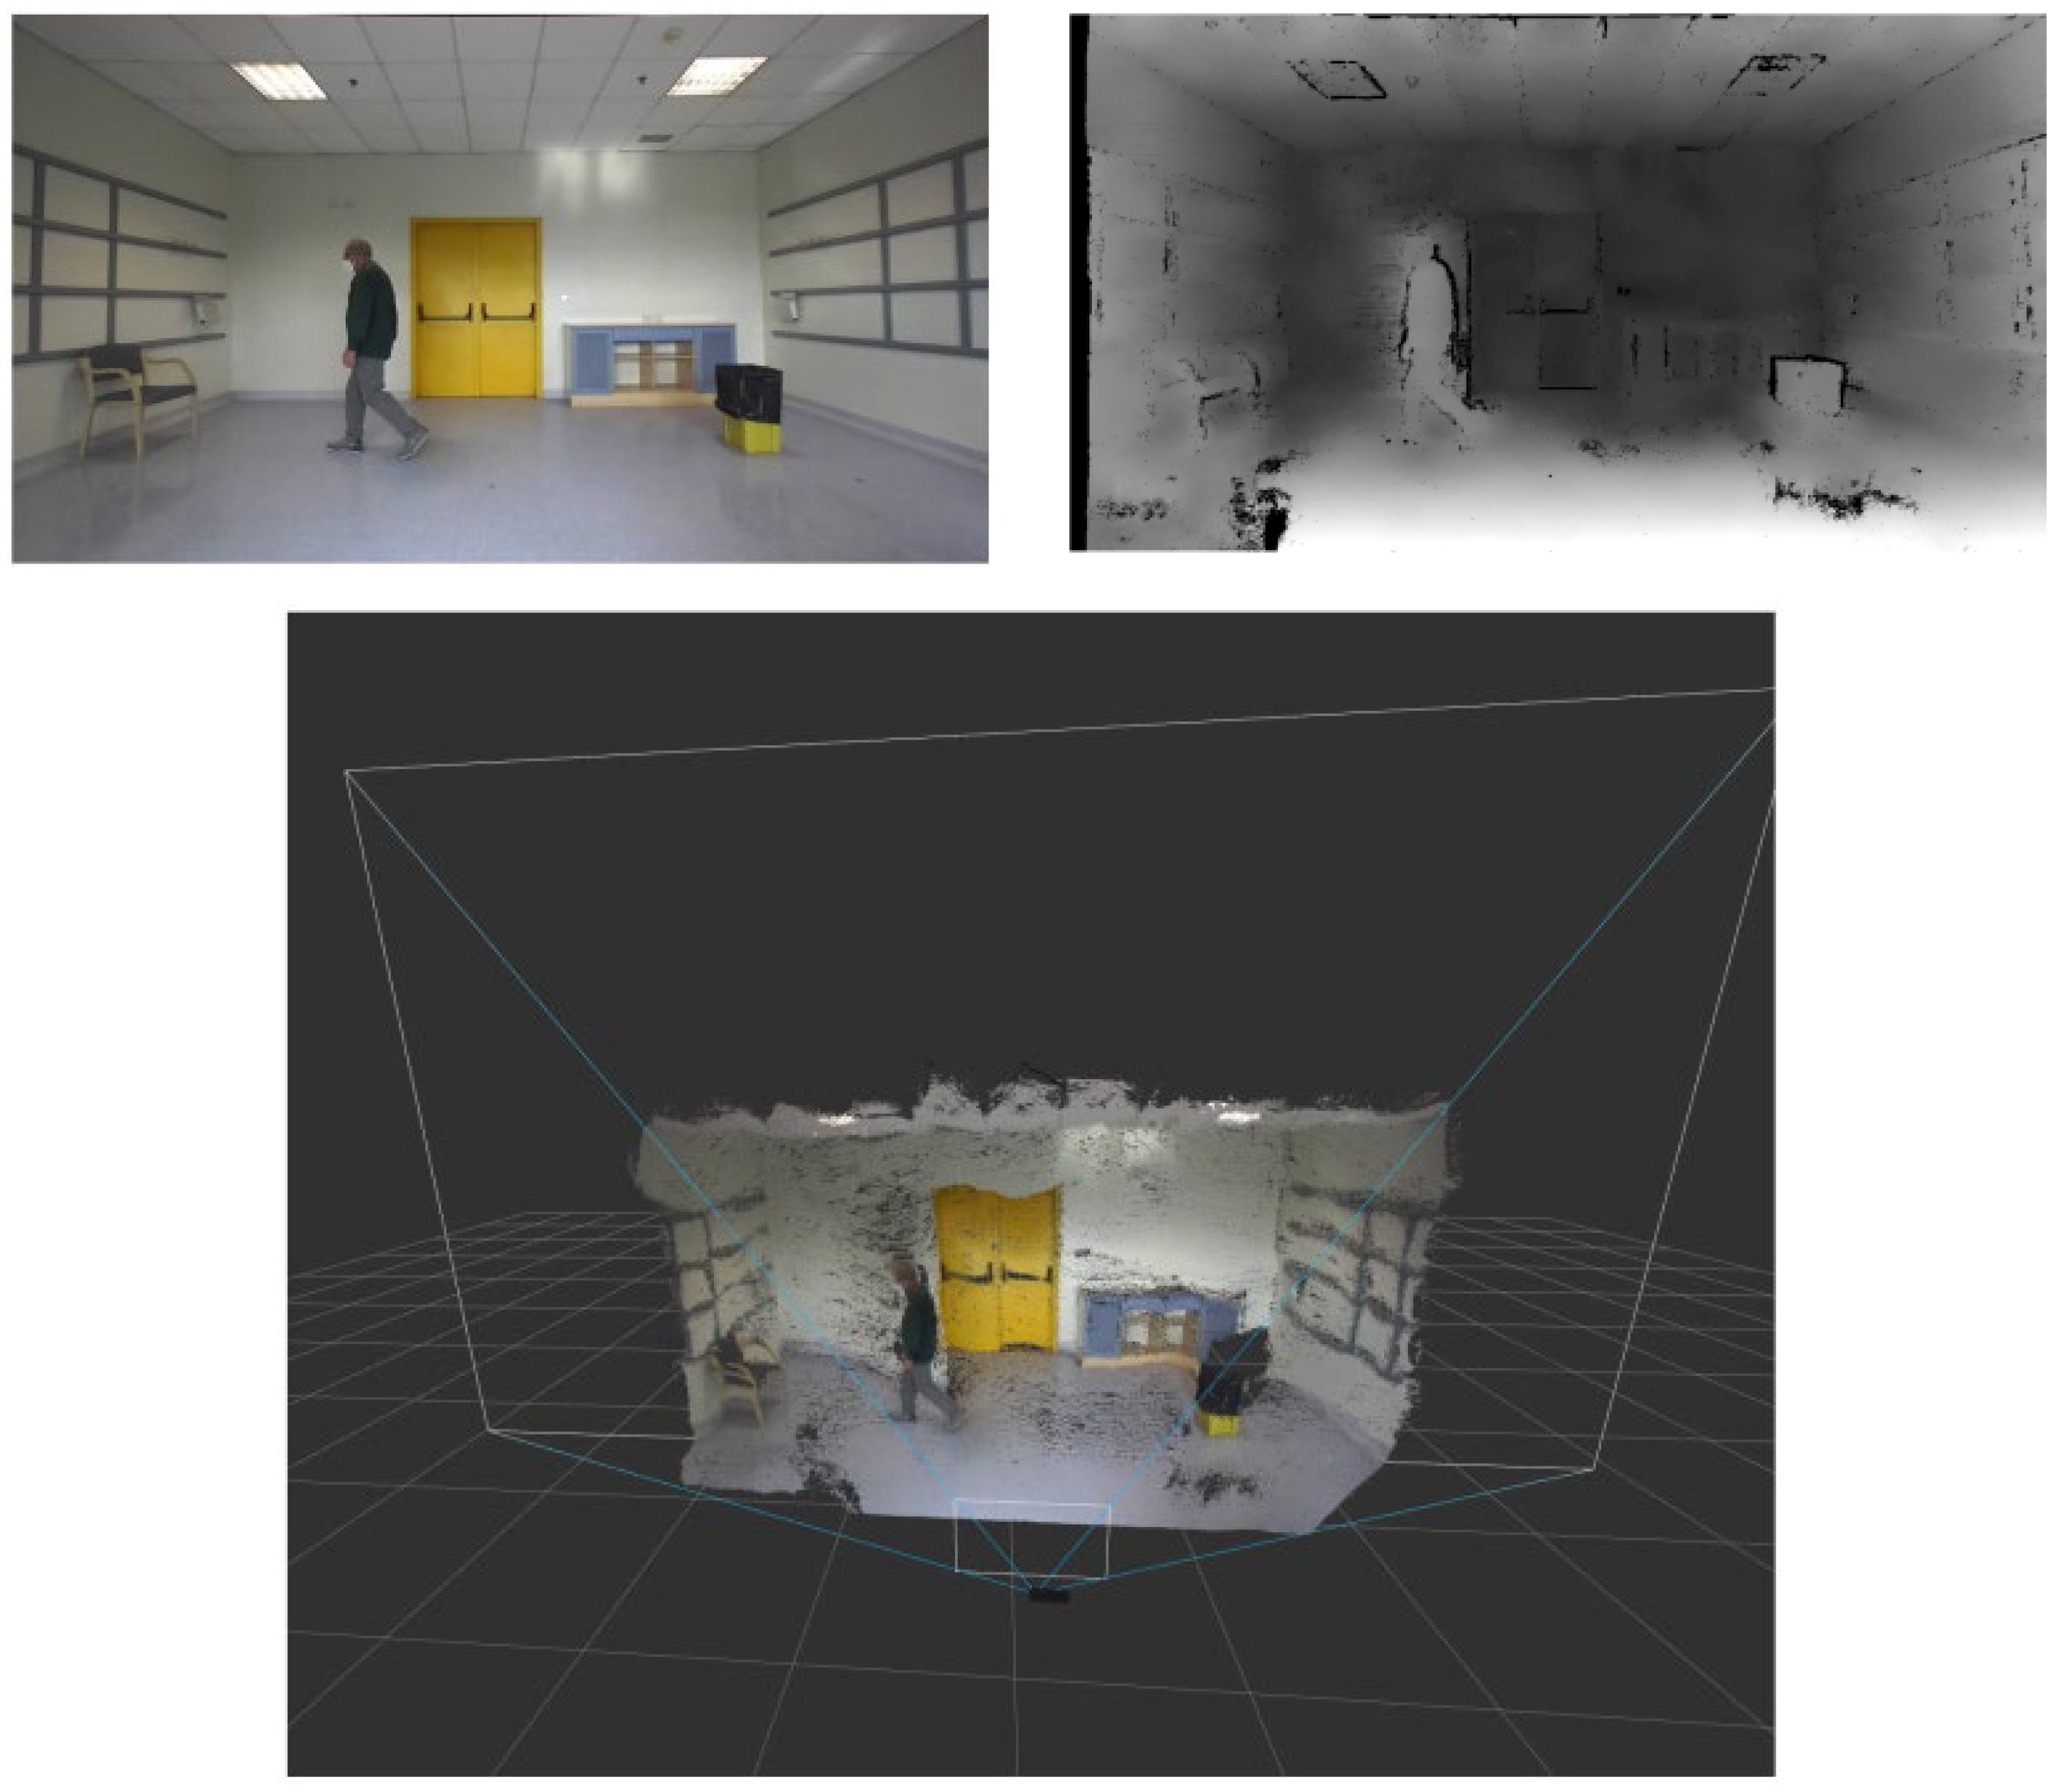
The test environment for this study was a hospital room measuring 7 × 6 m, five of which were used for the walk test (
Figure 4). The MDS-UPDRS Part III experimental protocol requires the subject to walk for at least ten meters and then turn around and return. Therefore, to reach this length in our experimental setup, we asked the subjects who participated in this study to repeat the walking test path four times. This slight adaptation of the standard experimental protocol to the requirements of our setup had the positive side of increasing the likelihood of freezing of gait episodes, which, as known, occur more often when subjects perform a turn to change their direction of travel.
3.1. Gait Analysis
The parameters currently observed by clinicians using the MDS-UPDRS scale to analyze a person’s gait in a test session (see
Figure 5) are stride length and velocity, height of feet lift, heel strikes and turning.
All five patients in the cohort showed impaired walking skills. Four patients received a score of 1 for MDS-UPDRS Item 3.10 from the examiner as a sign of independent walking with minor gait impairment; one patient received a score of 2 because the subject walked with substantial gait impairment. None of the subjects participating in this study required an assistance device for safe walking
3.1.1. Stride Length and Velocity
The subjects’ stride length and speed were evaluated during the two walking tests, both with and without obstacles to be avoided. All subjects showed good ease and effectiveness in their gait and no skidding or stumbling was observed. The acquisition system, thanks to the high number of frames per second acquired, proved itself able to accurately follow the different phases of the subjects’ walks, managing to identify their lower limbs’ KeyPoints during the entire course of the tests.
Figure 6 shows the two points of view for 3D reconstruction of two paired subjects walking.
As it can be seen, the gait posture of the patient appears sufficiently correct in the image from the lateral camera (
Figure 6c), but an evident inclination of the trunk which strongly influences the motor skills of the subject can be seen in the image taken from the front camera (
Figure 6d).
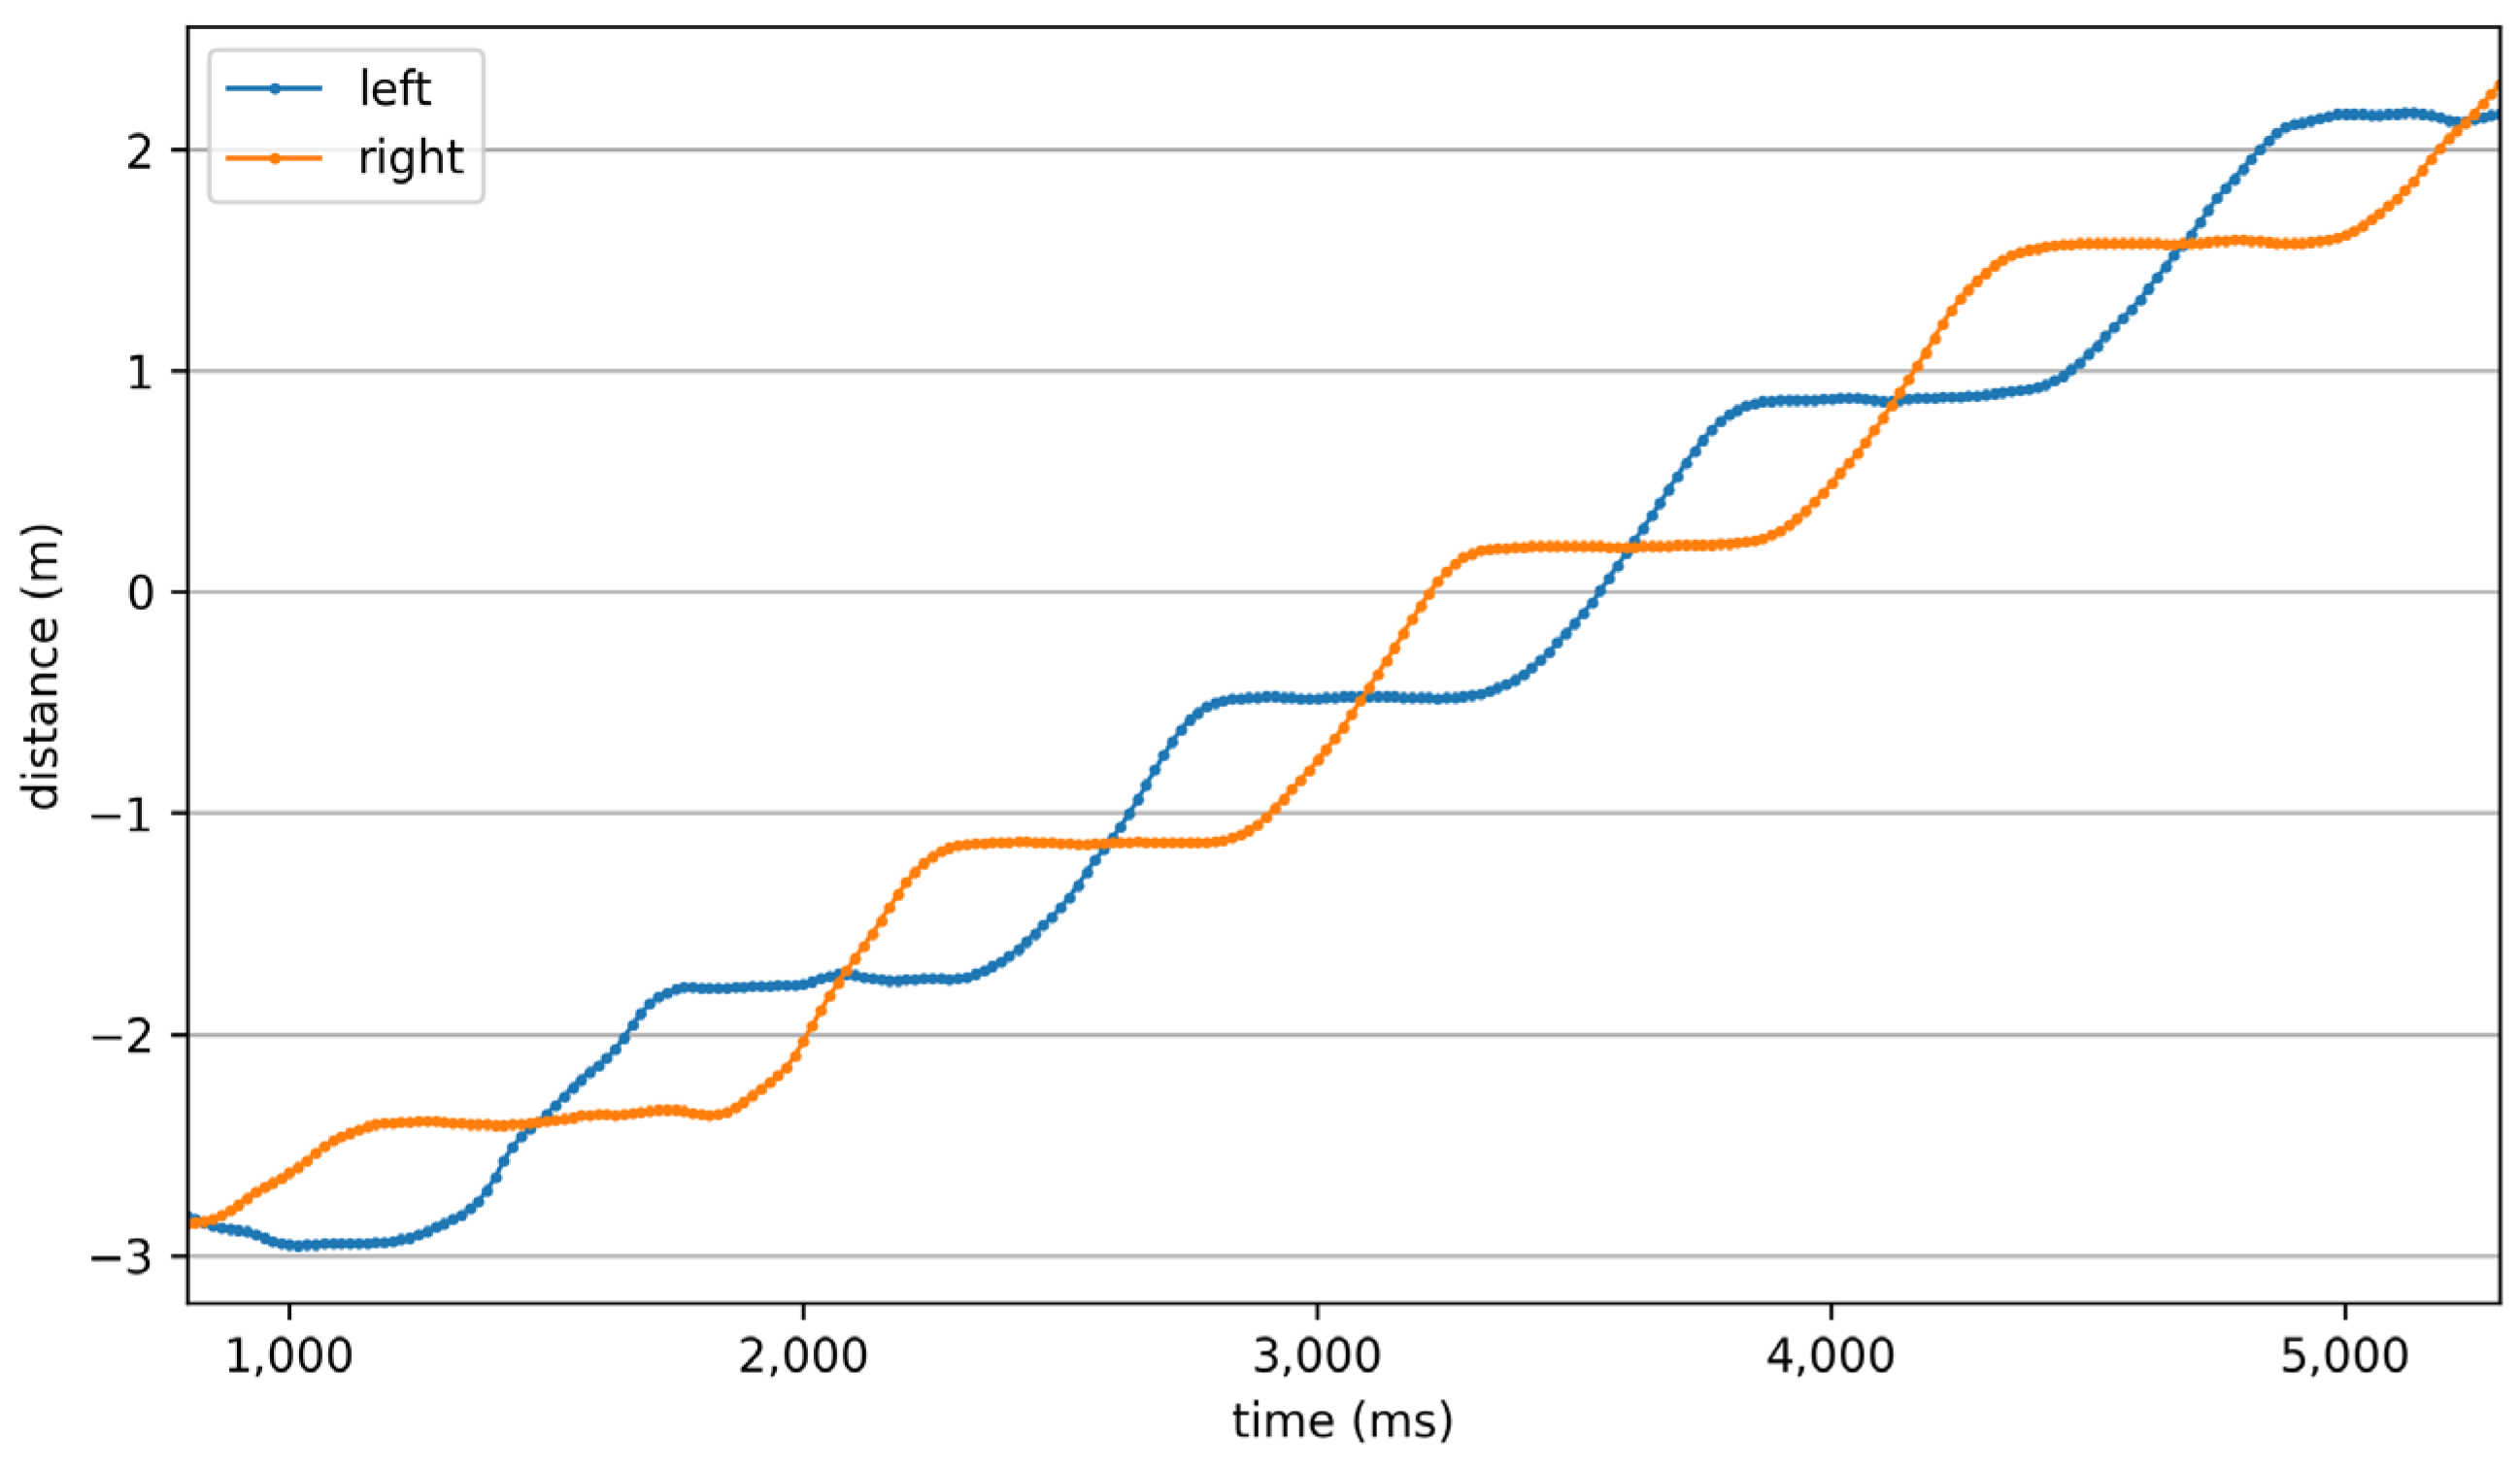
Figure 7 shows the distance from the origin of the left and right foot computed from the system for one of the subjects involved in this study. For all patients, the values of stride length and speed measured during the tests were lower than those of the corresponding control subjects, as perhaps it was reasonable to expect, given the scores that were attributed to them by the clinician.
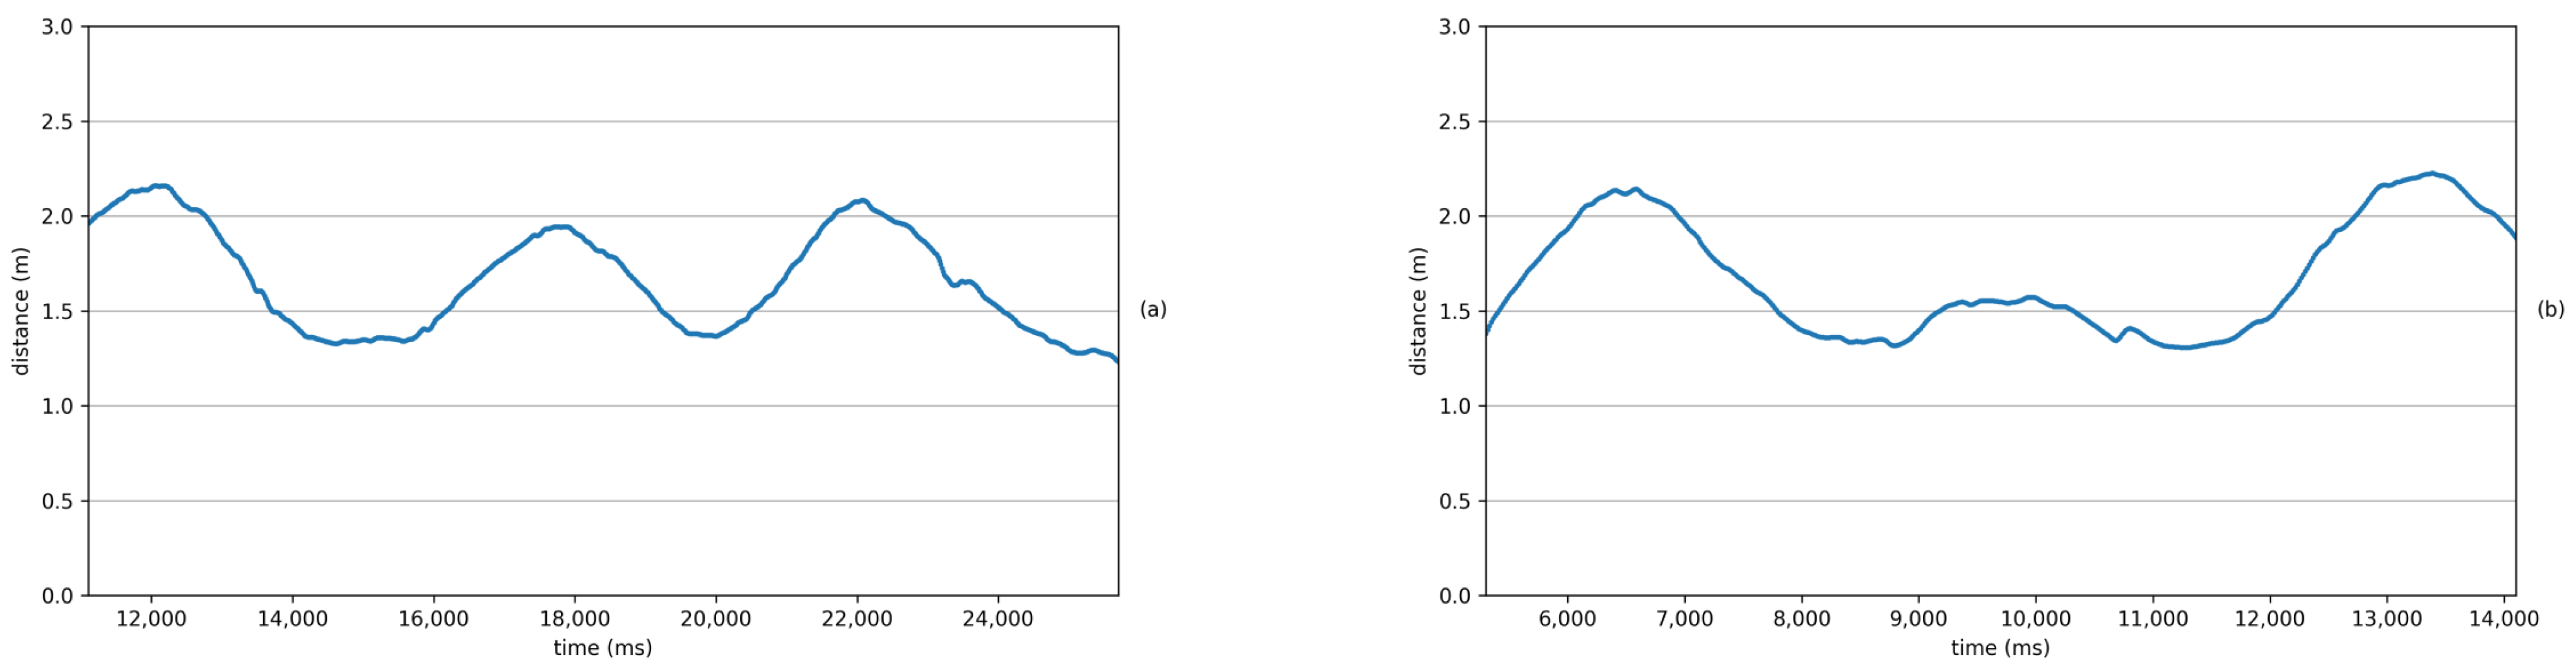
In
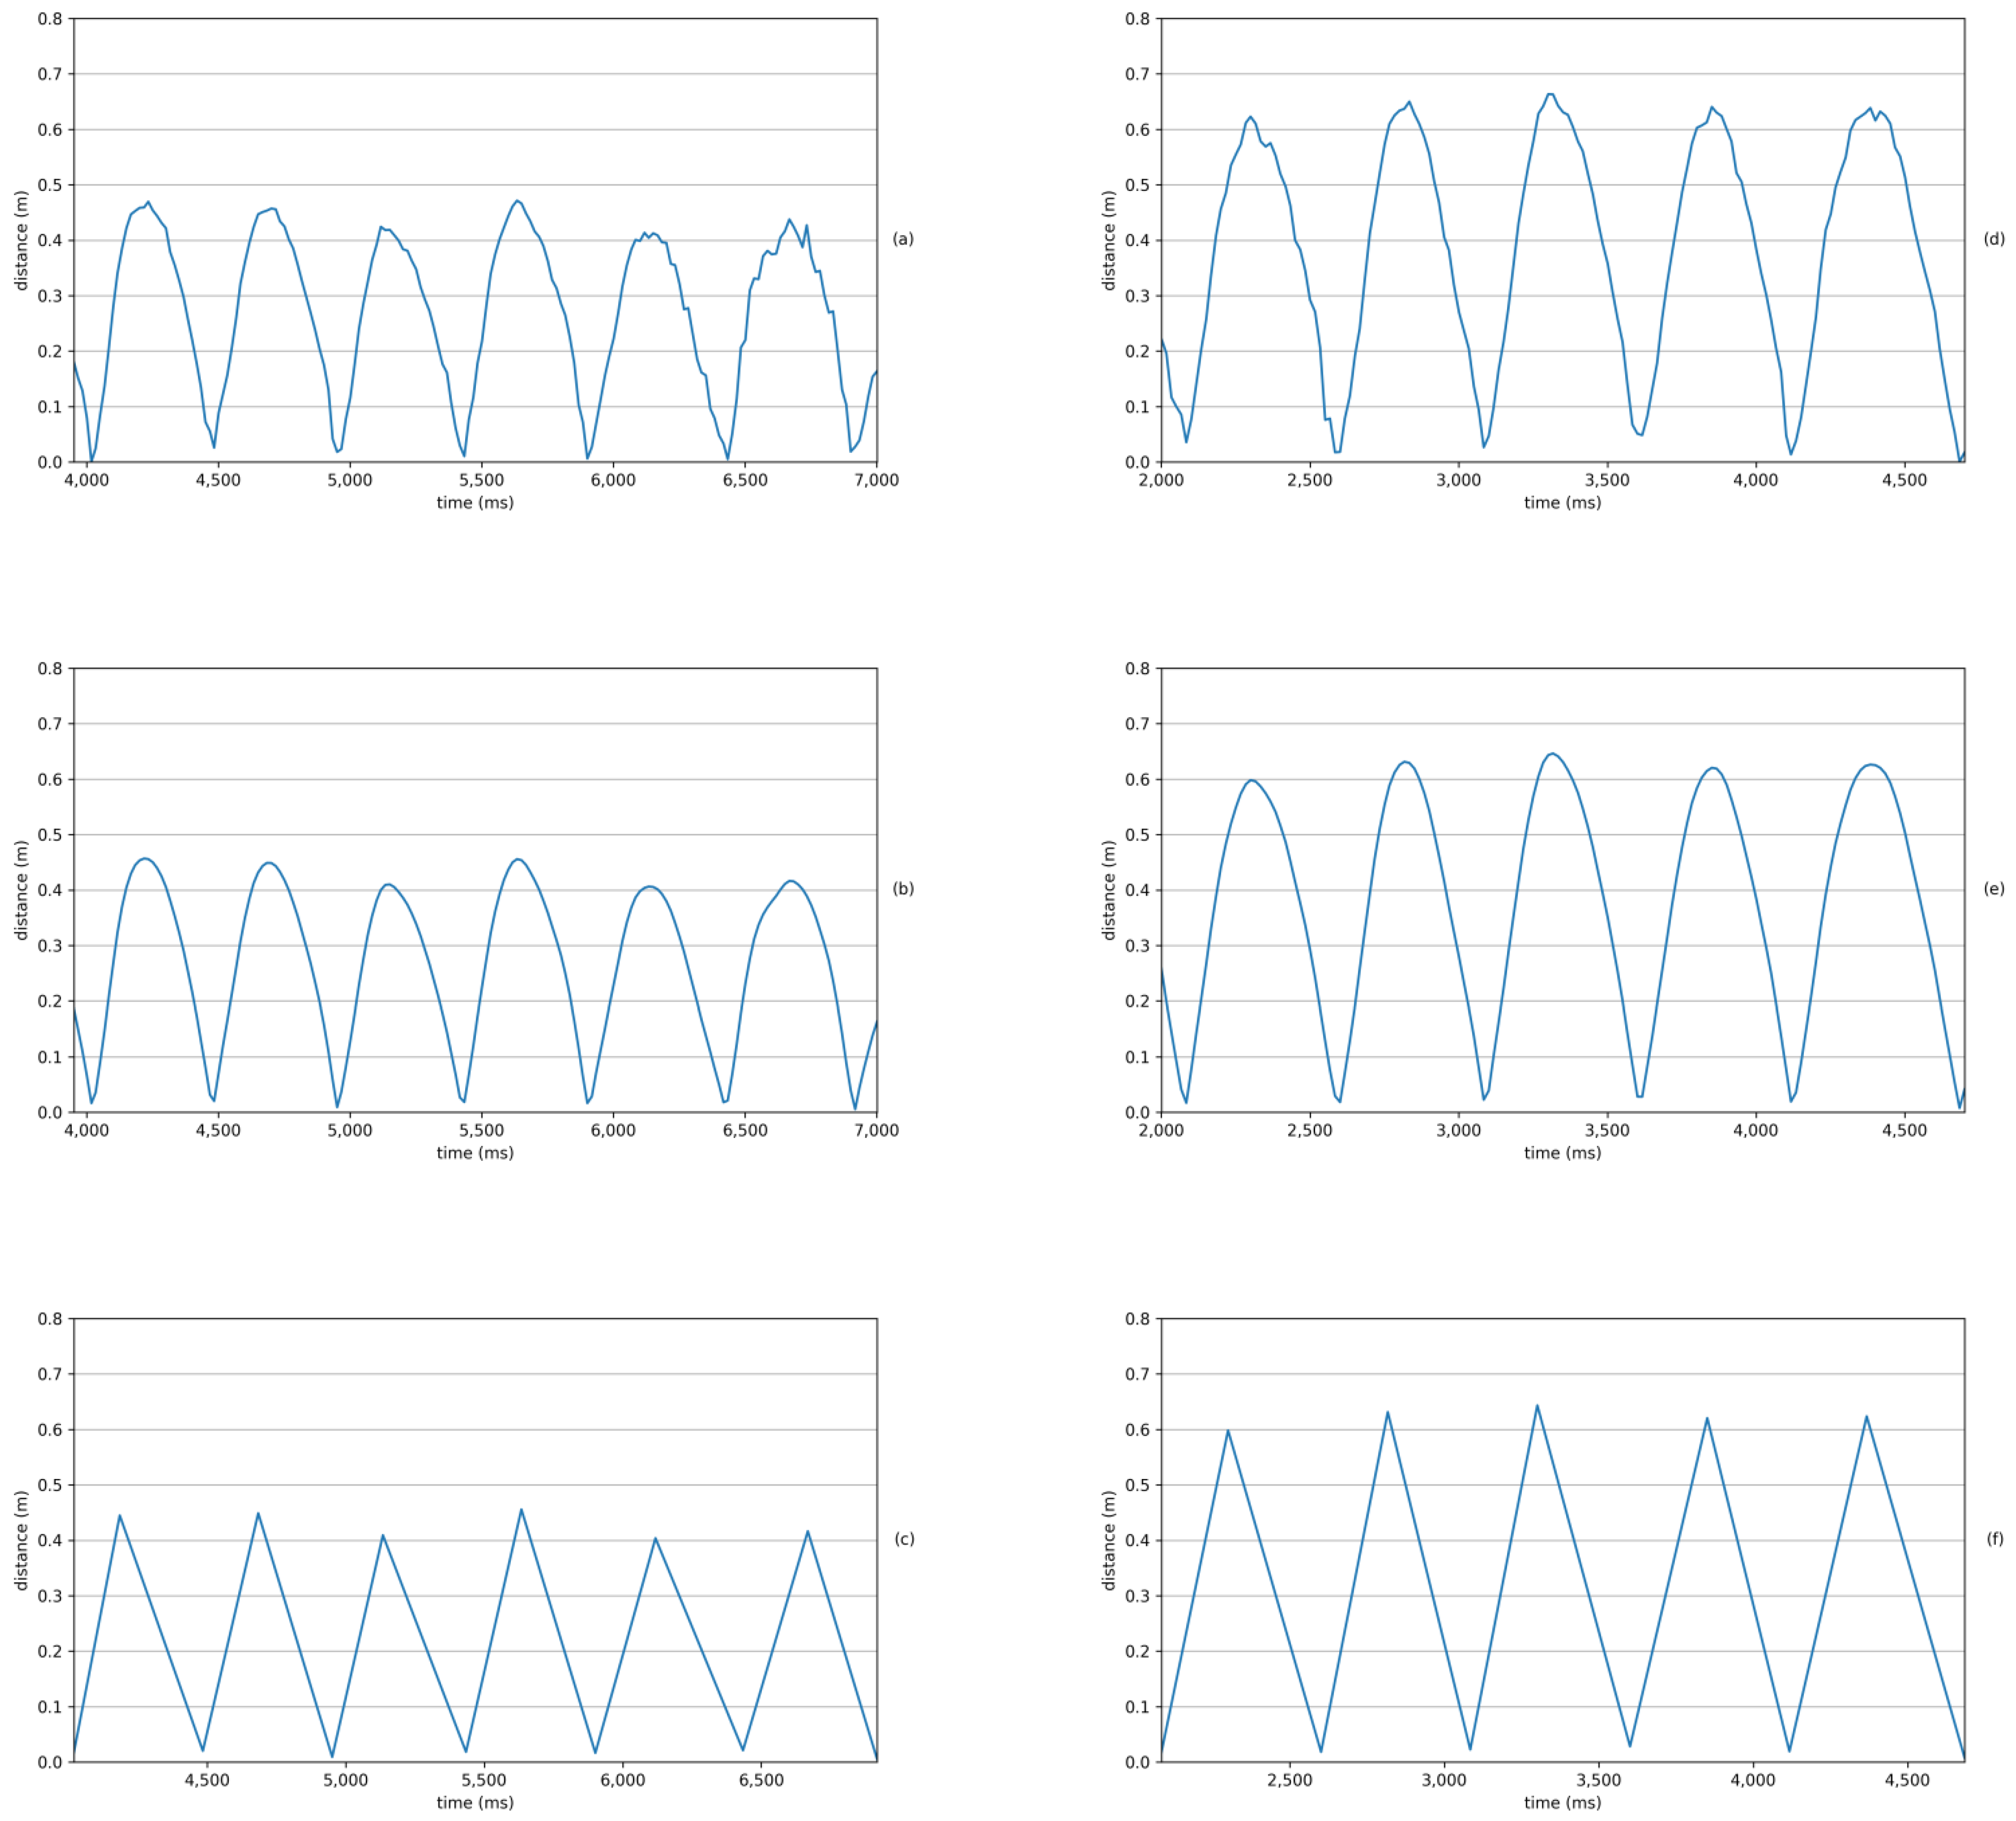
Figure 8, the graphs of distance between heels for two subjects, paired thanks to the strong similarity of their physical characteristics, are shown. The time difference between two consecutive curve maxima with odd or even indices gives the duration of each step.
For this healthy control, an average stride length of 1.25 m was measured (with the lengths of their two steps differing by less than 1 cm) along with an average stride velocity of 1.22 m/s. However, for the PD patient, an average stride length of 0.82 m was measured (with the length of the two steps differing by about 3 cm) along with an average stride velocity of 0.88 m/s. Values measured for all the other subjects involved in the study are shown in
Table 2.
3.1.2. Turning
The subjects’ turning skill, number of steps required and time taken to complete walks were evaluated during the two walking tests, both with and without obstacles to be avoided.
Table 2 only shows the average time values measured for the first scenario.
No skidding or stumbling was observed during this test. For all patients, the measured values of time taken to turn around the obstacle were greater than those of the corresponding control subjects, but there was a certain heterogeneity in the results obtained which did not seem to be reflected in the assessments assigned by the clinicians.
Three of the subjects showed good ease and effectiveness in turning, both when they simply had to turn and go back and when they had to go around the obstacle. Despite this, for one of the subjects there was an episode of freezing of gait, as will be shown in detail in
Section 3.2.
Figure 9 shows the results for two subjects, a patient and his paired control subject, obtained during one of the phases in which each subject moved around an obstacle.
The above values are quite high because the obstacle was bypassed twice, once clockwise and once counterclockwise, to evaluate the different behaviour in these two actions.
The subject belonging to the healthy control group took 12 steps over 8.7 s to move around the obstacle (in the manner described above) and continue walking in the opposite direction. Their average speed during this phase was 0.65 m/s. On the contrary, the PD patient took 22 steps over 14.6 s to move around the obstacle with an average speed of 0.44 m/s.
3.1.3. Height of Foot Lift and Heel Strike during Walking
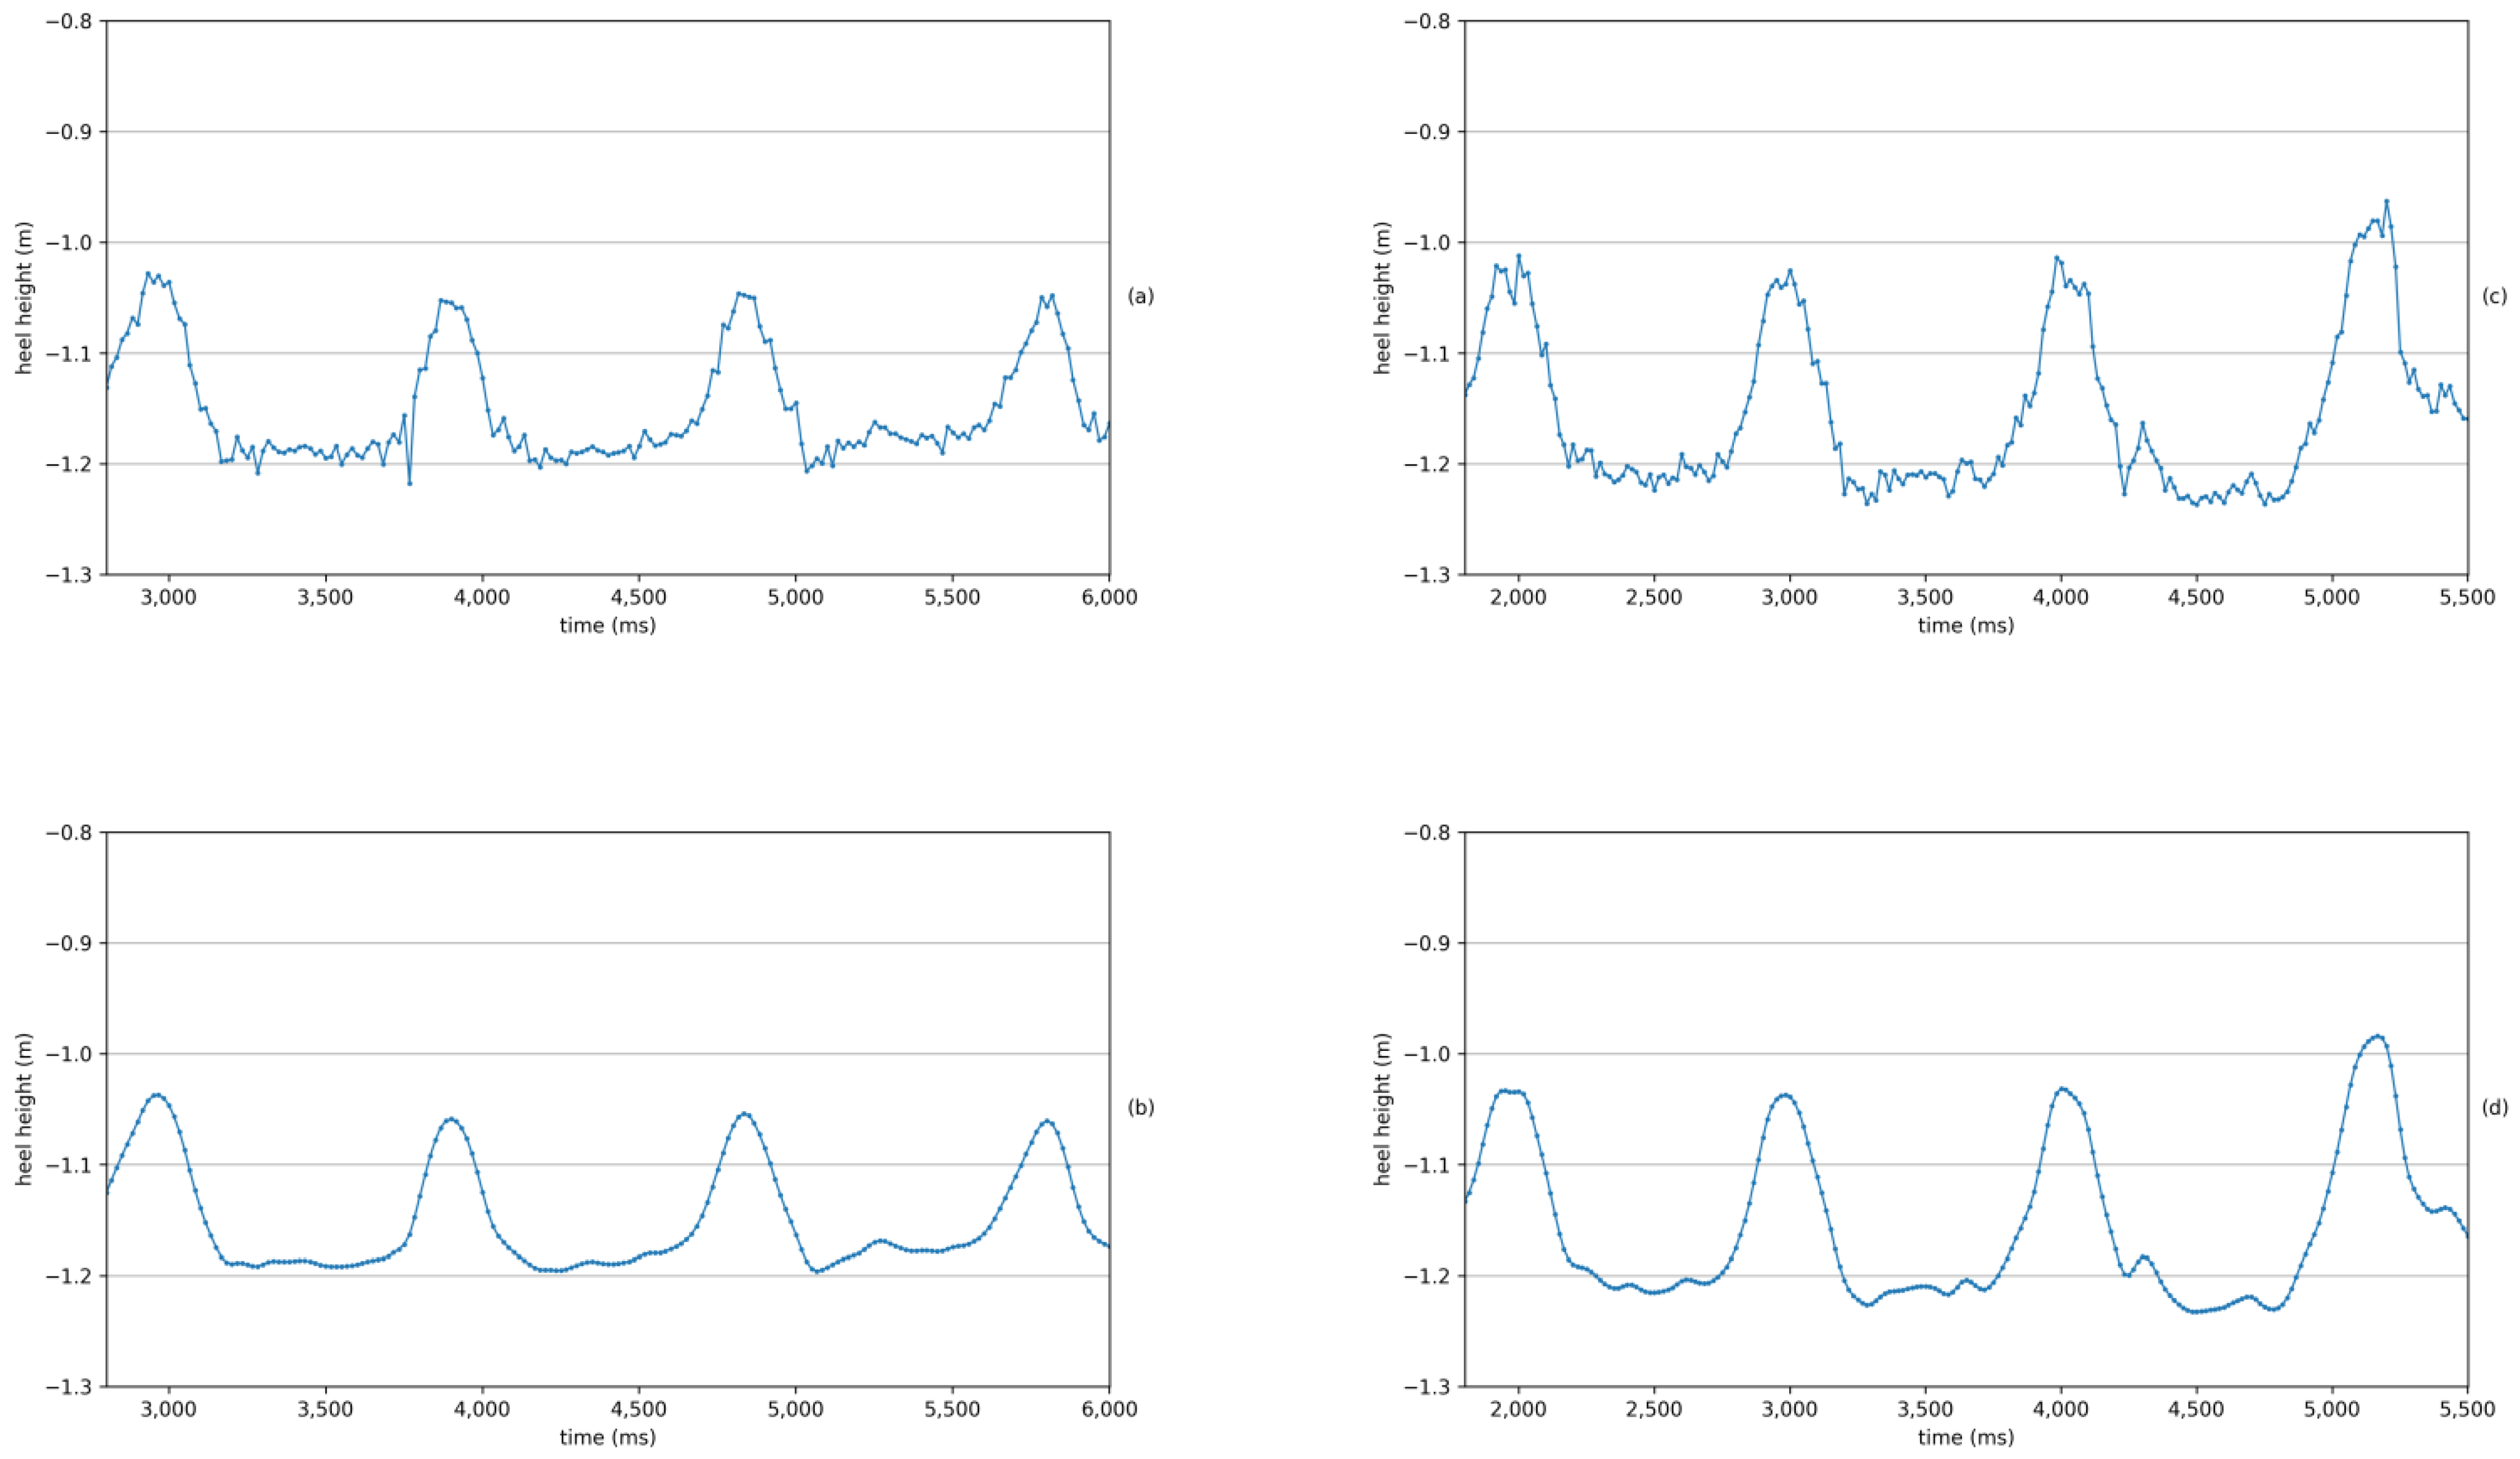
The subjects’ height of foot lift and heel strike during walking were evaluated during the two walking tests. None of the subjects who participated in the study showed particularly noticeable heel drag and their heel lifting was of sufficient height. In the graphs of
Figure 10, it is possible to see the lifting from the ground of the right heel for one subject compared with their paired control.
The subject belonging to the healthy control group had an average heel lift from the ground of 21 cm. On the contrary, the PD patient had an average heel lift from the ground of 13.5 cm, which was representative of the gait impairment of PD patients. The values measured for all the other subjects involved in the study are shown in
Table 2.
3.2. Freezing of Gait
During the whole test session, only one freezing of gait episode occurred, without leading to a fall or injury. For this item, the patient involved had an annotated score equal to 1 on the MDS-UPDRS scale because the episode was a single-halt during turning, but then the subject continued smoothly without freezing during straight walking. All the other subjects received a score 0.
The episode occurred in the walk that included going around an obstacle. To assess the freezing of gait, we considered the length of the stride, which we measured as done previously, using the cinematic characteristics of the two KeyPoints corresponding to the left and right heel: the abnormal gait pattern of gait freezing was revealed by measuring the heels’ distance. The freezing of gait episode occurred when the subject was circling the obstacle in front of the camera.
If the freezing episode had happened when the subject was behind the obstacle, occlusion would probably not have allowed such precise detection of the episode: in that case, our system could only have inferred the position of the hidden KeyPoints, with an error in this estimate that could have been quite large and could have led to masking of a freezing of gait episode with as short a duration as the one that was detected.
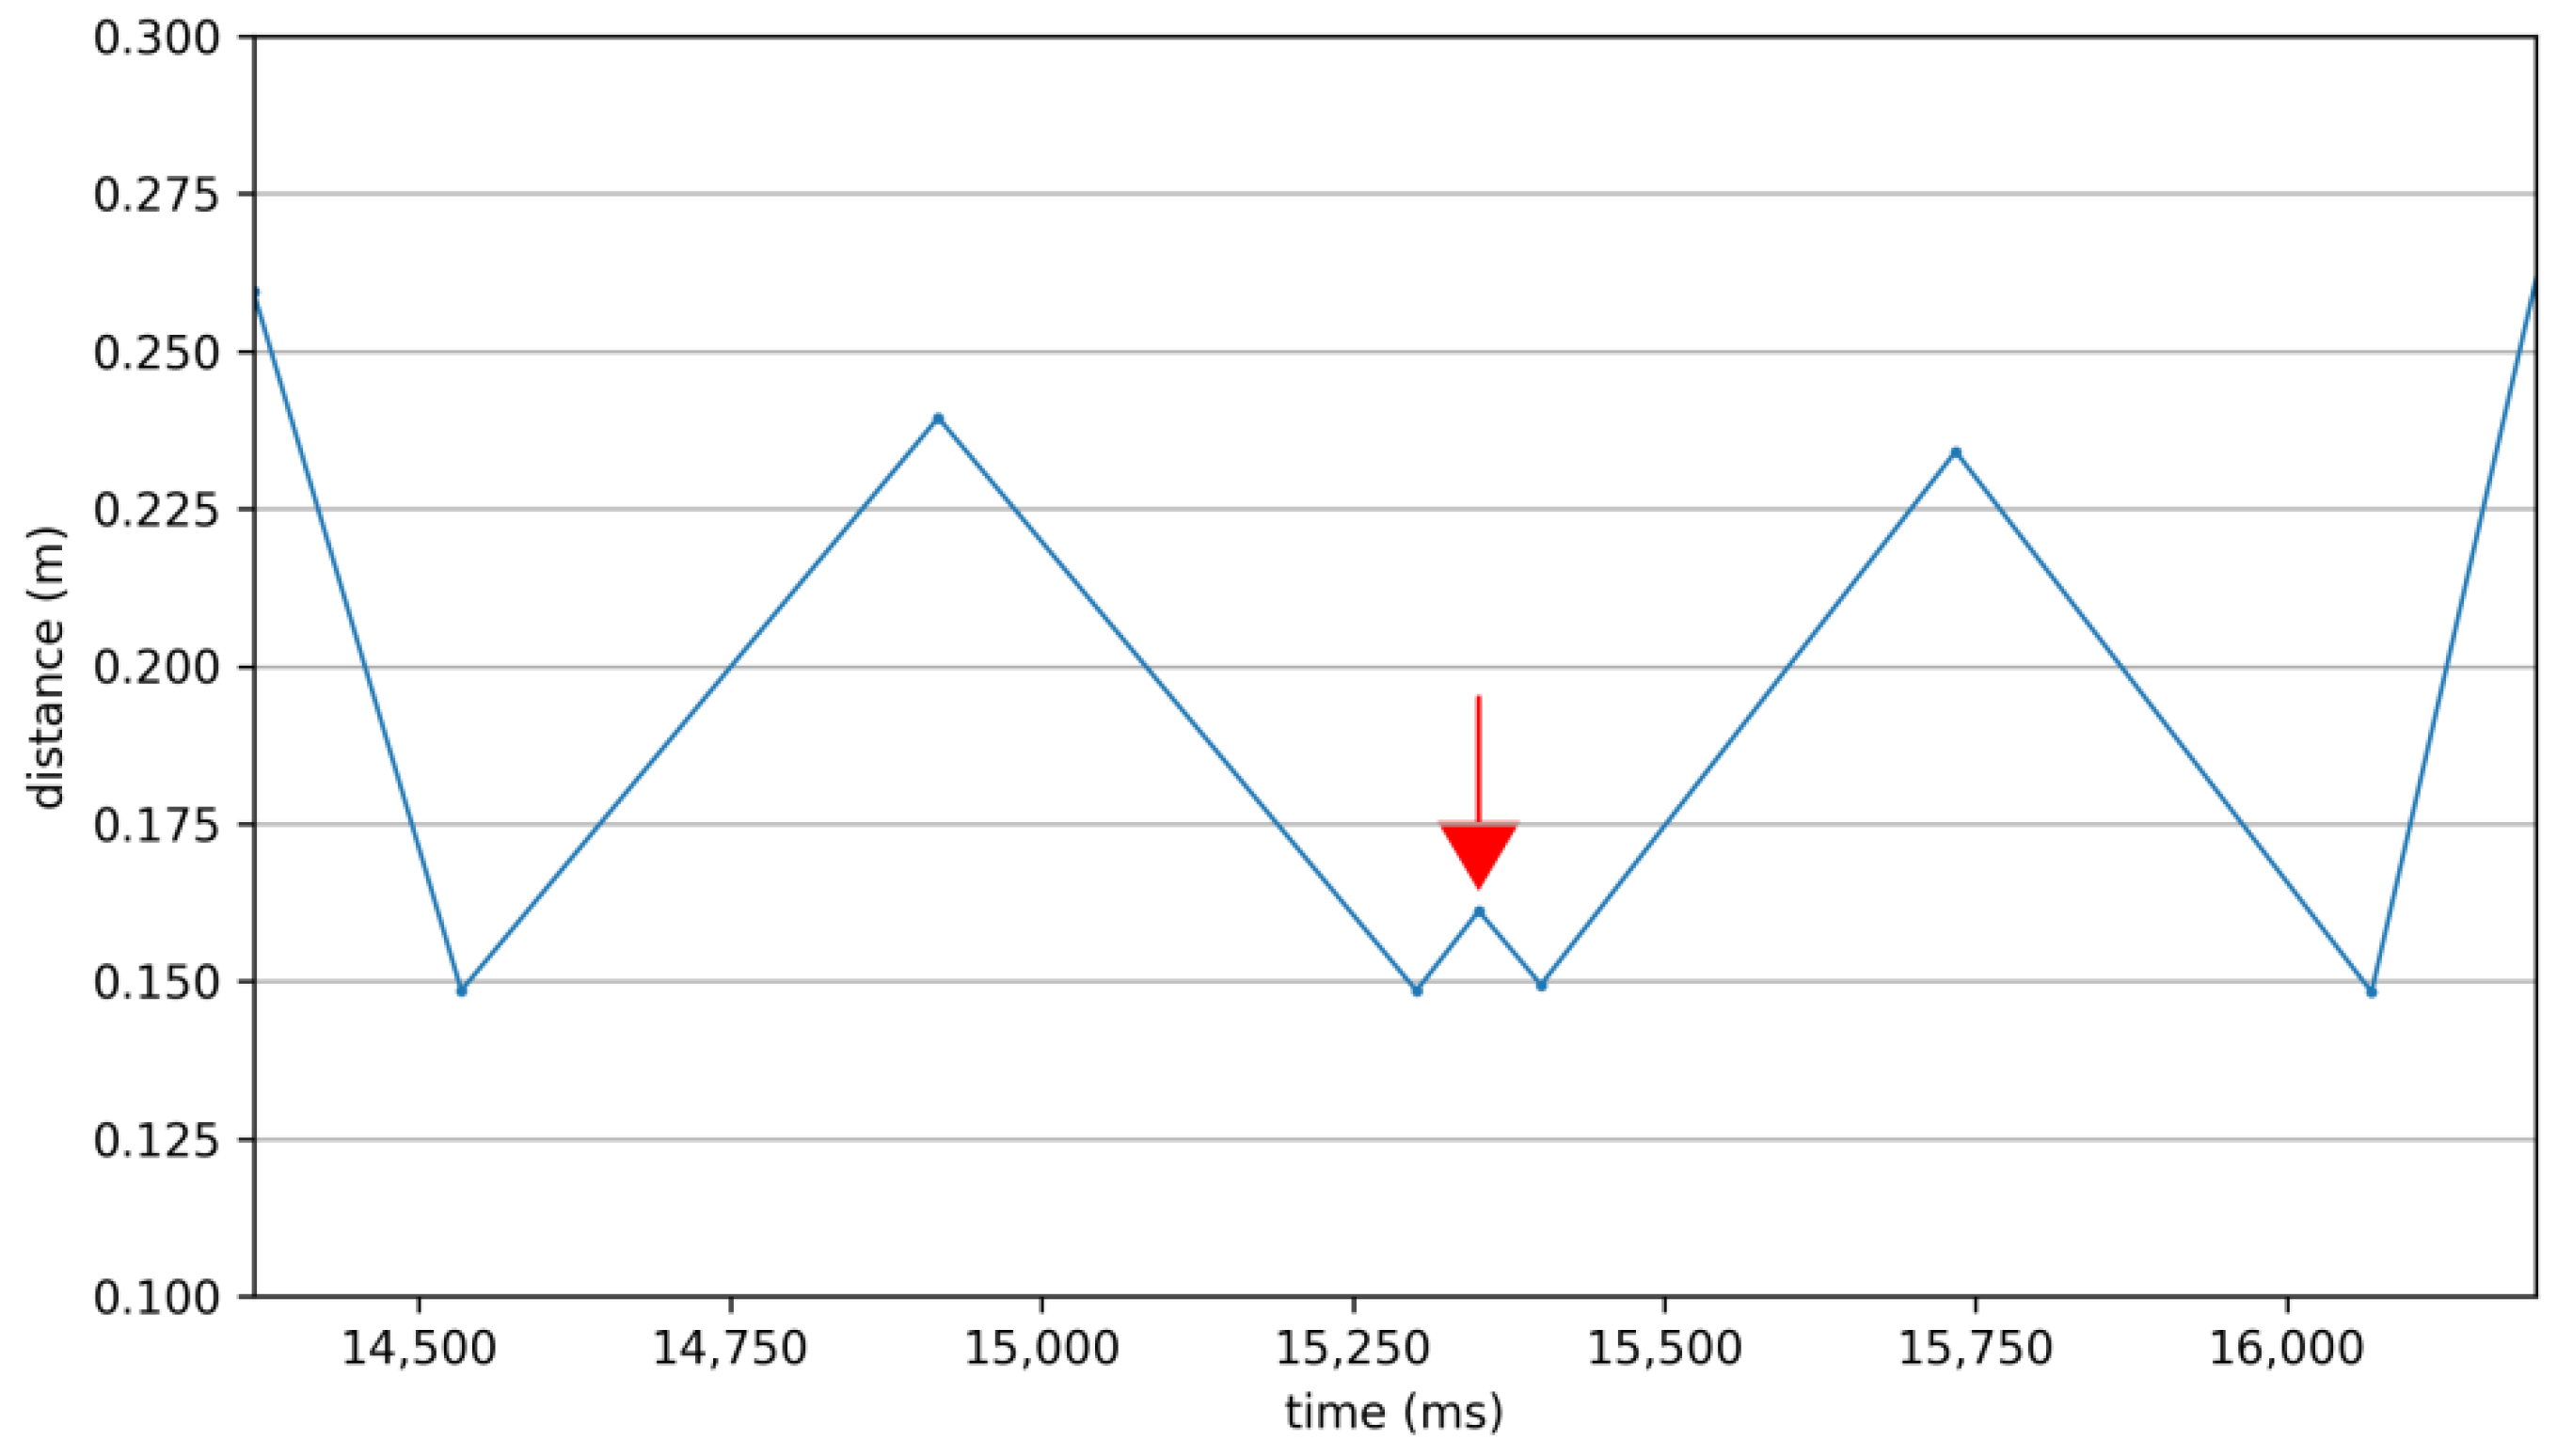
In
Figure 11, it can be seen that, during the freezing of gait episode, the subject’s stride amplitude reduced from an average value of about 24 cm, during the circling of the obstacle, to a much lower value of about 16 cm.
4. Discussion
In this preliminary study, we have tested the performance of an integrated image processing system with an AI-based approach, suited for the estimation of the degree of motor impairment in PD patients by exploring two axial items of the MDS-UPDRS scale: gait and freezing of gait. Although we have not obtained enough data to be able to make a statistical inference, we have found, by a preliminary descriptive analysis of our data, interesting and prospective results.
A subject’s gait is assessed in a composite way through the combination of various observations involving different tests. Our system is able to detect and measure, in patients with PD, a reduction in stride speed and length, in the height of the feet while walking and the need for more time and more steps in turning. These different characteristics measured by the system seem to each contribute in a different way to the assignment of the subject’s MDS-UPDRS score, which is assigned by a neurologist who, on the basis of their personal clinical experience, must necessarily aggregate what is observed during different tests to produce a single score represented by an integer.
In particular, the deviation in the amount of time it takes a subject to turn around and change direction or to move around an obstacle seems very important. In the case of patient 03, for example, who was assigned an MDS-UPDRS score of 1, the values of their deviations in stride amplitude and speed and the height of the feet during walking were about one-third of those of patient 2, also assigned a score of 1. Despite this, while for patient 02 the deviation of the “turning” parameter did not reach the value of 3%, for patient 03 it exceeded 44%. Similarly, in the case of patient 04, also with an MDS-UPDRS score of 1, their even-smaller deviations compared to patient 02 for stride amplitude, speed and height of their feet during walking were compensated for by a more significant deviation of the “turning” parameter, which was, in their case, 94%. The system also found, in one case, a discrepancy concerning the evaluation made by the clinician: in the case of patient 01, the percentage deviations found with respect to the corresponding control subjects seemed to suggest the assignment of a higher value.
The proposed system was able to discriminate different levels of gait impairment by analytically measuring the kinematics of some characteristic points of the human body. Moreover, it appeared to be able to objectively assess the freezing of gait even in the earliest stages of disease in PD patients.
This preliminary work opens interesting scenarios in the objective evaluation of motor dysfunctions affecting gait in Parkinson’s disease. Our proposed system, which includes high-definition video recording, reprocessing analysis, avatar reconstruction and computerized measurements, ranks among the state-of-the-art tools used to obtain more quantitative, refined and graduated measurements of motor deficit.
Our tool, therefore, not only seems to be correctly capable of recognizing and qualitatively highlighting the same alterations assessed by MDS-UPDRS scores (Items 3.10 and 3.11) but, by also providing a quantitative analysis of the results, can handle a wider and more finely graded range of motor disturbances. The potential applications are numerous: detecting early-stage motor deficits that would not reach a score of 1 on the qualitative assessment of the scale, identifying intermediate-grade motor deficits (e.g., more severe than a score of 1 but not so severe as to reach a score of 2), correcting for human error, increasing the degree of objectivity, ensuring greater homogeneity among evaluations of different clinicians or the same clinical neurologist at different times, and facilitating critical choice as far as an indication to advanced therapy under scrutiny, such as Deep Brain Stimulation [
43,
44]. This tool could also be useful for monitoring daily motor responses to L-Dopa and other antiparkinsonian drugs in order to optimize pharmacological therapy and tailor the best treatment for a patient. The ultimate goal is certainly to have a tool that is as early, precise and as faithful as possible to the patient’s motor alterations in order to investigate the degree of motor disturbance as best as possible, with relevant diagnostic and therapeutic implications.
The main limitation of the approach considered in this study concerns the information acquisition device and the methodology for obtaining an estimate of the depth of the scene. In the first case, the vision system is clearly ineffective in its blind spots. An accurate installation and the eventual use of several video cameras could solve this issue if installed in large rooms or with an irregular layout. For the second point, we fall back into the classic drawbacks concerning artificial stereoscopic vision, where the main problem lies in the fact that for some pixels in one image there may be non-univocal correspondence with pixels in the other image, or those pixels in the other may not even exist. This occurs, for example, when some parts of the scene are visible to one camera only and occluded from the other. In case of no correspondence, the direct calculation of the disparity for those pixels is impossible and a 3D reconstruction of the portion of the scene that those pixels represent cannot be made. One of the most widely applied solutions for solving this problem, at least in part, takes into consideration the possibility of obtaining, when possible, an estimate of the target’s position based on its previous history.
Additionally, the enlargement of the number of subjects involved in future clinical tests could also facilitate statistical analysis that could further orient the next development of the proposed system. Further aspects of gait should be deepened, not only from a kinematic but also a cognitive point of view; at a more strictly speculative level, it would be interesting to find ways to deepen the relationship between intention and gait in PD.
Future developments of the proposed system will consist of assessing additional MDS-UPDRS items for other manifestations of PD. Another prospective implication of our tool concerns the possibility of implementing it as a telemedicine tool. The pandemic phase we are experiencing has aroused more interest in tools that can provide parameters on a patient’s disease status from a distance. Our instrument is conducive to the future and these new needs, giving the possibility of using a high-definition camera in the future, perhaps even a smartphone, to measure the degree of motor deficit in PD patients at a distance, with the possibility of being able to intervene on the therapeutic level.
5. Conclusions
In this paper, the feasibility of an objective assessment of the motor symptoms of patients with PD using AI-based video analysis was explored. For this purpose, we collected video clips from regular clinical visits which assessed subjects’ status and advancement of their disease; tests were administered by neurologists who assigned scores for each task using the MDS-UPDRS scale. This study focused on alterations affecting motor skills, which are a hallmark of PD, and disorders of balance, posture and gait. Tracking these basic features provides, in most cases, relevant and early clues for the diagnosis and advancement of PD, facilitating the initiation of appropriate treatment strategies and evaluation of their outcome.
The results obtained in this pilot study suggest that the proposed system has the potential to provide an objective and accurate assessment of PD without imposing an additional burden on patients, providing clinicians with a range of information with which to deepen their assessments.
Our tool not only seems to be correctly capable of recognizing and qualitatively highlighting the same gait impairments assessed by MDS-UPDRS scores but, by also providing a quantitative analysis of the results, can handle a wider and more finely graded range of motor disorders. The system is able to offer an evaluation of the skill of a subject that is not expressed in a range of integer numbers, but that returns to the clinician all the richness of an instrumental measure. The results obtained during this pilot study seem to suggest that it is possible to extend the range in which gait impairment can be expressed. This aspect is decisive both in diagnostics, especially at an early stage of PD, when the symptoms are so mild that they do not reach a score of one on the MDS-UPDRS scale, and in the management of therapy which can thus agree with greater adherence to the real state of the health of the subject. On the other hand, for the freezing of gait, more data should be collected for general consideration, as only one episode occurred across all test sessions. However, it is worth noting that the system was able to correctly detect it, despite it being a minor episode in which the subject briefly froze and then easily started walking again.
The system has proved capable of offering clinicians, through accurate and objective data, a second opinion or a suggestion to reconsider the assignment of MDS-UPDRS score. During the test campaign, in one case, a rather evident discrepancy was found between the evaluation carried out by the clinician and the percentage deviations found with respect to the corresponding control subject (nearly 38% shorter average stride length, 37% shorter in both stride width and speed, 84% greater turning time and nearly 32% lower average foot lift height), seeming to suggest the assignment of a different value for the patient. Having brought these data to the attention of the clinician, after a careful evaluation that also included viewing the videos of the tests in which the subject was involved, the clinician decided to change the assigned score, making it consistent with the measures obtained by the proposed system.
The combined use of computer vision and deep learning techniques allows the system to obtain helpful information to describe a patient’s status and the progress of their disease in a way that does not impact their normal activities. The system is therefore not only effective but also has a low impact on the person, whose abilities, even of a residual type, are evaluated by the system in a way that is as accurate as it is respectful and ergonomic.
Thanks to its simplicity, the proposed system can be adopted in higher-level telemedicine on an ongoing basis in environments where people usually live and work as a tactful and non-intrusive approach with clinical-grade accuracy.
Author Contributions
Conceptualization, A.Z., R.C., N.B.M. and A.S.; methodology, A.Z. and R.C.; software, A.Z.; validation, A.Z., R.C., T.S., N.B.M. and A.S.; formal analysis, A.Z. and R.C.; investigation, A.Z. and R.C.; resources, A.Z., R.C., N.B.M. and A.S.; data curation, A.Z. and C.R.; writing—original draft preparation, A.Z., R.C. and V.B.; writing—review and editing, A.Z., R.C., V.B., C.R. and G.A.; visualization, A.Z.; supervision, A.Z., N.B.M., A.S., V.B. and G.A.; project administration, A.Z. and N.B.M.; funding acquisition, A.Z., N.B.M. and V.B. All authors have read and agreed to the published version of the manuscript.
Funding
Fondazione G.B.BARONI to Nicola Mercuri.
Institutional Review Board Statement
Ethical approval for this study was obtained from the Department of Systems Medicine at Tor Vergata University of Rome Ethics Committee (RS 97/19).
Informed Consent Statement
Informed consent was obtained from all subjects involved in the study.
Conflicts of Interest
The authors declare no conflict of interest.
References
- Available online: https://ec.europa.eu/info/strategy/priorities-2019-2024/new-push-european-democracy/ (accessed on 3 May 2022).
- Available online: https://www.movementdisorders.org/ (accessed on 3 May 2022).
- Available online: https://institutducerveau-icm.org/ (accessed on 3 May 2022).
- Feigin, V.L.; Abajobir, A.A.; Abate, K.H.; Abd-Allah, F.; Abdulle, A.M.; Abera, S.F.; Abyu, G.Y.; Ahmed, M.B.; Aichour, A.N.; Aichour, I.; et al. Neurological Disorders Collaborator Group. Global, regional, and national burden of neurological disorders during 1990–2015: A systematic analysis for the Global Burden of Disease Study 2015. Lancet Neurol. 2017, 16, 877–897. [Google Scholar] [CrossRef] [Green Version]
- Goetz, C.G.; Tilley, B.C.; Shaftman, S.R.; Stebbins, G.T.; Fahn, S.; Martinez-Martin, P.; Poewe, W.; Sampaio, C.; Stern, M.B.; Dodel, R.; et al. Movement Disorder Society-sponsored revision of the Unified Parkinson’s Disease Rating Scale (MDS-UPDRS): Scale presentation and clinimetric testing results. Mov. Disord. Off. J. Mov. Disord. Soc. 2008, 23, 2129–2170. [Google Scholar] [CrossRef] [PubMed]
- Brewka, G. Artificial intelligence—A modern approach by Stuart Russell and Peter Norvig, Prentice Hall. Series in Artificial Intelligence, Englewood Cliffs, NJ. Knowl. Eng. Rev. 1996, 11, 78–79. [Google Scholar] [CrossRef]
- Topol, E.J. High-performance medicine: The convergence of human and artificial intelligence. Nat. Med. 2019, 25, 44–56. [Google Scholar] [CrossRef]
- Brody, H. Cancer diagnosis. Nature 2020, 579, S1. [Google Scholar] [CrossRef] [Green Version]
- Ranschaert, E.R.; Morozov, S.; Algra, P.R. Artificial Intelligence in Medical Imaging: Opportunities, Applications and Risks; Springer: Berlin/Heidelberg, Germany, 2019; ISBN 978-3-319-94877-5. [Google Scholar]
- Bishop, C.M.; Nasrabadi, N.M. Pattern Recognition and Machine Learning; Springer: Berlin/Heidelberg, Germany, 2006; Volume 4, ISBN 978-0387-31073-2. [Google Scholar]
- Murphy, K.P. A Probabilistic Perspective; MIT Press: Cambridge, MA, USA, 2012; ISBN 978-0-262-01802. [Google Scholar]
- LeCun, Y.; Bengio, Y.; Hinton, G. Deep learning. Nature 2015, 521, 436–444. [Google Scholar] [CrossRef]
- Goodfellow, I.; Bengio, Y.; Courville, A. Deep Learning (Adaptive Computation and Machine Learning Series); The MIT Press: Cambridge, MA, USA, 2016; ISBN 0-262-03561-8. [Google Scholar]
- Marr, D. Vision: A Computational Approach; Freeman & Co: San Francisco, CA, USA, 1982. [Google Scholar]
- Poggio, T.; Torre, V.; Koch, C. Computational vision and regularization theory. Nature 1985, 317, 314–319. [Google Scholar] [CrossRef]
- Taraglio, S.; Zanela, A. A practical use of cellular neural networks: The stereo-vision problem as an optimisation. Mach. Vis. Appl. 2000, 11, 242–251. [Google Scholar] [CrossRef]
- Zanela, A.; Taraglio, S. A cellular neural network based optical range finder. Int. J. Circuit Theory Appl. 2002, 30, 271–285. [Google Scholar] [CrossRef]
- Zanardi, A.P.J.; da Silva, E.S.; Costa, R.R.; Passos-Monteiro, E.; dos Santos, I.O.; Kruel, L.F.M.; Peyré-Tartaruga, L.A. Gait parameters of Parkinson’s disease compared with healthy controls: A systematic review and meta-analysis. Sci. Rep. 2021, 11, 752. [Google Scholar] [CrossRef]
- Roggendorf, J.; Chen, S.; Baudrexel, S.; van de Loo, S.; Seifried, C.; Hilker, R. Arm swing asymmetry in Parkinson’s disease measured with ultrasound based motion analysis during treadmill gait. Gait Posture 2012, 35, 116–120. [Google Scholar] [CrossRef] [PubMed]
- Noh, B.; Youm, C.; Lee, M.; Cheon, S.-M. Gait characteristics in individuals with Parkinson’s disease during 1-minute treadmill walking. PeerJ 2020, 8, e9463. [Google Scholar] [CrossRef] [PubMed]
- De Lima, A.L.S.; Hahn, T.; Evers, L.; De Vries, N.M.; Cohen, E.; Afek, M.; Bataille, L.; Daeschler, M.; Claes, K.; Boroojerdi, B.; et al. Feasibility of large-scale deployment of multiple wearable sensors in Parkinson’s disease. PLoS ONE 2017, 12, e0189161. [Google Scholar] [CrossRef] [Green Version]
- Mazilu, S.; Blanke, U.; Calatroni, A.; Gazit, E.; Hausdorff, J.M.; Tröster, G. The role of wrist-mounted inertial sensors in detecting gait freeze episodes in Parkinson’s disease. Pervasive Mob. Comput. 2016, 33, 1–16. [Google Scholar] [CrossRef]
- Dindorf, C.; Teufl, W.; Taetz, B.; Bleser, G.; Fröhlich, M. Interpretability of Input Representations for Gait Classification in Patients after Total Hip Arthroplasty. Sensors 2020, 20, 4385. [Google Scholar] [CrossRef]
- Caramia, C.; Torricelli, D.; Schmid, M.; Munoz-Gonzalez, A.; Gonzalez-Vargas, J.; Grandas, F.; Pons, J.L. IMU-Based Classification of Parkinson’s Disease from Gait: A Sensitivity Analysis on Sensor Location and Feature Selection. IEEE J. Biomed. Health Inform. 2018, 22, 1765–1774. [Google Scholar] [CrossRef]
- Maetzler, W.; Domingos, J.; Srulijes, K.; Ferreira, J.J.; Bloem, B.R. Quantitative wearable sensors for objective assessment of Parkinson’s disease. Mov. Disord. 2013, 28, 1628–1637. [Google Scholar] [CrossRef]
- Fraccaro, P.; Coyle, L.; Doyle, J.; O’Sullivan, D. Real-World Gyroscope-Based Gait Event Detection and Gait Feature Extraction. In Proceedings of the eTELEMED, The Sixth International Conference on eHealth, Telemedicine, and Social Medicine, Barcelona, Spain, 24–27 March 2014. [Google Scholar]
- Ye, M.; Yang, C.; Stankovic, V.; Stankovic, L.; Cheng, S. Distinct Feature Extraction for Video-Based Gait Phase Classification. IEEE Trans. Multimed. 2019, 22, 1113–1125. [Google Scholar] [CrossRef] [Green Version]
- Valencia-Marin, C.; Pulgarin-Giraldo, J.; Velasquez-Martinez, L.; Alvarez-Meza, A.; Castellanos-Dominguez, G. An Enhanced Joint Hilbert Embedding-Based Metric to Support Mocap Data Classification with Preserved Interpretability. Sensors 2021, 21, 4443. [Google Scholar] [CrossRef]
- Verlekar, T.T.; De Vroey, H.; Claeys, K.; Hallez, H.; Soares, L.D.; Correia, P.L. Estimation and validation of temporal gait features using a markerless 2D video system. Comput. Methods Programs Biomed. 2019, 175, 45–51. [Google Scholar] [CrossRef] [Green Version]
- Sabo, A.; Mehdizadeh, S.; Ng, K.-D.; Iaboni, A.; Taati, B. Assessment of Parkinsonian gait in older adults with dementia via human pose tracking in video data. J. Neuroeng. Rehabil. 2020, 17, 97. [Google Scholar] [CrossRef] [PubMed]
- Cao, Z.; Hidalgo, G.; Simon, T.; Wei, S.E.; Sheikh, Y. OpenPose: Realtime Multi-Person 2D Pose Estimation Using Part Affinity Fields. IEEE Trans. Pattern Anal. Mach. Intell. 2021, 43, 172–186. [Google Scholar] [CrossRef] [PubMed] [Green Version]
- Xue, D.; Sayana, A.; Darke, E.; Shen, K.; Hsieh, J.-T.; Luo, Z.; Li, L.-J.; Downing, N.L.; Milstein, A.; Fei-Fei, L. Vision-Based Gait Analysis for Senior Care. arXiv 2018. [Google Scholar] [CrossRef]
- Rupprechter, S.; Morinan, G.; Peng, Y.; Foltynie, T.; Sibley, K.; Weil, R.S.; Leyland, L.-A.; Baig, F.; Morgante, F.; Gilron, R.; et al. A Clinically Interpretable Computer-Vision Based Method for Quantifying Gait in Parkinson’s Disease. Sensors 2021, 21, 5437. [Google Scholar] [CrossRef]
- Sato, K.; Nagashima, Y.; Mano, T.; Iwata, A.; Toda, T. Quantifying normal and parkinsonian gait features from home movies: Practical application of a deep learning–based 2D pose estimator. PLoS ONE 2019, 14, e0223549. [Google Scholar] [CrossRef] [PubMed] [Green Version]
- Kidziński, Ł.; Yang, B.; Hicks, J.L.; Rajagopal, A.; Delp, S.L.; Schwartz, M.H. Deep neural networks enable quantitative movement analysis using single-camera videos. Nat. Commun. 2020, 11, 4054. [Google Scholar] [CrossRef] [PubMed]
- Available online: https://www.stereolabs.com/ (accessed on 3 May 2022).
- Available online: https://developer.nvidia.com/gpu-accelerated-libraries (accessed on 3 May 2022).
- Needham, L.; Evans, M.; Cosker, D.P.; Wade, L.; McGuigan, P.M.; Bilzon, J.L.; Colyer, S.L. The accuracy of several pose estimation methods for 3D joint centre localisation. Sci. Rep. 2021, 11, 20673. [Google Scholar] [CrossRef]
- Available online: https://developer.nvidia.com/cudnn (accessed on 3 May 2022).
- Taraglio, S.; Zanela, A. Improving a Real-Time Neural-Based Stereo Vision System. Real-Time Imaging 2001, 7, 59–76. [Google Scholar] [CrossRef]
- Okuma, Y. Freezing of gait in Parkinson’s disease. J. Neurol. 2006, 253, vii27–vii32. [Google Scholar] [CrossRef]
- Hausdorff, J.M.; Schaafsma, J.D.; Balash, Y.; Bartels, A.L.; Gurevich, T.; Giladi, N. Impaired regulation of stride variability in Parkinson’s disease subjects with freezing of gait. Exp. Brain Res. 2003, 149, 187–194. [Google Scholar] [CrossRef]
- Sharma, V.D.; Safarpour, D.; Mehta, S.H.; Vanegas-Arroyave, N.; Weiss, D.; Cooney, J.W.; Mari, Z.; Fasano, A. Telemedicine and Deep brain stimulation—Current practices and recommendations. Parkinsonism Relat. Disord. 2021, 89, 199–205. [Google Scholar] [CrossRef] [PubMed]
- Cerroni, R.; Scalise, S.; Stefani, A. Coronavirus Disease 2019 and Management of Advanced Therapies in Parkinson’s Disease; Peculiar Needs for Deep Brain Stimulation Patients? Mov. Disord. Clin. Pract. 2020, 7, 875–876. [Google Scholar] [CrossRef] [PubMed]
Figure 1.
How the system processes input data to obtain the subject’s features.
Figure 1.
How the system processes input data to obtain the subject’s features.
Figure 2.
The KeyPoints of the BODY-25 model.
Figure 2.
The KeyPoints of the BODY-25 model.
Figure 3.
Setup used to assess the gait parameters of the subjects: (a) in a free walk and (b) in a walk with an obstacle to be avoided.
Figure 3.
Setup used to assess the gait parameters of the subjects: (a) in a free walk and (b) in a walk with an obstacle to be avoided.
Figure 4.
(top) Input image; (middle) computed PAFs; (bottom) subject’s KeyPoints and Parts.
Figure 4.
(top) Input image; (middle) computed PAFs; (bottom) subject’s KeyPoints and Parts.
Figure 5.
Test for assessing the subject’s gait skills. Top left image: input image. Top right image: the computed disparity map. Bottom image: how the system reconstructed the 3D scene where a subject was performing the test.
Figure 5.
Test for assessing the subject’s gait skills. Top left image: input image. Top right image: the computed disparity map. Bottom image: how the system reconstructed the 3D scene where a subject was performing the test.
Figure 6.
The two points of view for 3D reconstruction of one subject from the control group ((a): the subject walks from left to right; (b): the subject walks towards the camera) and one of the control patients ((c): the subject walks from left to right; (d): the subject walks away from the camera).
Figure 7.
Distance from the origin of left (blue) and right (orange) foot, respectively, for one of the subjects involved in the study.
Figure 7.
Distance from the origin of left (blue) and right (orange) foot, respectively, for one of the subjects involved in the study.
Figure 8.
Plot of distance between heels for two paired subjects: (a) patient subject heels distance; (b) patient subject smoothed heels distance, where we apply smoothing to remove false positives and false local extremes; (c) extreme of the curve (b) located to compute stride features: the time difference between two consecutive maxima with even or odd indexes gives the duration of each stride; (d) control subject heels distance; (e) control subject smoothed heels distance, where we apply smoothing to remove false positives and false local extremes; (f) extreme of the curve (e) located to compute stride features: the time difference between two consecutive maxima with even or odd indexes gives the duration of each stride.
Figure 9.
Distance from the origin for two paired subjects in the turning phase: (a) patient subject; (b) control subject.
Figure 9.
Distance from the origin for two paired subjects in the turning phase: (a) patient subject; (b) control subject.
Figure 10.
Plot of heel height for two paired subjects: (a) patient subject heel height; (b) patient subject smoothed heel height, where false positives and false local extremes have been removed; (c) control subject heel height; (d) control subject smoothed heel height, where false positives and false local extremes have been removed.
Figure 11.
Plot of distance between heels. A freezing of gait episode that occurred during the test is clearly visible and is highlighted by the red arrow.
Figure 11.
Plot of distance between heels. A freezing of gait episode that occurred during the test is clearly visible and is highlighted by the red arrow.
Table 1.
Summary of subjects in the study (n = 10).
Table 1.
Summary of subjects in the study (n = 10).
| Gender | Female | 4 (40%) |
| Male | 6 (60%) |
| Age (years) | 62.7 ± 13.2 |
| Height (cm) | 167.8 ± 8.4 |
| Weight (kg) | 71.4 ± 20.3 |
Table 2.
Summary of gait features for the five PD subjects, with their annotated MDS-UPDRS scores. In red is the percentage deviation from the corresponding control subject.
Table 2.
Summary of gait features for the five PD subjects, with their annotated MDS-UPDRS scores. In red is the percentage deviation from the corresponding control subject.
| Patients | P01 | P02 | P03 | P04 | P05 |
|---|
| Annotated MDS-UPDRS Score | 1 | 1 | 1 | 2 | 1 |
|---|
| Gait features | Step 1 length (m) | 0.48 | −42.17 | 0.41 | −32.79 | 0.50 | −9.09 | 0.41 | −33.87 | 0.51 | −10.53 |
| Step 2 length (m) | 0.54 | −33.33 | 0.45 | −26.23 | 0.48 | −12.73 | 0.41 | −34.92 | 0.54 | −5.26 |
| Stride amplitude (m) | 1.02 | −37.04 | 0.86 | −29.51 | 0.98 | −10.91 | 0.82 | −34.40 | 1.05 | −8.70 |
| Stride velocity (m/s) | 0.90 | −37.06 | 0.79 | −28.83 | 0.79 | −13.80 | 0.88 | −27.87 | 1.05 | −0.94 |
| Turning (s) | 1.29 | 84.29 | 0.77 | 2.67 | 1.04 | 44.44 | 0.87 | 77.55 | 0.97 | 94.00 |
| Height of foot 1 lift (m) | 0.20 | −31.03 | 0.18 | −18.18 | 0.21 | 0.00 | 0.13 | −40.91 | 0.21 | −12.50 |
| | Height of foot 2 lift (m) | 0.19 | −32.14 | 0.16 | −23.81 | 0.18 | −10.00 | 0.14 | −30.00 | 0.22 | −4.35 |
| Publisher’s Note: MDPI stays neutral with regard to jurisdictional claims in published maps and institutional affiliations. |
© 2022 by the authors. Licensee MDPI, Basel, Switzerland. This article is an open access article distributed under the terms and conditions of the Creative Commons Attribution (CC BY) license (https://creativecommons.org/licenses/by/4.0/).


 ,
, 


