Article

Aerodynamic Behavior and Impact on Driving Safety of Spalling Blocks Comprising High-Speed-Railway Tunnel Lining

School of Civil Engineering, Central South University, Shaoshan South Road No. 22, Changsha 410075, China
*
Authors to whom correspondence should be addressed.
Appl. Sci. 2022, 12(5), 2593; https://doi.org/10.3390/app12052593
Submission received: 12 February 2022 / Revised: 24 February 2022 / Accepted: 25 February 2022 / Published: 2 March 2022

Abstract

:
The lining of operating high-speed-railway tunnels suffers from cracks, the peeling of material, and other deteriorations and defects, all of which seriously affect driving safety. However, the trajectory of a falling block from the tunnel lining in a tunnel train wind environment and its impact on driving safety are unknown. To study the movement of falling blocks under a coupling effect of tunnel train wind and the local flow field of the falling blocks, a three-dimensional gas–solid-coupling numerical calculation model of spalling blocks–train–tunnel–air was established using FLUENT software The aerodynamic evolution mechanism governing the spalling blocks of the lining was analyzed, and we found that the falling process of a spalling block is affected by the coupling of its own characteristics and transient train wind. Train wind directly induced the horizontal motion of falling blocks, generated curves and eddy currents, and changed the motion state of spalled blocks. Furthermore, by comprehensively considering the motion trajectories of flaky and blocky blocks at different positions, the impact of spalling blocks on driving safety was obtained. The dangerous area of spalling blocks was approximately 5.5 m above the ground, which must be paid attention to. Our results provide guidance for the operation and maintenance of high-speed-railway tunnels.

1. Introduction

High-speed-railway tunnels are prone to various problems such as lining cracks and falling blocks [1,2,3] owing to many factors such as a complex geological environment and construction defects. Two main forms of tunnel lining spalling blocks are encountered: cement mortar, flaky blocks located at the lining surface layer and blocky, concrete blocks located at the construction joint or joint of the tunnel lining [4]. The main spalling position is the vault, as shown in Figure 1. Under the repeated action of inducing factors such as the vibration load of high-speed trains and aerodynamic pressure in the tunnel, lining blocks may spall off during the train operation period, affecting driving safety (see Figure 1c). For example, on 12 January 2016, lining blocks comprising the construction joint of the vault associated with a tunnel in Pingshan in China spalled off (cement block size: length: 10 cm, width: 5.5 cm, and thickness: 1.8 cm). This resulted in a train speed limit of 120 km/h and affected the normal running of the train for more than 2 h [5].
Many studies have focused on the cause, mechanism, and crack propagation process of lining fractures through analytical formulas [6,7,8], theoretical analyses [9,10,11], field investigations [12,13], numerical simulations, and model tests [14]. However, the influence of train aerodynamic factors remains unexplored. In addition, several studies have used the real vehicle test [15,16], the model test [17], numerical simulations [18], and other methods. These works considered the distribution characteristics of the train surface, tunnel wall, train wind in the tunnel, and micropressure wave at the entrance of the tunnel. However, each study focused on the single motion of the train, and the gas–solid-coupling motion of falling blocks under a train wind environment was overlooked. The driving safety under different natural environments [19,20,21] and infrastructure [22,23,24,25], as well as the safety of ancillary facilities in tunnels [26,27], under a train wind environment have been investigated in various works. However, the influence of spalling and falling blocks of high-speed-railway tunnel linings on driving safety has yet to be investigated.
In this work, a three-dimensional gas–solid-coupling calculation model of spalling blocks–train–tunnel–air was established on the basis of the basic theory of gas–solid interaction and the numerical simulation software, FLUENT [28]. The characteristics of the flow field structure change during the falling process of spalling blocks comprising a tunnel lining were determined. Based on these characteristics, a coupling effect during the falling process of spalling blocks under a train wind environment was analyzed, and the aerodynamic evolution mechanism of the lining blocks was obtained. Spalling blocks affected driving safety in different circumferential tunnel positions. Therefore, the influence partitions of these blocks on driving safety were obtained, identifying key prevention areas for spalling lining pieces in high-speed-railway tunnels.

2. Gas–Solid-Coupling Model of Spalling Blocks–Train–Tunnel–Air

2.1. Overview of Aerodynamic Coupling Model

A three-dimensional gas–solid-coupling calculation model of spalling blocks, a train, a tunnel, and air was established on the basis of the finite element calculation software, FLUENT. A flow chart of our calculation model is shown in Figure 2. In this model, the process of a spalling block falling from the top of a tunnel lining and landing under (or touching the body of) a train wind environment was synchronously simulated. The train wind interacted with the block. The wind pressure on the surface of the block under the action of the wind was obtained from the basic calculation formula of the wind pressure theory. Combined with the aerodynamic pressure on the surface of the block, the force (including force and moment) on the block was obtained in integral form. Motion parameters such as acceleration, velocity, and displacement of the spalling block were obtained using the rigid body dynamics equation.

2.2. Basic Theory of Gas–Solid Coupling

(1)
Turbulence model
The modified out-of-body vortex turbulence model (DDES) that is based on the two equations of SST k–ω was selected to simulate an unsteady, incompressible transient flow field based on the basic equations of fluid mechanics. This turbulence model has been widely used to simulate high-speed-train flow field structures [29,30,31,32]. According to Menter [33], the equations governing SST k–ω are as follows:
ρ k t + u i ρ k x i = x j [ Γ k k x j ] + G k Y k
ρ ω t + u i ρ k ω x i = x j [ Γ ω ω x j ] + G ω Y ω + D ω
where k represents turbulent kinetic energy, w represents the turbulent kinetic energy dissipation rate, Gω represents turbulent kinetic energy caused by a velocity gradient, Γk and Γw represent the convection terms of k and ω, Yk and Yw represent the effective diffusion terms of k and ω caused by turbulence, and Dw represents the cross-convection term. Turbulent shear stress was considered a part of turbulent viscosity.
(2)
Gas–solid-coupling interaction
The pressure on the lining surface under train wind is equal to the sum of the wind pressure generated by the wind and the aerodynamic pressure (pressure wave) formed by the compressed air of the train. This pressure is given as follows:
p j = 1 n ( p v j + p w j ) = 1 n ( 1 2 ρ v v j 2 + p w j )
where j represents the number of blocks on the lining surface, 1, 2, ⋯ n; pj, pvj, and pwj represent total pressure, wind pressure, and aerodynamic pressure, respectively, on the surface of block j, newtons per square meter; and vvj represents the wind speed on the lining surface, meters per second.
The external force acting on a spalling block’s center of mass and the external moment around this point were obtained by integrating the compressive strength of the block as follows:
{ F x = 1 n p j cos ( α j ) s j F y = 1 n p j cos ( β j ) s j m ρ g F z = 1 n p j cos ( φ j ) s j
{ M c x = 1 n p j cos ( α j ) s j r c x j M c y = 1 n p j cos ( β j ) s j r c y j M c z = 1 n p j cos ( φ j ) s j r c z j
where sj represents the surface area of block j, square meters; αj, βj, and φj represent the angle between the normal vector outside block j and the x, y, and z axes, respectively; rcij represents the component of the distance from the surface center of block j to its center of mass along direction i, i = x, y, and z, meters; g represents the acceleration due to gravity, meters per second squared; Fi represents the external force along direction i, i = x, y, and z, newtons; and Mi represents the closing moment of the lining block around the centroid axis in direction i, i = x, y, and z, newton-meters.
The acceleration of the center of mass and the angular acceleration of rotation around the center of mass axis acted on by the train wind pressure and aerodynamic pressure on the spalling block were obtained as follows:
{ a c x = F x m = 1 m 1 n ( 1 2 ρ v v j 2 + p w j ) cos ( α j ) s j a c y = F y m = 1 n ( 1 2 ρ v v j 2 + p w j ) cos ( β j ) s j ρ g a c z = F z m = 1 n ( 1 2 ρ v v j 2 + p w j ) cos ( φ j ) s j
{ θ c x = M c x I c x = 1 I c x 1 n ( 1 2 ρ v v j 2 + p w j ) cos ( α j ) s j r c x j θ c y = M c x I c y = 1 I c y 1 n ( 1 2 ρ v v j 2 + p w j ) cos ( β j ) s j r c y j θ c z = M c x I c z = 1 I c z 1 n ( 1 2 ρ v v j 2 + p w j ) cos ( φ j ) s j r c z j
where m is the mass of the lining block, kilograms; aci is the translational acceleration of the lining block’s center of mass, meters per second squared; Ici is the moment of inertia of the lining block around the centroid axis, kilogram-square meters; and θci is the angular acceleration of the lining block around the centroid axis, inverse seconds.

2.3. Gas–Solid-Coupling Calculation Model

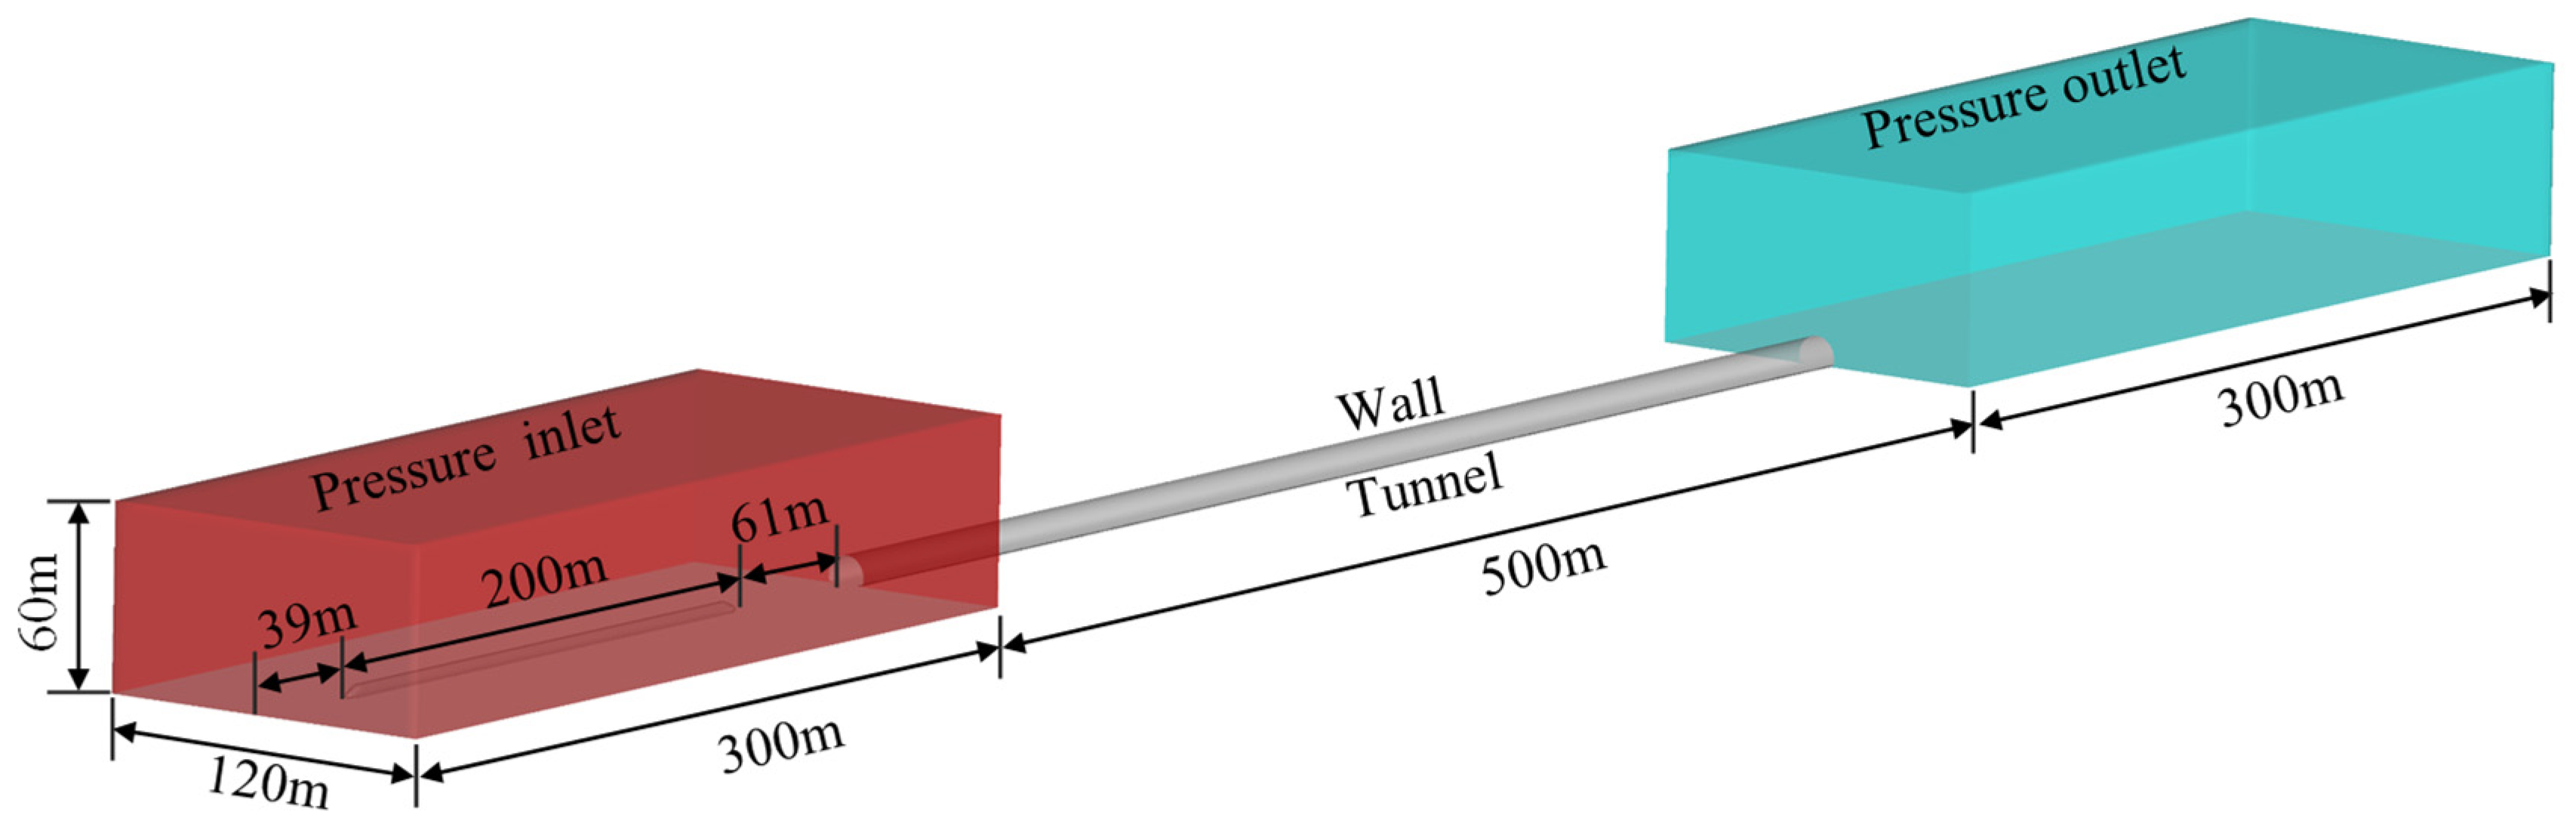
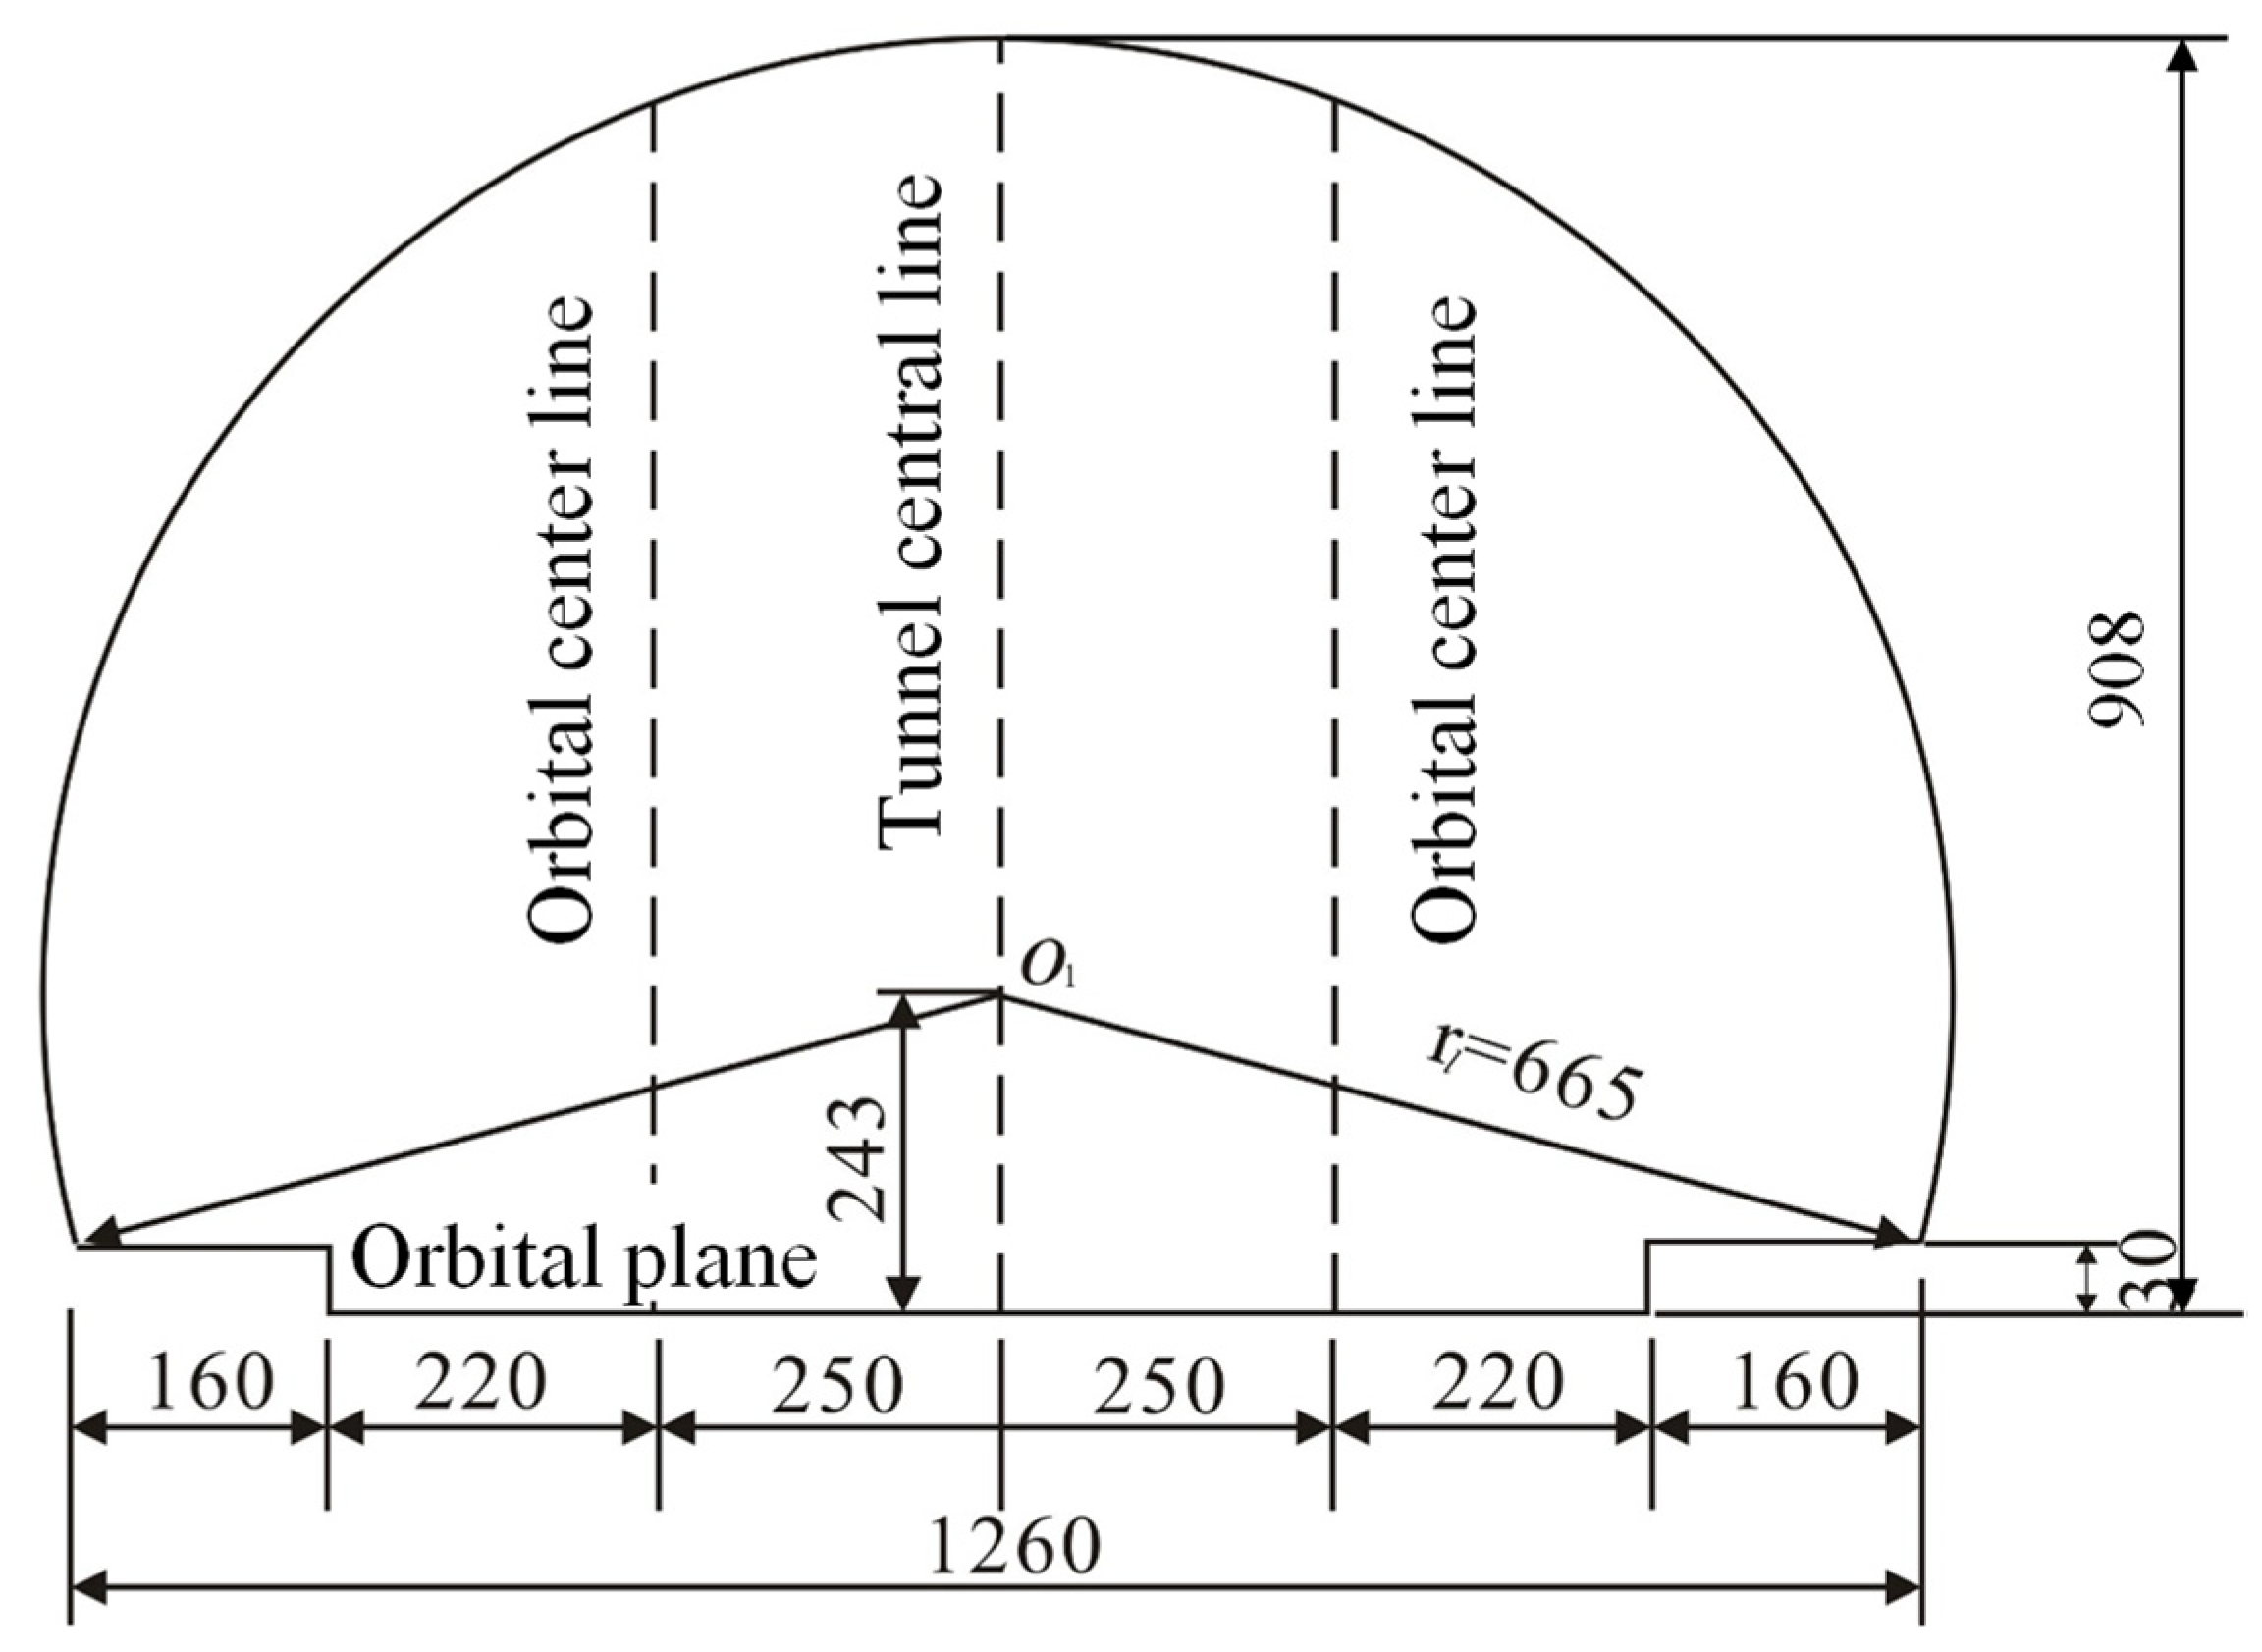
2.3.1. Geometric Model

Figure 3 shows the overall geometric model of our numerical simulation calculation. The scale ratio of the model was 1:1. CRH3 was selected as the high-speed train and eight train marshalling units were grouped (lead train with six middle trains and a tail train); the total length was approximately 200 m. Components such as windows, pantographs, and bogies were ignored, as shown in Figure 4. The 100 m2 high-speed-railway single-hole and double-track standard tunnel was adopted for our tunnel model (see Figure 5). In addition, the tunnel length was 500 m. The open areas at both ends of the tunnel were cuboids, each with a length, width, and height of 300, 120, and 60 m, respectively, as shown in Figure 3. According to findings from both literature and field investigations [1,2,3,4,5], the spalling block of a tunnel lining is mainly a sheet cement mortar structure, and the geometric shape is mostly irregular. To facilitate the establishment of the model and the subsequent meshing, the spalling blocks were assumed to be regular and homogeneous geometric rigid bodies. We selected a cuboid (length: 20 cm, width: 20 cm, thickness: 0.5 cm, and density: approximately 2000 kg/m3 (based on cement mortar)) as the research object.

2.3.2. Grid Model

In this work, the method of combining a structured, hexahedral static grid and an unstructured, tetrahedral dynamic grid was adopted. This combination allowed the active train movement and the passive motion of falling blocks to be (relatively) synchronically realized. In addition, it reduced the number of grids and improved computational efficiency.
The mesh sizes of the head and tail surfaces of the high-speed train were each approximately 0.1 m. The mesh size of the body area surface was approximately 0.2 m, and the mesh size of a spalling block was 0.005 m. Moreover, the maximum size of the tunnel wall was approximately 1.0 m. In addition, a corresponding dense boundary layer was set on the surfaces of the high-speed train and the spalling block. The initial thickness of the grid was h0 = 1 mm, and the corresponding y+ value was approximately 30 [34]. The outward expansion ratio was 1.2, and the number of layers was six. The overall grid quantity of the model was approximately 20 million, and the minimum mass of the grid was approximately 0.2, which met the requirement of calculation accuracy. A model grid is shown in Figure 6.

2.3.3. Boundary Conditions and Solution Settings

The numerical calculation model in this work employed four types of boundary conditions, namely, wall, interface, pressure inlet, and pressure outlet, as shown in Figure 3. The surfaces of the high-speed train and the spalling block, the tunnel wall, and the ground were all set as the wall boundary without slip. The roughness thickness of the spalling block was Ks = 0.005 m and the roughness length was Cs = 0.8. The interface of the dynamic and static meshes was set as the interface boundary condition. Furthermore, the open area at the tunnel entrance where the initial high-speed train was located was set as the pressure inlet, and the open area at the tunnel exit was set as the pressure outlet. The operating pressure was standard atmospheric pressure.
The discrete mode of the governing equation was the Finite Volume Method (FVM). Moreover, a pressure-based, unsteady, and incompressible solver was used, and the coupled equation of pressure and velocity was solved on the basis of the SIMPLE algorithm. An implicit equation with second-order accuracy was used for time, and the physical time step was set at 0.001 s [35]. Each time step was iterated 30 times, and the minimum convergence value was 10−3 [36].

2.3.4. Calculation Conditions

The cross section of the tunnel was set as seven spalling blocks at different spalling positions. The length, width, and height of the slicing blocks were 20, 20, and 0.5 cm, respectively, and the density was 2000 kg/m3. Spalling block 1 and block 3 were located directly above both sides of the train, and block 2 was located on the middle line of the line (directly above the center of the train). In addition, blocks 4, 5, 6, and 7 were located on the tunnel wall on the upper right, and the vertical distance between adjacent blocks was 1 m. The number and position of the spalling blocks are shown in Figure 7.
Wang [37] studied the distribution characteristics and laws of wind pressure in the different parts of a high-speed train (lead, middle, and rear carriage) when passing through a tunnel. The results showed that when the head of the train passes, the pressure mutation rate is the largest, which is the situation that is most likely to cause a block to fall. Thus, considering the most dangerous situation, all the working conditions in this study were based on the assumption that when the head of the train passed just above the spalling block, the block began to fall off the lining.

2.4. Model Reliability Verification

2.4.1. Checking of Grid Independence

To verify the independence of model meshes, models with different grid sizes were established. The total number of grids was 10 million (coarse), 20 million (medium), and 40 million (fine). The final lateral z-displacement of the falling block, which was directly above the train, was taken as the final evaluating index. The final z-direction displacement values corresponding to the coarse, medium, and fine meshes were −0.16, −0.21, and −0.22 m, respectively. The results indicated that the final z-displacement was completely convergent when the total number of mesh elements was 20–40 million. Thus, 20 million grids were selected in this study for more-efficient computation.

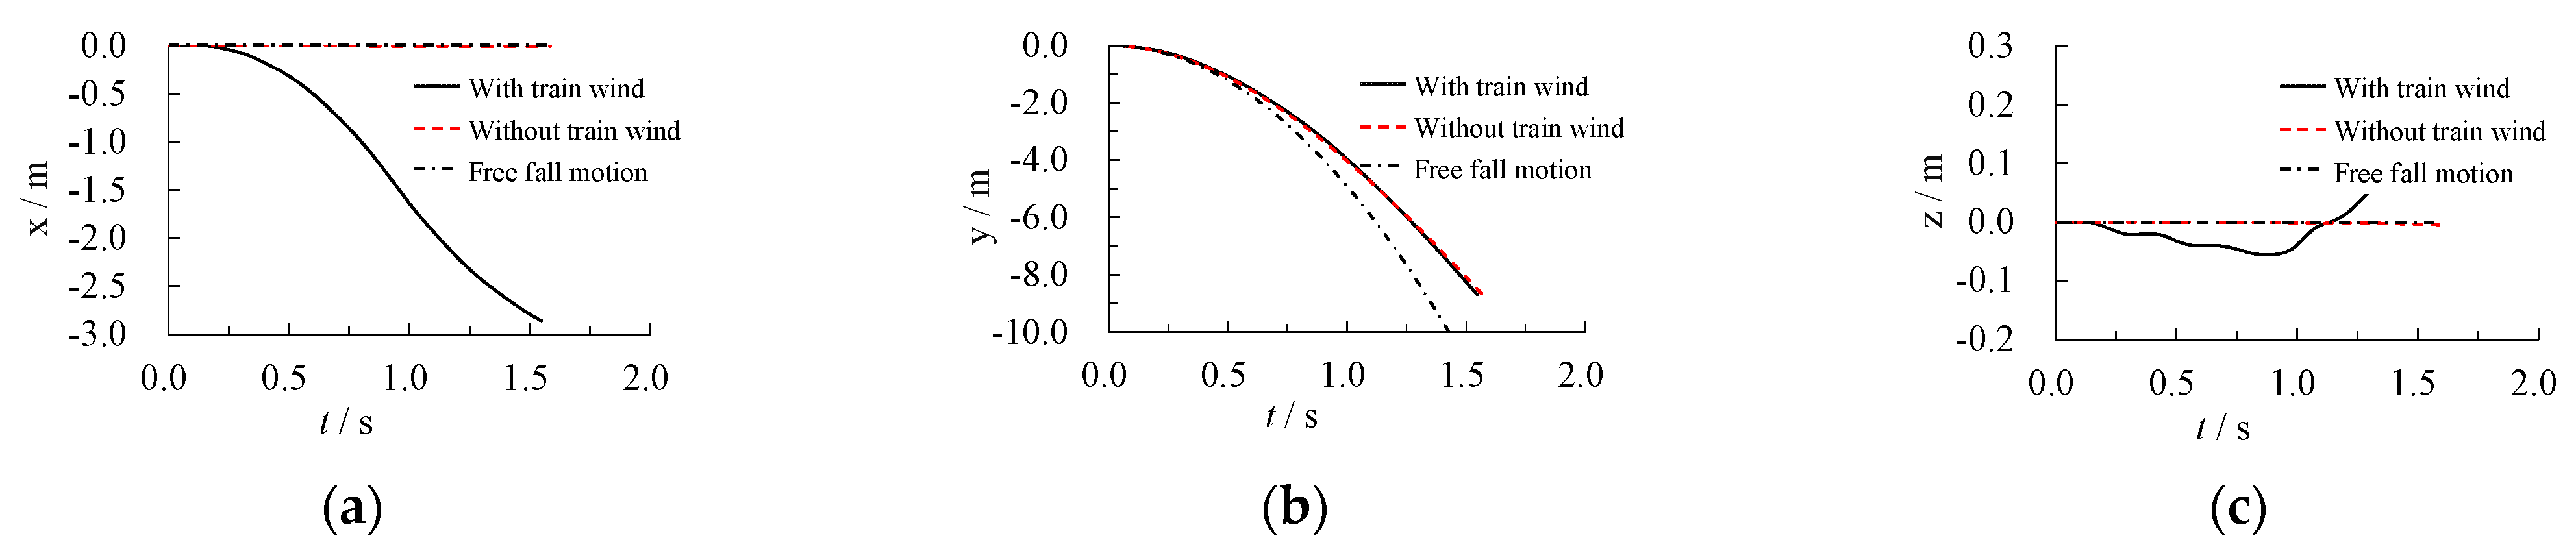
2.4.2. Verification of the Free-Fall Model

The accuracy of the passive falling motion of the falling block was verified using a 0.05 m cube spalling block. The tracked time history curve of the falling block is shown in Figure 8. As shown in the figure, the actual vertical displacement of the block was almost identical to the theoretical value. Furthermore, the relative error of displacement and velocity was <5%, indicating that our numerical calculation model accurately realized the free-falling movement of the spalling block.

2.4.3. Turbulence Model Verification

To verify the rationality and accuracy of the turbulence model and the parameter settings of the model, our numerical calculation results were compared with the dynamic model test results reported by Zhang [17]. On the basis of the dynamic model test, the numerical model was established at 1:1 to ensure that the model conditions were exactly the same. The overall scale ratio of the model was 1:20. The high-speed train, CRH3 (length: 2.59 m, height: 0.19 m, and width: 0.16 m), which has two marshalling units, was adopted. The tunnel model was 50 m long and the section area was 0.25 m2. The blocking ratio was 0.116, and the line spacing was 0.25 m. Wall pressure monitoring points 1 and 2 were arranged at cross-sectional positions of 3.25 and 25 m away from the tunnel entrance, respectively. Each point was located 0.095 m above the track. The numerical simulation calculation results and the model test results are compared in Figure 9 and Table 1.
As shown in Figure 9 and Table 1, the pressure time history curve obtained from our numerical simulation of monitoring points 1 and 2 concurred with the dynamic model test results. In addition, the waveform trend and peak were basically the same. The maximum relative error of the pressure at the monitoring point on the tunnel wall was 7.4%, and the minimum relative error was 4.9%. The reliability of the simulation was high, and the selection of the turbulence model and the setting of related parameters of the model were reasonable.

3. Aerodynamic Evolution Mechanism of a Spalling Block under Train Wind Environment

3.1. Aerodynamic Behavior

To visually observe the movement of falling blocks under the influence of a train’s motion, the trajectory of a falling block is shown in Figure 10 using a time interval of 0.25 s. The spalling block exhibited a typical three-dimensional rigid body motion, including translation and rotation.
To further quantify the three-dimensional motion of the spalling block, the block’s motion data at each moment were extracted; time history curves of block translation and rotation are shown in Figure 11 and Figure 12, respectively. Translation occurred mainly along the longitudinal movement of the train, and rotation occurred mainly around the horizontal axis. In the absence of train wind, the block fell via vertical particle motion. The block underwent a displacement of 2.861 and 0.127 m in the x (longitudinal)- and z (transverse)-directions, respectively. The flaky lining block was flipped around the z-axis (horizontal axis), and the maximum flipping angle was approximately 135°. However, in the absence of wind, the maximum movement distance of the flaky spalling block along the x- and z-directions was only 0.005 m, and the falling rotation angle was ≤2°.

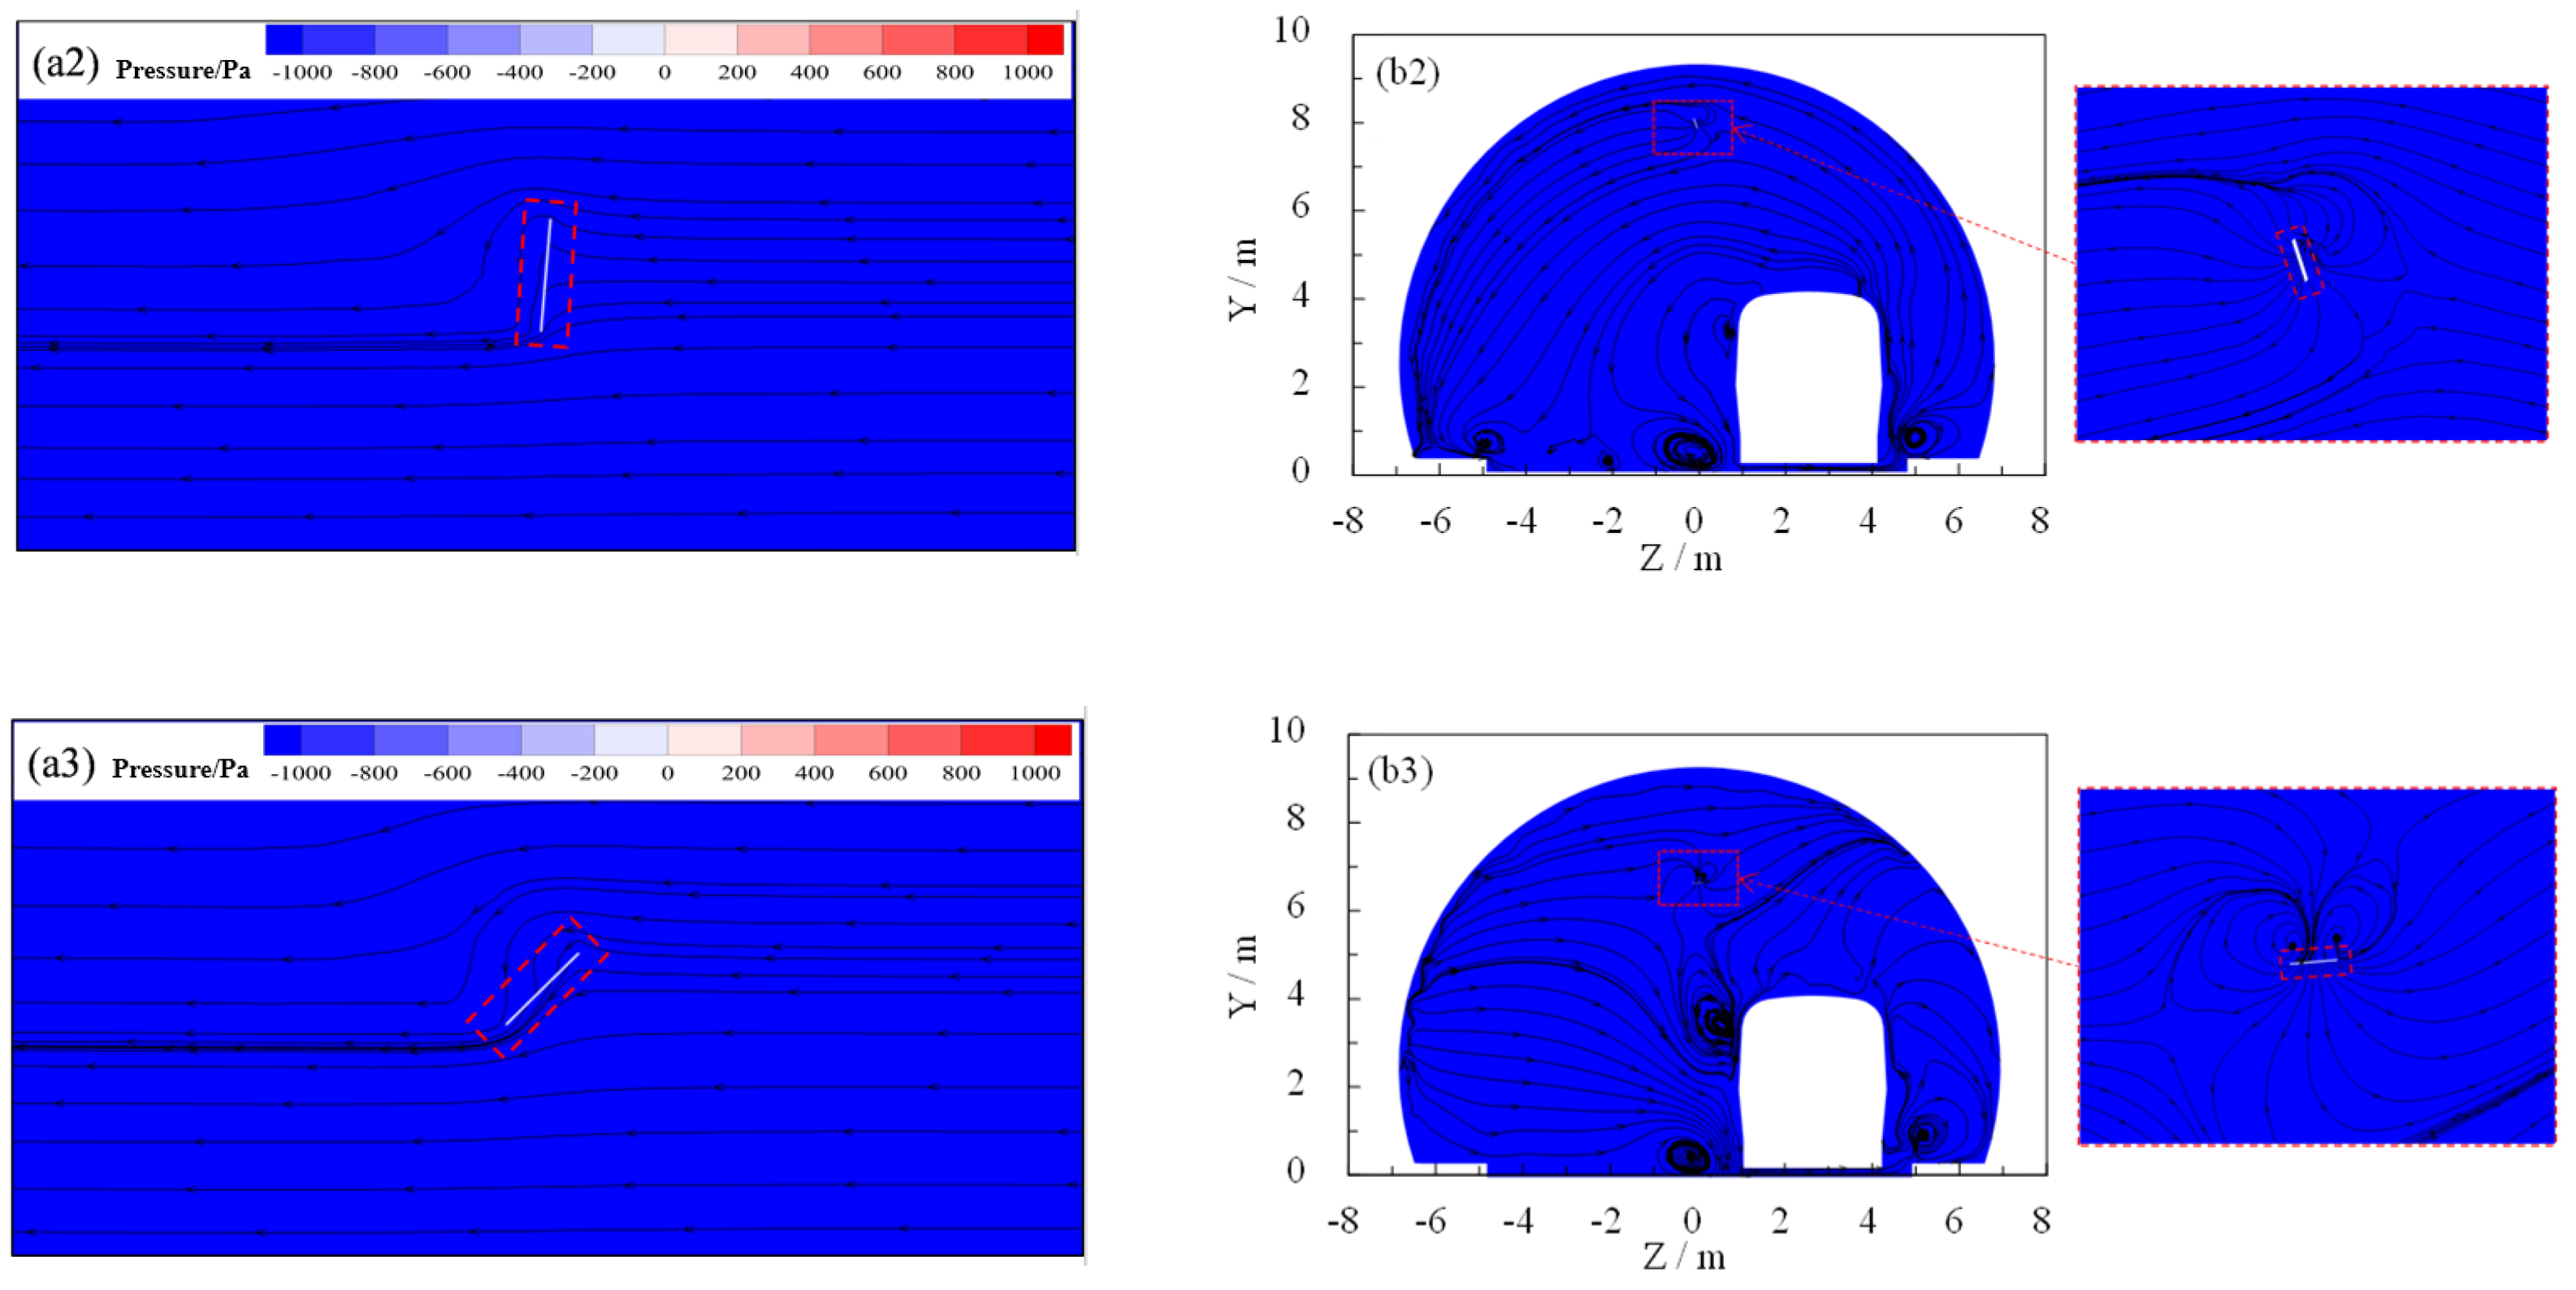
3.2. Aerodynamic Evolution Mechanism

To study the aerodynamic evolution mechanism, we analyzed the local flow field structure of the block and the flow field structure inside the tunnel. Therefore, the local and overall flow field structures at 0.25, 0.5, and 0.75 s during the falling of a lining block were extracted, as shown in Figure 13 and Figure 14.
According to Figure 13 and Figure 14, we concluded the following:
(1)
In the falling process of the flaky spalling block, the train wind pressure played a considerably greater role than the aerodynamic static pressure in the tunnel. The uneven train wind pressure on the relative surface of the spalling block promoted the translation and rotation of the lining block.
(2)
The falling process of the flaky spalling block was affected by the coupling effect of the block (geometric size and heavy weight) and transient train wind. The train wind acted directly on the block and gradually pushed the movement of the block, resulting in circumfluence, vortex, and other phenomena that further changed its motion state. The changed motion state of the spalling block affected the driving effect of the train wind on the lining block, surrounding flow, and vortex structure.
(3)
The main movement direction of the spalling block was opposite the direction of train movement due to the influence of the wind field structure associated with the train. For the body surrounding the flow field structure from the front to the rear, the longitudinal flow velocity (the direction of train movement) was larger than the other velocity. The flow field directly drove the falling-backward movement of the spalling block along the flow field structure. In addition, the block and streamline were characterized by different time-dependent angles and intensities of flow; hence, an uneven force was exerted on the spalling block’s surface. Therefore, a moment that induced rotation around the horizontal axis (z-axis, perpendicular to the train) was generated, and the block rotated around this axis. The lateral flow velocity was relatively small and had a weak promoting effect on the lateral horizontal movement of the block. The significant vortex phenomenon around the block reduced the unevenness of the force associated with the block, and the rotation around the longitudinal axis was negligible. The vertical velocity was smaller than the lateral flow velocity and had no significant effect on the falling motion of the falling lining block; the spalling block was affected more by air resistance.

4. Traffic Safety Partition for Spalling Block

To obtain the safety partitions of the tunnel, we investigated the movement trajectories of dropped blocks at different positions. Therefore, we qualitatively analyzed the trajectories of dropping lining blocks at different positions and their impact on driving safety. Then, we used the modelling method in this paper to calculate the quantitative safety partitions of flaky and blocky blocks. Finally, we analyzed the influence of different shapes of blocks on driving safety.

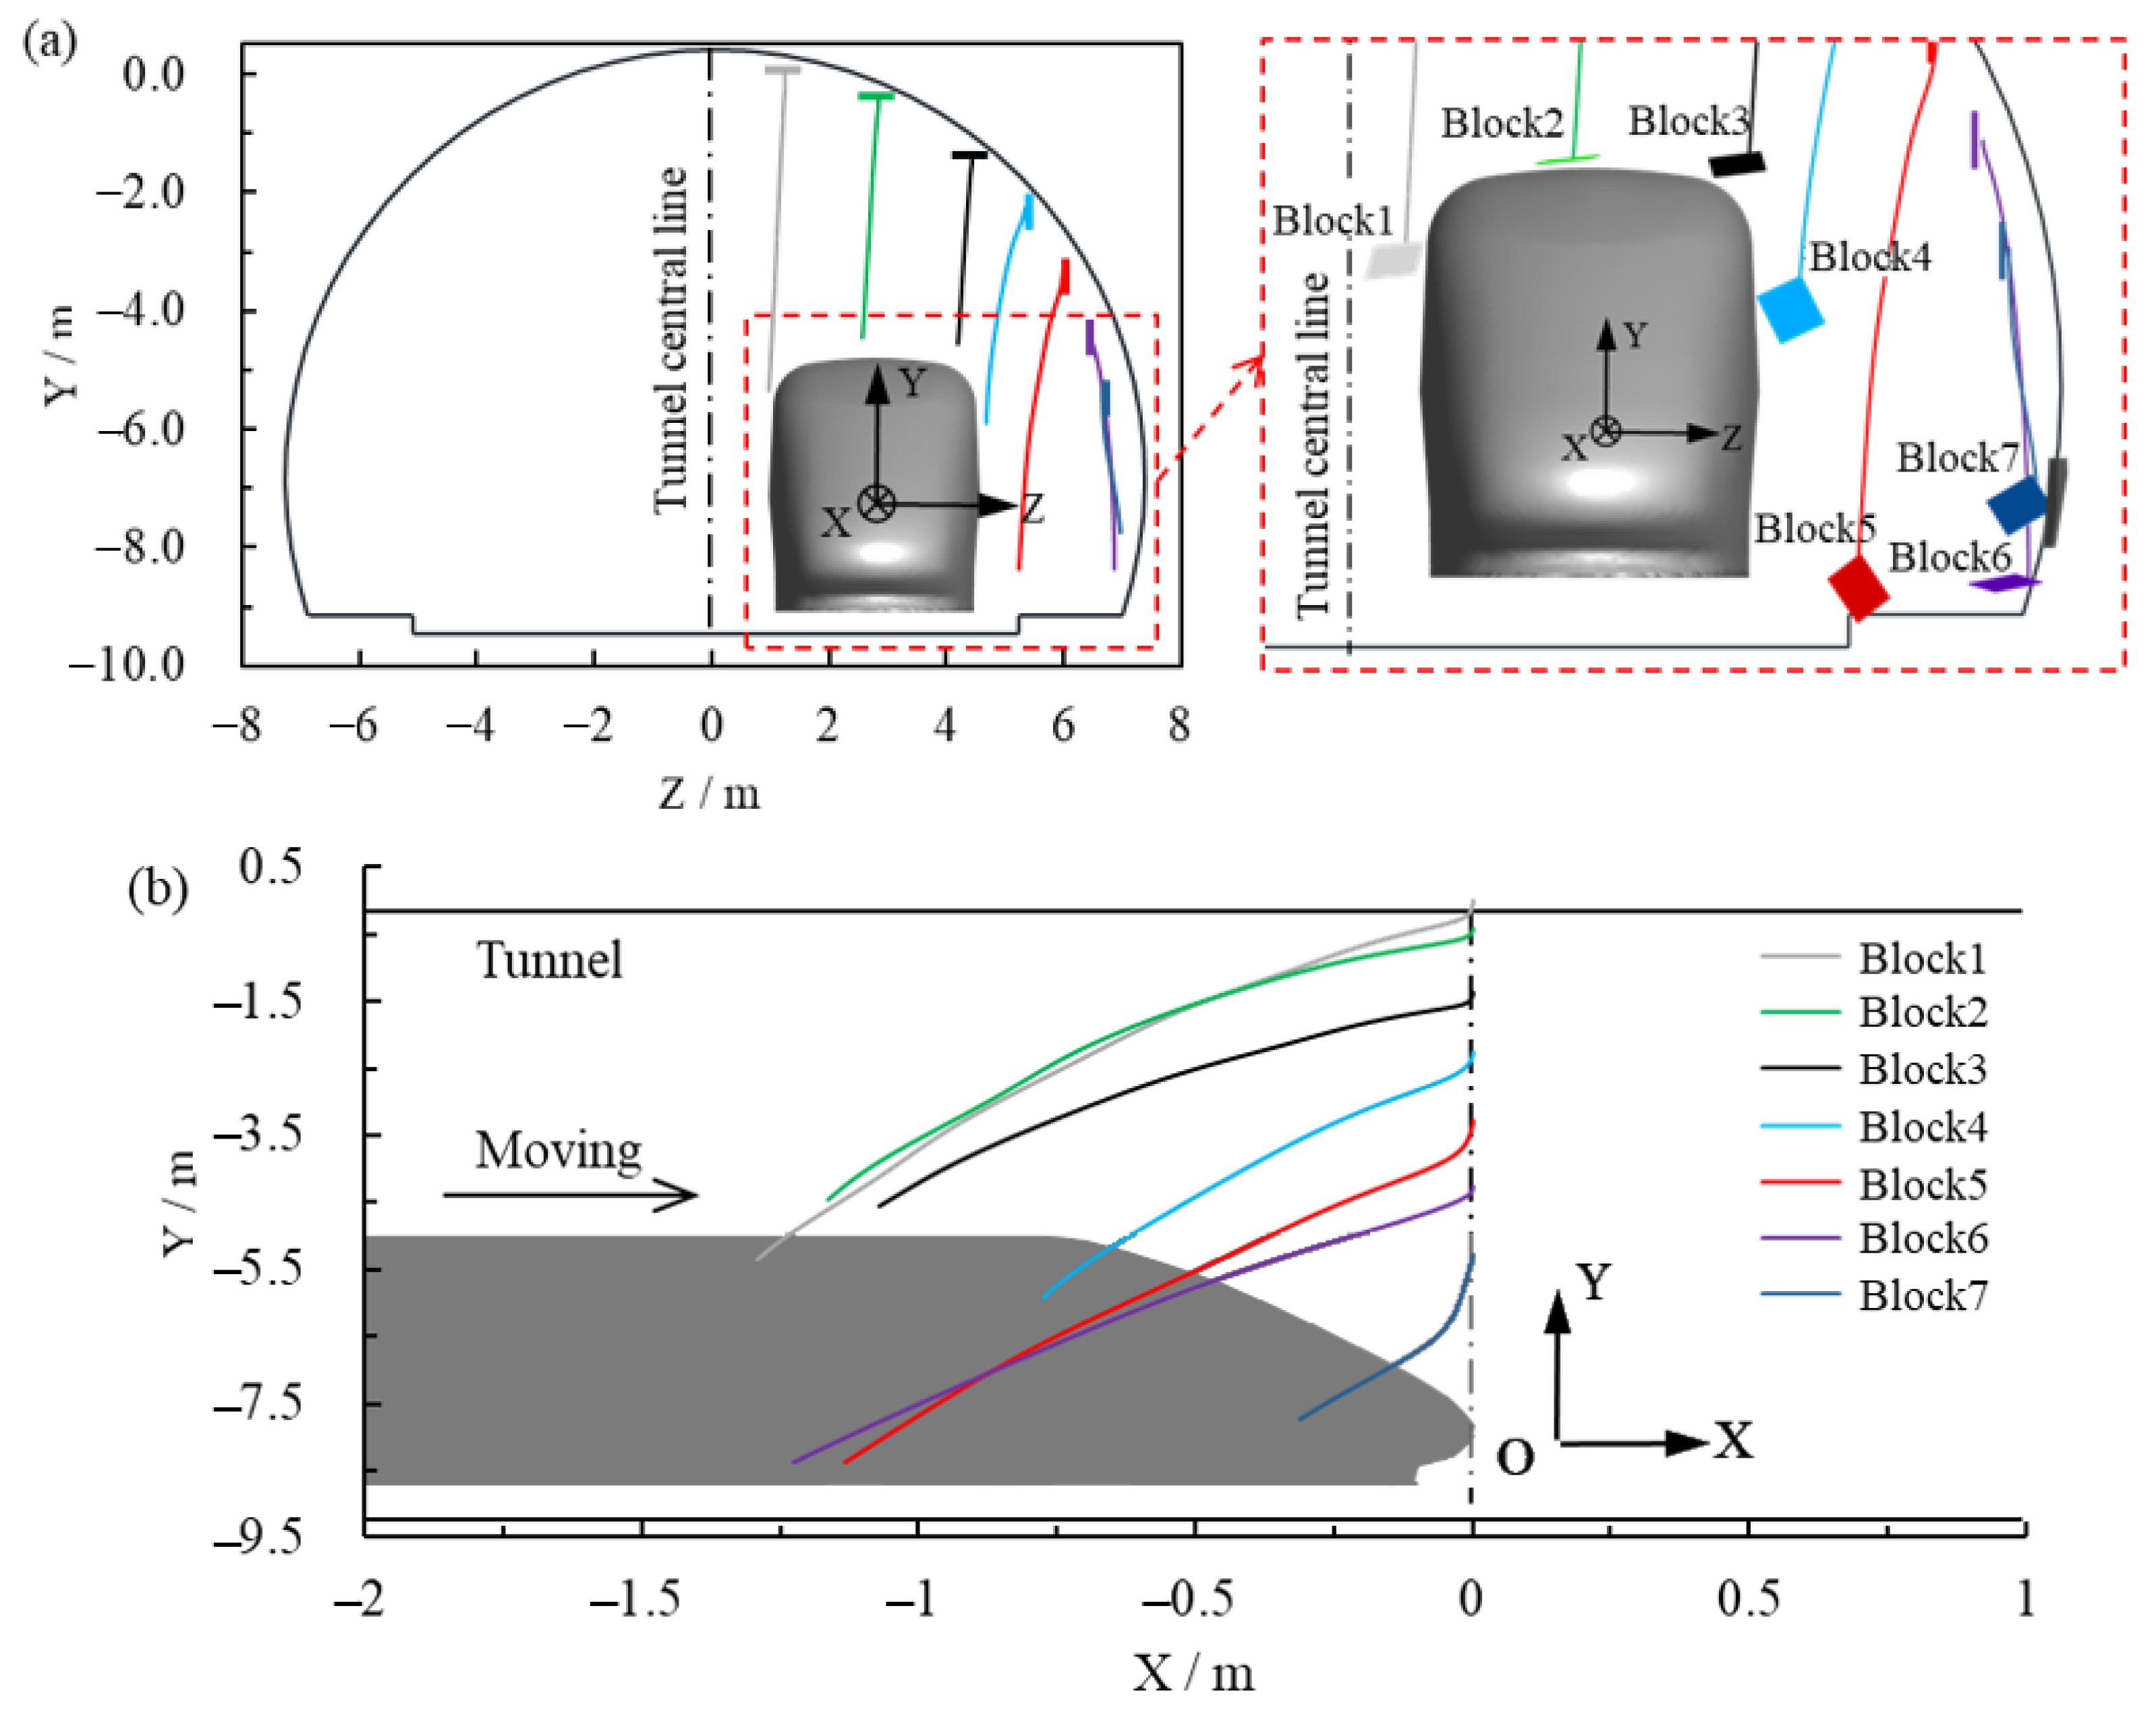
4.1. Trajectories of Spalling Blocks at Different Positions

To consider the motion trajectories of blocks at different positions, all of the working conditions in Figure 7 were calculated, and the motion trajectories in Figure 15 and Table 2 were obtained. Figure 15 shows the falling displacement trajectory of a spalling block at different spalling positions. Table 2 shows the displacement statistics obtained for blocks along the x- and z-directions when each block fell to a height of 3 m.
According to Figure 15 and Table 2, the transverse movement of a spalling block was controlled by the flow field structure of the cross section. The spalling blocks of the vaulted and arching waist moved toward the center direction of the tunnel (close to the train). In addition, the spalling blocks of the side wall moved toward the arched foot of the tunnel (away from the train), as shown in Figure 16. The train wind had a significant attraction effect on the spalling blocks (blocks 4 and 5) of the tunnel’s arched waist. The transverse movement (0.6 m toward the train direction) was 2–3 times the transverse movement displacement of the spalling blocks (blocks 1, 2, and 3) of the arched roof.
Spalling block 1 of the tunnel vault passed around the vehicle body without collision with the train; spalling blocks 2 and 3 peeled off from the tunnel vault and collided directly with the top of the carriage, thereby endangering driving safety. In addition, spalling block 4 peeled off from the arched waist of the tunnel and collided with the side of the carriage due to the attraction of the train wind; spalling block 5 moved toward the vehicle body under the attraction of the wind and fell to the edge of the maintenance track. Moreover, blocks 6 and 7, which peeled off the side wall of the tunnel, moved away from the vehicle body and fell to the arched foot of the tunnel, thereby having no impact on driving safety. Spalling blocks that peel off at the circumferential position of the tunnel between blocks 4 and 5 may be drawn into the vehicle rail, thereby posing a threat to driving safety.

4.2. Driving Safety Partitions of Flaky Block

Different spalling positions have different effects on driving safety; therefore, the falling blocks of the tunnel lining were divided into three categories, namely, dangerous blocks, risk blocks, and safety blocks. The spalling blocks that spalled off from the danger zone collided directly with the train body and had a significant effect on driving safety. The spalling blocks that spalled off from the risk zone fell in the area between the train body and the outer edge of the overhaul road and were potentially caught in the wheel and rail, thereby posing a risk to driving safety. However, the blocks that spalled off from the safety zone underwent no train collisions and had no effect on driving safety.
According to the aforementioned risk classification principles, by setting up a variety of different position working conditions, the risk of different blocks was calculated to obtain the driving safety zone. The safety zone of the flaky block (0.2 × 0.2 × 0.05 m) is shown in Figure 17, where AB is the danger zone, BC is the risk zone, and CD is the safety zone. Taking the tunnel ground center as the origin of the coordinates, the coordinates of points A, B, C, and D were (0.90 m, 9.02 m), (5.45 m, 6.24 m), (5.90 m, 5.50 m), and (6.30 m, 0.30 m), respectively.

4.3. Driving Safety Partitions of Blocky Block

The blocky spalling block was weakly affected by the train wind during the falling process. The vertical movement was the main movement, and almost no movement occurred in the vertical and horizontal directions. For example, the length, width, and height of the spalling block were 0.2 m, 0.2 m, and 2 cm, respectively, and the density was 2000 kg/m3. In addition, the final longitudinal and transverse movement displacement levels of the lining block were −0.19 and −0.01 m.
The impact partitions of the blocky spalling block on driving safety are shown in Figure 18. The partitions consisted of two areas, namely, the danger zone (section AB) and the safety zone (section BC). The influence of train wind on the block was weak, and without dangerous behavior involving the lining block falling into the wheel and rail, no risk zone was observed. Taking the ground center of the tunnel as the origin of the coordinates, the coordinates of points A, B, and C were (0.70 m, 9.04 m), (4.30 m, 7.50 m), and (6.30 m, 0.30 m), respectively.

4.4. Differences between Flaky and Blocky Blocks on Driving Safety

The dangerous-area influence of flaky spalling blocks on driving safety was larger than that of blocky spalling blocks under the same conditions. In addition, the size of the dangerous area (including the danger zone and the risk zone) increased by approximately 60%. The danger zone of a flaky block was approximately 31.0% larger than that of a blocky block. Furthermore, the risk zone (approximately 0.87 m) increased the impact on driving safety.
The larger risk zone of a flaky spalling block compared with that of a blocky spalling block resulted from the fact that the falling flaky lining blocks of the tunnel’s arched waist were attracted to the lateral train wind and moved to the vehicle body and collided with the side of the body, thereby affecting driver safety. Therefore, the lower critical point (point B) of the danger zone associated with this block moved down by approximately 1.26 m along the tunnel ring. The upper critical point (point A) of the danger zone occurring for a falling flaky lining block was similar to that of a falling blocky block. Moreover, the upper critical point of the falling flaky and blocky lining blocks moved down by approximately 0.2 m along the tunnel ring under the influence of train wind.

5. Conclusions and Outlook

(1)
A three-dimensional gas–solid-coupling calculation model of spalling blocks, a train, a tunnel, and air was established on the basis of the basic theory of gas–solid interaction and the numerical simulation software, FLUENT. The transient coupling between a spalling block of a tunnel lining and turbulent train wind, as well as the numerical simulation of the entire falling process, were realized. The simulation results were consistent with the test results.
(2)
The aerodynamic evolution mechanism governing the falling motion of a flaky spalling block associated with a high-speed-railway tunnel lining operated as follows: The falling process of the block was affected by the transient coupling of its characteristics and the transient train wind. The train wind acted directly on the block, leading to horizontal movement of the block and consequent phenomena such as circumfluence and vortex that further changed the motion state of the block. Due to its changed motion state, the spalling block affected the flow field structure.
(3)
The impact of train wind was more significant for a flaky spalling block than for a blocky spalling block. The spalling blocks that peeled off the tunnel vault risked colliding directly with the train and had a considerable effect on driving safety. The falling lining blocks that peeled off the tunnel’s arched waist were attracted to the train wind and risked colliding with the side of the vehicle body or becoming involved with the wheel and rail, thereby affecting driving safety. The falling lining blocks that peeled off the tunnel side wall were repelled by the wind of the train and moved away from the vehicle body; hence, they had no effect on driving safety.
(4)
The impact partitions of the flaky blocks on driving safety were divided into three areas along the circular direction of the tunnel lining: dangerous zone, risk zone, and safety zone. The dangerous areas of flaky and blocky blocks were 5.5 and 7.5 m above the ground in the vault area, respectively, indicating that flaky blocks are more dangerous. Thus, during the operation of a tunnel, attention should be paid to the maintenance of the weak area above 5.5 m above the ground to ensure driving safety.
Although conclusions about safety zone were drawn based on a specific case, the research method adopted in this study may open a path for the further optimization of safety partitions in train tunnels. To obtain a comprehensive safe driving zone, we must consider the different densities, shapes, and sizes of lining blocks along with vehicle speeds and other factors. Such requirements were not part of the contents presented and should be a part of future work.

Author Contributions

Conceptualization, C.-H.S.; methodology, W.-C.Y.; software, A.W.; validation, X.-H.S. and A.W.; formal analysis, A.W.; investigation, A.W.; resources, W.-C.Y.; writing—original draft preparation, A.W.; writing—review and editing, X.-H.S.; visualization, A.W.; supervision, C.-H.S.; project administration, W.-C.Y.; funding acquisition, W.-C.Y. All authors have read and agreed to the published version of the manuscript.

Funding

This research was funded by National Natural Science Foundation of China, grant number: 51978670.

Institutional Review Board Statement

Not applicable.

Informed Consent Statement

Not applicable.

Data Availability Statement

Some or all data, models, or codes that support the findings of this study are available from the corresponding author upon reasonable request.

Conflicts of Interest

The authors declare no conflict of interest.

References

  1. China Railway Corporation. Bulletin of China Railway Corporation on Handling Quality Problems of Guizhou Section of Shanghai-Kunming High-Speed Railway (Railway Construction Letter [2017] No. 839). 21 July 2017. Available online: https://wenku.baidu.com/view/3ac95bc703d276a20029bd64783e0912a3167c11.html (accessed on 11 February 2022). (In Chinese).
  2. Dong, S.; Li, Y.Z. Treatment of post-construction settlement of open tunnel of high-speed railway tunnel. Archit. Eng. Technol. Des. 2016, 18, 1227. [Google Scholar]
  3. Wang, L.C.; Xiao, X.W.; Lin, H. Analysis on causes for and renovation of floor structure of a high-speed railway tunnel located in slightly-dipping interbedded rock mass. Tunn. Constr. 2014, 34, 823–836. [Google Scholar]
  4. Ministry of Land, Infrastructure and Transport. On the Railway Construction Maintenance Management Standard Verification Results. 25 November 2014. Available online: https://www.mlit.go.jp/report/press/tetsudo07_hh_000078.html (accessed on 11 February 2022). (In Japanese)
  5. The In-Depth Analysis Report of High Speed Railway Tunnel Construction Joint Block Falling Accident. 12 January 2012. Available online: https://www.docin.com/p-2038643566.html (accessed on 11 February 2022). (In Chinese).
  6. Simanjuntak, T.; Marence, M.; Mynett, A.E.; Schleiss, A.J. Mechanical–hydraulic interaction in the cracking process of pressure tunnel linings. Int. J. Hydropower Dams 2013, 20, 112–119. [Google Scholar]
  7. Amorim, D.; Proenca, S.; Flrez, L.J. Simplified modeling of cracking in concrete: Application in tunnel linings. Eng. Struct. 2014, 70, 23–35. [Google Scholar] [CrossRef]
  8. Fernandez, G. Behavior of pressure tunnels and guidelines for liner design. J. Geotech. Eng. 1994, 120, 1768–1791. [Google Scholar] [CrossRef] [Green Version]
  9. Schleiss, A.J. Design of concrete linings of pressure tunnels and shafts for external water pressure. In Proceedings Tunnelling Asia; CRC Press: Boca Raton, FL, USA, 2020; pp. 147–156. [Google Scholar]
  10. Schleiss, A. Design of reinforced concrete linings of pressure tunnels and shafts. Hydropower Dams 1997, 4, 88–94. [Google Scholar]
  11. Schleiss, A. Design criteria applied for the lower pressure tunnel of the North Fork Stanislaus river hydroelectric project in California. Rock Mech. Rock Eng. 1998, 21, 161–181. [Google Scholar] [CrossRef]
  12. Asakura, T.; Kojima, Y. Tunnel maintenance in Japan. Tunn. Underg-Round Space Technol. 2003, 18, 161–169. [Google Scholar] [CrossRef]
  13. Gálvez, J.C.; Červenka, J.; Cendón, D.A.; Saouma, V. Discrete crack approach to normal/shear cracking of concrete. Cem. Concr. Res. 2002, 32, 1567–1585. [Google Scholar] [CrossRef]
  14. Standing, J.R.; Lau, C. Small-scale model for investigating tunnel lining deform-ations. Tunn. Undergr. Space Technol. 2017, 68, 130–141. [Google Scholar] [CrossRef]
  15. Suzuki, M.; Fujimoto, H.; Sakuma, Y. Measures to reduce aerodynamic force acting on high-speed train in tunnel. Proc. Transp. Logist. Conf. 2002, 11, 277–278. [Google Scholar] [CrossRef]
  16. Liu, T.H.; Tian, H.Q.; Jin, X.S. Experimental study of full scale train on aerodynamics in tunnel. Acta Aerodyn. Sin. 2008, 26, 42–46. (In Chinese) [Google Scholar]
  17. Zhang, L.; Yang, M.Z.; Zhang, H.; Jin, Q. Influence of Tunnel Portals on Tunnel Aerodynamic Effects in Operation of High-speed Railways. J. China Railw. Soc. 2013, 35, 92–97. (In Chinese) [Google Scholar]
  18. Wang, R.L. Numerical Study on Aerodynamic Effect of High Speed Train Entering Tunnel. Master’s Thesis, Lanzhou Jiaotong University, Lanzhou, China, 2015. (In Chinese). [Google Scholar]
  19. Deng, E.; Yang, W.C.; Lei, M.F.; Zhu, Z.; Zhang, P. Aerodynamic loads and traffic safety of high-speed trains when passing through two windproof facilities under crosswind: A comparative study. Eng. Struct. 2019, 188, 320–339. [Google Scholar] [CrossRef]
  20. Deng, E.; Yang, W.C.; Lei, M.F.; Zhu, Z.H.; Zhang, P.P. Transient aerodynamic performance of high-speed trains when passing through two windproof facilities under crosswinds: A comparative study. Eng. Struct. 2019, 188, 729–744. [Google Scholar] [CrossRef]
  21. Yang, W.C.; Deng, E.; Lei, M.F.; Zhang, P.P.; Yin, R.S. Flow structure and aerodynamic behavior evolution during train entering tunnel with entrance in crosswind. J. Wind. Eng. Ind. Aerodyn. 2018, 175, 229–243. [Google Scholar] [CrossRef]
  22. Hsiao, L.F. An EOF analysis and modeling study of the multi-typhoons movement over the west northern Pacific and the South China Sea. In Proceedings of the 24th Conference on Hurricanes and Tropical Meteorology, Fort Lauderdale, FL, USA, 29 May–2 June 2000; pp. 466–467. [Google Scholar]
  23. Li, L.B. Analysis of Train-Track- Bridge Coupling Vibration of Cable-Stayed Bridge. Master’s Thesis, Central South University, Changsha, China, 2015. [Google Scholar]
  24. Deng, E.; Yang, W.C.; He, X.H.; Ye, Y.C.; Wang, A. Transient aerodynamic performance of high-speed trains when passing through an infrastructure consisting of tunnel–bridge–tunnel under crosswind. Tunn. Undergr. Space Technol. 2020, 102, 103440. [Google Scholar] [CrossRef]
  25. Yang, W.C.; Deng, E.; Zhu, Z.H.; Lei, M.F.; Shi, C.H.; He, H. Sudden variation effect of aerodynamic loads and safety analysis of running trains when entering tunnel under crosswind. Appl. Sci. 2020, 10, 1445. [Google Scholar] [CrossRef] [Green Version]
  26. Shi, C.H.; Yang, W.C.; Peng, L.M.; Wang, Z.W.; Lei, M.F. Analysis of catenary’ s safety under train wind action in high-speed railway tunnel. J. Cent. South Univ. Sci. Technol. 2012, 43, 3652–3658. (In Chinese) [Google Scholar]
  27. Yang, Y.; Cui, J. Analysis into the Characteristic Damaged Marks Resulted from Aerodynamic Impact in High-speed-railway Tunnel. Forensic Sci. Technol. 2020, 45, 215–217. (In Chinese) [Google Scholar]
  28. Ansys Fluent. Fluid Simulation Software. (Version 19.0). Available online: https://www.ansys.com/products/fluids/ansys-fluent (accessed on 11 February 2022).
  29. Niu, J.Q.; Zhou, D.; Wang, Y. Numerical comparison of aerodynamic performance of stationary and moving trains with or without windbreak wall under crosswind. J. Wind. Eng. Ind. Aerodyn. 2018, 182, 1–15. [Google Scholar] [CrossRef]
  30. Zhang, J.; Li, J.J.; Tian, H.Q.; Gao, G.J.; Sheridan, J. Impact of ground and wheel boundary conditions on numerical simulation of the high-speed train aerodynamic performance. Fluid Struct. 2016, 61, 249–261. [Google Scholar] [CrossRef]
  31. Morden, J.A.; Hemida, H.; Baker, C.J. Comparison of RANS and detached eddy simulation results to wind-tunnel data for the surface pressures upon a class 43 highspeed train. Fluid Eng. 2015, 137, 041108. [Google Scholar] [CrossRef]
  32. Muld, T.W.; Efraimsson, G.; Henningson, D.S. Wake characteristics of high-speed trains with different lengths. Proc. Inst. Mech. Eng. Part F J. Rail Rapid Transit 2013, 228, 333–342. [Google Scholar] [CrossRef]
  33. Menter, F.R. Zonal two equation k-ω turbulence models for aerodynamic flow. In Proceedings of the 24th Fluid Dynamics Conference, Orlando, FL, USA, 6–9 June 1993. [Google Scholar]
  34. Paz, C.; Suarez, E.; Gil, C. Numerical methodology for evaluating the effect of sleepers in the underbody flow of a high-speed train. J. Wind. Eng. Ind. Aerodyn. 2017, 167, 140–147. [Google Scholar] [CrossRef]
  35. Muñoz-Paniagua, J.; García, J.; Crespo, A. Genetically aerodynamic optimization of the nose shape of a high-speed train entering a tunnel. J. Wind. Eng. Ind. Aerodyn. 2014, 130, 48–61. [Google Scholar] [CrossRef] [Green Version]
  36. Niu, J.Q.; Zhou, D.; Liang, X.F.; Liu, T.H.; Liu, S. Numerical study on the aerodynamic pressure of a metro train running between two adjacent platforms. Tunn. Undergr. Space Technol. 2017, 65, 187–199. [Google Scholar] [CrossRef]
  37. Wang, A. Study on Aerodynamic Behavior and Driving Safety of Lining Fall-Block in High-Speed Railway Tunnel. Master’s Thesis, Central South University, Changsha, China, 2009. (In Chinese). [Google Scholar]
Figure 1. Impact on driving safety of spalling blocks comprising a tunnel lining. (a) Flaky block; (b) blocky block; (c) The falling block collided with the train.
Applsci 12 02593 g001
Figure 2. Flow chart of gas–solid-coupling calculation simulation.
Applsci 12 02593 g002
Figure 3. Overall geometric model of numerical calculation.
Applsci 12 02593 g003
Figure 4. Geometric model of the lead car comprising the high-speed train. (a) Lead train entity; (b) lead train model; (c) lead train cross section; (d) lead train longitudinal section.
Applsci 12 02593 g004
Figure 5. Section size of 100 m2 standard double-line, single-hole tunnel (unit: centimeters).
Applsci 12 02593 g005
Figure 6. Schematic of our grid model. (a) Overall grid model. (b) Local meshing performed on the cross section of the model. (c) Local grid of the spalling block in the tunnel lining.
Applsci 12 02593 g006aApplsci 12 02593 g006b
Figure 7. Distribution of different spalling block locations in the tunnel lining of our model.
Applsci 12 02593 g007
Figure 8. Comparison of time history curves showing the speed and displacement of a free-falling body. (a) Time history curve of velocity. (b) Time history curve of displacement.
Applsci 12 02593 g008
Figure 9. Comparison of pressure time history curves obtained for monitoring points on the tunnel wall. (a) Monitoring point 1. (b) Monitoring point 2.
Applsci 12 02593 g009
Figure 10. Curve showing falling trajectory of a spalling block. (a) cross section; (b) longitudinal section.
Applsci 12 02593 g010
Figure 11. Time history curve obtained for the falling displacement of a spalling block. (a) X-direction. (b) Y-direction. (c) Z-direction.
Applsci 12 02593 g011
Figure 12. Time history curve obtained for the falling rotation angle of a flaky spalling block. (a) With train wind. (b) Without train wind.
Applsci 12 02593 g012
Figure 13. Three-dimensional flow field structure diagrams of a flaky spalling block. (a1) flow field structures at 0.25 s; (a2) flow field structures at 0.5 s; (a3) flow field structures at 0.75 s.
Applsci 12 02593 g013
Figure 14. Flow field structure associated with the longitudinal axis and cross section of a flaky spalling block. (a1) longitudinal flow field structures at 0.25 s; (a2) longitudinal flow field structures at 0.5 s; (a3) longitudinal flow field structures at 0.75 s; (b1) cross-sectional flow field structures at 0.25 s; (b2) cross-sectional flow field structures at 0.5 s; (b3) cross-sectional flow field structures at 0.75 s.
Applsci 12 02593 g014aApplsci 12 02593 g014b
Figure 15. Falling displacement trajectory of a spalling block. (a) Cross section. (b) Longitudinal section.
Applsci 12 02593 g015
Figure 16. Flow field structure of tunnel cross section under single-vehicle operation.
Applsci 12 02593 g016
Figure 17. Impact partitions of a flaky spalling block on driving safety under standard conditions (unit: meters).
Applsci 12 02593 g017
Figure 18. Impact partitions of falling blocky lining block on driving safety (unit: meters).
Applsci 12 02593 g018
Table 1. Comparison of the maximum values obtained from the numerical simulation and model test results.
Peak Pressure FluctuationMonitoring Point 1Monitoring Point 2
Model Test
/Pa
Numerical Simulation
/Pa
Relative Error
/%
Model Test
/Pa
Numerical Simulation
/Pa
Relative Error
/%
Maximum180917443.6163117537.4
Minimum−2011−19144.9−2251−22251.2
Table 2. Movement displacement statistics obtained for the x- and z-directions when a spalling block fell 3 m.
Spalling Block1234567
Displacement/mx−0.86−0.97−1.03−0.68−0.70−0.94−0.31
z−0.15−0.21−0.23−0.64−0.600.410.30
Publisher’s Note: MDPI stays neutral with regard to jurisdictional claims in published maps and institutional affiliations.

