
Autonomous Detection of Spodoptera frugiperda by Feeding Symptoms Directly from UAV RGB Imagery

 , and
, and
Abstract
:1. Introduction
2. Materials and Methods
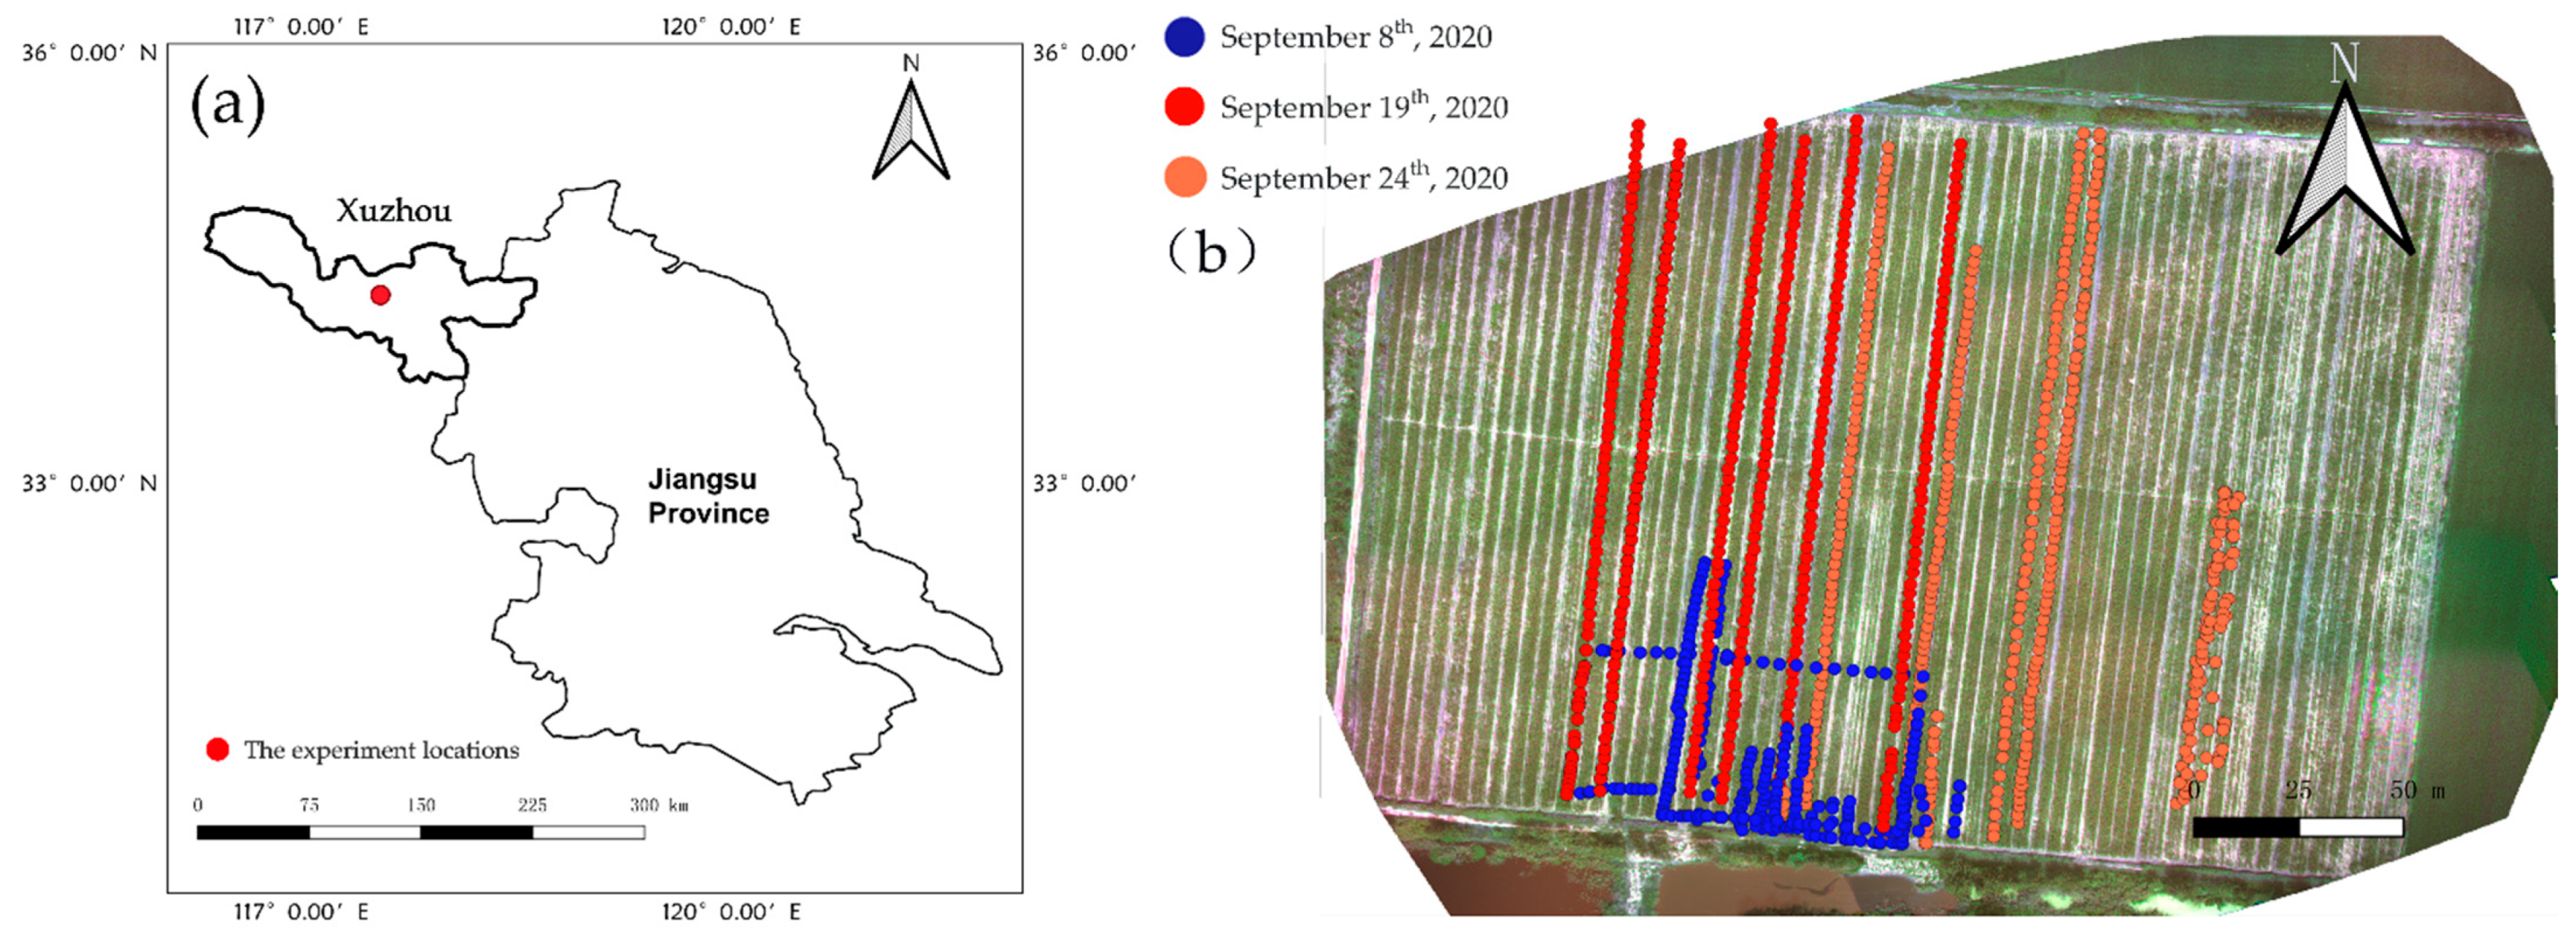
2.1. Study Area
2.2. UAV Image Collection
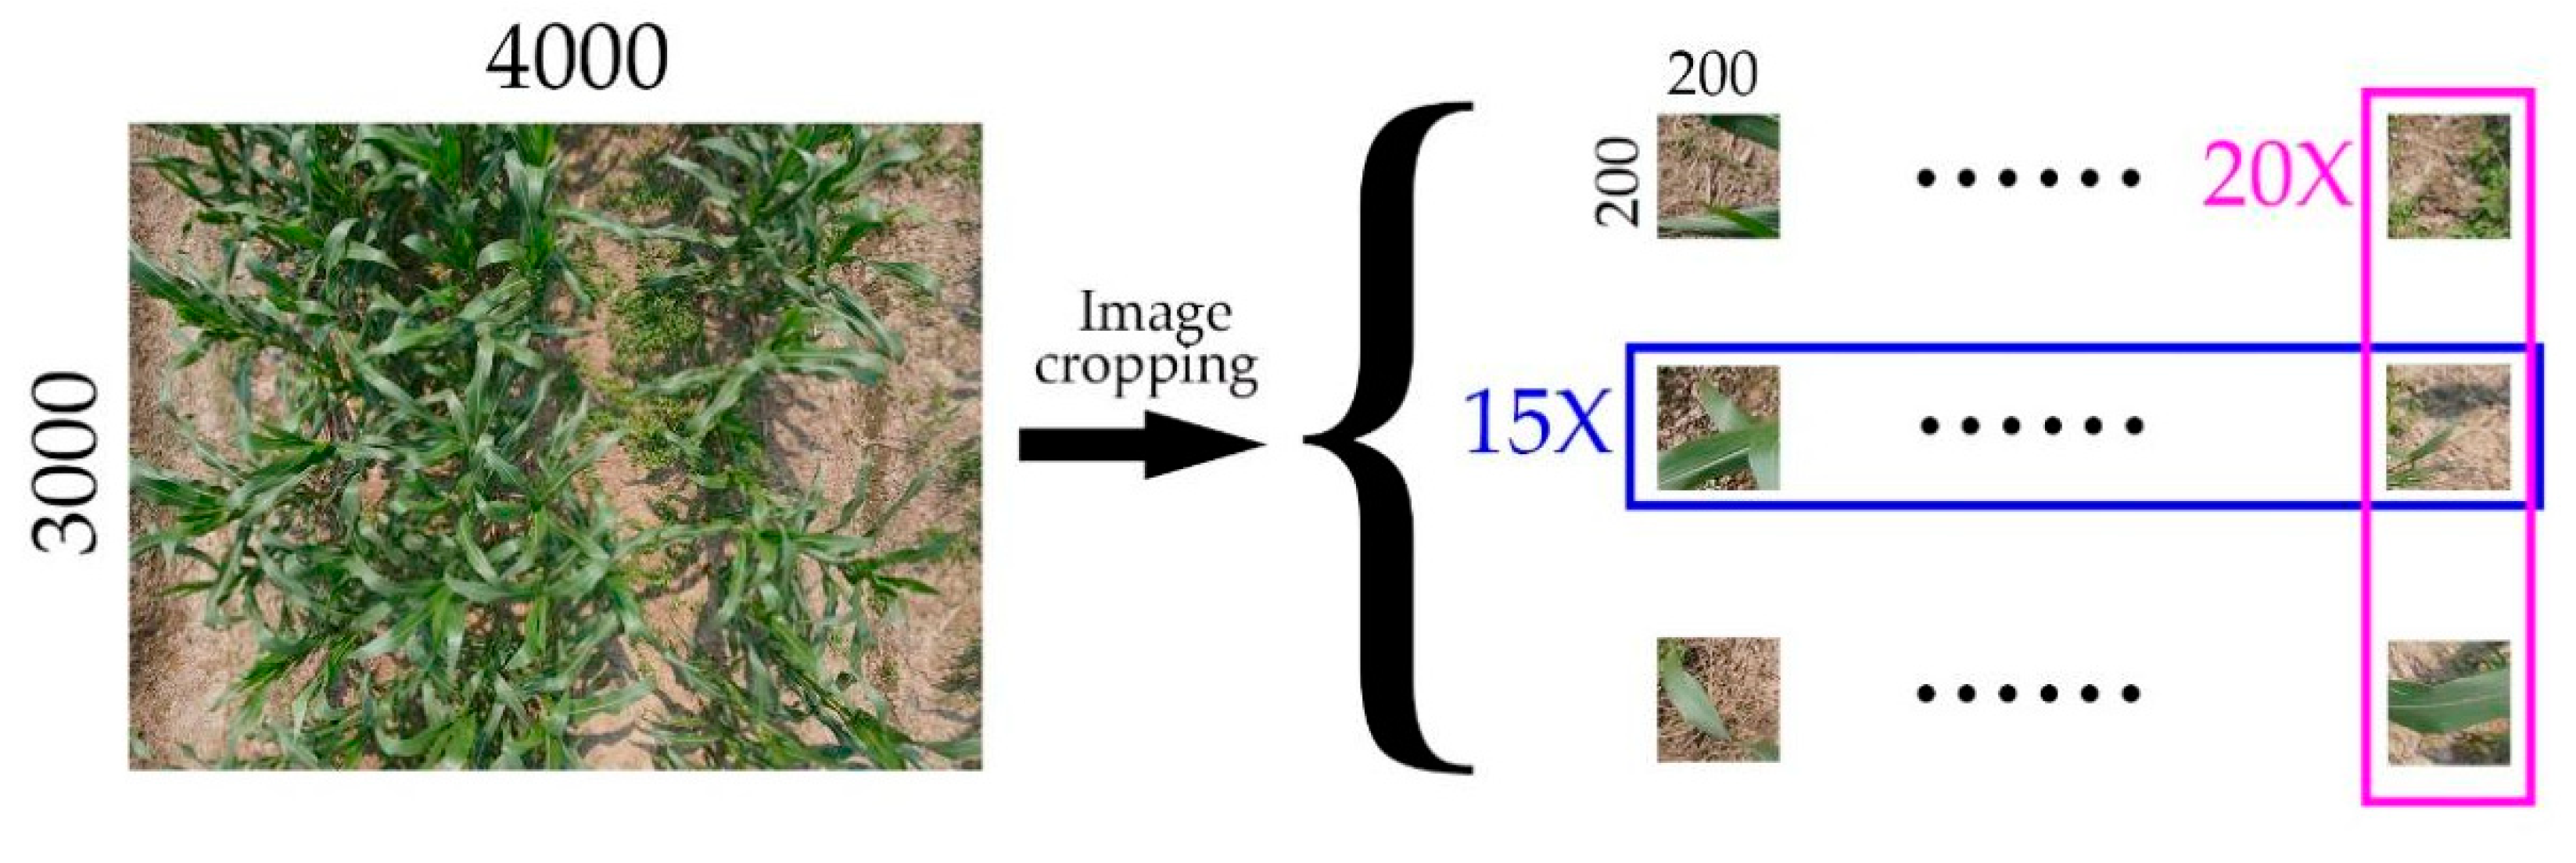
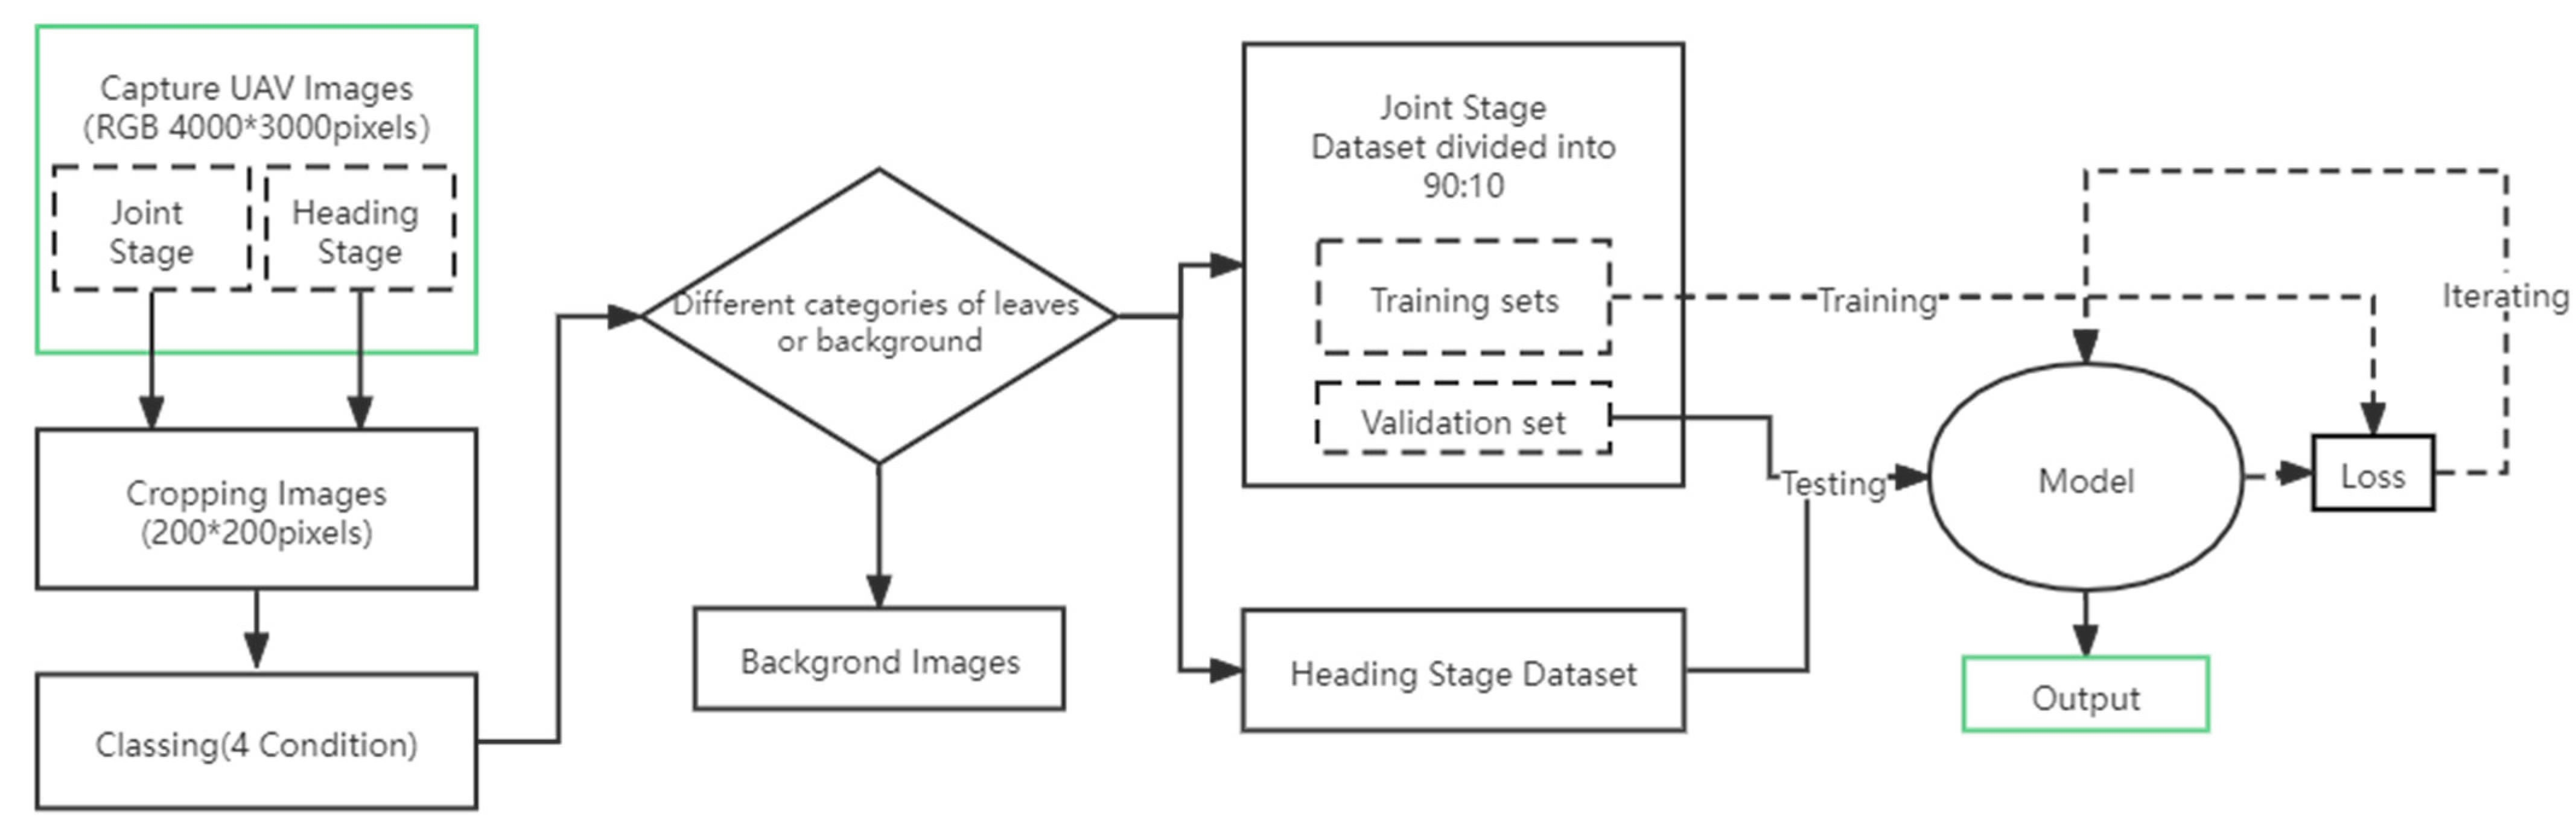
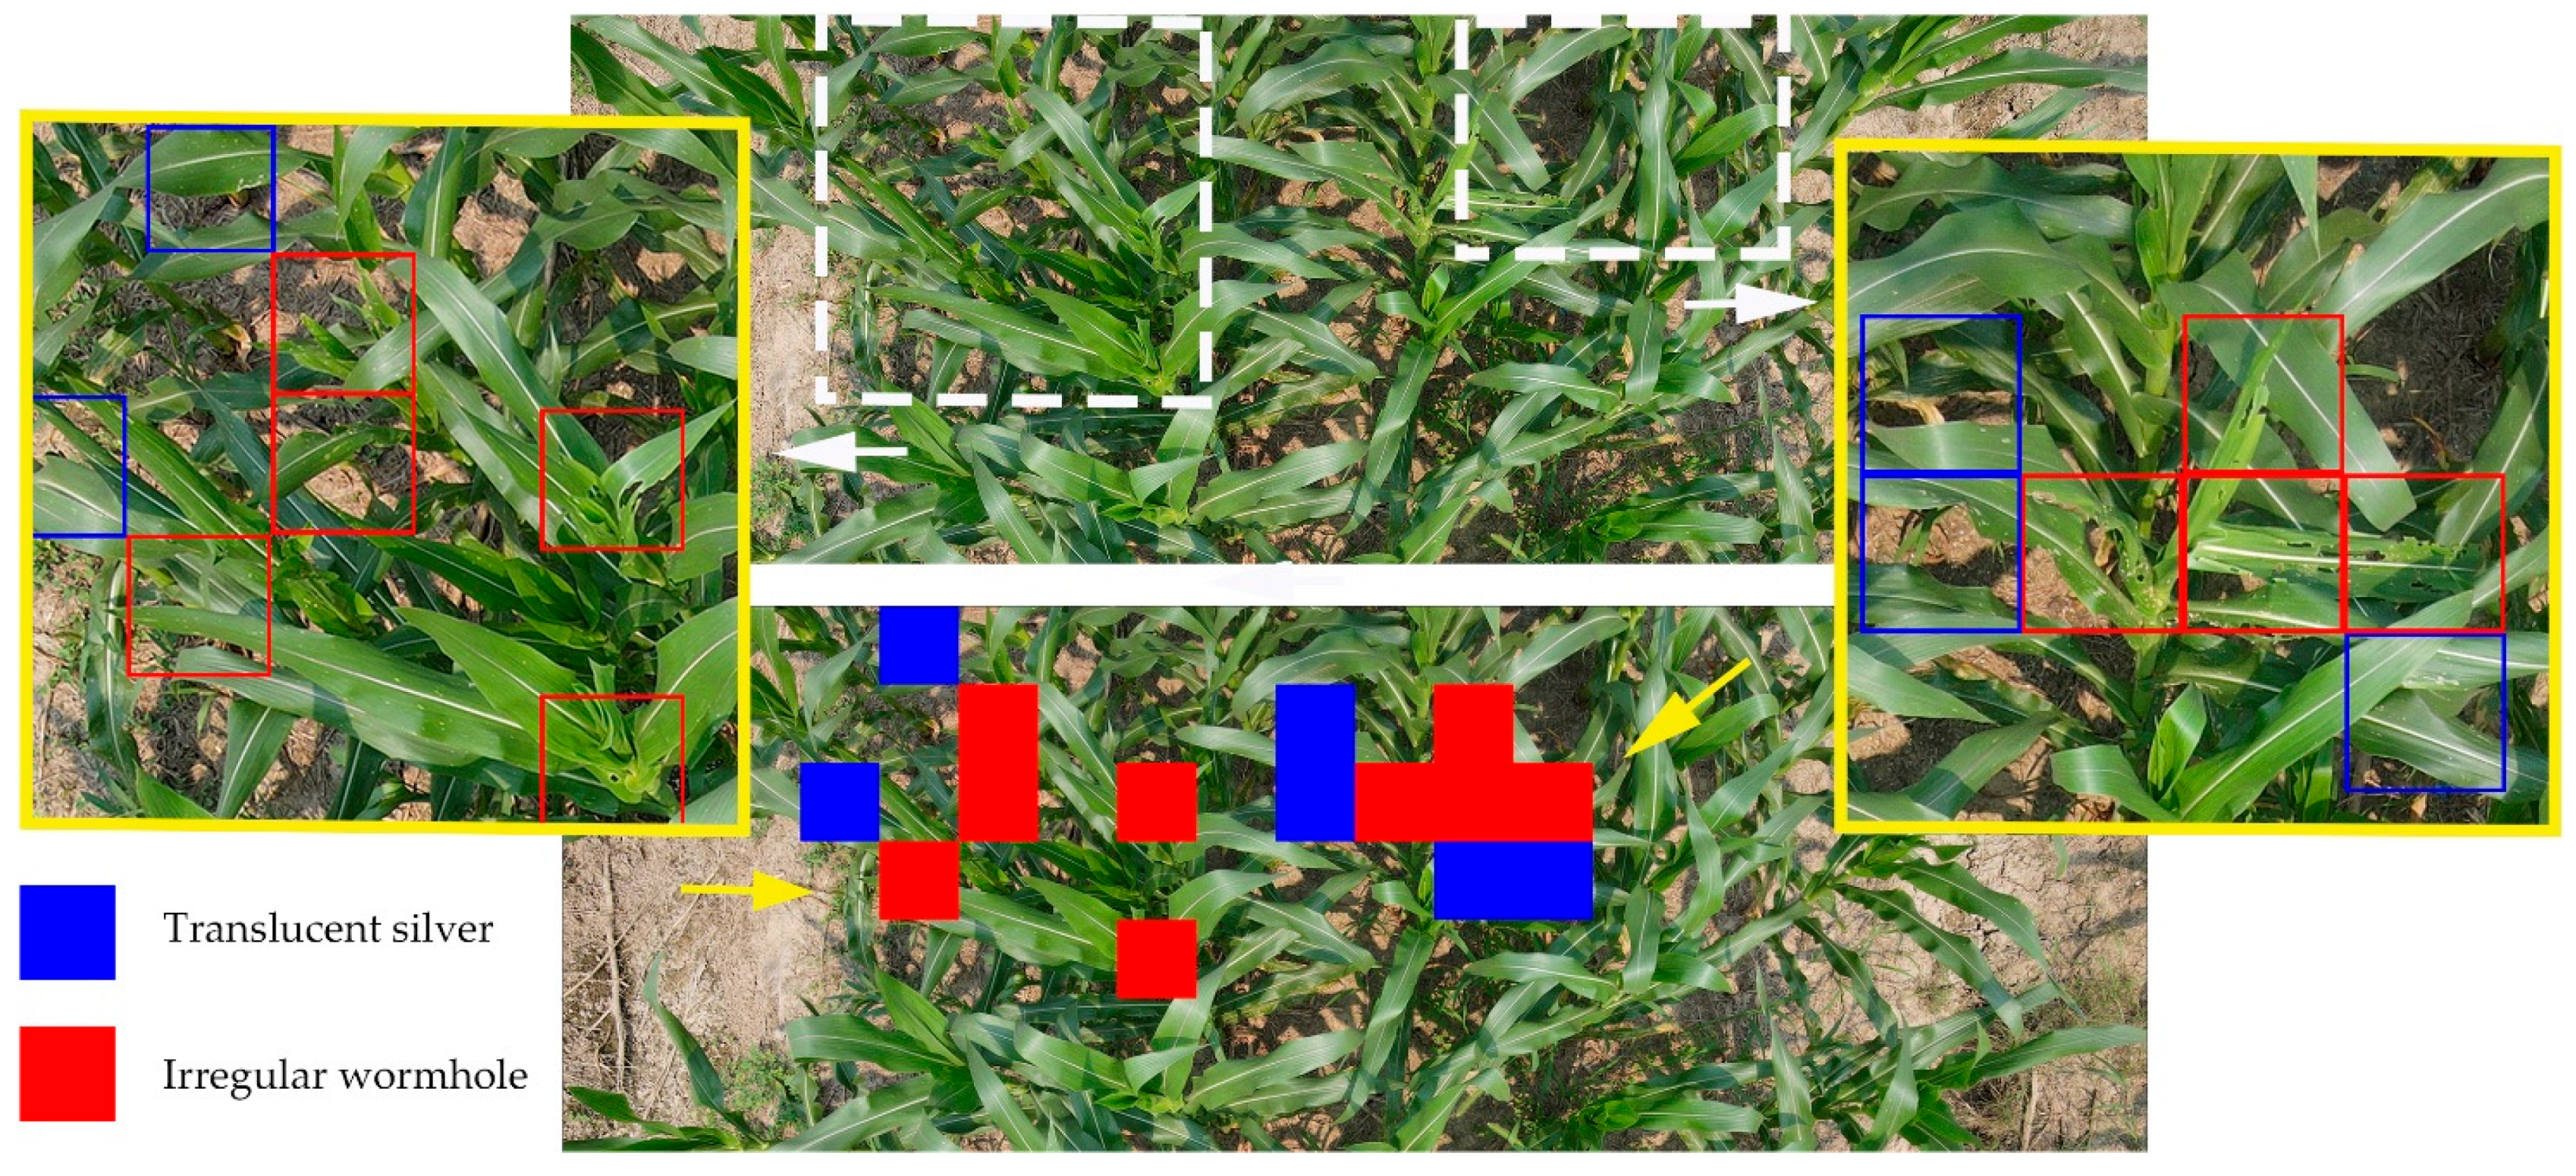
2.3. Image Preprocessing
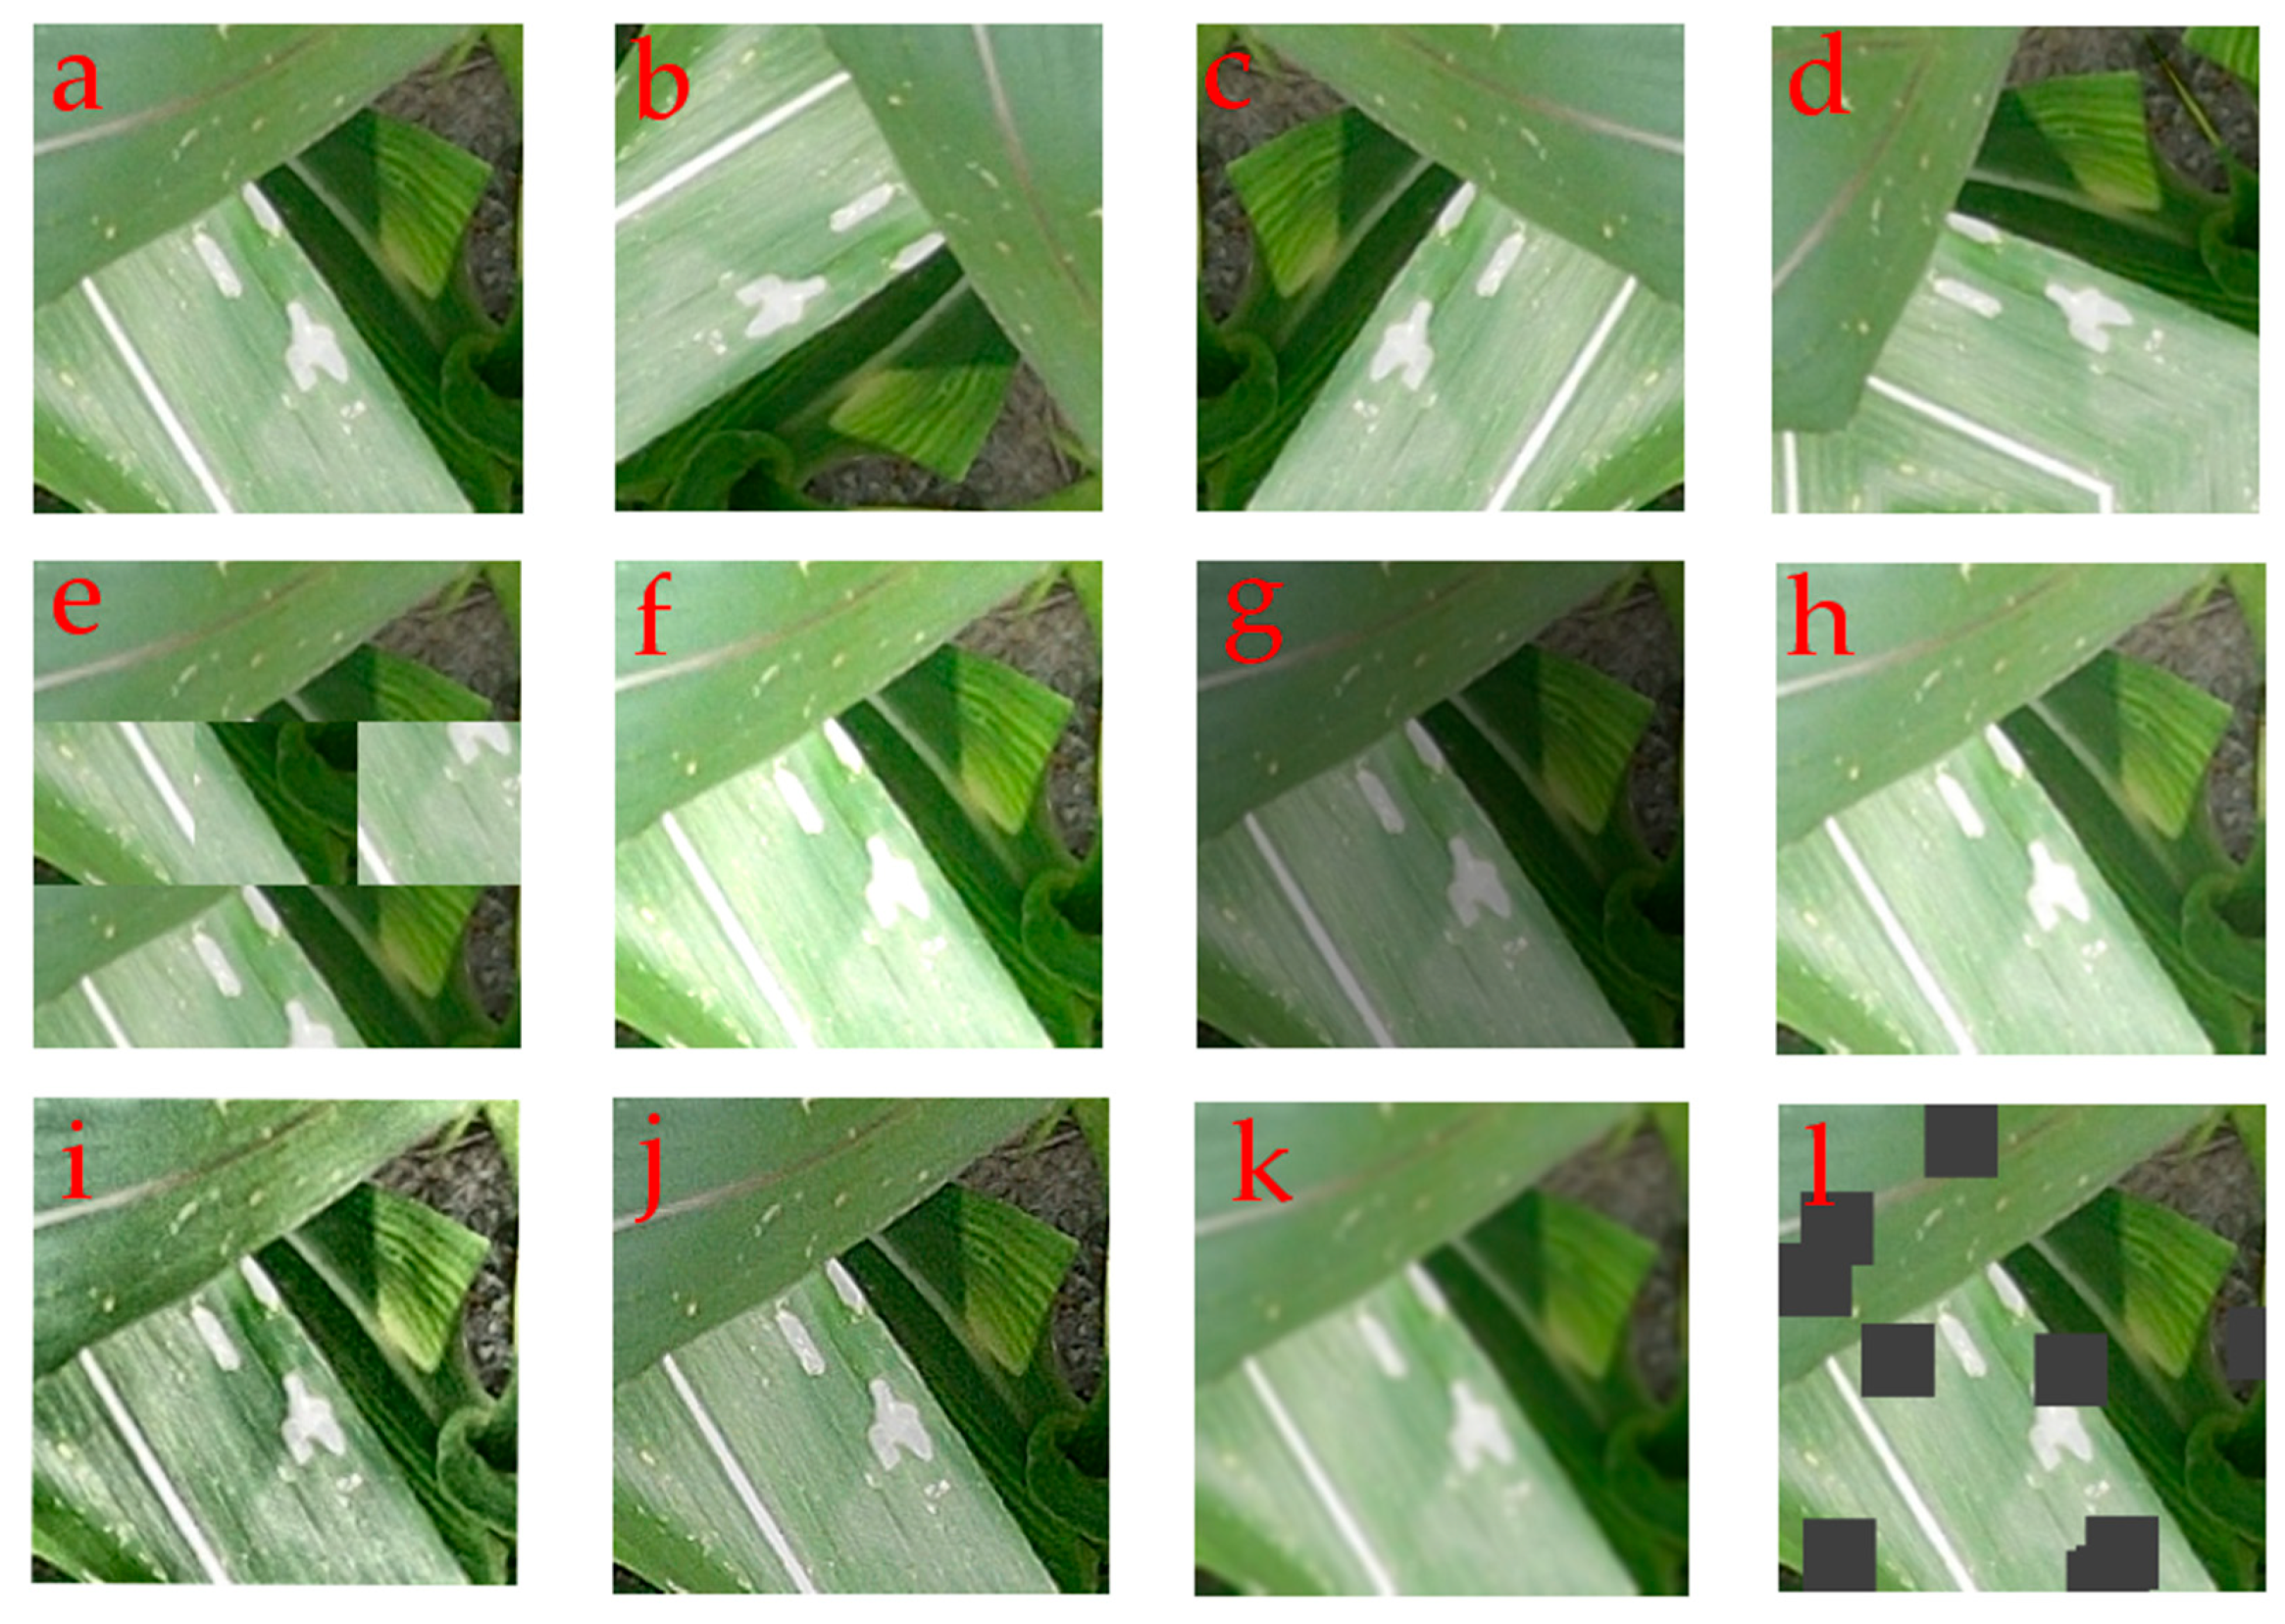
2.4. Augmentation
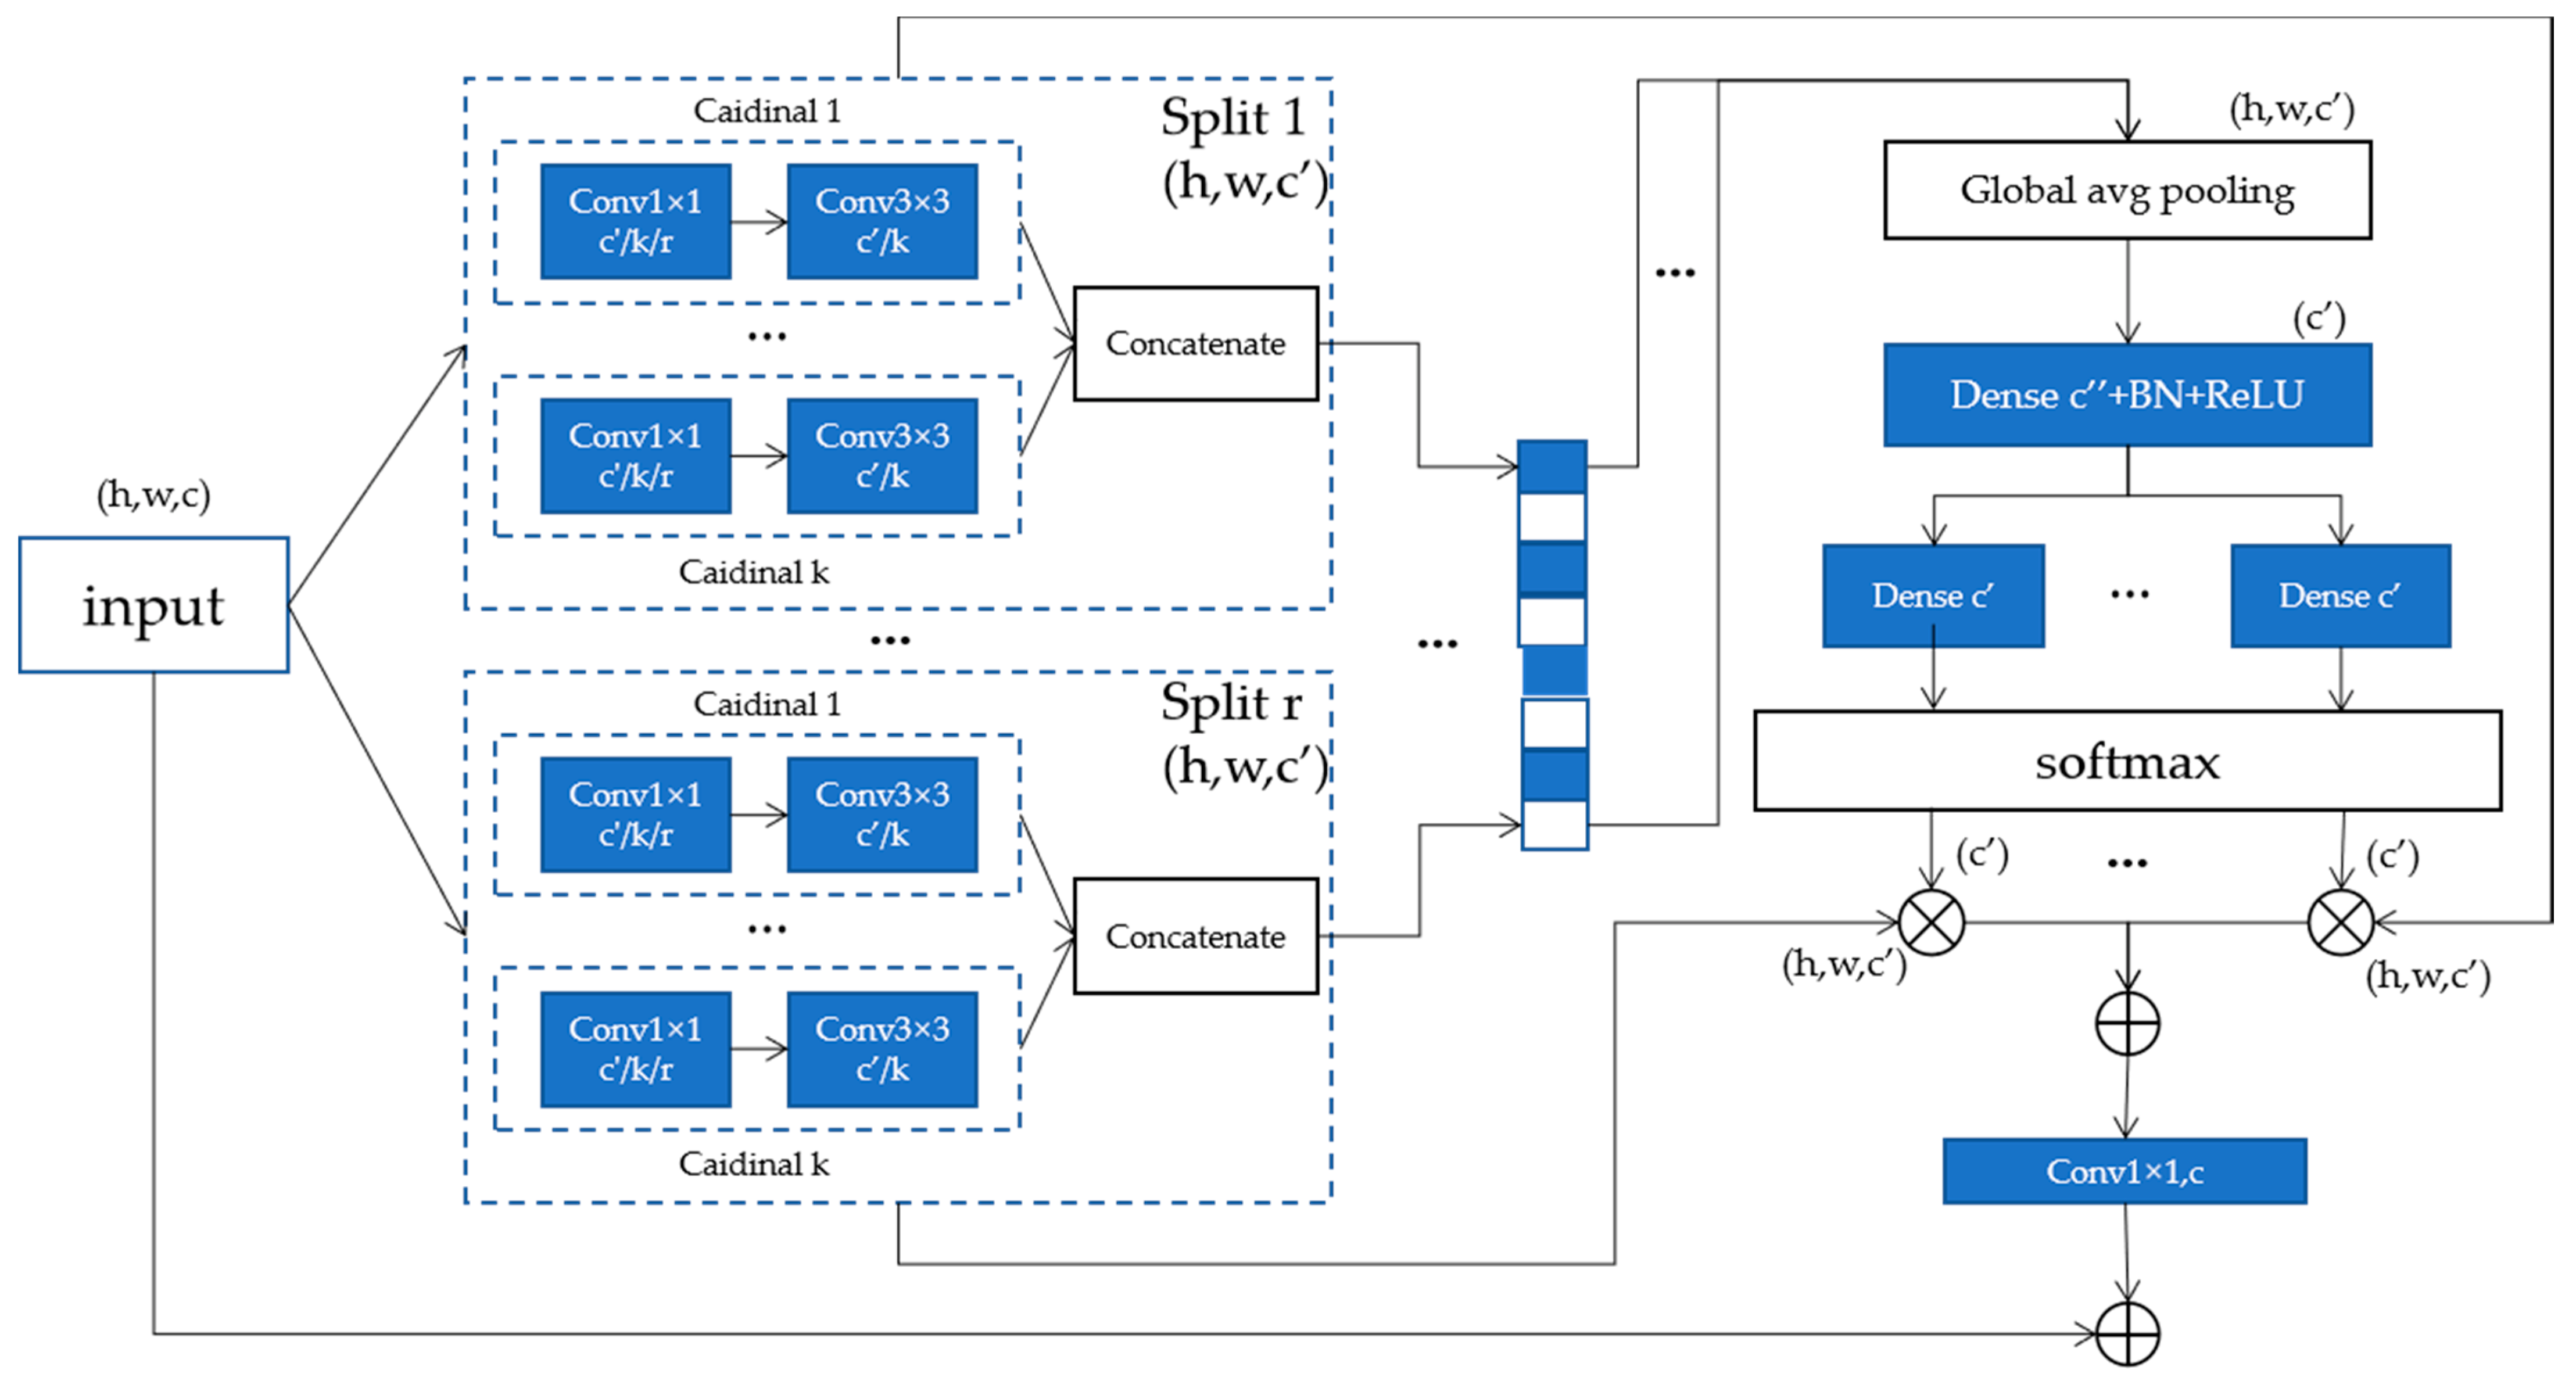
2.5. Convolutional Neural Network
2.6. Transfer Learning
3. Results
3.1. Experimental Setup
3.2. Evaluation Parameters
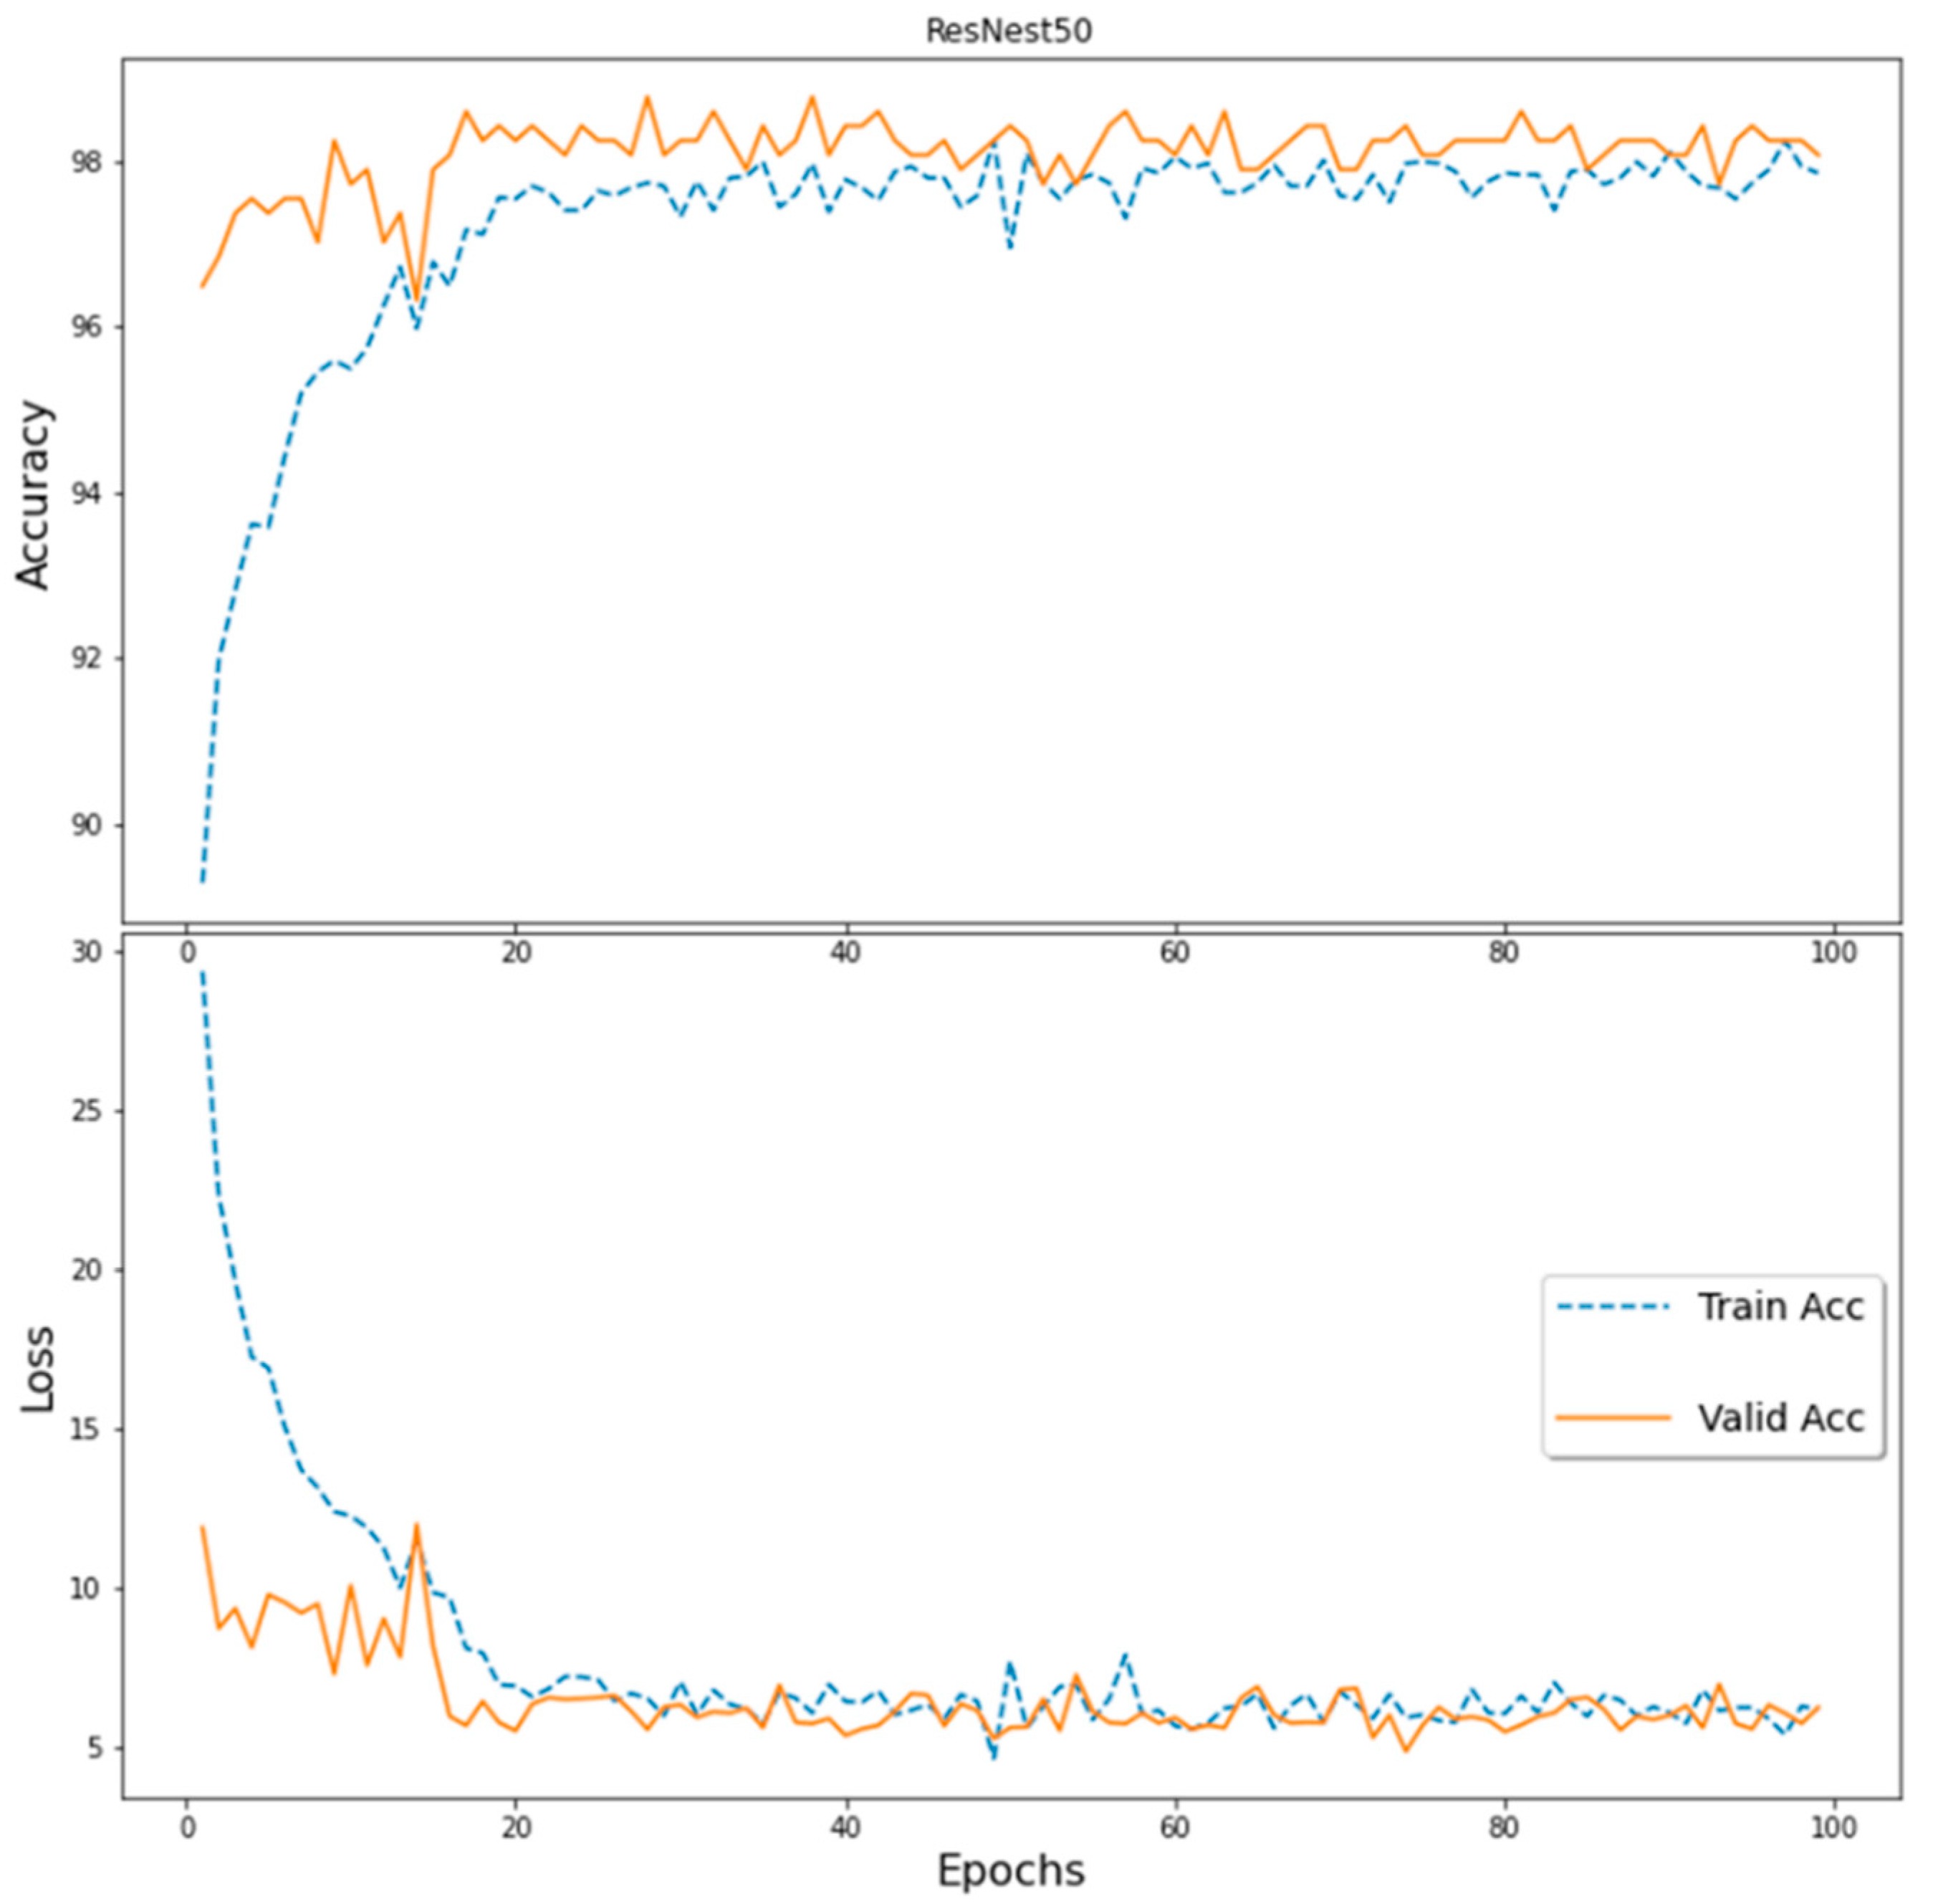
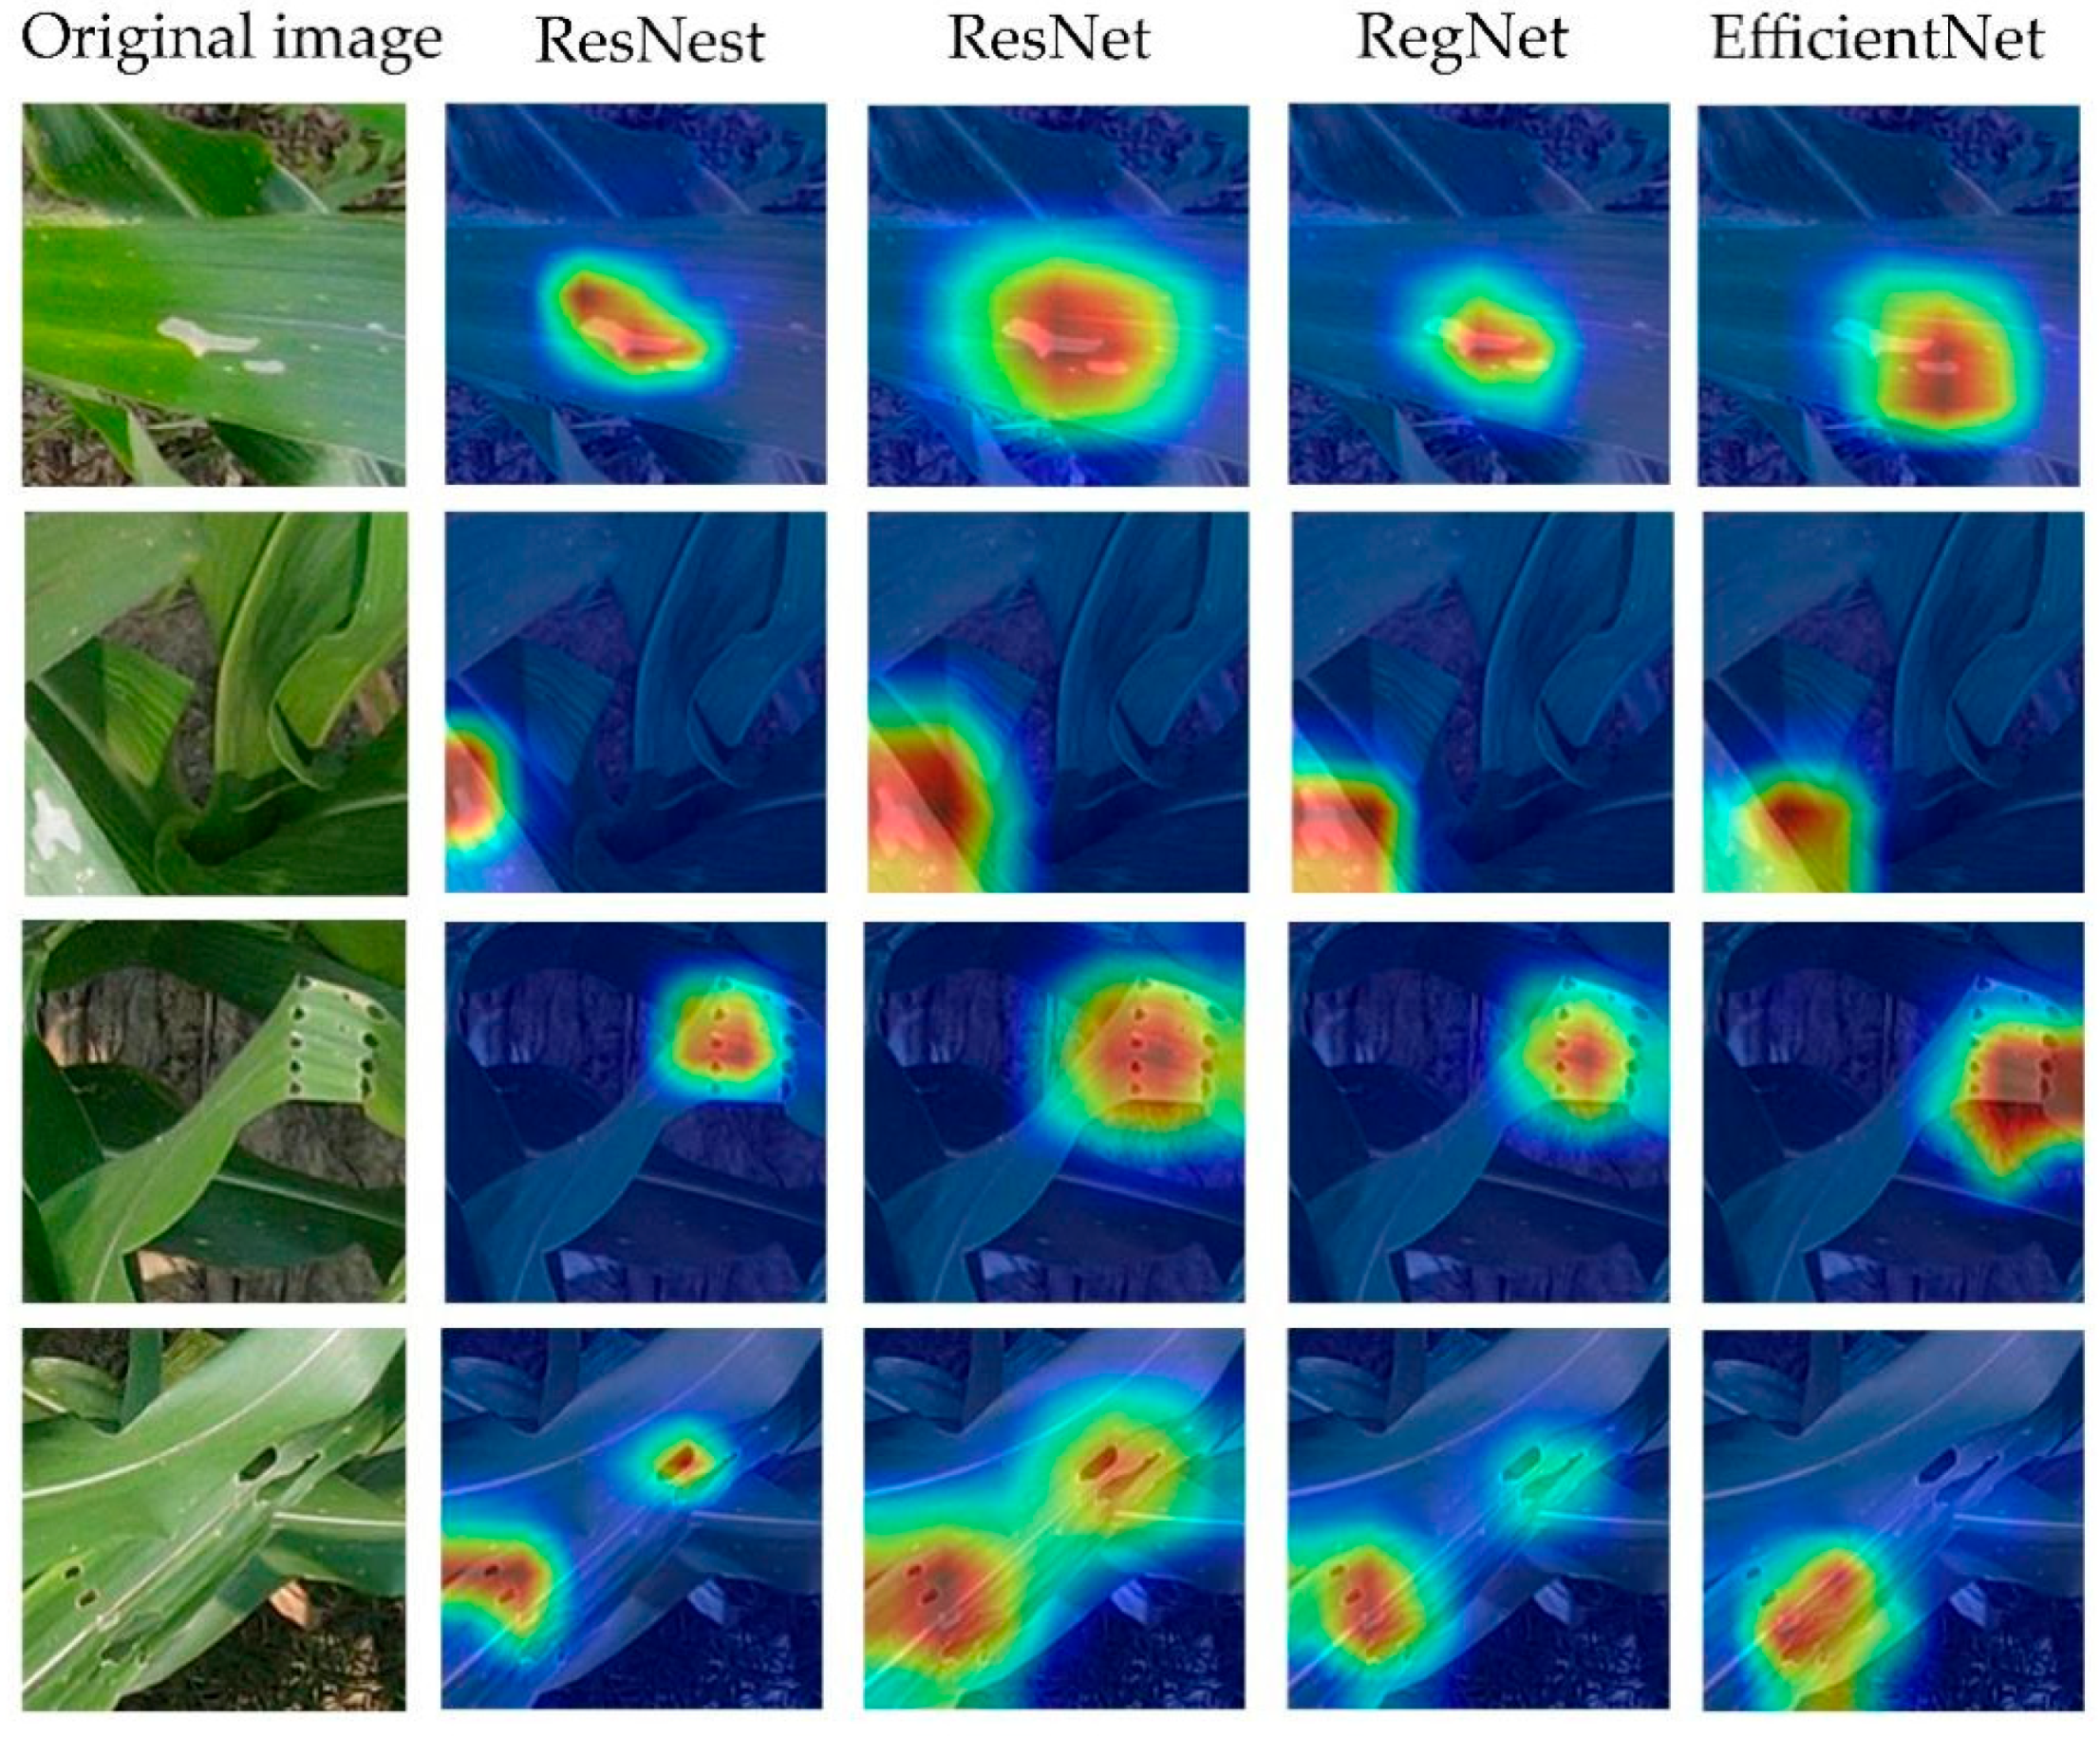
3.3. Experimental Results
4. Discussion
5. Conclusions and Future Directions
Author Contributions
Funding
Institutional Review Board Statement
Informed Consent Statement
Data Availability Statement
Conflicts of Interest
References
- Spark, A.N. A Review of the Biology of the Fall Armyworm. Florida Entomol. 1979, 62, 82–87. [Google Scholar] [CrossRef]
- Food and Agriculture Organization of the United Nations. Map of the Worldwide Spread of Fall Armyworm since 2016. 2022. Available online: http://www.fao.org/fall-armyworm/monitoring-tools/faw-map/en/ (accessed on 24 February 2022).
- Sarkowi, F.N.; Mokhtar, A.S. The fall armyworm (Faw) spodoptera frugiperda: A review on biology, life history, invasion, dispersion and control. Outlooks Pest Manag. 2021, 32, 27–32. [Google Scholar] [CrossRef]
- Poisot, A.; Hruska, A.; Fredrix, M. Integrated Management of the Fall Armyworm on Maize. 2018. Available online: https://www.preventionweb.net/publication/integrated-management-fall-armyworm-maize-guide-farmer-field-schools-africa (accessed on 24 February 2022).
- Ministry of Agriculture and Rural Affairs. The General Office of the Ministry of Agriculture and Rural Affairs on Continuously Strengthening the Prevention and Control of Grass Moths. 2019. Available online: http://www.zzys.moa.gov.cn/tzgg/201907/t20190731_6321854.htm (accessed on 24 February 2022). (In Chinese)
- Bieganowski, A.; Dammer, K.; Siedliska, A.; Bzowska-Bakalarz, M.; Bereś, P.K.; Dąbrowska-Zielińska, K.; Pflanz, M.; Schirrmann, M.; Garz, A. Sensor-based outdoor monitoring of insects in arable crops for their precise control. Pest Manag. Sci. 2020, 77, 1109–1114. [Google Scholar] [CrossRef] [PubMed]
- Sugiura, R.; Tsuda, S.; Tamiya, S.; Itoh, A.; Nishiwaki, K.; Murakami, N.; Shibuya, Y.; Hirafuji, M.; Nuske, S. Field phenotyping system for the assessment of potato late blight resistance using RGB imagery from an unmanned aerial vehicle. Biosyst. Eng. 2016, 148, 1–10. [Google Scholar] [CrossRef]
- Dammer, K.; Adamek, R. Sensor-Based Insecticide Spraying to Control Cereal Aphids and Preserve Lady Beetles. Agron. J. 2012, 104, 1694–1701. [Google Scholar] [CrossRef]
- Karimzadeh, R.; Hejazi, M.J.; Helali, H.; Iranipour, S.; Mohammadi, S.A. Assessing the impact of site-specific spraying on control of Eurygaster integriceps (Hemiptera: Scutelleridae) damage and natural enemies. Precis. Agric. 2011, 12, 576–593. [Google Scholar] [CrossRef]
- Bock, C.H.; Poole, G.H.; Parker, P.E.; Gottwald, T.R. Plant Disease Severity Estimated Visually, by Digital Photography and Image Analysis, and by Hyperspectral Imaging. Crit. Rev. Plant Sci. 2010, 29, 59–107. [Google Scholar] [CrossRef]
- Nanni, L.; Maguolo, G.; Pancino, F. Research on insect pest image detection and recognition based on bio-inspired methods. arXiv 2019, arXiv:1910.00296. [Google Scholar]
- Thenmozhi, K.; Reddy, U.S. Crop pest classification based on deep convolutional neural network and transfer learning. Comput. Electron. Agric. 2019, 164, 104906. [Google Scholar] [CrossRef]
- Li, W.; Chen, P.; Wang, B.; Xie, C. Automatic Localization and Count of Agricultural Crop Pests Based on an Improved Deep Learning Pipeline. Sci. Rep. 2019, 9, 1–11. [Google Scholar] [CrossRef]
- Zhang, X.; Yue, Q.; Meng, F.; Fan, C.; Zhang, M. Identification of maize leaf diseases using improved deep convolutional neural networks. IEEE Access 2018, 6, 30370–30377. [Google Scholar] [CrossRef]
- Alvaro, F.; Sook, Y.; Sang, K.; Dong, P. A robust deep-learning-based detector for real-time tomato plant diseases and pests recognition. Sensors 2017, 17, 2022. [Google Scholar] [CrossRef] [Green Version]
- Selvaraj, M.G.; Vergara, A.; Ruiz, H.; Safari, N.; Blomme, G. AI-powered banana diseases and pest detection. Plant Methods 2019, 15, 1–11. [Google Scholar] [CrossRef]
- Salamí, E.; Barrado, C.; Pastor, E. UAV Flight Experiments Applied to the Remote Sensing of Vegetated Areas. Remote Sens. 2014, 6, 11051–11081. [Google Scholar] [CrossRef] [Green Version]
- Zhang, C.; Kovacs, J.M. The application of small unmanned aerial systems for precision agriculture: A review. Precis. Agric. 2012, 13, 693–712. [Google Scholar] [CrossRef]
- Matese, A.; Toscano, P.; di Gennaro, S.F.; Genesio, L.; Vaccari, F.P.; Primicerio, J.; Belli, C.; Zaldei, A.; Bianconi, R.; Gioli, B. Intercomparison of UAV, Aircraft and Satellite Remote Sensing Platforms for Precision Viticulture. Remote Sens. 2015, 7, 2971–2990. [Google Scholar] [CrossRef] [Green Version]
- Zhang, X.; Zhang, K.; Sun, Y.; Zhao, Y.; Zhuang, H.; Ban, W.; Chen, Y.; Fu, E.; Chen, S.; Liu, J.; et al. Combining Spectral and Texture Features of UAS-Based Multispectral Images for Maize Leaf Area Index Estimation. Remote Sens. 2022, 14, 331. [Google Scholar] [CrossRef]
- Toda, Y.; Okura, F. How Convolutional Neural Networks Diagnose Plant Disease. Plant Phenomics 2019, 2019, 9237136. [Google Scholar] [CrossRef]
- Zhao, S.; Peng, Y.; Liu, J.; Wu, S. Tomato Leaf Disease Diagnosis Based on Improved Convolution Neural Network by Attention Module. Agriculture 2021, 11, 651. [Google Scholar] [CrossRef]
- Ferentinos, K.P. Deep learning models for plant disease detection and diagnosis. Comput. Electron. Agric. 2017, 145, 311–318. [Google Scholar] [CrossRef]
- Chen, S.; Zhang, K.; Zhao, Y.; Sun, Y.; Ban, W.; Chen, Y.; Zhuang, H.; Zhang, X.; Liu, J.; Yang, T. An Approach for Rice Bacterial Leaf Streak Disease Segmentation and Disease Severity Estimation. Agriculture 2021, 11, 420. [Google Scholar] [CrossRef]
- Liu, J.; Zhang, K.; Wu, S.; Shi, H.; Zhao, Y.; Sun, Y.; Zhuang, H.; Fu, E. An Investigation of a Multidimensional CNN Combined with an Attention Mechanism Model to Resolve Small-Sample Problems in Hyperspectral Image Classification. Remote Sens. 2022, 14, 785. [Google Scholar] [CrossRef]
- Tetila, E.C.; Machado, B.B.; Belete, N.; Guimaraes, D.A.; Pistori, H. Identification of Soybean Foliar Diseases Using Unmanned Aerial Vehicle Images. IEEE Geosci. Remote Sens. Lett. 2017, 1, 5. [Google Scholar] [CrossRef]
- Wu, H.; Wiesner-Hanks, T.; Stewart, E.L.; DeChant, C.; Kaczmar, N.; Gore, M.A.; Nelson, R.J.; Lipson, H. Autonomous Detection of Plant Disease Symptoms Directly from Aerial Imagery. Plant Phenome J. 2019, 2, 1–9. [Google Scholar] [CrossRef]
- Ha, J.G.; Moon, H.; Kwak, J.T.; Hassan, S.I.; Dang, M.; Lee, O.N.; Park, H.Y. Deep convolutional neural network for classifying Fusarium wilt of radish from unmanned aerial vehicles. J. Appl. Remote Sens. 2017, 11, 1. [Google Scholar] [CrossRef]
- Lima, M.C.F.; Leandro, M.E.D.D.A.; Valero, C.; Coronel, L.C.P.; Bazzo, C.O.G. Automatic Detection and Monitoring of Insect Pests—A Review. Agriculture 2020, 10, 161. [Google Scholar] [CrossRef]
- Liu, L.; Wang, R.; Xie, C.; Yang, P.; Wang, F.; Sudirman, S.; Liu, W. PestNet: An End-to-End Deep Learning Approach for Large-Scale Multi-Class Pest Detection and Classification. IEEE Access 2019, 7, 45301–45312. [Google Scholar] [CrossRef]
- Zhang, J.; Huang, Y.; Yuan, L.; Yang, G.; Jingcheng, Z.; Zhao, C. Using satellite multispectral imagery for damage mapping of armyworm (Spodoptera frugiperda) in maize at a regional scale. Pest Manag. Sci. 2016, 72, 335–348. [Google Scholar] [CrossRef]
- Suwa, K.; Cap, Q.H.; Kotani, R.; Uga, H.; Kagiwada, S.; Iyatomi, H. A comparable study: Intrinsic difficulties of practical plant diagnosis from wide-angle images. In Proceedings of the IEEE International Conference on Big Data, Los Angeles, CA, USA, 9–12 December 2019; pp. 5195–5201. [Google Scholar] [CrossRef] [Green Version]
- Del-Campo-Sanchez, A.; Ballesteros, R.; Hernandez-Lopez, D.; Ortega, J.F.; Moreno, M.A.; on behalf of Agroforestry and Cartography Precision Research Group. Quantifying the effect of Jacobiasca lybica pest on vineyards with UAVs by combining geometric and computer vision techniques. PLoS ONE 2019, 14, e0215521. [Google Scholar] [CrossRef] [Green Version]
- Ishengoma, F.S.; Rai, I.A.; Said, R.N. Identification of maize leaves infected by fall armyworms using UAV-based imagery and convolutional neural networks. Comput. Electron. Agric. 2021, 184, 106124. [Google Scholar] [CrossRef]
- Blok, P.M.; van Evert, F.K.; Tielen, A.P.M.; van Henten, E.J.; Kootstra, G. The effect of data augmentation and network simplification on the image-based detection of broccoli heads with Mask R-CNN. J. Field Robot. 2021, 38, 85–104. [Google Scholar] [CrossRef]
- Kuznichov, D.; Zvirin, A.; Honen, Y.; Kimmel, R. Data Augmentation for Leaf Segmentation and Counting Tasks in Rosette Plants. In Proceedings of the IEEE/CVF Conference on Computer Vision and Pattern Recognition Workshops, Long Beach, CA, USA, 16–17 June 2019; pp. 2580–2589. [Google Scholar] [CrossRef] [Green Version]
- El-Kenawy, E.-S.M.; Ibrahim, A.; Mirjalili, S.; Eid, M.M.; Hussein, S.E. Novel Feature Selection and Voting Classifier Algorithms for COVID-19 Classification in CT Images. IEEE Access 2020, 8, 179317–179335. [Google Scholar] [CrossRef]
- Shorten, C.; Khoshgoftaar, T.M. A survey on Image Data Augmentation for Deep Learning. J. Big Data 2019, 6, 60. [Google Scholar] [CrossRef]
- Gonzalez, T.F. Handbook of Approximation Algorithms and Metaheuristics; Chapman and Hall/CRC: New York, NY, USA, 2007; 1432p. [Google Scholar] [CrossRef]
- LeCun, Y.; Bengio, Y.; Hinton, G. Deep learning. Nature 2015, 521, 436–444. [Google Scholar] [CrossRef] [PubMed]
- Girshick, R.; Donahue, J.; Darrell, T.; Malik, J. Rich feature hierarchies for accurate object detection and semantic segmentation. In Proceedings of the 2014 IEEE Conference on Computer Vision and Pattern Recognition, Columbus, OH, USA, 23–28 June 2014; pp. 580–587. [Google Scholar] [CrossRef] [Green Version]
- He, K.; Zhang, X.; Ren, S.; Sun, J. Deep residual learning for image recognition. In Proceedings of the 2016 IEEE Conference on Computer Vision and Pattern Recognition (CVPR), Las Vegas, NV, USA, 27–30 June 2016. [Google Scholar]
- Zhang, X.; Han, L.; Dong, Y.; Shi, Y.; Huang, W.; Han, L.; González-Moreno, P.; Ma, H.; Ye, H.; Sobeih, T. A Deep Learning-Based Approach for Automated Yellow Rust Disease Detection from High-Resolution Hyperspectral UAV Images. Remote Sens. 2019, 11, 1554. [Google Scholar] [CrossRef] [Green Version]
- Xie, S.; Girshick, R.; Dollar, P.; Tu, Z.; He, K. Aggregated residual transformations for deep neural networks. In Proceedings of the IEEE Conference on Computer Vision and Pattern Recognition (CVPR), Honolulu, HI, USA, 21–26 July 2017; pp. 5987–5995. [Google Scholar] [CrossRef] [Green Version]
- Hu, J.; Shen, L.; Albanie, S.; Sun, G.; Wu, E. Squeeze-and-Excitation Networks. IEEE Trans. Pattern Anal. Mach. Intell. 2020, 42, 2011–2023. [Google Scholar] [CrossRef] [Green Version]
- Li, X.; Wang, W.; Hu, X.; Yang, J. Selective kernel networks. In Proceedings of the 2019 IEEE/CVF Conference on Computer Vision and Pattern Recognition (CVPR), Long Beach, CA, USA, 15–20 June 2019; pp. 510–519. [Google Scholar]
- Zhang, H.L.H.; Wu, C.; Zhang, Z.; Zhu, Y. ResNeSt: Split-Attention Networks. arXiv 2020, arXiv:2004.08955. [Google Scholar]
- Tan, M.; Le, Q.V. EfficientNet: Rethinking model scaling for convolutional neural networks. In Proceedings of the Thirty-sixth International Conference on Machine Learning, ICML, Long Beach, CA, USA, 9–15 June 2019; pp. 10691–10700. [Google Scholar]
- Radosavovic, I.; Kosaraju, R.P.; Girshick, R.; He, K.; Dollar, P. Designing network design spaces. In Proceedings of the 2020 IEEE/CVF Conference on Computer Vision and Pattern Recognition (CVPR), Seattle, WA, USA, 13–19 June 2020; pp. 10425–10433. [Google Scholar]
- Afifi, A.; Alhumam, A.; Abdelwahab, A. Convolutional Neural Network for Automatic Identification of Plant Diseases with Limited Data. Plants 2020, 10, 28. [Google Scholar] [CrossRef]
- Hu, R.; Zhang, S.; Wang, P.; Xu, G.; Wang, D.; Qian, Y. The identification of corn leaf diseases based on transfer learning and data augmentation. ACM Int. Conf. Proceeding Ser. 2020, 58–65. [Google Scholar] [CrossRef]
- Deng, J.; Dong, W.; Socher, R.; Li, L.-J.; Li, K.; Fei-Fei, L. ImageNet: A large-scale hierarchical image database. In Proceedings of the 2009 IEEE Computer Society Conference on Computer Vision and Pattern Recognition, Miami, FL, USA, 20–25 June 2009; pp. 248–255. [Google Scholar]


| CNN | Convolutional Neural Networks | UAV | Unmanned Aerial Vehicle |
| RS | Remote Sensing | RGB | R (red), G (green), B (blue) |
| Date | #Images | Stage | Image Resolution |
|---|---|---|---|
| 8 September 2020 | 295 | Jointing | 4000 × 3000 |
| 19 September 2020 | 249 | Heading | 6000 × 8000 |
| 24 September 2020 | 84 272 | Heading | 6000 × 8000 4000 × 3000 |
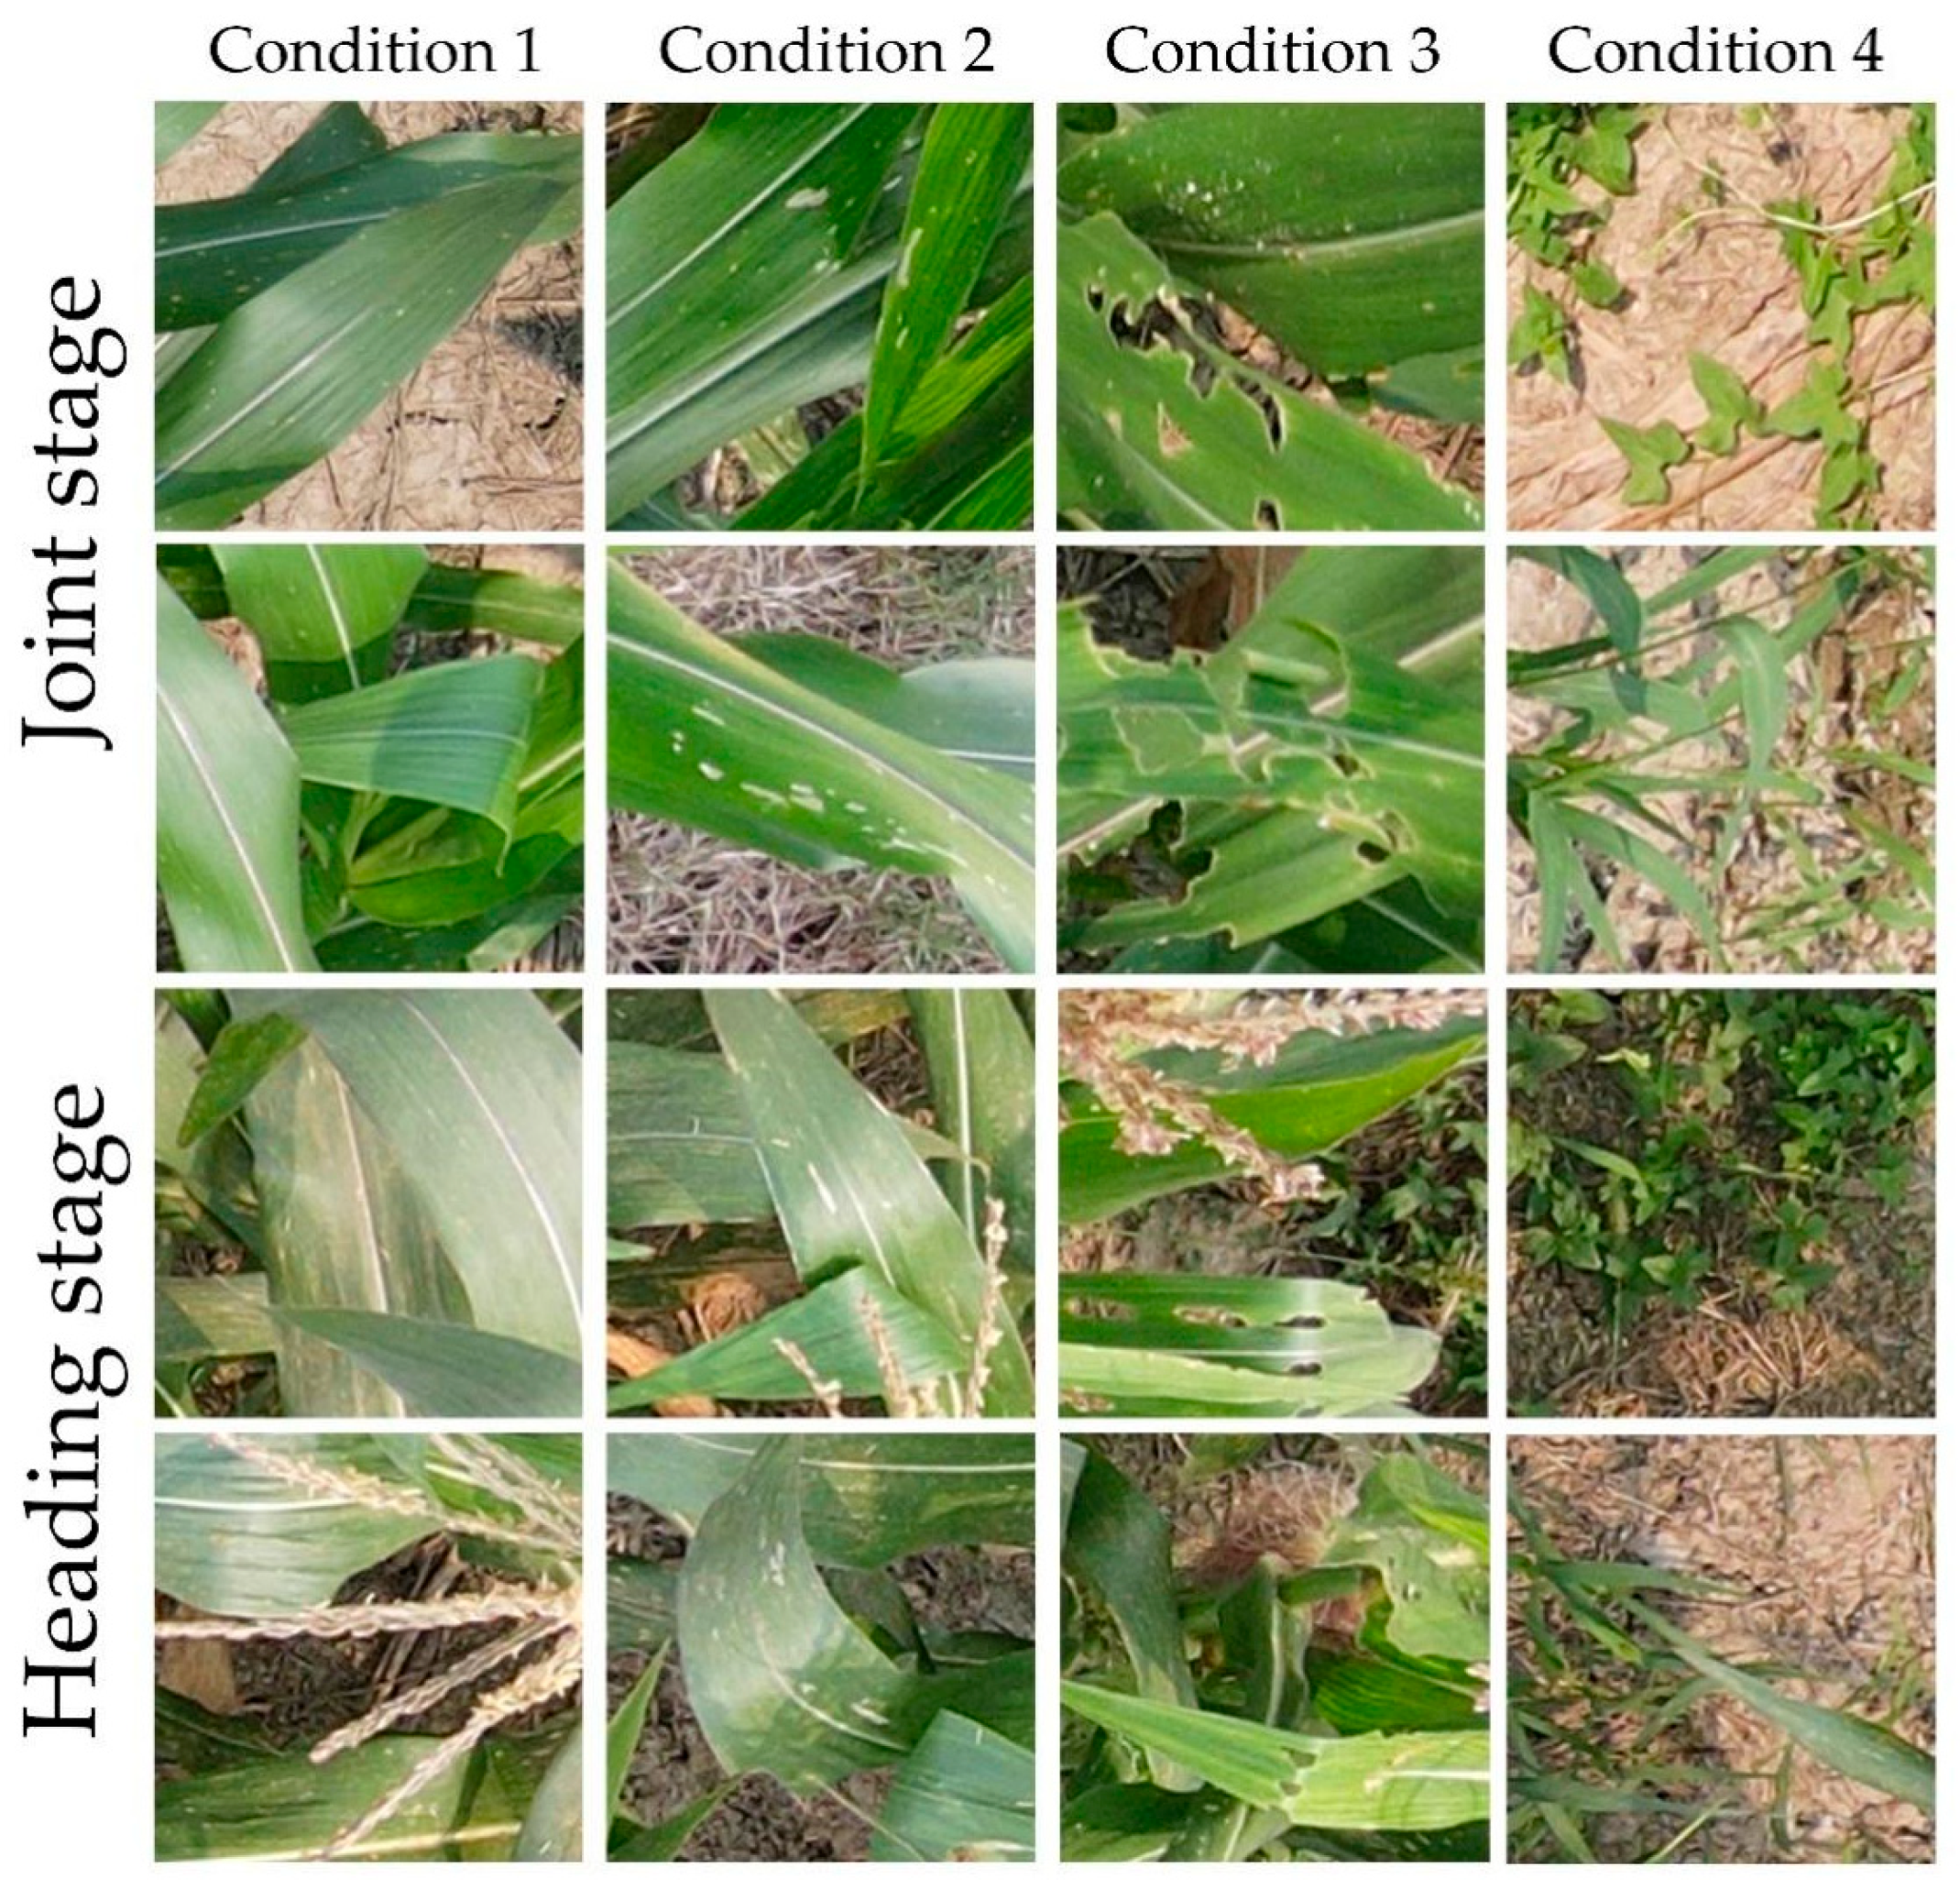
| Stage | Health | TSW | IW | Sum |
|---|---|---|---|---|
| Jointing | 2043 | 1904 | 1744 | 5691 |
| Heading | 532 | 417 | 596 | 1545 |
| Model | Class | Health | TSW | IW | Accuracy | Sensitivity | Specificity | Precision | F1 Score | Kappa |
|---|---|---|---|---|---|---|---|---|---|---|
| ResNeSt50 | Health | 473 | 47 | 12 | 89.39% | 0.89 | 0.97 | 0.94 | 0.91 | 0.84 |
| TSW | 7 | 398 | 12 | 0.950.86 | 0.90 0.97 | 0.97 0.96 | 0.86 | |||
| IW | 22 | 64 | 510 | 0.90 | ||||||
| ResNet50 | Health | 390 | 37 | 105 | 81.88% | 0.73 | 0.97 | 0.94 | 0.82 | 0.72 |
| TSW | 14 | 349 | 54 | 0.84 0.88 | 0.91 0.82 | 0.79 0.77 | 0.81 | |||
| IW | 13 | 57 | 526 | 0.82 | ||||||
| EfficientNet | Health | 456 | 39 | 37 | 86.21% | 0.86 | 0.95 | 0.91 | 0.88 | 0.79 |
| TSW | 18 | 377 | 22 | 0.90 0.84 | 0.90 0.93 | 0.77 0.89 | 0.83 | |||
| IW | 25 | 72 | 499 | 0.86 | ||||||
| RegNet | Health | 419 | 30 | 83 | 84.21% | 0.79 | 0.97 | 0.94 | 0.86 | 0.76 |
| TSW | 15 | 342 | 60 | 0.82 | 0.93 | 0.82 | 0.82 | |||
| IW | 10 | 46 | 540 | 0.91 | 0.84 | 0.79 | 0.84 |
Publisher’s Note: MDPI stays neutral with regard to jurisdictional claims in published maps and institutional affiliations. |
© 2022 by the authors. Licensee MDPI, Basel, Switzerland. This article is an open access article distributed under the terms and conditions of the Creative Commons Attribution (CC BY) license (https://creativecommons.org/licenses/by/4.0/).
Share and Cite
Feng, J.; Sun, Y.; Zhang, K.; Zhao, Y.; Ren, Y.; Chen, Y.; Zhuang, H.; Chen, S. Autonomous Detection of Spodoptera frugiperda by Feeding Symptoms Directly from UAV RGB Imagery. Appl. Sci. 2022, 12, 2592. https://doi.org/10.3390/app12052592
Feng J, Sun Y, Zhang K, Zhao Y, Ren Y, Chen Y, Zhuang H, Chen S. Autonomous Detection of Spodoptera frugiperda by Feeding Symptoms Directly from UAV RGB Imagery. Applied Sciences. 2022; 12(5):2592. https://doi.org/10.3390/app12052592
Chicago/Turabian StyleFeng, Jiedong, Yaqin Sun, Kefei Zhang, Yindi Zhao, Yi Ren, Yu Chen, Huifu Zhuang, and Shuo Chen. 2022. "Autonomous Detection of Spodoptera frugiperda by Feeding Symptoms Directly from UAV RGB Imagery" Applied Sciences 12, no. 5: 2592. https://doi.org/10.3390/app12052592