Article

Wearable Inertial Measurement Unit to Measure External Load: A Full-Season Study in Professional Soccer Players

by
Hadi Nobari
1,2,3,4,*,†,
Luiz G. Gonçalves
5,
Rodrigo Aquino
6,
Filipe Manuel Clemente
7,8,*,†,
Manuchehr Rezaei
3,
Jorge Carlos-Vivas
9,
Jorge Pérez-Gómez
9,
Basilio Pueo
10 and
Luca Paolo Ardigò
11
1
Department of Physical Education and Sports, University of Granada, 18010 Granada, Spain
2
Department of Physiology, School of Sport Sciences, University of Extremadura, 10003 Cáceres, Spain
3
Sports Scientist, Sepahan Football Club, Isfahan 81887-78473, Iran
4
Department of Exercise Physiology, Faculty of Educational Sciences and Psychology, University of Mohaghegh Ardabili, Ardabil 56199-11367, Iran
5
Department of Performance Analysis, Criciúma Football Club, Criciúma 88816-276, Brazil
6
LabSport, Center of Physical Education and Sports, Federal University of Espírito Santo, Vitória 29075-910, Brazil
7
Escola Superior Desporto e Lazer, Instituto Politécnico de Viana do Castelo, Rua Escola Industrial e Comercial de Nun’Álvares, 4900-347 Viana do Castelo, Portugal
8
Instituto de Telecomunicações, Delegação da Covilhã, 1049-001 Lisboa, Portugal
9
HEME Research Group, Faculty of Sport Sciences, University of Extremadura, 10003 Cáceres, Spain
10
Institute for Computing Research, Physical Education and Sports, Faculty of Education, University of Alicante, 03013 Alicante, Spain
11
Department of Neurosciences, Biomedicine and Movement Sciences, School of Exercise and Sport Science, University of Verona, 37131 Verona, Italy
*
Authors to whom correspondence should be addressed.
These authors contributed equally to this work.
Appl. Sci. 2022, 12(3), 1140; https://doi.org/10.3390/app12031140
Submission received: 8 November 2021 / Revised: 19 January 2022 / Accepted: 20 January 2022 / Published: 21 January 2022
(This article belongs to the Special Issue Wearables and Smartphone Applications in Sports)

Abstract

:
The aim of this study was to describe weekly acute workload (wAW), chronic workload (wCW), acute: chronic workload ratio (wACWR), training monotony (wTM), and training strain (wTS) variations over a full season across playing positions. Twenty-one professional soccer players were daily monitored during 48 consecutive weeks. Total distance, sprint total distance (STD), high-speed running distance (HSRd), maximum speed, number of the repeated sprints, and body load (BL) were obtained during training and matches using a Wearable Inertial Measurement Unit. The wAW was determined for each external load measure. The wCW, wACWR, and wTM were calculated based on BL metric. Higher values of weekly STD were observed in lateral defenders/wingers (LDW) compared to central defenders/forwards (CDF) (p = 0.009; ES = Large) and midfielders (MDF) (p = 0.034; ES = Large). Additionally, weekly HSRd was higher in LDW vs. CDF (p = 0.016; ES = Large) and MDF (p = 0.011; ES = Large). The CDF presented a lower weekly number of repeated sprints than LDW (p = 0.021; ES = Large). In conclusion, weekly external load metrics were position-dependent over the season. Moreover, LDW a presented greater weekly STD, HSRd, and number of repeated sprints compared to other positions.

1. Introduction

Load monitoring is employed by coaches and practitioners to understand the basic concept of “load-recovery”, which consequently leads to positive adaptations in physical fitness [1,2]. The process of continuous monitoring was extensive coverage, for example, to identify individual strengths and weaknesses and to monitor player development over the full season [3,4,5]. Additionally, previous studies reported several factors that influenced the external loads, such as congested schedule [6], match players’ participation [7], task constraints [8], and situational variables [9]. Paying attention to training load, recovery, and changes in psychological status provides useful information for coaches to handle and manage the variation of stimuli based on playing position. The optimization of the training individualization is to decrease the risk of injury, and the early finding of bad overreaching is to minimize the risk of non-functional overreaching syndrome (NFOR). However, the process of load monitoring over the full season, considering the playing posing, was few previously evidenced [10,11,12]. In fact, when the volume of training/competition increases in conjunction with insufficient recovery, the players may enter into an NFOR marked by decrements in performance due to cumulative fatigue during the season [13]. It has been shown that there are different performance level differences between player positions [14,15,16].
Aside from that, soccer has been described as a high-intensity activity, including sprints, accelerations, and decelerations [16]. Furthermore, controlling the physiological and physical condition of players provides information about their unique requirements [17]. Recognizing the demands is one of the key advantages of individual monitoring based on their playing position [13]. In addition, diverse energy systems, physiological, and psychological demands are represented by different roles and needs in each playing position [18]. For example, according to a study, defenders have more backward, lateral, and explosive actions, such as jumping, than other positions, consuming 20 to 40% more energy than going forward [19]. In contrast to attackers and defenders, midfielders run greater distances but at a lower or moderate intensity. Attackers, like defenders, are more prone to sprints and explosive movements [20].
Previous studies described positive or negative fluctuations in the internal and external load over different periods (e.g., pre-season or in-season) in professional soccer [21,22,23,24,25]. Thus, some studies provided more information when focusing on training monotony (TM) (mean of training load during the seven days of the week divided by the standard deviation of the training load of the seven days) and training strain (TS) (multiplication of accumulated weekly load by the TM) workload indices [10,26]. In contrast, Clemente et al. [27] demonstrated high TM variations (0.9–3.8 AU) in professional players over the season. Additionally, a longitudinal study showed that TM and TS were related to high-injury risks and illnesses [28]. Additionally, the relationship between acute weekly load and chronic load (referred to as “acute: chronic workload ratio”, or ACWR) has been received as a measure of predicting injury [29]. However, the framework and mathematics principles of this metric for this purpose received scientific criticism [29,30]. In contrast, no critics can be found to the real value of the ACWR to understand the progression load principle over the weeks [31]. Therefore, a well-implemented soccer player monitoring, including TM, TS, and ACWR, is warranted to better control stimulus–response relationships over the season [32].
Furthermore, the accelerometry-based measures can provide a great level of sensitivity and accuracy considering the capacity of these sensors to collect data at a higher acquisition frequency than Global Positioning System (GPS) [33,34,35]. The body load (BL) metric (expressed as a G-force) is a triaxial accelerometer measure from the GPS that provides summarized actions information of the acceleration/deceleration, related changes of direction, jumps, and impacts/collisions [36]. Previous studies have used GPSs and accelerometers to access match running performance (e.g., high-intensity running, sprinting, and BL) across playing positions [37,38]. However, the TM, TS, and acute and chronic of both distance- and accelerometry-based workloads across playing positions have not been well documented in the literature over the professional soccer season. This information can aid coaches and practitioners to deeply understand the specificities of the positional role and prescribe more representative training tasks.
In a professional sports team, a full season include three phases: the off-season, pre-season, and in-season. Pre- and in-season are substantial in terms of physical work, where usually during the pre-season there is an enhancement of physical fitness of the players, while the in-season improves the maintenance of the capacities developed during the pre-season. With this explanation, we hypothesized that the training loads recorded for players at different time periods of the season could be different [27,28], for example possibly being greater during the pre-season, lower during competition, or lower during the tournament. Therefore, the aim of this study was twofold: (i) to describe weekly average acute workload (wAW), chronic workload (wCW), acute: chronic workload ratio (wACWR), TM (wTM), and TS (wTS) based on BL metric variations across the full season by playing positions and (ii) to analyze the variations of wAW, wCW, wACWR, wTM, wTS, weekly total distance (wTD), weekly sprint total distance (wSTD), weekly high-speed running distance (wHSRd), weekly repeat sprint (wRS), weekly maximum speed (wMaxSp), the ratio between wHSRd/wTD, and the ratio between wSTD/wTD by playing position over the full season.

2. Materials and Methods

2.1. Experimental Approach to the Problem

This study was a cross-sectional cohort that included a full season of attending a professional football team during 48 weeks in the Persian Gulf Premier League and knockout tournament in the 2018–2019 year. Due to the limited number of subjects, we tried to divided players according to the similar physical demands of playing position [39,40,41]: (i) lateral defenders and wingers (LDW; n = 4 lateral defenders, n = 4 wingers); (ii) central defenders and forwards (CDF; n = 4 central defenders, n = 3 forwards); and (iii) midfielders (MDF; n = 6 midfielders). During the whole season, 7 weeks congested (i.e., two or more matches within 7 days), 30 weeks non-congested; 44 matches, 200 training sessions; and 141,26.75 min of time play and sessions were held.

2.2. Participants

Twenty-one professional soccer players (age, 28.27 ± 3.78 years; height, 181.23 ± 7.08 cm; body mass, 74.45 ± 7.72 kg; BMI, 22.60 ± 1.03 kg·m−2) of one team competing in the Iranian Premier League were evaluated for 48 weeks during a full season. The inclusion criterion for the participants was (i) at least 3 training sessions per week. The exclusion criteria were (i) each player due to prolonged injury or a lack of participation in training for at least 2 weeks were excluded, and (ii) goalkeepers were excluded from the study due to differences in sports activity and variables used [39]. This research was conducted by the training coaches of the club after setting with the relevant authorities and the head coach in the club. Prior to commencing the study, it also received the approval of the research ethics committee from the University of Mohaghegh Ardabili (1395.10.20; decision date: 9 January 2017). All players were informed of the purpose of the study and then signed the informed consent. The study was carried out according to regulations on human studies in the Helsinki Declaration.

2.3. Sample Size

We calculated the design’s power and sample size using the G-Power software (University of Dusseldorf, Dusseldorf, Germany) [42] with the following parameters: post hoc; compute achieved power; F tests—ANOVA; fixed effects, omnibus, one-way; number of groups = 3; α err prob = 0.5, total sample size = 21 players, and based on the results of this study, it has been considered the median of the effect size of between-group differences in all dependent variables. The null hypothesis of no difference in variables in this study’s results has a 95.9% (i.e., power is 1-β err prob) likelihood of being appropriately rejected.

2.4. Monitoring External Load

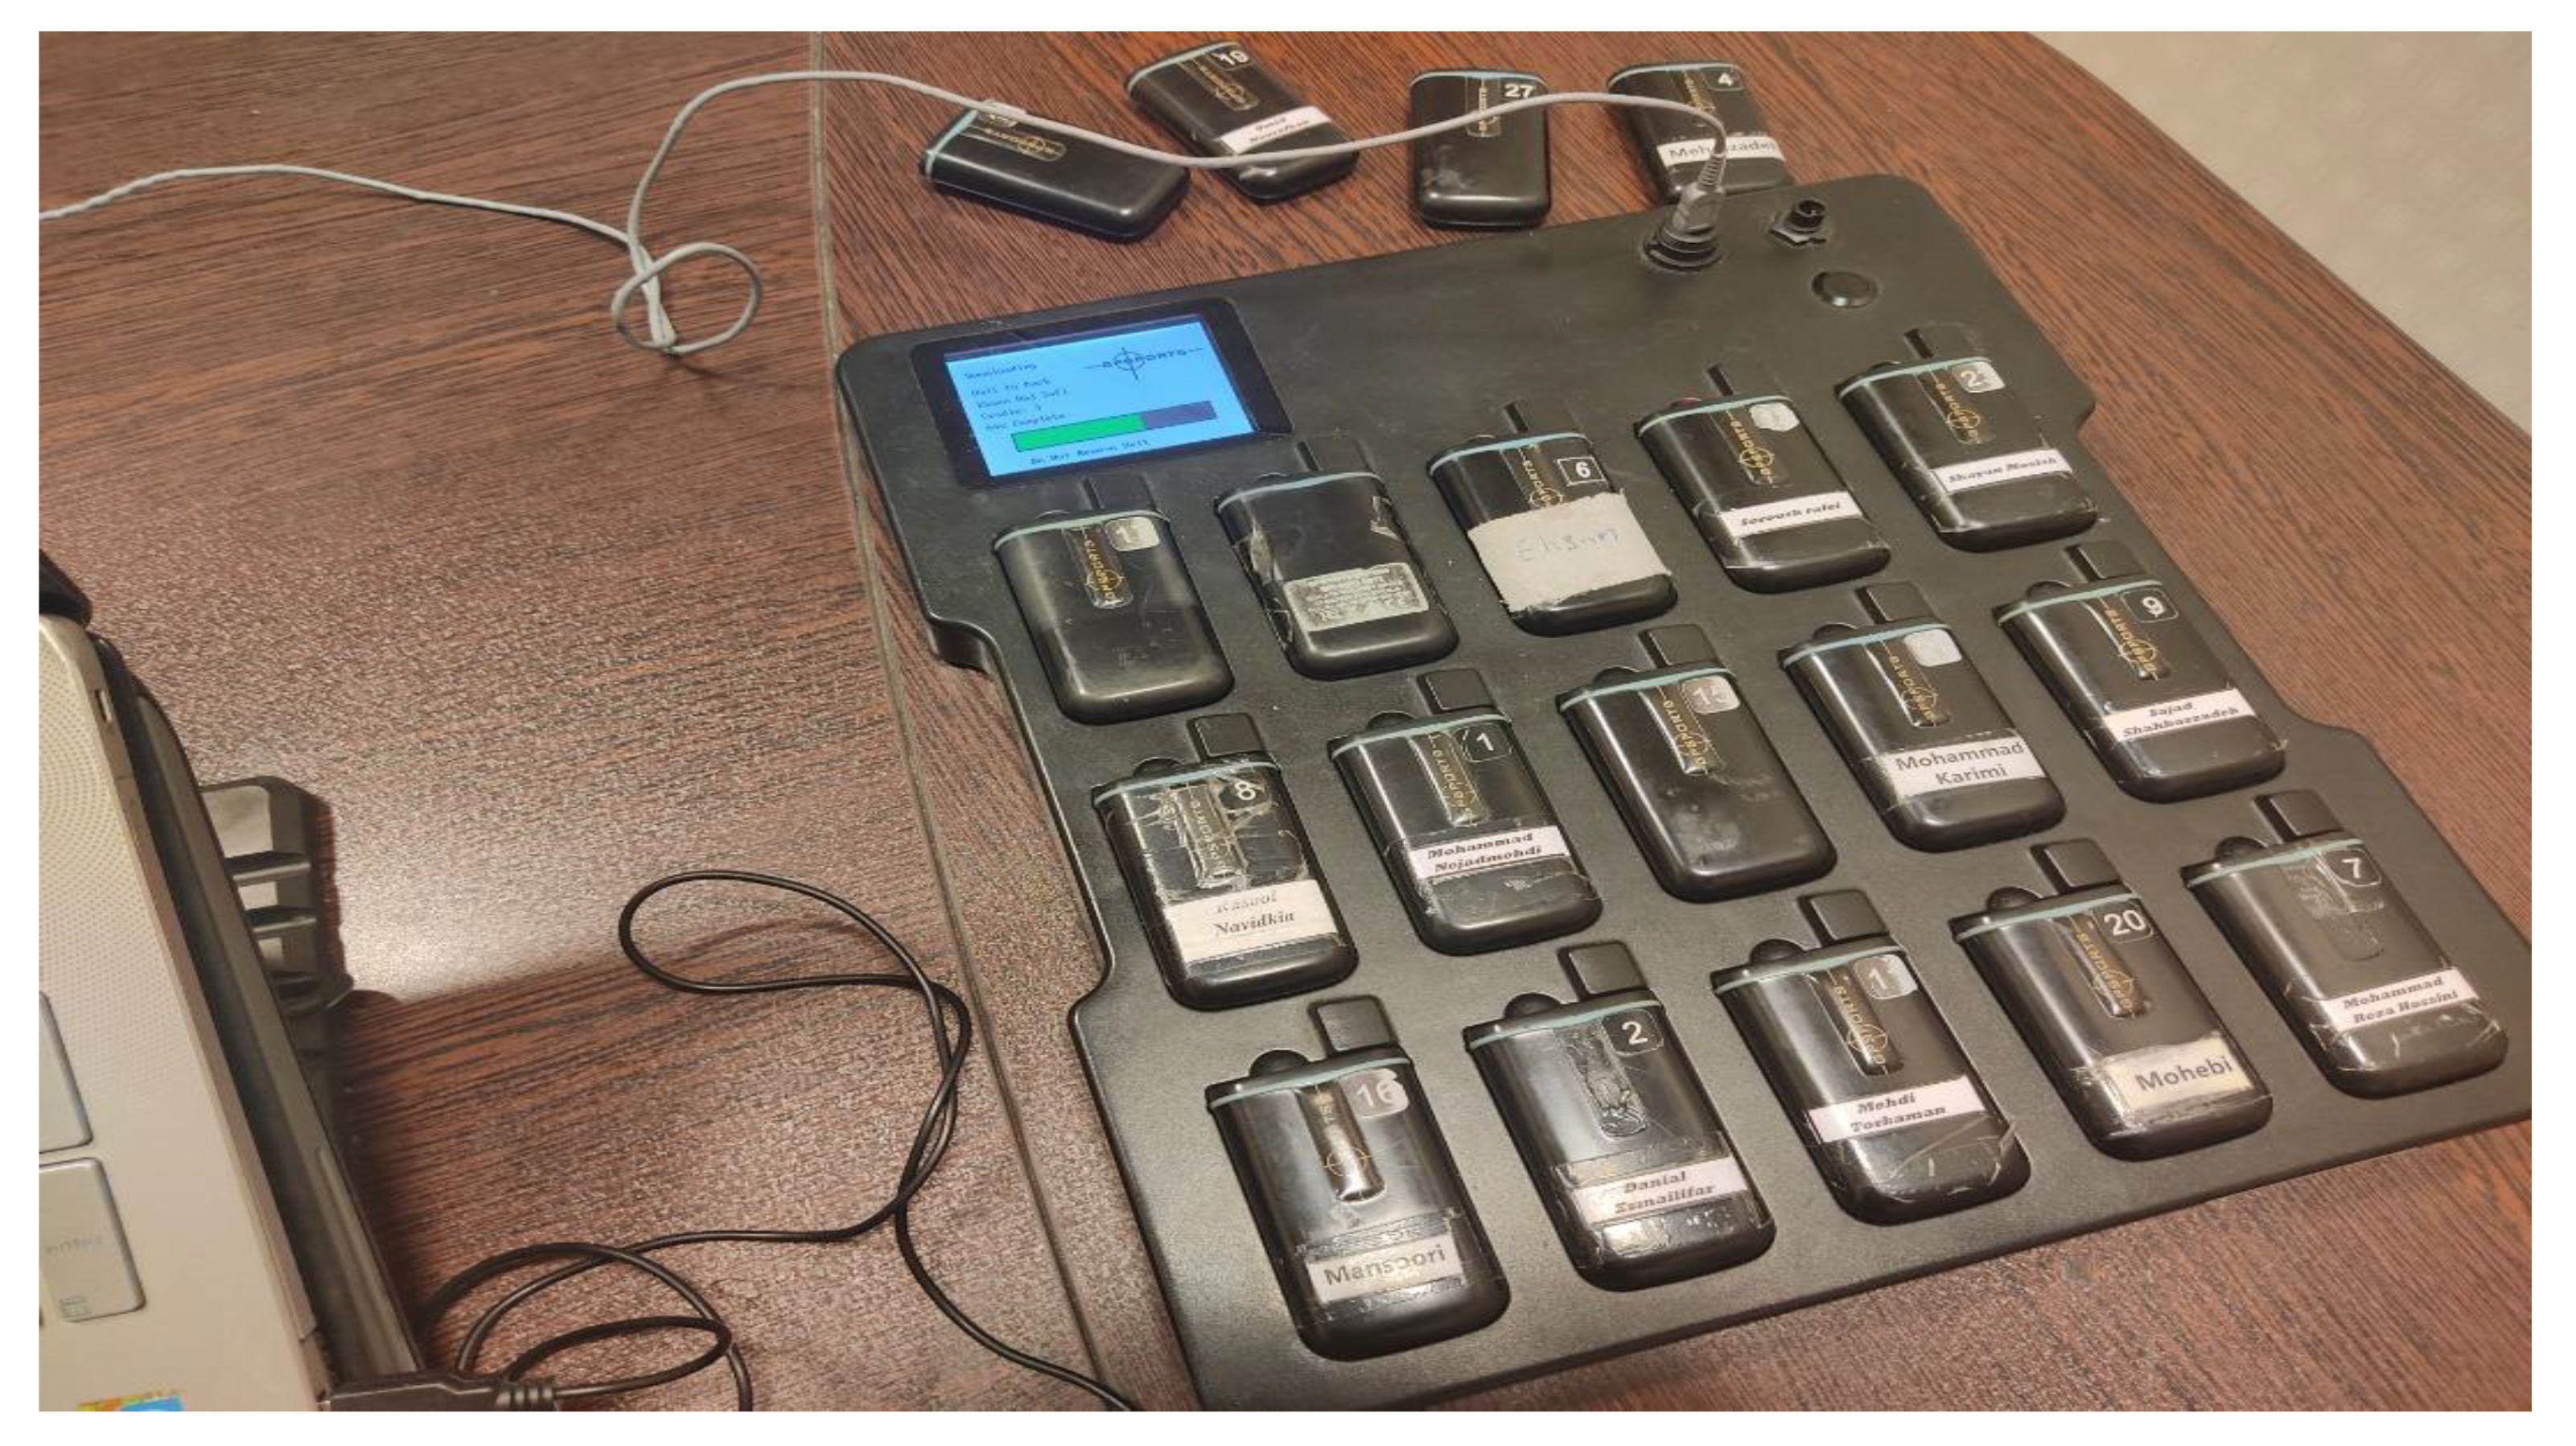
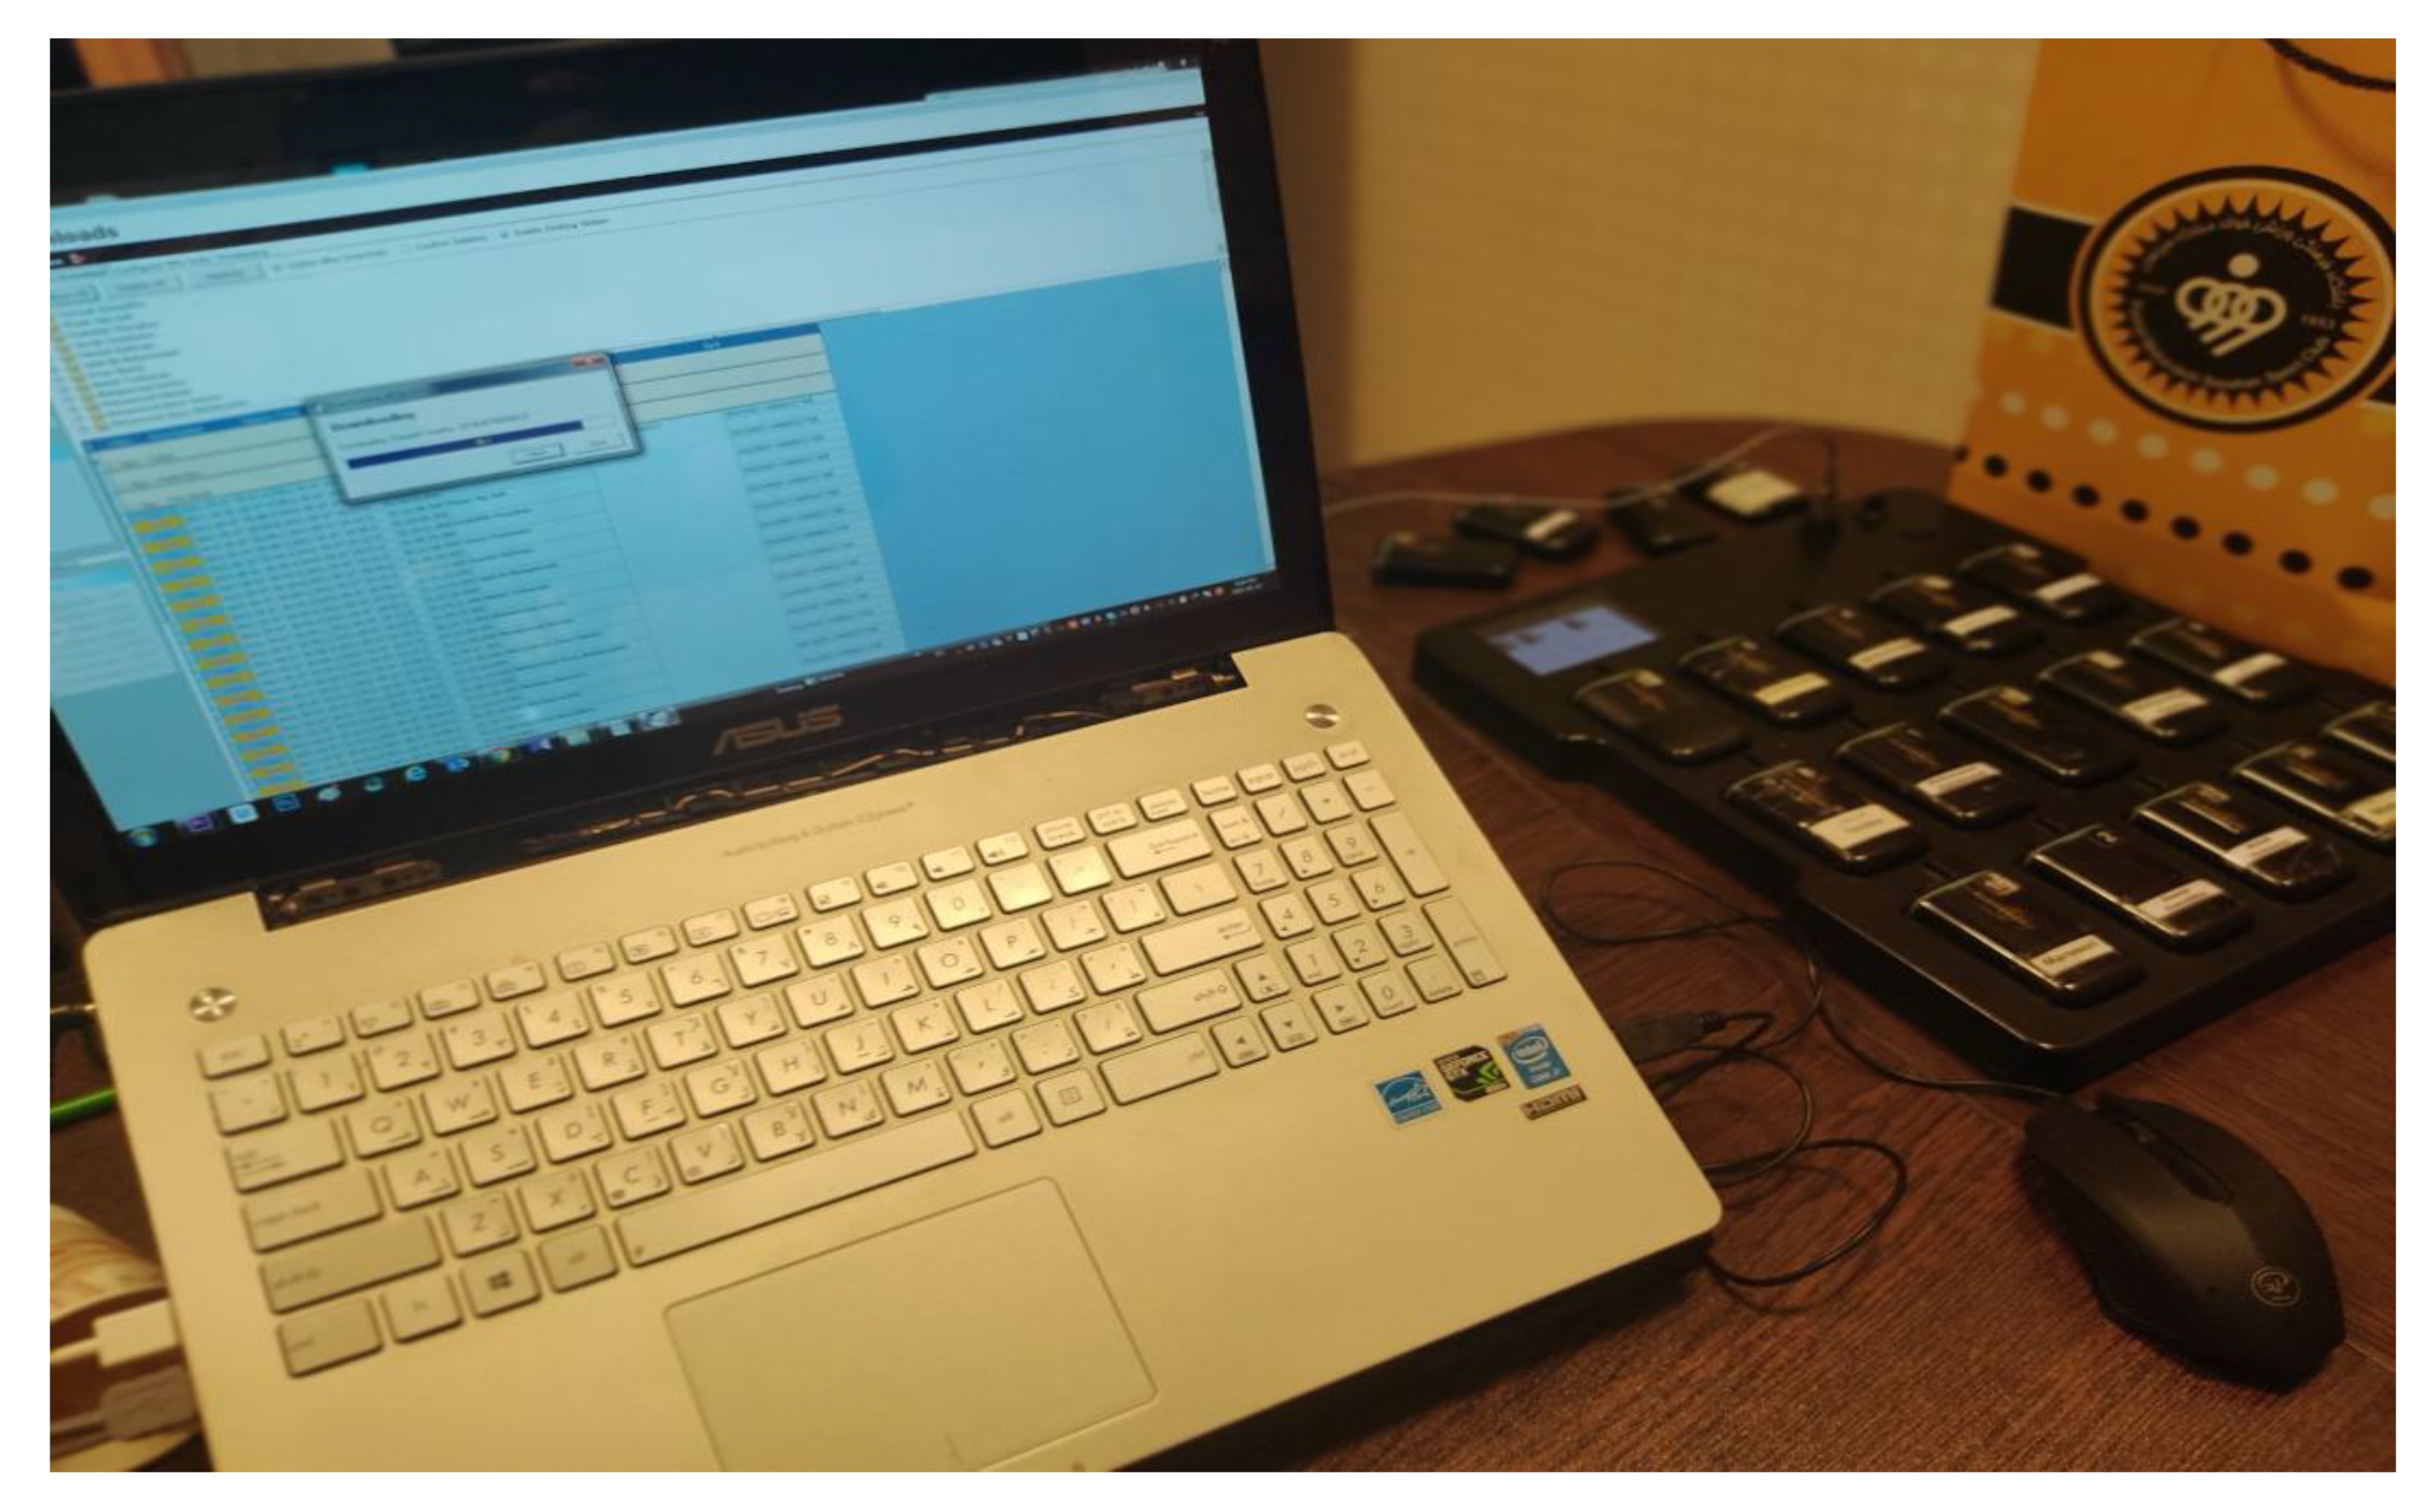
2.4.1. GPS Receiver Specifications

All players’ activities in training sessions and matches were recorded with GPS (GPSPORTS systems Pty Ltd., Canberra, Australia, Figure 1). GPS-based tracking systems for professional athletes, model SPI High Performance Unit (HPU), features include 15 Hz position GPS, distance, and speed measurement; accelerometer: 100 Hz, 16 G Tri-Axial-Track impacts, accelerations, and decelerations as well as data source BL; Mag: 50 Hz, Tri-Axial; dimensions: smallest device on the market (74 mm × 42 mm × 16 mm); robustness; SPI HPU and weight 56 g. Previous studies have shown that the GPS unit was tested for having a very high accuracy demonstrated validity and inter-unit reliability (coefficient of variation = 0.90%) [43,44,45,46]. Collecting data during training and matches sessions was possible provided favorable weather and GPS satellite status.

2.4.2. Data Collection by Wearable Inertial Measurement Unit

For the pre-session, we placed upright tracking units in the pouch of the belt and then checked that the green light (GPS tracking) and red light (heart-rate tracking) were flashing, based on previous studies [47,48,49,50] (Figure 2).
For the post-session, tracking units were collecting from players; after making sure each unit was working, we placed them on the docking station. Data units automatically were downloaded into docking memory and then deleted from units to prepare for the next session. After 10 min, units were turning off automatically (Figure 3).
The information collected by the units’ tracker was automatically entered into the portable computer by USB with the Team AMS (R1 2019.1). After turning on the portable computer, we selected “download as indoor”, then clicked “Download all”. Afterward, we put the clicking downloads all in Excel files. After this part, we removed all the data from the docking memory (Figure 4). In this study, the Default Zone in the SPI IQ Absolutes defined that the following variables were evaluated: (i) total distance in meters (TD); (ii) sprint total distance in meters (STD); (iii) high-speed running distance in meters (HSRd), (23–29 km·h−1); (iv) maximum speed (MaxSp; km·h−1); and (v) BL is calculated from the accelerometer data of GPSports devices, which are obtained from a tri-axis accelerometer (planes X,Y,Z) and are designed to reflect both the volume and intensity of accelerations performed by players. The following stages were performed in the BL calculation for each acceleration level: initialize the BL count to 0; calculate the magnitude of the acceleration vector (V) for the current acceleration (V = ax2 + ay2 + az2); and normalize the magnitude vector (NV) by subtracting a national 1 G (NV = V − 1.0 G). Following that, the unscaled BL (USBL) was calculated using the formula USBLC = NV + [NV3] [51]; after that, the scaled BL (SBLC) was computed using the accelerometer logging rate (100 HZ) and exercise factor (EF) (SBLC = USBLC/100/EF); finally, the final BL (BL = BL + SBLC) was determined [52]. BL had replaced the original GPSports. The BL variable also is an integrated loading variable and is used as a training load marker and work rate marker, as well as as a criterion for the training load. The final variables were (vi) number of repeated sprints (RS); (vii) ratio between HSRd/TD; and (viii) the ratio between STD/TD in the full season.

2.4.3. Training Load

In this study, BL was used as the criterion for the training load. For calculating training load parameters in order [51]:
  • Equation wAW= sum of BL was total sessions which held on per week [18,53];
  • Equation wCW= 0.333 × (wAW in the previous 3 weeks), which is based on the uncoupled formula; the CW was not computed for the first four weeks [54];
  • Equation ACWR= wAW/0.333 × (wAW in the previous 3 weeks), based on the uncoupled formula; the ACWR was not computed for the first four weeks [18,53];
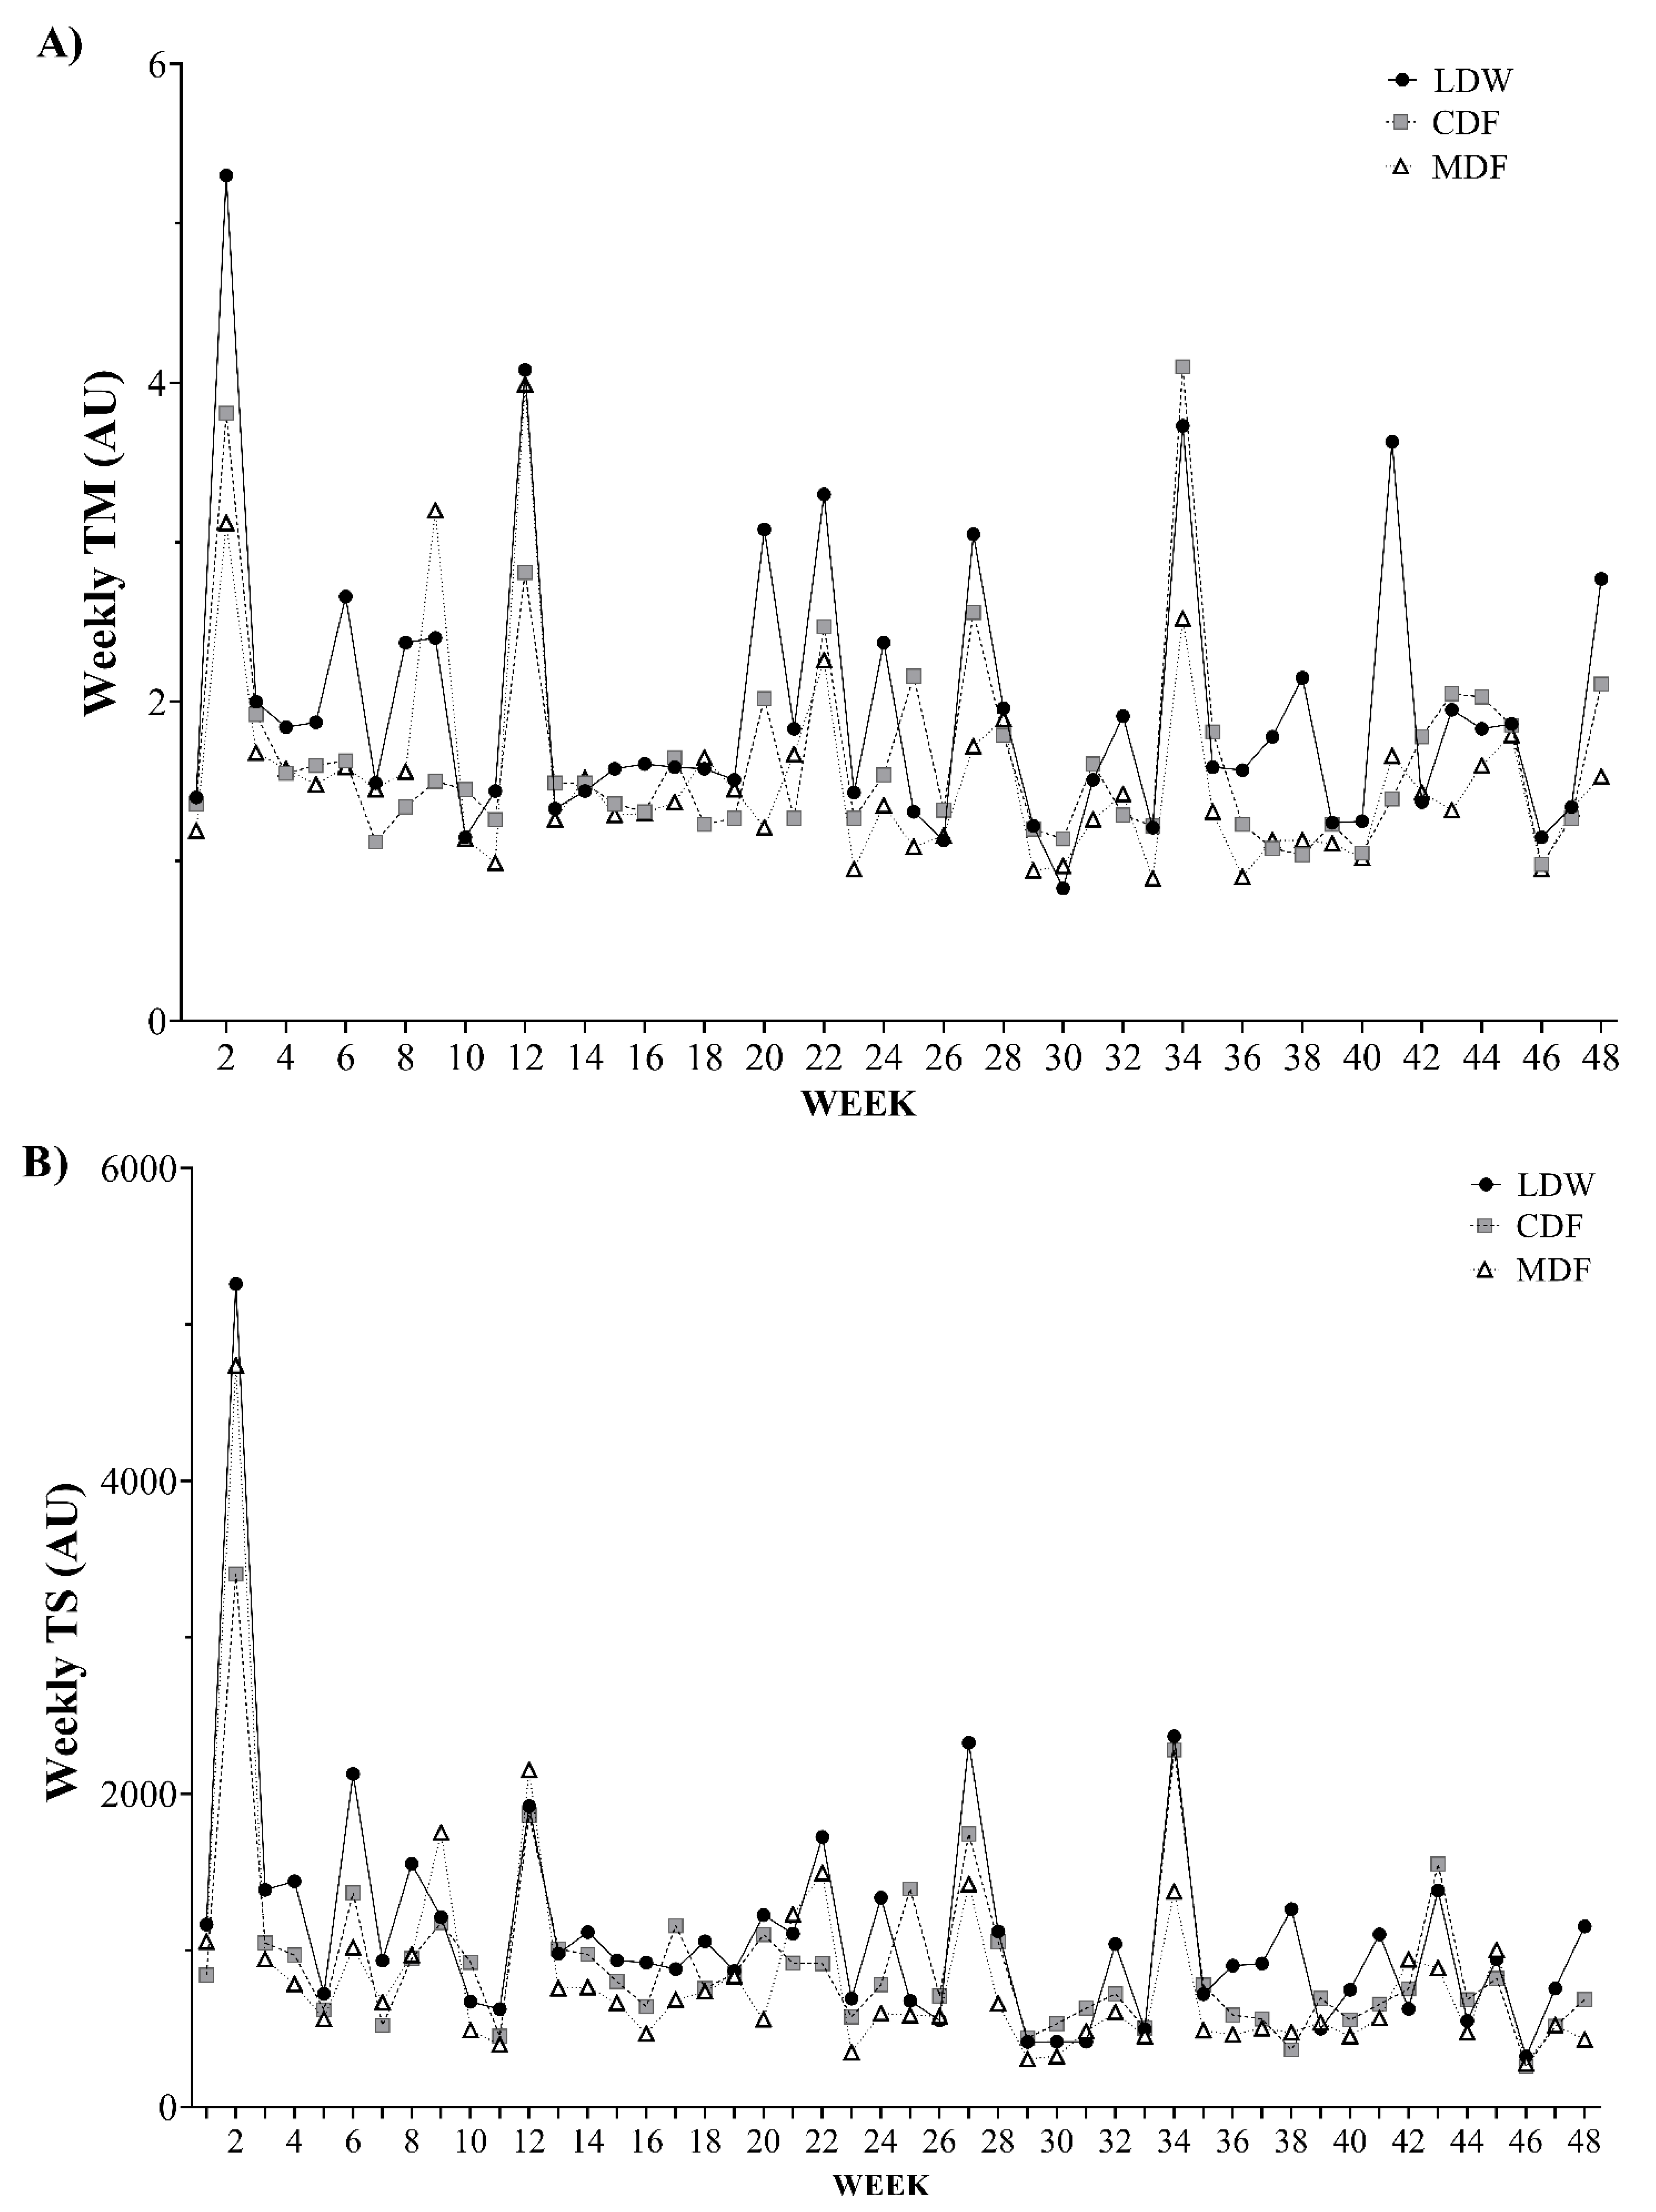
  • Equation wTM= average of wAW/standard deviation (SD), both in a similar week [55];
  • Equation wTS= wAW × wTM, both in a similar week [56];
  • Ultimately, for other distances and sprints variables, calculations were from the weekly in full season.

2.5. Statistical Analysis

Statistical procedures and computations were conducted using SPSS (version 25.0; IBM SPSS Inc, Chicago, IL, USA). Data are presented as mean and SD. The whole team coefficient of variation (CV) for every derived-GPS parameter was also calculated. Shapiro–Wilk and Levene’s tests were applied to check the normality and homogeneity of the data, respectively. Then, inferential tests were executed. One-way ANOVA was applied to analyse between-group differences in all dependent variables, followed by a Bonferroni post hoc test to determine differences and the p-value in the pairwise comparisons. Cohen’s d effect size (95% confidence interval) was also calculated using the SD. The Hopkins’ thresholds for the Cohen d effect size statistics were used as follows [57]: ≤0.2, trivial; >0.2, small; >0.6, moderate; >1.2, large; >2.0, very large; and >4.0, nearly perfect (21). Significant differences were considered for p ≤ 0.05.

3. Results

Table 1 displays the information of the weekly averages for all derived-GPS variables by playing position.
Figure 5 shows an overall vision of the wAW, wCW, and wACWR, variations across the full season by playing position. Overall, the highest wAW occurred in weeks 27, 9, and 5 for lateral defenders and wingers, central defenders and forwards, and midfielders, respectively. The lowest wAW happened in week 46 for the lateral defenders, wingers, and midfielders, while central defenders and forwards showed the lowest wAW in week 30 (Figure 5A). Concerning wCW, the highest outcomes were observed in weeks 30, 11, and 6 for lateral defenders and wingers, central defenders and forwards, and midfielders, respectively. The lowest wCW were found in weeks 42, 48, and 26 for lateral defenders and wingers, central defenders and forwards, and midfielders, respectively (Figure 5B). Besides, the highest wACWR happened in weeks 27, 22, and 5 for lateral defenders and wingers, central defenders and forwards, and midfielders, respectively. Coincidentally, all player groups showed the lowest wACWR in week 30 (Figure 5C).
Figure 6 displays an overall vision of the wTM and wTS variations across the full season by play position. The highest wTM occurred in weeks 2, 34, and 12 for lateral defenders and wingers, central defenders and forwards, and midfielders, respectively, while the lowest wTM were observed in weeks 29, 30, and 11 for lateral defenders and wingers, central defenders and forwards, and midfielders, respectively (Figure 6A). Coincidentally, the highest wTS happened in week 2 for all player groups. Moreover, the lowest wTS were observed in week 46 for lateral defenders, wingers, central defenders, and forwards, while midfielders showed the lowest wTS in week 29 (Figure 6B).
Between-group comparisons on wAW, wCW, wACWR, wTM, and wTS for the full season were displays in Table 2. These comparisons were conducted using the full season average for every dependent variable, which was calculated from the weekly average of each one. No significant differences in any variables were found when compare the different player groups.
Table 3 shows the between-group comparisons for the full season average derived-GPS variables of distance and sprints, calculated from the weekly average of them. Results revealed small to very largely significantly higher wSTDs in lateral defenders and wingers compared to central defenders and forwards (p = 0.009; d = 1.63) and midfielders (p = 0.034; d = 1.55). Similar findings were found in wHSRd comparing lateral defenders and wingers with central defenders and forwards (p = 0.016; d = 1.48) and midfielders (p = 0.011; d = 1.77). Lateral defenders and wingers also showed small to very largely significantly higher wRSs compared to central defenders and forwards (p = 0.021; d = 1.47). Moreover, small to very largely significantly higher wSTD/wTDs and wHSRd/wTDs were observed in lateral defenders and wingers compared to central defenders and forwards (wSTD/wTD: p = 0.017; d = 1.76; wHSRd/wTD: p = 0.014; d = 1.61). Similarly, lateral defenders and wingers also showed small to very largely significantly greater wSTD/wTDs (p = 0.046; d = 1.79), but trivial to very large significant higher wHSRd/wTDs compared to midfielders (p = 0.008; d = 1.21). No significant differences were observed in any derived GPS variable when compared central defenders’ forwards and midfielders, neither for wTD nor wMaxSp in pairwise comparisons.

4. Discussion

This study aimed to describe the external load variations according to playing positions over the season and to compare these metrics across playing positions. The main results were (i) no significant differences were found in wAW, wCW, wACWR, wTM, and wTs between playing positions; and (ii) higher values of wSTD, wHSRd, wRS, wSTD/sTD, and wHSRd/wTD were observed in LDW compared to CDF and MDF positions. Overall, and apart from short-term and even large variations, wAW and CW showed a marked decrease pattern over the season (Figure 4), whereas the other metrics (wACWR, wTM, and wTS) remained rather constant (Figure 4 and Figure 5).
The current findings showed variations of acute and chronic load over the season. Previous studies demonstrated similar training loads during the pre- and in-season periods [10,58,59]. However, similar studies observed higher workloads in the first- compared to the end-season mesocycles [58]. The possible explanation of these differences can be attributed to high physical training volume during the pre-season and high technical-tactical training volume during the in-season [7,59]. There are also two other important considerations in analyzing the performance of athletes with micro-technology sensors. The type of equipment used inside the practice setting, such as Wearable Inertial Measurement Units or Electronic Performance Tracking Systems, as well as these analyses, was only to discuss the performance abilities of athletes and does not consider the tactical demands, which can help to better understand the potential differences within variables between training and competition. Additionally, 7 weeks were congested in this study (i.e., two or more matches within 7 days). A previous study showed that most sessions during the congested fixture are dedicated to players’ recovery, reducing the training load [60].
Regarding load variations, we found the highest values of wAW and wACWR for LDW (week 27), CDF (week 9), and MDF (week 5). In contrast, we verified the lowest values of wACRW during week 30 for all positions (i.e., recovery week during the team’s half-season training camp in Turkey for the start of league competitions from week 31). This week saw a reduction of training volume (i.e., week 30) in the team’s half-season training camp in Turkey for recovery and the start of competitions of the league in the next week. Additionally, we observed the highest wTM in weeks 2, 34, and 12 for LDW, CDF, and MDF, respectively. Simultaneously, the highest wTS occurred in week 2 for all positions. Our results are in line with previous research, showing high within- and between-week variability in professional soccer [61]. Therefore, to optimal load management, coaches and practitioners should prescribe loads (respecting the interval recovery) to enhance physical fitness [62,63].
Despite ACWR having been questioned as a predictor of injury [29] due to the lack of evidence to support its use in reducing injury risk while controlling training loads, there is no doubt about the need of knowing training load progression and variations throughout time. Interestingly, training heterogeneity could contribute to differences between playing positions and the variation of ACWR along the season since ACWR measures sensitivity to distinct periods (i.e., congested or normal ones). Naturally, those variations and differences may depend on the derived-GPS parameter considered. This idea is supported by the outcomes presented into this manuscript that show coefficients of variations from 15 to 37% in the different derived-GPS parameters assessed, being especially higher for parameters referred to the high-intensity efforts or actions performed by players. It is well-known that high-intensity demands differ between playing positions.
Curiously, we did not verify differences for the wAW, wCW, wTM, and wTS based on the BL metric between playing positions. In contrast, a previous study reported greater values of wAW and BL for the defenders (124.1 ± 114.1 AU), midfielders (153.9 ± 125.4 AU), and forwards (107.5 ± 60.3 AU) compared to our results [63]. The contrasting findings can be explained by the different training tasks applied over the season [8]. Further studies, including the training content, are warranted to clarify the workload doses throughout the season, which will enable future comparisons between studies [64,65].
Here, wTD did not differ between playing positions over the season. We found lower values of wTD (3.842 m–3.587 m; Table 3) compared to previous studies that reported values of wTD of ~4.500 m in Spain [22], ~5.000 m in the Netherlands, and ~7.000 m in Portugal [66]. The possible explanation of the divergent results can be related to the playing styles, coachs’ decisions for designing drills, and competition demands across leagues [67]. In addition, our results revealed greater values of wSTD, wHSRd, ratio STD/TD, and HSRd/TD for LDW compared to CDF and MDF. Martín-García, Gómez Díaz, Bradley, Morera, and Casamichana [22] also observed that wide positional roles presented significant high-speed and sprint activities during the training and match sessions. These specific positional physical demands may be related to the constant attack and defensive functions during the training sessions as well as match-play [58]. Therefore, coaches must be aware of the weekly workload demands for each playing position when prescribing training microcycles over the season. This study provided ranges of values for different external load variables for each positional role that can be used as a reference for other teams (see Table 1 and Table 2).
This study has some limitations that should be acknowledged. First, the described external load variables were followed in one reference team. Second, there is a lack of information in the present study regarding internal load metrics (e.g., heart rate). Therefore, further studies should analyze the external and internal load for each positional role in multiple teams and seasons in professional soccer. Third, other interpretations regarding the status of the players could provide a deeper analysis (e.g., training load for starters (players who start playing the matches) and non-starters (substitute players)). Finally, sample size could be further increased to power all metrics’ investigations more homogenously. However, this study presented some strengths. We complement previous studies for in-depth knowledge of the distance- and accelerometry-based variations over a full season. Additionally, we have advanced in showing the external load demands for each playing position in professional soccer. However, the lack of access to the type of training session during the season can be another limitation for the present study, so we strongly recommend that this be considered in future studies.
We argue that this can be future research, in which training load is organized based on the type of exercises, and it would be possible to compare the impact of training design on the ultimate load imposed.

5. Conclusions

We describe the weekly variations of training load by players’ positions over the season in professional soccer players. In general, the findings demonstrated no differences values of wAW, wCW, wACWR, wTM, and wTS based on BL between the LDW, CDF, and MDF positions. In contrast, the LDW position presented higher wSTD, wHSRd, wRS, wSTD/wTD, and wHRSd/wTD compared to the CDF and MDF positions. According to Buchheit and Simpson [68,69], accelerometer/inertial sensor metrics (viz., “level 3” ones) provide more sensitivity to external load variables but not information on tactical demand. Therefore, coaches and practitioners should be attentive to the investigated specific external load demands here to prescribe more representative training tasks for each positional role over the season, but preferably when considering standardized drills and/or small-sided games rather than regular matches. Moreover, as practical implications, coaches should consider that some measures may be more sensitive than others to training plan variations, and this was found considering measures such as BL. Perhaps coaches should consider identifying different measures, the impact of training specificities, and also playing positions that can be more or less sensitive to some variables related to typical demands.

Author Contributions

Conceptualization, H.N. and F.M.C.; methodology, H.N., F.M.C., M.R., J.C.-V., B.P. and J.P.-G.; formal analysis, H.N. and F.M.C.; investigation, H.N., B.P. and F.M.C.; writing—original draft preparation, H.N., F.M.C., L.G.G. and R.A.; writing—review and editing, H.N., F.M.C., L.G.G., L.P.A. and B.P.; supervision, L.P.A. and B.P. All authors have read and agreed to the published version of the manuscript.

Funding

This work is funded by Fundação para a Ciência e Tecnologia/ Ministério da Ciência, Tecnologia e Ensino Superior through national funds and when applicable co-funded EU funds under the project UIDB/50008/2020.

Institutional Review Board Statement

This research was conducted by the training coaches of the club after setting with the relevant authorities and the head coach in the club. Prior to commencing the study, it also received the approval of the research ethics committee from the University of Mohaghegh Ardabili (1395.10.20; decision date: 9 January 2017). All players were informed of the purpose of the study and then signed the informed consent. The study was carried out according to regulations on human studies in the Helsinki Declaration.

Informed Consent Statement

Informed consent was obtained from all subjects involved in the study.

Data Availability Statement

Data will be available through the corresponding authors: hadi.nobari1@gmail.com (Hadi Nobari) and jorge.carlosvivas@gmail.com (Jorge Carlos-Vivas).

Conflicts of Interest

The authors declare no conflict of interest.

References

  1. Jaspers, A.; Brink, M.S.; Probst, S.G.M.; Frencken, W.G.P.; Helsen, W.F. Relationships Between Training Load Indicators and Training Outcomes in Professional Soccer. Sports Med. 2017, 47, 533–544. [Google Scholar] [CrossRef]
  2. Ryan, S.; Pacecca, E.; Tebble, J.; Hocking, J.; Kempton, T.; Coutts, A.J. Measurement Characteristics of Athlete Monitoring Tools in Professional Australian Football. Int. J. Sports Physiol. Perform. 2019, 15, 457–463. [Google Scholar] [CrossRef] [PubMed]
  3. Impellizzeri, F.M.; Marcora, S.M.; Coutts, A.J. Internal and External Training Load: 15 Years On. Int. J. Sports Physiol. Perform. 2019, 14, 270–273. [Google Scholar] [CrossRef] [PubMed]
  4. Akenhead, R.; Nassis, G.P. Training load and player monitoring in high-level football: Current practice and perceptions. Int. J. Sports Physiol. Perform. 2016, 11, 587–593. [Google Scholar] [CrossRef] [PubMed]
  5. Weston, M. Training load monitoring in elite English soccer: A comparison of practices and perceptions between coaches and practitioners. Sci. Med. Footb. 2018, 2, 216–224. [Google Scholar] [CrossRef]
  6. Rabbani, A.; Baseri, M.K.; Reisi, J.; Clemente, F.M.; Kargarfard, M. Monitoring collegiate soccer players during a congested match schedule: {Heart} rate variability versus subjective wellness measures. Physiol. Behav. 2018, 194, 527–531. [Google Scholar] [CrossRef] [PubMed]
  7. Los Arcos, A.; Mendez-Villanueva, A.; Martínez-Santos, R. In-season training periodization of professional soccer players. Biol. Sport 2017, 34, 149–155. [Google Scholar] [CrossRef]
  8. Sarmento, H.; Clemente, F.M.; Harper, L.D.; Costa IT, D.; Owen, A.; Figueiredo, A.J. Small sided games in soccer—A systematic review. Int. J. Perform. Anal. Sport 2018, 18, 693–749. [Google Scholar] [CrossRef]
  9. Lago-Peñas, C. The role of situational variables in analysing physical performance in soccer. J. Hum. Kinet. 2012, 35, 89–95. [Google Scholar] [CrossRef]
  10. Clemente, F.M.; Silva, R.; Castillo, D.; Los Arcos, A.; Mendes, B.; Afonso, J. Weekly Load Variations of Distance-Based Variables in Professional Soccer Players: A Full-Season Study. Int. J. Environ. Res. Public Health 2020, 17, 3300. [Google Scholar] [CrossRef]
  11. Moura, F.A.; Santana, J.E.; Vieira, N.A.; Santiago, P.R.P.; Cunha, S.A. Analysis of Soccer Players’ Positional Variability during the 2012 UEFA European Championship: A Case Study. J. Hum. Kinet. 2015, 47, 225–236. [Google Scholar] [CrossRef] [Green Version]
  12. Nikolaidis, P.; Ziv, G.; Lidor, R.; Arnon, M. Inter-individual variability in soccer players of different age groups playing different positions. J. Hum. Kinet. 2014, 40, 213–225. [Google Scholar] [CrossRef] [Green Version]
  13. Nobari, H.; Fani, M.; Pardos-Mainer, E.; Pérez-Gómez, J. Fluctuations in Well-Being Based on Position in Elite Young Soccer Players during a Full Season. Healthcare 2021, 9, 586. [Google Scholar] [CrossRef]
  14. Sedeaud, A.; De Larochelambert, Q.; Moussa, I.; Brasse, D.; Berrou, J.M.; Duncombe, S.; Antero, J.; Orhant, E.; Carling, C.; Toussaint, J.F.; et al. In-Season Internal and External Workload Variations between Starters and Non-Starters—A Case Study of a Top Elite European Soccer Team. Medicina 2020, 57, 645. [Google Scholar] [CrossRef]
  15. Nobari, H.; Praça, G.M.; Clemente, F.M.; Pérez-Gómez, J.; Carlos Vivas, J.; Ahmadi, M. Comparisons of new body load and metabolic power average workload indices between starters and non-starters: A full-season study in professional soccer players. Proc. Inst. Mech. Eng. Part P J. Sport. Eng. Technol. 2021, 235, 105–113. [Google Scholar] [CrossRef]
  16. Oliveira, R.; Martins, A.; Nobari, H.; Nalha, M.; Mendes, B.; Clemente, F.M.; Brito, J.P. In-season monotony, strain and acute/chronic workload of perceived exertion, global positioning system running based variables between player positions of a top elite soccer team. BMC Sports Sci. Med. Rehabil. 2021, 13, 126. [Google Scholar] [CrossRef] [PubMed]
  17. Nobari, H.; Cholewa, J.M.; Pérez-Gómez, J.; Castillo-Rodríguez, A. Effects of 14-weeks betaine supplementation on pro-inflammatory cytokines and hematology status in professional youth soccer players during a competition season: A double blind, randomized, placebo-controlled trial. J. Int. Soc. Sports Nutr. 2021, 18, 42. [Google Scholar] [CrossRef]
  18. Nobari, H.; Kargarfard, M.; Minasian, V.; Cholewa, J.M.; Pérez-Gómez, J. The effects of 14-week betaine supplementation on endocrine markers, body composition and anthropometrics in professional youth soccer players: A double blind, randomized, placebo-controlled trial. J. Int. Soc. Sports Nutr. 2021, 18, 20. [Google Scholar] [CrossRef]
  19. Nobari, H.; Vahabidelshad, R.; Pérez-Gómez, J.; Ardigò, L.P. Variations of Training Workload in Micro- and Meso-Cycles Based on Position in Elite Young Soccer Players: A Competition Season Study. Front. Physiol. 2021, 12, 529. [Google Scholar] [CrossRef]
  20. Di Salvo, V.; Gregson, W.; Atkinson, G.; Tordoff, P.; Drust, B. Analysis of high intensity activity in premier league soccer. Int. J. Sports Med. 2009, 30, 205–212. [Google Scholar] [CrossRef]
  21. Di Salvo, V.; Baron, R.; Tschan, H.; Montero, F.J.C.; Bachl, N.; Pigozzi, F. Performance characteristics according to playing position in elite soccer. Int. J. Sports Med. 2007, 28, 222–227. [Google Scholar] [CrossRef]
  22. Clemente, F.M.; Martinho, R.; Calvete, F.; Mendes, B. Training load and well-being status variations of elite futsal players across a full season: {Comparisons} between normal and congested weeks. Physiol. Behav. 2019, 201, 123–129. [Google Scholar] [CrossRef]
  23. Martín-García, A.; Gómez Díaz, A.; Bradley, P.S.; Morera, F.; Casamichana, D. Quantification of a Professional Football Team’s External Load Using a Microcycle Structure. J. Strength Cond. Res. 2018, 32, 3511–3518. [Google Scholar] [CrossRef] [Green Version]
  24. McCall, A.; Dupont, G.; Ekstrand, J. Internal workload and non-contact injury: A one-season study of five teams from the UEFA Elite Club Injury Study. Br. J. Sports Med. 2018, 52, 1517–1522. [Google Scholar] [CrossRef]
  25. Stevens, T.G.A.; de Ruiter, C.J.; Twisk, J.W.R.; Savelsbergh, G.J.P.; Beek, P.J. Quantification of in-season training load relative to match load in professional Dutch Eredivisie football players. Sci. Med. Footb. 2017, 1, 117–125. [Google Scholar] [CrossRef]
  26. LQT Aquino, R.; Cruz Gonçalves, L.G.; Palucci Vieira, L.H.; Oliveira, L.P.; Alves, G.F.; Pereira Santiago, P.R.; Puggina, E.F. Periodization Training Focused on Technical-Tactical Ability in Young Soccer Players Positively Affects Biochemical Markers and Game Performance. J. Strength Cond. Res. 2016, 30, 2723–2732. [Google Scholar] [CrossRef]
  27. Malone, S.; Roe, M.; Doran, D.A.; Gabbett, T.J.; Collins, K.D. Protection Against Spikes in Workload With Aerobic Fitness and Playing Experience: The Role of the Acute:Chronic Workload Ratio on Injury Risk in Elite Gaelic Football. Int. J. Sports Physiol. Perform. 2017, 12, 393–401. [Google Scholar] [CrossRef] [Green Version]
  28. Clemente, F.M.; Clark, C.; Castillo, D.; Sarmento, H.; Nikolaidis, P.T.; Rosemann, T.; Knechtle, B. Variations of training load, monotony, and strain and dose-response relationships with maximal aerobic speed, maximal oxygen uptake, and isokinetic strength in professional soccer players. PLoS ONE 2019, 14, e0225522. [Google Scholar] [CrossRef] [Green Version]
  29. Delecroix, B.; Mccall, A.; Dawson, B.; Berthoin, S.; Dupont, G. Workload monotony, strain and non-contact injury incidence in professional football players. Sci. Med. Footb. 2019, 3, 105–108. [Google Scholar] [CrossRef]
  30. Impellizzeri, F.M.; Tenan, M.S.; Kempton, T.; Novak, A.; Coutts, A.J. Acute:Chronic Workload Ratio: Conceptual Issues and Fundamental Pitfalls. Int. J. Sports Physiol. Perform. 2020, 15, 907–913. [Google Scholar] [CrossRef]
  31. Impellizzeri, F.M.; Woodcock, S.; Coutts, A.J.; Fanchini, M.; McCall, A.; Vigotsky, A.D. What Role Do Chronic Workloads Play in the Acute to Chronic Workload Ratio? Time to Dismiss ACWR and Its Underlying Theory. Sport. Med. 2021, 51, 581–592. [Google Scholar] [CrossRef]
  32. Andrade, R.; Wik, E.H.; Rebelo-Marques, A.; Blanch, P.; Whiteley, R.; Espregueira-Mendes, J.; Gabbett, T.J. Is the Acute: Chronic Workload Ratio (ACWR) Associated with Risk of Time-Loss Injury in Professional Team Sports? A Systematic Review of Methodology, Variables and Injury Risk in Practical Situations. Sports Med. 2020, 50, 1613–1635. [Google Scholar] [CrossRef]
  33. Renfree, A.; Casado, A.; McLaren, S. Re-thinking athlete training loads: Would you rather have one big rock or lots of little rocks dropped on your foot? Res. Sports Med. 2021, 1–4. [Google Scholar] [CrossRef]
  34. Vanrenterghem, J.; Nedergaard, N.J.; Robinson, M.A.; Drust, B. Training Load Monitoring in Team Sports: A Novel Framework Separating Physiological and Biomechanical Load-Adaptation Pathways. Sports Med. 2017, 47, 2135–2142. [Google Scholar] [CrossRef]
  35. Barrett, S.; Midgley, A.W.; Towlson, C.; Garrett, A.; Portas, M.; Lovell, R. Within-Match PlayerLoadTM Patterns During a Simulated Soccer Match: Potential Implications for Unit Positioning and Fatigue Management. Int. J. Sports Physiol. Perform. 2016, 11, 135–140. [Google Scholar] [CrossRef]
  36. Coutts, A.J.; Duffield, R. Validity and reliability of GPS devices for measuring movement demands of team sports. J. Sci. Med. Sport 2010, 13, 133–135. [Google Scholar] [CrossRef]
  37. Cummins, C.; Orr, R.; O’Connor, H.; West, C. Global positioning systems ({GPS}) and microtechnology sensors in team sports: A systematic review. Sports Med. 2013, 43, 1025–1042. [Google Scholar] [CrossRef]
  38. Dalen, T.; Ingebrigtsen, J.; Ettema, G.; Hjelde, G.H.; Wisløff, U. Player Load, Acceleration, and Deceleration During Forty-Five Competitive Matches of Elite Soccer. J. Strength Cond. Res. 2016, 30, 351–359. [Google Scholar] [CrossRef]
  39. Dellaserra, C.L.; Gao, Y.; Ransdell, L. Use of integrated technology in team sports: A review of opportunities, challenges, and future directions for athletes. J. Strength Cond. Res. 2014, 28, 556–573. [Google Scholar] [CrossRef]
  40. Nobari, H.; Khalili, S.M.; Oliveira, R.; Castillo-Rodríguez, A.; Pérez-Gómez, J.; Ardigò, L.P. Comparison of Official and Friendly Matches through Acceleration, Deceleration and Metabolic Power Measures: A Full-Season Study in Professional Soccer Players. Int. J. Environ. Res. Public Health 2021, 18, 5980. [Google Scholar] [CrossRef]
  41. Nobari, H.; Aquino, R.; Clemente, F.M.; Khalafi, M.; Adsuar, J.C.; Pérez-Gómez, J. Description of acute and chronic load, training monotony and strain over a season and its relationships with well-being status: A study in elite under-16 soccer players. Physiol. Behav. 2020, 225, 113117. [Google Scholar] [CrossRef]
  42. Abbott, W.; Brickley, G.; Smeeton, N.J. Physical demands of playing position within {English} {Premier} {League} academy soccer. J. Hum. Sport Exerc. 2018, 13, 285–295. [Google Scholar] [CrossRef]
  43. Faul, F.; Erdfelder, E.; Lang, A.G.; Buchner, A. G*Power 3: A flexible statistical power analysis program for the social, behavioral, and biomedical sciences. In Proceedings of the Behavior Research Methods; Psychonomic Society Inc.: Bethesda, MD, USA, 2007; Volume 39, pp. 175–191. [Google Scholar]
  44. Scott, M.T.U.; Scott, T.J.; Kelly, V.G. The Validity and Reliability of Global Positioning Systems in Team Sport. J. Strength Cond. Res. 2016, 30, 1470–1490. [Google Scholar] [CrossRef] [PubMed]
  45. Akenhead, R.; French, D.; Thompson, K.G.; Hayes, P.R. The acceleration dependent validity and reliability of 10Hz GPS. J. Sci. Med. Sport 2014, 17, 562–566. [Google Scholar] [CrossRef] [PubMed]
  46. Tessaro, E.; Williams, J. Validity and reliability of a 15 Hz GPS device for court-based sports movements—Sport performance & science reports. Sport Perform. Sci. Rep. 2018, 1, 1–4. [Google Scholar]
  47. Nikolaidis, P.T.; Clemente, F.M.; van der Linden, C.M.I.; Rosemann, T.; Knechtle, B. Validity and reliability of 10-Hz global positioning system to assess in-line movement and change of direction. Front. Physiol. 2018, 9, 228. [Google Scholar] [CrossRef] [Green Version]
  48. Nobari, H.; Oliveira, R.; Clemente, F.M.; Adsuar, J.C.; Pérez-Gómez, J.; Carlos-Vivas, J.; Brito, J.P. Comparisons of accelerometer variables training monotony and strain of starters and non-starters: A full-season study in professional soccer players. Int. J. Environ. Res. Public Health 2020, 17, 6547. [Google Scholar] [CrossRef]
  49. Clemente, F.M.; Silva, R.; Chen, Y.S.; Aquino, R.; Praça, G.M.; Paulis, J.C.; Nobari, H.; Mendes, B.; Rosemann, T.; Knechtle, B. Accelerometry-workload indices concerning different levels of participation during congested fixture periods in professional soccer: A pilot study conducted over a full season. Int. J. Environ. Res. Public Health 2021, 18, 1137. [Google Scholar] [CrossRef]
  50. Nobari, H.; Castillo, D.; Clemente, F.M.; Carlos-Vivas, J.; Pérez-Gómez, J. Acute, chronic and acute/chronic ratio between starters and non-starters professional soccer players across a competitive season. Proc. Inst. Mech. Eng. Part P J. Sport. Eng. Technol. 2021, 17543371211016594. [Google Scholar] [CrossRef]
  51. Nobari, H.; Mainer-Pardos, E.; Zamorano, A.D.; Bowman, T.G.; Clemente, F.M.; Pérez-Gómez, J. Sprint Variables Are Associated with the Odds Ratios of Non-Contact Injuries in Professional Soccer Players. Int. J. Environ. Res. Public Health 2021, 18, 10417. [Google Scholar] [CrossRef]
  52. Nobari, H.; Banoocy, N.K.; Oliveira, R.; Pérez-Gómez, J. Win, Draw, or Lose? Global Positioning System-Based Variables’ Effect on the Match Outcome: A Full-Season Study on an Iranian Professional Soccer Team. Sensors 2021, 21, 5695. [Google Scholar] [CrossRef]
  53. Nobari, H.; Silva, R.; Clemente, F.M.; Akyildiz, Z.; Ardigò, L.P.; Pérez-Gómez, J. Weekly variations in the workload of turkish national youth wrestlers: A season of complete preparation. Int. J. Environ. Res. Public Health 2021, 18, 3832. [Google Scholar] [CrossRef]
  54. Windt, J.; Gabbett, T.J. Is it all for naught? What does mathematical coupling mean for acute:chronic workload ratios? Br. J. Sports Med. 2019, 53, 988–990. [Google Scholar] [CrossRef]
  55. Foster, C.; Florhaug, J.A.; Franklin, J.; Gottschall, L.; Hrovatin, L.A.; Parker, S.; Doleshal, P.; Dodge, C. A new approach to monitoring exercise training. J. Strength Cond. Res. 2001, 15, 109–115. [Google Scholar]
  56. Nobari, H.; Barjaste, A.; Haghighi, H.; Clemente, F.M.; Carlos-Vivas, J.; Perez-Gomez, J. Quantification of training and match load in elite youth soccer players: A full-season study. J. Sports Med. Phys. Fitness 2021. [Google Scholar] [CrossRef]
  57. Hopkins, W.G.; Marshall, S.W.; Batterham, A.M.; Hanin, J. Progressive statistics for studies in sports medicine and exercise science. Med. Sci. Sports Exerc. 2009, 41, 3–12. [Google Scholar] [CrossRef] [Green Version]
  58. Oliveira, R.; Brito, J.P.; Martins, A.; Mendes, B.; Marinho, D.A.; Ferraz, R.; Marques, M.C. In-season internal and external training load quantification of an elite European soccer team. PLoS ONE 2019, 14, e0209393. [Google Scholar] [CrossRef] [Green Version]
  59. Dellal, A.; Lago-Peñas, C.; Rey, E.; Chamari, K.; Orhant, E. The effects of a congested fixture period on physical performance, technical activity and injury rate during matches in a professional soccer team. Br. J. Sports Med. 2015, 49, 390–394. [Google Scholar] [CrossRef] [Green Version]
  60. Owen, A.L.; Lago-Penñs, C.; Gómez, M.Á.; Mendes, B.; Dellal, A. Analysis of a training mesocycle and positional quantification in elite European soccer players. Int. J. Sport. Sci. Coach. 2017, 12, 665–676. [Google Scholar] [CrossRef]
  61. Meckel, Y.; Doron, O.; Eliakim, E.; Eliakim, A. Seasonal Variations in Physical Fitness and Performance Indices of Elite Soccer Players. Sports 2018, 6, 14. [Google Scholar] [CrossRef] [PubMed] [Green Version]
  62. Malone, J.J.; Di Michele, R.; Morgans, R.; Burgess, D.; Morton, J.P.; Drust, B. Seasonal training-load quantification in elite English Premier League soccer players. Int. J. Sports Physiol. Perform. 2015, 10, 489–497. [Google Scholar] [CrossRef] [Green Version]
  63. Rico-González, M.; Mendez-Villanueva, A.; Los Arcos, A. Trainin load periodization in soccer with one official match a week: A systematic review. In An Essential Guide to Sports Performance; Alvira, D., Raya-González, J., Eds.; Nova Science: New York, NY, USA, 2020. [Google Scholar]
  64. Gabbett, T.J. The training-injury prevention paradox: Should athletes be training smarter and harder? Br. J. Sports Med. 2016, 50, 273–280. [Google Scholar] [CrossRef] [Green Version]
  65. Gomez-Piriz, P.T.; JiméNez-Reyes, P.; Ruiz-Ruiz, C. Relation between total body load and session rating of perceived exertion in professional soccer players. J. Strength Cond. Res. 2011, 25, 2100–2103. [Google Scholar] [CrossRef]
  66. McLaren, S.J.; Smith, A.; Spears, I.R.; Weston, M. A detailed quantification of differential ratings of perceived exertion during team-sport training. J. Sci. Med. Sport 2017, 20, 290–295. [Google Scholar] [CrossRef] [Green Version]
  67. Barrett, S.; McLaren, S.; Spears, I.; Ward, P.; Weston, M. The Influence of Playing Position and Contextual Factors on Soccer Players’ Match Differential Ratings of Perceived Exertion: A Preliminary Investigation. Sport 2018, 6, 13. [Google Scholar] [CrossRef] [Green Version]
  68. Clemente, F.M.; Owen, A.; Serra-Olivares, J.; Nikolaidis, P.T.; Van Der Linden, C.M.I.; Mendes, B. Characterization of the Weekly External Load Profile of Professional Soccer Teams from Portugal and the Netherlands. J. Hum. Kinet. 2019, 66, 155–164. [Google Scholar] [CrossRef] [Green Version]
  69. Clemente, F.M.; Rabbani, A.; Conte, D.; Castillo, D.; Afonso, J.; Clark, C.C.T.; Nikolaidis, P.T.; Rosemann, T.; Knechtle, B. Training/match external load ratios in professional soccer players: A full-season study. Int. J. Environ. Res. Public Health 2019, 16, 3057. [Google Scholar] [CrossRef] [Green Version]
Figure 1. Tracking systems in GPS devices.
Applsci 12 01140 g001
Figure 2. Describes the situations in which the sensors are connected to the player body.
Applsci 12 01140 g002
Figure 3. Tools used in each training session and matches.
Applsci 12 01140 g003
Figure 4. How to obtain the calculated information in each training session and matches.
Applsci 12 01140 g004
Figure 5. Descriptive statistics of (A) acute workload (AW), (B) chronic workload (CW), (C) acute: chronic workload ratio (ACWR), and their variations across the full season, considering the weekly averages of body load. AU, arbitrary units; LDW, lateral defenders and wingers; CDF, central defenders and forwards; and MDF, midfielders.
Applsci 12 01140 g005
Figure 6. Descriptive statistics of (A) training monotony (TM), (B) training strain (TS), and their variations across the full season, considering the weekly averages of body load. AU, arbitrary units; LDW, lateral defenders and wingers; CDF, central defenders and forwards; and MDF, midfielders.
Applsci 12 01140 g006
Table 1. Descriptive data of weekly average for all derived GPS variables by playing position.
Playing
Position
Frequency
(Sessions wk−1)
wNBL
(AU)
wTD
(m)
wSTD
(m)
wHSRd
(m)
wRS
(num)
LDW>3547.24 (31.87)23,764.21 (3024.59)2053.02 (256.11)340.35 (89.83)72.89 (4.55)
CDF>3526.43 (60.57)21,809 (4391.51)1831.06 (370.15)271.55 (73.80)65.80 (9.06)
MID>3473.40 (96.46)20,002.31 (5203.42)1654.23 (508.09)230.78 (114.12)60.95 (14.43)
wTD, weekly total distance in meters; wSTD, weekly sprint total distance in meters; wHSRd, weekly high-speed running distance in meters; wRS, weekly repeat sprint as number; wNBL, weekly new body load; AU, arbitrary units; LDW, lateral defenders and wingers; CDF, central defenders, and forwards; and MDF, midfielders.
Table 2. Between-group differences in the full season weekly average for workload variables, training monotony, and training strain.
MEAN (SD)COMPARATIVEMEAN DIFFERENCEpCohen’s d (95% CI)CV (%)
wAW (AU)LDW: 88.02 (16.15)LDW vs. CDF6.3 (−21.3 to 34.0)1.0000.26 (−0.76 to 1.28)22.80
CDF: 81.68 (29.37)LDW vs. MDF−9.0 (−37.9 to 19.9)1.000−0.62 (−1.70 to 0.47)
MDF: 97.01 (8.69)CDF vs. MDF−15.3 (−45.1 to 14.4)0.571−0.63 (−1.75 to 0.48)
wCW (AU)LDW: 88.25 (16.57)LDW vs. CDF6.3 (−21.4 to 34.0)1.0000.25 (−0.77 to 1.27)22.64
CDF: 81.95 (29.48)LDW vs. MDF−7.3 (−36.2 to 21.6)1.000−0.50 (−1.58 to 0.57)
MDF: 95.55 (7.00)CDF vs. MDF−13.6 (−43.3 to 16.1)0.729−0.57 (−1.68 to 0.54)
wACWR (AU)LDW: 1.05 (0.04)LDW vs. CDF0.002 (−0.063 to 0.067)1.0000.01 (−1.00 to 1.02)4.38
CDF: 1.05 (0.04)LDW vs. MDF−0.018 (−0.086 to 0.049)1.000−0.41 (−1.48 to 0.66)
MDF: 1.08 (0.07)CDF vs. MDF−0.020 (−0.090 to 0.049)1.000−0.40 (−1.51 to 0.70)
wTM (AU)LDW: 1.71 (0.18)LDW vs. CDF−0.008 (−0.508 to 0.493)1.000−0.03 (−1.04 to 0.99)20.18
CDF: 1.72 (0.51)LDW vs. MDF−0.015 (−0.537 to 0.508)1.000−0.06 (−1.12 to 1.00)
MDF: 1.73 (0.36)CDF vs. MDF−0.007 (−0.545 to 0.531)1.000−0.01 (−1.10 to 1.08)
wTS (AU)LDW: 964.24 (220.24)LDW vs. CDF110.7 (−205.3 to 426.6)1.0000.41 (−0.61 to 1.44)24.88
CDF: 853.55 (288.02)LDW vs. MDF−131.8 (−461.4 to 197.9)0.917−0.62 (−1.71 to 0.46)
MDF: 1095.99 (158.63)CDF vs. MDF−242.4 (−582.1 to 97.2)0.227−0.95 (−2.10 to 0.20)
Note: AU, arbitrary units; wAW, weekly average acute workload in AU; wCW, weekly average chronic workload in AU; wACWR, weekly average acute:chronic workload ratio in AU; wTM, weekly average training monotony based on new body load in AU; wTS, weekly average training strain based on body load in AU; LDW, lateral defenders and wingers; CDF, central defenders and forwards; and MDF, midfielders; p, p-value at alpha level 0.05; Cohen’s d (95% CI), Cohen’s d effect size magnitude with 95% confidence interval; CV, coefficient of variations for overall team as percentage. Significant differences (p ≤ 0.05) are highlighted in bold.
Table 3. Between-group differences for derived-GPS variables of distance and sprint in the full season.
MEAN (SD)COMPARATIVEMEAN DIFFERENCEpCohen’s d (95% CI)CV (%)
wTD (m)LDW: 3842.51 (307.12)LDW vs. CDF255.2 (−254.8 to 765.1)0.6100.58 (−0.45 to 1.62)10.03
CDF: 3587.32(507.56)LDW vs. MDF177.3 (−354.8 to 709.5)1.0000.58 (−0.50 to 1.66)
MDF: 3665.16(246.22)CDF vs. MDF−77.8 (−626.0 to 470.4)1.000−0.18 (−1.27 to 0.92)
wSTD (m)LDW: 351.36(39.64)LDW vs. CDF79.1 (17.9 to 140.3)0.0091.63 (0.46 to 2.81)18.47
CDF: 272.29 (51.52)LDW vs. MDF68.2 (4.3 to 132.1)0.0341.55 (0.34 to 2.75)
MDF: 283.17 (42.91)CDF vs. MDF−10.9 (−76.7 to 54.9)1.000−0.21 (−1.31 to 0.88)
wHSRd (m)LDW: 62.84 (13.81)LDW vs. CDF23.2 (3.8 to 42.5)0.0161.48 (0.34 to 2.62)37.63
CDF: 39.68 (15.73)LDW vs. MDF25.4 (5.2 to 45.6)0.0111.77 (0.53 to 3.02)
MDF: 37.47 (12.59)CDF vs. MDF2.2 (−18.6 to 23.0)1.0000.14 (−0.95 to 1.23)
wRS
(number)
LDW: 13.43 (3.11)LDW vs. CDF3.8 (0.5 to 7.1)0.0211.47 (0.32 to 2.61)25.41
CDF: 9.60 (1.34)LDW vs. MDF2.9 (−0.6 to 6.3)0.1250.95 (−0.17 to 2.06)
MDF: 10.55 (2.35)CDF vs. MDF−1.0 (−4.5 to 2.6)1.000−0.47 (−1.58 to 0.63)
wMaxSp
(km·h−1)
LDW: 20.58 (1.99)LDW vs. CDF0.8 (−2.2 to 3.8)1.0000.31 (−0.71 to 1.33)11.03
CDF: 19.77 (2.90)LDW vs. MDF1.8 (−2.2 to 4.1)0.4580.96 (−0.16 to 2.08)
MDF: 18.83 (1.15)CDF vs. MDF0.9 (−2.2 to 4.1)1.0000.38 (−0.72 to 1.49)
wSTD/wTDLDW: 0.092 (0.010)LDW vs. CDF0.005 (0.001 to 0.009)0.0171.76 (0.57 to 2.95)31.92
CDF: 0.076 (0.008)LDW vs. MDF0.006 (0.001 to 0.010)0.0461.79 (0.54 to 3.04)
MDF: 0.077 (0.012)CDF vs. MDF0.001 (−0.004 to 0.005)1.0000.18 (−0.92 to 1.27)
wHSRd/wTDLDW: 0.016 (0.003)LDW vs. CDF0.016 (0.003 to 0.030)0.0141.61 (0.44 to 2.78)14.82
CDF: 0.011 (0.003)LDW vs. MDF0.014 (0.000 to 0.029)0.0081.21 (0.06 to 2.36)
MDF: 0.013 (0.004)CDF vs. MDF−0.002 (−0.016 to 0.013)1.000−0.16 (−1.25 to 0.93)
Note: wTD, weekly total distance in meters; wSTD, weekly sprint total distance in meters; wHSRd, weekly high-speed running distance in meters; wRS, weekly repeat sprint as number; MaxSp, weekly maximum speed in kilometers per hour; wHSRd/wTD, ratio between weekly high-speed running distance and weekly total distance; wSTD/wTD, ratio between weekly sprint total distance and weekly total distance; LDW, lateral defenders and wingers; CDF, central defenders and forwards; and MDF, midfielders; p, p-value at alpha level 0.05; Cohen’s d (95% CI), Cohen’s d effect size magnitude with 95% confidence interval; CV, coefficient of variations for overall team as percentage. Significant differences (p ≤ 0.05) are highlighted in bold.
Publisher’s Note: MDPI stays neutral with regard to jurisdictional claims in published maps and institutional affiliations.

