Article

Failure Analysis of Subway Box Structures According to Displacement Behavior on a Serviced Urban Railway

1
Department of Construction Engineering, Dongyang University, Yeongju-si 36040, Republic of Korea
2
Department of Architectural Engineering, Gachon University, Seongnam-si 13120, Republic of Korea
3
Civil Engineering Office, Seoul Metro, 5, Seoul 06693, Republic of Korea
4
SANGANG ENC Co., Ltd., 1519ho, 127, Seoul 05836, Republic of Korea
*
Author to whom correspondence should be addressed.
Appl. Sci. 2022, 12(24), 12637; https://doi.org/10.3390/app122412637
Submission received: 17 October 2022 / Revised: 5 December 2022 / Accepted: 6 December 2022 / Published: 9 December 2022
(This article belongs to the Special Issue Advances on Structural Engineering, Volume III)

Abstract

:
The increasing development of underground infrastructure has led to the deformation of subway box structures and surrounding roadbeds, eventually resulting in cracks. Therefore, it is necessary to predict damage through effective analysis and evaluation techniques. This study examined the correlation between displacement behavior and damage in a subway box structure and proposed an analysis technique to predict the damage location and scale of a structure by comparing the results from visual inspection, on-site measurement, and numerical analysis. The proposed technique can be used to compute the external boundary conditions that may induce major deformations in a subway box structure, and to predict and evaluate the members and locations where the damage may occur. In addition, we confirm that the damaged location and scale in a subway box structure can be determined, and that the maintenance of a subway box structure can be achieved by repairing and reinforcing the damaged part. Therefore, the results of this study are expected to help accurately predict damage in subway box structures, thereby contributing to better maintenance and failure prevention of underground infrastructure.

1. Introduction

The development of underground tunnels, for constructing roads, railroads, and subways, is increasing because of the expansion of various urban infrastructures and efficient use of land.
Large-scale building and tunnel construction in deep underground areas close to subway box structures has increased, and the deformation of subway box structures and surrounding roadbeds has become a serious problem because of the large-scale excavation work near towns. Thus, damage caused by subsidence and the combination of heaving and settlement has occurred in numerous places.
This investigation began because considerable groundwater runoff from the blind end occurred during excavation when installing a shield tunnel at the lower end of the subway box structure in use. This caused a rapid decrease in the groundwater level, leading to settlement and heaving in the subway box structure, thus causing cracks. Previously, this damage was only evaluated based on the crack status instead of the sectional force, which was considered in the design. However, few studies have been conducted on the specific effects of the deformation of subway box structures, or on the damage caused by heaving and settlement. Therefore, it is necessary to conduct research to predict damage through effective analysis and evaluation techniques when cracks and further damage occurs in the field.
Numerous studies have been conducted on the effects of various behaviors of subway box structures as a result of damage. Chung et al. examined track irregularity as a result of subsidence in the gravel track in the serviced line owing to the adjacent excavation construction. Numerical modeling was performed on the gravel track, and the track error caused by the excavation work was precisely analyzed [1]. Choi [2] investigated the dynamic behavior of the gravel track using a qualitative analysis approach. In addition, the track performance was predicted according to the variation in the track in the dynamic wheel–rail force and track support stiffness. Choi et al. [3] investigated land subsidence in the vulnerable ground and the deformation of city railroad structures owing to the adjacent excavation construction. Their study results demonstrated that the deformation in the vertical direction was higher than that in the horizontal direction when excavation was conducted below existing structures. Lee, Choi, Choi et al., and Cho investigated the track deformation of serviced lines and the deformation of underground structures; furthermore, they established an automated measurement and evaluation system to examine the deformation of underground structures due to adjacent excavation and construction [4,5,6,7]. Yoon examined the effect of deformation on the retaining walls and subway box structures during adjacent excavations [8]. Song investigated the application of the elastic foundation proposed by Winkler to beams on the elastic foundation as a cantilever member to verify the efficiency of the numerical integration [9]. Chun et al. examined the dynamic behavior of ballast and concrete track structures as a result of changes in train load and speed by applying a computational model of beams on an elastic foundation [10]. Chung et al. [11] analyzed the principal stress and displacement of the excavation surface due to excavation of the ground, and predicted the ground behavior. This study was used to obtain the basic data for selecting a ground excavation analysis model for each condition as a specification for the numerical analysis.
Seismic studies on subway box structures have been conducted worldwide. Nguyen et al. developed fragility curves for three damage states using numerical analysis to evaluate the seismic vulnerability of cut-and-cover subway tunnels [12]. Tao et al. qualitatively reproduced the shape of a structure according to the seismic response characteristics of prefabricated subway structures during an actual earthquake through shaking table tests [13]. Chen and Liu examined the dynamic characteristics of soil by performing shaking table tests to verify the effect of pulse-like earthquake motions on a general subway structure [14]. Lee et al. performed a damage analysis of a tunnel to define the damage state and corresponding damage indices (DIs) under seismic loading [15]. Tang et al. performed shaking table tests to investigate the dynamic interaction between a subway station with an irregular section and silty-clay soil. Consequently, the movement of the subway station was controlled more by the surrounding silty clay soil in terms of phase and amplitude. In addition, the lower layers of the shallow buried subway structures, particularly the components of the central column, sustained cumulative damage [16]. Zhuang et al. developed a finite element analysis model to evaluate the seismic performance of an underground subway station structure, considering the connection modes and diaphragm walls [17]. Cui and Ma conducted table tests to improve the seismic performance of the soft tunnel portal sections. Therefore, a structure strengthening and isolation method should be adopted for the seismic design of the soft portal section [18]. Zhuang et al. [19] verified the seismic performance of large subway stations using numerical analysis of various soil foundations. Pang et al. performed a seismic performance evaluation of damage in a three-dimensional (3D) subway structure based on probabilistic analysis and verified that the probabilistic earthquake generated through an intensity–frequency nonstationary ground motion model was consistent with the code spectrum [20]. Huang et al. applied a rapid detection and analysis system to shield tunnels to investigate lining damage. The types, morphological characteristics, and distribution characteristics of the structural damage were quantitatively analyzed based on the field investigation results [21].
This study computed the subgrade reaction modulus of a subway box structure by applying the continuous elastic foundation beam model after converting the in situ leveling results into a displacement function. In addition, the deformation and damage of the subway box structure were examined by comparing and analyzing the results of the elastic beam and numerical analyses. As a result, damage and additional damage prediction can be achieved using simple analysis evaluation techniques when damage, such as cracks, occurs in subway box structures.

2. Field Measurement

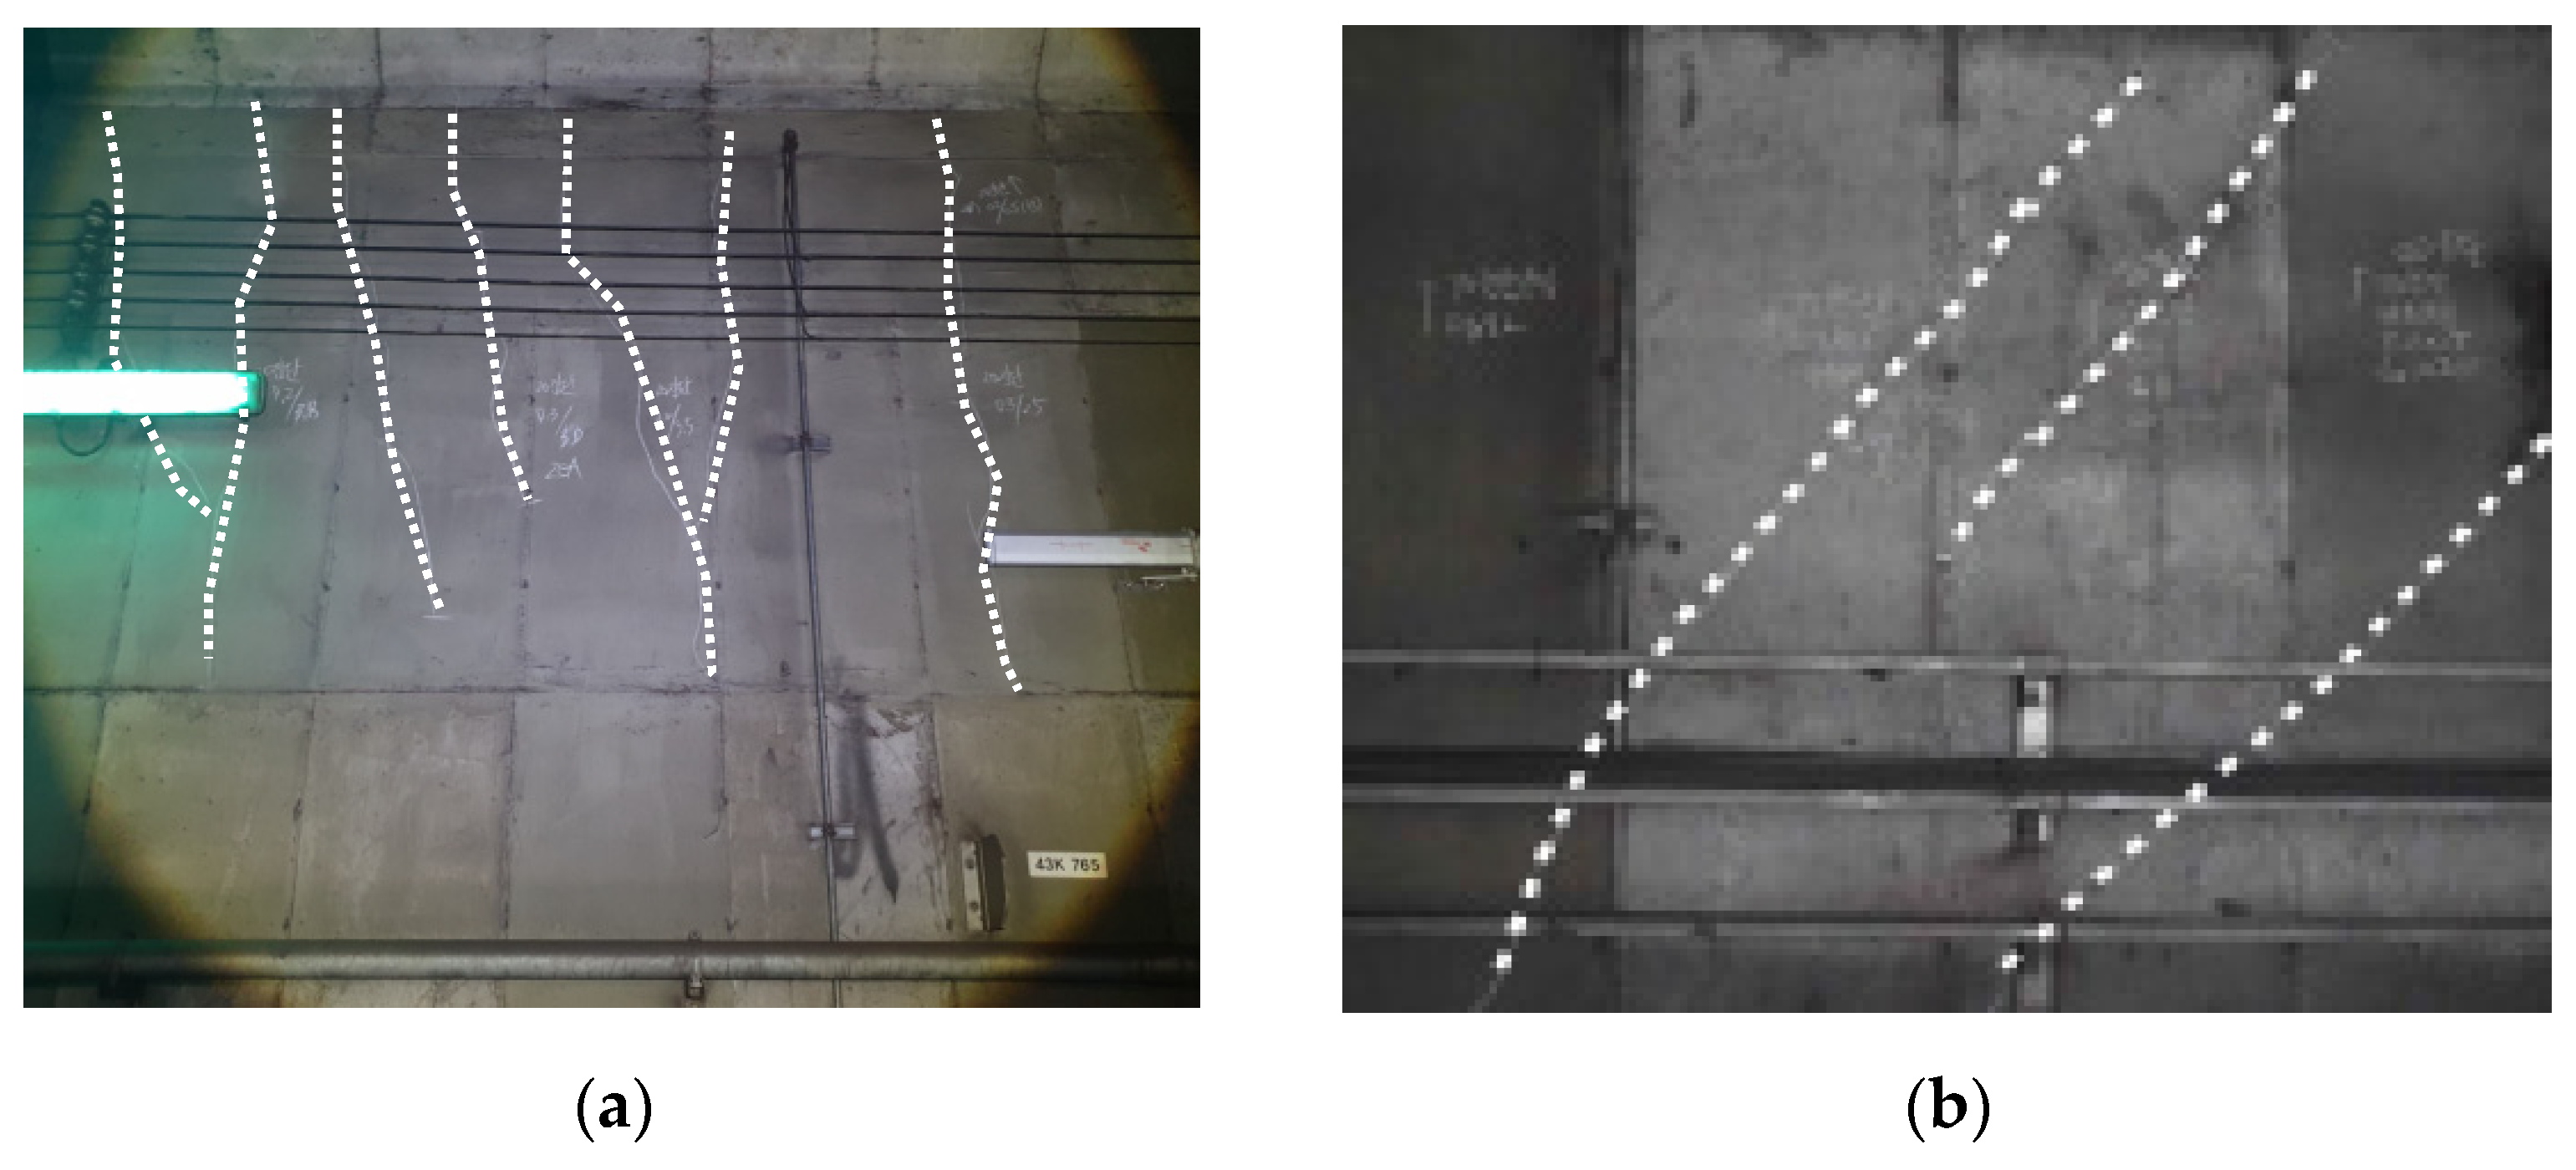
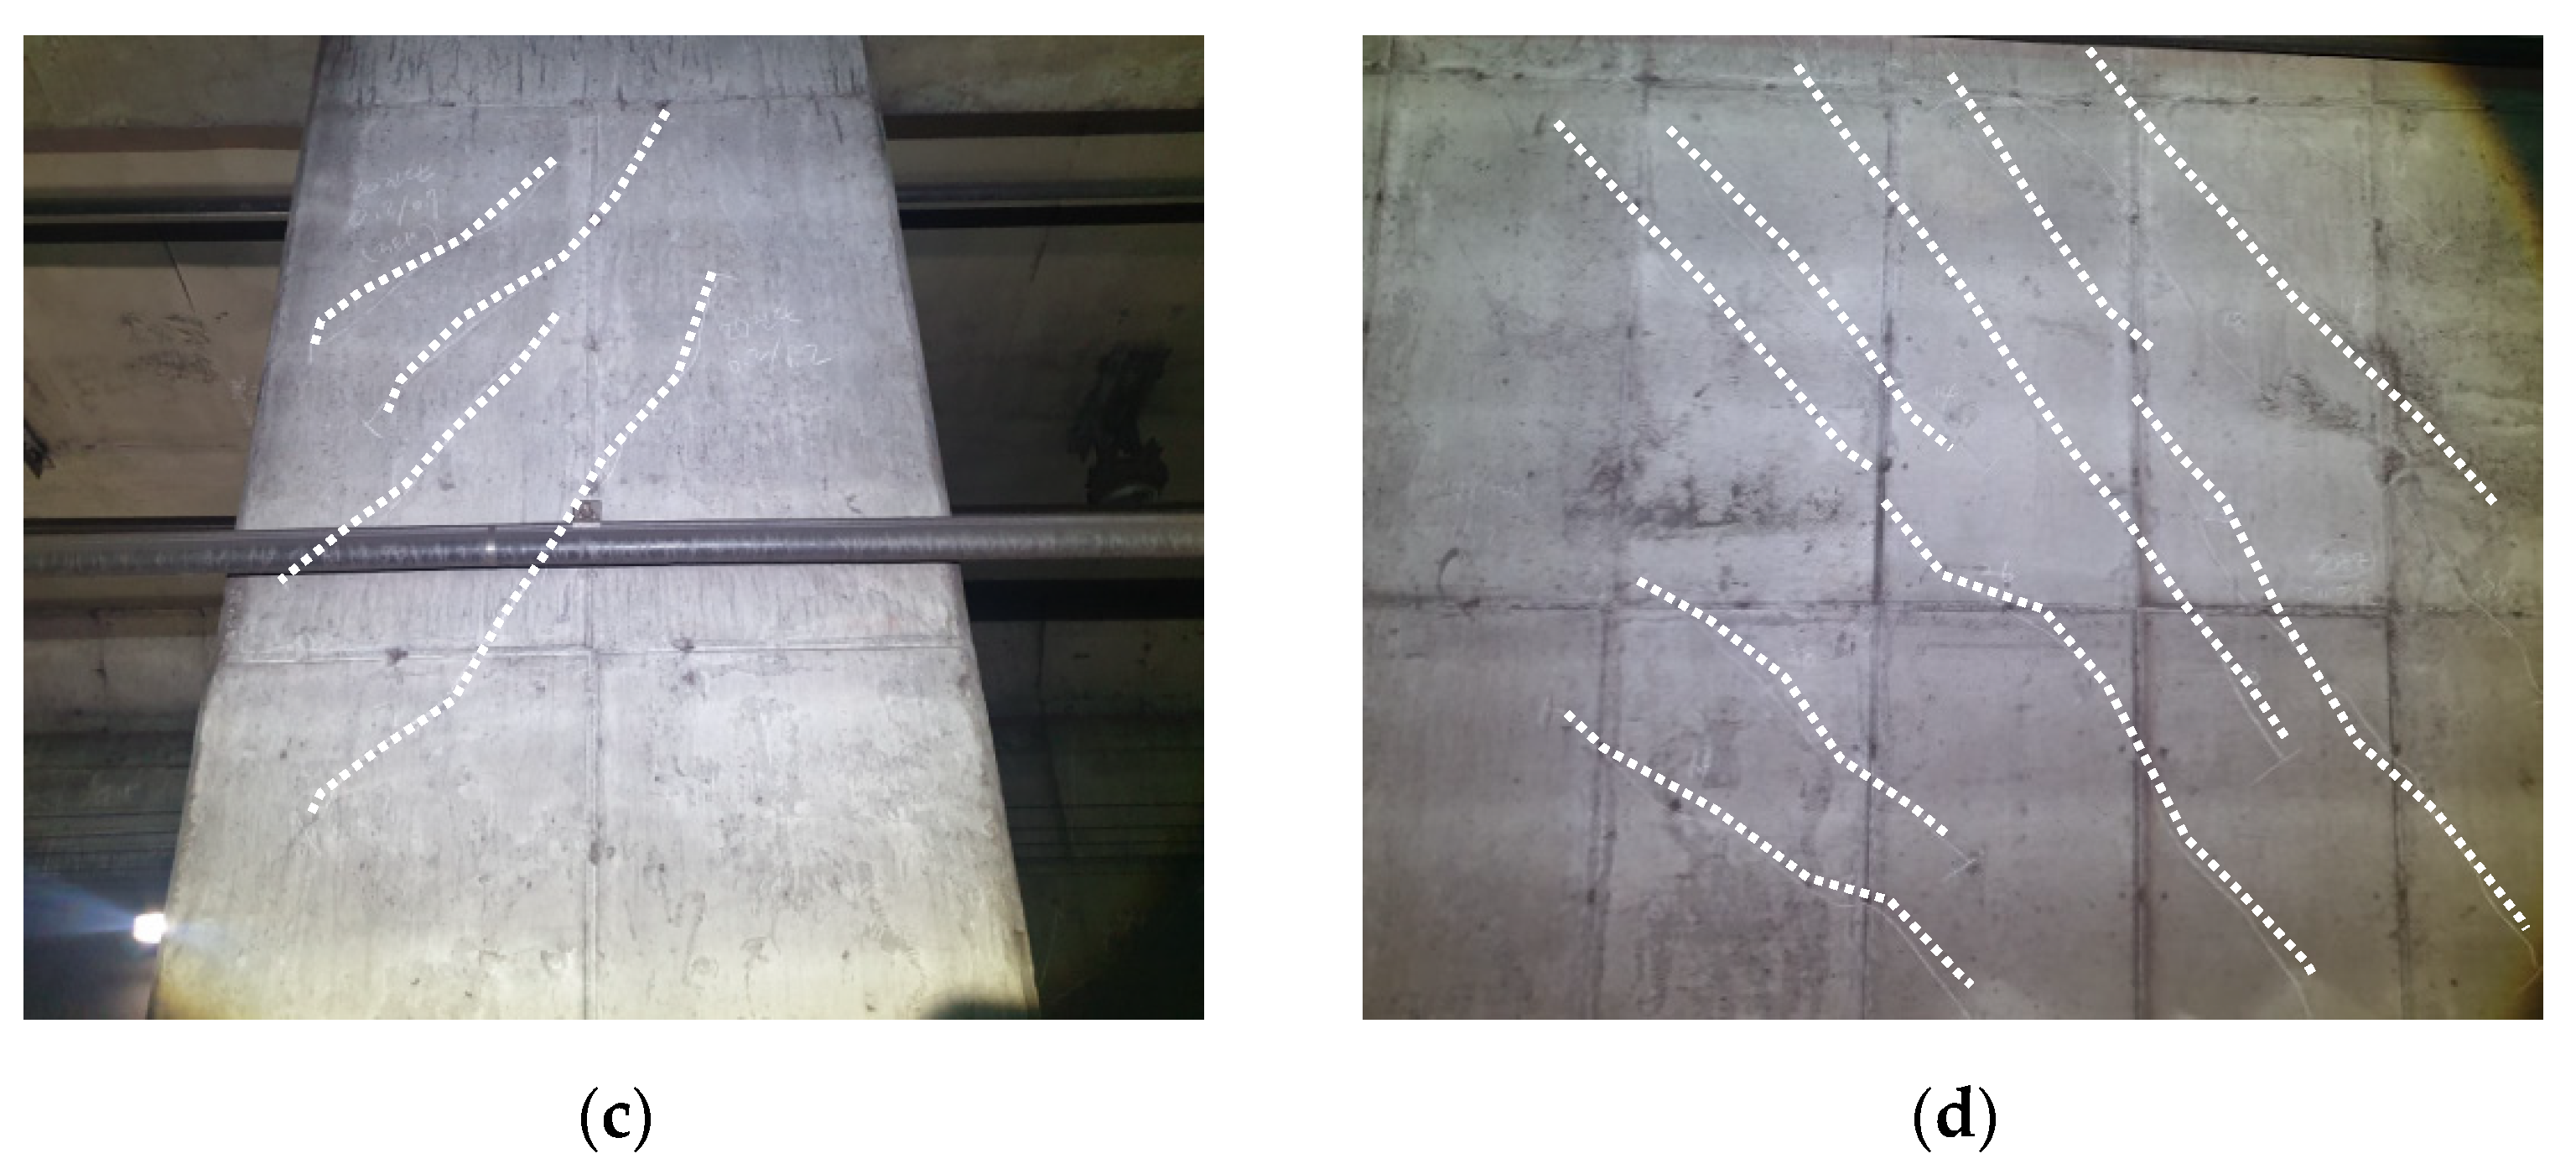
2.1. Visual Inspection

We examined the damage to the structure through a prevision safety diagnosis from 2011 to 2020, in Korea SeoulMetro line 7. The findings of the prevision safety diagnosis of cracks in 2011 indicated no structural safety issues. The findings of the prevision safety diagnosis of cracks in 2016 indicated that most cracks were short and did not cause significant damage. The results of the prevision safety diagnosis of cracks in 2020 showed transverse cracks in the ceiling and wall and diagonal cracks in the lower and upper sides of the wall.
The damaged area in the subway box structure was soft soil, in which the groundwater level quickly dropped during construction adjacent to the subway box structure, resulting in gradual ground subsidence for a long time. This resulted in heaving and settlement, affecting the subway box structure, and creating damage such as cracks.
Figure 1 illustrates the location of the damaged subway box structure. Most networks of fine cracks generated in the ceiling had a crack width of 0.1–0.2 mm. Several diagonal cracks (cw: 0.1–0.3 mm) and transverse cracks (cw: 0.2–0.4 mm) occurred, which were not found five years ago in the columns and walls in the mainline section, as illustrated in Figure 1a–d. The cracks in Figure 1a were caused by differential settlement. Figure 1b shows that diagonal cracks occurred owing to the increase in soil pressure, decrease in sidewall pressure, decrease in soil pressure, and long-term loading. Figure 1c,d shows the torsion due to flexural tension.

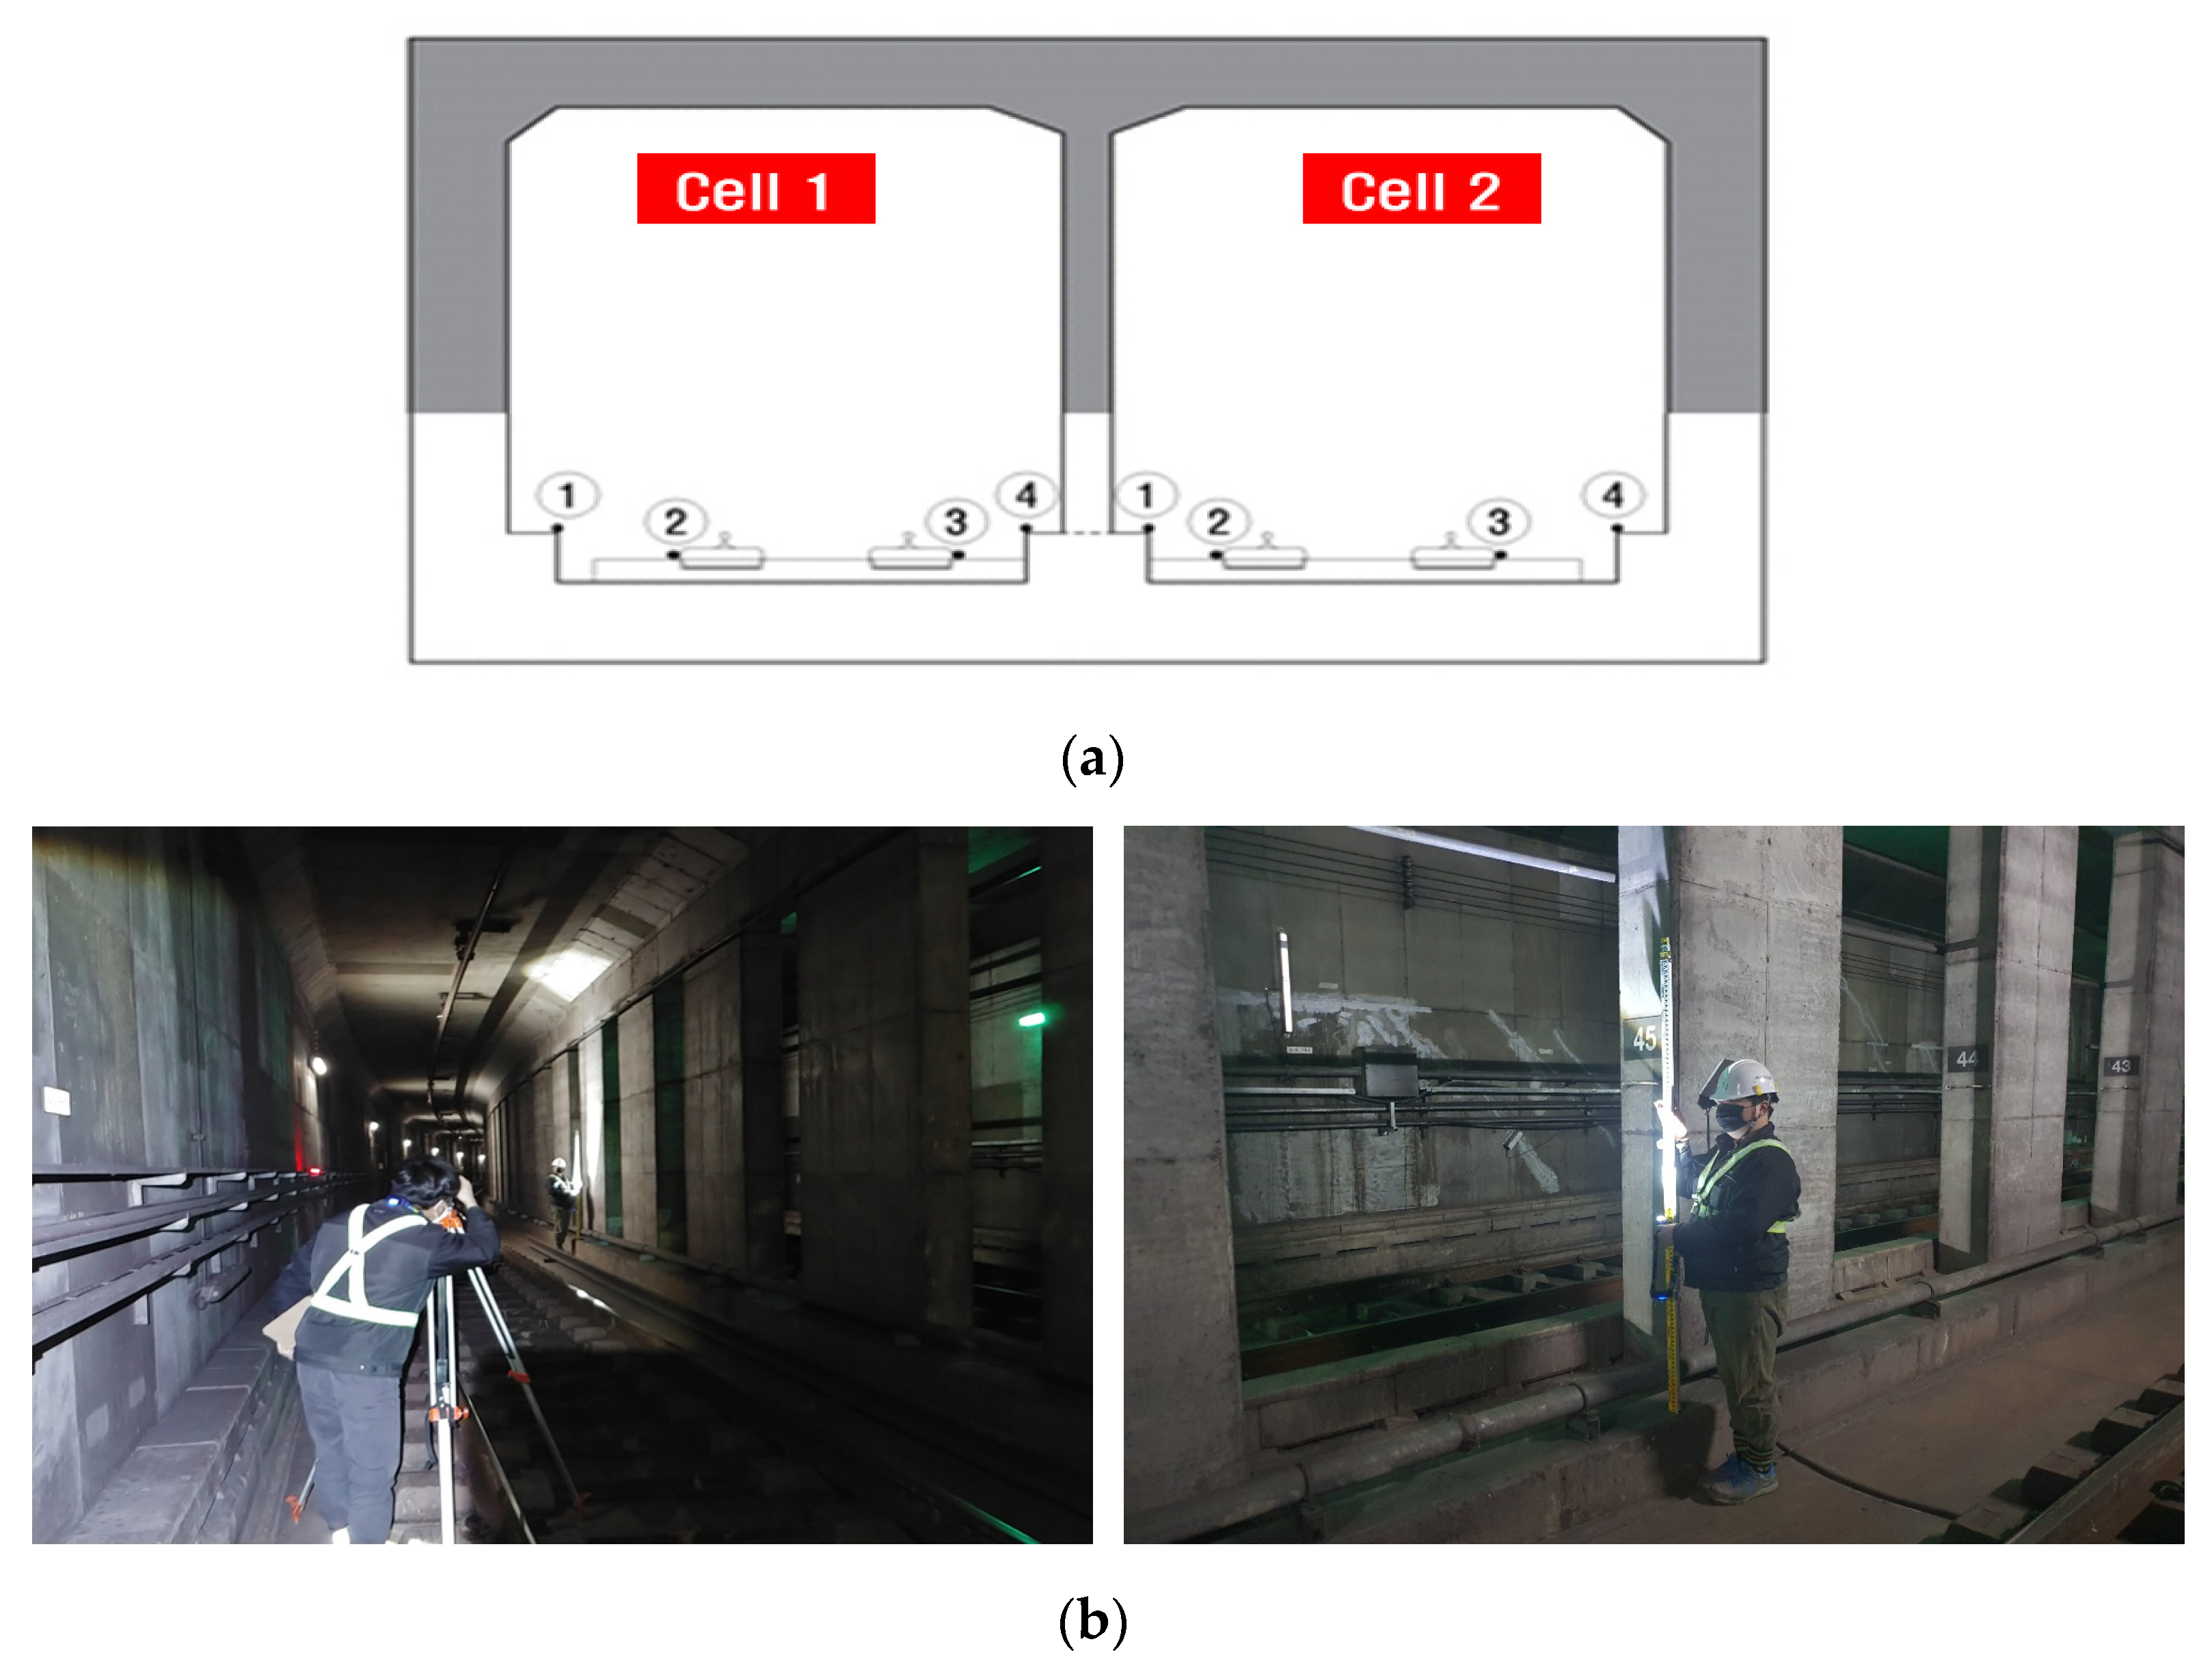
2.2. Optical Leveling for Box Structures

As shown in Figure 2a, to measure the displacement of the structure, leveling was conducted at four points in each up-track and down-track every 10 m, with a total of 104 points. Figure 2b shows the optical leveling. Damage to the subway box structure of Cells 1 and 2 occurred at the point of soft rock, resulting in tensile cracks in the upper part. A sinusoidal crack occurred at the boundary between the soft rock and granitic soil. Settlement occurred in the middle part of the granitic soil, resulting in tensile cracks in the upper and lower parts of the subway box structure.
Heaving of 0.01–0.02 m occurred in the 25–35 m section, and the maximum deflection of −0.18 to −0.186 m occurred in the 60–70 m section (settlement section), as illustrated in Figure 3.

3. Numerical Analysis
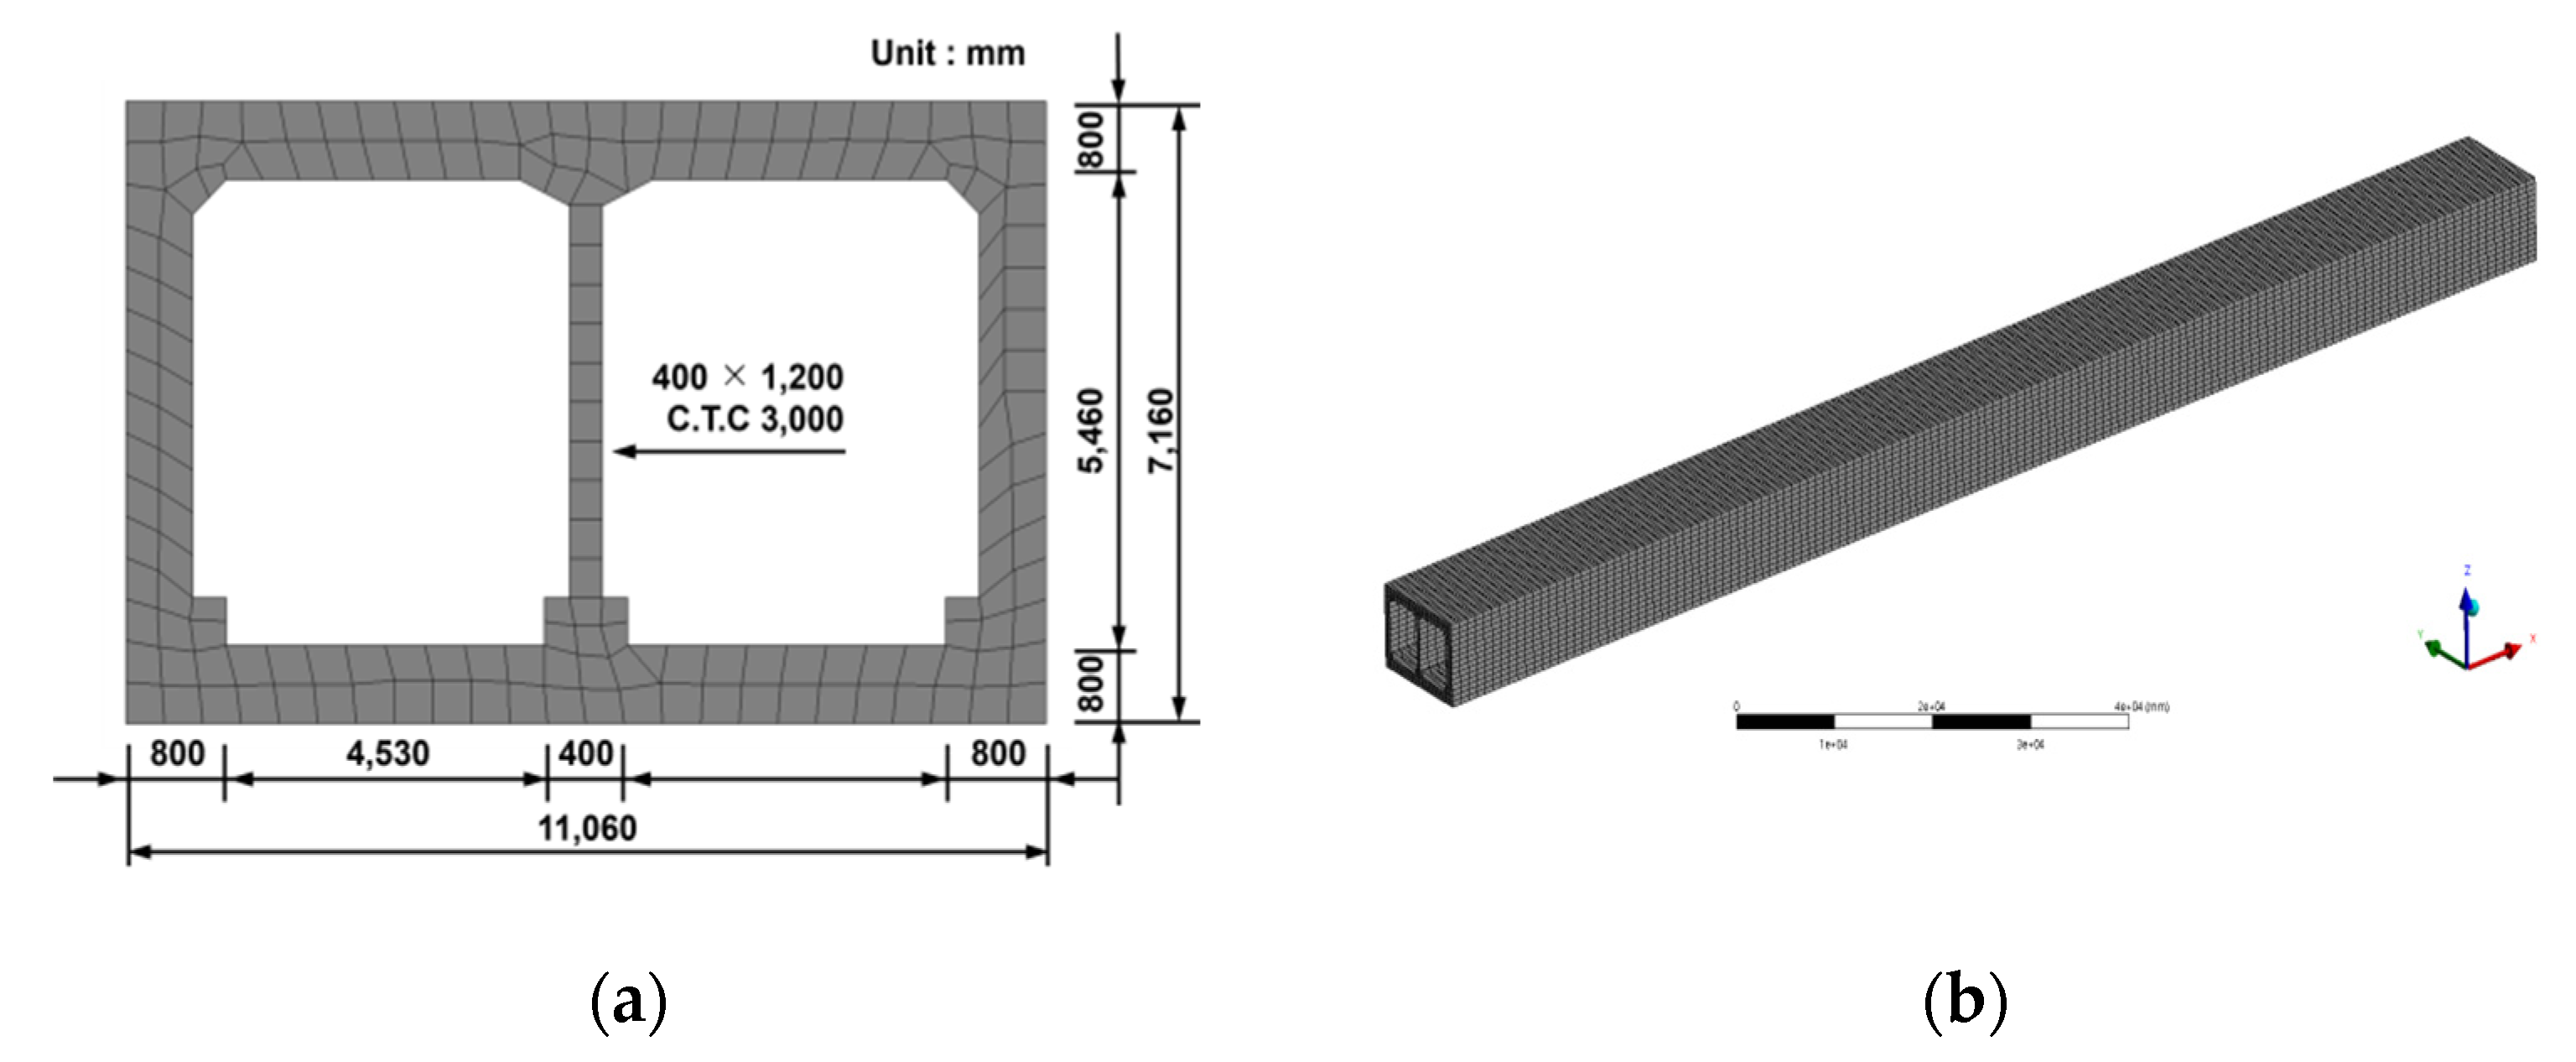
3.1. Modeling

Previous research, and damage evolution and fatigue models for various engineering materials, were reviewed [22]. In this study, the structure can no longer be used when it exhibits plastic behavior, the numerical analysis of the structure assumes linear elastic behavior. When heaving and settlement occurred in subway box structure, its safety was confirmed through numerical analysis. Using the continuous elastic foundation beam analysis employing the displacement measurement for each location, obtained based on the in situ measurements, loads and boundary conditions that were employed in the 3D finite element analysis model were applied.
The analysis of beams in elastic ground was assumed to be proportional to the degree of deformation rather than the reaction force of the elastic ground. In 1867, Winkler proposed the continuous elastic foundation beam theory [23]. It is a technique used to examine the behavior of flexible structural elements in contact with supporting and bearing soils as an infinite continuum by idealization employing a simplified continuum model, as shown in Figure 4.
Figure 4 illustrates the assumption of a railway track modeled with an infinite Euler–Bernoulli beam, which is continuously supported in the longitudinal direction. The deflection ω(x) of the rail can be computed using the differential equation in Equation (1) using the following two track parameters. In Equation (1), q(x) is the reaction force of the elastic ground according to deflection ω(x) at any point of the beam. Furthermore, the subgrade reaction modulus in the vertical direction can be computed using Equations (2) and (3), respectively [24].
E I d 4 ω x d x 4 + k ω x = q x ,
K v = K v 0 B v 0.3 3 4 ,
K v 0 = 1 0.3 × α × E 0 ,
where q(x) is the distribution load on the rail (N/m), EI is the flexural rigidity (k/m2), k   is the foundation rigidity (N/m2), d is the deformation (m), ω x is the deflection (m), K v is the coefficient of the vertical subgrade reaction (kN/m3), K v 0 is the initial coefficient of the vertical subgrade reaction (kN/m3), B v is the section modulus (m), E 0 is the deformation modulus (kN/m2), and α is the correction factor of the deformation modulus (constant).
The in situ measurement results were applied to Equations (1)–(3) to compute the subgrade reaction modulus of the structure, as presented in Table 1 and Figure 5. Figure 5 shows the results of the subgrade reaction modulus calculated by the displacement function using the leveling results and structural analysis. The maximum heaving section occurred in the 20–30 m range, and the maximum settlement section occurred in the 60–70 m range. Additionally, the deformation function of the structure and the subgrade reaction modulus for each displacement measurement point were applied as the load and boundary conditions in the 3D numerical analysis model.
As shown in Table 1, the subgrade reaction modulus due to settlement and heaving differed depending on the location. Additionally, the subgrade reaction modulus in the maximum settlement section was reduced by approximately 95% compared to that in the maximum heaving section.
The structural safety of the subway box structure was investigated via finite element analysis. Based on the leveling data, 3D modeling was performed for the subway box structure of 120 m. ANSYS Workbench (Cannonsberg, PA, USA) [25] v. 2021.1R was used as the finite element analysis program, and solid elements were used for 3D modeling. Nodes and elements are calculated automatically during their generation in the ANSYS Workbench program. The mesh of the box model contained 229,836 nodes and 40,800 elements. The element size of the subway box structure was assumed to be 500 mm. Figure 6a,b show the front view mesh and 3D view of the subway box structure, respectively. For the boundary condition, the tunnel bottom was fixed under the supported conditions. The subgrade reaction modulus measured at the site was applied to the bottom part of the subway box structure for each section.

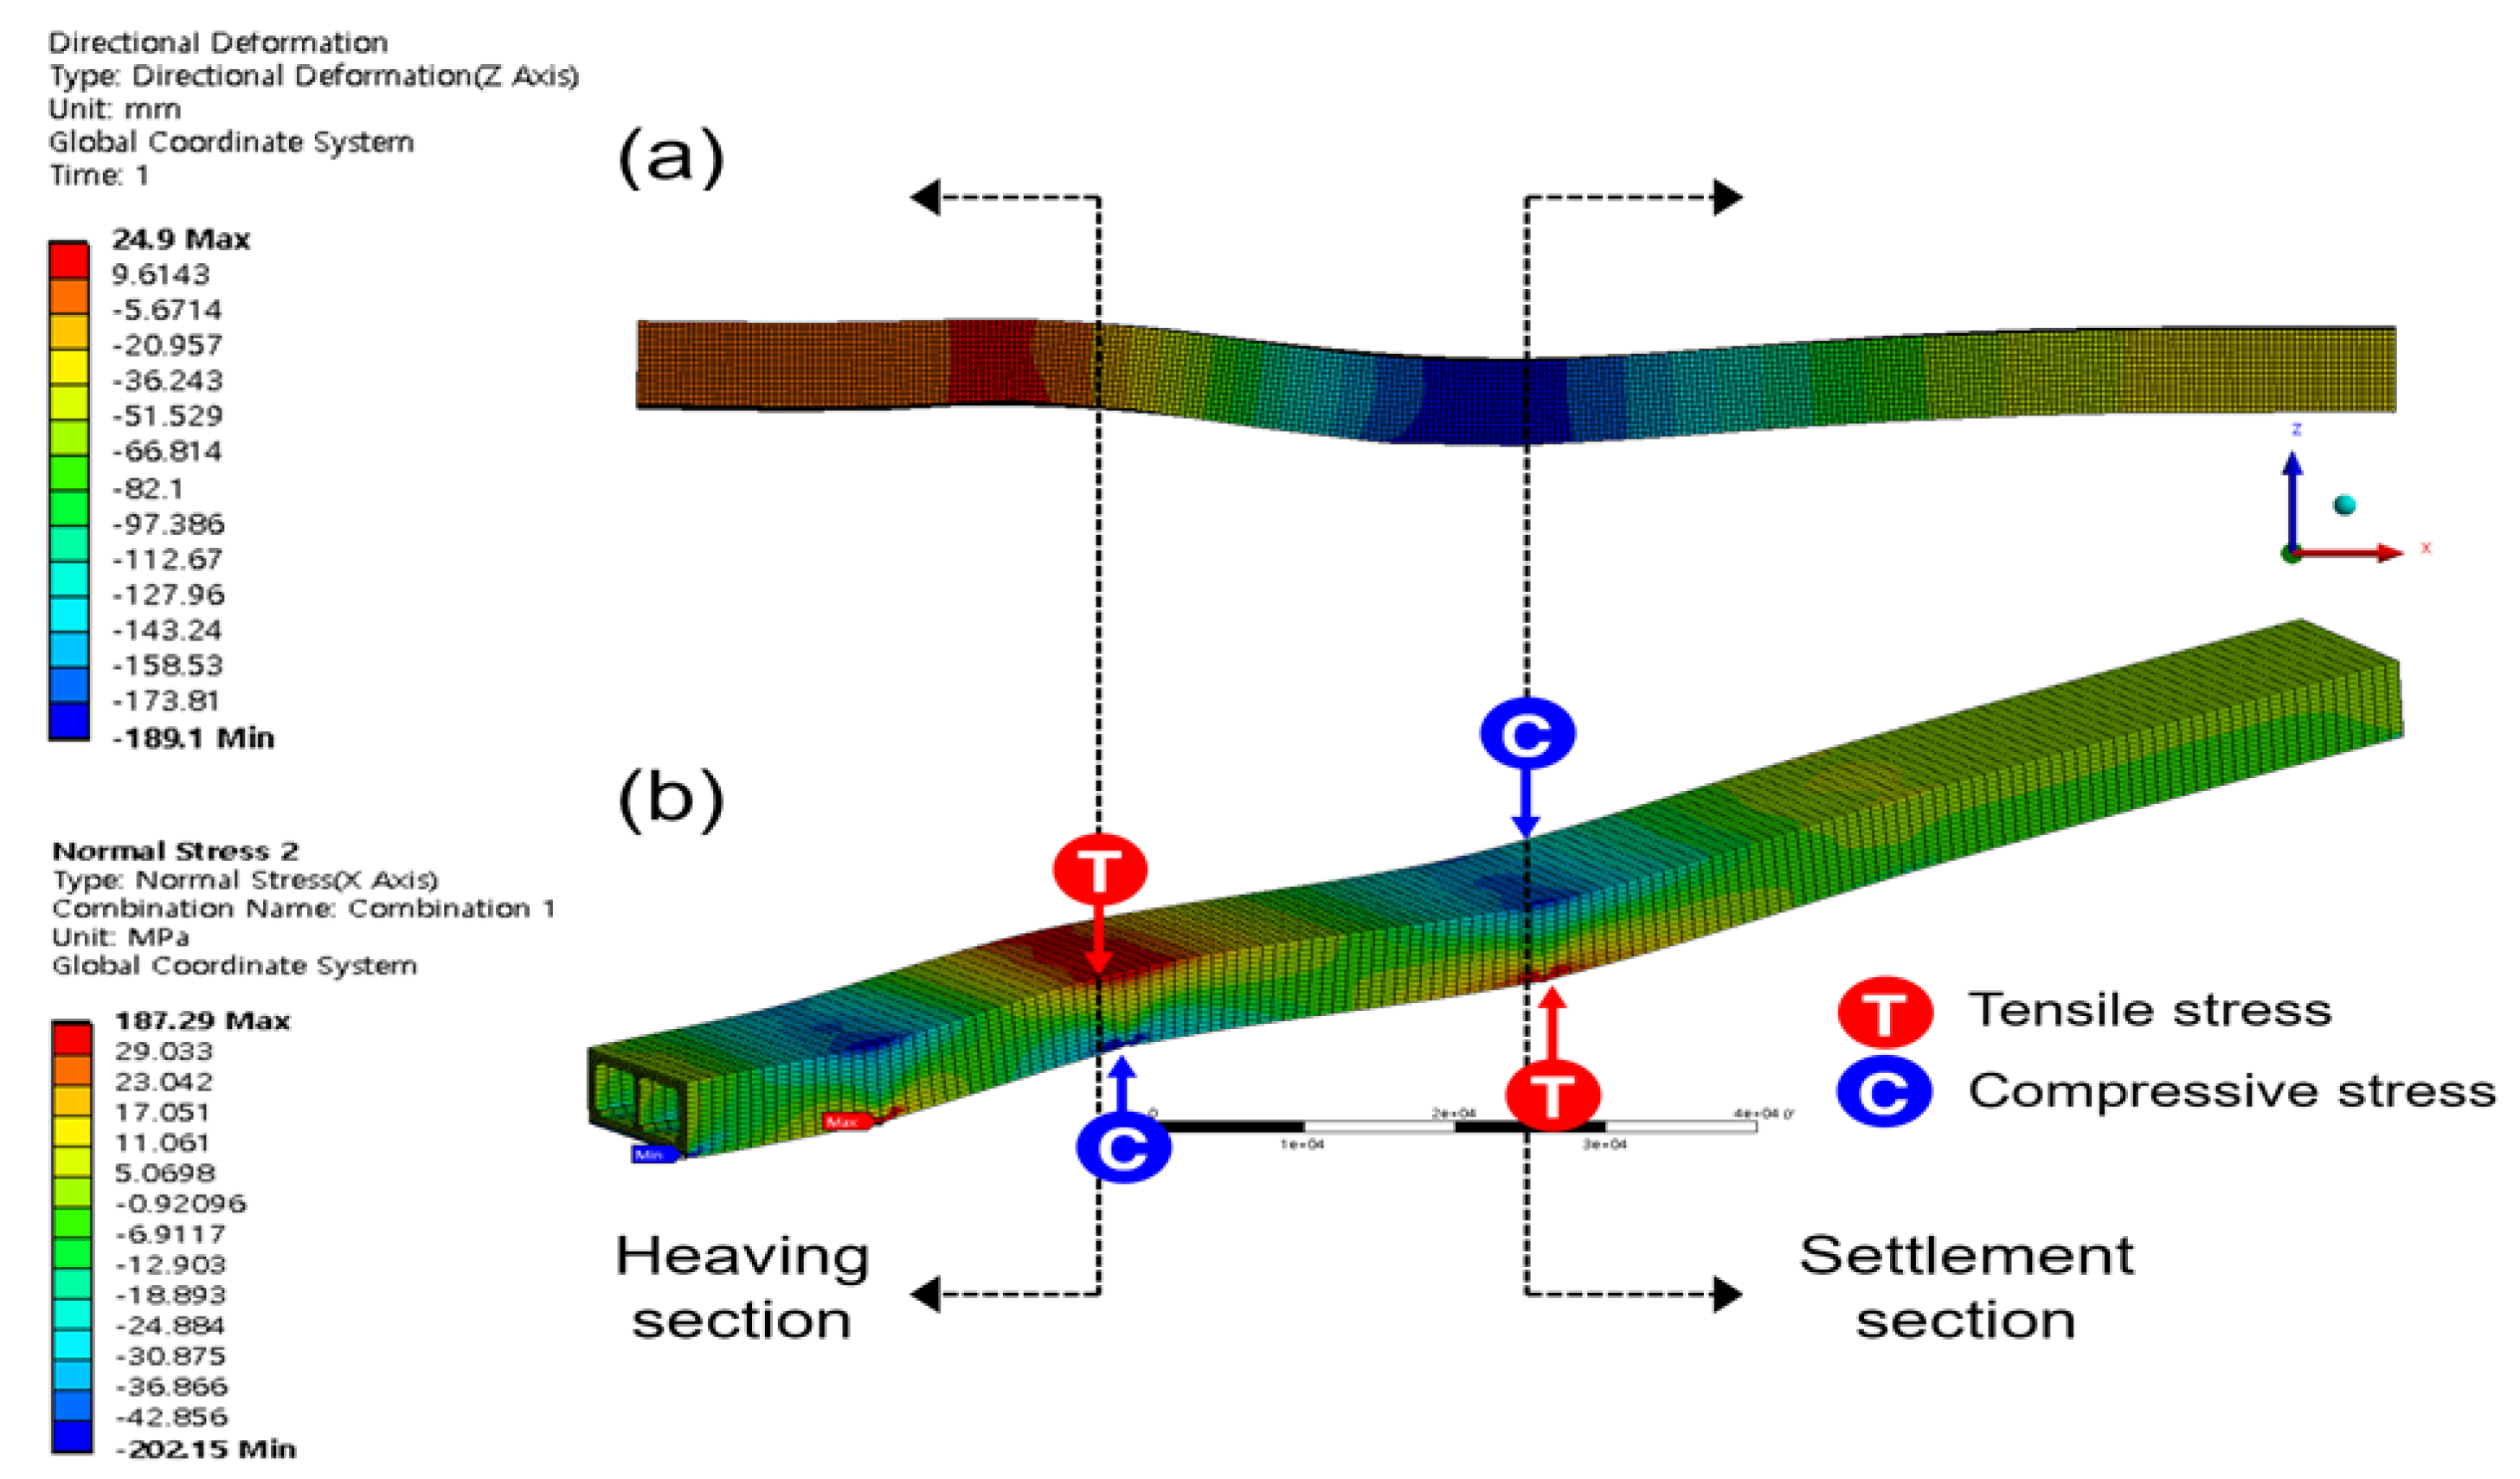
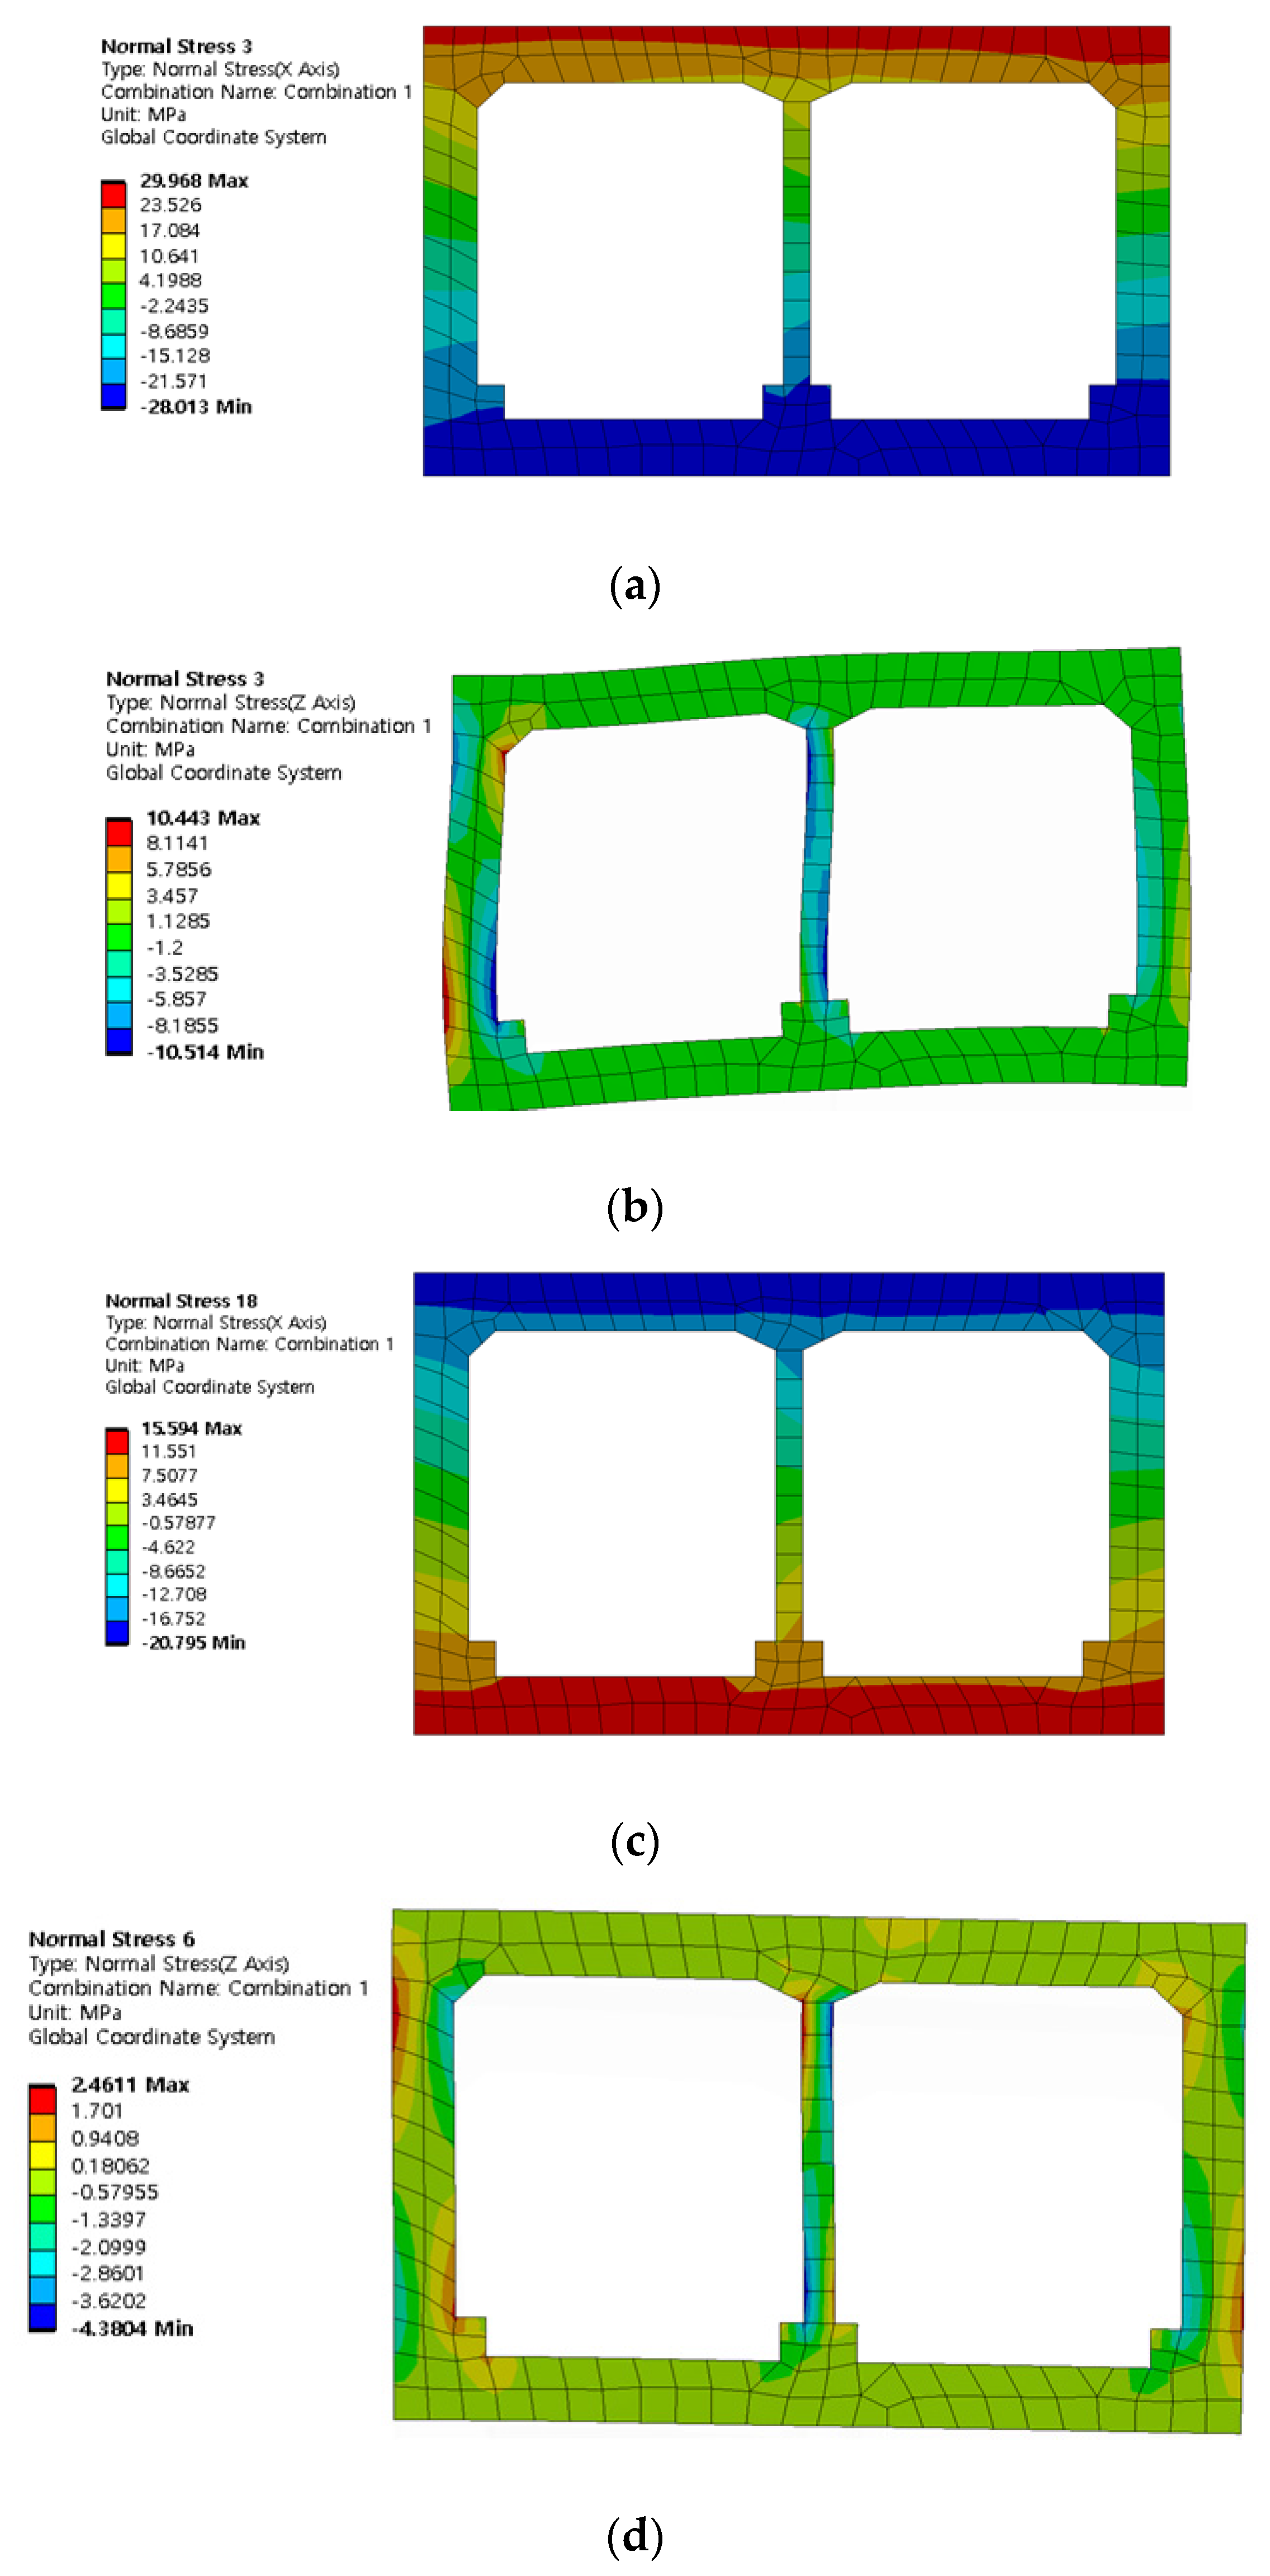
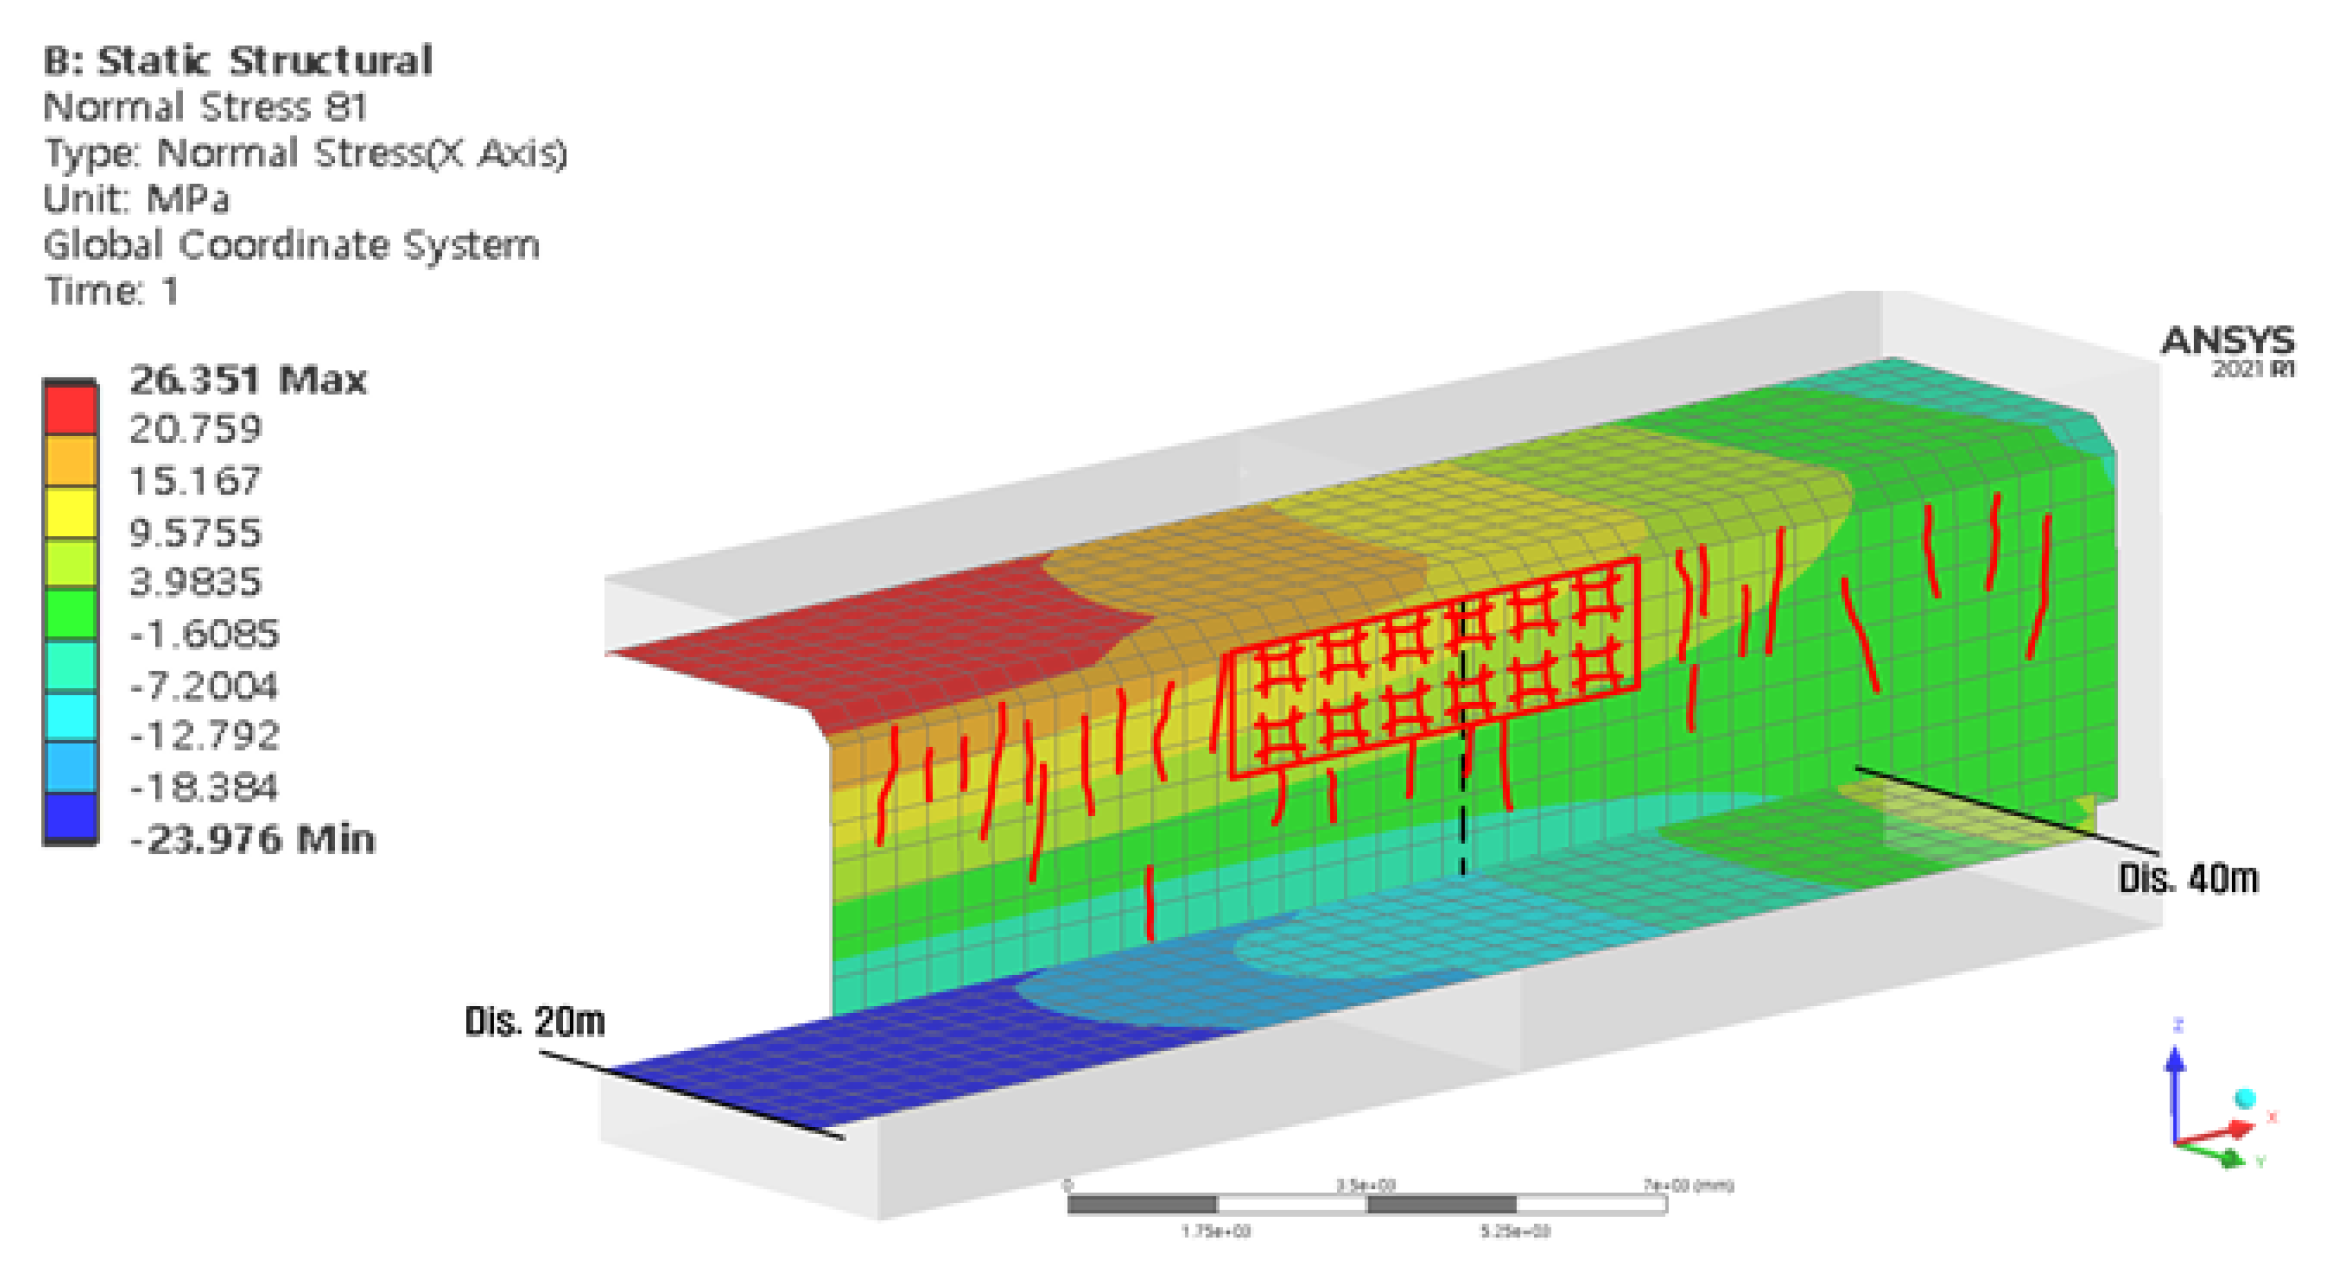
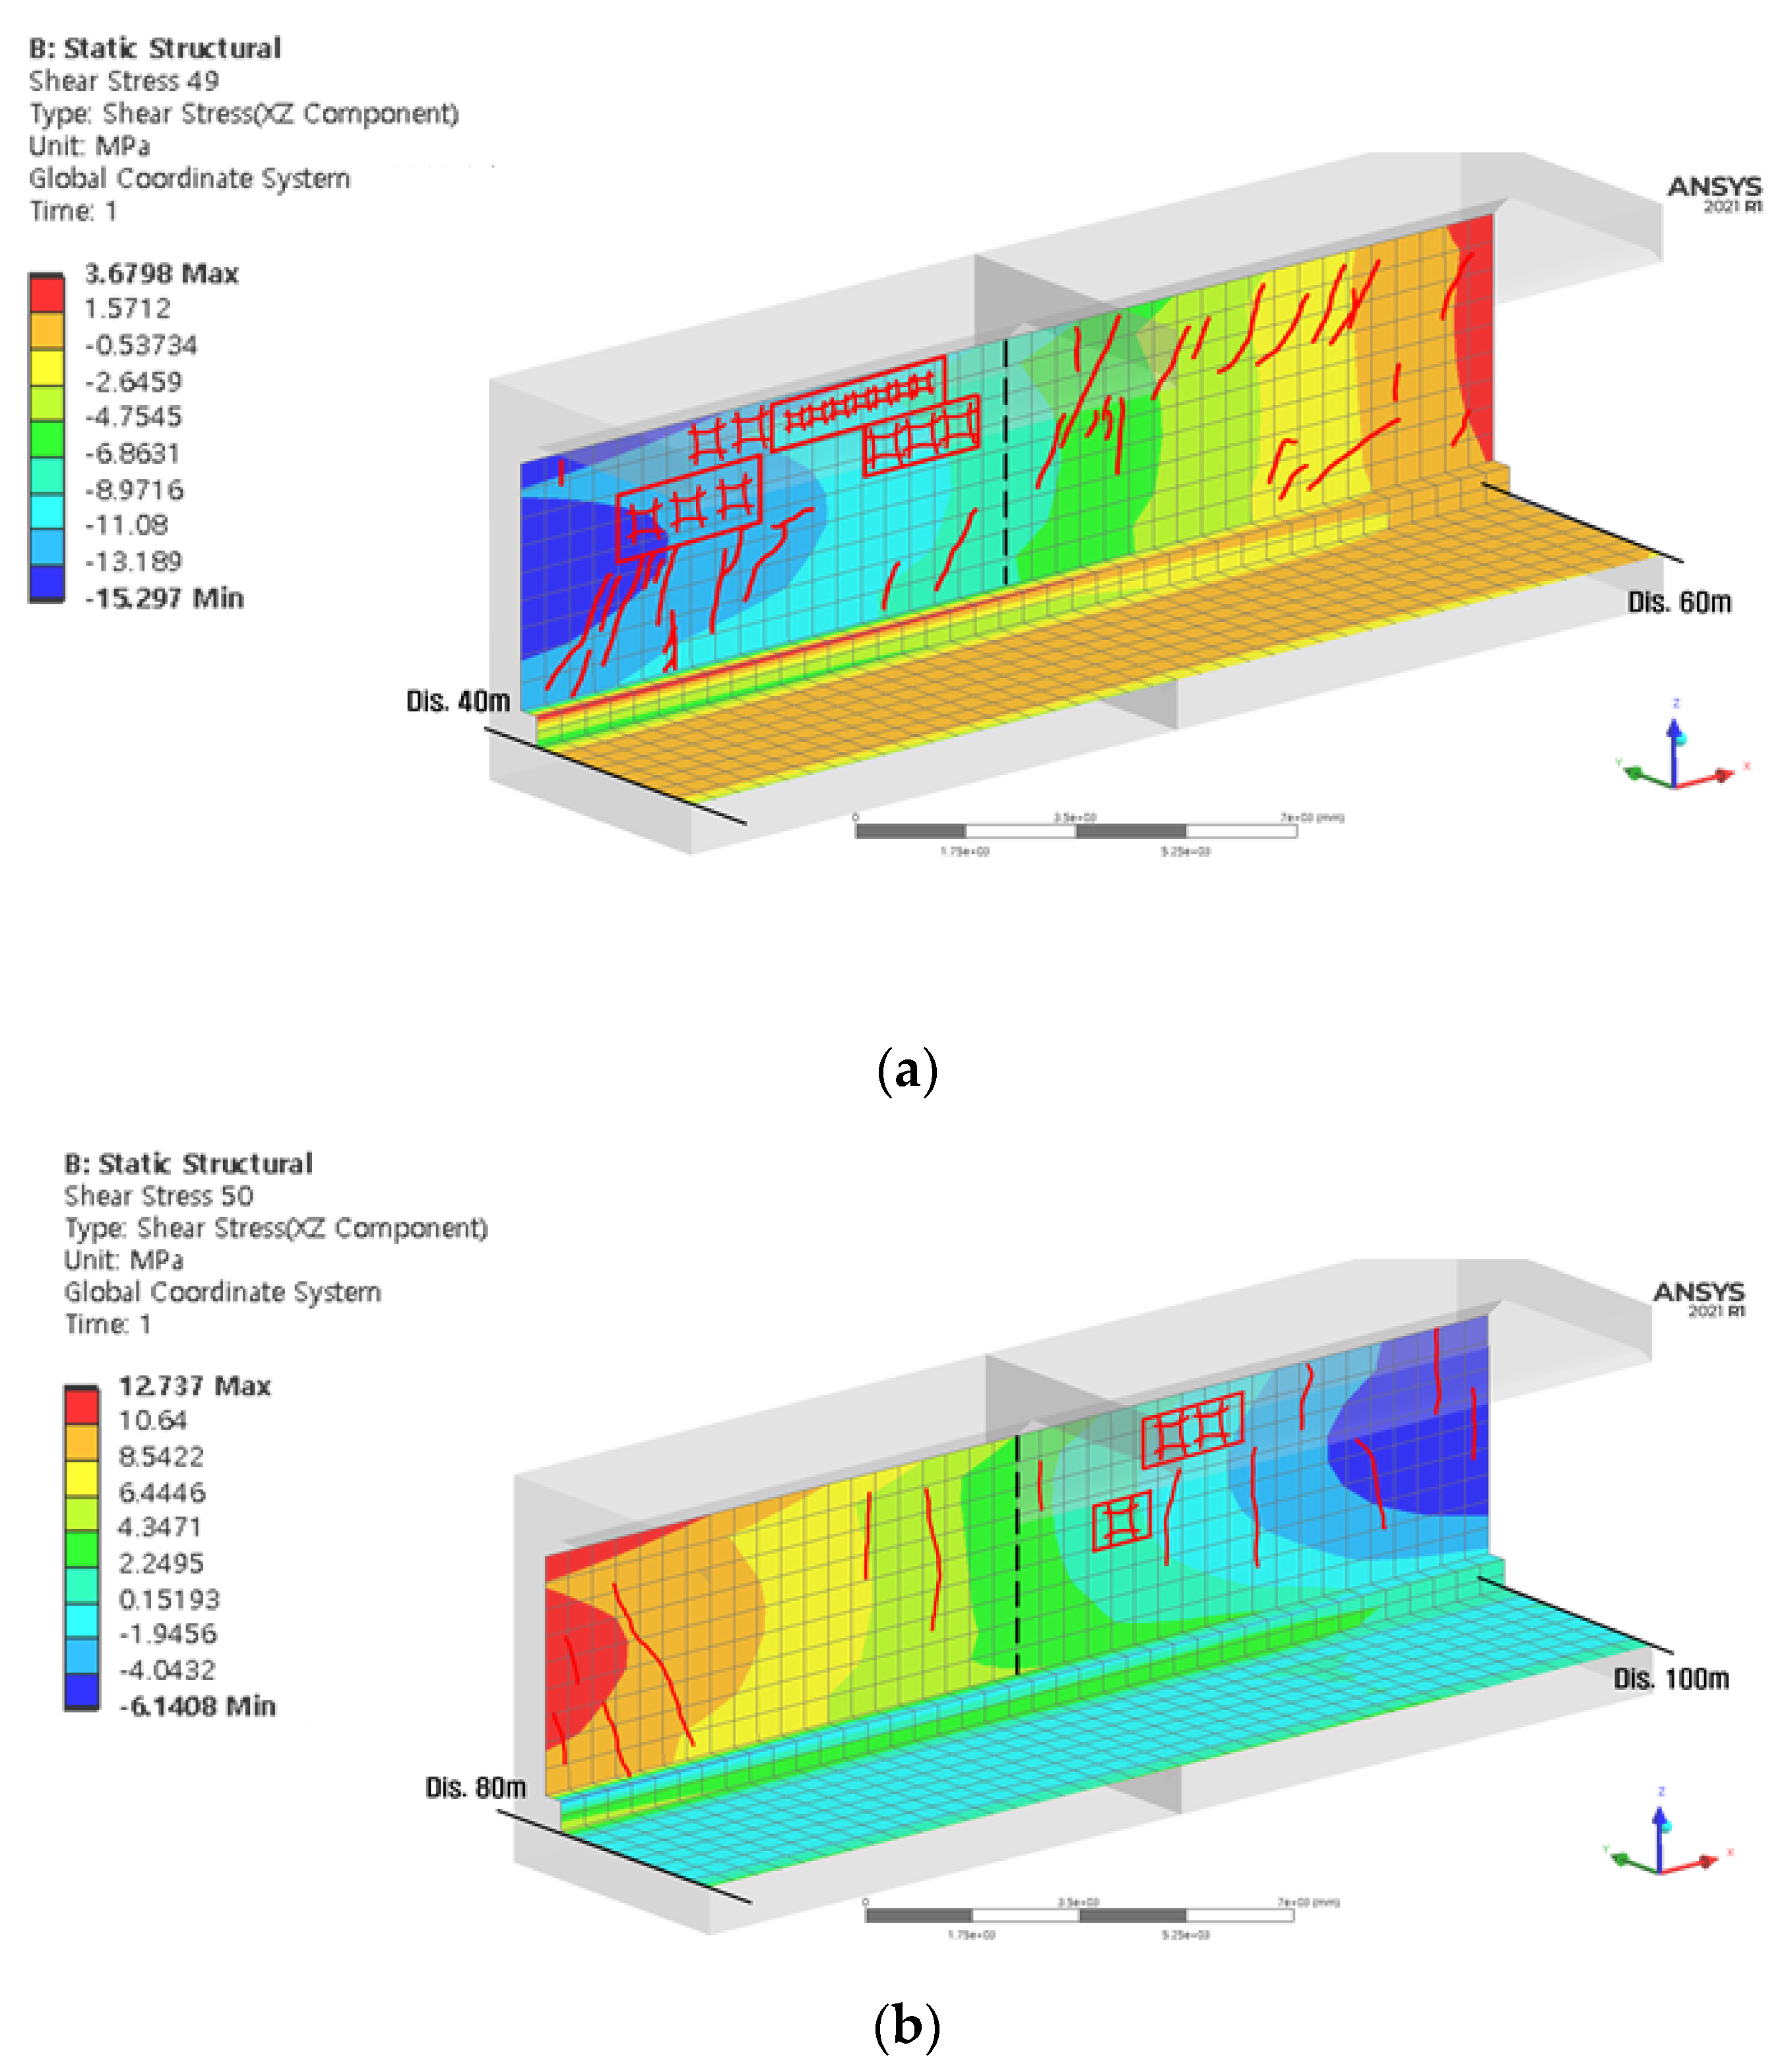
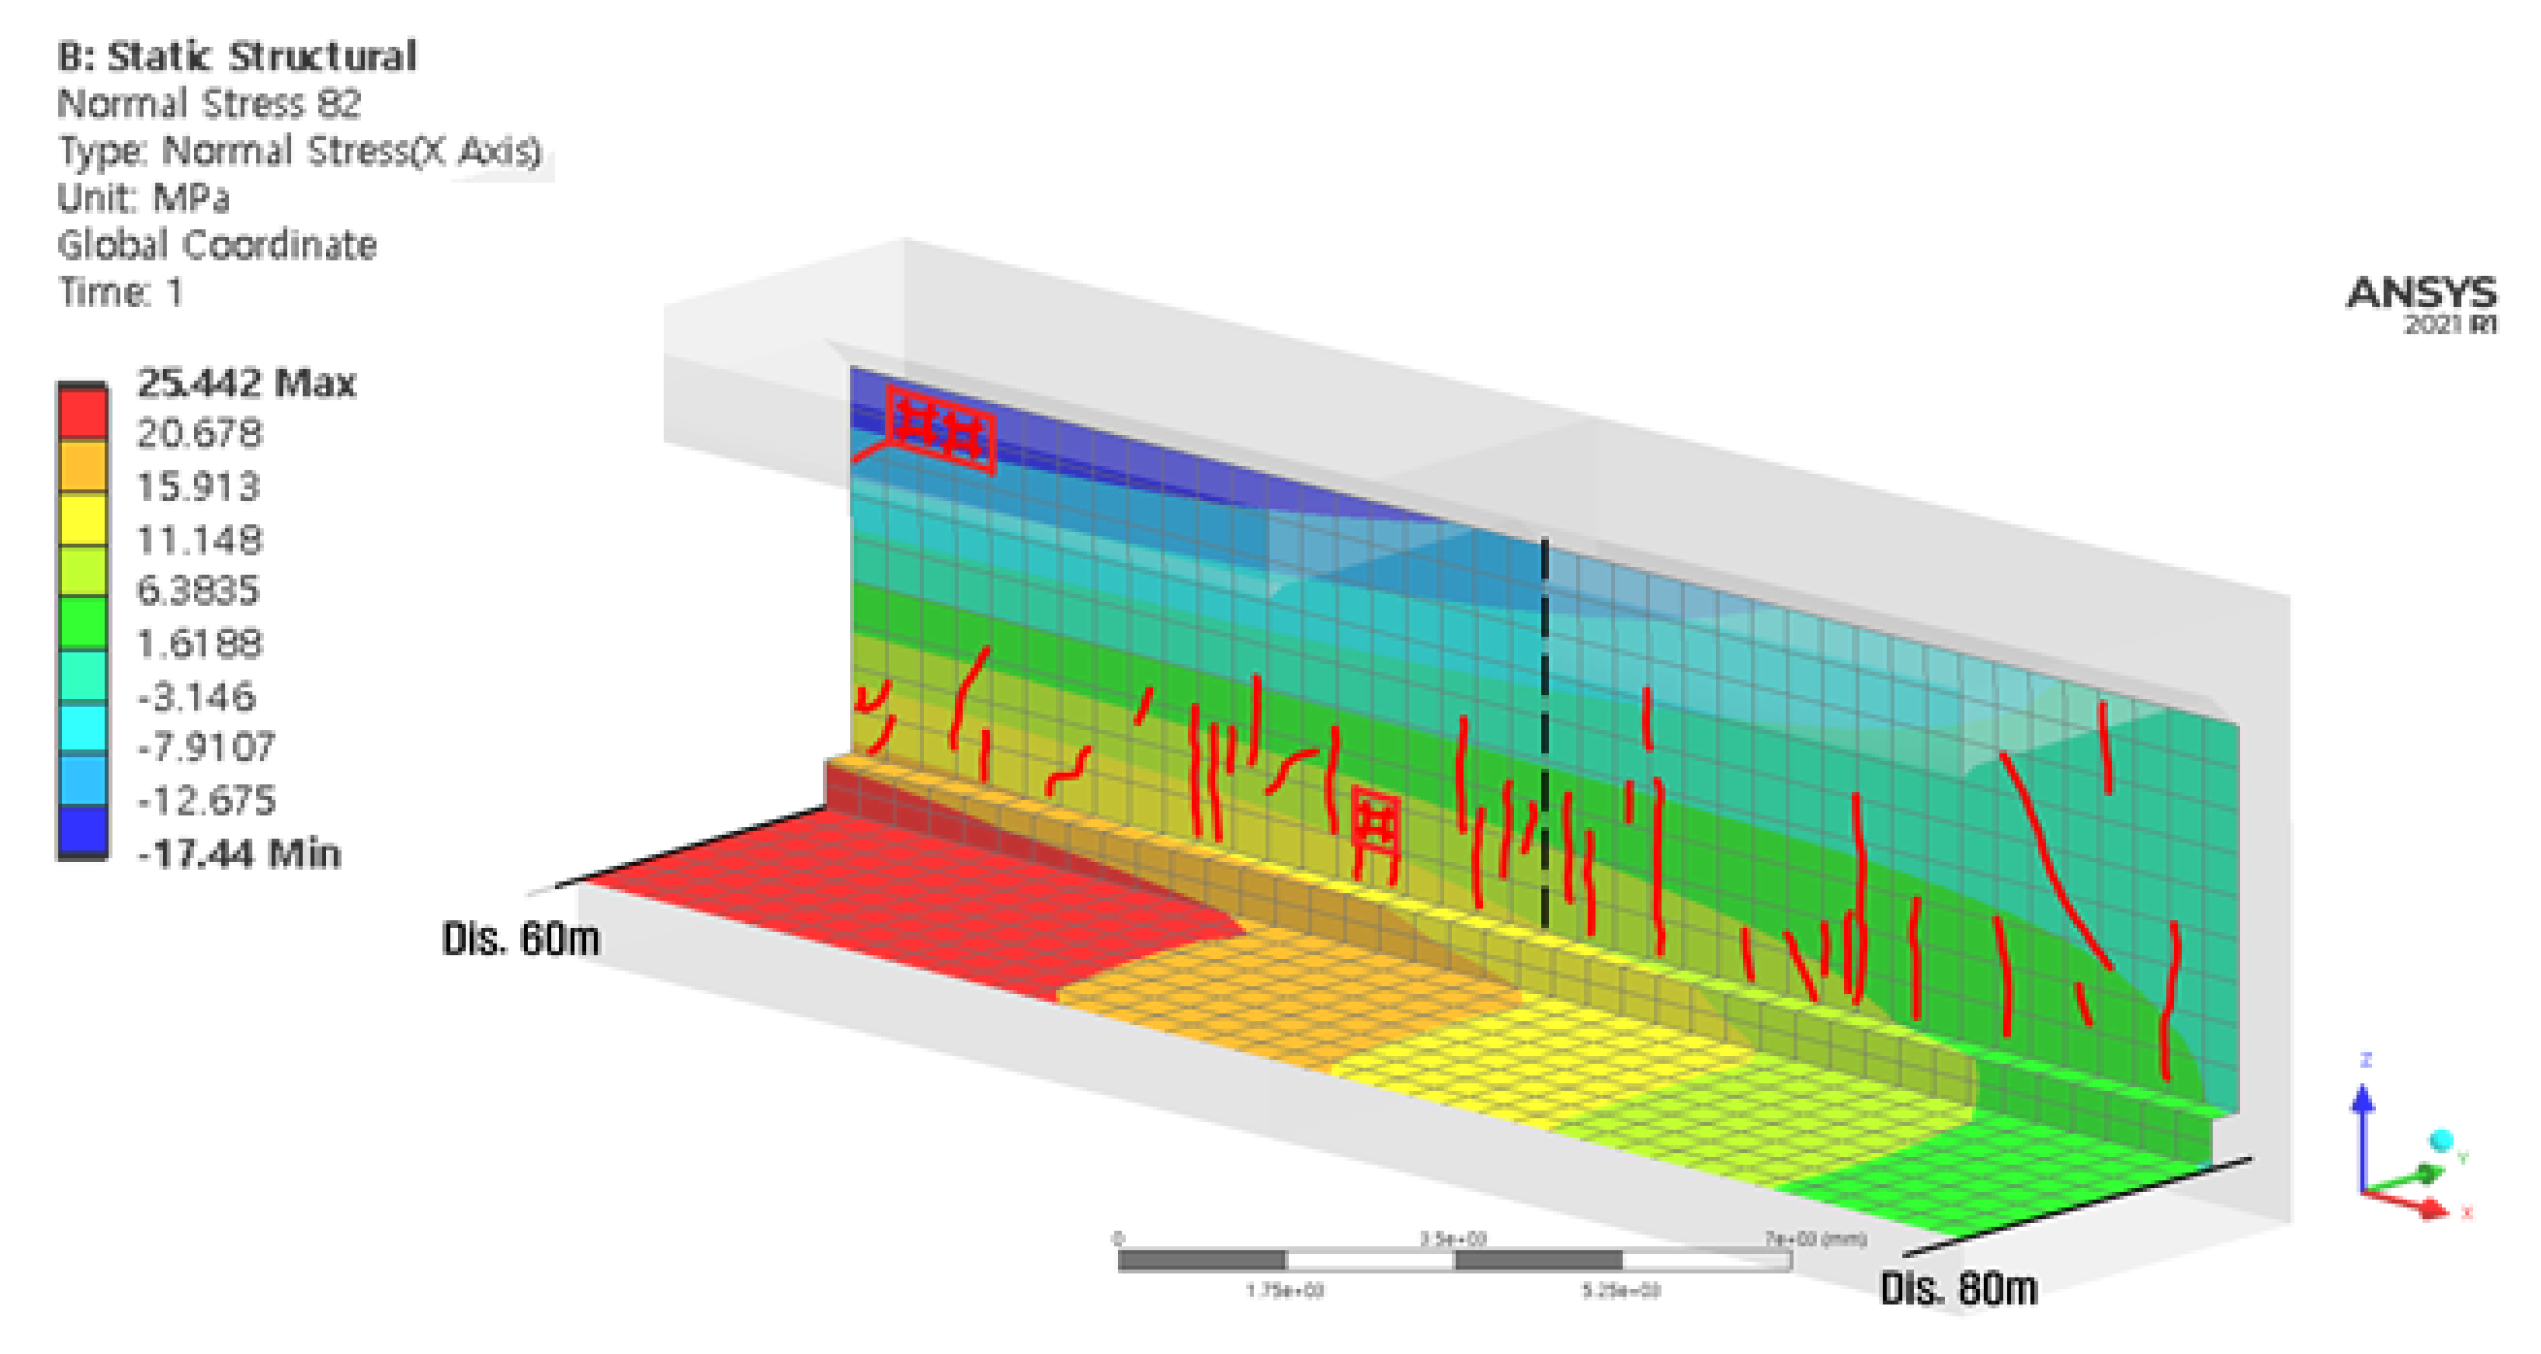
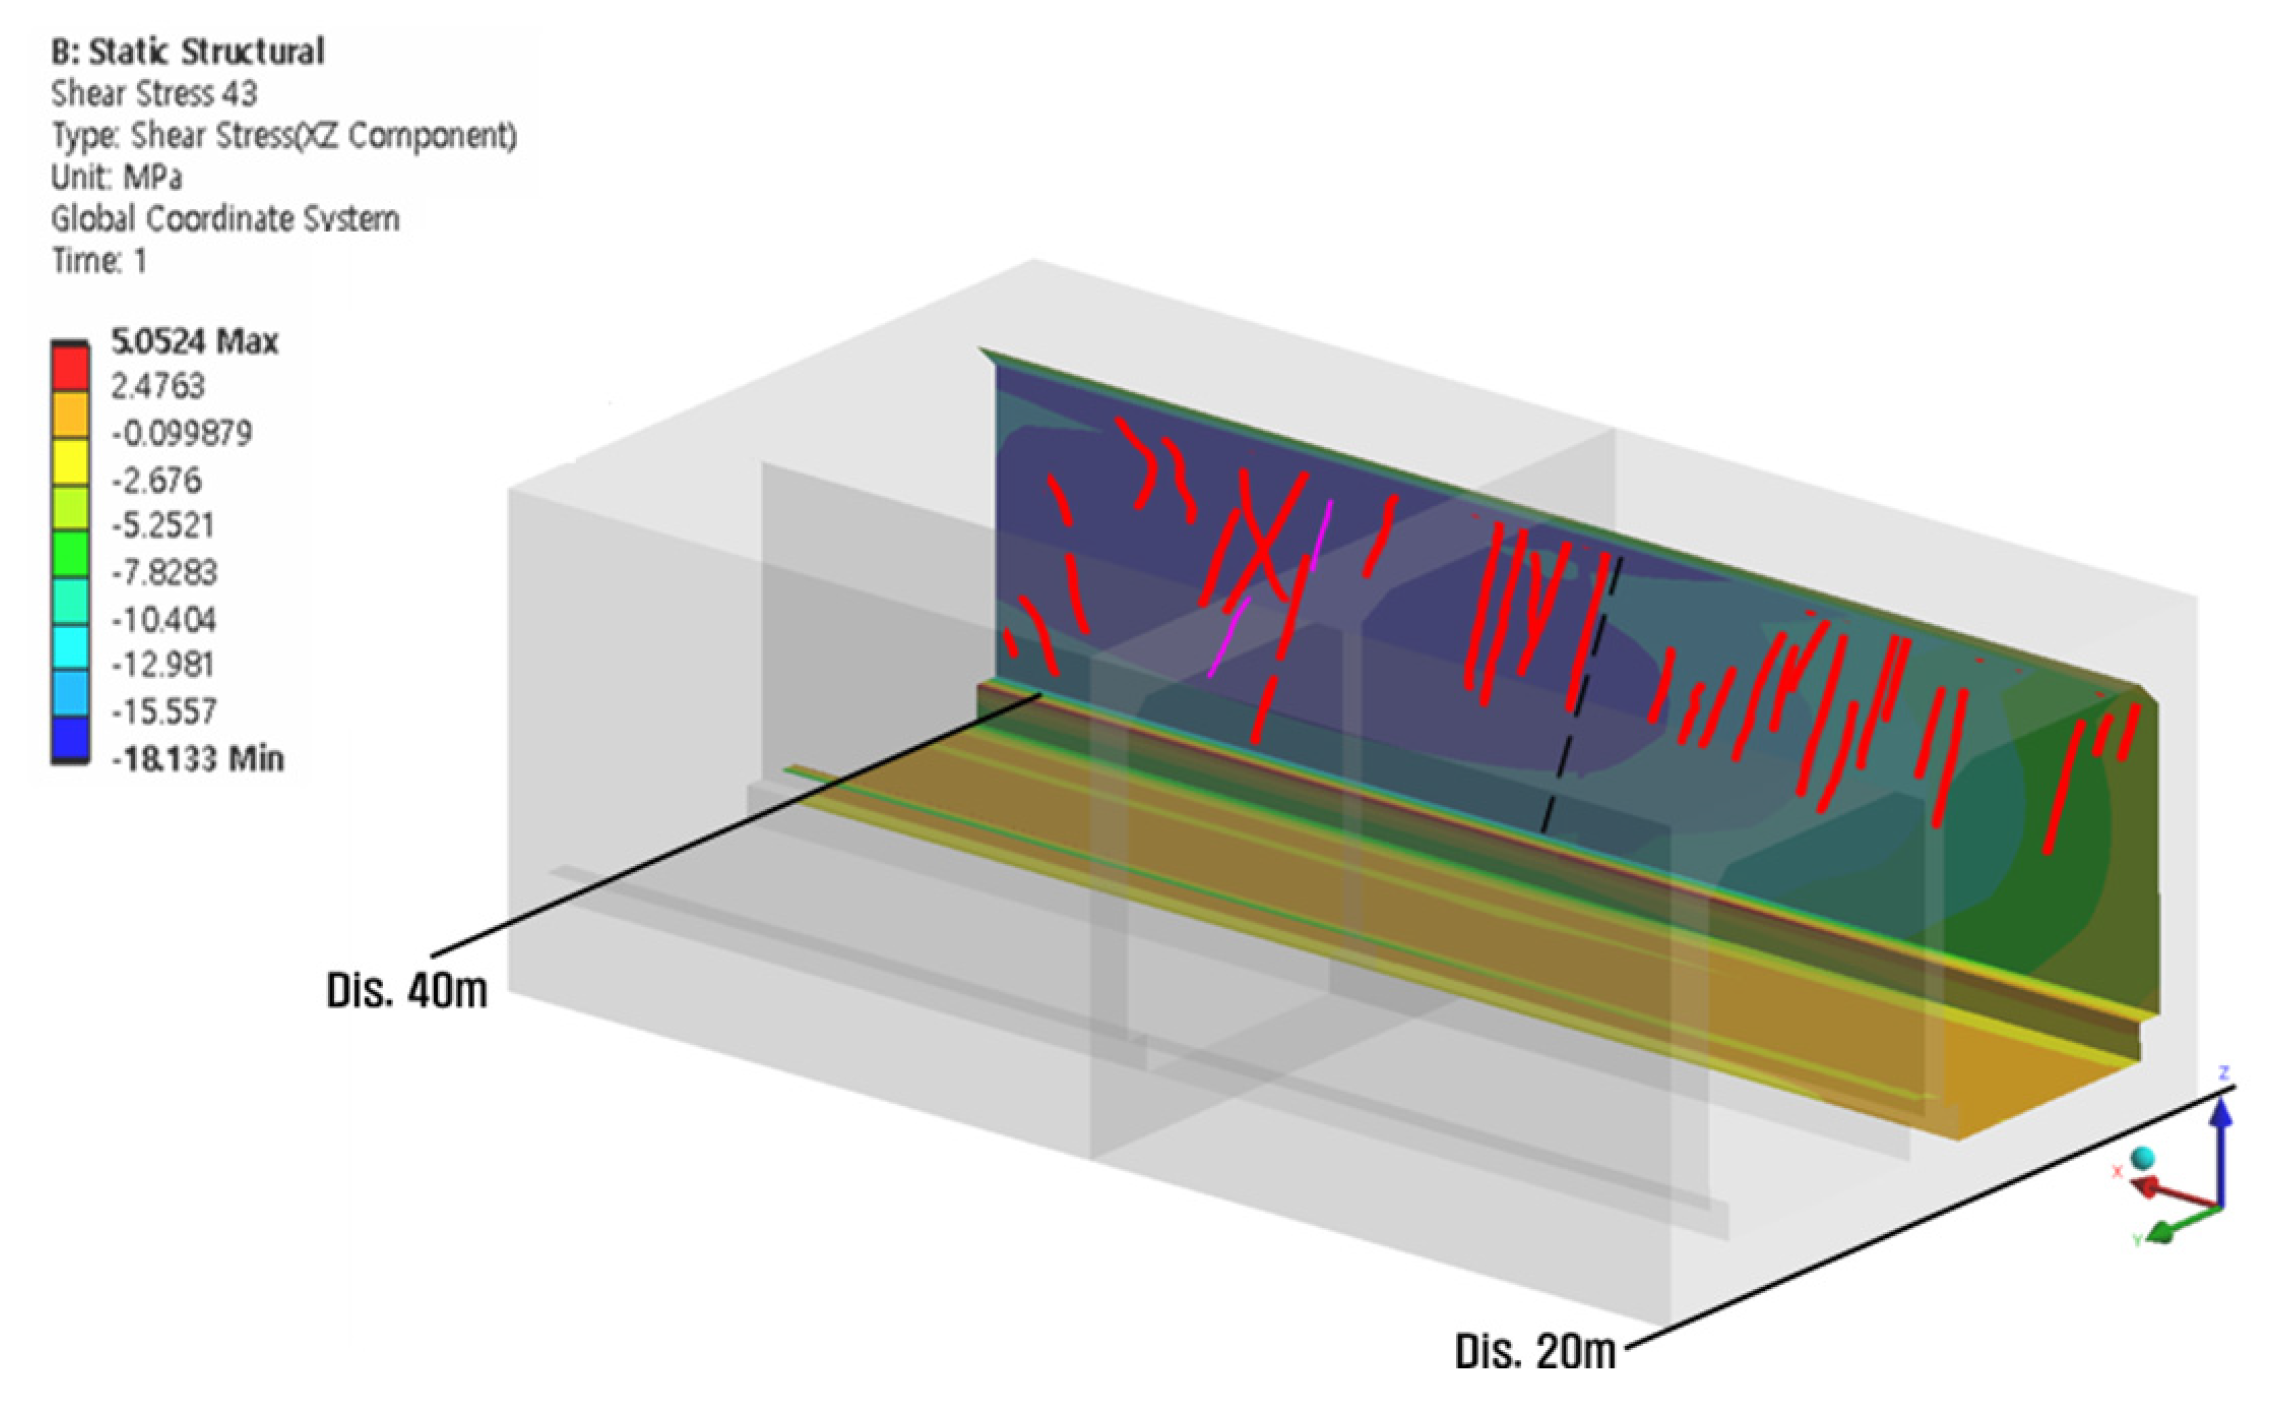
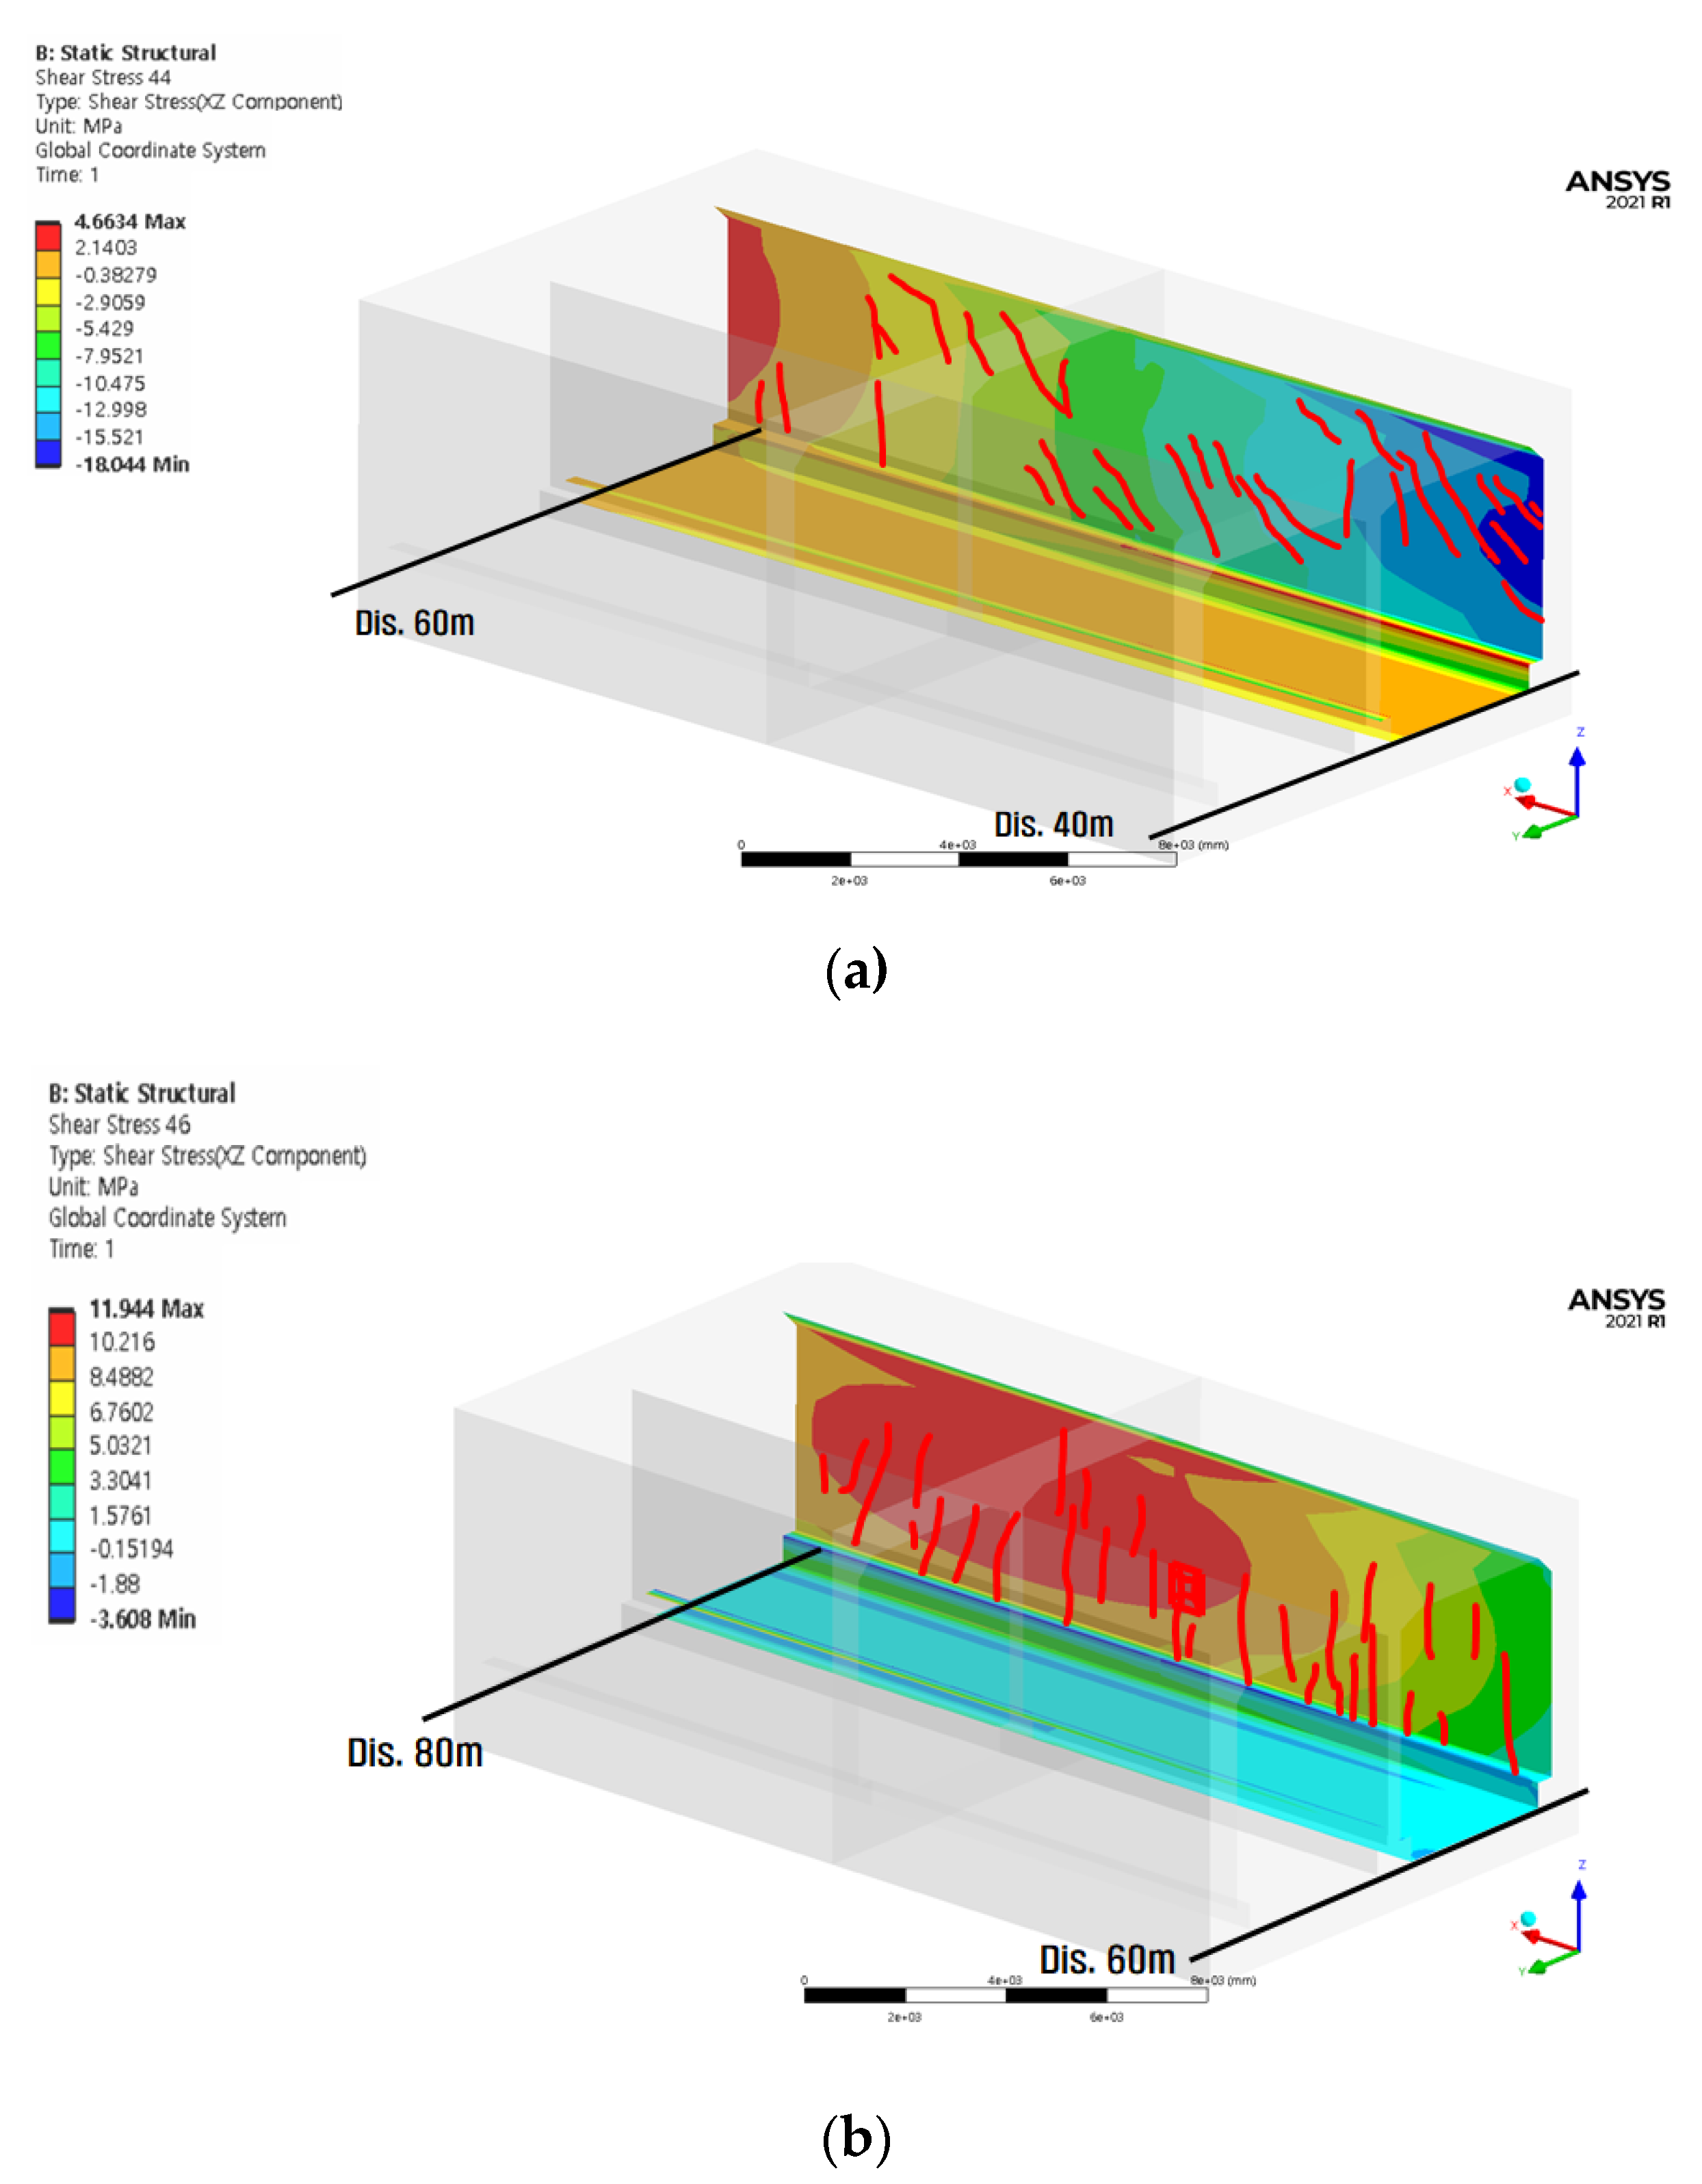
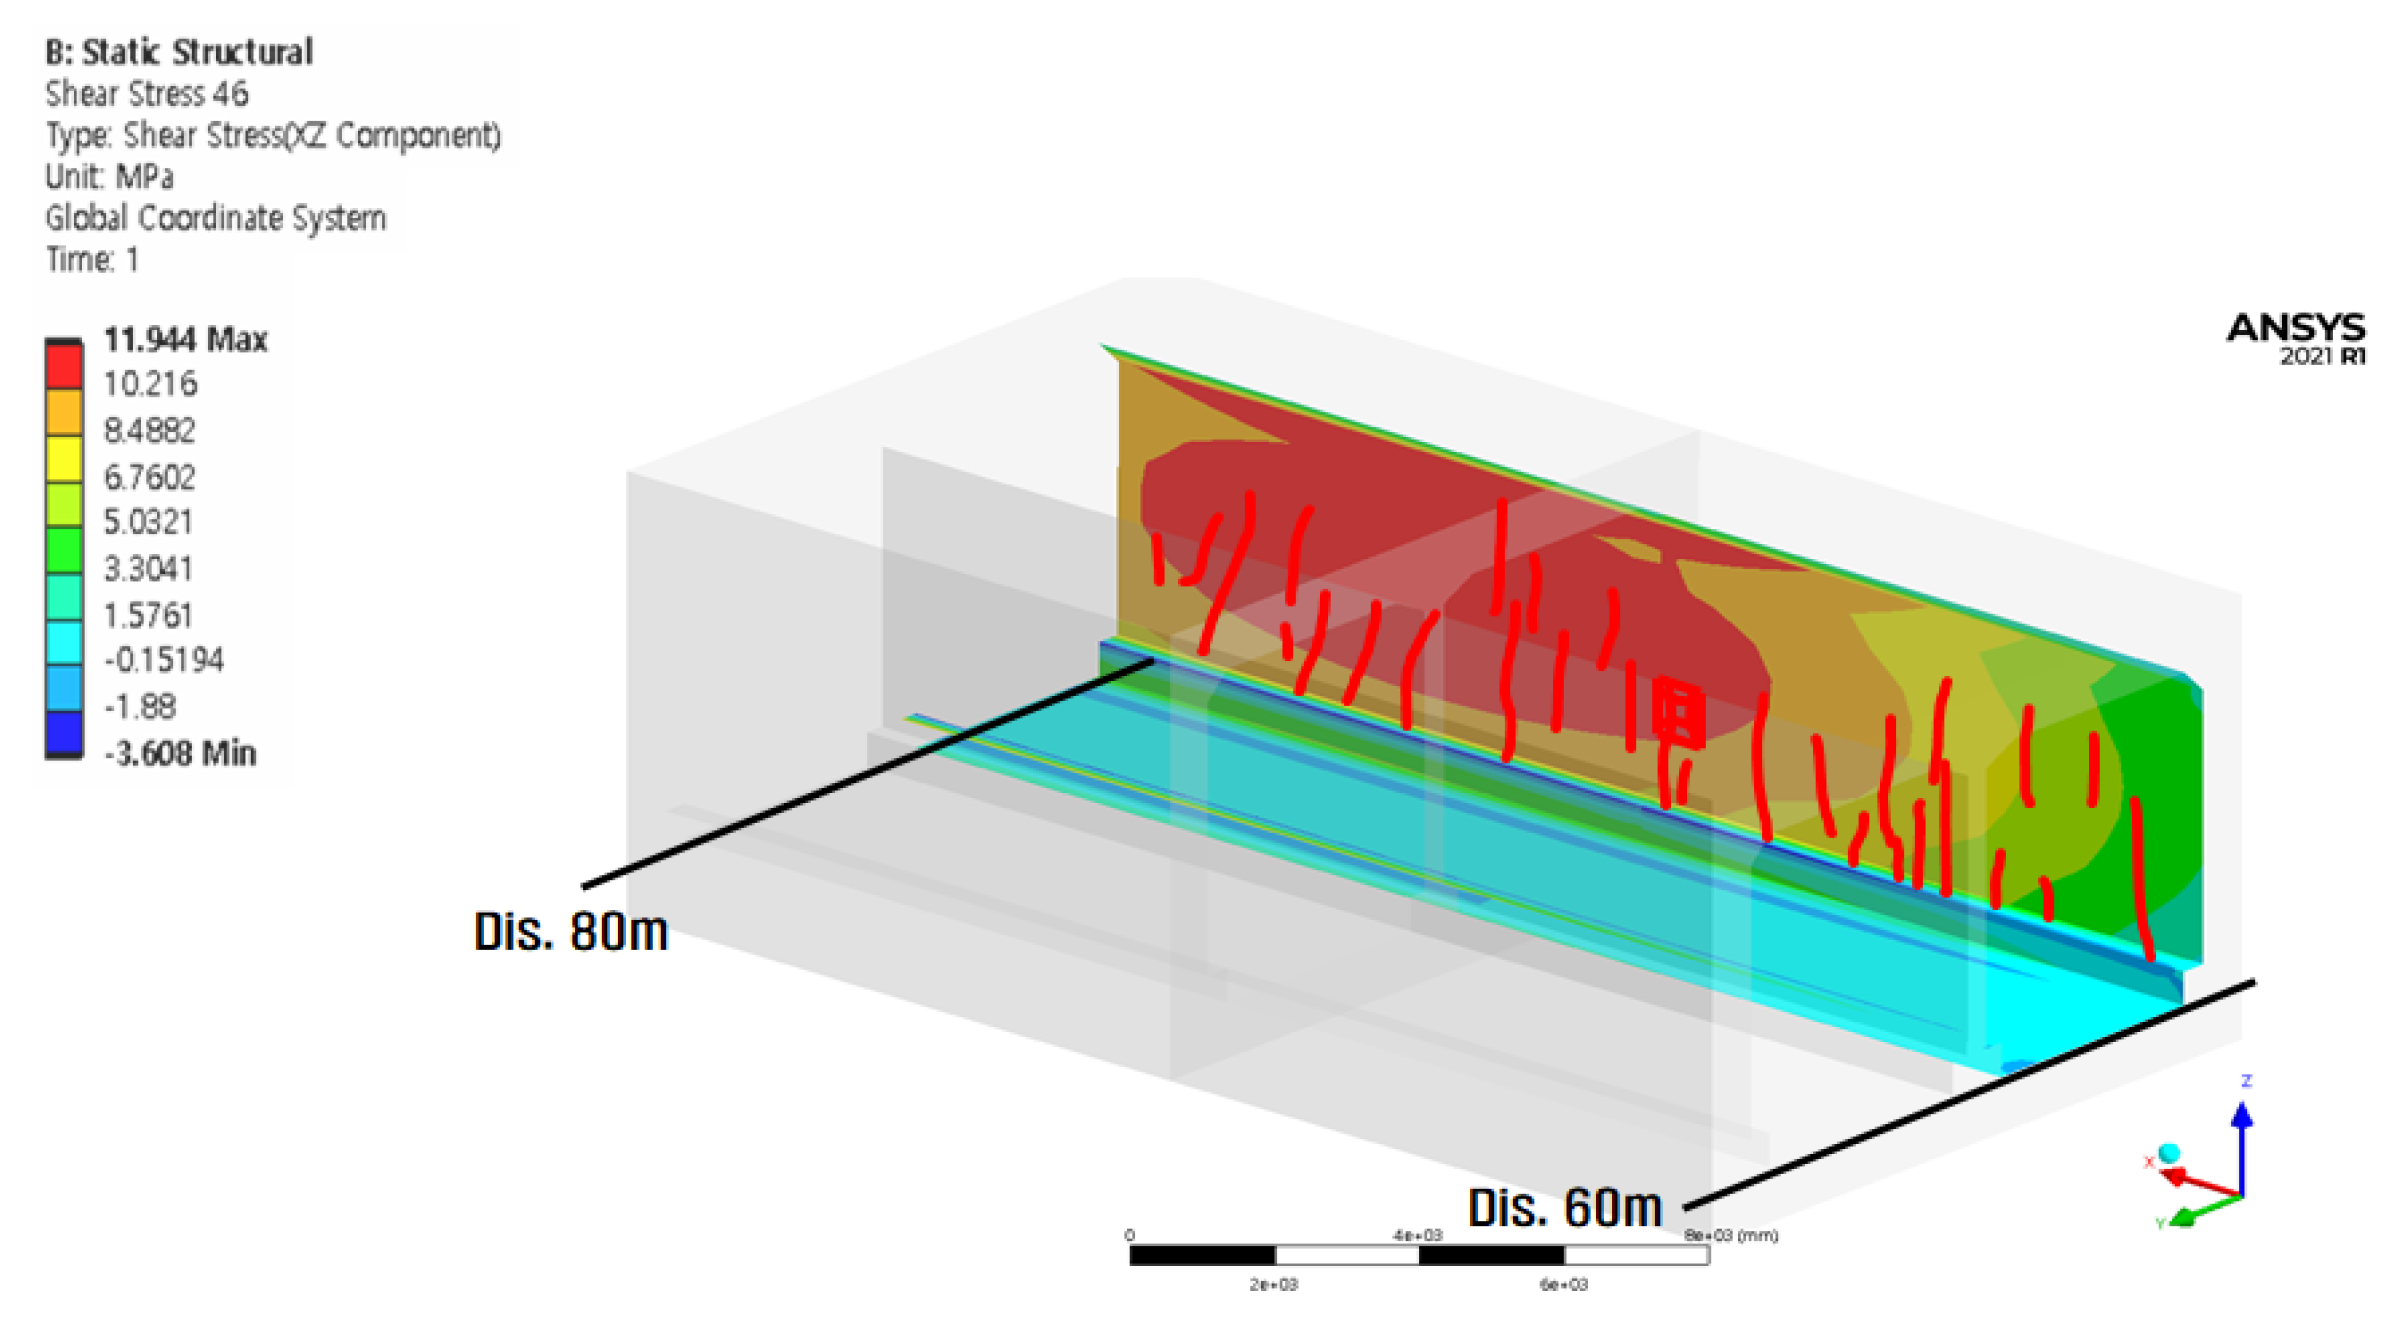
3.2. Analysis Results

Figure 7 and Figure 8 show the displacement behavior and generated stress in the underground structure, respectively. The analysis results in Figure 7 and Figure 8 indicate that the displacement behavior of the underground structure directly impacts the stress characteristics. Tensile stress was dominant in the upper slab, where maximum heaving occurred, whereas compressive behavior was induced in the lower slab. However, for the settlement section, compression occurred in the upper slab, whereas tension occurred in the lower slab, indicating a clear contrast between the stress location and that in the heaving section.
Furthermore, as shown in Figure 8a–d, the box structure in the section where the maximum heaving and settlement occurred was a continuum structure with a nonuniform subgrade reaction modulus in the longitudinal direction. There was a significant difference in the deviation of stress in the corner, exterior, and lower haunches owing to the displacement behavior of the box structure, thus inducing torsional behavior.
As a result of the vertical displacement analysis applying the ground reaction force coefficient, it increased by +79 mm in the 20–30 m section, and subsided by −208.15 mm in the 60–70 m section. Tensile stress was generated in the raised portions of the top and bottom of the underground box structure.
As shown in Figure 8, not only the inner side of the cross-section of the box but also the exterior side in contact with the subgrade may have been damaged because of the displacement behavior of the underground box structure. The damage that occurred on the inner side of the box structure can be identified through visual inspection and can be appropriately repaired and reinforced accordingly. However, the damage that occurred on the exterior side of the box’s cross-section could not be visually identified, which is probably a vulnerable damage section in the long term. Therefore, it is essential to have a measure to repair and reinforce both the inner and exterior sides by predicting the damage that is likely to occur on the exterior side by identifying the damage on the inner side.

4. Results and Discussion

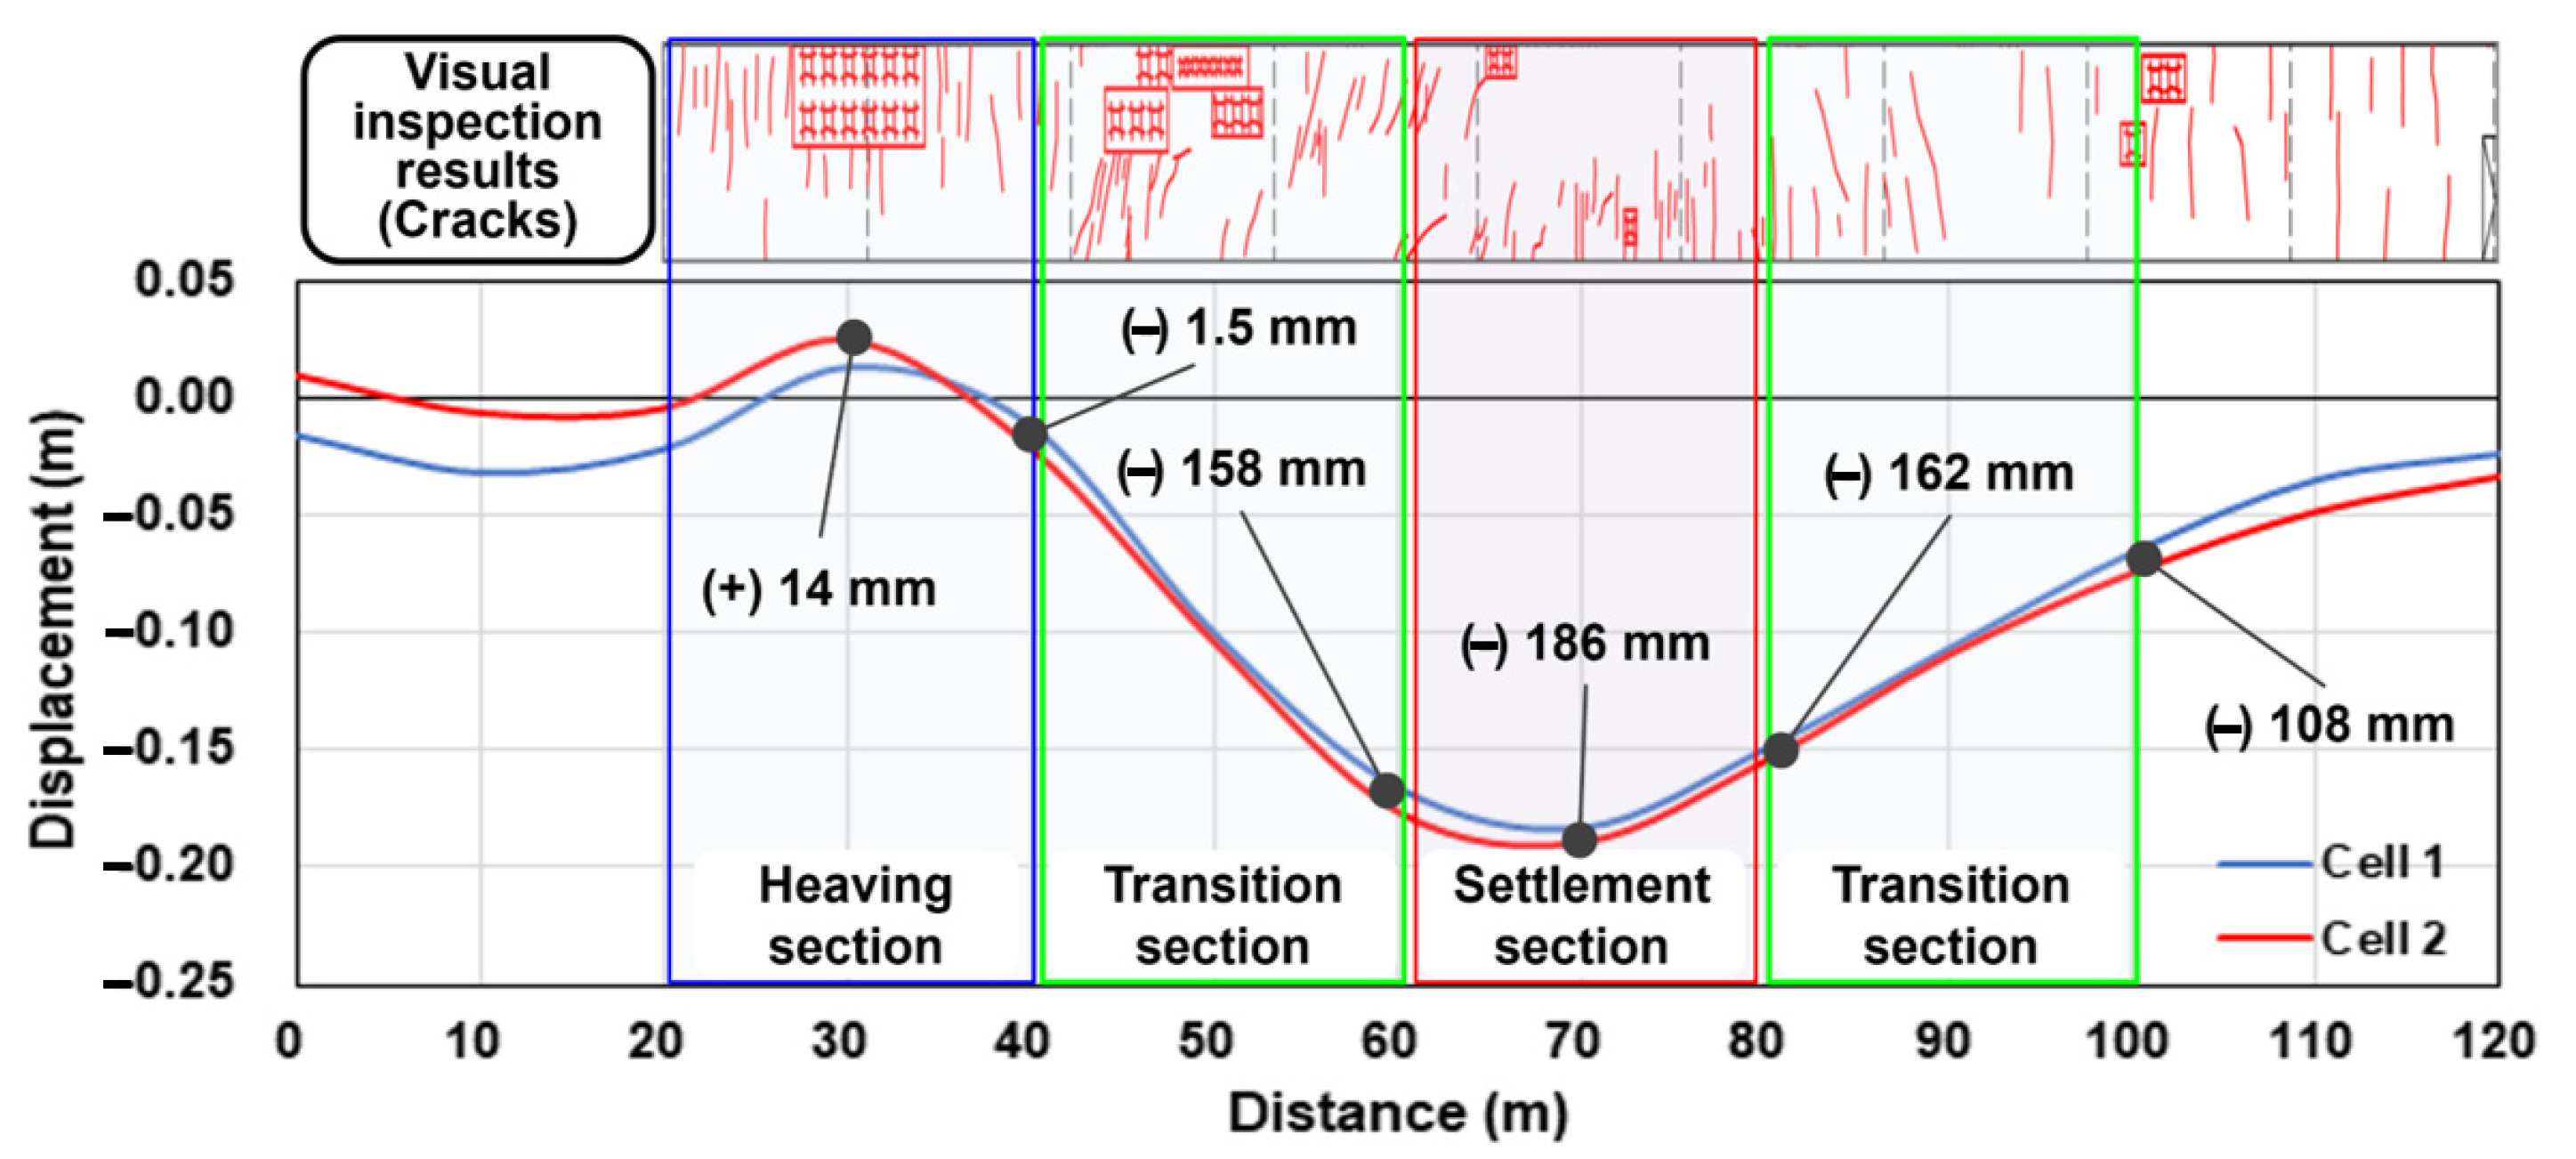
4.1. Comparison of Damage to Subway Box Structures and Finite Element Analysis

In this study, the visual inspection mesh diagram and numerical analysis results were comparatively analyzed, and are shown in Figure 9, Figure 10, Figure 11, Figure 12, Figure 13 and Figure 14.
Compressive stress occurred in the upper part of the Cell 1 wall in the 20–40 m section, and transverse cracks occurred owing to the compressive stress in the upper and central parts of the wall. The analysis results of the stress in the wall at the maximum heaving section showed that the tensile stress that occurred on the lower side of the upper slab was transferred to the upper side of the wall, as shown in Figure 9. Therefore, the magnitude of the analyzed stress at the center of the wall reached the ultimate strength of the concrete.
The analysis results of the wall stress in the transition section showed that shear stress that exceeded the allowable shear stress occurred in the wall at the 40–60 m section because of the extreme difference in the displacement and stress of the structure, which occurred in the maximum heaving and settlement sections, as illustrated in Figure 10a.
However, the level of shear stress was small and the onsite crack level was also relatively small in the 80–100 m section where the settlement was converged in the maximum settlement section, as illustrated in Figure 10b, which was a transition section whose deviation of displacement was evaluated to be relatively small. Therefore, the damage level at the transition section directly affected the deviation in the displacement at the adjacent section, verifying that the transition section where settlement and heaving occurred simultaneously, was more vulnerable.
Transverse cracks in the lower part of the wall and lateral cracks in the construction joints occurred in the 60–80 m section of Cell 1 because of the compressive stress of the slab below the settlement end point, as shown in Figure 11.
The stress analysis results in the wall at the maximum settlement section showed that the tensile stress that occurred on the upper side of the lower slab was transferred to the lower side of the wall, thus affecting the section up to the center of the wall, as illustrated in Figure 11. Therefore, the level of the analyzed stress reached the ultimate strength of concrete. Additionally, the range of the stress levels in the analysis result was relatively consistent with the location and scale of crack occurrence.
Comparing the visual inspection mesh diagram and FEA of the Cell 2 wall, it can be inferred that transverse cracks occurred in the 20–40 m section because of the compressive stress of the heaving wall, as shown in Figure 12.
In the 40–60 m section, when compressive stress was applied to the wall at the boundary point, a transverse crack at the top of the wall and a diagonal crack in the slab at the bottom of the end point occurred, as shown in Figure 13a. In the 80–100 m section, as shown in Figure 13b, oblique cracks occurred owing to the compressive stress on the wall at the boundary point. Transverse and oblique cracks occurred in the lower part owing to the compression of the end wall.
In the 60–80 m section, transverse and oblique cracks occurred at the bottom of the end point of the wall owing to stress transfer owing to the compressive stress of the subsidence slab, as shown in Figure 14.
In the Cell 2 section, lateral cracks occurred in the heaving wall, at the top of the boundary, and at the bottom of the boundary, owing to the combined action of ground heaving and settlement. In addition, transverse cracks occurred in the lower part of the subsidence wall.

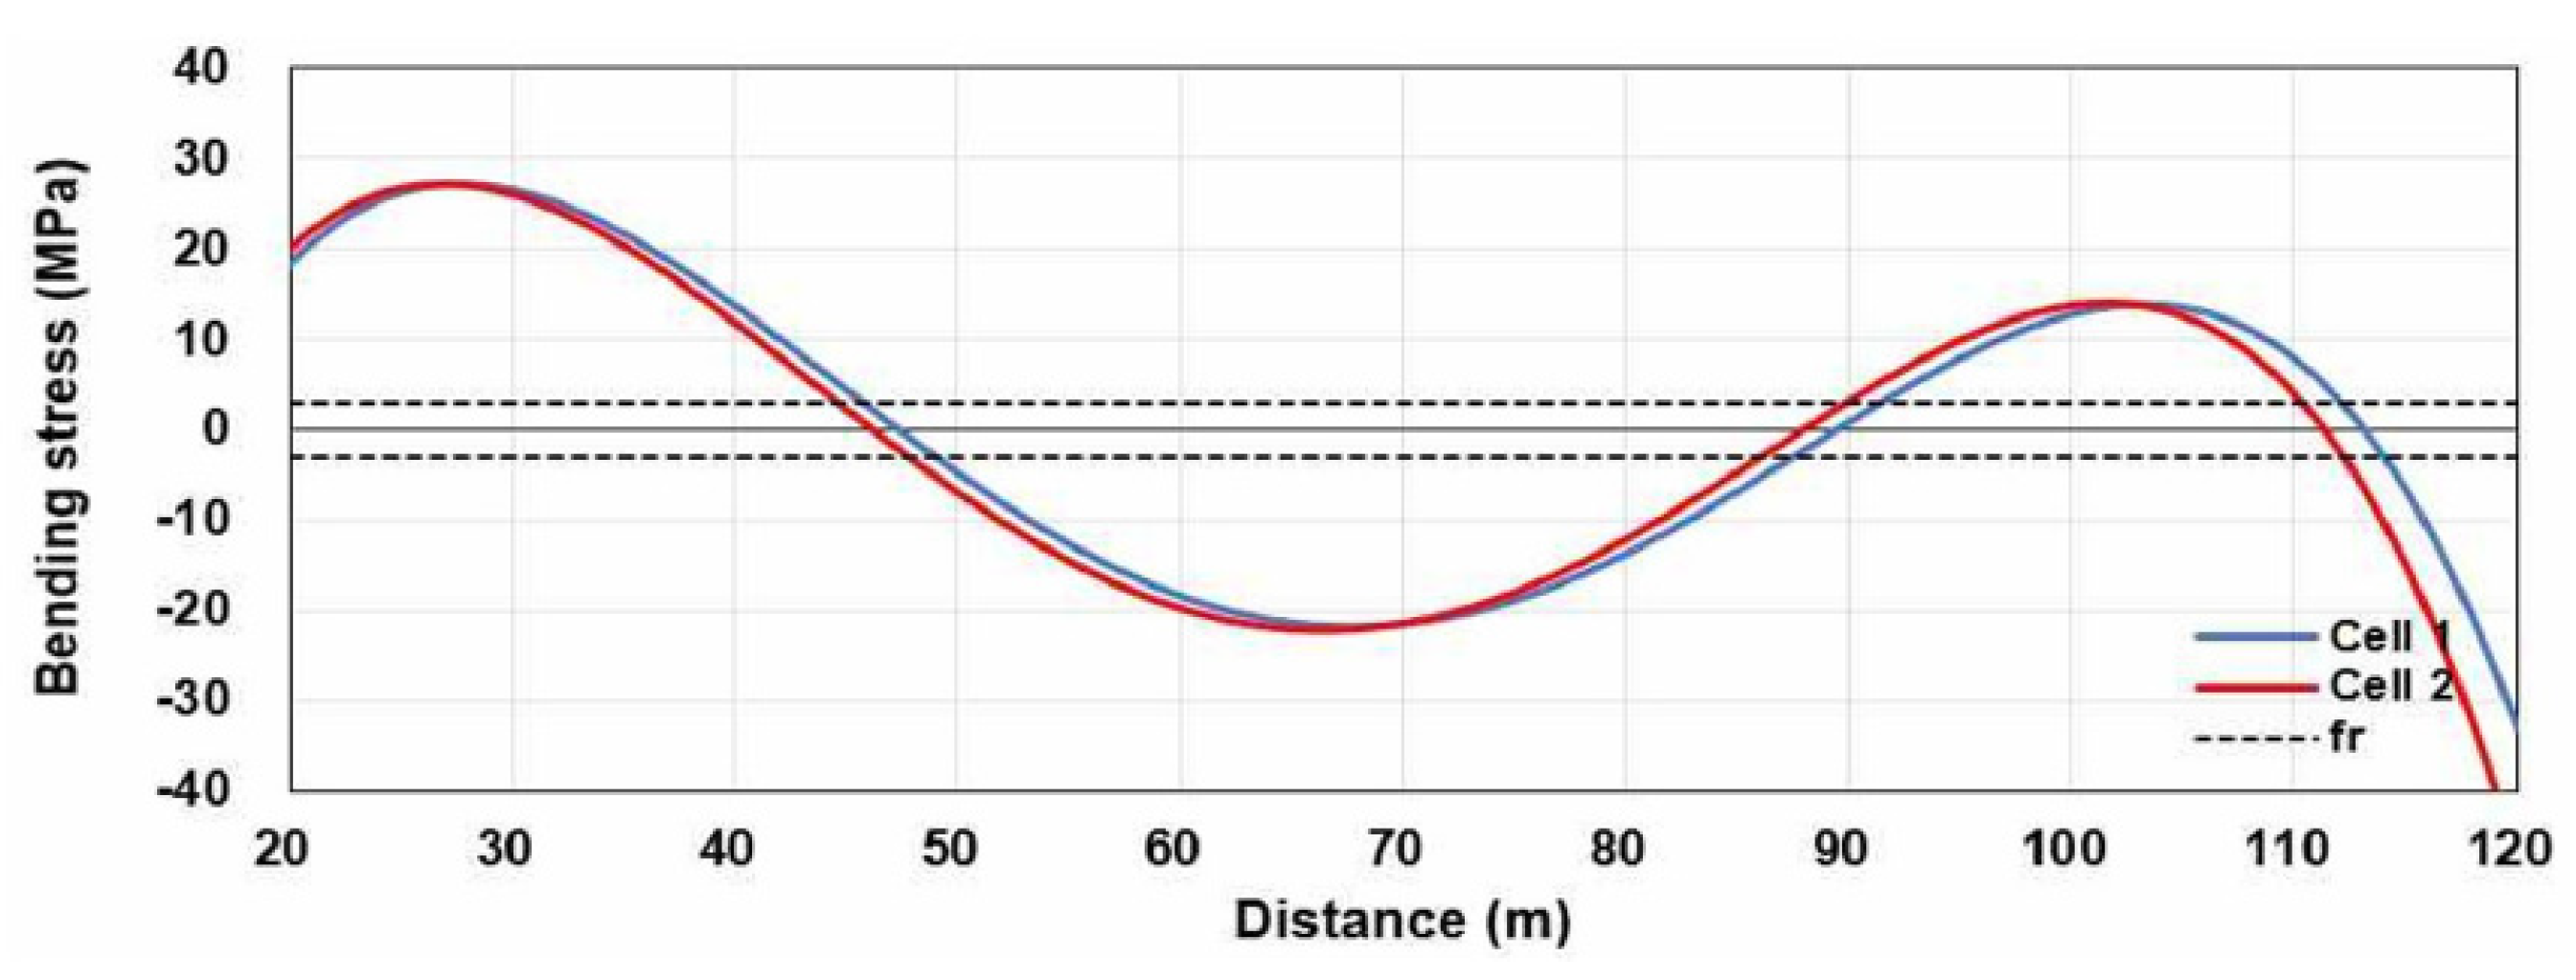
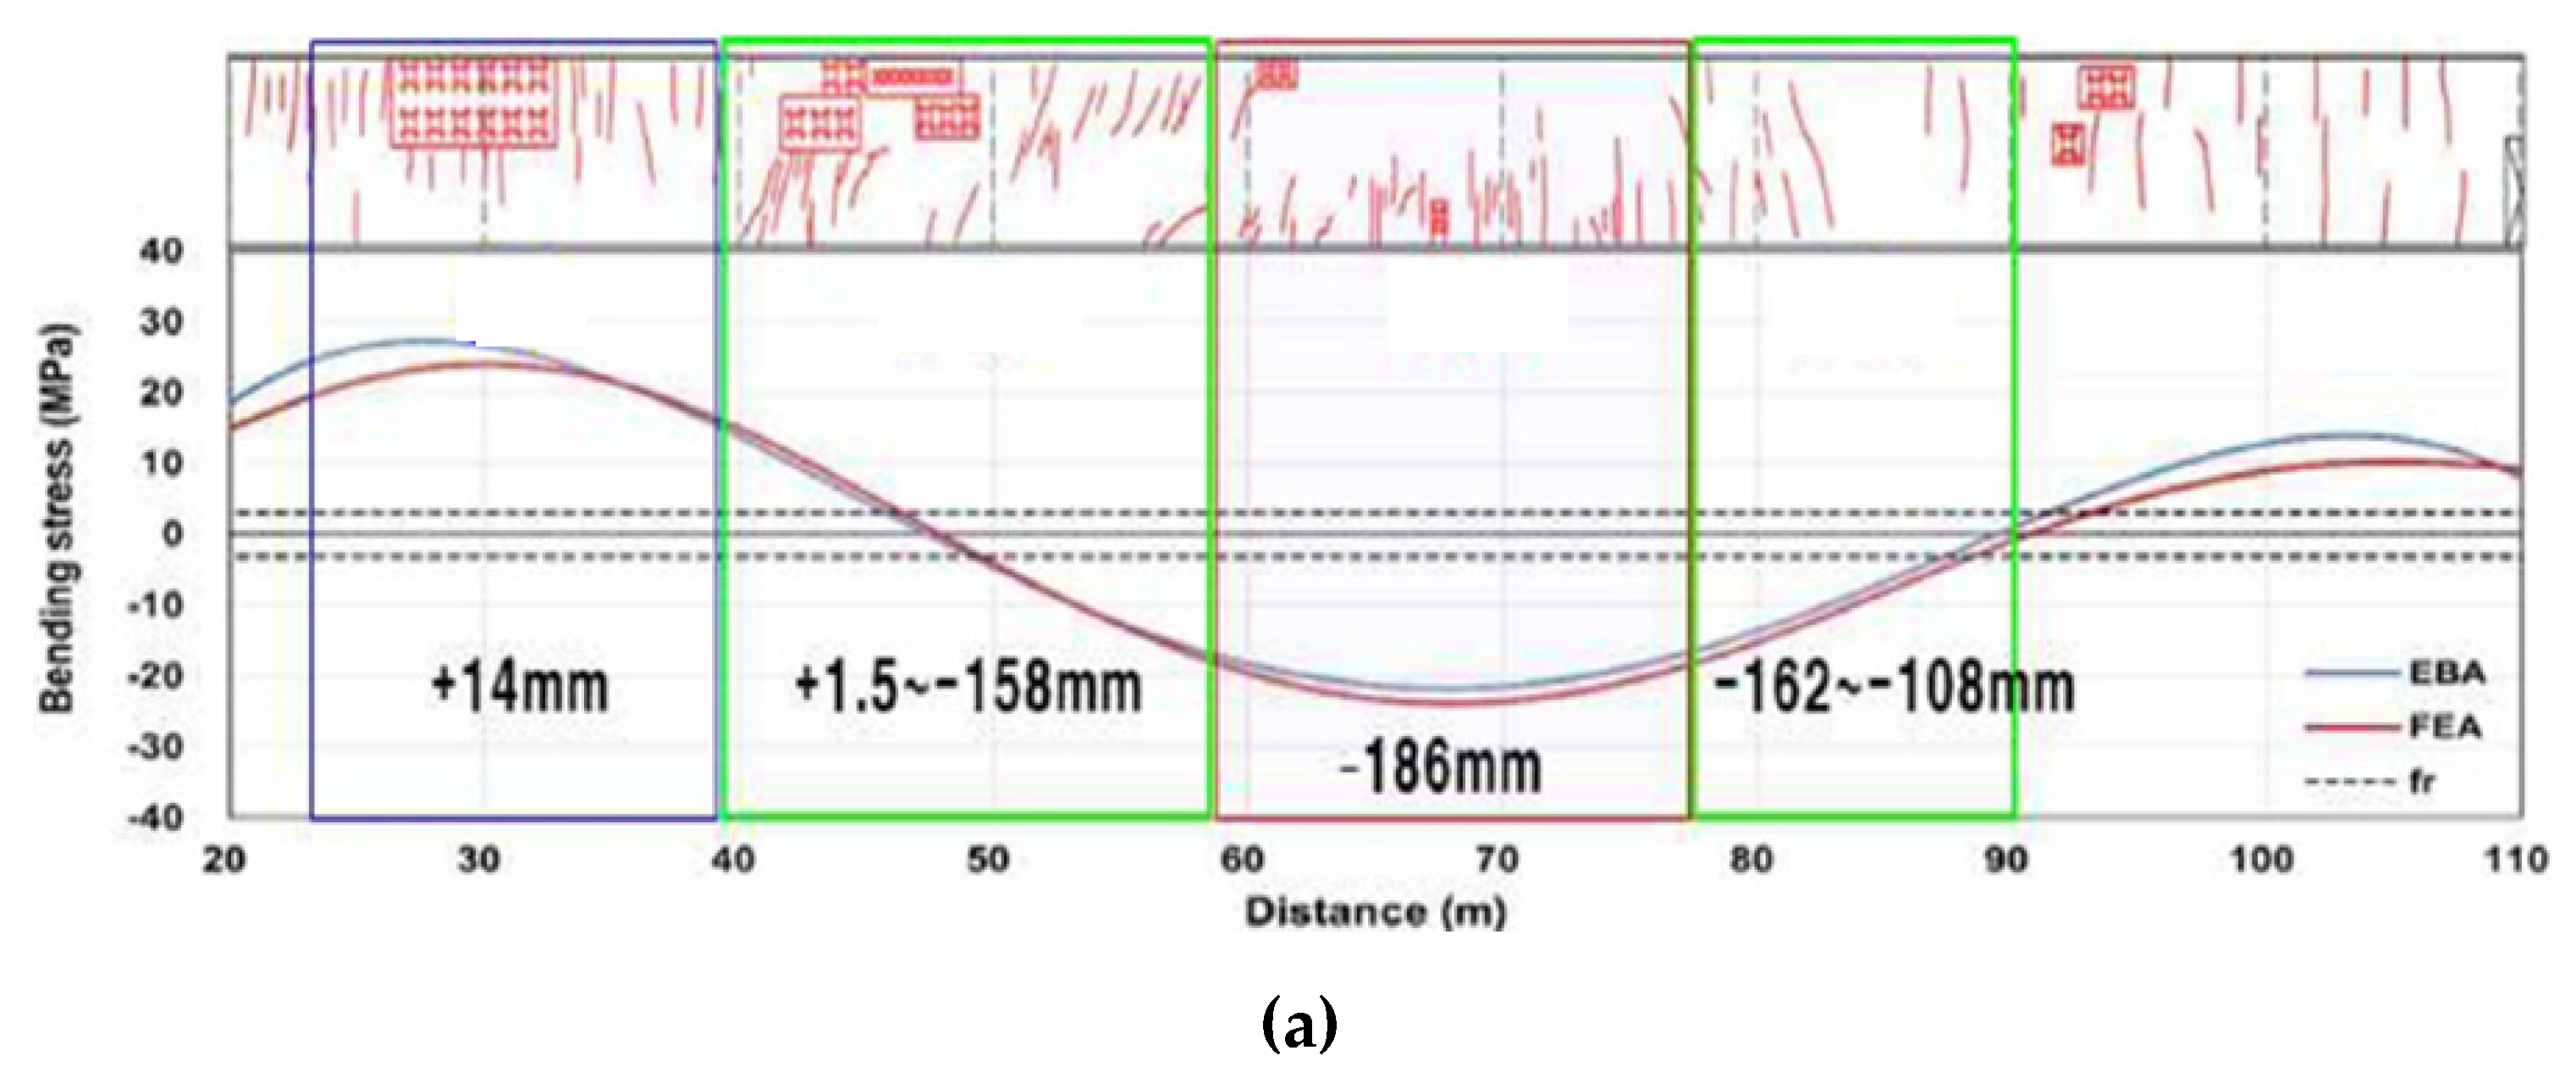
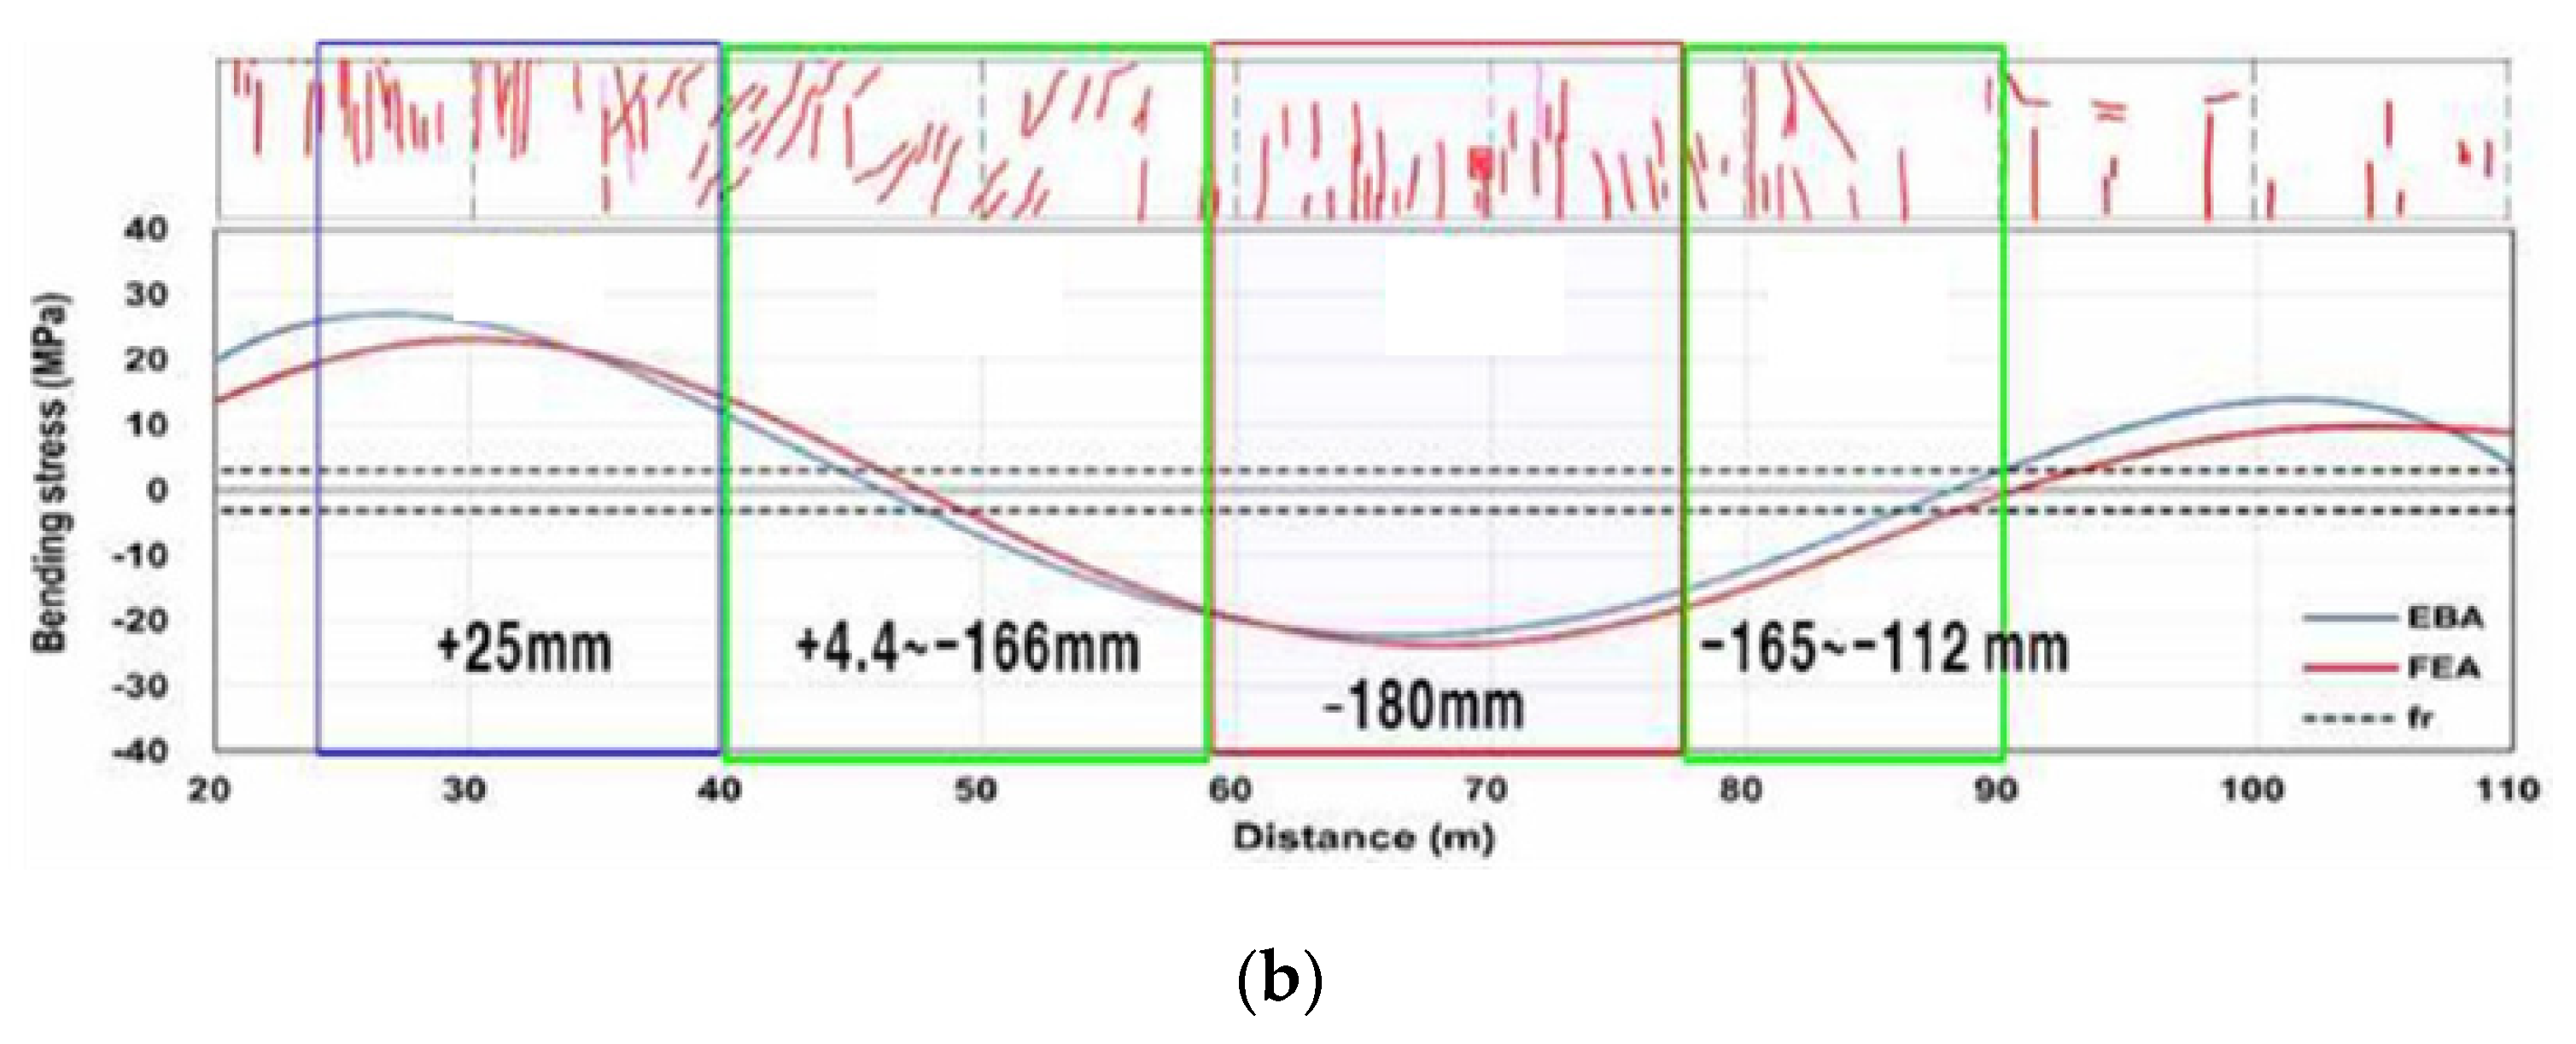
4.2. Comparison of Elastic Beam and Numerical Analyses

Figure 15 shows a comparison of the bending stress generated in the subway box structure through elastic beam and finite element analyses.
The bending stress exceeded the concrete rupture modulus in most sections. The concrete rupture modulus in Figure 15 was obtained using Equation (4).
f r = 0.63 λ f c k ,
where f c k is the standard design compressive stress of concrete ( f c k = 24   MPa ) , λ is coefficient of light weight concrete (1.0).
Compressive stress was generated inside the raised lower slab and the lower slab of the subsidence of Cells 1 and 2.
In the case of Cell 1, the compressive stress of most sections exceeded the concrete rupture modulus, as shown in Figure 16a, with transverse cracks in the elevation, diagonal cracks at the upper and lower edges of the boundary, and transverse cracks at the top of the subsidence.
As shown in Figure 16b for Cell 2, most of the compressive strength exceeded the concrete rupture modulus. In Cell 2, several transverse cracks in the elevation, diagonal cracks at the boundary, and transverse cracks at the top of the subsidence occurred. In addition, as a result of comparing for the elastic beam analysis and finite element analysis, a difference of approximately 20% occurred in the heaving and approximately 15% difference occurred in the settlement. Therefore, the numerical analysis result of the elastic beam analysis was generally consistent with the crack occurrence.

5. Conclusions

This study proposed a damage evaluation technique based on the displacement behavior of a subway box structure. We conducted in situ measurements (leveling and crack investigation) and numerical analysis. The conclusions are as follows.
(1)
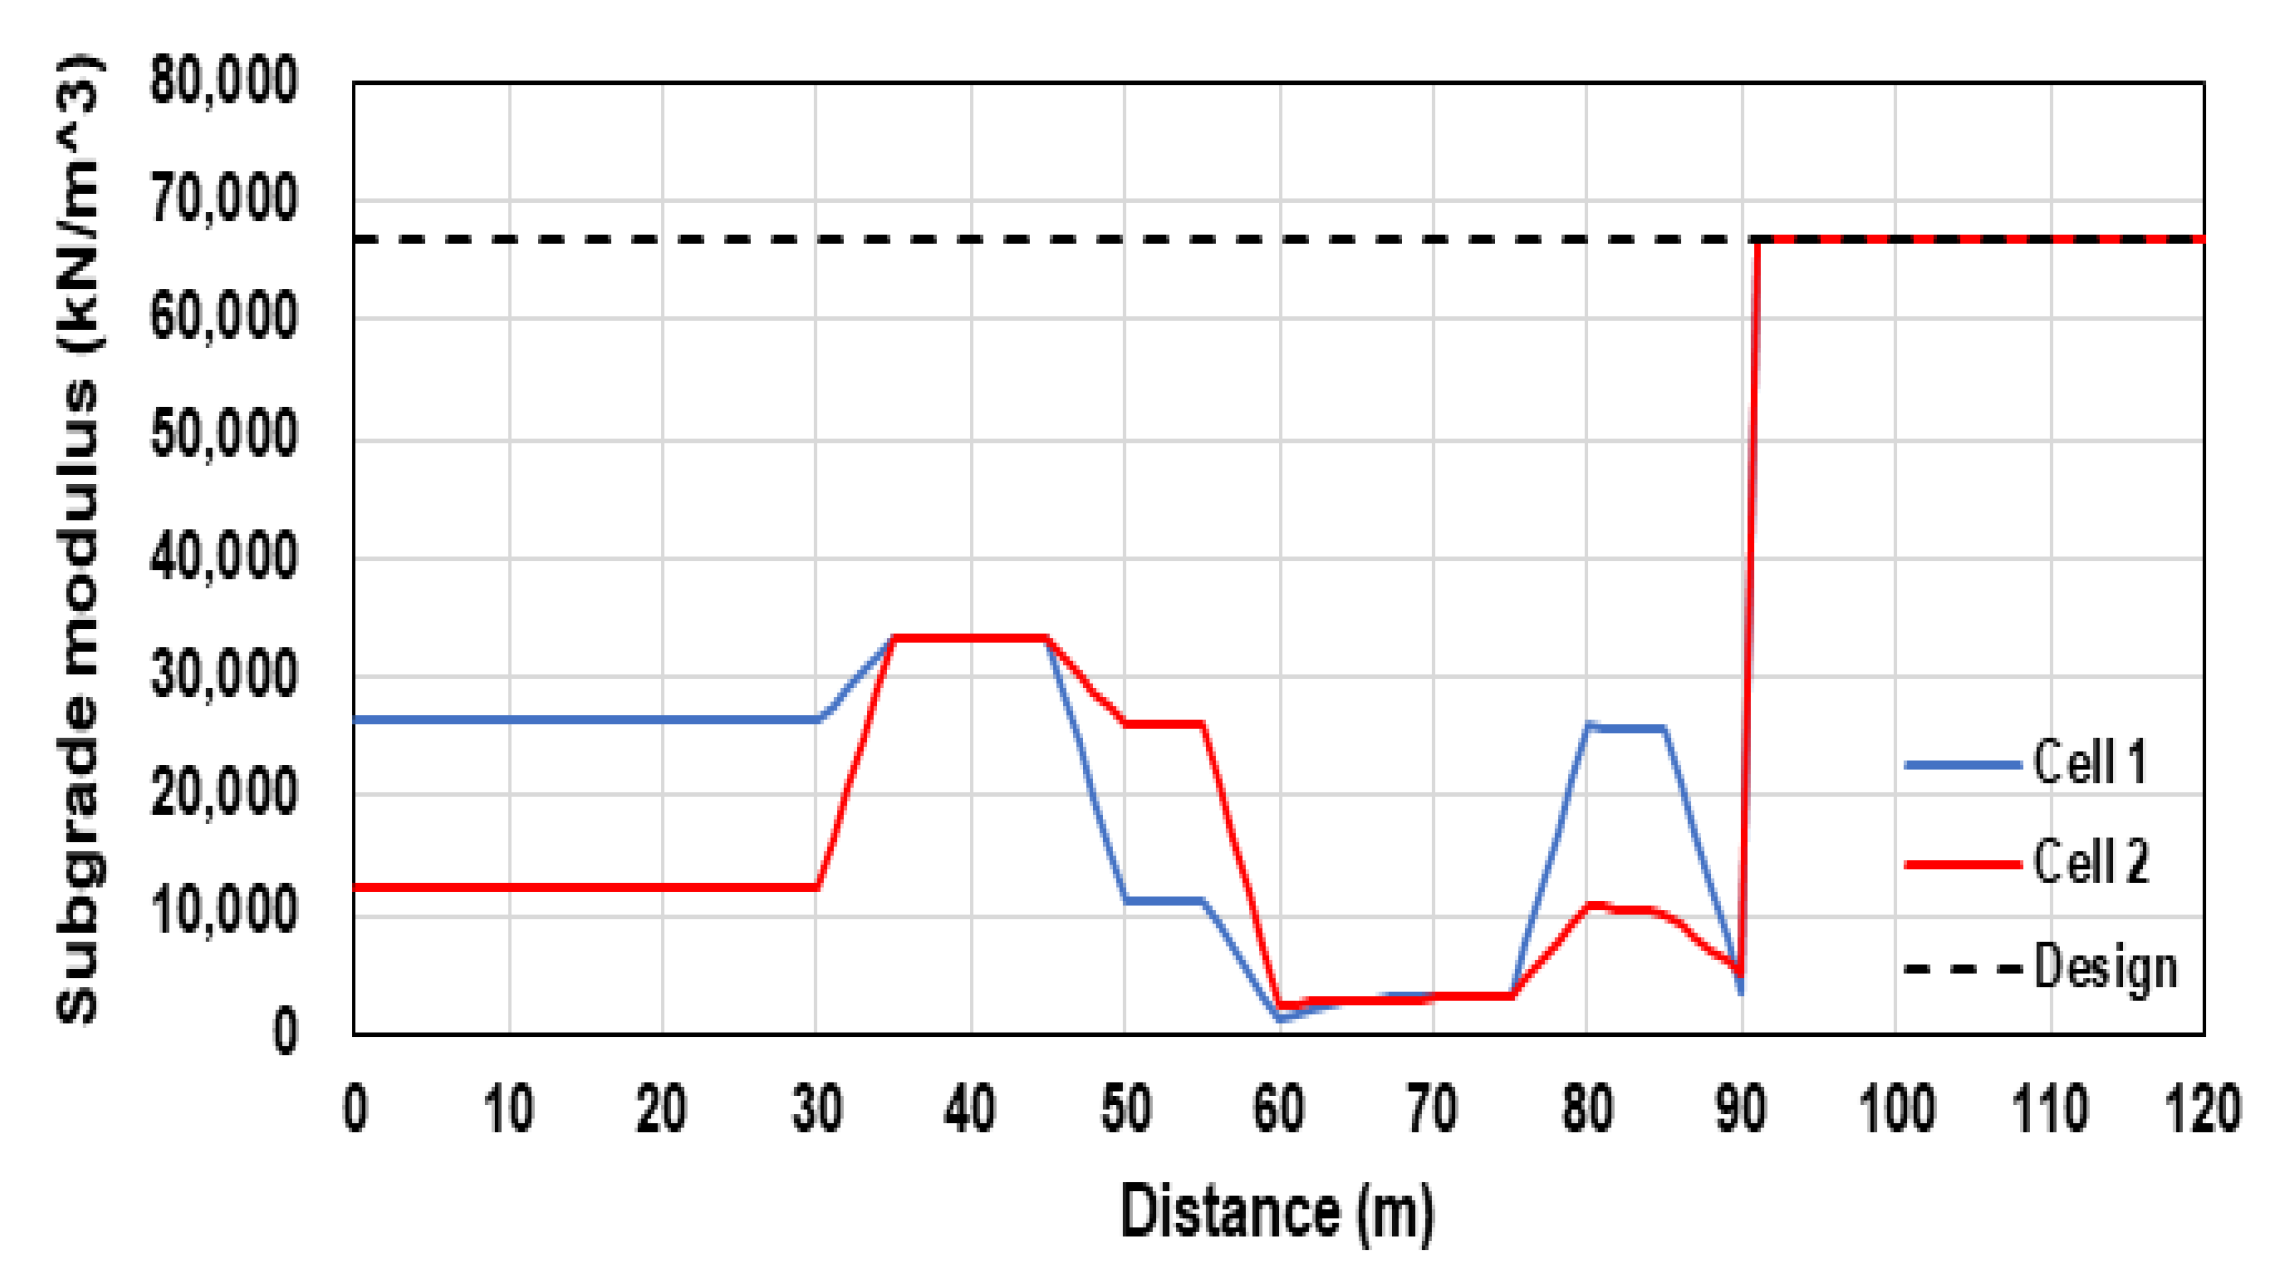
The cross-sectional analysis condition, which is a current evaluation technique in structure diagnosis in Korea, cannot reflect the displacement behavior characteristics of a particular location of the subway box structure, which demonstrates a continuous behavior in the longitudinal direction. Our analysis results show that the evaluation technique, where the maximum displacement (point settlement) in a specific cross-section and an empirical value for the subgrade modulus were applied, could not consider the relative displacement difference based on the structure location. Therefore, it was concluded that it was difficult to obtain a realistic damage evaluation for the structures.
(2)
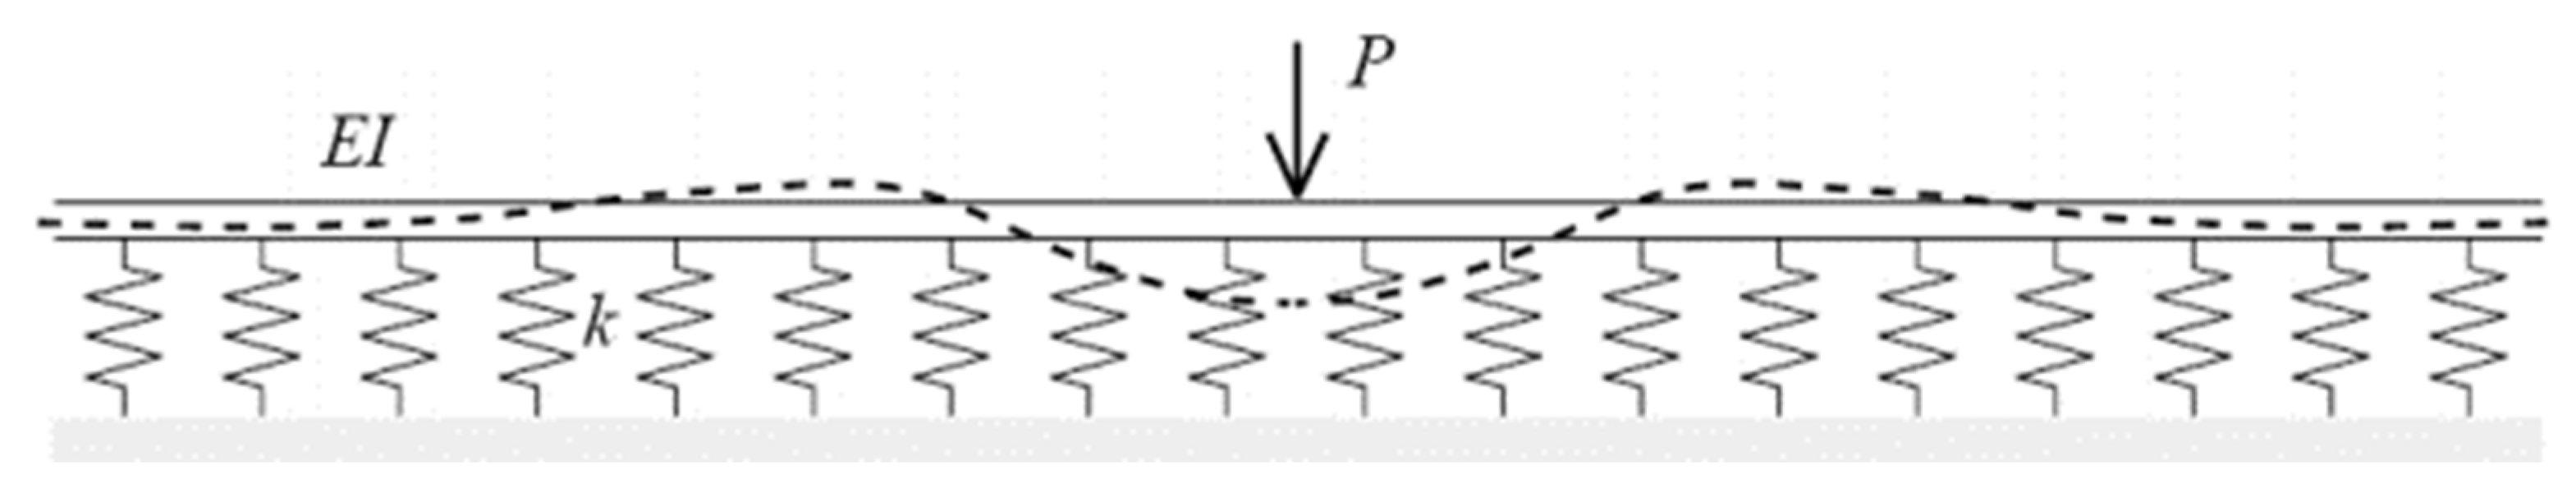
The validity of the evaluation technique proposed in this study was verified through a comparison between the onsite damage and computed result of the subgrade modulus (boundary condition), where the structure’s displacement behavior characteristics were reflected by deriving a displacement function using a displacement measurement of the subway box structure, and applying this to the continuous elastic foundation beam theory.
(3)
The numerical analysis results after replacing the leveling results with the location of the box structure with the displacement function and the damage location and scale that occurred in the real subway box structure were consistent. Therefore, we confirmed that even the damage at an invisible location, which may occur in the real subway box structure, can be predicted based on 3D numerical analysis, where the displacement function is calculated using the leveling result, and the realized subgrade modulus is applied depending on the location.
(4)
Based on the leveling results, a displacement function was derived, and the boundary conditions of the modulus of the subgrade reaction were applied to calculate the modulus of subgrade reaction and the stress for each location through continuous elastic beam analysis. Continuous damage evaluation is possible by considering the relative displacement difference based on the location of the underground structure.
(5)
Using the proposed technique to analyze the damaging impact, the external boundary conditions that may induce major deformations in a subway box structure can be computed, and the members and locations where the damage may occur can be predicted and evaluated. Therefore, we can achieve reasonable damage evaluation and maintenance of the subway box structure, where the displacement behavior characteristics are reflected by repairing and reinforcing the damaged part at an accurate location through damage impact analysis techniques.

Author Contributions

Conceptualization, J.-Y.C. and G.-N.Y.; methodology, J.-Y.C.; software, G.-N.Y.; formal analysis, J.-Y.C. and J.-S.C.; data curation, J.-S.C. and S.-H.K.; investigation, H.-H.L.; funding acquisition H.-H.L.; writing—original draft preparation, J.-Y.C. and S.-H.K.; writing—review and editing, J.-Y.C. and S.-H.K. All authors have read and agreed to the published version of the manuscript.

Funding

This research received no external funding.

Institutional Review Board Statement

Not applicable.

Informed Consent Statement

Not applicable.

Data Availability Statement

Not applicable.

Conflicts of Interest

The authors declare no conflict of interest.

References

  1. Chung, J.S.; Park, D.R.; Choi, J.Y. Evaluation of track irregularity effect due to adjacent excavation on serviced railway line. J. Converg. Cult. Technol. 2019, 5, 401–406. [Google Scholar]
  2. Choi, J.Y. Qualitative Analysis for Dynamic Behavior of Railway Ballasted Track. Ph.D. Thesis, Technical University of Berlin, Berlin, Germany, January 2014. [Google Scholar]
  3. Choi, J.Y.; Yang, G.N.; Kim, T.J.; Chung, J.S. Analysis of ground subsidence according to tunnel passage in geological vulnerable zone. J. Converg. Cult. Technol. 2020, 6, 393–399. [Google Scholar]
  4. Lee, H.H. A Study on Improvement of Automatic Measurement Evaluation System for Subway Structure by Adjacent Excavation. Ph.D. Dissertation, Dongyang University, Yeongju, Republic of Korea, February 2021. [Google Scholar]
  5. Choi, H.Y. A Study about the Improvement on Automatic Measure Method of Tunnel. Master’s Thesis, Seoul National University of Technology, Seoul, Republic of Korea, August 2007. [Google Scholar]
  6. Choi, J.Y.; Lee, H.H.; Kang, Y.S.; Chung, J.S. Evaluation of structural stability of tunnel due to adjacent excavation on urban transit. J. Converg. Cult. Technol. 2020, 6, 503–508. [Google Scholar]
  7. Cho, S.I. A Study on Deformation of Subway Structures by Adjacent Excavation Work. Master’s Thesis, Dongyang University, Yeongju, Republic of Korea, February 2020. [Google Scholar]
  8. Yoon, D.Y. A Study on Stability Evaluation of Retaining Wall and Subway Box Structure while Excavating the Ground Near Subway. Master’s Thesis, Seoul National University of Technology, Seoul, Republic of Korea, February 2017. [Google Scholar]
  9. Song, J.H. Numerical Evaluation of Various Numerical Integration Methods in Structural Analysis. Master’s Thesis, Wonkwang University, Iksan, Republic of Korea, August 2002. [Google Scholar]
  10. Chun, H.K.; Kang, Y.S.; Park, P.G. Study of the behavior of concrete slab track on earthwork according to the variation of train axle load and speed. J. Korea Acad. Ind. Coop. Soc. 2015, 16, 6788–6798. [Google Scholar]
  11. Chung, J.S.; Shin, Y.W.; Kim, M.H.; Kook, Y.M.; Jeong, K.K.; Kim, P.S.; Lee, S.W. A study on the displacement behavior according to the analysis model of ground excavation. J. Korean Geo-Environ. Soc. 2018, 19, 27–32. [Google Scholar]
  12. Nguyen, D.D.; Park, D.H.; Shamsher, S.; Nguyen, V.Q.; Kee, T.H. Seismic vulnerability assessment of rectangular cut-and-cover subway tunnels. Tunn. Undergr. Space Technol. 2019, 86, 247–261. [Google Scholar] [CrossRef]
  13. Tao, L.; Ding, P.; Shi, C.; Wu, X.; Wu, S.; Li, S. Shaking table test on seismic response characteristics of prefabricated subway station structure. Tunn. Undergr. Space Technol. 2019, 91, 102994. [Google Scholar] [CrossRef]
  14. Chen, Z.Y.; Liu, Z.Q. Effects of pulse-like earthquake motions on a typical subway station structure obtained in shaking-table tests. Eng. Struct. 2019, 198, 109557. [Google Scholar] [CrossRef]
  15. Lee, T.H.; Park, D.H.; Nguyen, D.D.; Park, J.S. Damage analysis of cut-and-cover tunnel structures under seismic loading. Bull. Earthq. Eng. 2016, 14, 413–431. [Google Scholar] [CrossRef]
  16. Tang, B.; Li, X.; Chen, S.; Zhuang, H.; Chen, H.P. Investigations of seismic response to an irregular-section subway station structure located in a soft clay site. Eng. Struct. 2020, 217, 110799. [Google Scholar] [CrossRef]
  17. Zhuang, H.; Jing, Y.; Su, C.; Jisai, F.; Guoxing, C. Seismic performance of underground subway station structure considering connection modes and diaphragm wall. Soil Dyn. Earthq. Eng. 2019, 127, 105842. [Google Scholar]
  18. Cui, G.; Ma, J. Structure strengthening method for enhancing seismic behavior of soft tunnel portal section. Math. Probl. Eng. 2021, 2021, 6624963. [Google Scholar] [CrossRef]
  19. Zhuang, H.; Ren, J.; Miao, Y.; Yao, L.J.; Xu, C. Seismic performance levels of a large underground subway station in different soil foundations. J. Earthq. Eng. 2021, 25, 2808–2833. [Google Scholar] [CrossRef]
  20. Pang, R.; Chen, K.; Fan, Q.; Xu, B. Stochastic ground motion simulation and seismic damage performance assessment of a 3-D subway station structure based on stochastic dynamic and probabilistic analysis. Tunn. Undergr. Space Technol. 2022, 126, 104568. [Google Scholar] [CrossRef]
  21. Huang, Z.; Fu, H.; Chen, W.; Zhang, J.; Huang, H. Damage detection and quantitative analysis of shied tunnel structure. Autom. Constr. 2018, 94, 303–316. [Google Scholar] [CrossRef]
  22. Lee, H.W.; Basaran, C. A review of damage, void evolution, and fatigue life prediction models. Metals 2021, 11, 609. [Google Scholar] [CrossRef]
  23. Winkler, E. Die Lehre von der Elasticitaet und Festigkeit: Mit besonderer Rücksicht auf ihre Anwendung in der Technik, Für Polytechnische Schulen, Bauakademien, Ingenieure, Maschinenbauer, Architecten, etc.; Fb&c Limited: London, UK, 2018. [Google Scholar]
  24. Korea Highway Standard. Korea Highway Bridge Design Standard: Explanation; KHS: Dortmund, Germany, 2008; pp. 758–759. [Google Scholar]
  25. Ansys Inc. ANSYS® 2007 ANSYS Workbench 2021.1R; ANSYS Inc.: Cannonsberg, PA, USA, 2021. [Google Scholar]
Figure 1. Major damage types: (a) wall, transverse crack; (b) wall, diagonal crack; (c) column, diagonal crack (1); (d) column, diagonal crack (2).
Applsci 12 12637 g001aApplsci 12 12637 g001b
Figure 2. Optical leveling: (a) points of optical leveling; (b) photographs of optical leveling.
Applsci 12 12637 g002
Figure 3. Comparison between optical leveling and visual inspection results for each section.
Applsci 12 12637 g003
Figure 4. Beam on continuous elastic foundation.
Applsci 12 12637 g004
Figure 5. Comparative analysis results of subgrade reaction modulus.
Applsci 12 12637 g005
Figure 6. 3D modeling mesh: (a) front view; (b) 3D view.
Applsci 12 12637 g006
Figure 7. Vertical displacement analysis results: (a) deformation; (b) stress.
Applsci 12 12637 g007
Figure 8. Stress analysis results in the position of maximum heaving and settlement: (a) normal stress (x-axis) at maximum heaving point (30 m); (b) normal stress (z-axis) at maximum heaving point (30 m); (c) normal stress (x-axis) at maximum settlement point (70 m); (d) normal stress (z-axis) at maximum settlement point (70 m).
Applsci 12 12637 g008
Figure 9. Comparison between the visual inspection mesh diagram and analysis results (Cell 1 wall) for the heaving section.
Applsci 12 12637 g009
Figure 10. Comparison between the visual inspection mesh diagram and analysis results (Cell 1 wall) for the transition section: (a) 40–60 m; (b) 80–100 m.
Applsci 12 12637 g010
Figure 11. Comparison between the visual inspection mesh diagram and analysis results (Cell 1 wall for the settlement section.
Applsci 12 12637 g011
Figure 12. Comparison between the visual inspection mesh diagram and analysis results (Cell 2 wall) for heaving section.
Applsci 12 12637 g012
Figure 13. Comparison between the visual inspection mesh diagram and analysis results (Cell 2 wall) for the transition section: (a) 40–60 m; (b) 80–100 m.
Applsci 12 12637 g013
Figure 14. Comparison between the visual inspection mesh diagram and analysis results (Cell 2 wall) of settlement section.
Applsci 12 12637 g014
Figure 15. Comparison result of elastic beam analysis (bending stress).
Applsci 12 12637 g015
Figure 16. Comparison result of elastic beam and finite element analyses: (a) Cell 1; (b) Cell 2.
Applsci 12 12637 g016aApplsci 12 12637 g016b
Table 1. Calculation of subgrade reaction.
StationSubgrade CategoryModified Value (N)E0 (kN/m2)Kv0 (kN/m3)Kv (kN/m3)
755.37Weathered rock-150,000500,00033,329
760.00Weathered rock-150,000500,00033,329
765.00Weathered rock-150,000500,00033,329
770.00Weathered rock-150,000500,00033,329
775.00Weathered rock-150,000500,00033,329
780.00Weathered rock-150,000500,00033,329
785.00SM (Silt non-plastic)2116,08653,6203574
790.00SM2116,08653,6203574
795.00SM5383012,767851
800.00SM1713,02243,4072893
805.00SM1914,55448,5133234
810.00SM1914,55448,5133234
815.00Weathered rock-150,000500,00033,329
820.00Weathered rock-150,000500,00033,329
825.00SM1612,25640,8532723
825.20SM1612,25640,8532723
Publisher’s Note: MDPI stays neutral with regard to jurisdictional claims in published maps and institutional affiliations.

