1. Introduction
Production in the automotive industry is very demanding. On the one hand, high machine efficiency is required, and on the other hand, high quality of the components produced is also required [
1,
2,
3]. Any situation that causes a signal from the customer, and often even a complaint about the product, makes the manufacturer an unreliable partner with a low level of quality, which is associated with the loss of orders and acquiring new customers. Machine performance depends on many variables that affect the quality of the final product. These variables include input material, machine, tool, measuring equipment, operator, and working environment [
4,
5,
6]. Taking into account possible errors in measurements, a case of classifying a good product as a bad one or, conversely, a bad product as a good one, is the major issue. Errors of this type are called first and second type errors. The former is of course less harmful and generates fewer problems. The second type error case is very costly and creates many problems, ranging from complaints to the costs of production breaks at the customer’s site [
7].
Let us stop for a moment to describe the case considered in the research. The organization in which the research is conducted is a leading manufacturer of car seat guide rails. The complete guide consists of two assembled profiles, a male profile and a female profile. These profiles are connected to each other during the assembly process, but before they are delivered to assembly, they are manufactured in the press department, where they must be qualitatively assessed. The first thing to be assessed is the comparison with the model piece. During this comparison, the operator assesses the compliance of the detail by comparing its length with the standard, then the holes are compared in terms of quantity. After the initial visual assessment, the process is fully approved, during which all characteristics specified in the control plan are assessed. These characteristics are the diameters of the holes, the distance between them, as well as other functional parameters such as, for example, the width of the profile, the height of the teeth, or the symmetry of the holes. The issue seems obvious and easy to interpret, but as the previous situations related to the approval of the process showed, the measurement results are divergent, causing doubts among people who perform the qualitative assessment of the manufactured products. The research and analysis come down to comparing the results between operators who use the same type of equipment. What if the quality controller validates the process with a different type of equipment and the customer with a different type? At this point, one should consider whether the method of selecting the equipment is known to both the manufacturer and the end customer.
We assume that such elementary foundations are known in the automotive industry and the appropriate selection of equipment for the measured parameter is analyzed on the basis of the “golden rule”, in which the measuring instrument is selected according to the manufacturing tolerance [
8]. Let us focus on analyzing the measurement of the different types of equipment owned by the organization. One of the available devices is the Mitutoyo LH-600 height gauge, the DEA Global Coordinate Measuring Machine with tactile stylus, and the Werth Scope Check FB DZ Multisensor Measuring Machine equipped with a contact system and an optical system. The latter is used to approve the production process because the time to measure hole diameters and the distance between them compared with the classical CMM is significantly shorter. MSA tests carried out before the purchase of a modern type of equipment (performed according to guidelines of [
9,
10]), such as the aforementioned Werth Multisensor Measuring Machine, showed its ability to perform the assumed task, and also allowed to save a lot of time. The difference when testing a detail that had 27 defined characteristics was almost 700 s in favor of optical measurements. Therefore, it is not surprising that for several years, multisensor systems have been entering the market very dynamically and gaining more and more sympathizers among metrologists. Using a multisensor measuring machine allows one to save time, and thus gives the opportunity to increase production volume without having to invest in new production machines and searching for a suitable place in the organization area. Obviously, when the contact sensor of a multisensor machine is used for measurement of other characteristics, the measurement time will be longer, which does not change the fact that the final balance of the time needed is in favor of the multisensor machine. However, the question is how to compare the results obtained from the aforementioned multisensor machine using an optical sensor with results from a conventional machine with a contact sensor and with results obtained using a height gauge? MSA analysis should help answer this question as well as help determine which system is better for a given characteristic and what strategy to apply for the analyzed cases. In his article, Jan Rewilak [
11] reminds us that measurement system analysis is a mandatory element of organization in the automotive industry. Therefore, before starting the ability tests, criteria and parameters were defined, which were subjected to statistical analysis, and then MSA analysis was completed. The authors state that during these tests, all the devices mentioned in the control plan should be taken into account. Later in the article, it is stated that a lack of supervision and statistical evaluation of measurement equipment may result in false decisions.
On the other hand, Saikaew in [
12] states that a measurement system is a process that includes standards, personnel, and methods of obtaining measurements of some quality characteristics. All components and variables of the measurement system that have a significant impact on the selection and acceptance of an appropriate measurement system should be optimized. The primary goal of MSA is to quantify accuracy, precision, and stability, which is directly related to the statistical evaluation of the process. Statistical process control (SPC) methods are one of the important instruments in the quality management strategy [
13]. So far, no publication has been found that would describe the differences in measurement results between the CMM with a contact sensor (tactile stylus) and an optical sensor.
Questions like those presented above are raised in a majority of companies from the automotive, aviation, and machine industries. This paper tries to give answers to these questions. A methodology for analysis of different system capabilities in relation to the same measuring tasks and guidance on interpreting the results of them are given in this paper.
2. Materials and Methods
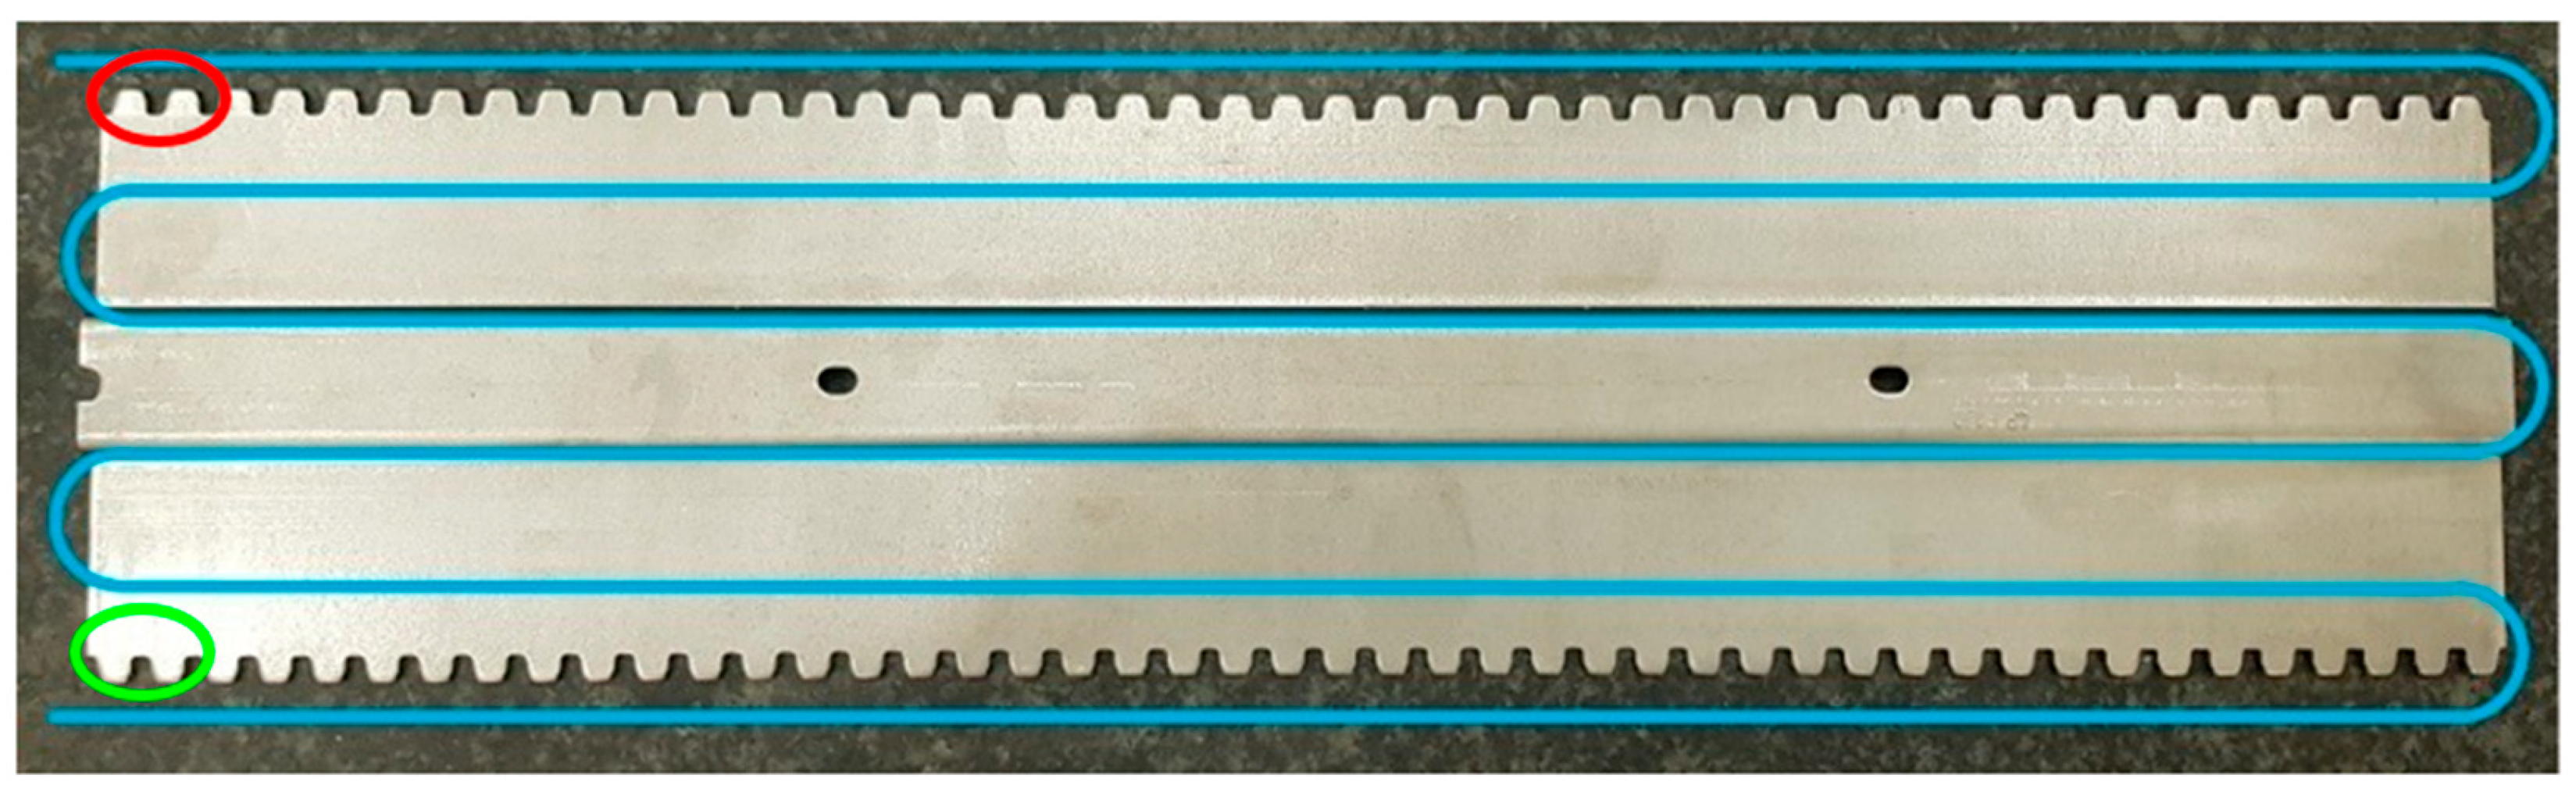
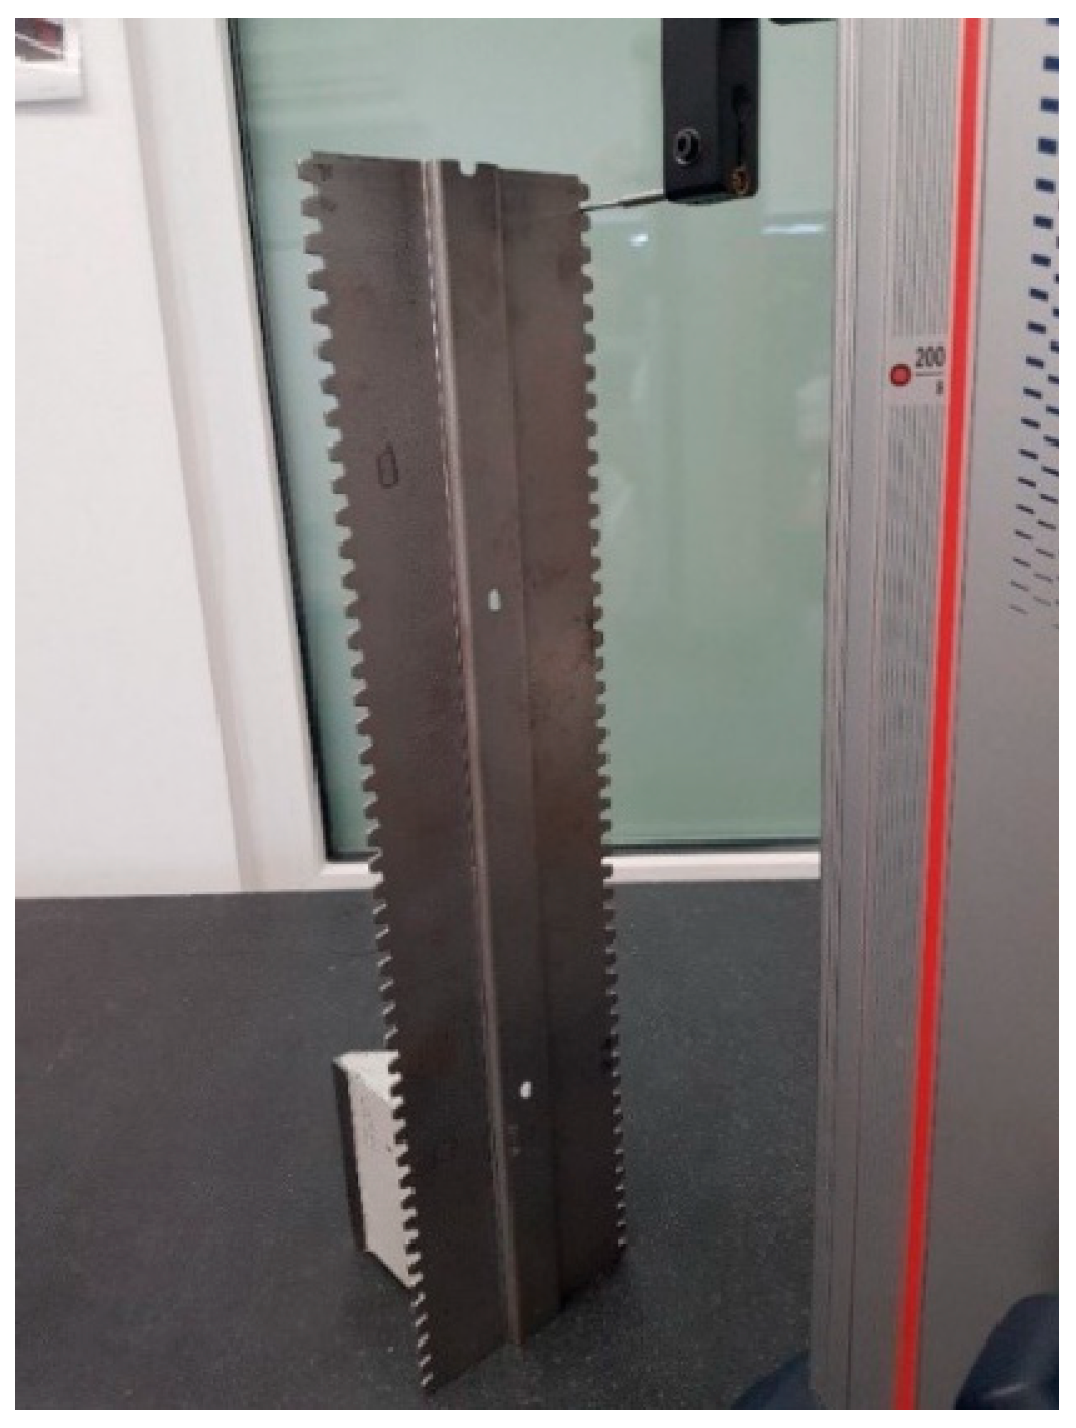
When measuring with different systems and using different strategies, we get different results, which leads to doubts, not only on the producer–client line, but inside the organization. In order to prevent such misunderstandings and, as a result, develop an appropriate measurement strategy ensuring compliance in the assessment of products for various types of equipment, methods, and strategies, the metal element being a semi-finished product of the female profile was tested. This element is a blank, which after completing operation no. 2 on the press machine, has cut teeth shown in
Figure 1. The completely shaped profile assembled with the male profile allows sliding and blocking of the guide. The blank sheet is a pressed element of S500 steel with a thermal expansion of
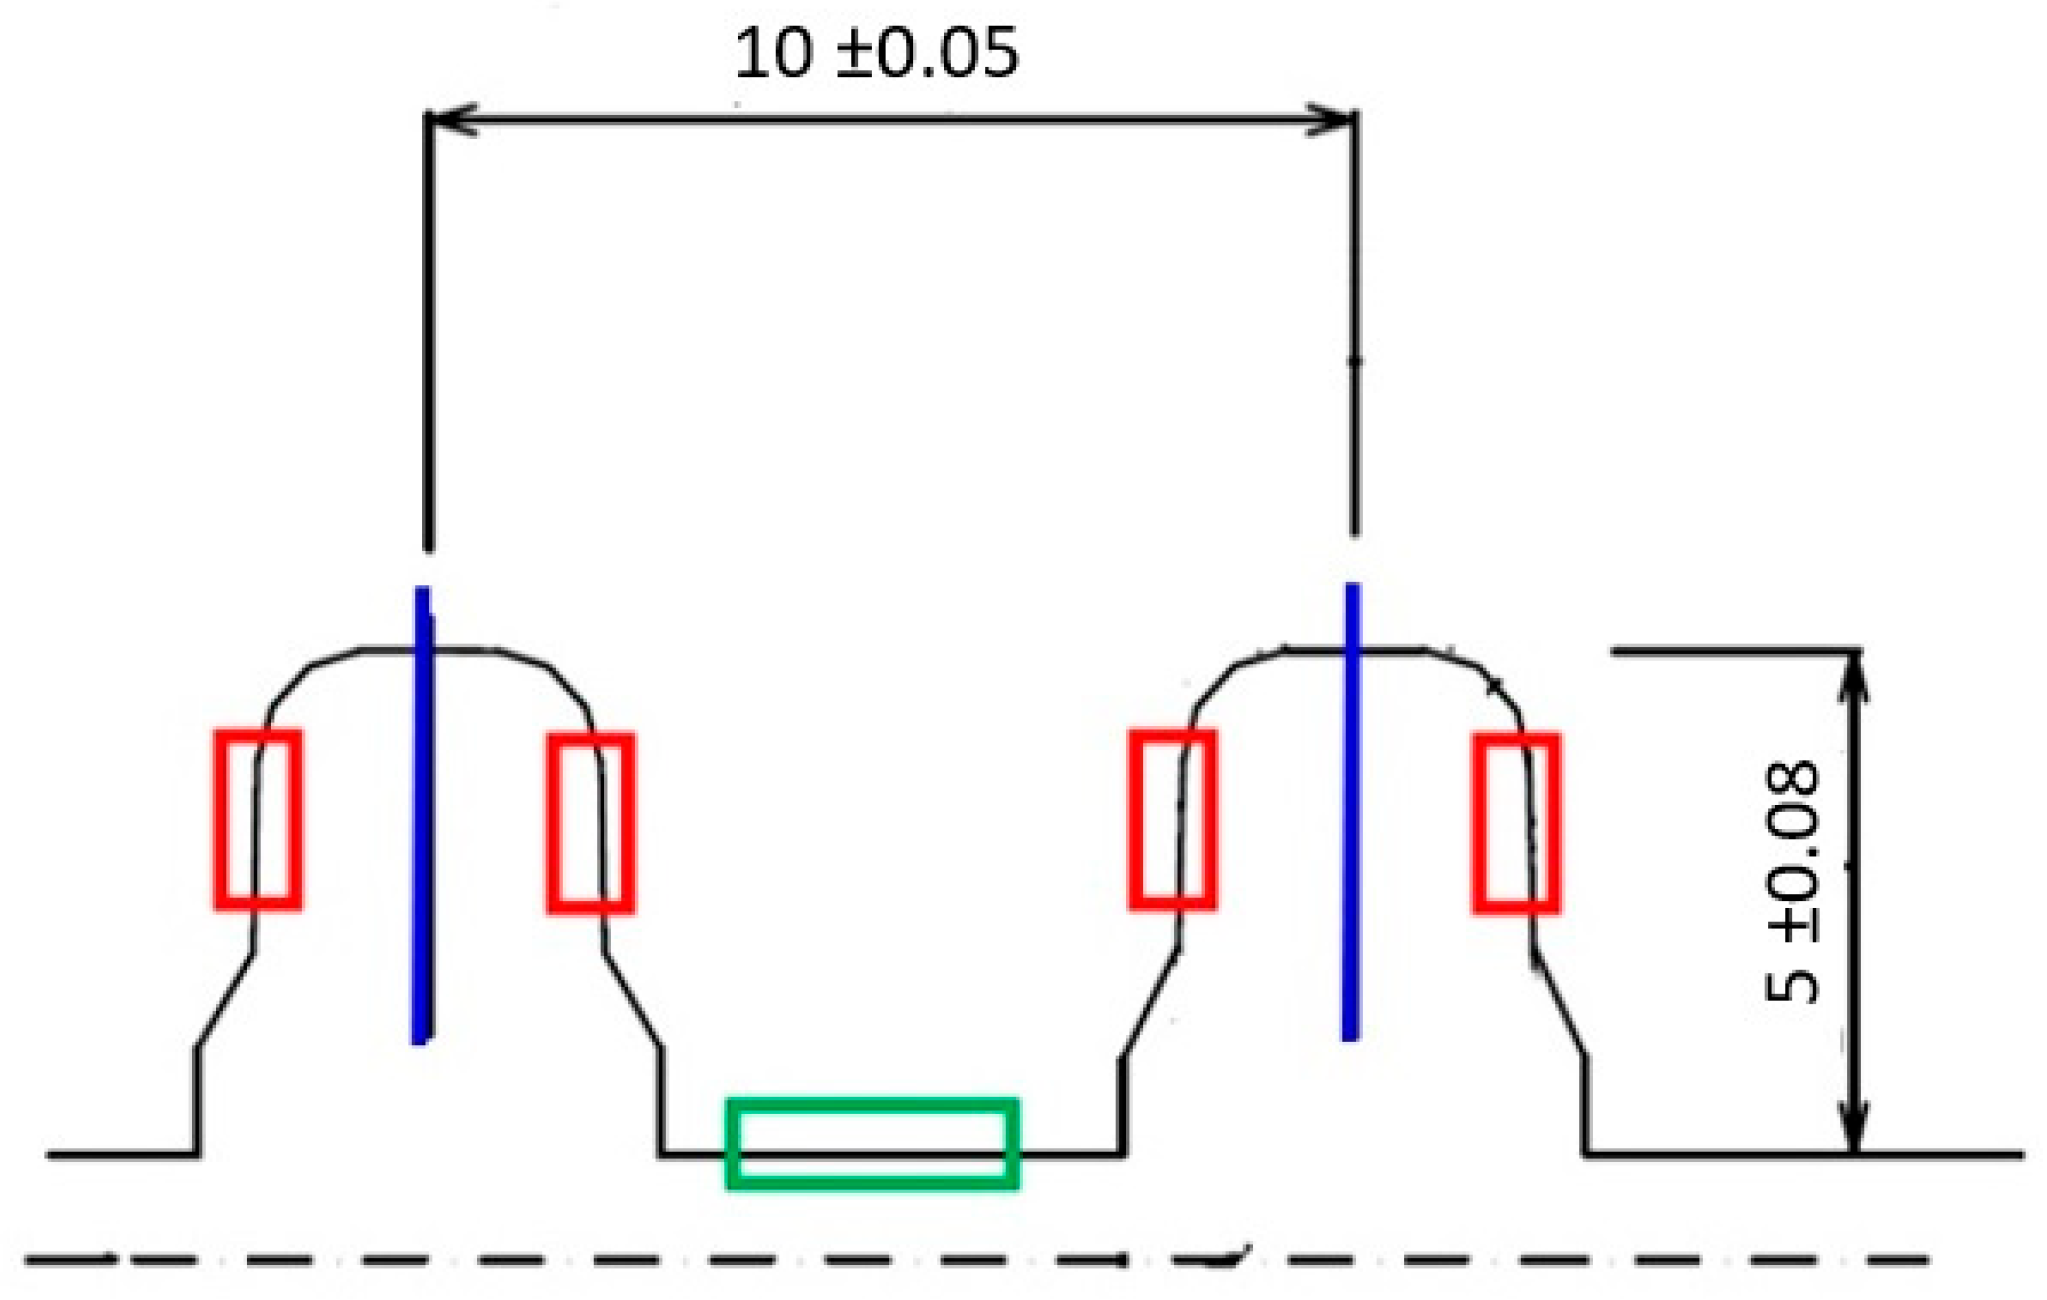
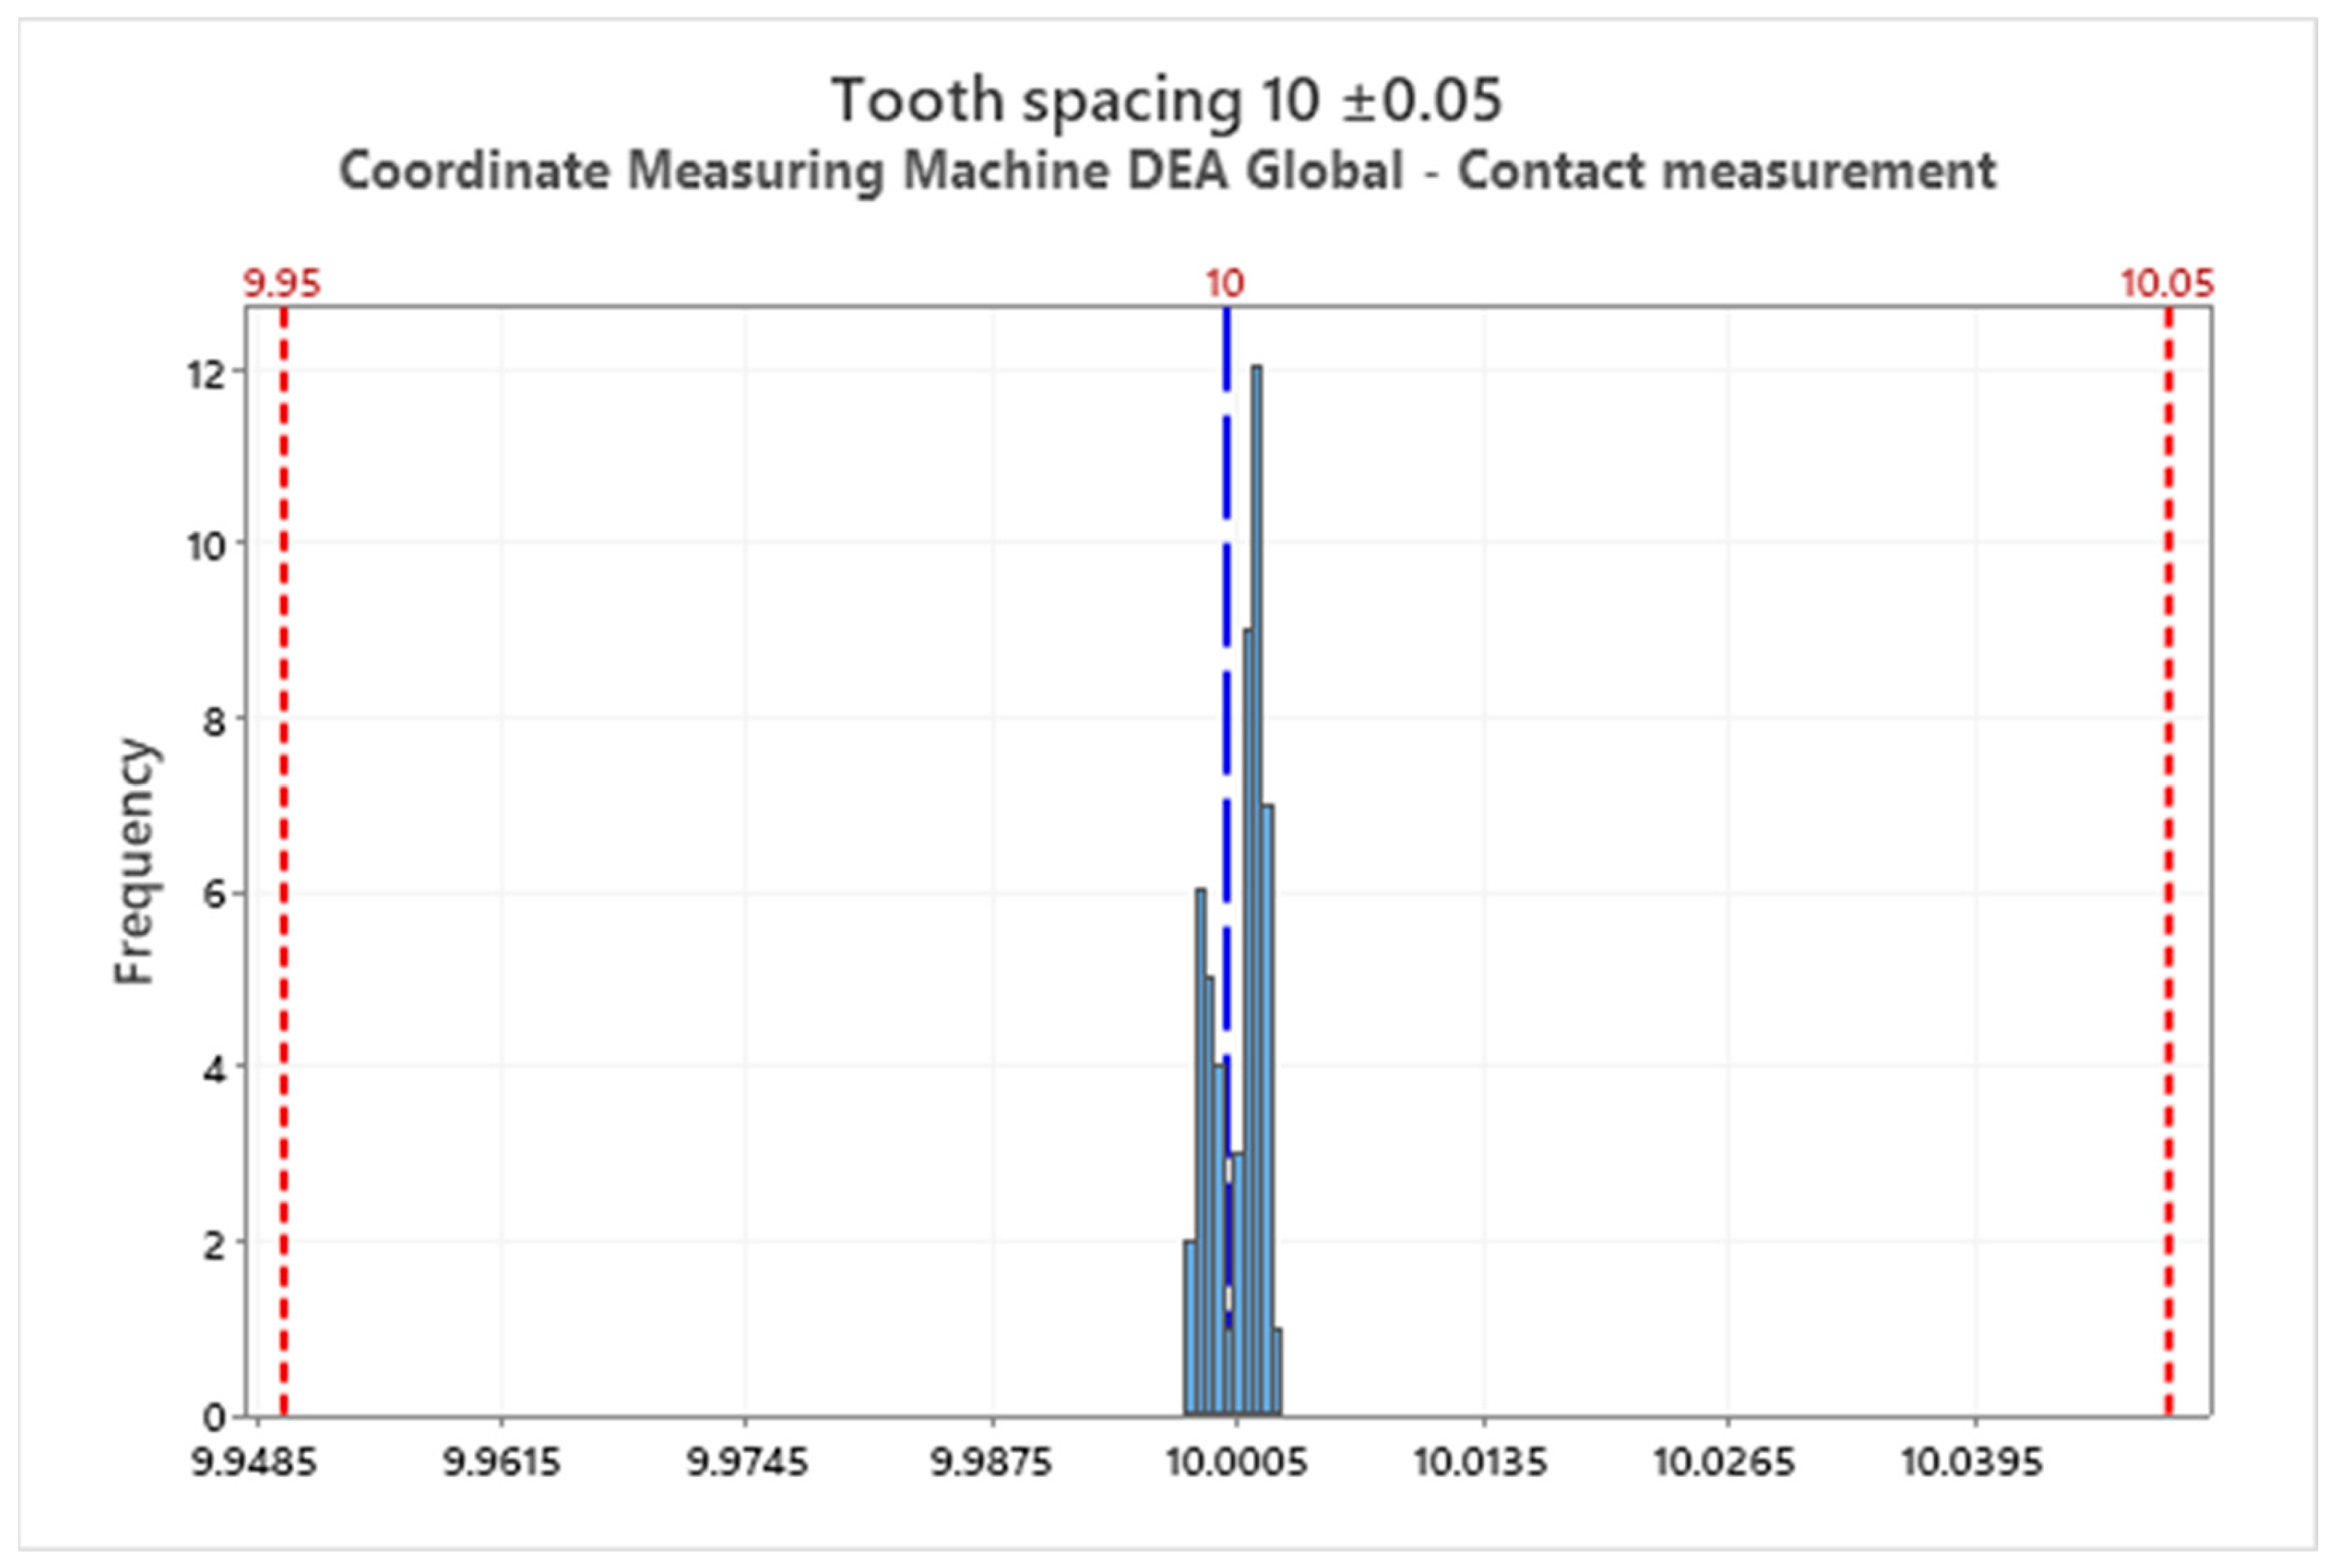
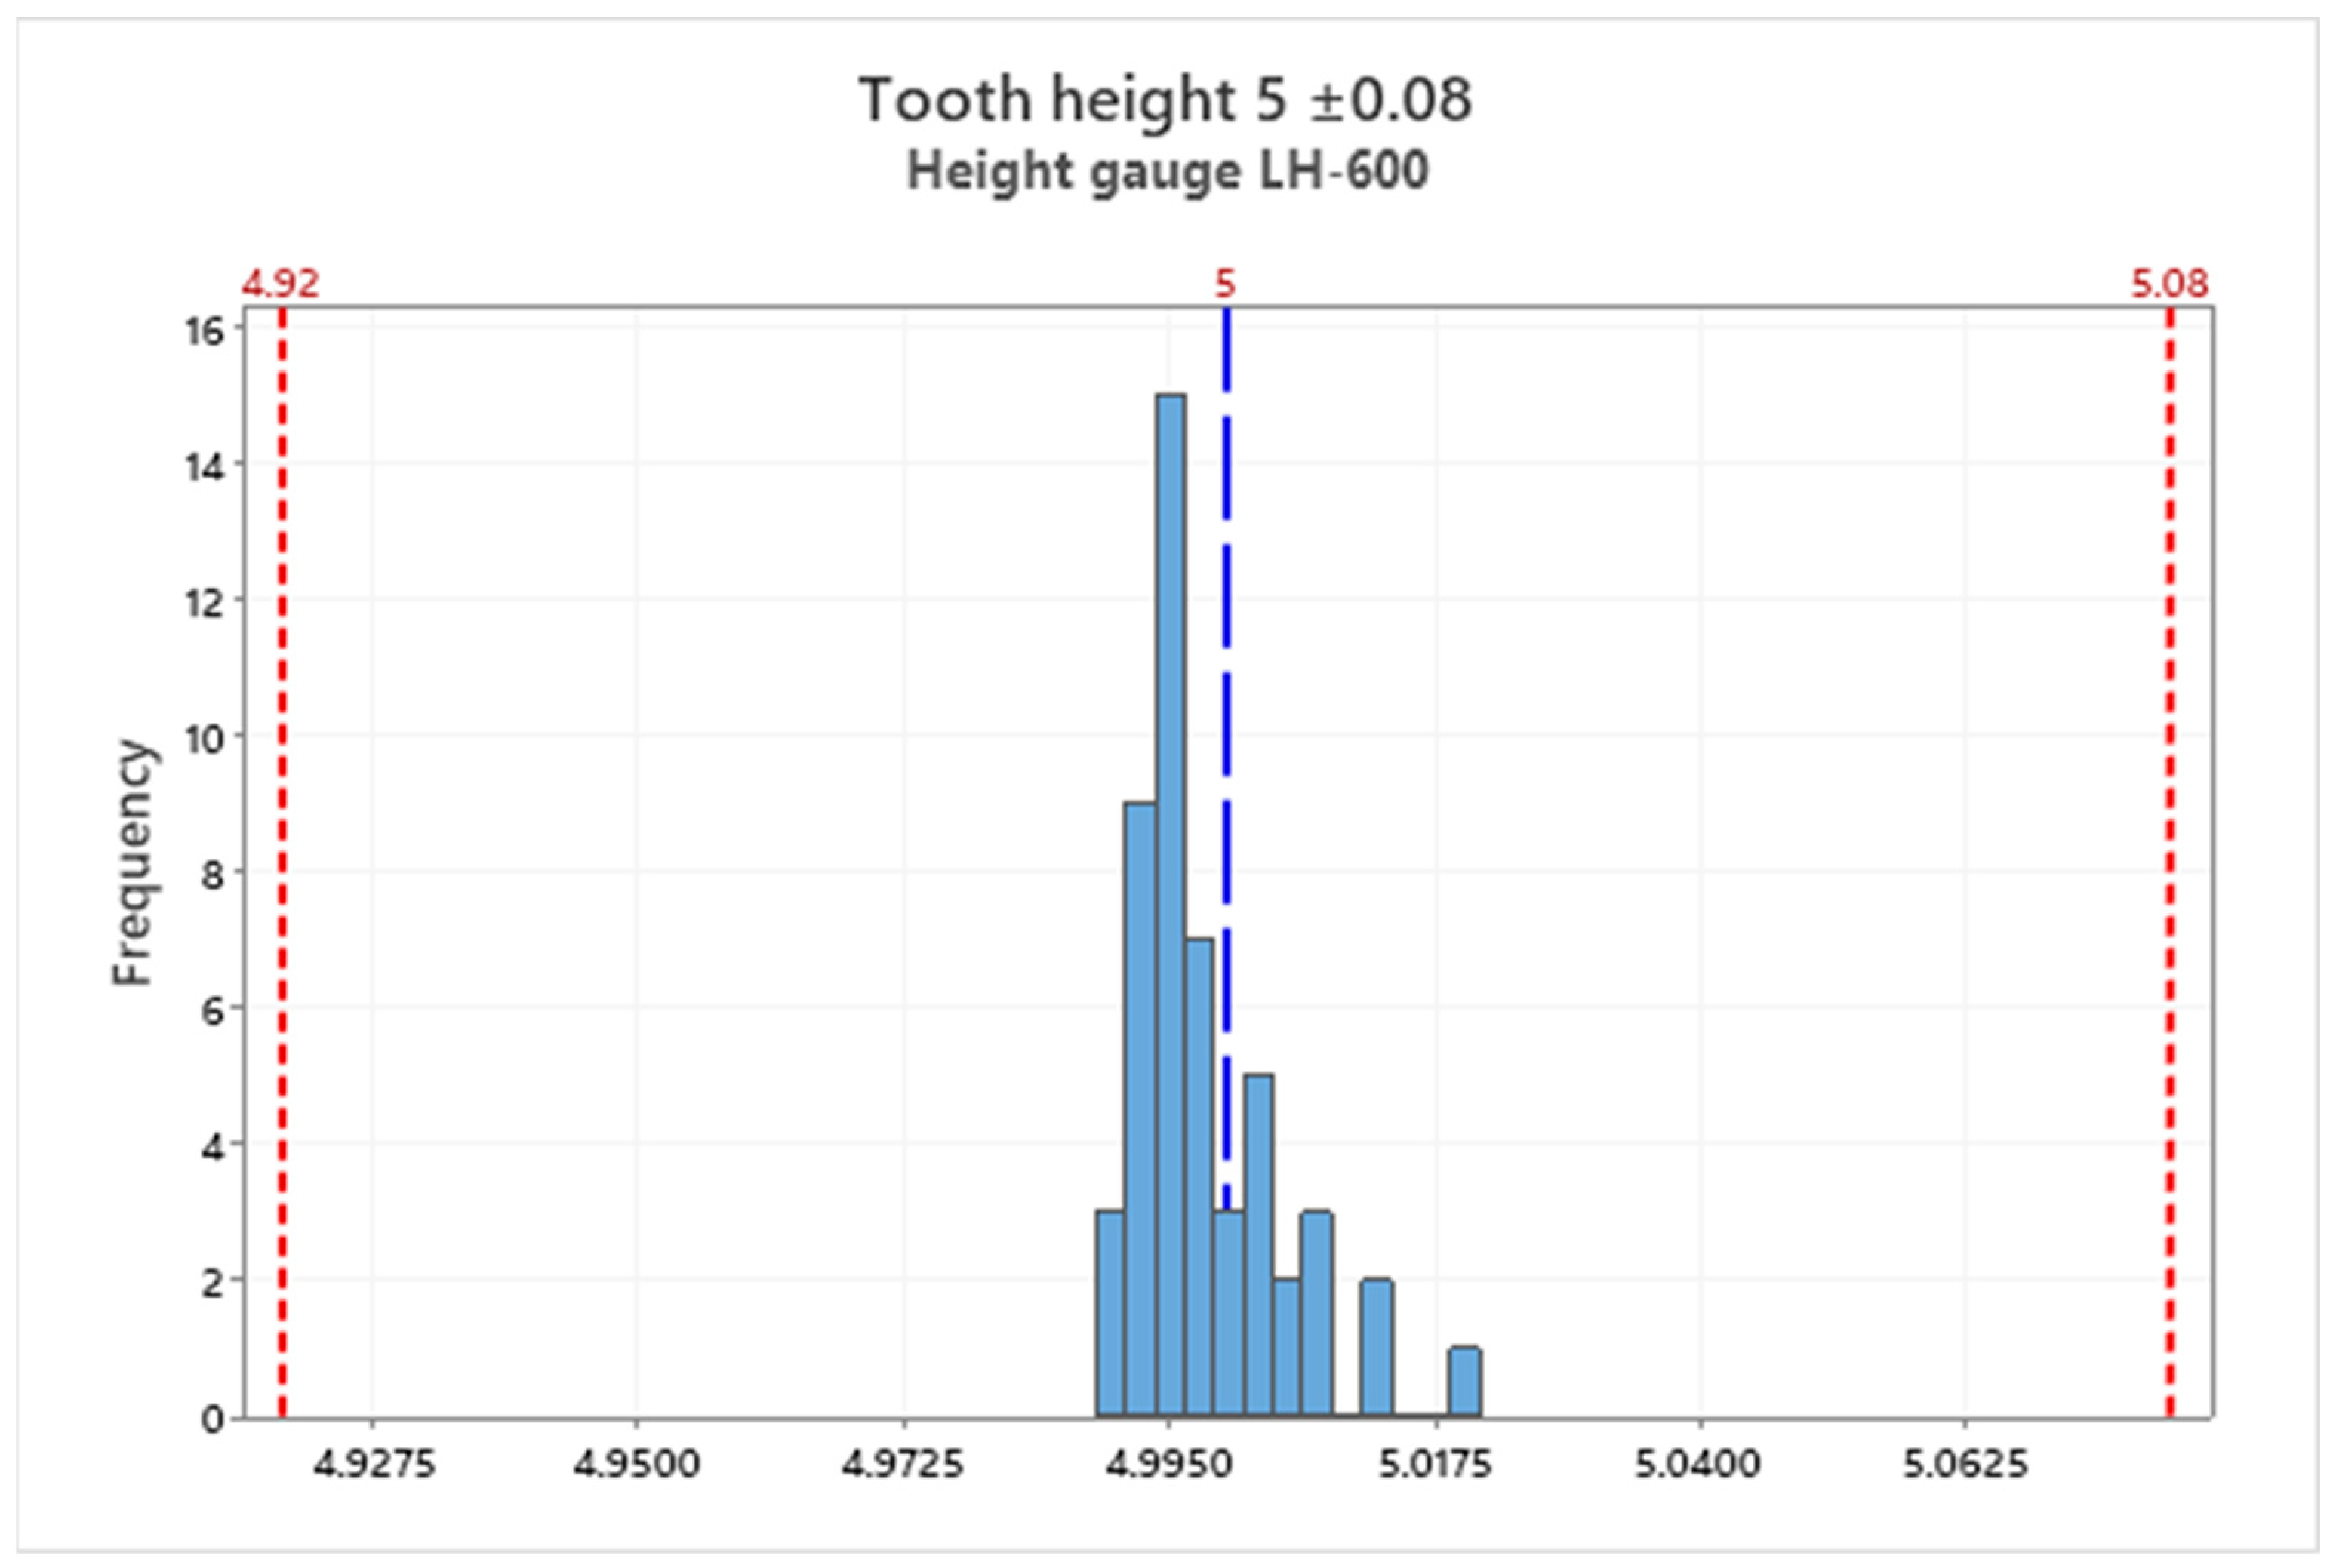
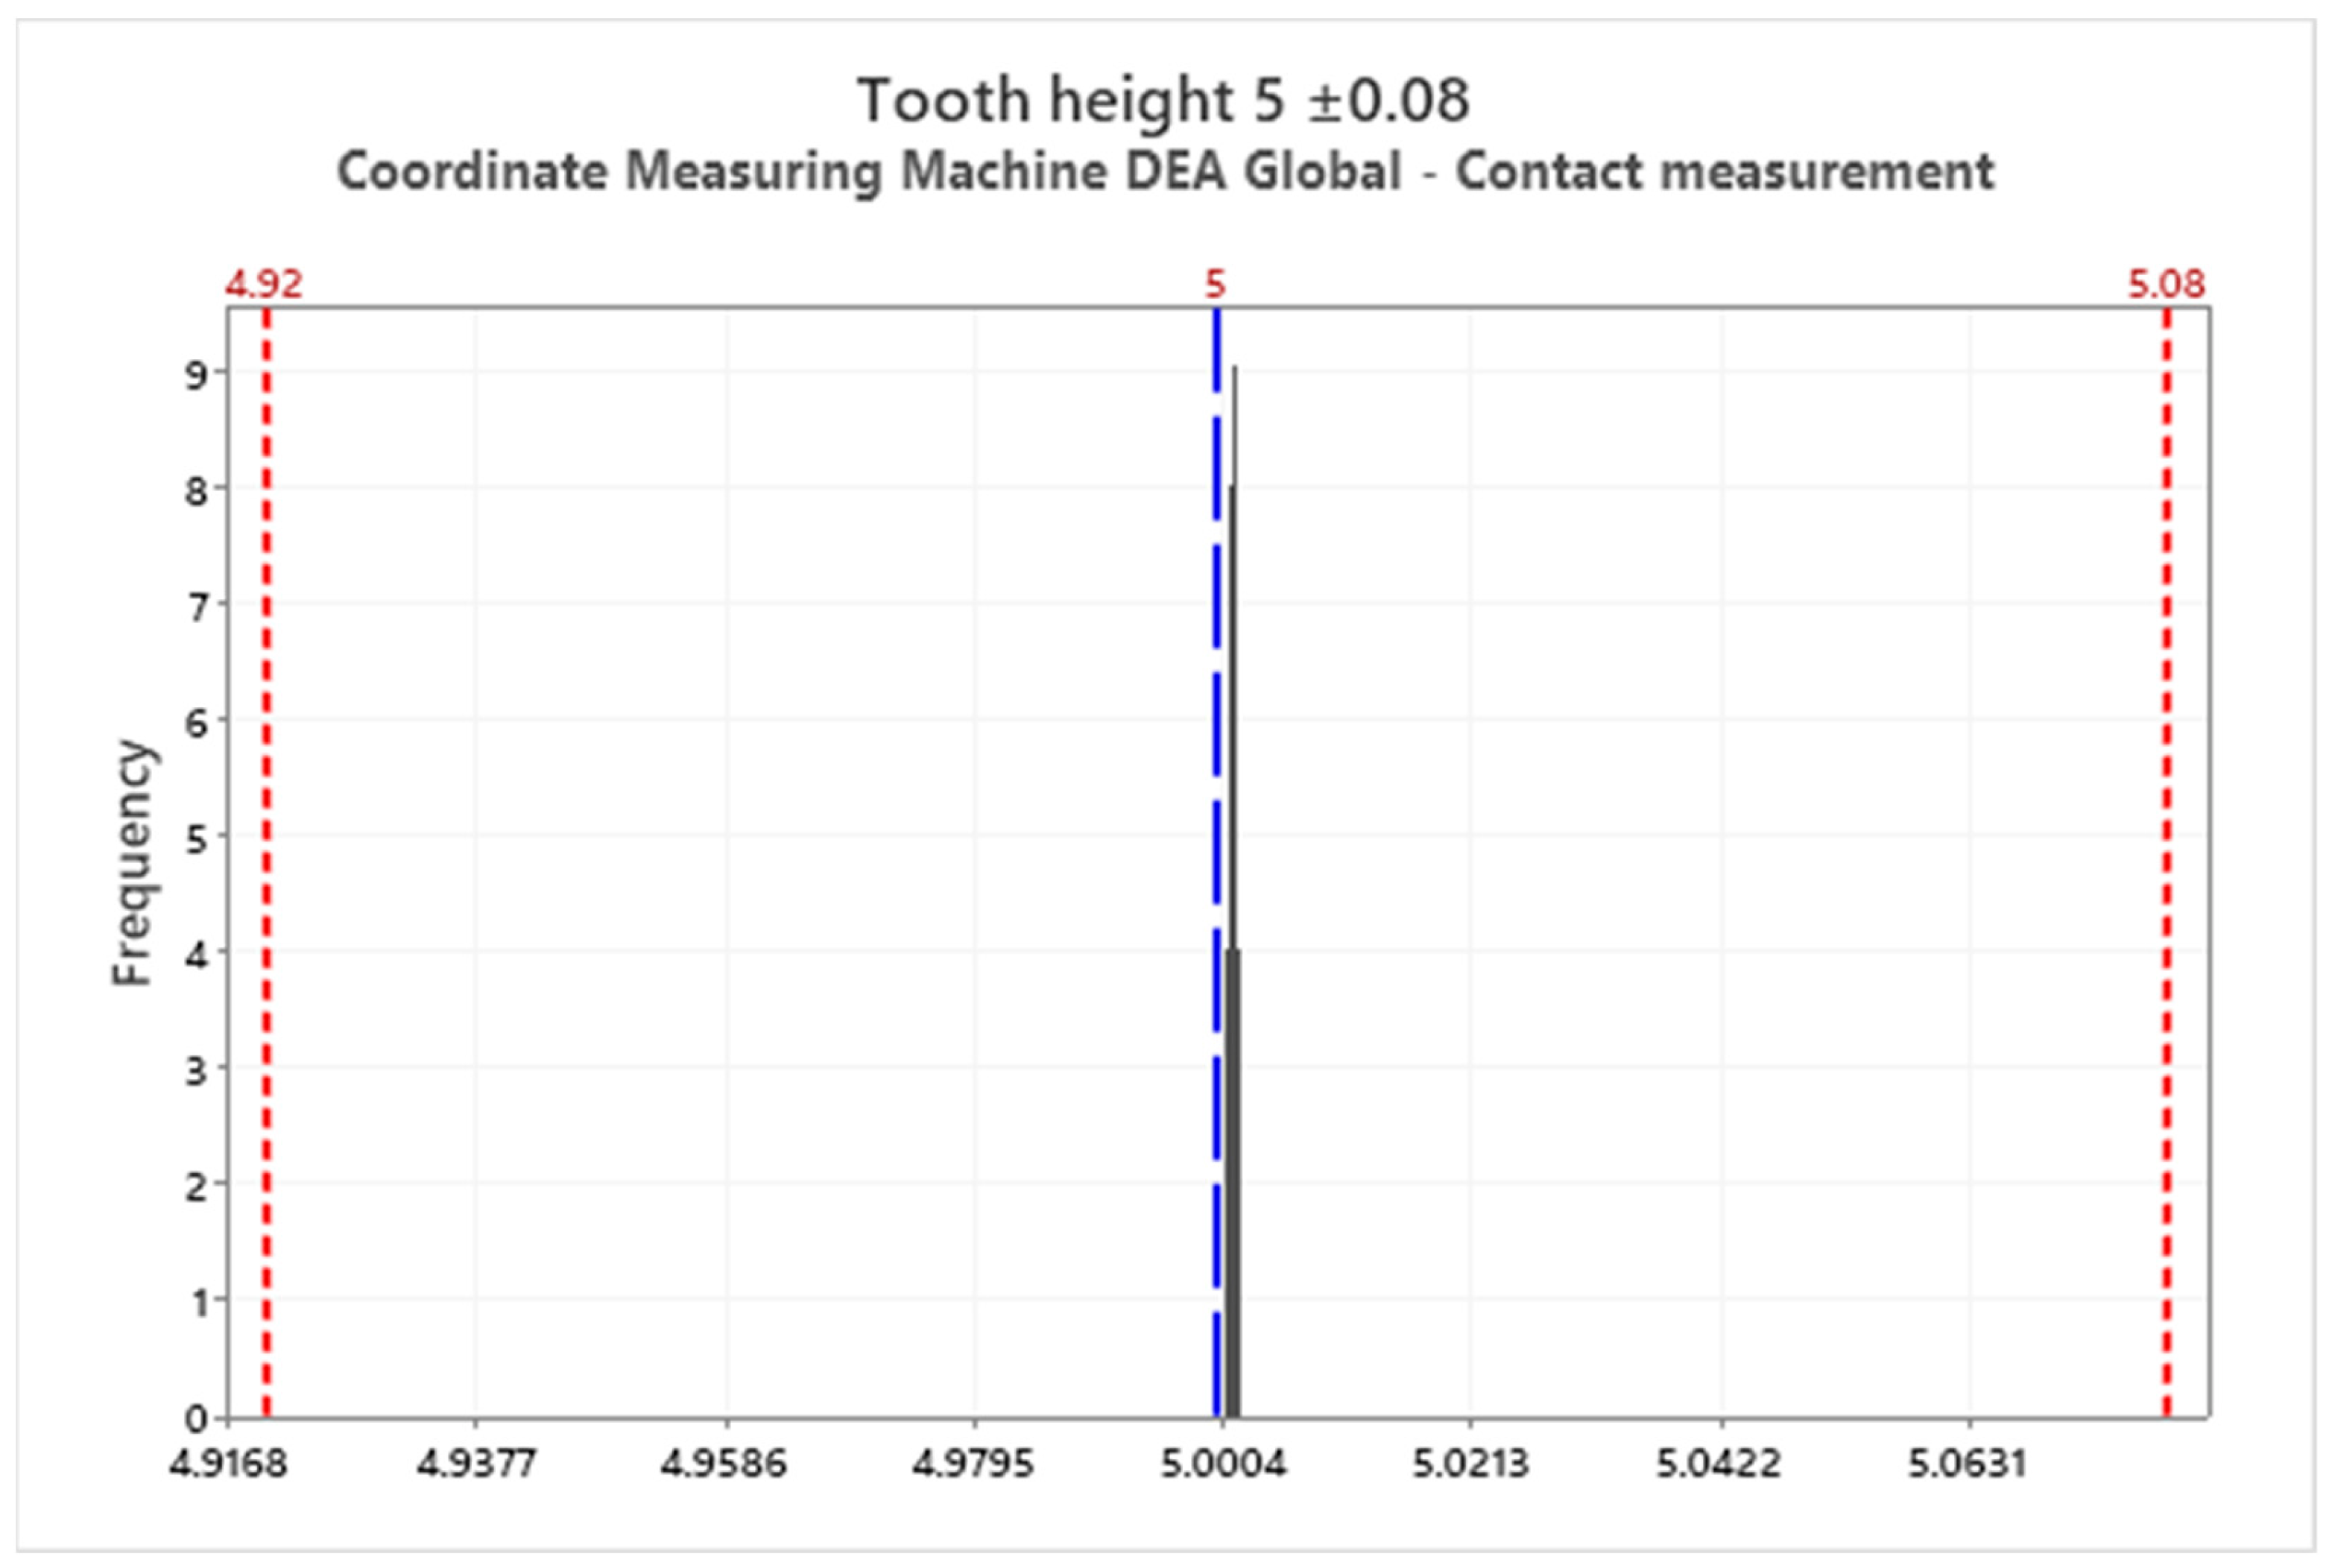
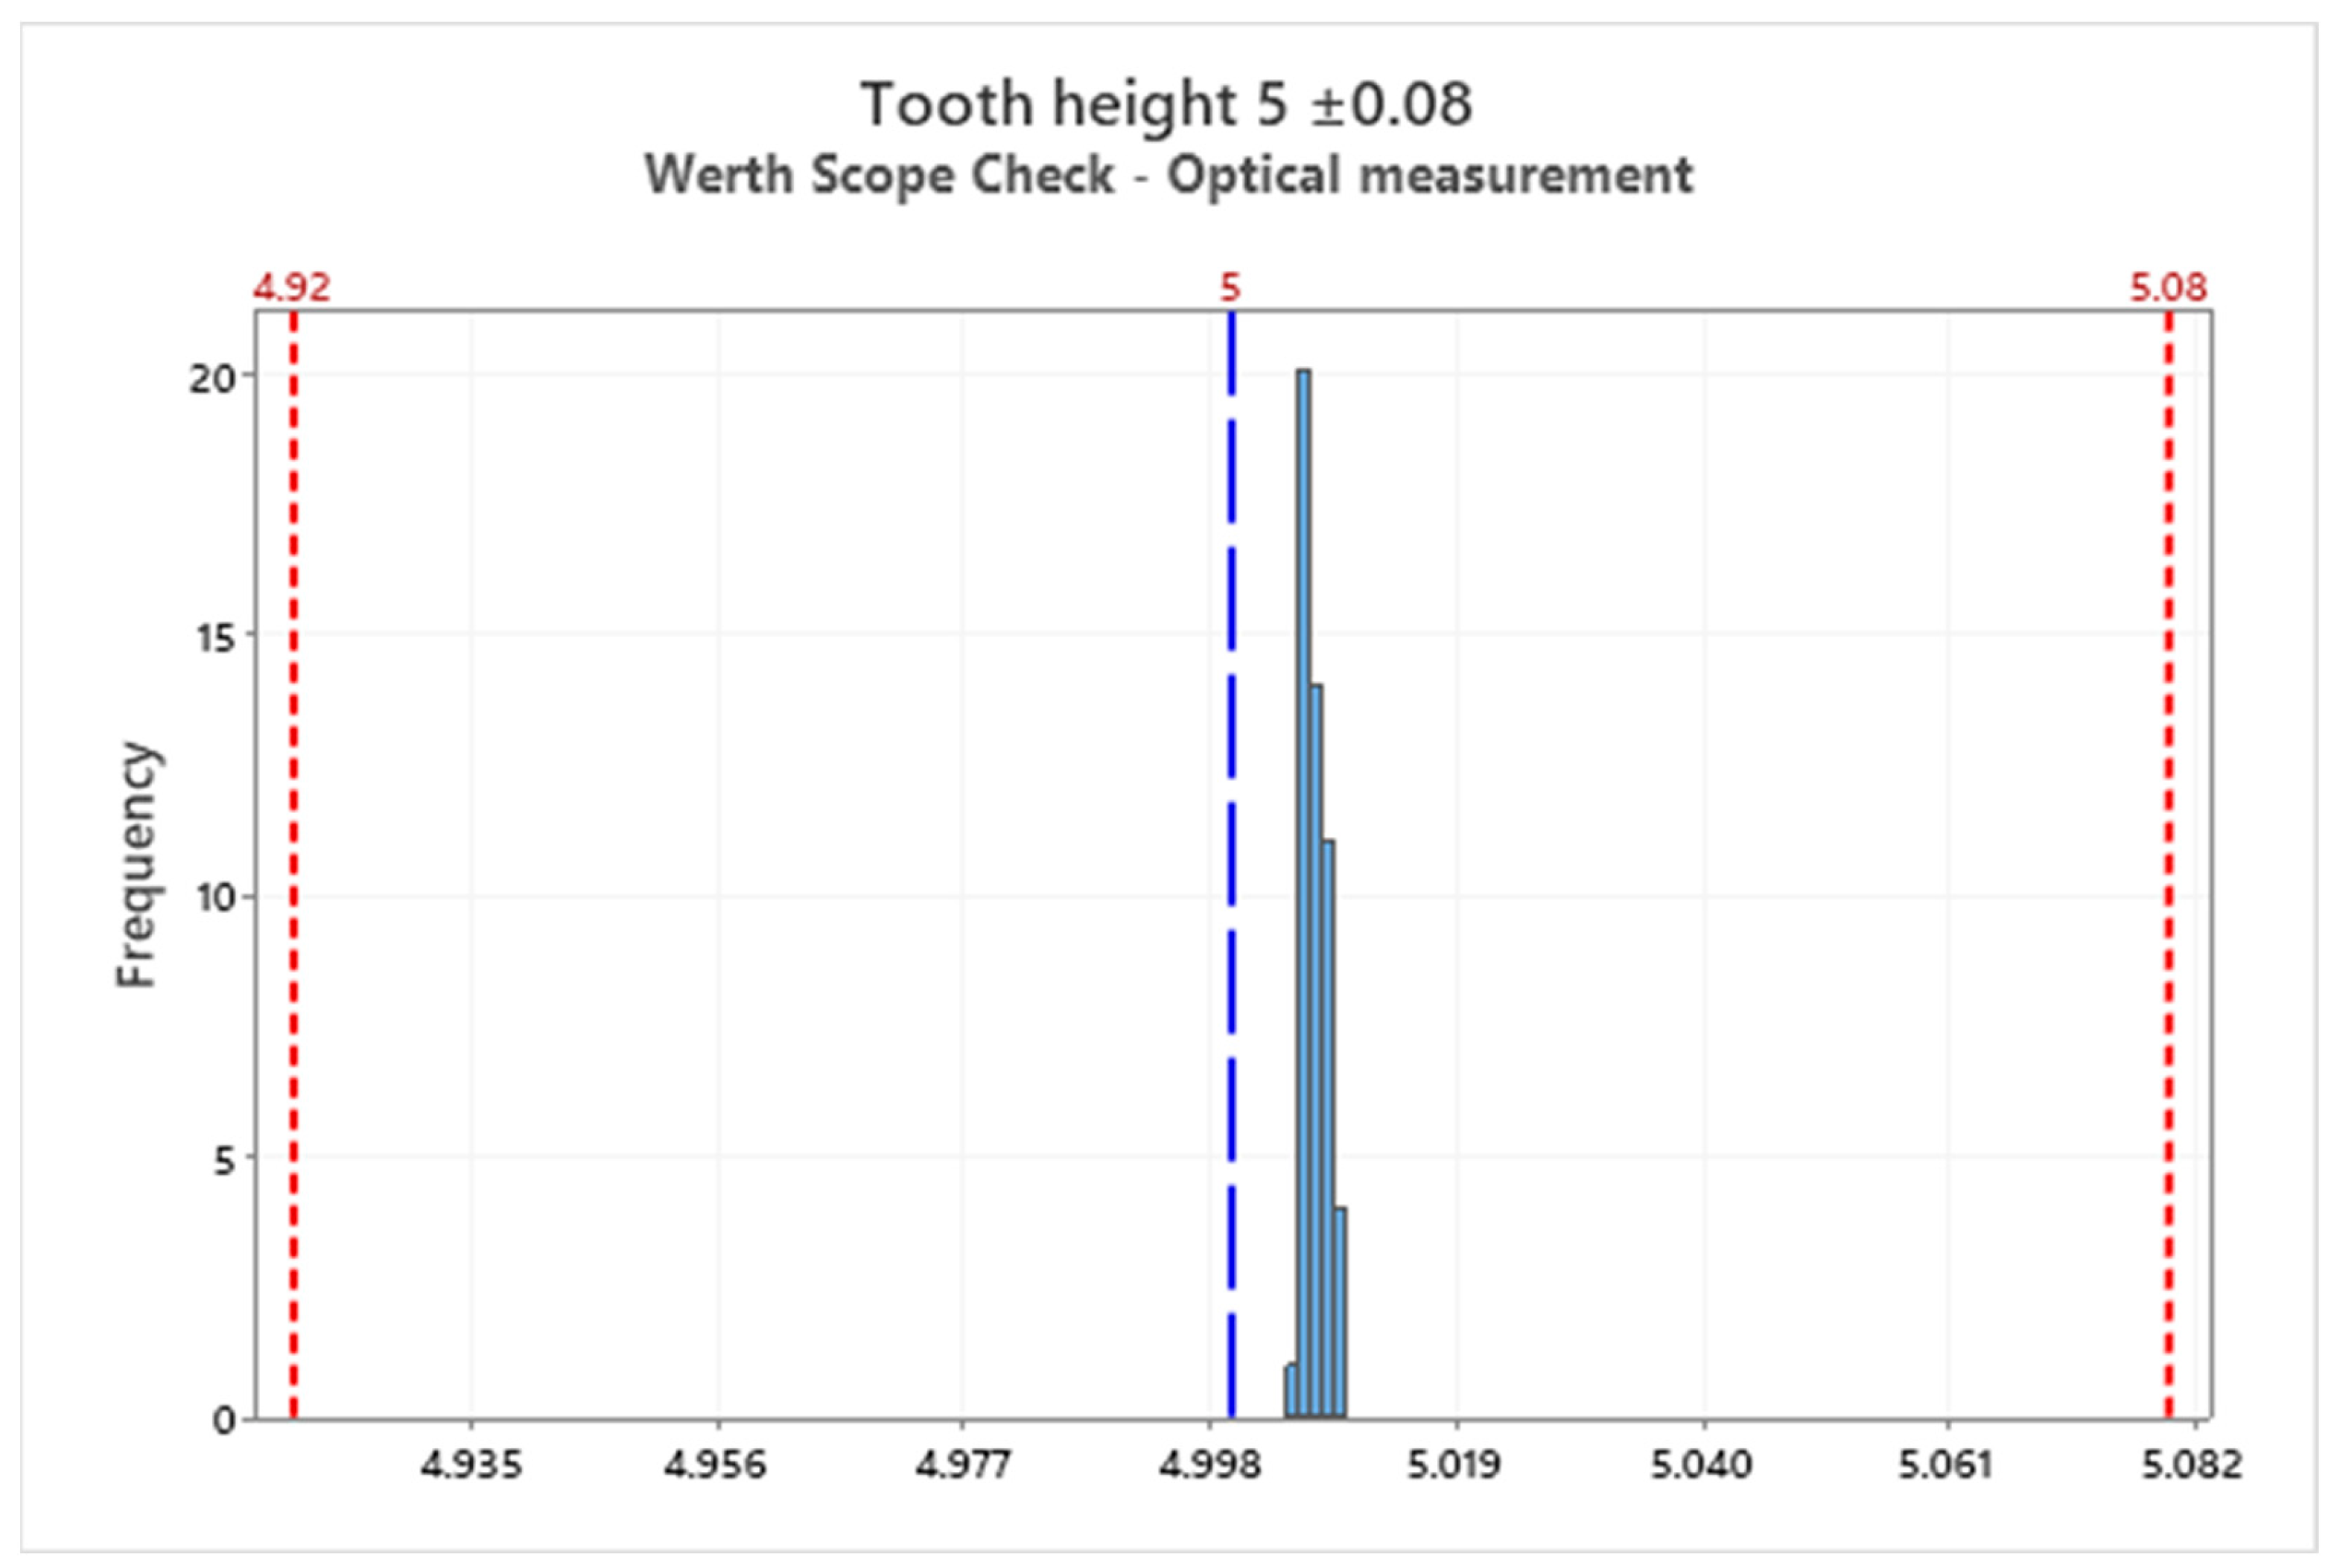
The parameter to be controlled after the second operation is the tooth spacing, which according to the specification should be 10 ± 0.05 mm. The next parameter is the tooth height with the specification 5 ± 0.08 mm shown in
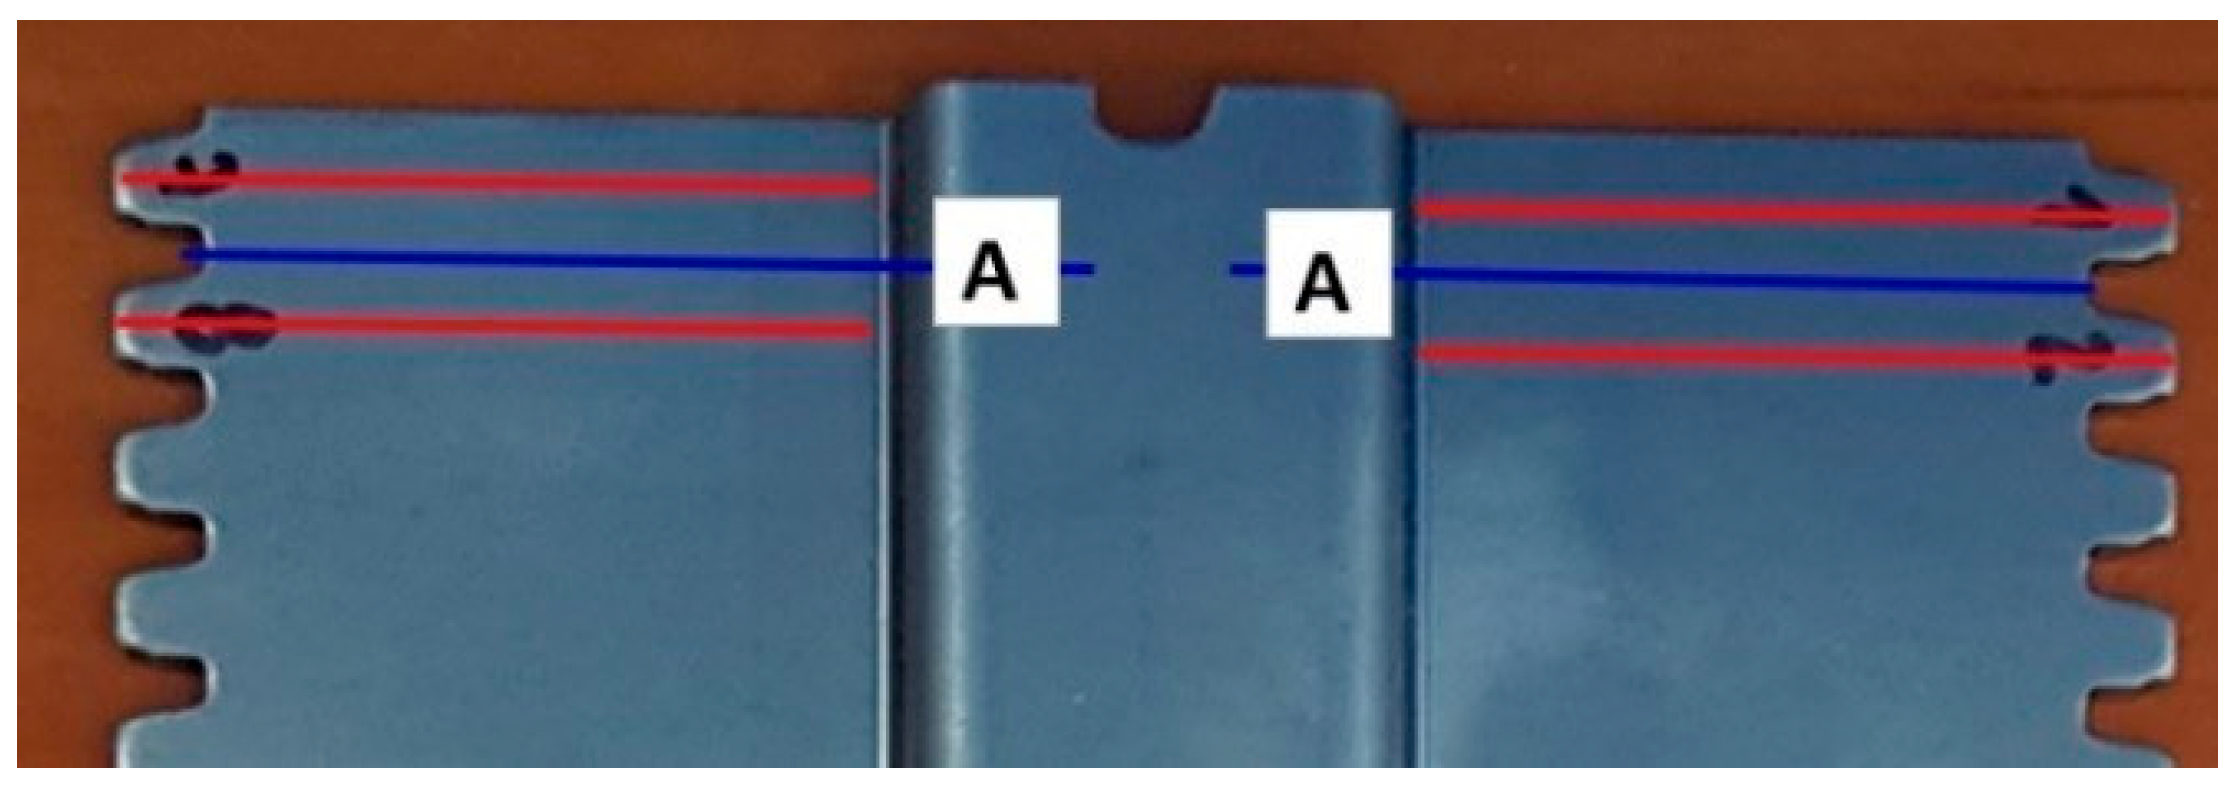
Figure 2, as well as the phase shift of the teeth of one side in relation to the other (the difference between the symmetry of adjacent teeth), defined as max. 0.05 mm, shown in
Figure 3. For the analysis, teeth No. 1 and 2, marked in
Figure 1, were selected. The spacing of the teeth was measured in such a way that the axis of symmetry of teeth 1 and 2 was determined and these teeth were measured 50 times. The method of determining the axis of symmetry of the teeth is shown in
Figure 2. Each of the teeth was measured in such a way that lines were marked on the edge of the tooth in the area of the red rectangle, and then the axis of symmetry was determined from these straight lines. The areas marked with boxes are intended to approximate the method of measuring the characteristics. Therefore, for the linear height one point was collected and for CMM DEA the axes on both sides of the tooth and the axis of the tooth symmetry were determined. For the Werth Scope Check, we determined several hundred points on the edge.
The contour is measured from the distant points every 0.01 mm (about 500 points). It results from the adopted magnification and resolution of the optical system.
The distance between the axes is the value of the tooth spacing 10 ± 0.05 mm. The height of the tooth was measured such that a point was acquired at the edge marked with a green area, and this point was set as the zero point. The point at the apex of the tooth was then collected. The value of this quantity determined the tooth height of 5 ± 0.08 mm. tooth No. 2 was selected for the analysis. As for the phase shift of the teeth, the axis of symmetry of teeth 1 and 2 marked in red in
Figure 1 was compared with the opposite teeth marked in green in the same figure.
The measurement of the first manufactured item is carried out on a 3D machine, while the measurement of the parameters is performed using a linear height gauge. The point here is to not block the machine for simple geometric measurements that can be made with other equipment of similar accuracy. Such equipment is undoubtedly the LH-600 linear height gauge, whose MPE defined by the manufacturer (specified in point 2) is on a comparable level to the Dea Global machine. Therefore, one would expect similar values of the measured characteristics. Unfortunately, the results obtained from measuring these characteristics differ significantly from those obtained with the CMM. The most important issue that raises doubts is the evaluation and comparison of various sensors and measurement strategies. G.F. Barbosa [
14] describes optical measurements which, compared with contact measurements, are much faster and provide the user with more information about the tested detail. This is true for research in the aerospace industry. Studying the variability and assessing the repeatability of the two measurement systems are intended to answer which system is better in terms of accuracy, efficiency, and productivity. This is related to the optimization of processes, which in the perspective of Industry 4.0 seems to be a standard. The issue of optical measurements is often generalized because optical measurements are measurements with the use of a microscope, structured light, or laser triangulation, among others. The measuring systems available in these studies, including the Multisensory Measuring Machine Werth Scope Check, enable the use of an optical sensor that allows for image recording. The optical sensor can be used in the so-called static or dynamic measurement mode. These modes differ in that the dynamic measurement consists in scanning the entire detail using the Raster Scanning HD, which enables dynamic registration of contours, while the static mode is carried out by sequential runs from the characteristic measurement point to the next measuring point.
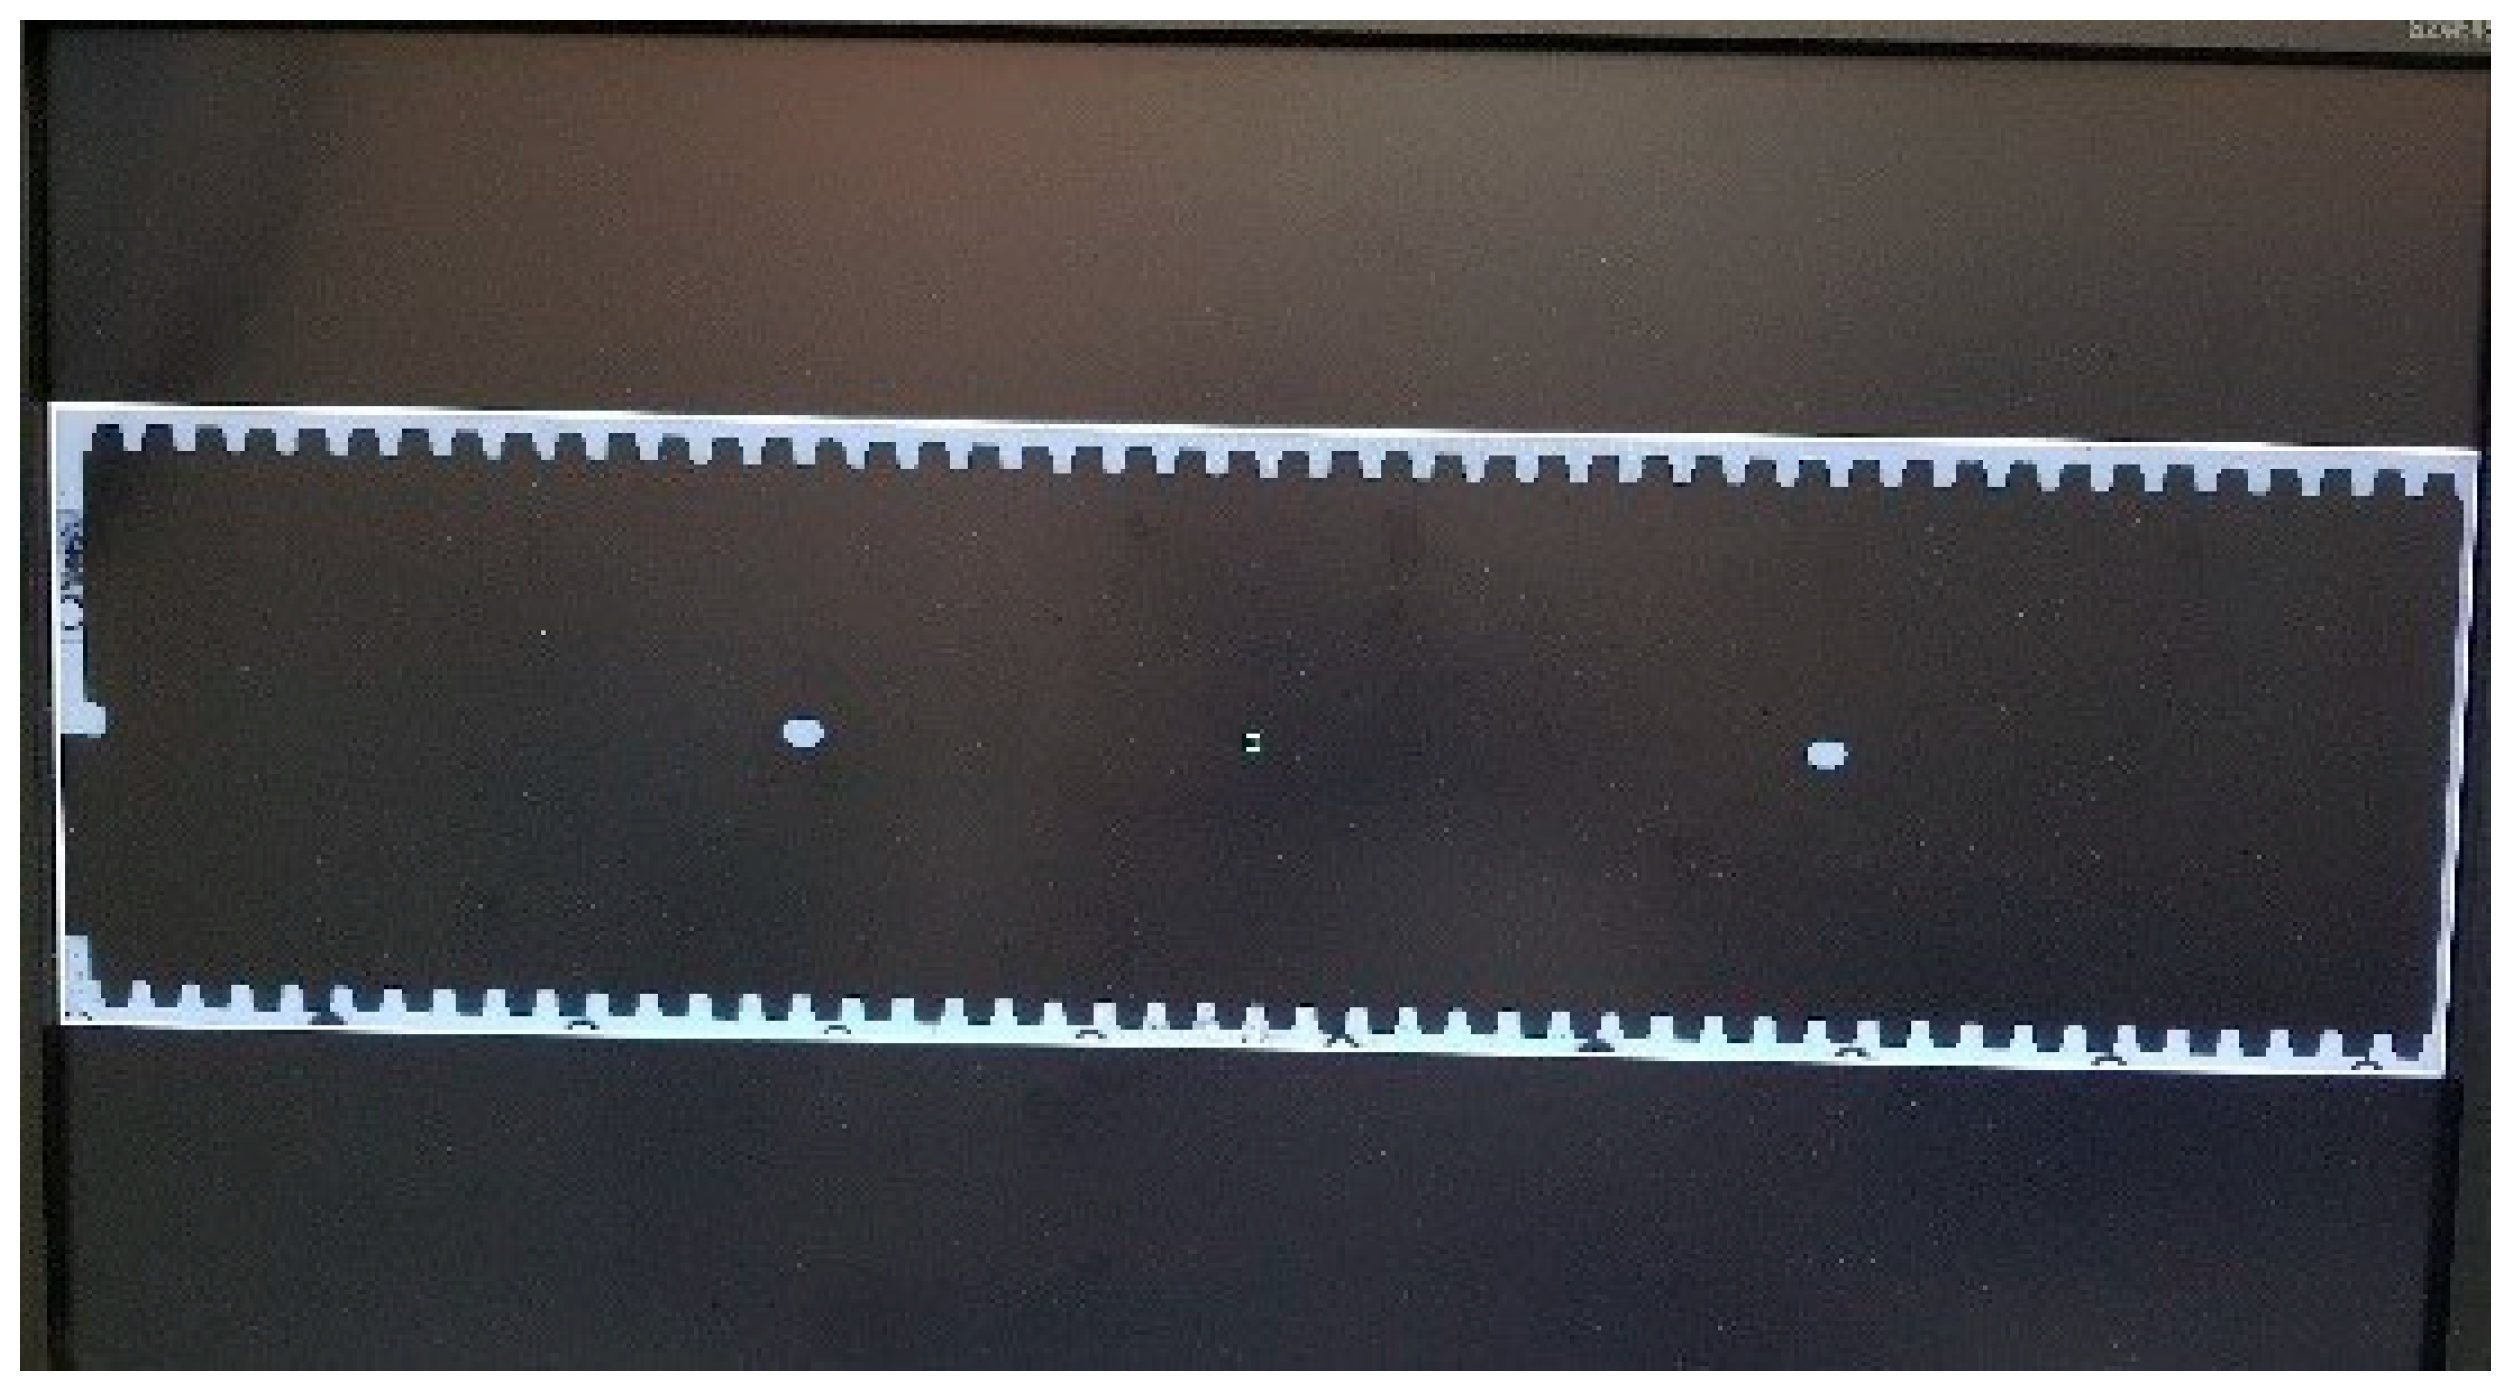
A schematic example of a dynamic measurement is shown in
Figure 4. Analyzing the results of various measurements, we can expect many variables that may cause differences that will raise doubts for the person deciding to accept the production process.
In this study, it has been established that the system analysis will start with checking the capability of the measuring equipment by determining the Cg/Cgk capability index for three types of equipment with the maximum permissible errors for the equipment specified according to [
15]. This indicator evaluates only the measuring device (not the process and not the measuring system). It provides information about the extent the instrument is suitable for the assumed measurement task.
LH-600 Height gauge → E0,MPE = 1.1 + 0.6 × L/600 µm, L in mm;
DEA Global Coordinate Measuring Machine → E0,MPE = 1.7 + L/333 µm, L in mm;
Werth Scope Check FB DZ Multisensory Measuring Machine → E0,MPE = 2.9 + L/100 µm, L in mm.
As may be seen above, according to the MPE equations, the height gauge has the best MPE value. However, it should be remembered that this is the accuracy of the measuring device in one axis, namely, the Z axis. Coordinate machines have this accuracy specified in the XYZ space, so it cannot be compared 1:1.
Before starting the experiment, measurements were carried out in an accredited laboratory and model values for the analyzed characteristics were obtained. Then, with the use of measurement systems available in the organization, the tested piece was measured 50 times and the results were obtained which are presented below using various graphs performed with the Minitab program. The measurement with the height gauge took place in the laboratory, where the temperature stability is controlled and was 21 ± 0.3 °C during the measurement. The sample was attached to the prism, and the height gauge was placed on a granite plate in class “0”. The measurement conditions are shown in
Figure 5.
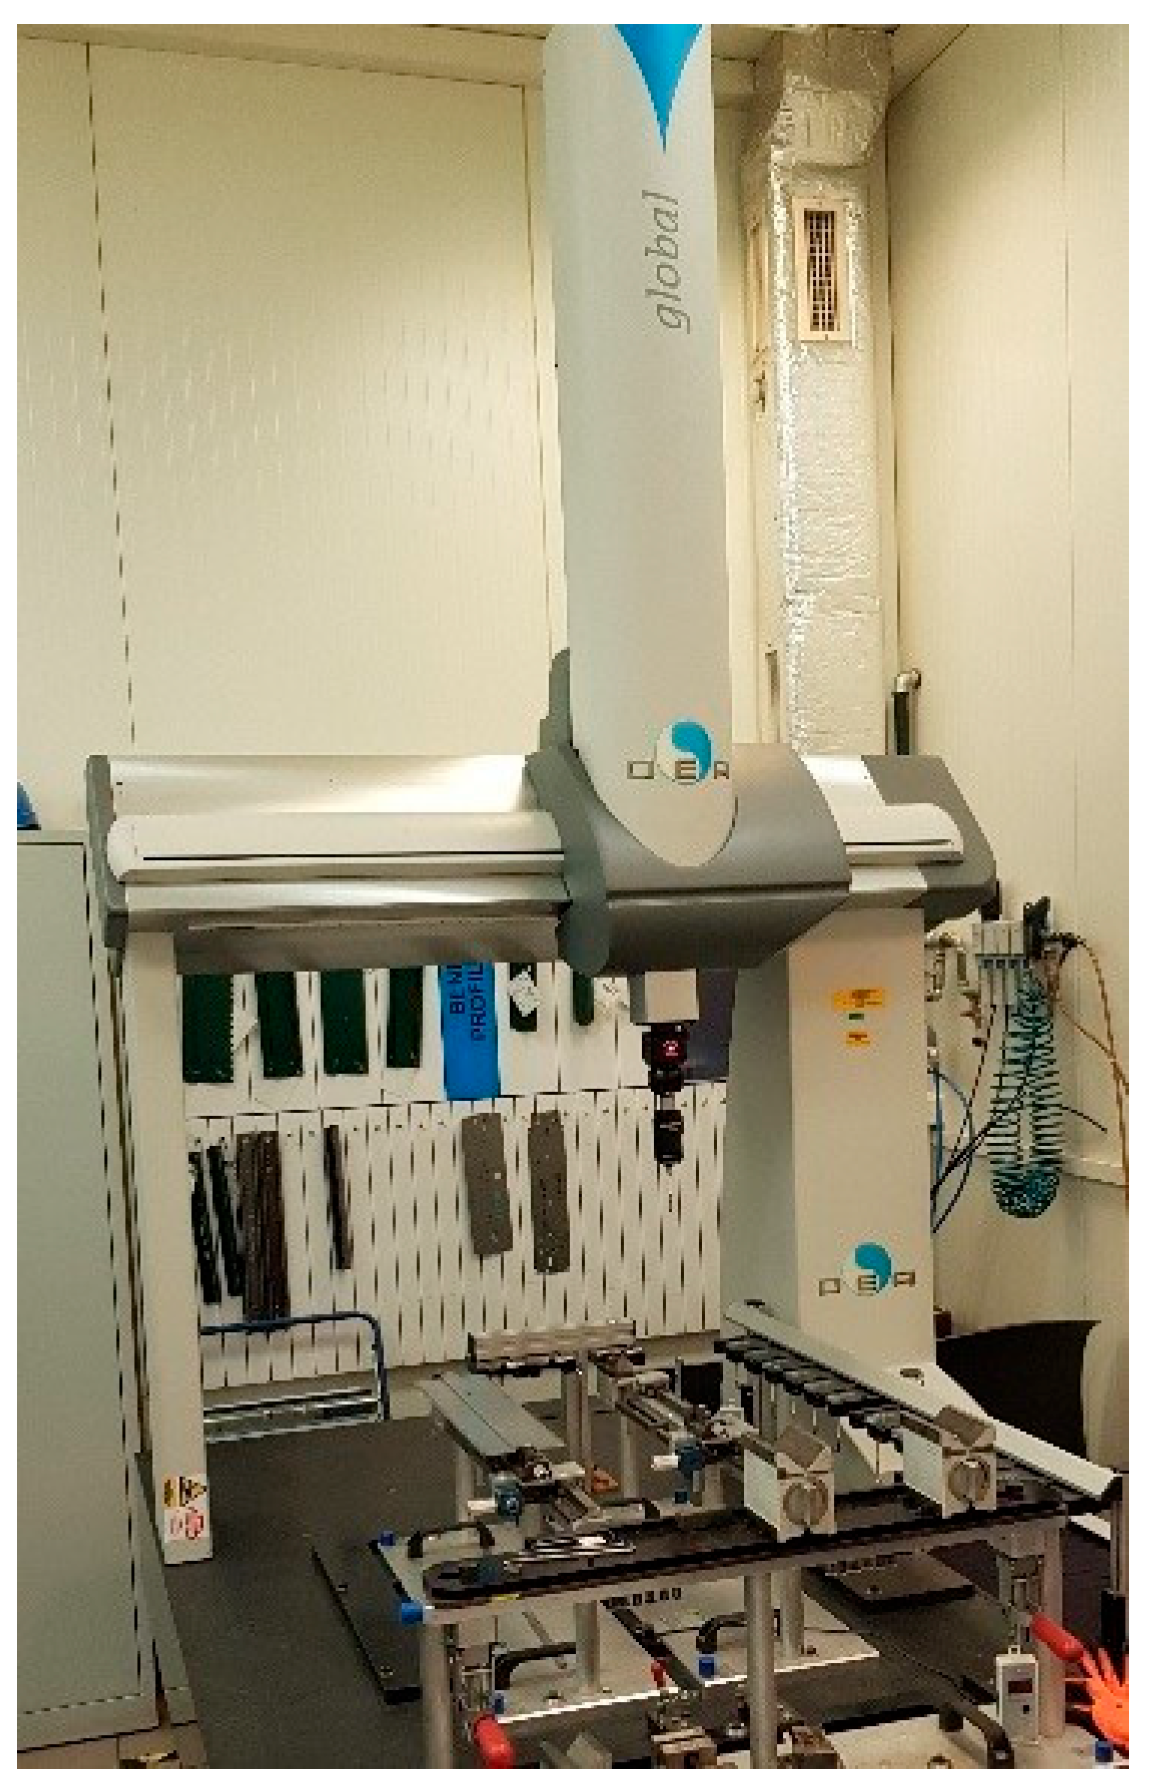
Another series of fifty measurements of the same piece was carried out using the DEA Global Coordinate Measuring Machine with a contact head, and the sample was mounted on a tripod and locked with clamps, which ensured that the sample was firmly fixed during the measurement. The fixing and measurement are shown in
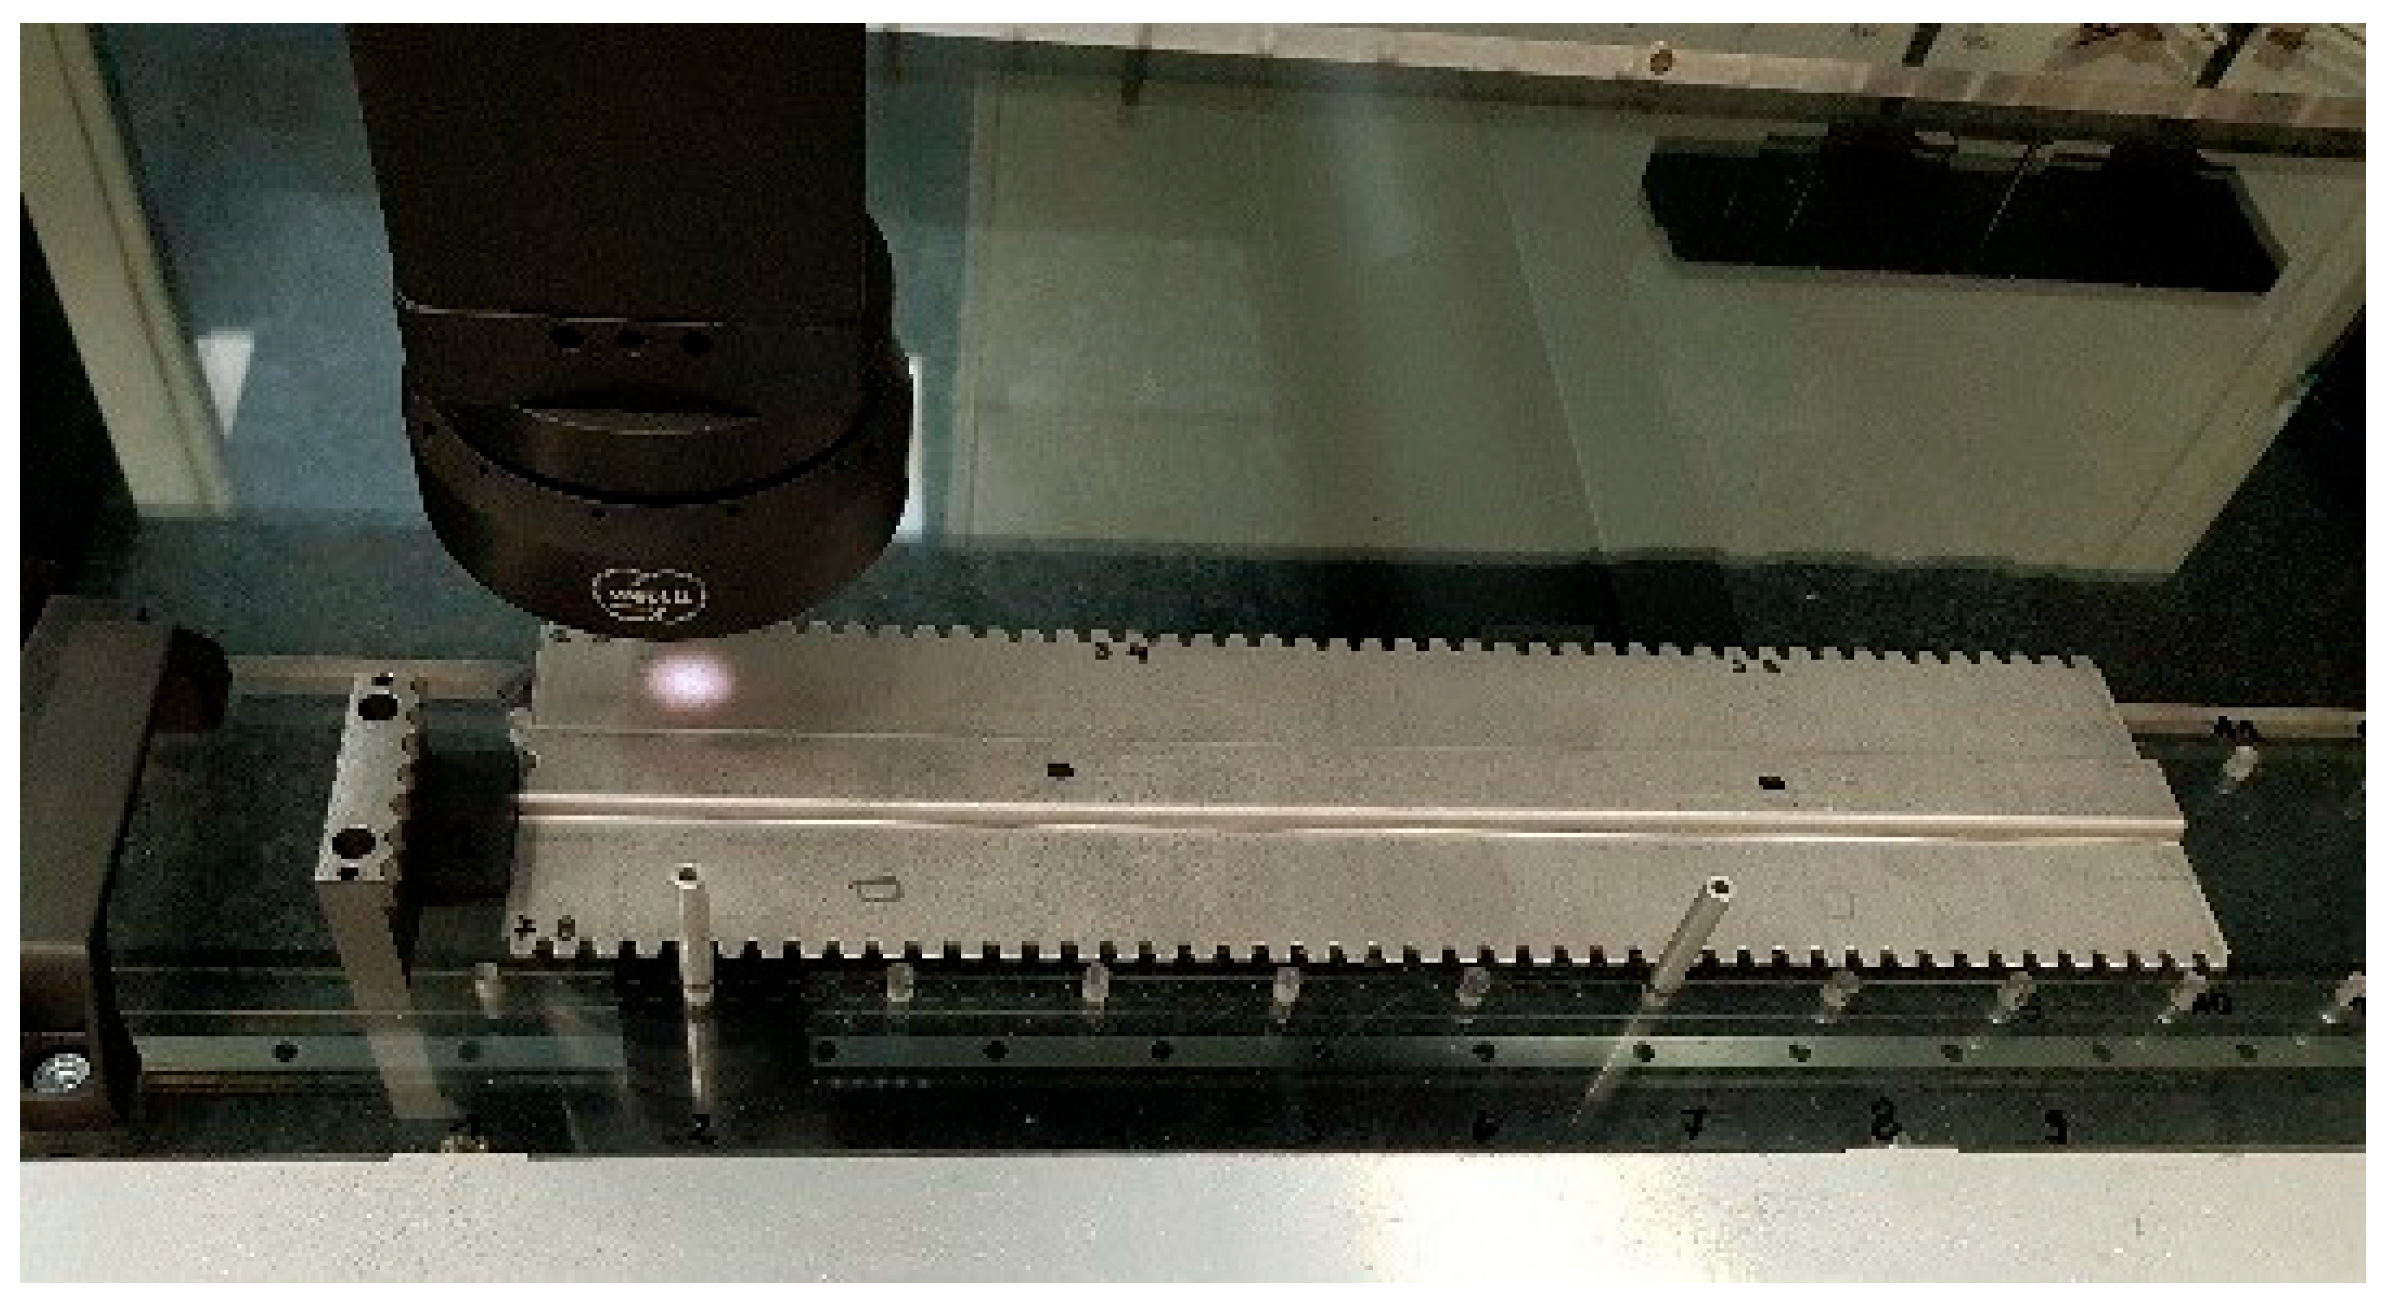
Figure 6. When measuring with the Multisensory Measuring Machine Werth Scope Check, the detail was placed on the plate in such a way that the optical sensor used to measure the sample could scan the entire detail and obtain a scan view. Mounting of the blank during optical measurement is shown in
Figure 7, while the view of the blank after scanning is shown in
Figure 4.
Orientation in the same position is not possible for the three considered measurement systems. The LH-600 linear height gauge allows to measure only in the Z axis; the head in the DEA Global contact machine allows to measure in the Z axis as well as in any other orientation using the change of the orientation of the head for this purpose. Unfortunately, the quill for the optical sensor in the multisensory machine does not allow a change in the position, so the measurements were made in such a way that the detail was positioned in the XY plane. The height gauge measurement for the measured piece oriented in the XZ plane is the only possible fixture in this case. It should be mentioned that the linear height gauge is only a safety solution and the CMMs are the main equipment. It does not change the fact that the authors wanted confirmation as to the compatibility of the obtained results.
3. Results
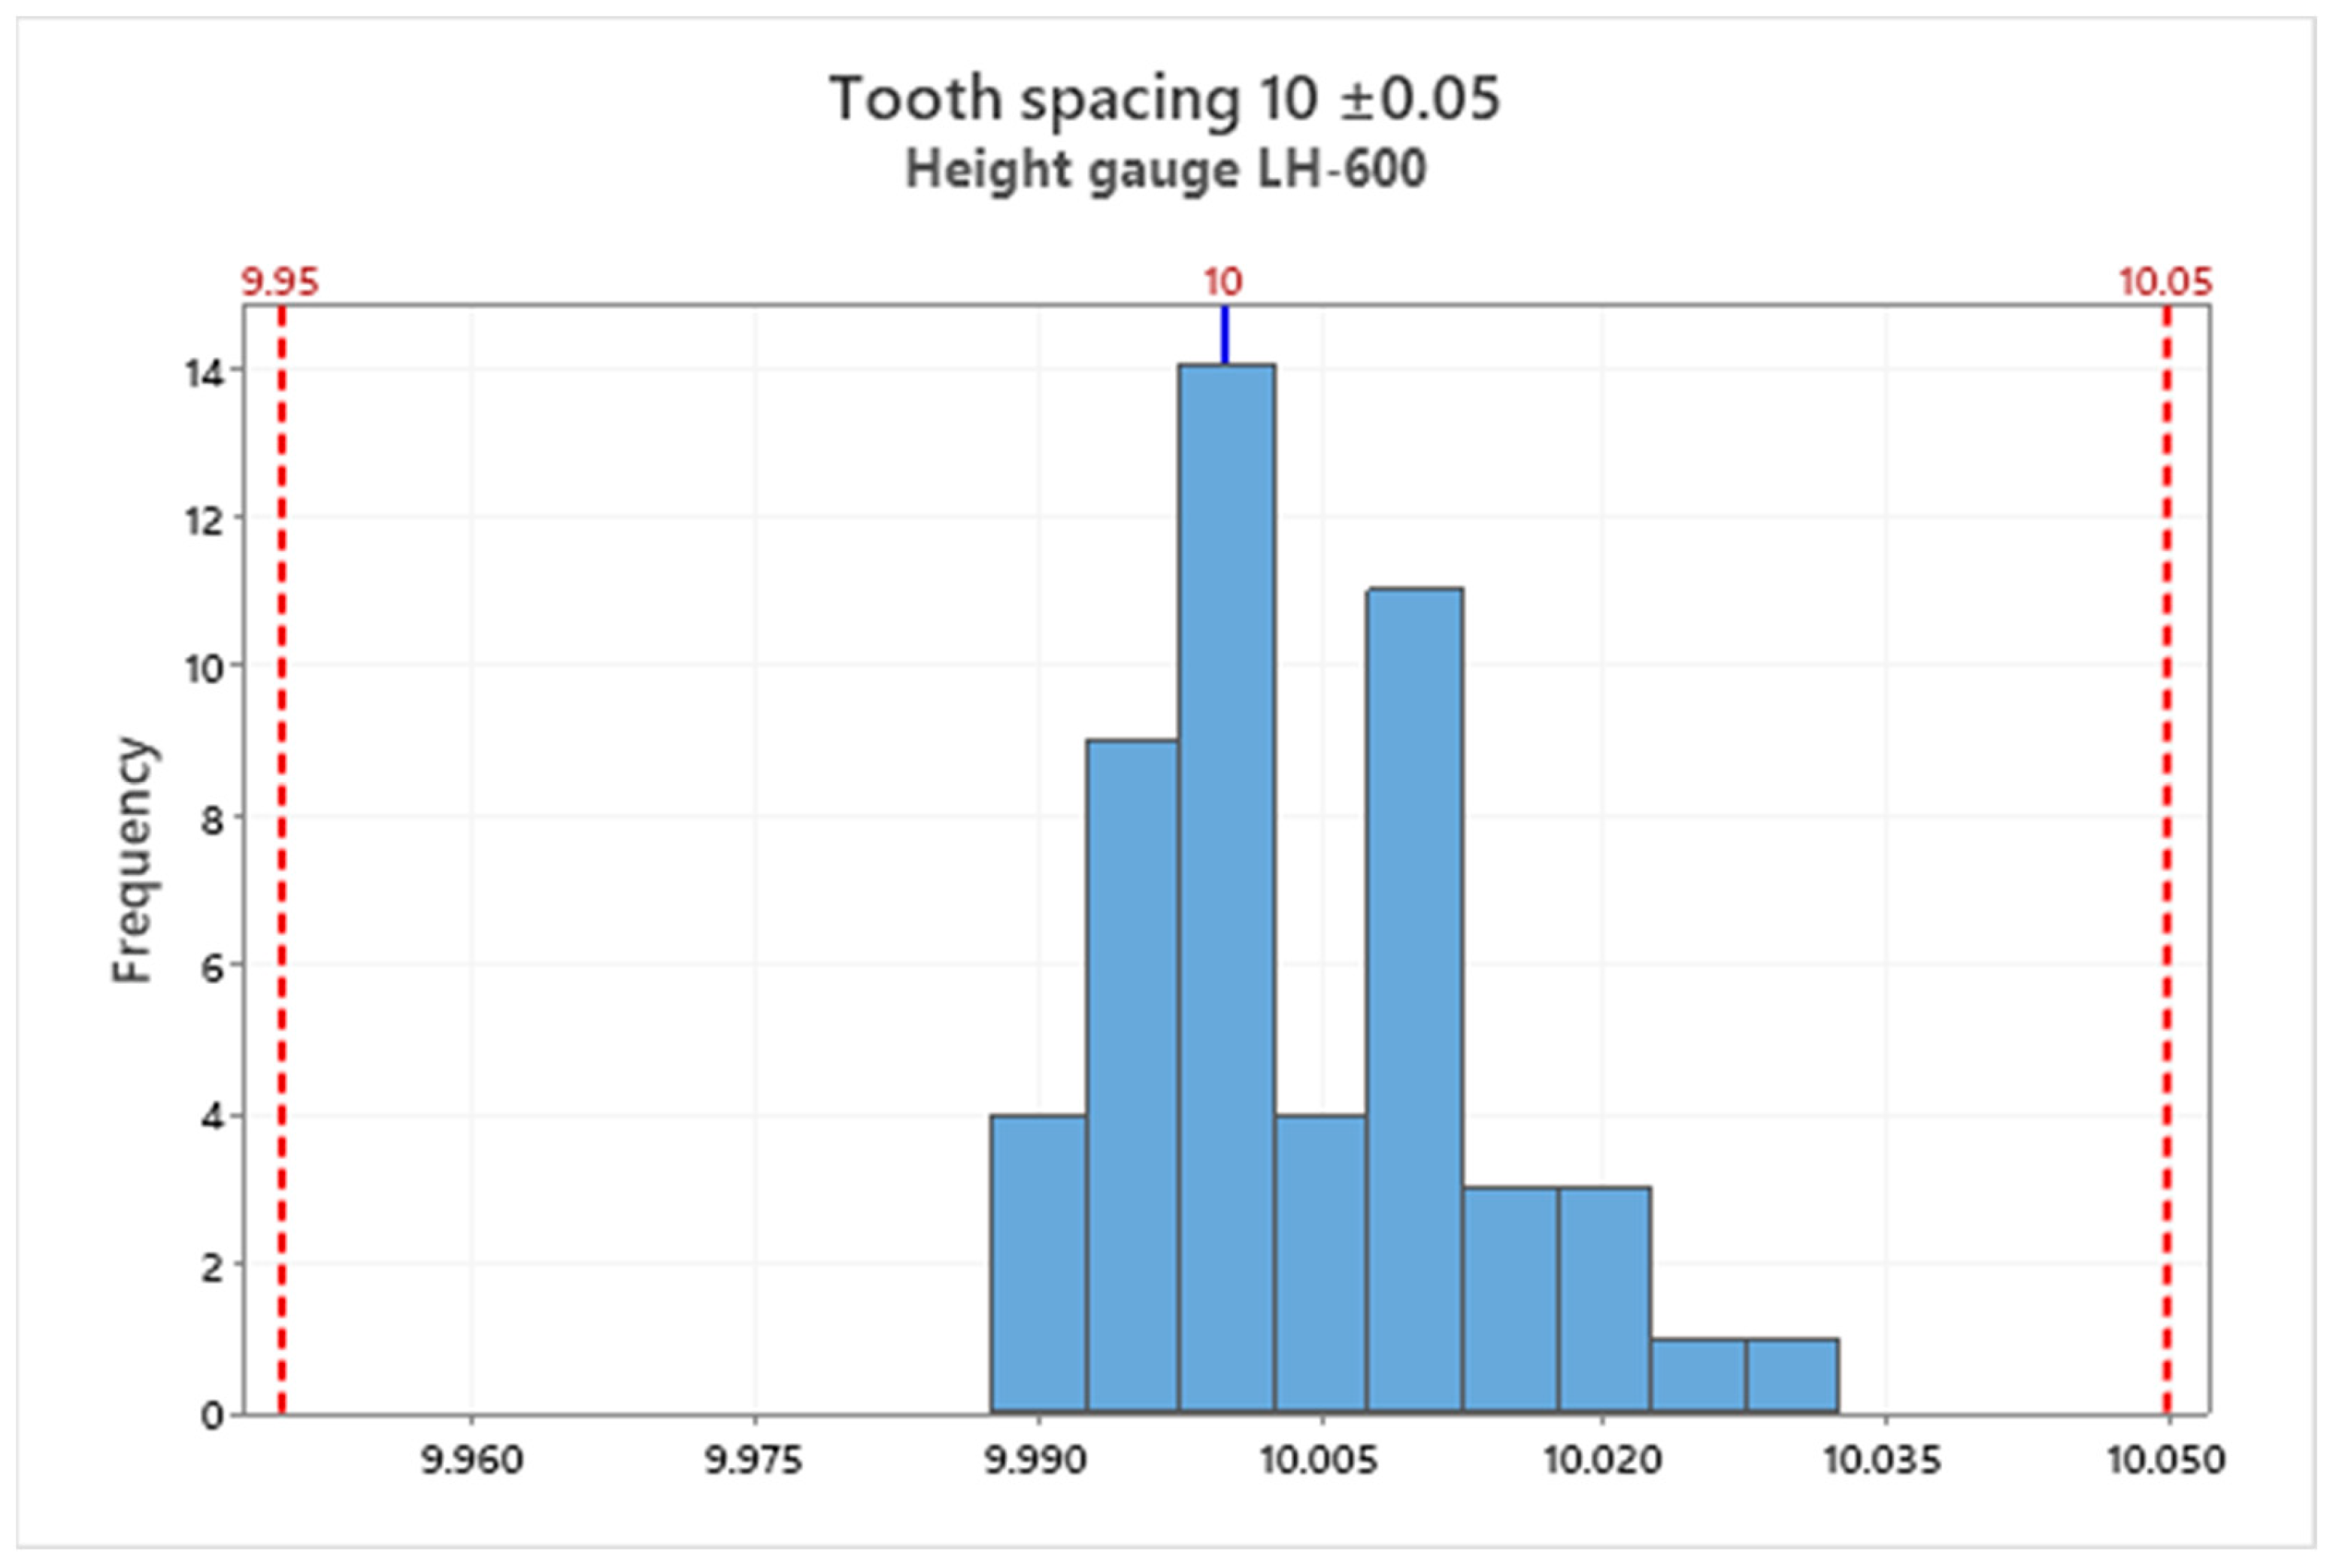
The results obtained from the measurements were arranged in a spreadsheet and then copied to the Minitab program which used the available tools to then illustrate the results with histograms. Thus,
Figure 8 shows the results for the characteristic teeth spacing 10 ± 0.05 mm using the LH-600 height gauge;
Figure 9 shows the same characteristic, but the measurements have been made using the DEA Global Coordinate Measuring Machine; and
Figure 10 shows the measurement results obtained with the Multisensory Measuring Machine Werth Scope Check with the use of an optical sensor recording the image.
The following graphs show the characteristics of a tooth height of 5 ± 0.08 mm for individual systems. Therefore, for the height gauge, the values of the results are shown in
Figure 11; for the DEA Global Coordinate Measuring Machine, the results are shown in
Figure 12; and for the Werth Scope Check Multisensory Measuring Machine, the results are shown in
Figure 13.
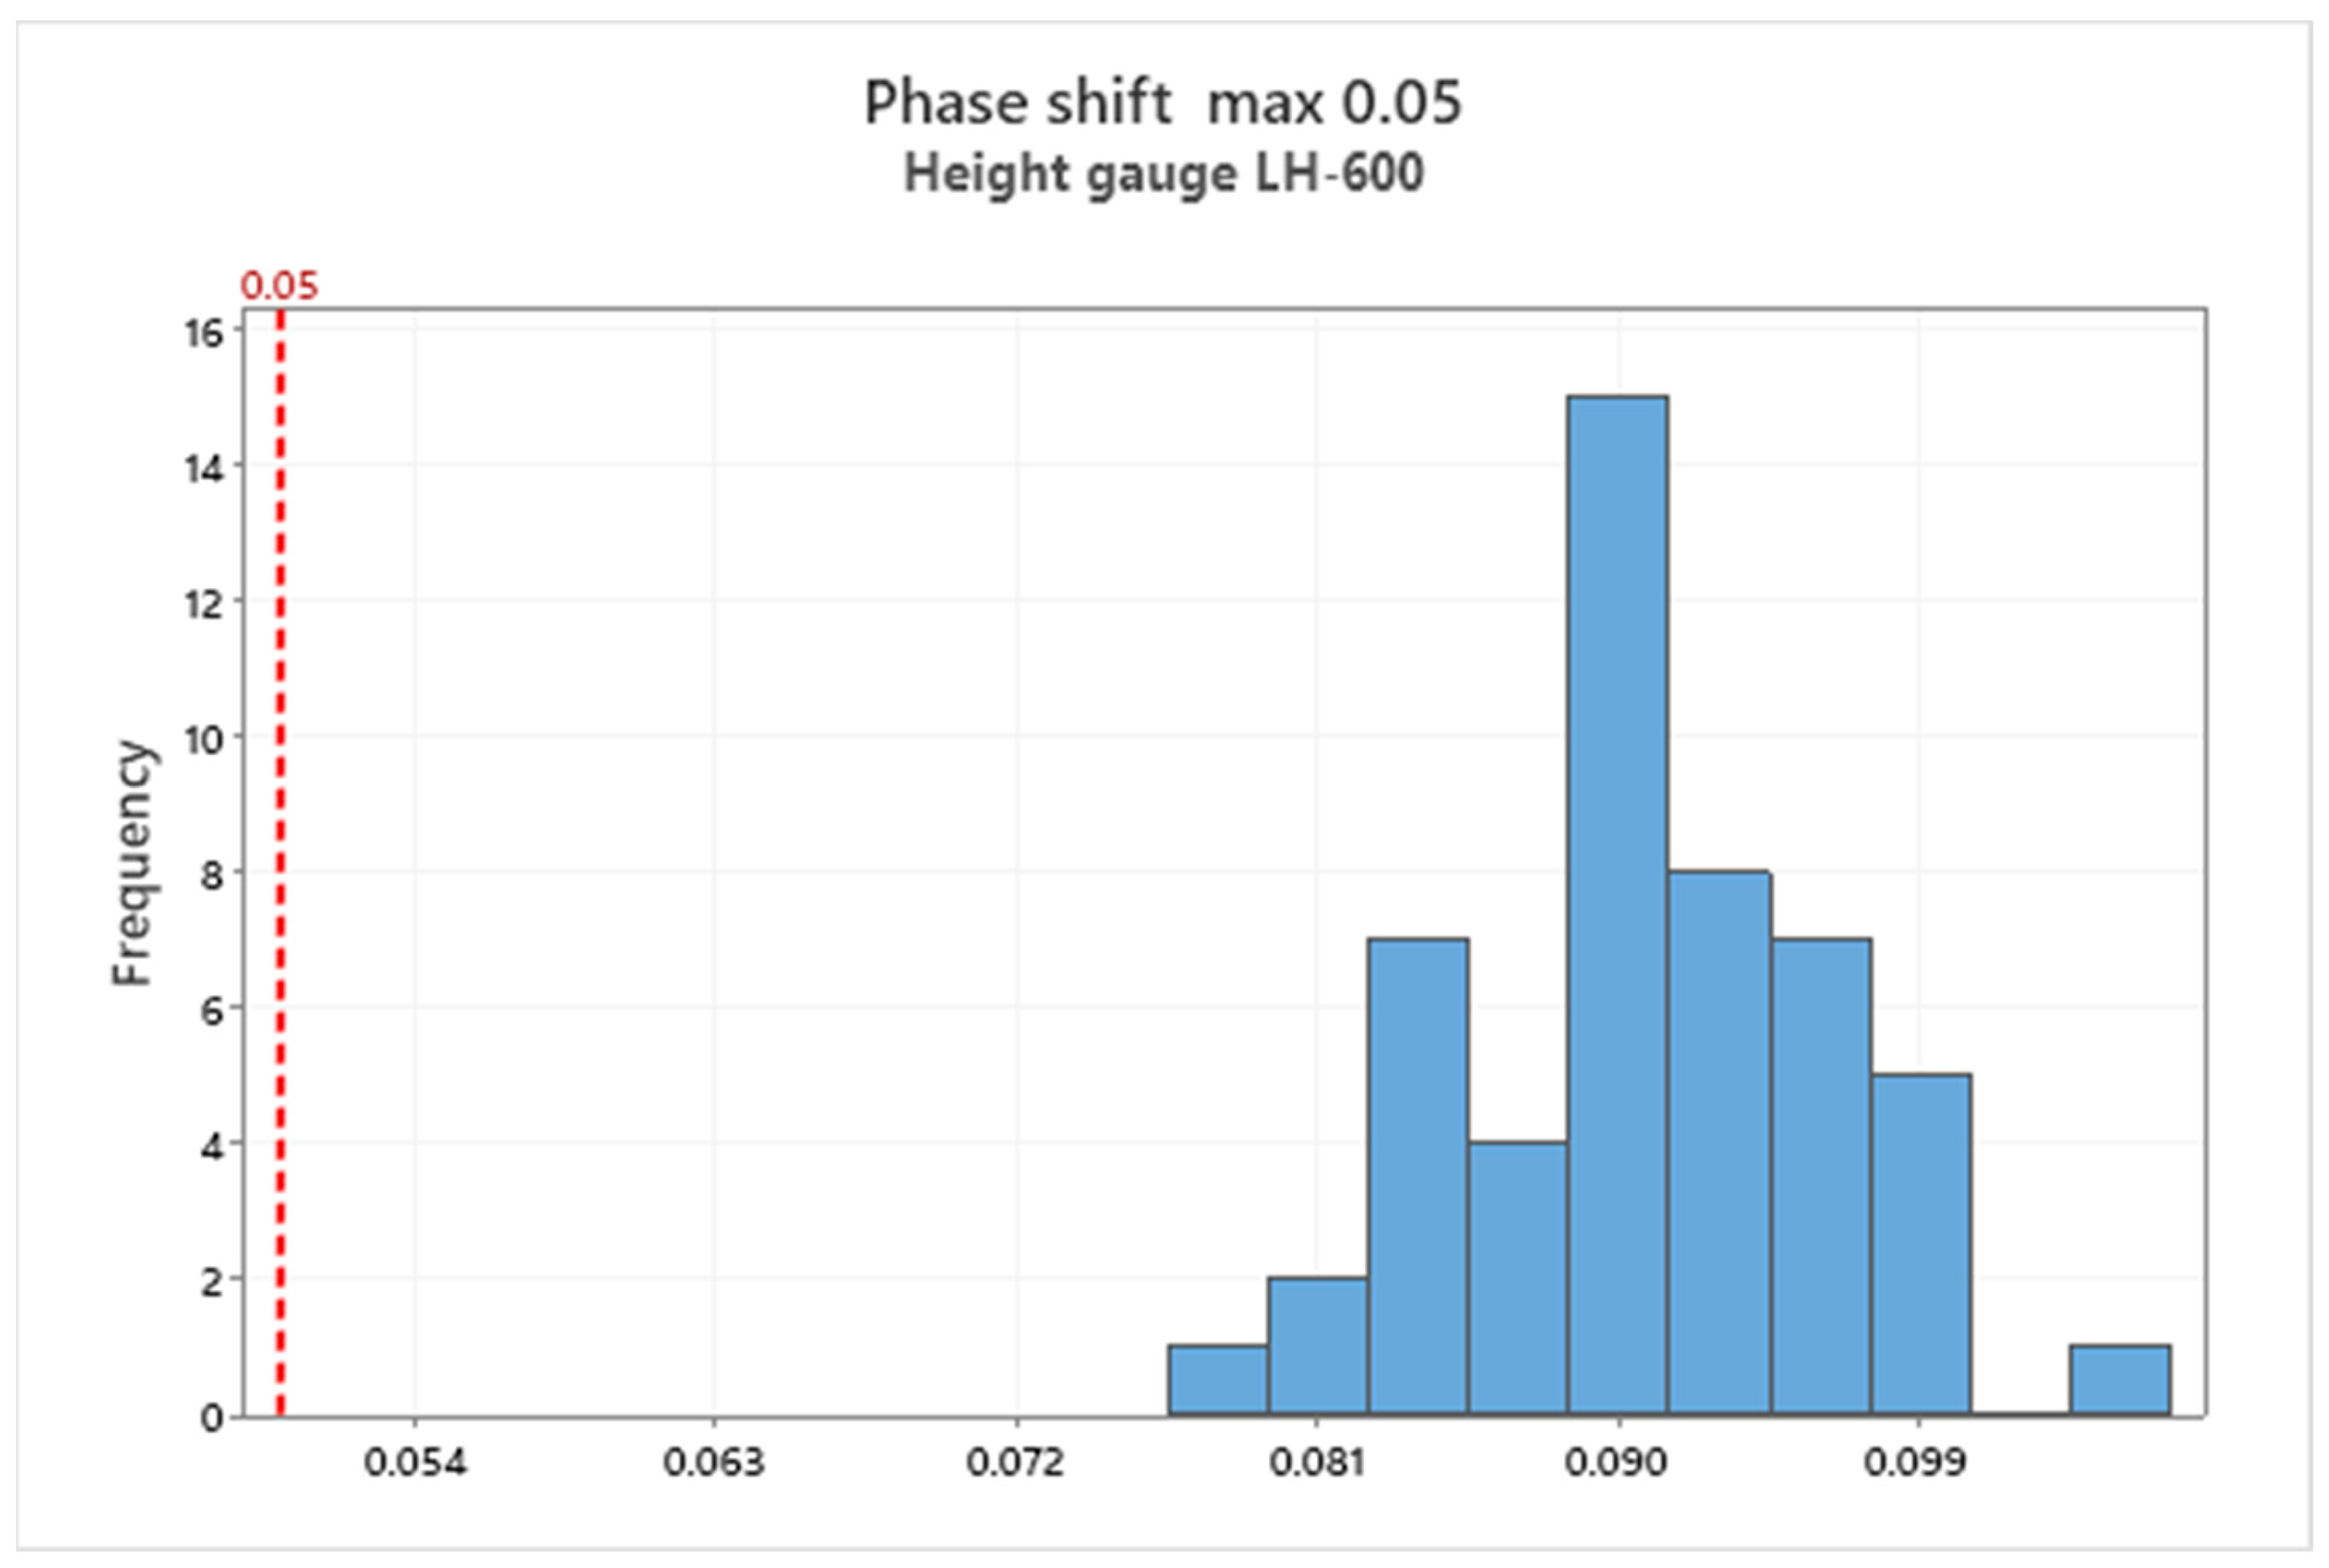
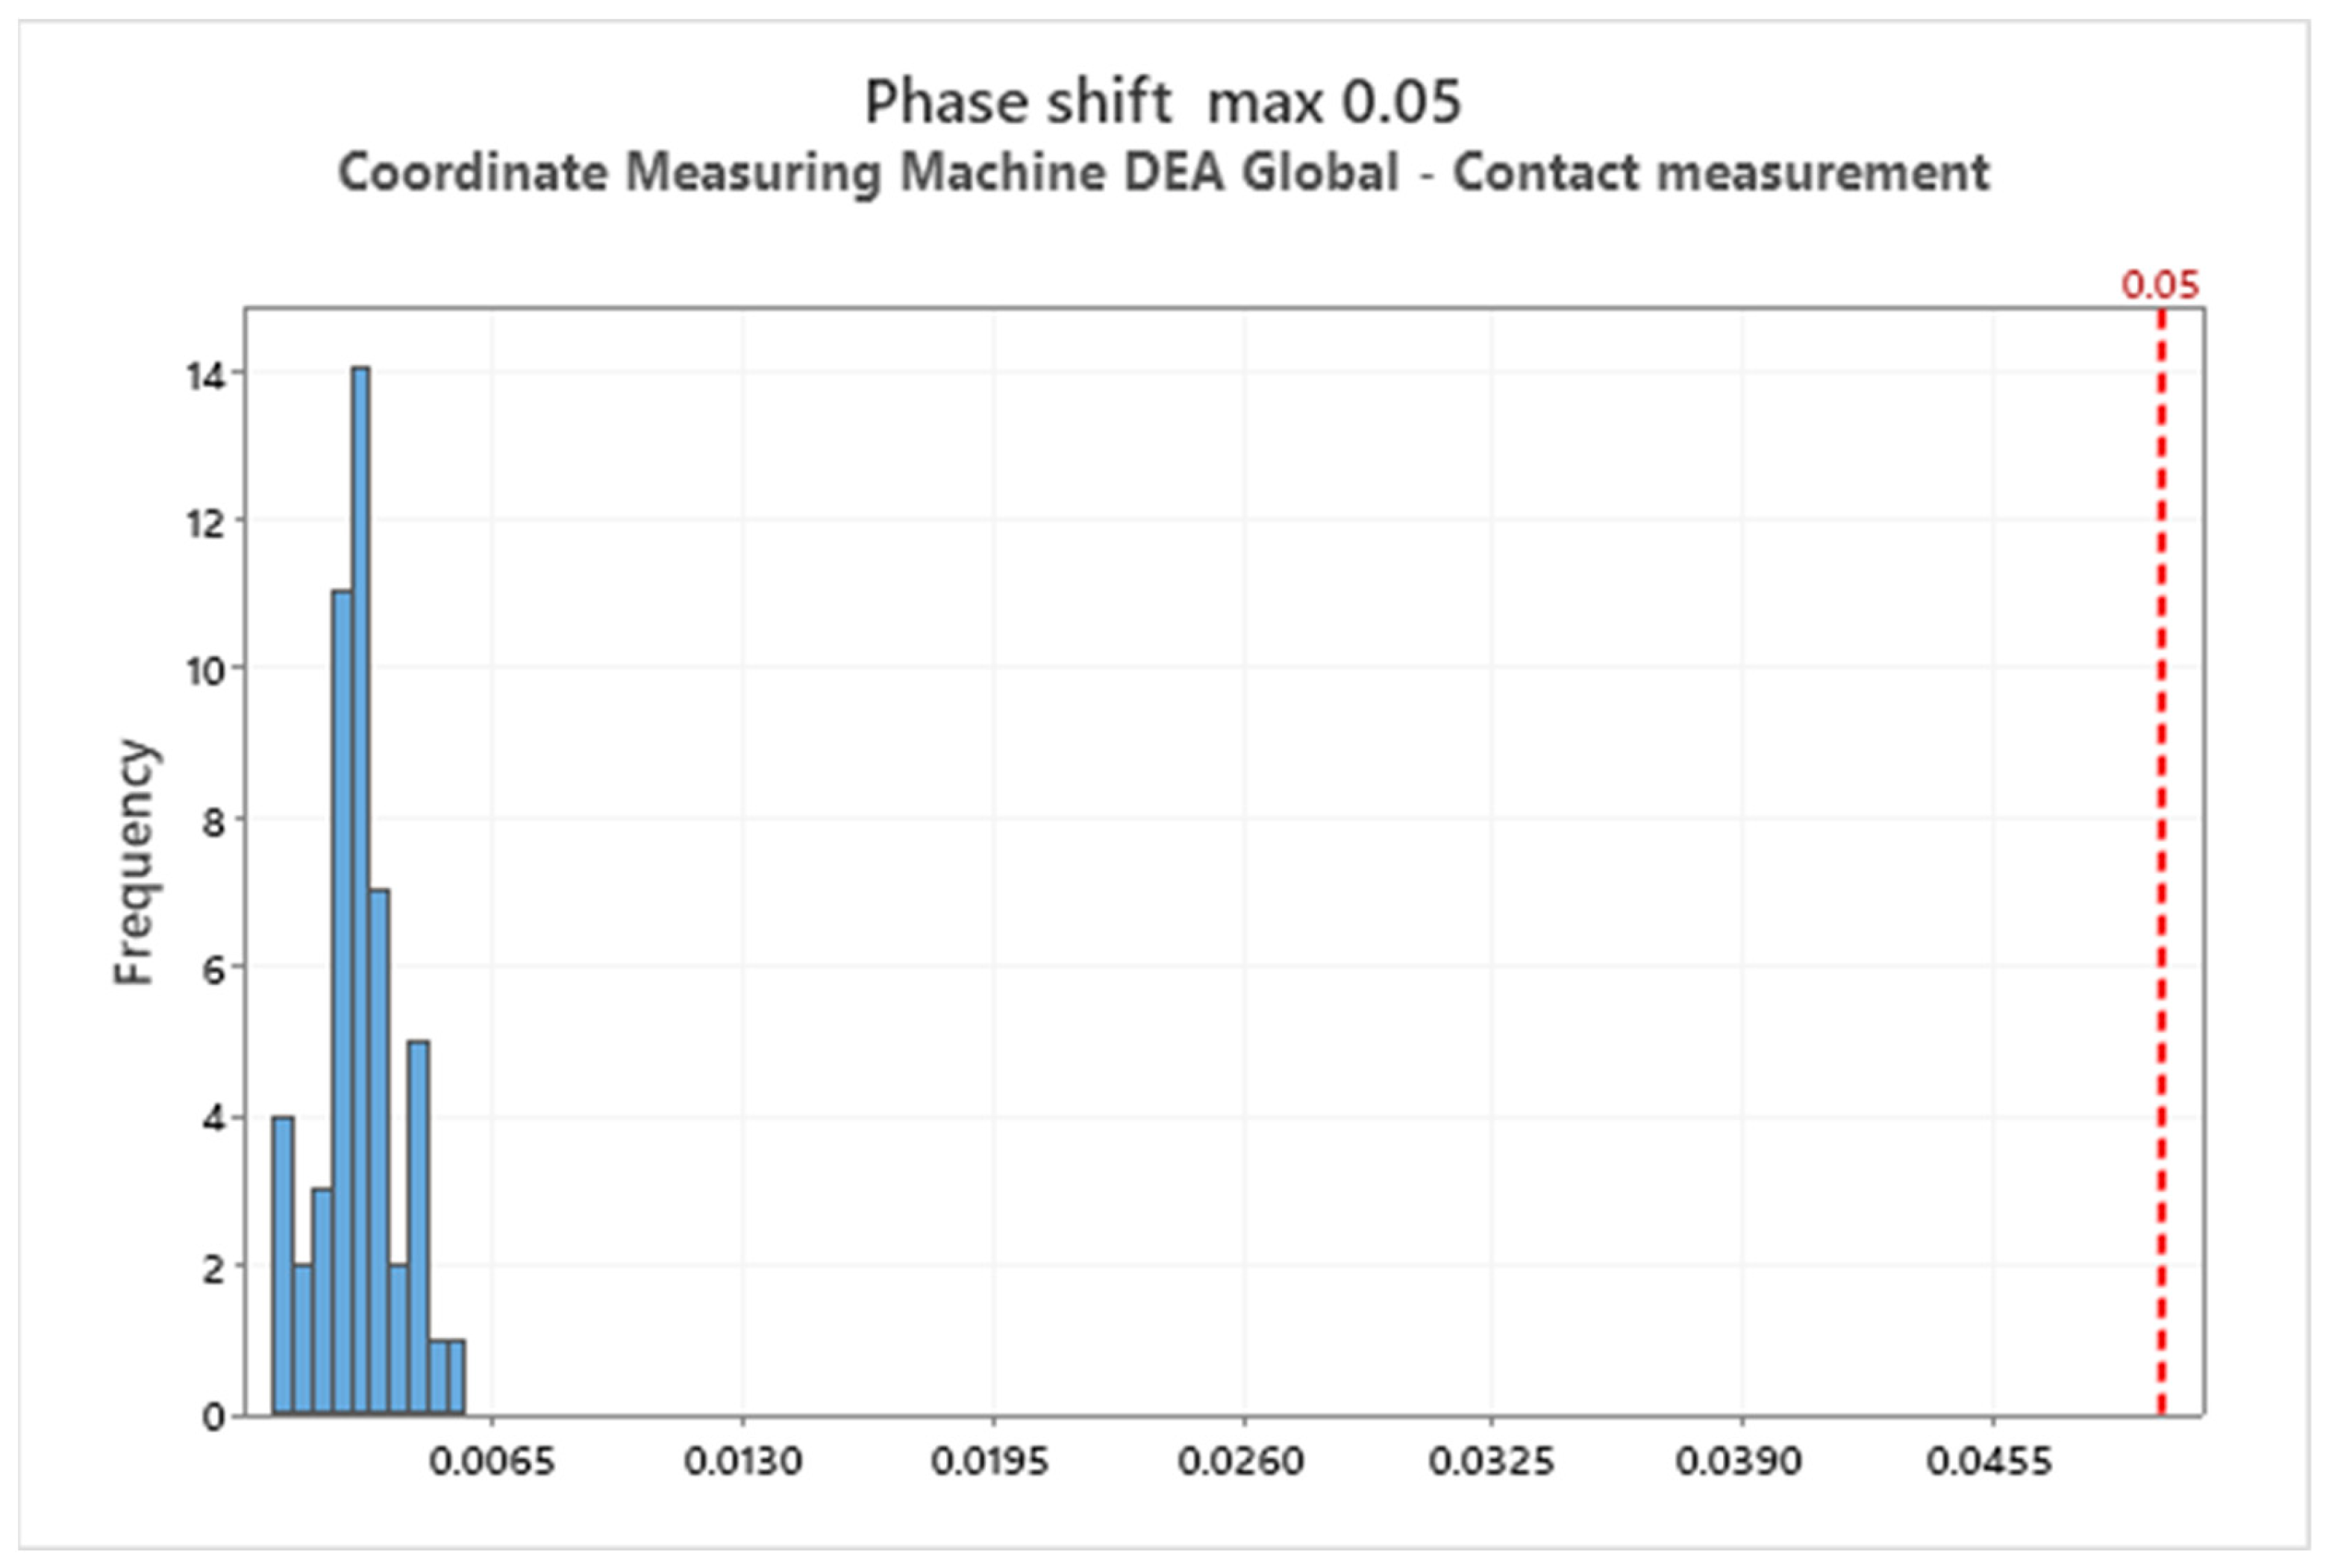
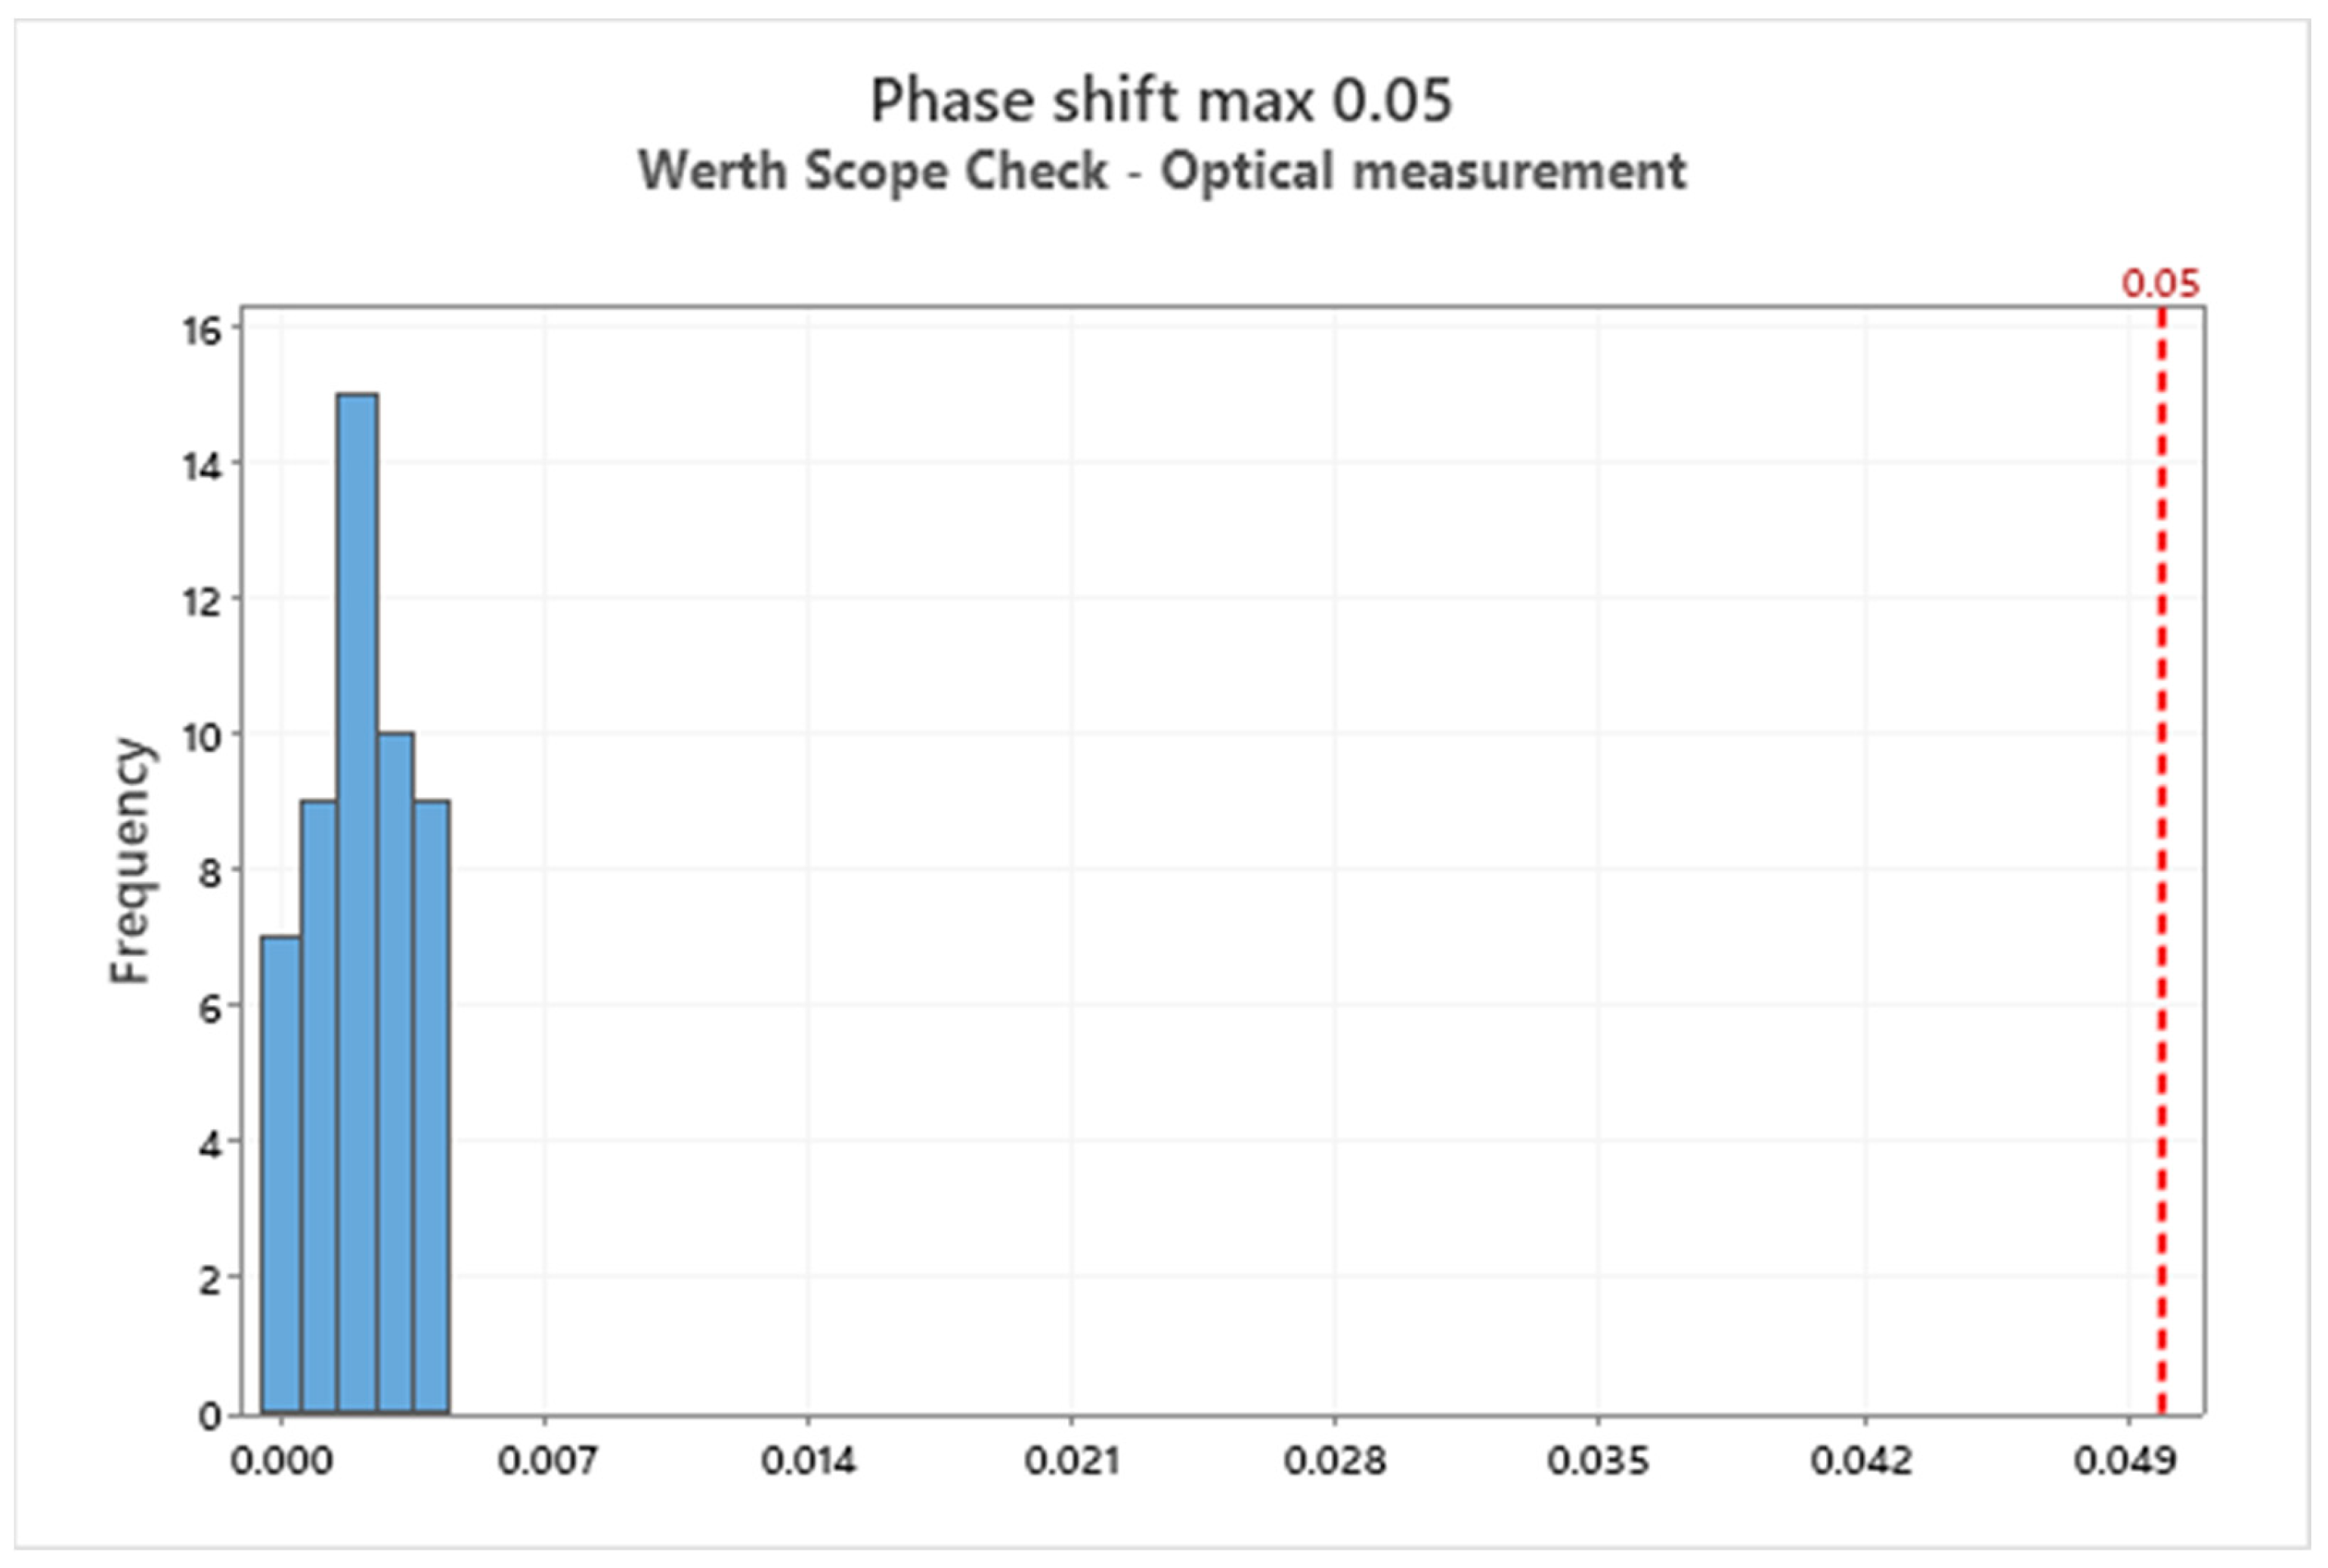
Moving on to the third analyzed characteristic, which is the phase shift of the teeth max. 0.05 mm, we see the histogram for the results obtained from the measurements with the height gauge, which is shown in
Figure 14. Then, the histogram for the results obtained during the measurement with the Coordinate Measuring Machine is shown in
Figure 15, DEA Global. The histogram for the results obtained from measurements with the Multisensory Measuring Machine Werth Scope Check is shown in
Figure 16.
For the performed measurements, the measurement uncertainty was estimated, which is presented in
Table 1.
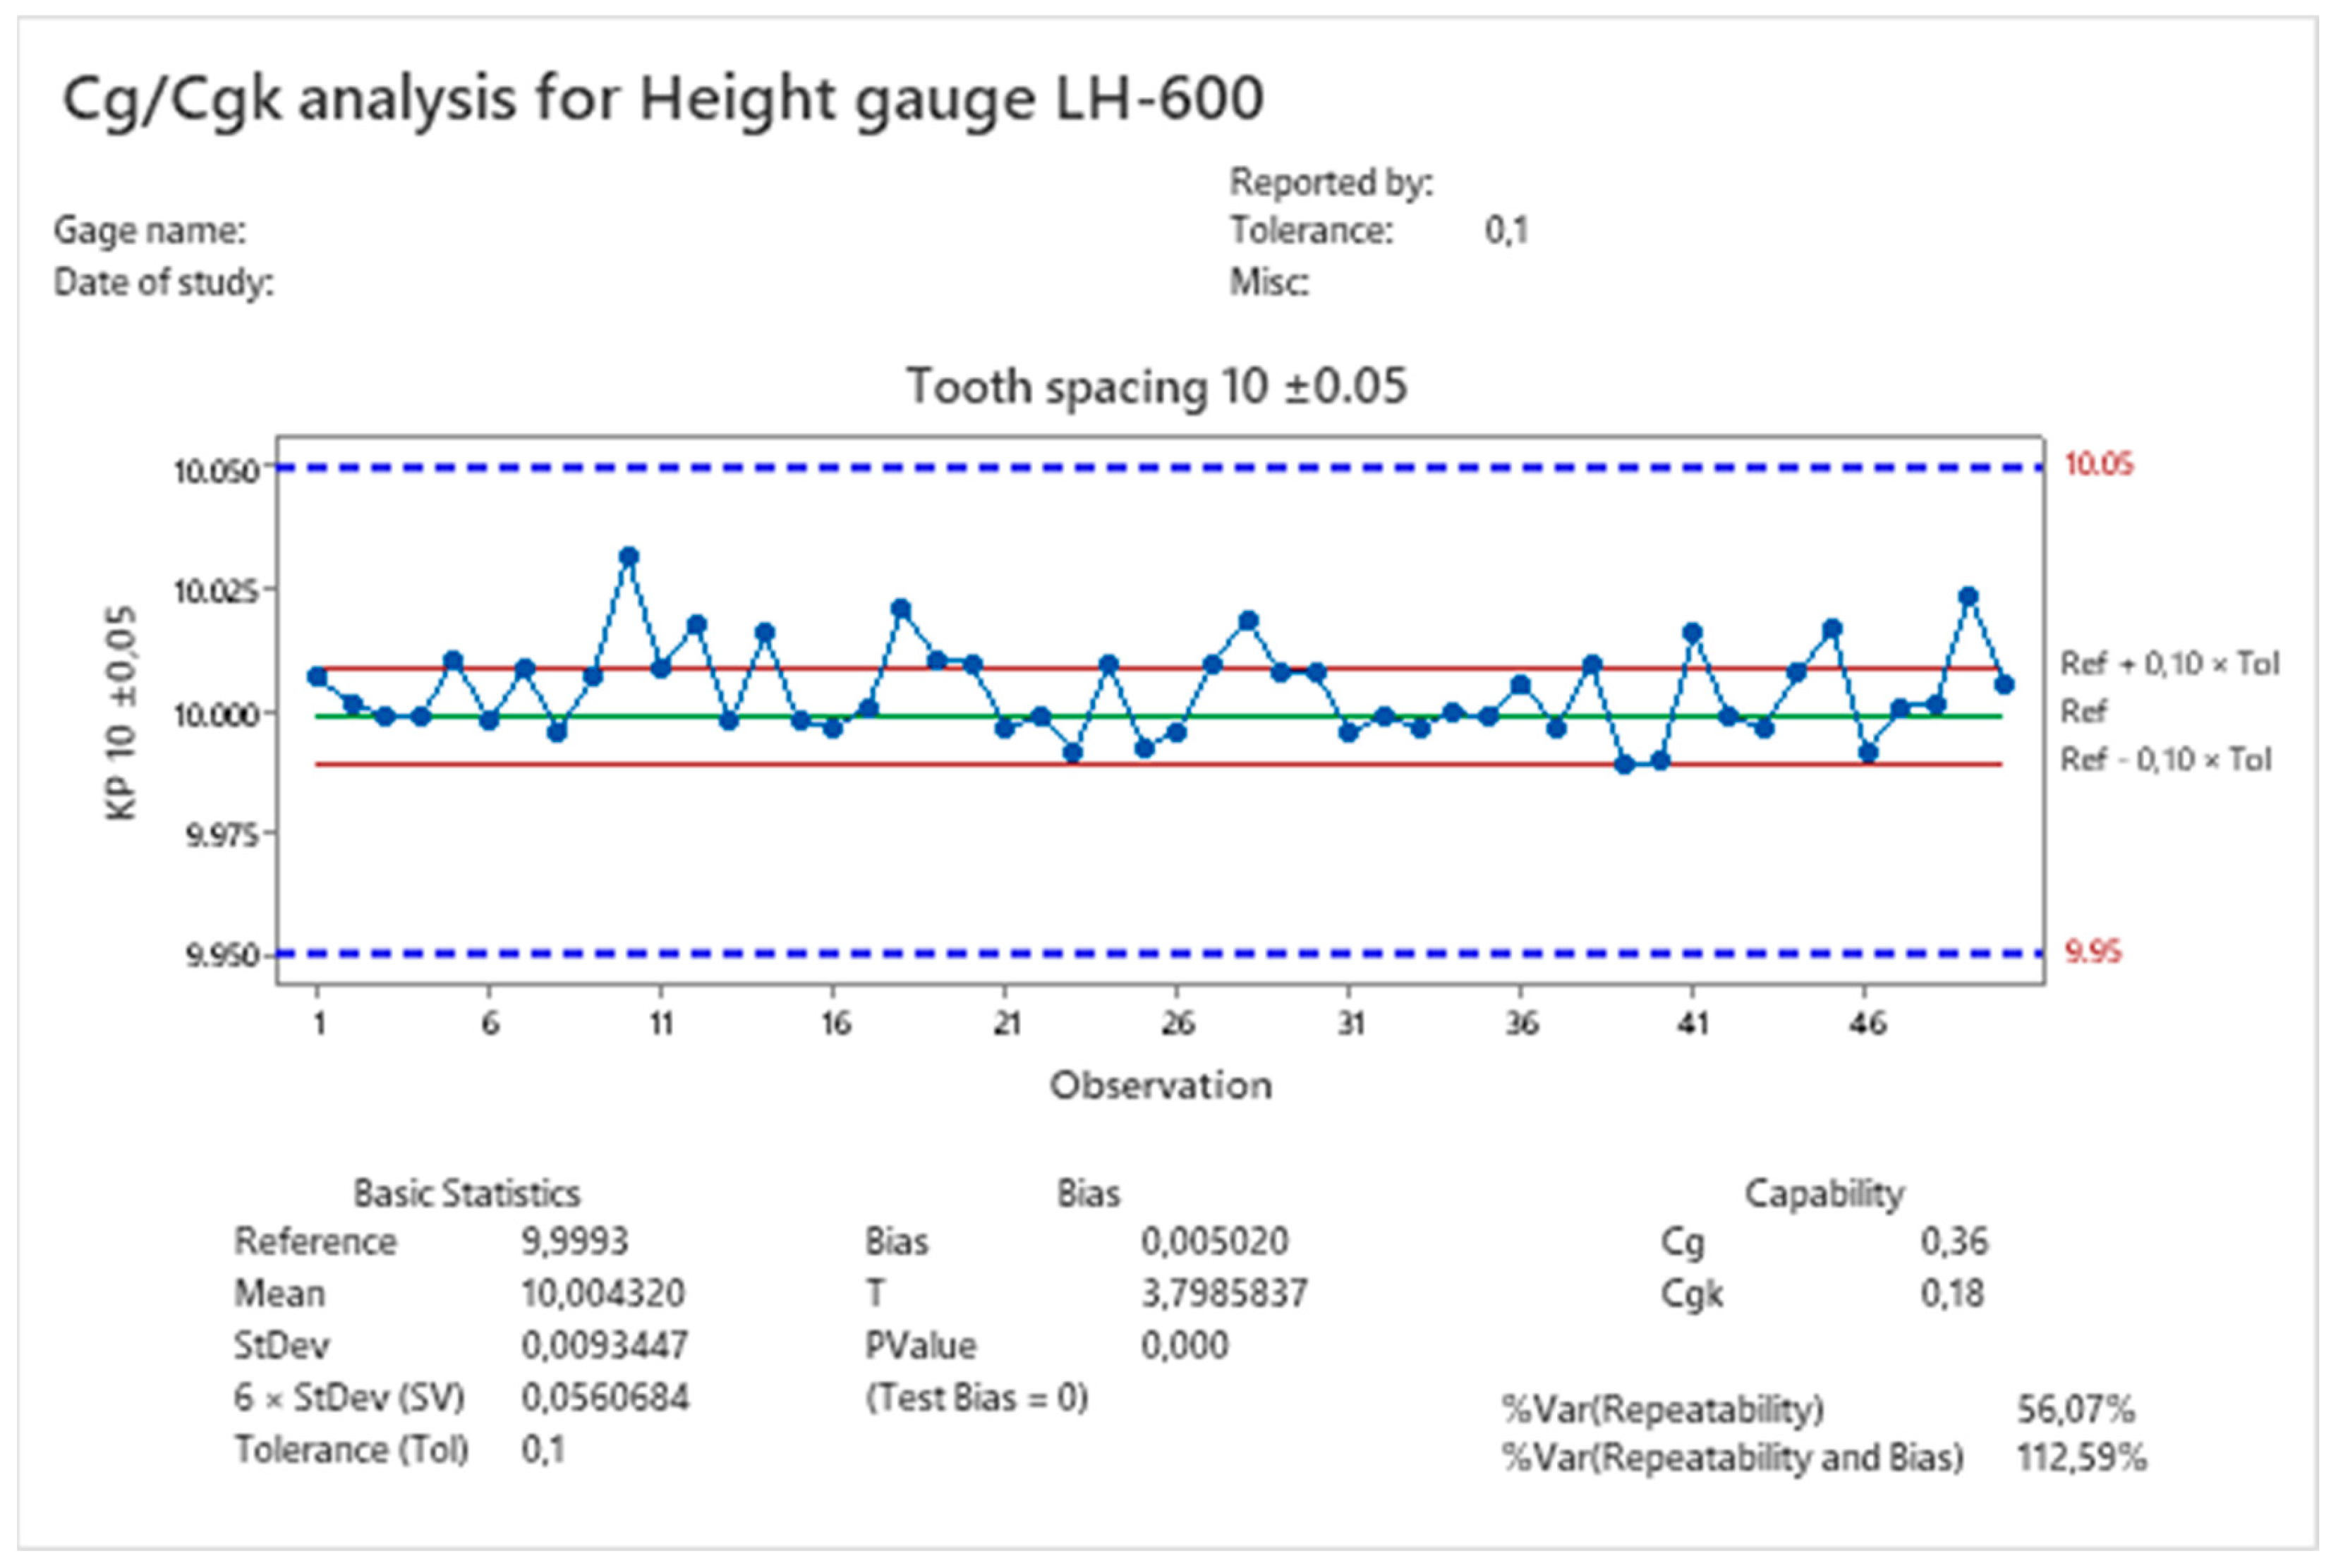
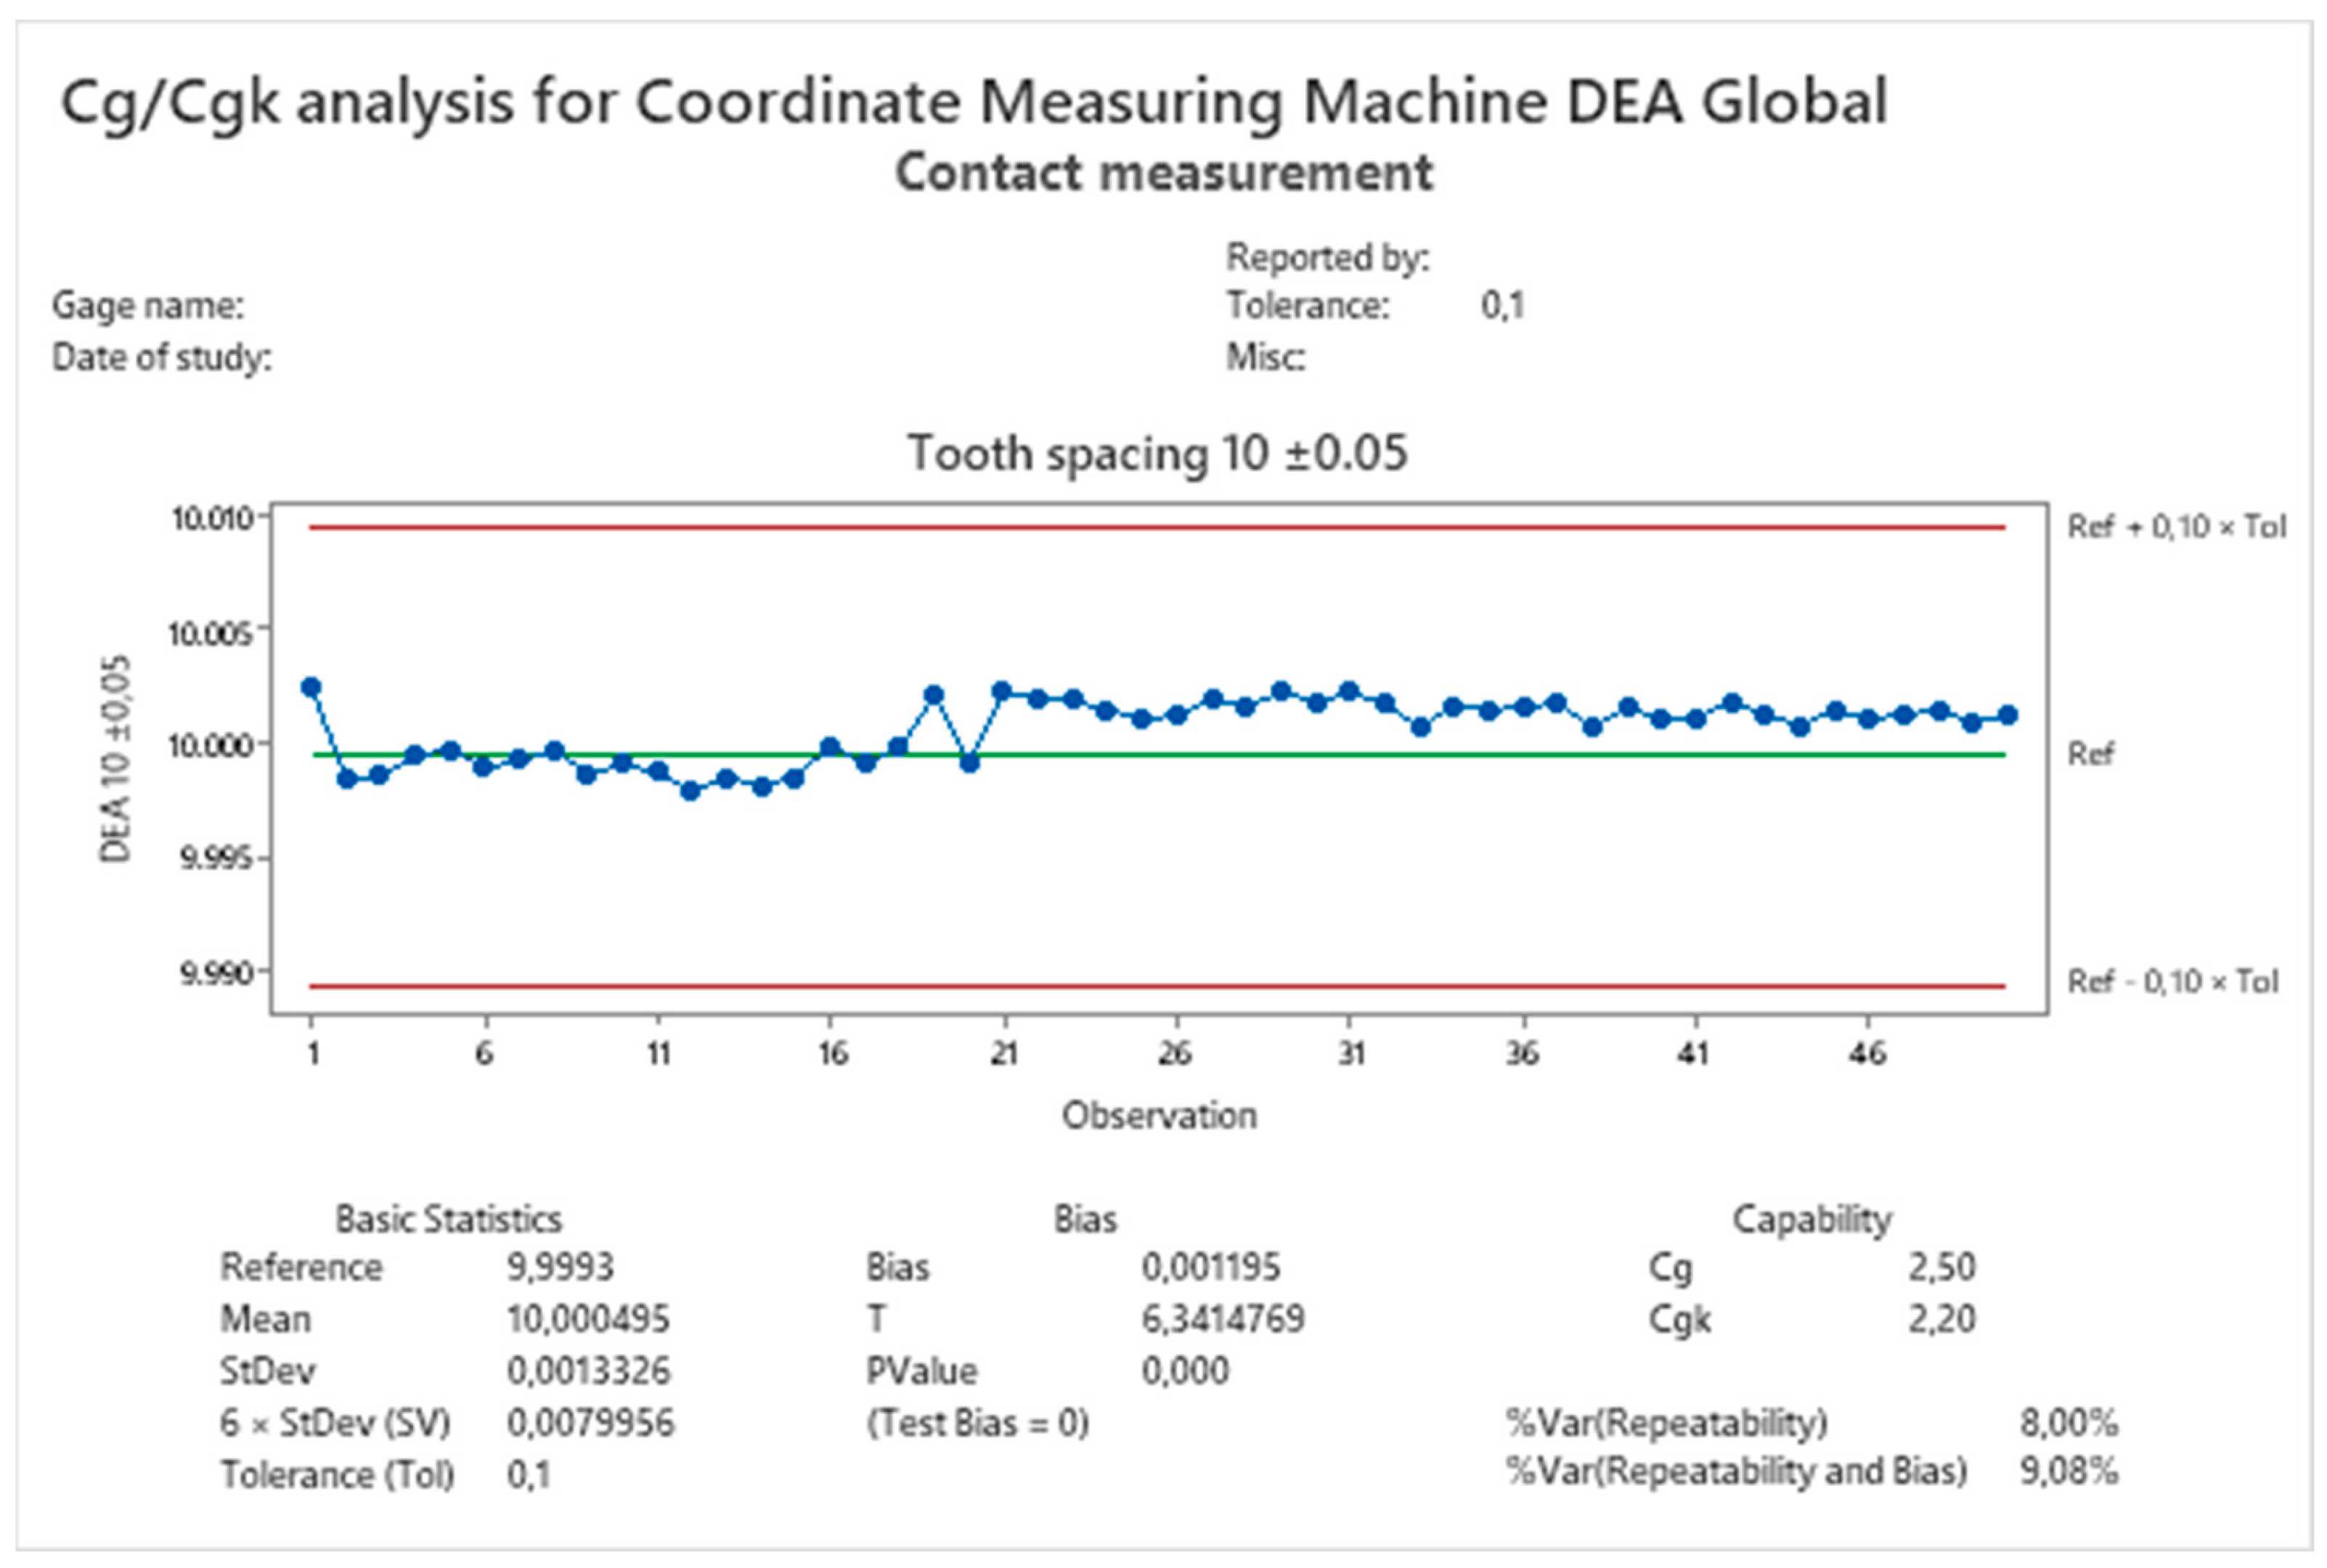
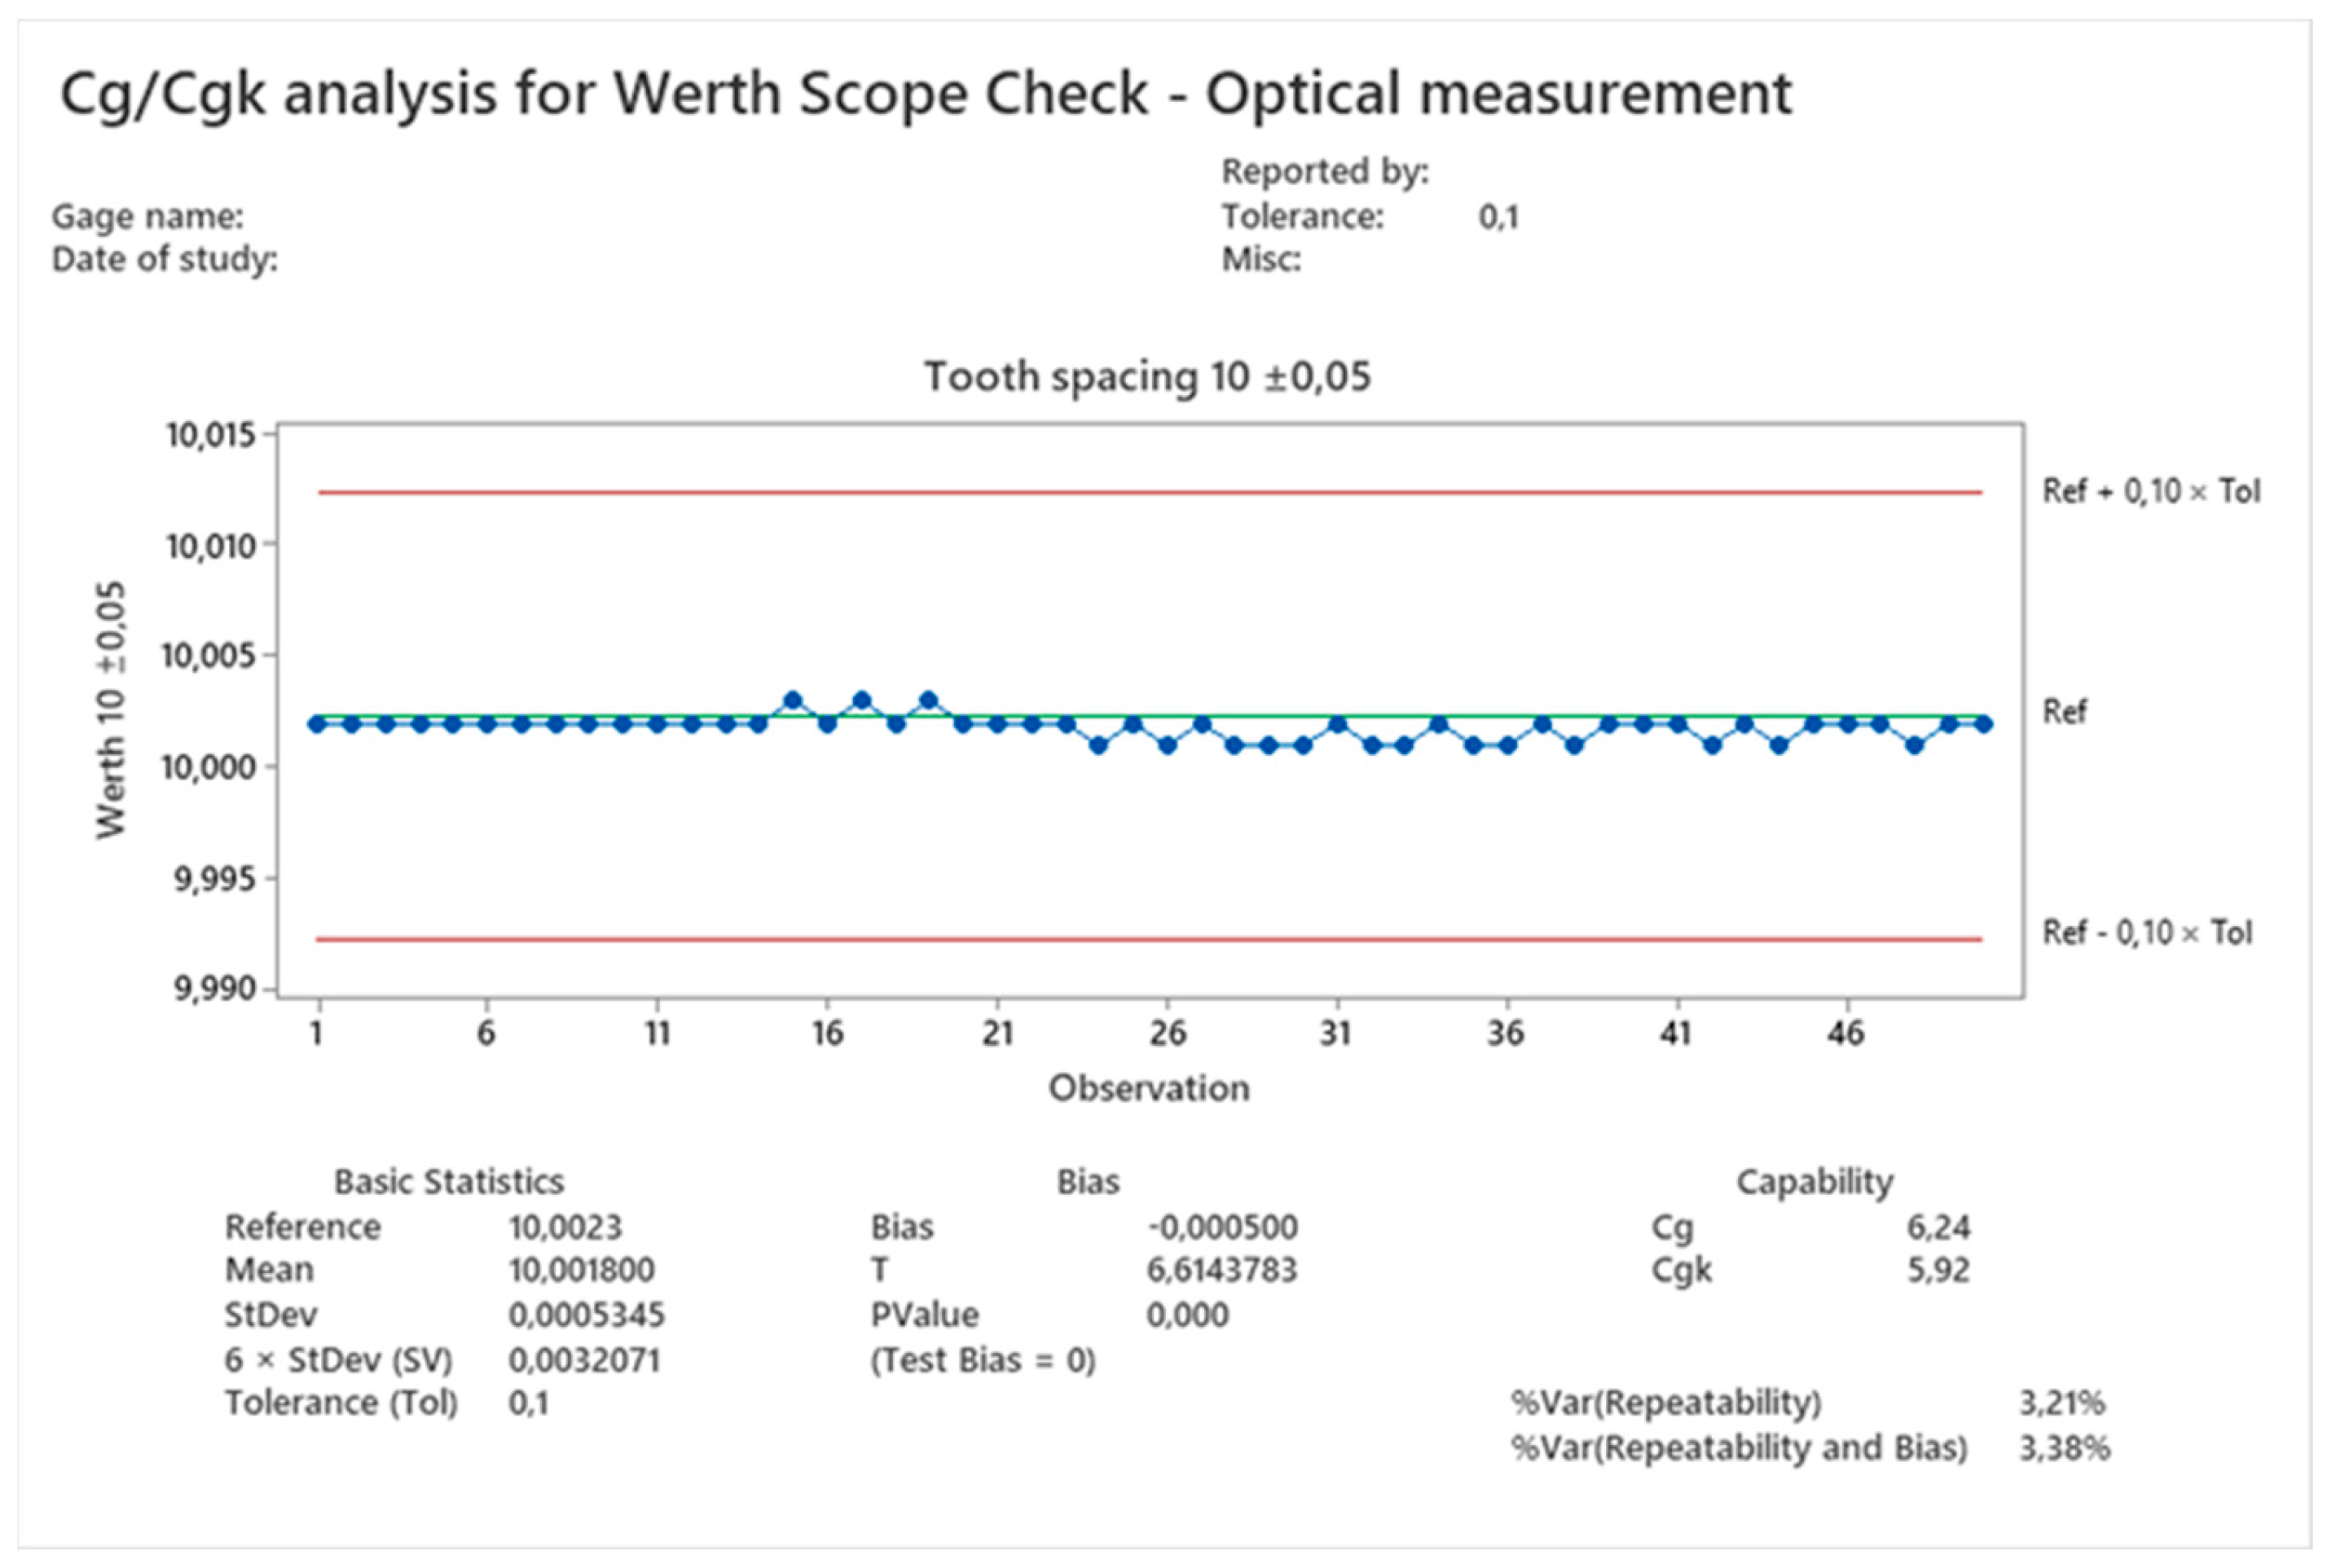
The next step was to check the repeatability of the measurements with the available equipment and to determine the Cg/Cgk ratio. The ratio was supposed to confirm the correctness of choosing the specific type of measuring equipment used. In addition, the repeatability analysis was intended to help to create a ranking of the measuring equipment used and facilitate the interpretation of the results (
Figure 17). To determine the capability index of the measuring equipment, the parameter teeth spacing 10 ± 0.05 mm was selected. As mentioned earlier, the standard values of the tested parameters were determined in the laboratory and were obtained for the contact measurement Xwz = 9.9993 ± 0.0006 mm and for the optical measurement Xwz = 10.0023 ± 0.0006 mm. These values have been referenced in Minitab as reference values. Thus, three more charts were obtained. They show, respectively, the results for the measurement with the LH-600 height gauge—
Figure 18, the results for the measurements with the DEA Global Coordinate Measuring Machine—
Figure 19, and the results obtained with the Werth Scope Check Multisensory Measuring Machine—
Figure 20.
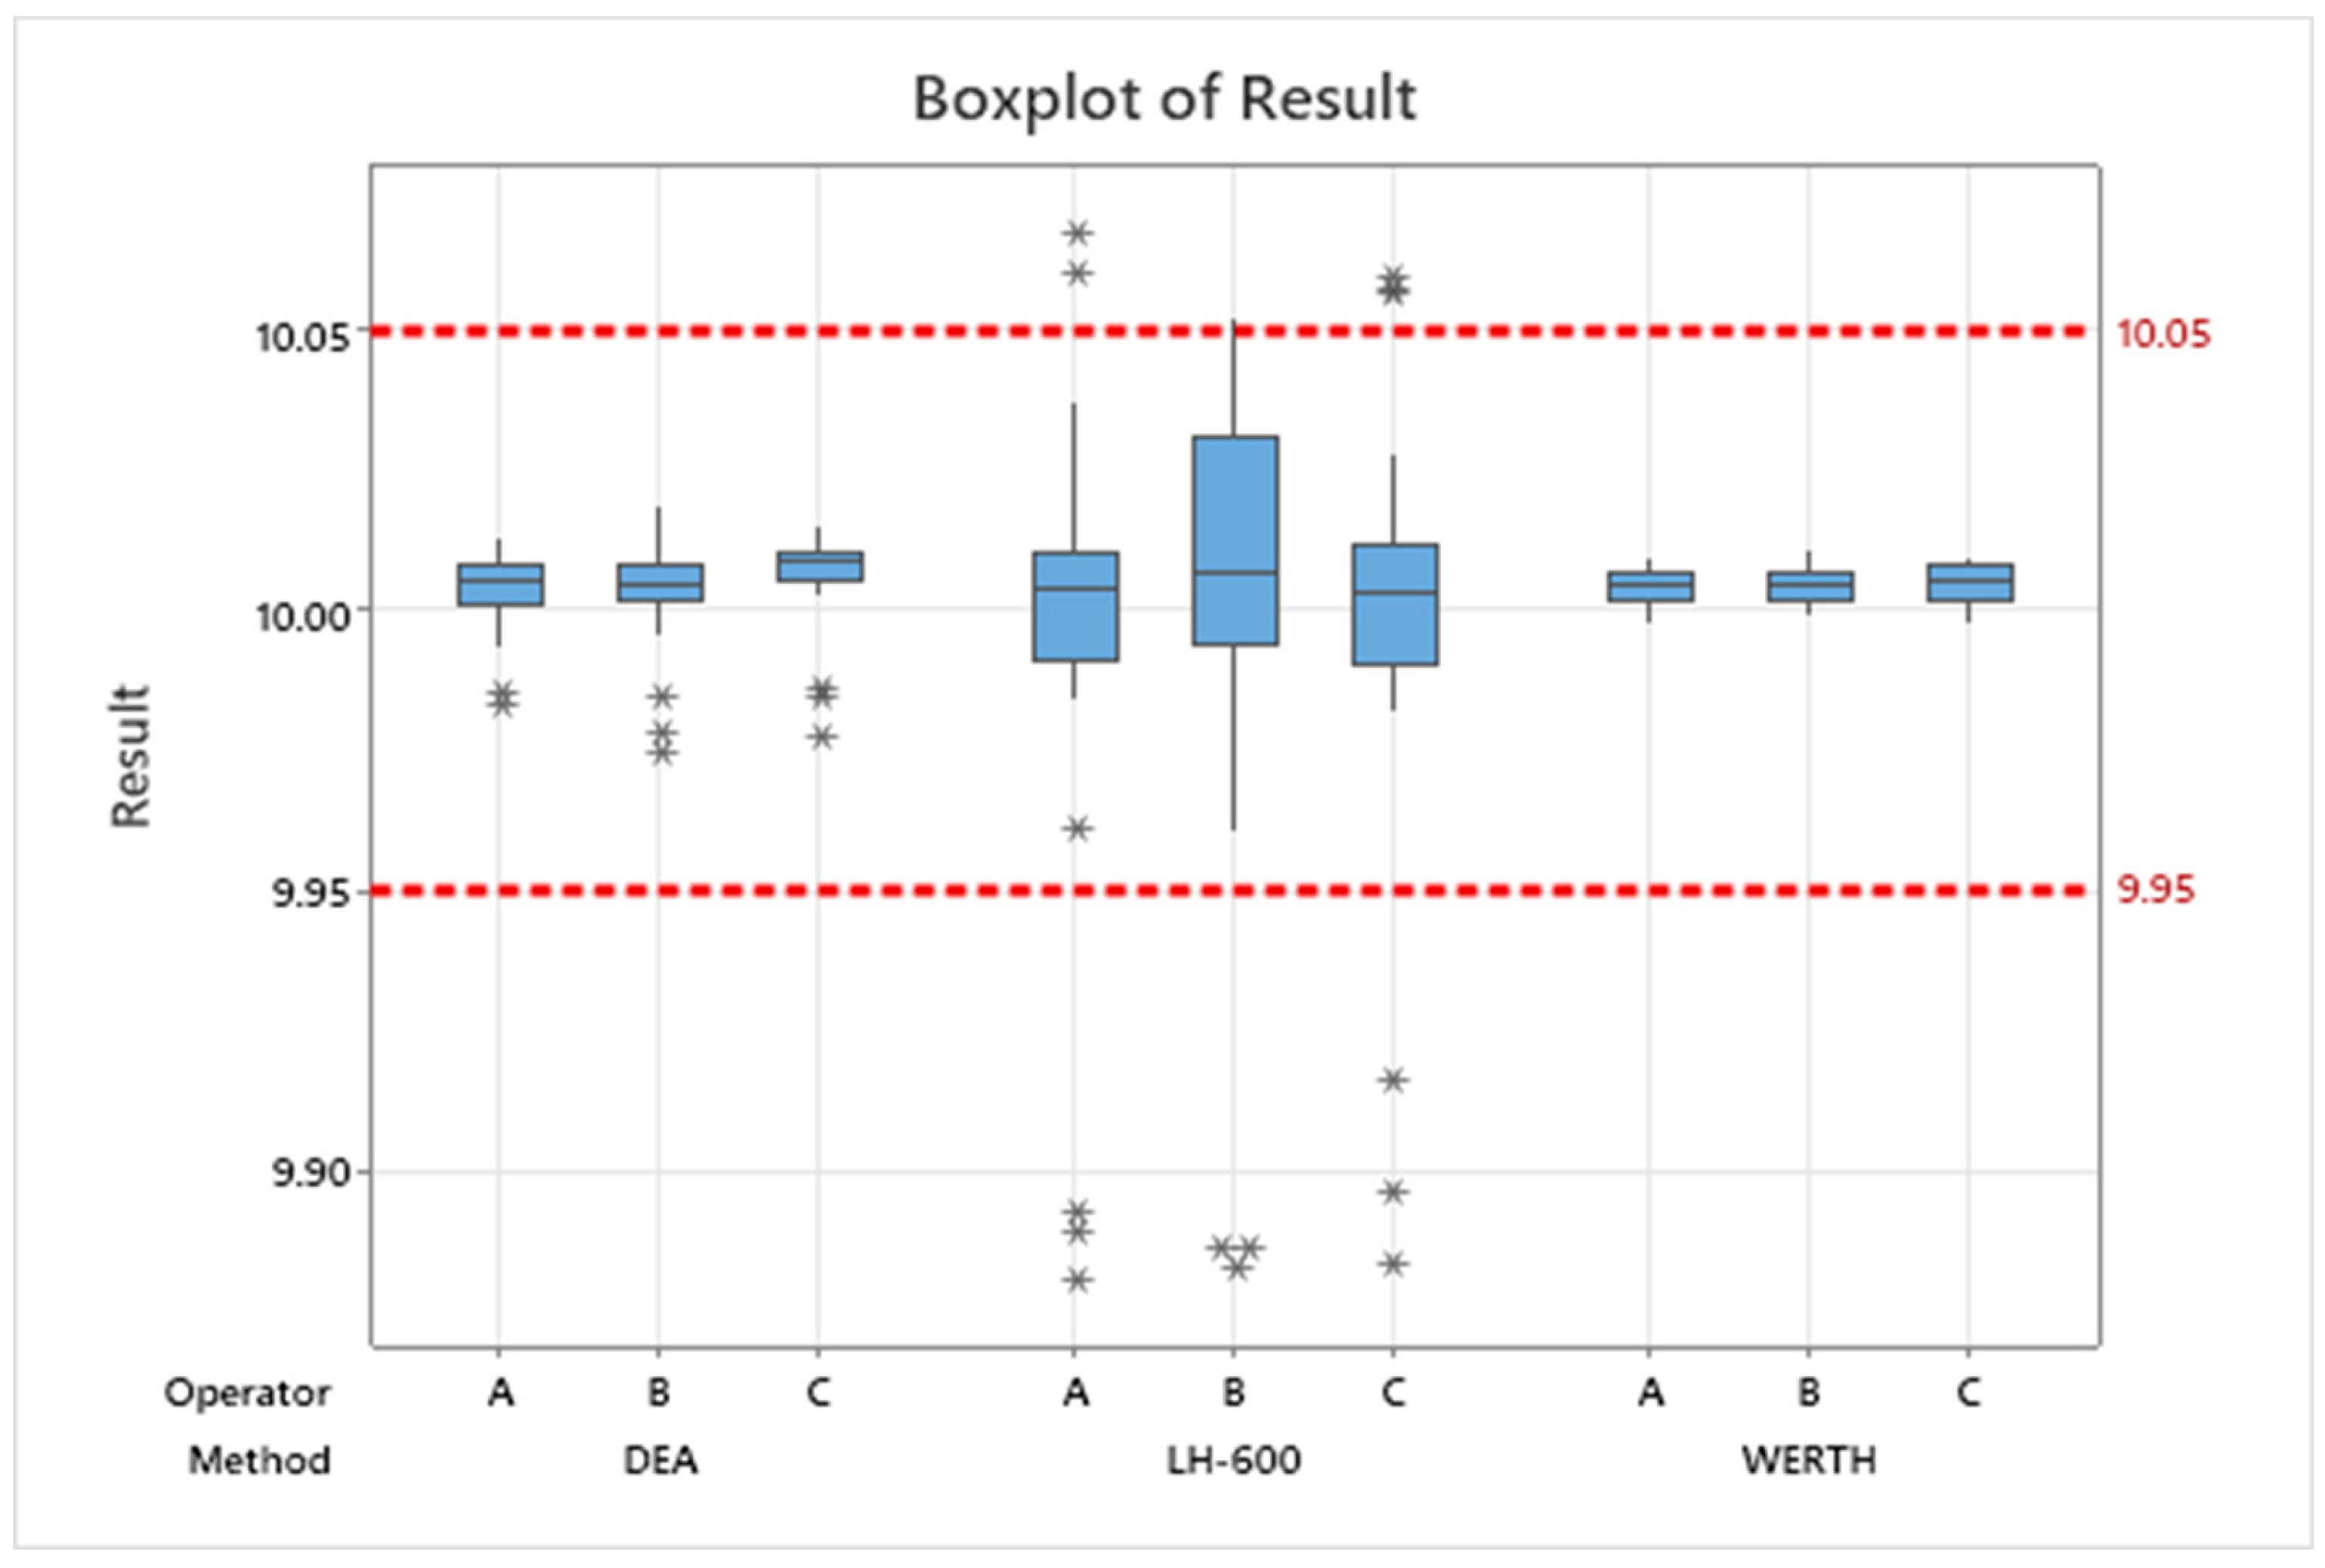
The obtained values of the Cg/Cgk ratios caused, and even forced, the necessity to present all the results on one graph in order to be able to compare all three measurement systems and three operators. The boxplot diagram in
Figure 21 shows all three measuring systems and the results for the characteristic tooth pitch of 10 ± 0.05 mm. This confirms the assumption that the weakest system is the LH-600 linear height gauge; the results discrepancy of this system is out of specification. In addition, this confirms the ability of the other two systems, i.e., CMM machines, both in the contact and optical measurement mode, to carry out measurements.
4. Discussion
Before the research, it was assumed that similar MPE values for all the measurement systems used should give similar values of the results. As experience has shown, it is completely different.
As shown by the prepared analysis, the results for three different systems are divergent. Differences in the measurement results always occur and it is a natural phenomenon accompanied by the aforementioned variability. We are not always able to monitor this variability, as it largely depends on the resolution of the measurement system. Before beginning the research, such differences in measurements for the tested detail were expected, nevertheless, the differences obtained during the research exceeded the expectations of the authors. While the results from the machines can be compared with each other, the results obtained from the measurements with the use of the height gauge are definitely far from the expected. Reference values for the tested characteristics have been determined in an accredited laboratory for two types of measurements: for contact measurement and optical measurement because it is impossible to relate the results of contact measurements to the results of optical measurements. The values obtained with the same sensor should be compared. Any other comparison may raise additional doubts. As shown by the analysis carried out in the Minitab program, the results obtained from the measurements differ from the standard values, as evidenced by the Cgk index. For the comparison of the systems, the values of the Cg/Cgk index were determined, which confirms in the general classification that the weakest system is the height gauge. The height gauge MPE is not worse than the MPE declared by the machine manufacturer. So what should be done in this situation? Which system is the best, which guarantees the lowest uncertainty while ensuring fast measurement of specific characteristics, and what influence does the operator have on the measurement results? An additional question arises, namely, what strategy should be chosen when measuring with a multisensor machine? Should it be a static or dynamic measurement? What are the differences between these measurements? Can the distance between the holes and their diameters be measured optically, and other characteristics by contact, using the multisensor machine, or should the characteristics be divided into several different available measuring systems? Finally, after the experiment, is it possible to compare the measurement with the contact sensor with the measurement obtained with the optical sensor? We will try to answer these and other questions during further research, but at this point the focus was on the evaluation and comparison of the described measurement systems.
5. Conclusions
As can be seen from the graphs, each characteristic has a different dispersion and position in relation to the tolerance field. This is especially true for the results of the height gauge measurements and the characteristics of the phase shift of the teeth (
Figure 14).
The question is, could the measurement be influenced by the method of mounting the workpiece? Of course it can, however changing the position of the measured part is not possible due to the fact that in the case of an optical machine, there is no possibility to change the angular position of the quill. In addition, the authors wanted to compare the results for the XY plane for both 3D machines. The linear height gauge is a kind of protection in case the measurement with a CMM is not possible. As the obtained results raise doubts as to the capability of the measurement system, Minitab determined Cg/Cgk values to verify that the system meets the repeatability requirements. For this experiment, the characteristic teeth spacing was selected. Therefore, for the height gauge, the graph and Cg/Cgk indices were obtained, which are shown in
Figure 17. For the DEA Global Coordinate Measuring Machine, the results are shown in
Figure 19, and for the Werth Scope Check Multisensor Measuring Machine, the results and graphic interpretation are presented in
Figure 20.
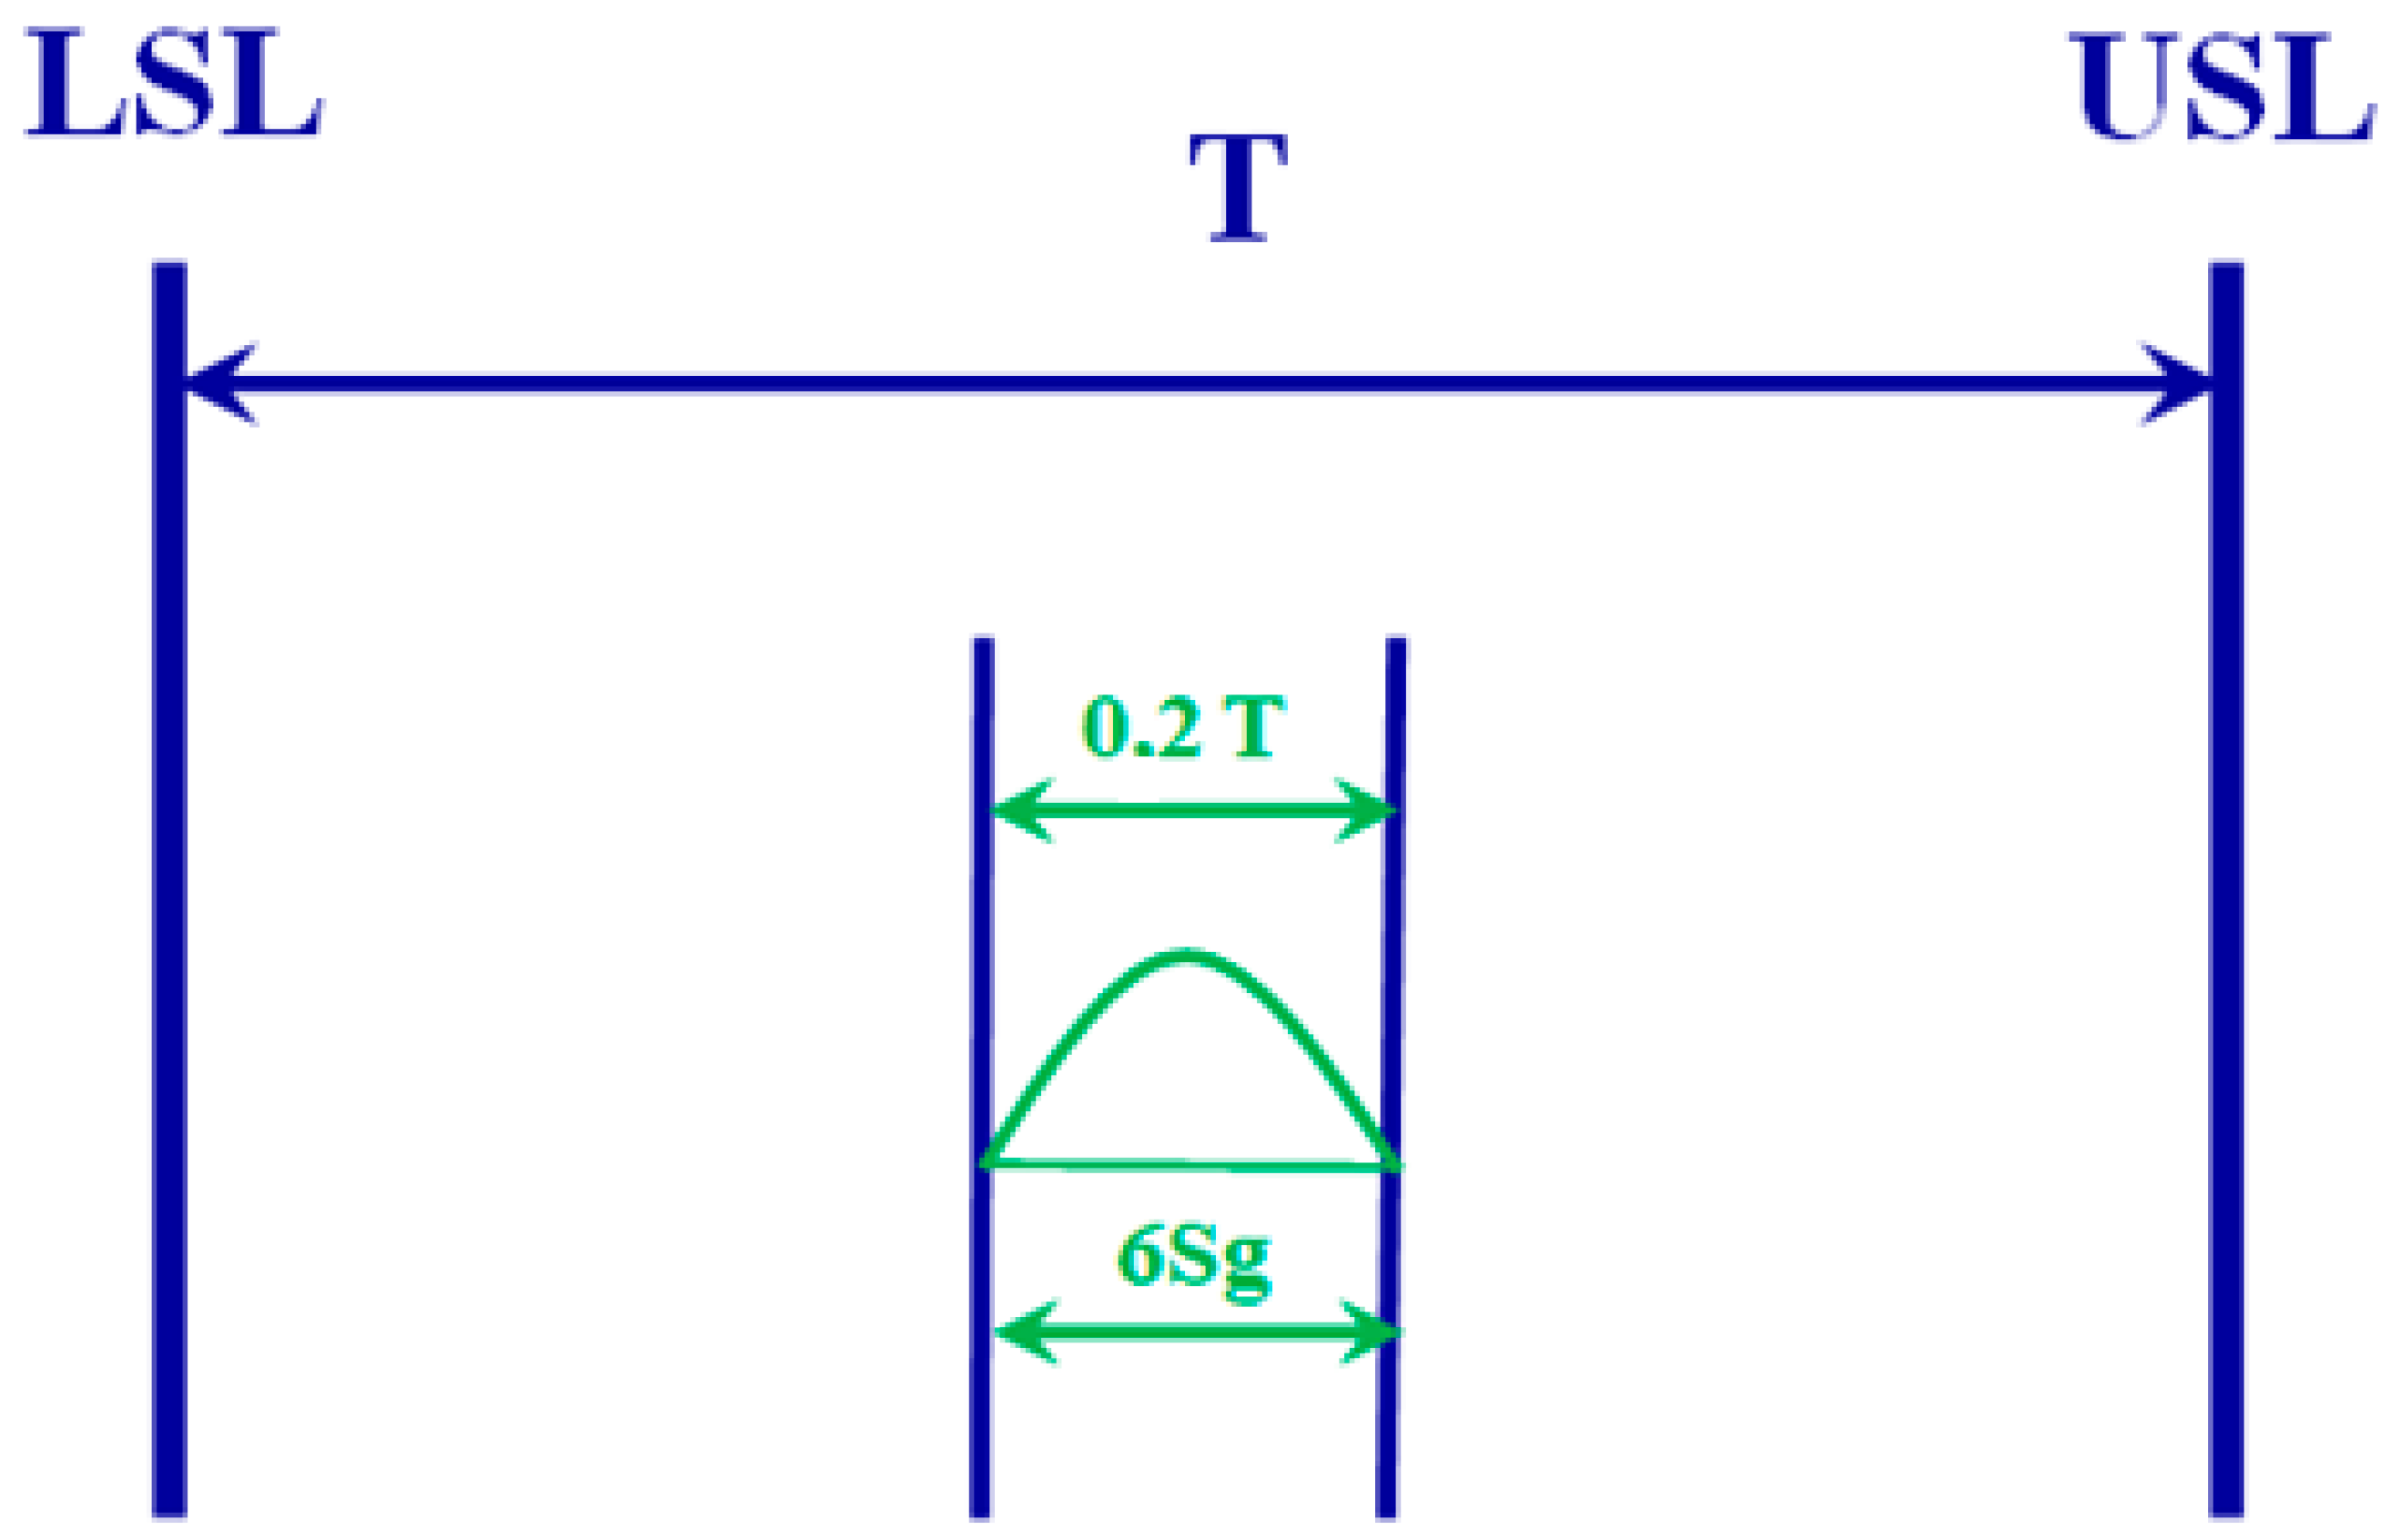
The results shown in
Figure 17 are out of the specification. For the measurement system to be acceptable, the discrepancy of the results should be within 20% of the available tolerance field. This is required by Procedure I according to the MSA handbook, i.e., Cg, Cgk analysis. The Cg index determines the concentration of the results, and the Cgk index determines the position in relation to the tolerance. The measuring equipment can be used for measurements if the scatter of the results is within 0.2 T. The results went beyond the red lines that define this 0.2 T. The blue lines are the true tolerance lines, which in this case have a value of ±0.05.
Comparing MPE (maximum permissible error) for the height gauge with MPE for machines, it can be initially stated that the systems should generate similar values obtained from the measurements. The trial has shown that it is completely different. Where do these discrepancies come from? Measuring with the height gauge is done in a completely different way than measuring with the 3D machine. The main difference is that using the measuring machine a coordinate system (alignment) is built, which is recalled each time and provides repeatability. When measuring with the height gauge, a detail has to be mounted each time, and each mounting does not guarantee repeatability. Another factor is undoubtedly measuring in different planes. On the CMM, the workpiece is placed in the XY plane, while when measuring with the height gauge the workpiece is fixed in the ZX plane. Another important factor can be the temperature gradient. The recorded temperature during the measurement was 21 ± 0.3 °C, but there was a variation in time and this aspect should certainly be taken into account and analyzed more extensively.
After taking the measurements and performing the analysis, it can be stated with certainty that the operator’s influence (AV—appraiser variation) is crucial in the analysis carried out with the use of the height gauge. In the CMM measurement, the measuring points were defined. Both the DEA Global Coordinate Measuring Machine with a contact sensor and the Multisensor Measuring Machine with an optical sensor always collect points in nearly the same place. In the case of the LH-600 height gauge, the location of the measuring points depends on factors such as a perpendicular application of the stylus to the measured element, scanning speed, etc. In machines, these issues are not dependent on the operator.
We believe that the discussed topic brings novelty to employees who use various types of equipment available in industry, which are used to qualify products. The main criterion for selecting equipment for the measured feature is MPE, which should be from 1/5 to 1/10 of the tolerance field. Based on tolerances, engineers quickly and without hesitation choose the type of equipment that meets this requirement. Therefore, for the analyzed case, for the tolerance, the LH-600 height gauge was selected, which meets the criterion. As the experiences carried out by engineers with many years of experience in the industry have shown, this road is not good because the measurement results are significantly influenced by the uncertainty, which is unfavorable for the height gauge compared with the CMMs. If engineers could estimate the uncertainty without measuring it would certainly be a benefit. Unfortunately, this is not possible. The components of uncertainty from the operator require knowledge of statistics, adopting appropriate distributions, and the ability to estimate the uncertainty budget, and for that one measurement results are required. As experience has shown, relying on MPE alone does not guarantee reliable results.
As for the results, the authors think they could have been predicted to some extent. When comparing CMMs versus height gauge, any good practitioner will choose CMMs without hesitation; however, such big differences were not expected. So what if MPE for the height gauge is better than for the machine, since MPE for the height gauge is defined only in one axis, namely, the Z axis. Machines have MPE given for the spatial system, i.e., for the X, Y, and Z axes. The use of an height gauge determines its ease of use and greater availability than the CMM. Results for simple measurements are obtained much faster, and the waiting time for measurements made with CMM causes a loss of time needed to release the first good piece. That is why the height gauge is so popular with industry workers. This aspect has a large impact on the performance of machines, which translates into the finances of the organization.
On the basis of the data collected from the conducted research, further analyses are planned, which will include preparing complete MSA analysis with 10 units measured three times by three operators. In addition, assessment of the impact of the AV, PV, and EV factors’ variability, searching for an appropriate measurement strategy, and using the possibilities of equipment to maintain consistency between contact and optical measurements will also be carried out. Checking the consistency of results obtained using different measurement techniques of the same quantity using VIM criterion or Altman’s criterion is also planned.


