1. Introduction
Anode effect prediction is one of the research focuses in the production of modern aluminum electrolysis industry. Anode effect is a special phenomenon in the production process of aluminum electrolysis. If the anode effect occurs in one or some anodes, the voltage and anode current density on these anodes will rise sharply in a short time, resulting in a decrease in the current efficiency and a shortened life of the aluminum electrolytic cell. In addition, the anode effect will produce two kinds of perfluorocarbon gases, CF
4 and C
2F
6, with strong greenhouse effect, which have a global warming potential 6630 and 11,100 times higher than that of CO
2 [
1]. Therefore, the earlier detection of anode effect for reducing its number has important theoretical value and practical significance.
In the last few years, the research on anode effect mostly focused on the prediction of global anode effect, due to the small scale of aluminum electrolytic cell. The current detecting methods for the occurrence of anode effect is to monitor the changes of cell voltage and cell resistance. Until now, the direct prediction of anode effect is not realized in industrial production [
2]. In literature [
3], a model was proposed to extract the fault signatures of anode effect based on the combination of digital filter and local mean decomposition, which lays the foundation for anode effect prediction. Zhou et al. [
4] used generalized regression neural network to identify and simulate the cell voltage before and after the anode effect of aluminum electrolytic cell. After training and verifying the model with field data samples, the occurrence of anode effect can be predicted online about half an hour in advance. Yang et al. [
5] proposed a robust dictionary learning method, which improved the fault detection rate of anode effect and reduced the false alarm rate. In literature [
6], a nonlinear process anode effect monitoring method was proposed based on Kernel dictionary learning algorithm. Chen et al. [
7] proposed a data fusion algorithm based on collaborative prediction model to predict the global anode effect by using the similarity search principle. Yin et al. [
8] excavated the key feature information of the anode effect by constructing a stacked denoising autoencoder, and sorted the key features by the random forest algorithm to solve the problem of uneven sample distribution in the prediction of the anode effect. At the same time, the Long Short-Term Memory (LSTM) neural network was used to predict the global anode effect. The above research was aimed at the prediction of global anode effect. Due to the violent reaction when the global anode effect occurs, a large number of bubbles overflow, and the slot controller alarms, which is convenient for observation and recording. At present, the study of global anode effect based on data-driven has been relatively mature, and the prediction point of global anode effect can be advanced to about 20 min. Neural network, machine learning, and other methods are used to predict the occurrence of anode effect, which is feasible and accurate.
With the development of computer technology and the improvement of the production process of aluminum electrolytic cell, the aluminum electrolytic cell is gradually developing towards large scale [
9], which leads to the difficulty of controlling the production of aluminum electrolysis. In addition, because of the increasing scale of the cell, the key parameters of the aluminum electrolytic cell are unevenly distributed, and the local anode effect happened frequently. The occurrence of local anode effect often precedes the global anode effect. The effective prediction of local anode effect is conducive to preventing the occurrence of global effect. Therefore, with the development of large-scale electrolytic cell, the prediction of local anode effect has gradually become the focus of research. Ding et al. [
10] proposed the distribution of alumina concentration in the feeding process based on the finite element mechanism analysis, however the finite element algorithm takes a long time to calculate. So it will take a long time to get the training data, and it is not feasible to predict the anode effect. Wong et al. [
11] obtained the influence of fluoride bubbles on the cell voltage by simulating the equivalent circuit of aluminum electrolytic cell, and then predicted the occurrence of local anode effect. By analyzing the distributed anode current, Håkon [
12] divided the anode effect into conventional anode effect and low-voltage anode effect according to the cell voltage setting threshold of 8 V. The detection of low-voltage anode effect is analyzed by monitoring the non-uniformity of the current distribution of the anode rod, which proves the feasibility of the distributed anode rod current to predict the anode effect. Aiming at the problem of uneven alumina concentration distribution in large-scale aluminum reduction cells, Zhang et al. [
13] proposed the idea of uniform alumina concentration control based on single point feeding and combined with the effect prediction system based on anode current distribution, which greatly reduces the probability of anode effect in the in aluminum reduction cells. By analyzing the power spectrum of the distributed anode rod current, Cui et al. [
14] divided the aluminum reduction cell into areas, and determined the occurrence of local anode effect by setting the current fluctuation threshold. Yang et al. [
15] developed a low-voltage anode effect prediction method based on the periodic average current deviation ratio by averaging the distributed anode current in time windows, and proposed a multi-point feeding strategy based on the probability distribution of low-voltage anode effects.
Due to the complex on-site environment of high temperature, high magnetism and multi-field coupling in the aluminum electrolysis industry and the complex physicochemical process reaction in the cell, it is difficult to achieve online real-time measurement of alumina concentration, the core parameter that reacts to local anodic effect. While distributed current, as an important parameter affecting the occurrence of anode effect, can be collected in real time. By tracking and predicting the fluctuation of anode current data, the occurrence time and intensity of local anode effect can be effectively predicted, so as to prevent the occurrence of global effect through reasonable and effective measures.
This paper proposes a prediction method of local anode effect of aluminum reduction cell based on distributed current fluctuation detection. Firstly, through the analysis of the aluminum electrolysis production process, a current fluctuation detection method based on the density of the time sliding window is designed to detect the fluctuation of anode current. Secondly, according to the difference of current fluctuation, the anode current in the area is classified and predicted. The Gated Recurrent Unit-Long Short-Term Memory (GRU-LSTM) hybrid neural network is used to track and predict the anode rod current with fluctuation, and the Autoregressive Integrated Moving Average (ARIMA) algorithm is used to track and predict the anode rod current without fluctuation. The occurrence time and intensity of local anode effect are given by combining these two algorithms. Finally, the local anode effect prediction simulation experiment is carried out based on the actual industrial aluminum plant data.
Innovations: (1) The local anode effect is predicted, and the fuzzification level classification of the local anode effect prediction is proposed. (2) A current volatility detection method based on time-sliding window density is designed to classify and track the prediction of anode current in the region according to the current volatility.
3. Anode Rod Sequence Fluctuation Detection Algorithm Based on Sliding Window
The current 400 kA aluminum electrolytic cell has six feeding points evenly distributed over the space, and each port has the greatest impact on the nearest surrounding area. In order to reduce the time and computational effort in the process of tracking and predicting the distributed anode current sequence, the 400 kA aluminum electrolytic cell is divided into six areas according to the feeding point, as shown in
Figure 2. Each area contains four anode rods on the A side and four on the B side. The current sequence of each area is divided into several window current segments through the sliding window [
19], and the current of each sliding window is analyzed to monitor the current fluctuation.
3.1. Sliding Window Current Series Segmentation
First, current sequence data was segmented by sliding window, and set the current sequence as:
where,
is current data of the acquisition point at each time, and
t1 −
tn represents the time. In the current sequence, a fixed length sliding window
is used for sliding segmentation of the current sequence. The principle is shown in
Figure 3. The window moves backward one step length
for each sliding, and slides
times to form
subsequences.
Assuming one of the subsequences is
, the slope between any two adjacent data points in the subsequences can be calculated according to Formula (2):
In this time window , there are slopes of adjacent current data. is the average of the current slope of the time window, while is the average of the current data within the time window. The window length , the average slope value , and the average value c form an array . Then, the current sequence sliding window data is analyzed, and its fluctuation is determined by the standard deviation and the change in the slope of the window data.
3.2. Fluctuation Monitoring of Current Sequence
To better monitor the fluctuation of the current sequence, the classification monitoring is performed by setting the distance radius threshold of the slope confidence interval to determine whether the time series produces fluctuations, and let the distance radius
of the slope confidence interval of the
-th sub-time window current sequence
be:
where,
is the upper confidence limit;
is the lower confidence limit.
is the mean slope of the current sequence of the
-th sub-time window;
is the mean square deviation of the current sequence slope of the
-th sub-time window;
is the standard normal distribution;
is the confidence level, which is used to improve or reduce the sensitivity of the confidence interval.
After obtaining its confidence interval radius, the fluctuation threshold is set to β according to the historical current fluctuation. If , the current sequence of sub-time window is judged to fluctuate, and the serial number of the fluctuating sub-time window is output.
In order to further improve the detection rate, the density difference between the array matrix
and ten adjacent sliding windows (select the first five and the last five of the current windows) is compared. If there are more densities similar to this current sequence, the smaller the probability of its generation fluctuations. The array density of sliding windows and the distance between different sliding windows are somewhat correlated. For example, the time window object
and
define its distance as:
Then the fluctuation monitoring algorithm process is:
STEP1: Select ten sliding windows;
STEP2: For the sliding window, the attainable density
is calculated according to Equation (7):
where,
is the number of sub time series in the neighborhood of the
-th distance of sub window object
(expressed as
, where
is calculated by Formula (8)),
is the set of sub-time window objects in the neighborhood of the
k-th distance of sub-time window object
X, and
is an element of it. The
-th distance neighborhood is defined as the set of objects whose distance between the selected sample space and object
is less than or equal to
.
is the maximum value of the
-th distance of sub-time window
and the distance between sub-time window object
and sub-time window object
.
STEP3: Calculate the ratio
of the mean value of reachable density of the ten neighboring sub-time-window objects
to the local reachable density of object
as shown in Formula (8):
STEP4: The calculated results are compared with 1. The closer the reachable density ratio is to 1, the closer the density is, the more stable the current sequence remains; and the greater the calculation result is than 1, the greater the difference between it and the mean of the attainable density of the time window of the nearest neighbor, and the stronger the fluctuation of the current sequence. The current fluctuation intensity can be determined by the parameter .
STEP5: Through the comprehensive results of the comparison between the distance radius of the slope confidence interval of the current sequence of the sub-time window and the threshold value and the density comparison between the array matrix and the adjacent ten sliding windows (select the first five and the last five of the current windows), it is shown whether current fluctuations occur and the their intensity of current fluctuations.
4. Prediction of Local Anode Effect Based on Analysis of Anode Guide Current Fluctuation
The above method is used to detect the anode current fluctuation in different areas of the aluminum electrolytic cell. If current fluctuation is detected in an anode rod of the electrolytic cell, the current of eight anode rods in the current fluctuation area is tracked and predicted. The anode rods in this area are divided into two groups, non-fluctuation anode rods and fluctuation anode rods, according to the current fluctuation detection results. The ARIMA model is used to track and predict the current of non-fluctuation anode rods in this area, GRU-LSTM hybrid neural network is used to track and predict the current of fluctuating anode rods, and the predicted value
at the moment of anode effect is determined from the current tracking results of fluctuation anode rods, and the local anode effect level is determined according to the number of changes from non-fluctuation anode rods to fluctuation anode rods and violently fluctuating guides predicted by the ARIMA model within
. The flow diagram of local anode effect prediction based on fluctuating anode current detection is shown in
Figure 4.
STEP1: The current sequence data of eight anode rods in one of areas is obtained by dividing the areas according to the electrolytic cell structure. The current sequence is divided by a sliding window. The current sequence fluctuation detection algorithm is used to detect its fluctuation and locate the anode rod where the current fluctuation occurs.
STEP2: For the fluctuation detection results in STEP1, the GRU-LSTM hybrid neural network is used to track and predict the current of the fluctuating anode rod in this area, and the predicted value of the strong fluctuation current determines the strong fluctuation occurrence time (fluctuating anode rod → strong fluctuating anode rod); the AMIRA model is used to track and predict the current of the non-fluctuating anode rod in this area. According to the prediction results, the number of the anode rod changing from non-fluctuating to fluctuating and strong fluctuating in time is determined.
STEP3: The time in STEP2 is taken as the prediction value of the time when the anode effect occurs, and the local anode effect level is divided according to the number of new fluctuation anode rods and strong fluctuation anode rods.
4.1. Prediction of Fluctuating Anode Current Based on GRU-LSTM Hybrid Neural Network
In order to predict the current of the fluctuating anode rod, a new prediction method based on GRU-LSTM hybrid neural network model is proposed. The LSTM and Gated Recurrent Unit (GRU) networks have been widely used in the field of time series detection. They are suitable for tracking and predicting the fluctuating current series and can be used as the prediction model of the fluctuating anode rod current.
The LSTM is a variant of Recurrent Neural Network (RNN) [
20] that adds long-term data memory units to the network structure, while setting the gate function to determine the amount of memory and forgetting of historical information. The gated neuron structure is shown in
Figure 5. When the neuron is at time
,
is the output of the previous neuron, and
is the input of the neuron at time
. And
is the output of the neuron. Three gate states are included to determine the memory and forgetting of information.
4.1.1. Forget Gate
The forget gate is used to discard the unimportant information in the neuron, and its function realization process is:
The neuron output
at the
t − 1 time and the current time input
are input into the
sigmoid function, and the activation function will output the weight value (0–1). The output value (0–1) indicates that the state information of the previous neuron has been forgotten to the extent of memory. And 0 means abandoned and 1 means reserved. The output of the forget gate is as shown in Equation (9):
where,
is the weight value of the forget gate,
represents the threshold value of the forget gate,
is the
activation function, and
is the vector matrix of the neuron state and time at the previous moment.
4.1.2. Memory Gate
will also be used as input while entering the calculation of the forget gate. The neuron state information at time
is calculated through the
activation function, and the information to be updated is obtained by Hadamard product of the neuron state at moment
with
. As shown in Equation (10) and Equation (11),
and
respectively represent the weight of the memory gate, and
,
respectively represent the bias of different states of the memory gate.
GRU is a member of the Recurrent Neural Networks (RNN) family. Compared with LSTM, GRU can also solve the problem of gradient saturation in the memory and back propagation of historical data, which are common in RNN. However, due to its simplified structure, the neuron parameters are much less than LSTM, and only a gated unit is used to perform the operation of forgetting and selective memory of historical data. The structure of gated neuron is shown in
Figure 6.
The output of GRU reset data gate and GRU update gate are as follows:
where,
is the output of GRU reset data gate;
is the weight matrix of reset gate;
,
xt constitute the vector of the neuron hidden layer and the data input layer, which is continuously updated with the input;
is the bias matrix;
is the output of GRU update gate;
is the weight matrix of the update gate. It is calculated by
function to narrow the output values to (0–1).
where,
is the neuronal state at time
;
is the weight update matrix of neuronal state;
is Hadamard product;
is the bias matrix of neuronal state; the neuronal state is limited to (−1,1) by hyperbolic tangent function.
where,
is calculated by Equation (14). As can be seen from the above formula, the output of the update gate strictly controls the retention or not of the information flow of the previous state in the neuron, with
varying between (0–1) [
21], to ensure that the control output is the ratio of the state of the unit at the previous moment to the unit input being input, to achieve the memory of important information, forgetting the inputs that have less impact on the neuron unit, and to constantly update the parameter architecture of the neuron hidden layer.
Since the training time of LSTM network is slightly longer, in order to improve the training speed of neural network and realize online current tracking, the advantages of LSTM and GRU networks are combined, and LSTM and GRU are combined by full link to form a current prediction model to achieve fast current tracking and high accuracy at the same time. The occurrence point of strong fluctuation of anode current can be determined in advance by current tracking, which can be used as the prediction value of the occurrence time of anode effect.
It is defined that the strong fluctuation current value of anode current is equal to or greater than 1.5 times of the average value of 20 current sampling values before the fluctuation [
22]:
where:
is the time point when strong current fluctuation is detected, and
is the strong current fluctuation value;
It is the current sampling value.
According to (16) the current data before the time point when the strong fluctuation current of the anode is detected in advance is input into the GRU-LSTM hybrid neural network for training and learning. The GRU-LSTM hybrid neural network after training is used to track and predict the anode rod that has fluctuated, and the value of strong fluctuation current and the time of strong fluctuation are obtained as the predicted value of the time when the anode effect occurs.
4.2. Tracking Prediction of Non-Fluctuating Anode Current Based on ARIMA Model
The local anode effect occurs 5–15 min before the current fluctuation of one or several guide rods. But under the working condition that the local alumina concentration of the contact part between the anode rod and the electrolyte decreases (according to expert experience [
16], when the aluminum concentration is lower than
, the electrolyte balance will be broken, and the anode effect is early to occur), it takes some time to spread to other nearby anode rods. So tracking the current changes of other anode rods in the same area that have not yet fluctuated will provide an important reference for anode effect prediction.
The differential ARIMA model is an algorithm for forecasting short-term, medium, and long-term time series information [
23].
model is essentially a combination of difference operation and
model. The basic process is as follows: first, the obtained time series data are checked for stationarity, and then the non-stationary time series data is converted into the stationary time series data by the
-difference operation; then, the order of stationary time series data are determined and the parameters are estimated to obtain the values of
,
; finally,
model is used to predict the time series.
Considering the algorithm computation, operability, real-time and other factors, if the anode rod current is detected to fluctuate, the ARIMA model is used to track and predict the current of the anode guide rods that do not fluctuate in the area where the anode rods are located. First, the stationary data is obtained by performing d-difference operation on the obtained time series current; after that, the is fitted to a fixed order to determine the and parameters; then, the ARMA model is used to track the current sequence of the anode rod without fluctuation and output the current prediction value for a certain time in the future. If the error between the current prediction value and the actual current is greater than the set threshold value, it is considered that the current of the anode rod tracked has fluctuated; finally, the local anode effect level is determined according to the number of non-fluctuating anode rods changing into fluctuating anode rods in this area.
The ARMA model of the original anode rod current after stationarity treatment is as follows:
where,
is the original anode rod current signal;
,
is the order of ARMA model, which is determined by the autocorrelation coefficient and partial correlation function of the sequence;
,
are the model coefficient;
is the mean square error of the current sequence.
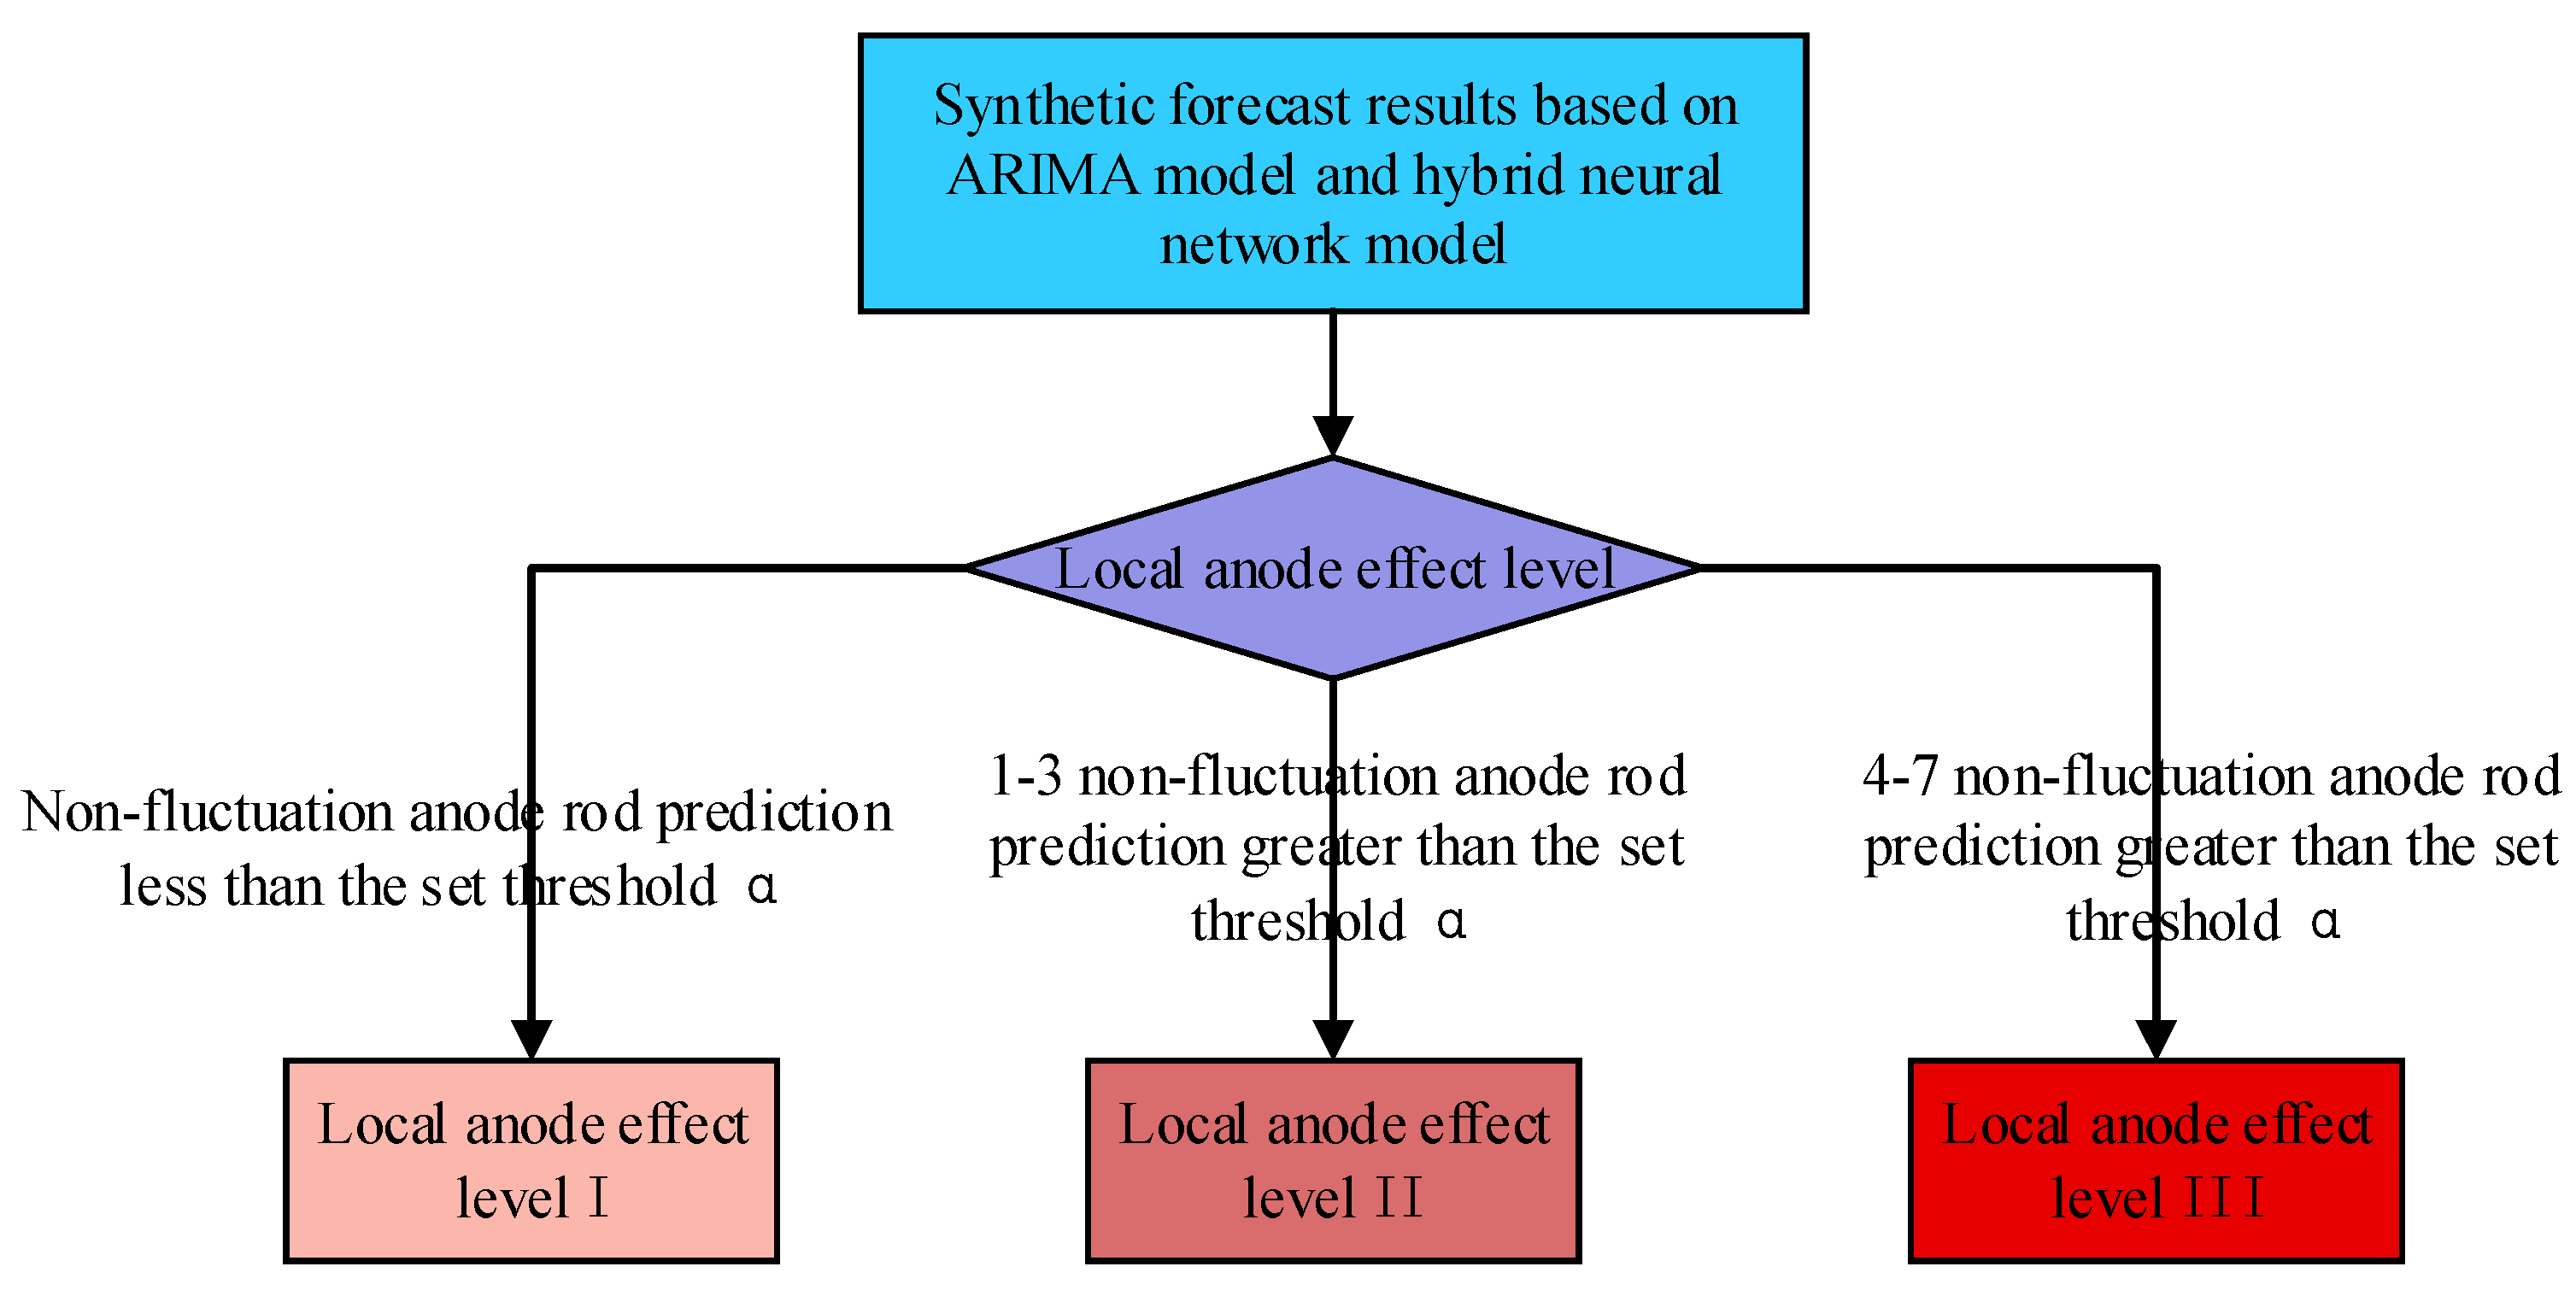
4.3. Local Anode Effect Level Strategy
According to the current prediction results of the non-fluctuated anode rods by (17) and the current prediction results of the fluctuated anode rods by the GRU-LSTM hybrid neural network, the prediction results of the local anode effect are jointly determined. At the same time, in order to reduce the false alarm rate, the local anode effect level is fuzzified and divided into three levels: I, II and III, which respectively represent that:
I: the current prediction value of fluctuating anode rod is greater than the set threshold, and the predicted value of non-fluctuating anode rod current is less than the set threshold ;
II: The predicted value of the current of the fluctuating anode rod is greater than the set threshold, and the predicted value of the current of 1–3 non-fluctuating anode rods in the area is greater than the set threshold ;
III: The predicted value of the current of the fluctuating anode rod is greater than the set threshold, and the predicted value of the current of the 4–7 non-fluctuating anode rods in the area is greater than the set threshold
. It is shown in
Figure 7.

 ,
, 


