1. Introduction
String insulators in transmission towers that operate in highly polluted areas require special handling. If this is not provided, it is possible that a flashover contamination that causes a phase to short circuit to ground could occur on the polluted insulator string. Furthermore, losses will arise, along with the discontinuity of electrical power transmission from the power plants to substations that are connected with many electrical loads.
Insulator cleaning is one of the effective flashover mitigations against contamination [
1]. However, the implementation of cleaning on the insulator strings installed in the power transmission tower cannot be carried out anytime, as strict licensing is required. In addition, the preparation of personnel and equipment is needed to meet proper cleaning requirements [
2]. Effective guidance is needed to determine the cleaning schedule for insulator strings.
In principle, the flashover mechanism due to contamination is a slow process [
3]. Polluted insulator strings in a humid or drizzly environment (non-cleaning wetting) usually experience the partial discharge phenomenon first. More severe partial discharge will develop into a partial arc. If the partial arc has extended from the energized terminal to the grounded terminal, a flashover will occur.
One indication of pre-breakdown phenomena, such as partial discharge and partial arc, is ultraviolet (UV) light [
4]. Researchers conducted experimental studies in the laboratory to understand the characteristics of UV emission on insulators captured using an UV camera. Research [
5] had found that the quantitative data generated by UV images were not only affected by the distance between the UV camera and the tested insulator, but also by the UV camera settings selected. There were two types of quantitative data, namely, the UV count which was shown in real time on the camera screen and UV pixels (facular area) extracted from the application of image processing on UV images (frames of video). It showed that the facular area was better able to represent the dependent relationship between distance, gain, and discharge intensity than UV count. The use of image processing to calculate the facular area was supported by other researchers [
6,
7,
8,
9,
10,
11].
Regarding the use of UV data as a reference for assessing the insulator condition level, the UV diameter as a severity level parameter for flashover condition was proposed in [
6]. However, the object under study was only a cup-and-pin insulator. In addition, the UV pixels gathered to form a circle-like pattern. Since the circle formed was not perfect, the accuracy of calculating the diameter was affected.
The development of UV emission on an insulator string in an artificial contamination test was investigated in [
7]. Because the insulator string was very long (the string consisted of dozens of cup-and-pin insulators), the UV camera was fixed steadily only at the cup-and-pin insulators close to the energized terminal. This way caused a measurement window consisting of several cup-and-pin insulators. The insulator string voltage was varied from safe condition to flashover condition. The results showed that the UV count was not completely linear with the increasing voltage. In this case, the values fluctuated with voltage, so a clear threshold value could not be drawn. This nonlinearity behavior was also found in [
12]. On the other hand, a very significant increase in the value of UV pixel (facular area) could be used as a reference that a partial arc had occurred.
With the very long dimension of insulator strings, it would be unfair if the observation was only made on a few cup-and-pin insulators close to the energized terminal. In this case, the partial discharge may spread not only to the cup-and-pin insulators close to the energized terminal, but also on other sides, such as the middle side of insulator string. Therefore, observing the condition of each cup-and-pin insulator should be considered.
This paper exhibits an approach to assess the condition of a 500 kV insulator string which included the UV camera settings, the recording method that allowed each cup-and-pin insulator to be observed, the digital image processing, and a simple classification model for insulator string condition level based on the quantitative data obtained automatically by inputting the UV video. A fair assessment was expected to be able to produce an effective reference in mitigating the contamination flashover on insulating equipment with a long dry arcing distance.
2. Materials and Methods
2.1. Laboratory Test
This test was designed to visually observe the UV development from the normal insulator string condition to flashover condition. The inspection was conducted on all sections of the insulator string from the energized terminal (subjected to voltage) to the grounded terminal. The insulator string condition level was then categorized based on the UV characteristics.
The test was conducted at the outdoor laboratory. The object tested was a suspension-type insulator string. It consisted of 10 porcelain cup-and-pin insulators with the non-uniform distribution of pollutants and wetness. The pollutant solution was made from a mixture of fly ash, salt, and demineralized water. After the artificial contamination process was carried out, the insulator string was naturally dried. When natural drizzle occurred, the test AC voltage was applied to the insulator string.
The UV data were recorded using a UViRCO CoroCAM 6D camera. This camera had sensors to capture visible and UV lights, so the output image was a combination of the two types of light. The zoom variable affected the field of view (FOV) of camera, whereas the gain variable influenced the amount of gain that was applied to the UV signal entering the camera. In this test, the zoom value was adjusted to 1× or 0.5×, while the gain value was kept at the default value (85%). A tripod was used to achieve smooth vertical camera movement. The distance between the camera and the insulator string was about 8 m.
A 400 kV alternating current (AC) high voltage testing equipment—Passoni Villa—was utilized to create line-to-ground voltage stress for the tested insulator string. The equipment had technical specifications as shown in
Table 1. The voltage regulation was performed by using a voltage regulator. The regulator was a double-wound transformer which had a second winding mounted on a conventional laminated core. A single phase reversible motor of the permanent capacitor type controlled the regulator.
The output terminal of the step-up transformer was connected to the pin of the lowest cup-and-pin insulator (number 1), while the grounding terminal was connected to the cup of the highest cup-and-pin insulator (number 10). The AC voltage stress was increased slowly at a constant speed until the flashover condition was reached. However, at a certain value, the voltage was held for about 2 min and the UV data was recorded from the energized terminal to the grounded terminal. After that, the test was continued with other AC voltage values.
2.2. Field Test
The UV emission measurement, either directly (based on UV count) or indirectly (based on facular area), was performed on the tension insulator strings installed at the 500 kV generator transformer (GT) area and the suspension and tension insulator strings installed at the 500 kV gas insulated substation (GIS), as shown in
Table 2. For further mention, the GT area was called the first substation, while the GIS substation was the second area. The suspension string consisted of 36 units of porcelain cup-and-pin insulator with a 1 × 36 configuration, while the tension string had 72 units of porcelain cup-and-pin insulator with a 2 × 36 configuration. There was a pair of corona rings on the energized terminal.
The camera used was the UViRCO CoroCAM 6D. The camera settings needed to be set as the camera parameters could affect the results. The camera settings were chosen as follows: UV gain = 85%, threshold = 40, integration period = 2 frames, integration gain = 50%, zoom 1× and 0.5×. The camera produced video in audio video interleave (AVI) format with a resolution of 768 × 576 and a frame rate of 25 frames per second. The camera was able to measure the discharge intensity which was represented by the UV count value. The UV count was displayed in real time on the camera screen [
13]. Another measurement method was the application of image processing to calculate the number of UV pixels contained in the image. These images (frames) were extracted from the video.
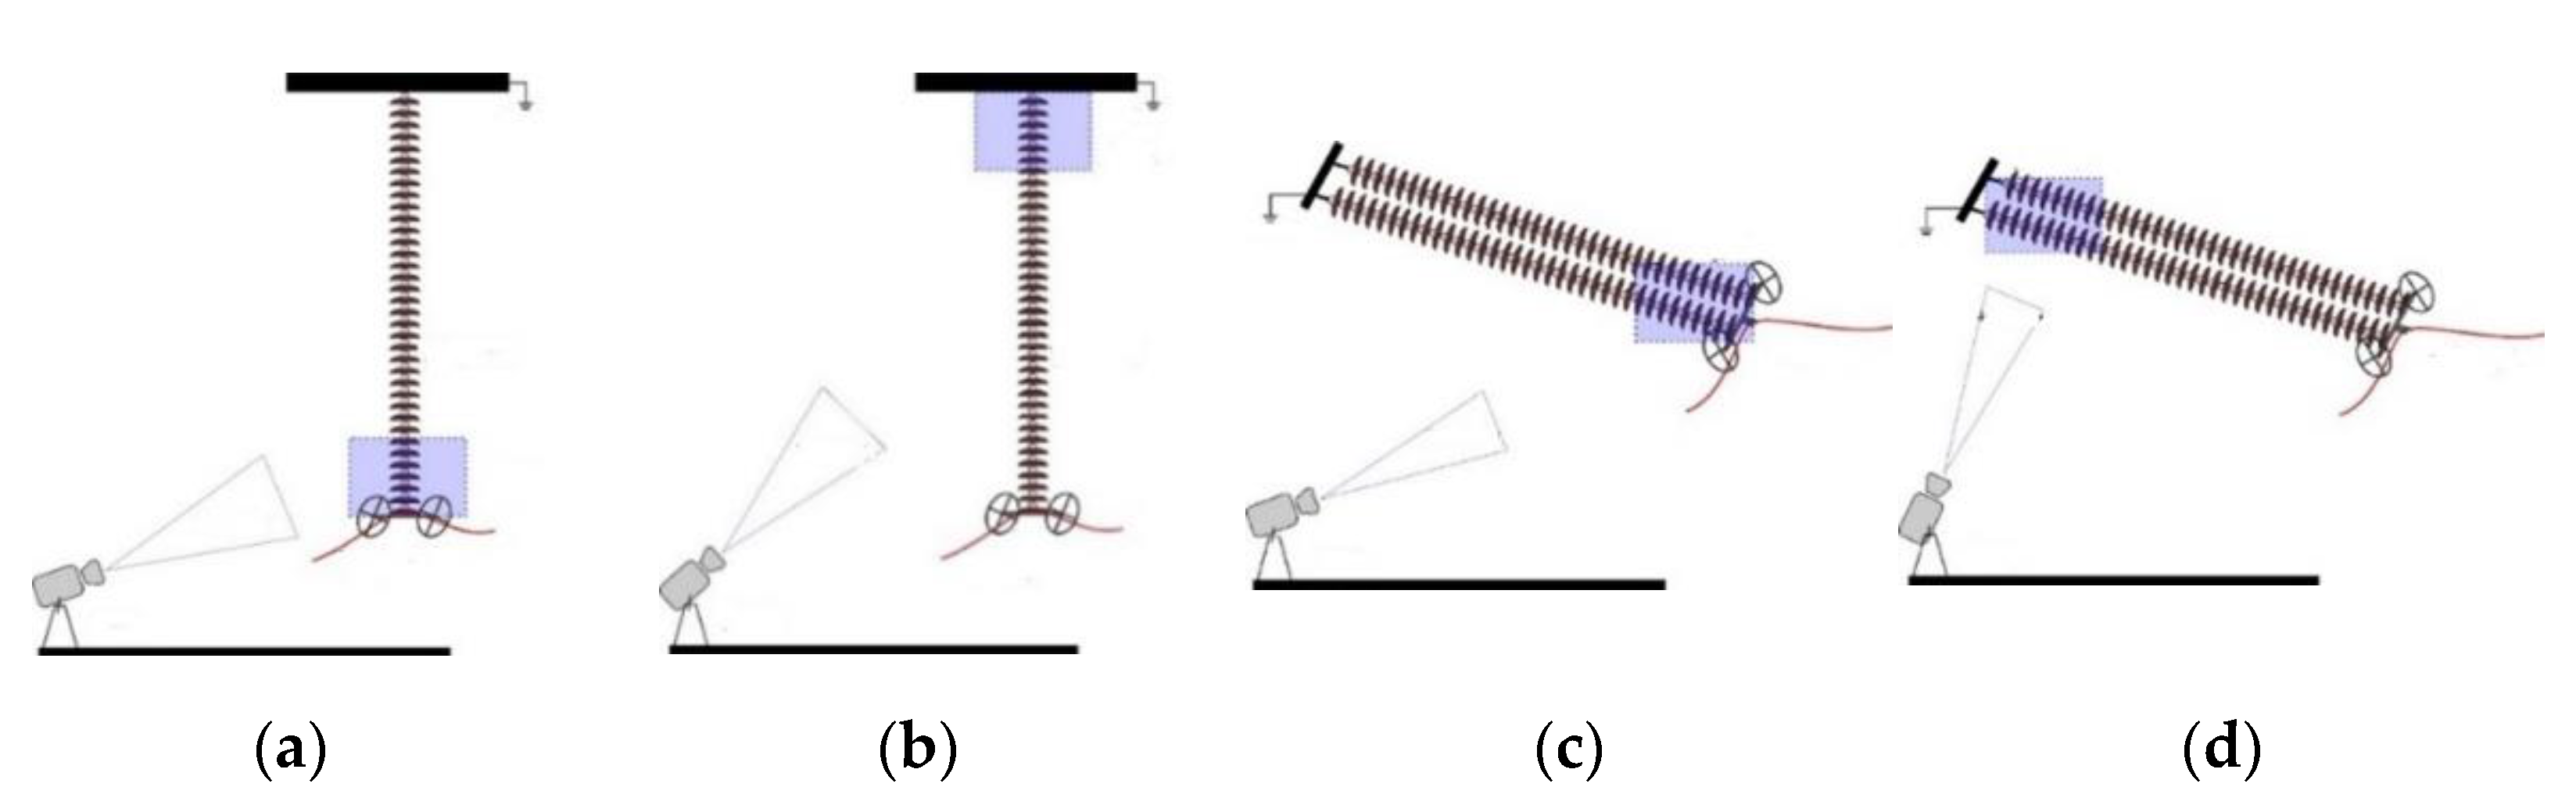
The entire section of string was recorded by moving the camera (using a tripod) from the energized terminal to the grounded terminal at a relatively constant speed, as illustrated in
Figure 1. The data was collected at night or early in the morning with a time span of 08.00 PM to 05.00 AM. During this time, the relative humidity was high (above 80%), so it was suitable for observing contaminant impact on the insulator string. For the same string, the camera location was constant to avoid the distance effect on the results. The distance between the camera and the object allowed 7–8 cup-and-pin insulators to be in the measurement window (on the camera screen) for the suspension string and 14–16 cup-and-pin insulators for the tension string.
2.3. Application of Image Processing for Field Test
Digital image processing is the implementation of computer algorithms for manipulation and extraction of information from a digital image. A digital image is a numerical representation of a two-dimensional image that can be defined as a function f(x,y) where x and y are spatial coordinates, while f is the value in the coordinates (x,y) [
14].
In this research stage, the image processing method was employed to extract the quantitative data from the image (frames from video). The image processing was performed according to the procedure in [
15]. In general, there were two main processes. The first one was the UV count extraction based on optical character recognition (OCR). The second one was the UV pixel percentage calculation based on facular area.
The image processing required the video as input data. The video was converted to frames. The image on each frame was then processed. The image was an 8-bit image with a size of 768 × 576 pixels and comprised 3 components, namely red, green, and blue (RGB). In the mathematical calculation, each component was represented as a matrix I with a size of 768 × 576. Since the image was 16-bit data, there were 28 or 256 value levels for each element in the matrix. In this case, 0 was the minimum value and 255 was the maximum value. In addition, there were binary images that were involved in this image processing where there were only two values for each element in the matrix, namely 0 and 1.
2.3.1. UV Count Extraction
The UV count could be noted manually by the operator, but this required a lot of time and effort. The potential for human error was also very high, especially related to its accuracy. The UV count in this research stage was extracted automatically by converting the image data into text data. The initial images (frames from video) had to be pre-processed before they were scanned using OCR [
16]. The pre-processing included image cropping, image segmentation, morphological aperture, and image inversion.
The initial image was cropped in the UV count display area at the pixel coordinates (520, 78) to (526, 178) where (0, 0) was the top leftmost pixel. This cropped area was applied to all zoom values. To implement the segmentation process, the image was first converted into a single channel 16-bit image (greyscale image) by using (1) [
17].
The grayscale image was then smoothed using Gaussian blur to reduce noise before thresholding. The Gaussian blur is a spatial filter in image processing that convolutes the input image with a Gaussian kernel, as written in (2) [
14].
The image segmentation process was the conversion of a 16-bit 3-channel image into a one-channel binary image. The smoothed image was segmented using the thresholding process. In this process, a thresholding value of 255 was used as the upper limit and 165 as the lower limit as given in (3) [
14]. The process was run using the function of cv2.threshold(img, 165, 255, cv2.THRESH_BINARY) [
18].
The morphological opening process was to remove noise in the binary image. It consisted of a dilation process followed by an erosion process. Both processes were morphological transformations that convoluted the input image with a structuring element in the form of a kernel by using (4)–(7) [
14], with A as the set of foreground pixels, B as the structuring element, and z as the foreground pixel value. The kernel was a 3 × 3 cross-shaped kernel. The opening process utilized the function of cv2.morphologyEx(img, cv.MORPH_OPEN, kernel) [
19].
The image inversion was the conversion from white to black, and vice versa. The image was inverted to match the input format accepted by the OCR. The image inversion could be written as in (8).
The OCR was applied to images that had been pre-processed. Tesseract OCR was employed as an OCR engine and PyTesseract was chosen as a wrapper to run Tesseract OCR. Tesseract OCR was configured according to the desired input and output image forms [
16].
2.3.2. UV Pixel Calculation
The initial image had to be cropped according to the selected zoom values. The cropping area was a white measurement window provided by the camera screen. The image was cropped at the coordinates (167, 212) to (407, 554) for the video with 1× zoom and at the coordinates (227, 298) to (347, 469) for the video with 0.5× zoom. The conversion from RGB color to HSV color (hue, saturation, value), as stated in (9)–(12), was to facilitate the next thresholding stage. The value was stored in 16-bit, so the HSV value became as in (13).
The image segmentation in this research stage was to segment the red pixels representing the UV emitted by the discharge phenomena of the insulator string. This process could not be carried out by selecting only one red color value (R = 255, G = 0, B = 0) because of the noise that caused a slight deviation in the RGB value. The noise might come from the rendering process or the compression by camera. The thresholding value was set in a range that was close to red color. In the HSV color, red had a hue value of 0° or 0 in the program representation. By taking a tolerance value of ±5°, the hue range was −5° ≤ H(m,n) ≤ 5° or 175 ≤ H(m,n) ≤ 180 ∩ 0 ≤ H(m,n) ≤ 5. The maximum value was 255 for the saturation and value range. With a tolerance value of 55, the ranges of saturation and value were 200 ≤ S(m,n) ≤ 255 and 200 ≤ V(m,n) ≤ 255. The thresholding process was as stated in (14).
The same threshold value was applied to every frame. The difference in threshold values allowed the different results of segmentation and UV emission area calculation for the same image.
The sum of each red pixel in the segmented image gave the UV emission area. The result was then divided by the cropped image resolution according to the selected zoom value, so the calculation result was independent of the zoom level of the recorded video since the measurement window on the camera screen became smaller when the zoom value was increased. The final calculation result was the ratio between the UV pixel total and the cropped image resolution, as shown in (15). The final calculation result was then multiplied by 100 (%) to obtain the results in percentage units.
2.4. Application of Laboratory Test-Based Insulator String Condition Level Criteria for Field Test
The insulator string condition rating criteria based on the visual inspection of UV development was produced at the laboratory test (
Section 2.1). The criteria were then implemented to the insulator strings at the first and second substations to rate their condition level and were expressed in quantitative terms (level 1, level 2, etc.). This process was carried out manually by visually observing the UV patterns in each frame from the field test results.
2.5. Application of Regression for Field Test
Each insulator string at the first and second substations had the index values (level status), such as level 1, level 2, etc., representing the level of its condition according to the procedure in
Section 2.4. At this research stage, the index values were then correlated with the values of the UV emission area calculated in
Section 2.3.2. In this case, the regression method was utilized to classify the values of the UV emission area.
The classification model was built using 80% of the data and tested using the other 20% of the data. The model was designed to receive the input data in the form of video and was expected to publish the classification results that were close to the index values found in
Section 2.4.
Only parameters from the UV emission area were used since the UV count was left behind from the UV image due to the calculation process (integration and averaging modes) that was carried out in real time by the camera. The average values of the UV emission area were then calculated to represent the entire phenomenon that occurred in a video. The logarithmic regression was considered using (16), with y as the dependent variable, x as the independent variable, a as the constant, and b as the regression coefficient.
The final stage was the validation process to measure the classification model performance by calculating the accuracy and mean absolute error of the prediction results on the test data. The accuracy was the percentage of the sum of prediction results that matched the index values produced in
Section 2.4, whereas the mean absolute error was a measure of the absolute error rate between the prediction results and the actual results. The mean absolute error was calculated using (20).
3. Results and Discussion
3.1. Criteria of Insulator String Condition Level Based on Laboratory Test
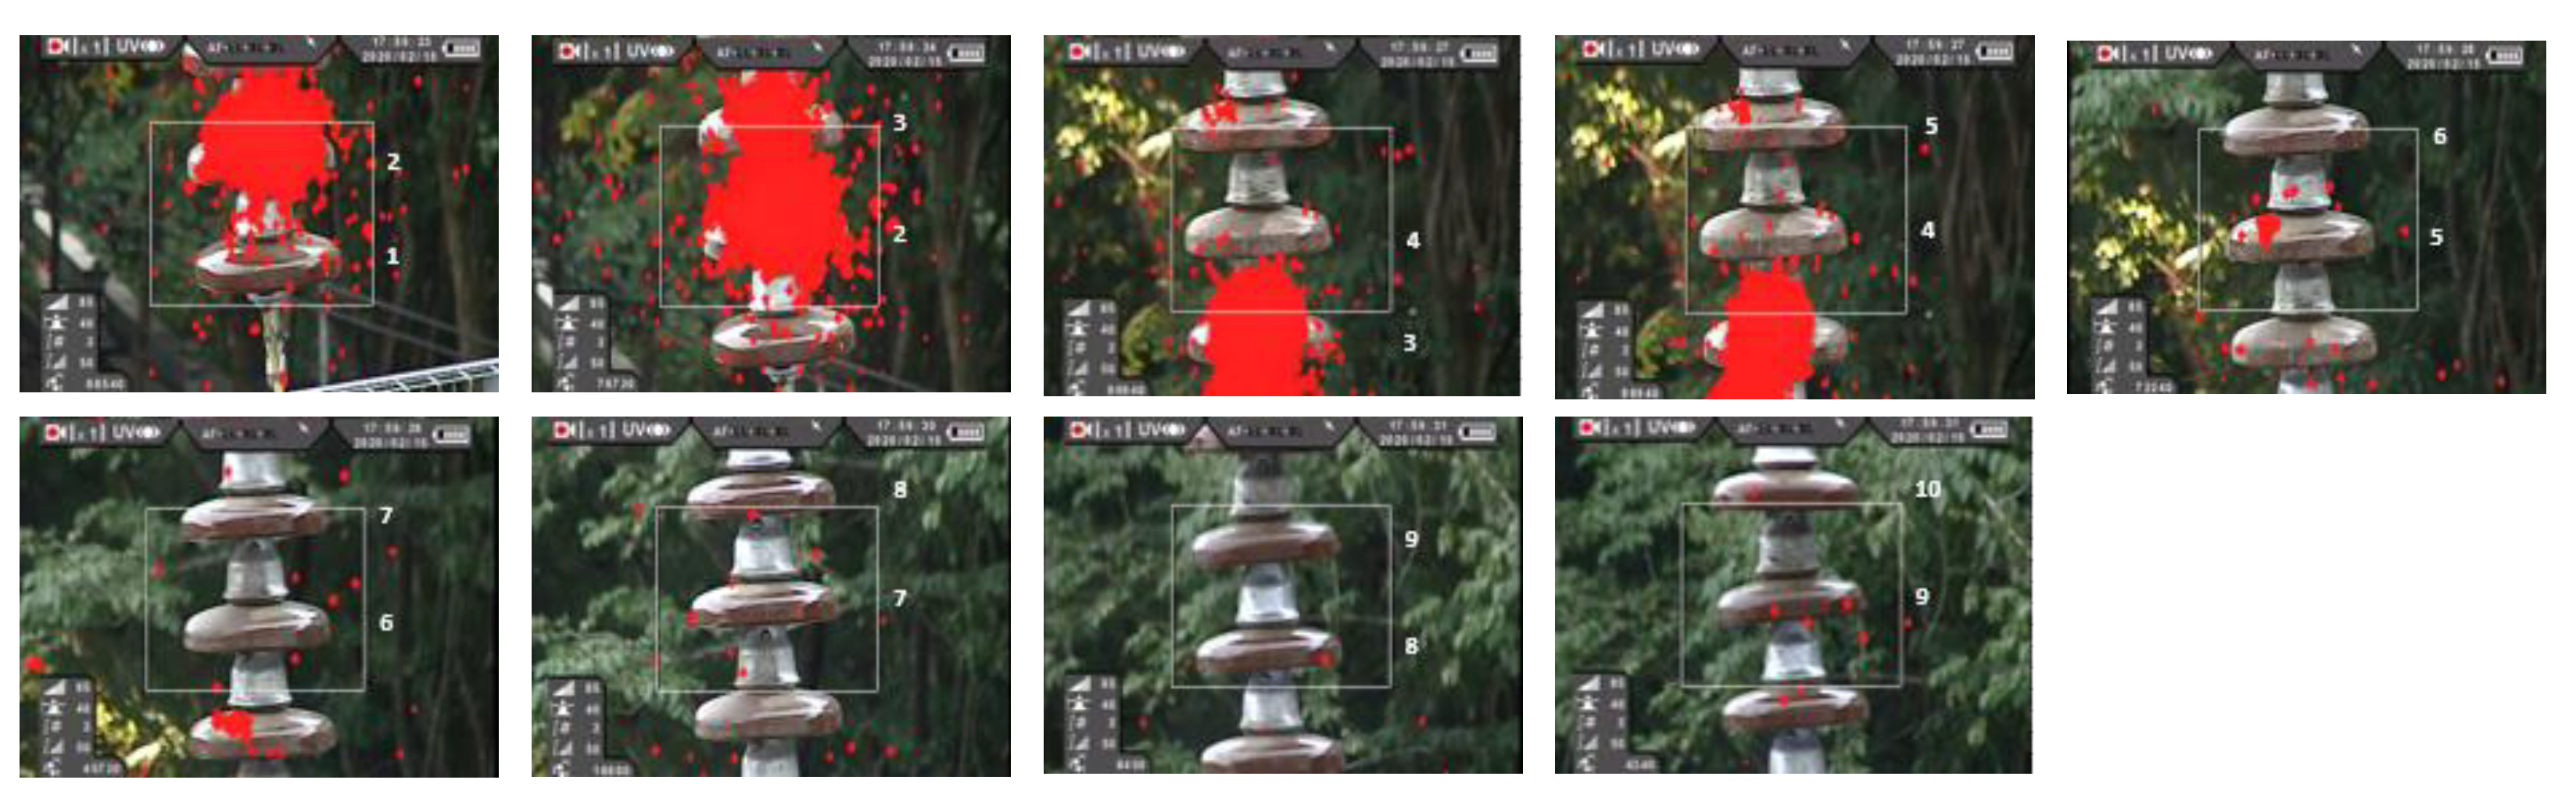
The samples of frames when the UV emission elongated from the first to fourth cup-and-pin insulator are shown in
Figure 2. The UV count value that was displayed directly on the camera screen was ignored since the observation made was qualitative. The UV was clearly seen at the junction between the first and second cup-and-pin insulator, the second and third cup-and-pin insulator, and the third and fourth cup-and-pin insulator. This condition was represented by testing with a voltage of 130 kV.
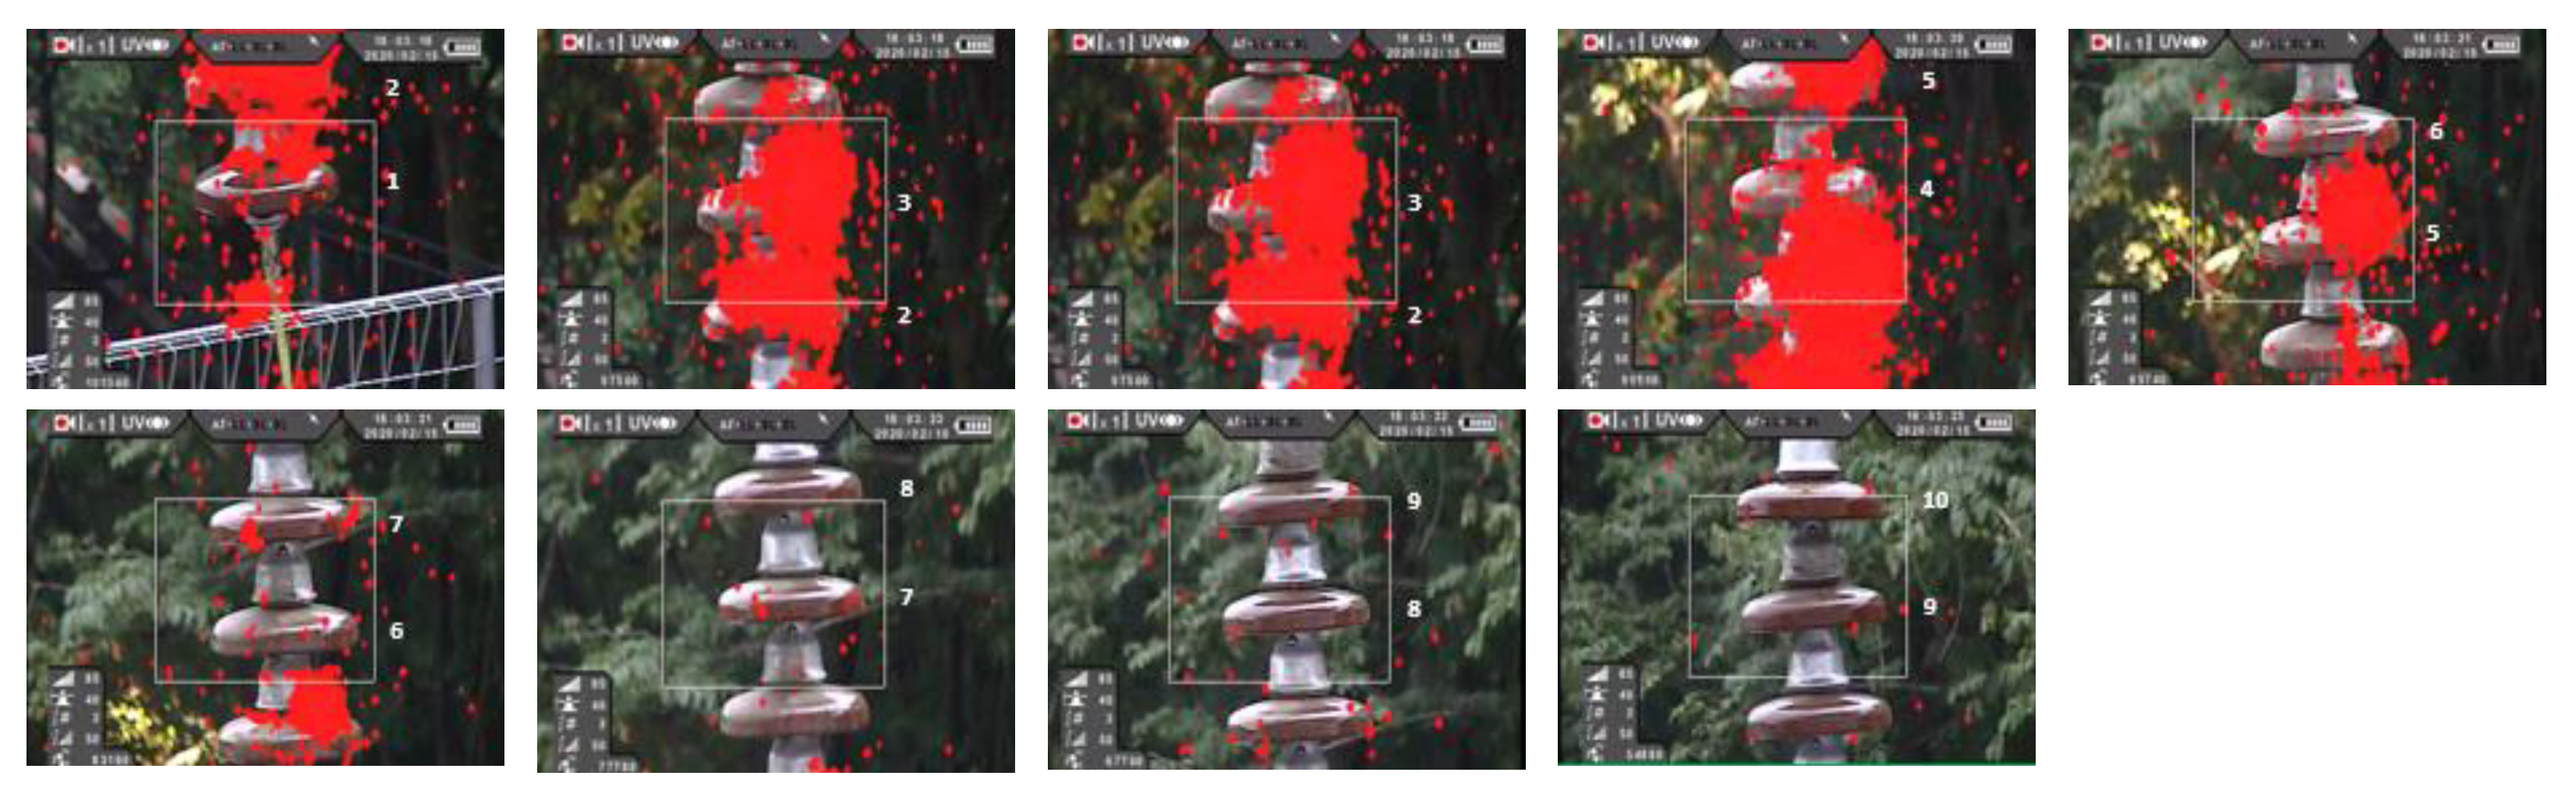
The condition with a voltage stress of 200 kV is displayed in
Figure 3. The UV emission extended from the first to the sixth cup-and-pin insulator. The UV was found at the connection (at each cap-and-pin element) between the first and second cup-and-pin insulator, second and third cup-and-pin insulator, third and fourth cup-and-pin insulator, and fourth and fifth cup-and-pin insulator.
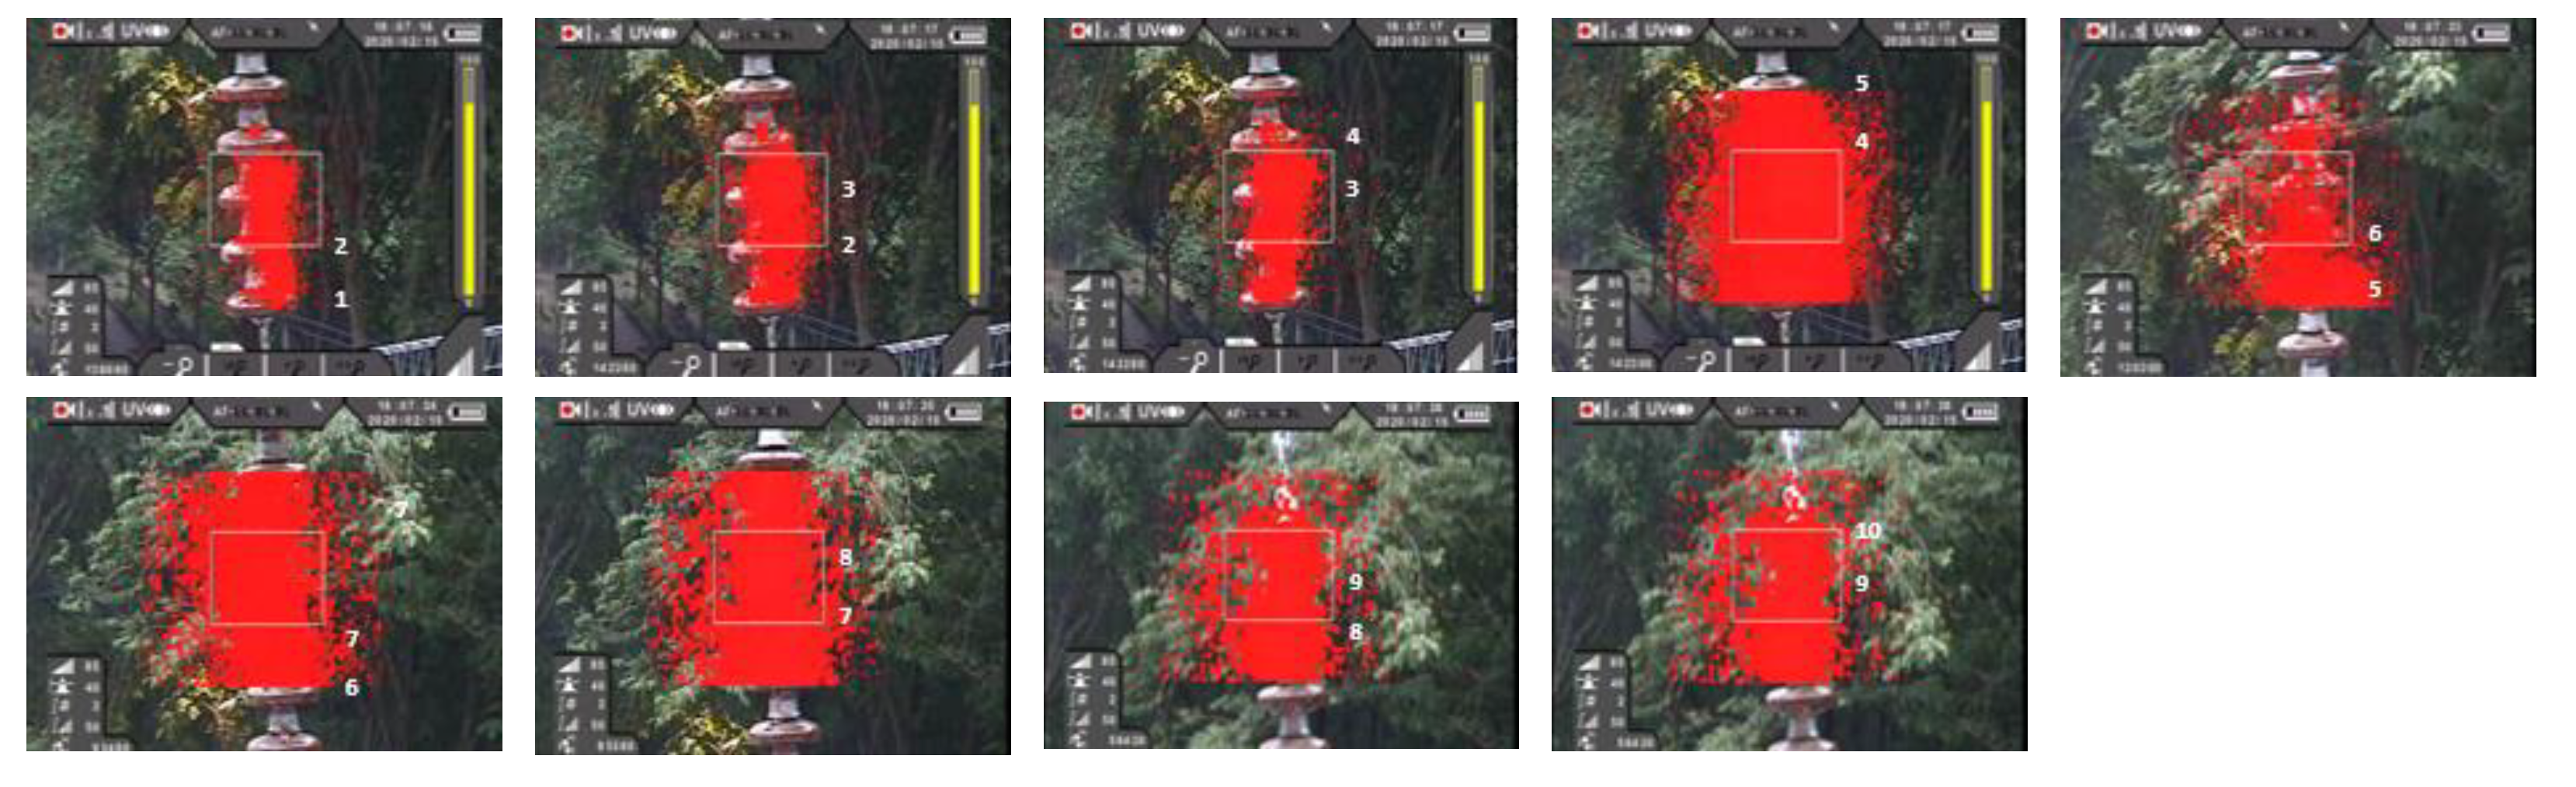
The flashover was generated by testing with a voltage of 215 kV. The UV elongation had reached the 10th cup-and-pin insulator as seen in
Figure 4. The UV appeared in all connections, namely between the first and second cup-and-pin insulator, the second and third cup-and-pin insulator, the third and fourth cup-and-pin insulator, the fourth and fifth cup-and-pin insulator, the fifth and sixth cup-and-pin insulator, the sixth and seventh cup-and-pin insulator, the seventh and eighth cup-and-pin insulator, the eighth and ninth cup-and-pin insulator, and the ninth and tenth cup-and-pin insulator. Although the UV had fully extended from the energized terminal to the grounded terminal, the protection system did not operate immediately. The protection system switched off the AC voltage supply after a voltage of 215 kV was held for about 1 min.
If the UV pattern was observed deeply, it could be generalized in two types. The first one was that the UV bridged the two adjacent cup-and-pin insulators. The second one was that the UV did not bridge the two adjacent cup-and-pin insulators. On that basis, the insulator string condition level was then assessed based on the UV existence and pattern. If the UV was not found, the insulator string condition level was categorized as one (1). If the UV was seen, but it did not bridge the two adjacent cup-and-pin insulators, the insulator string condition level was two (2). If the UV appeared and bridged the two adjacent cup-and-pin insulators, the insulator string condition level was three (3). In other words, level three was the worst state of insulator string condition, while level one was the safest state.
The categorization of insulator string condition which was created in the laboratory test was in accordance with the contamination flashover mechanism as defined in [
3]. There were seven phases before flashover condition. They were: (1) heating of the surface layer; (2) drying of the surface layer; (3) dry zone formation; (4) onset of dry zone arcing; (5) glow and streamer discharges; (6) slow arc growth; (7) fast arc growth. These seven phases could be simplified into three severity levels based on the discharge form. The first level included the phases 1–3 that had no discharge form. The second level comprised phases 4–5 that related to partial discharge development. The third level consisted of phases 6–7 relating to partial arc emergence.
3.2. Level Status of Insulator String Condition in Field Test
The results of implementing the insulator string condition level categorization procedure (as described in
Section 3.1) for field tests are shown in
Table 3 and
Table 4. The UV frame sample is given as evidence for the visual assessment. A summary of assessment results for all insulator strings, without the UV frame sample, is presented in
Table 5. The category with the least number of strings was level one, that was two strings (one string for S phase tension and one string for T phase tension). The most insulator string condition level was at level two, that was 27 strings. The remaining insulator strings (22 strings) fell into level three.
The insulator string condition with level three was dominated by the suspension type that was 19 strings. This revealed that the suspension type was more prone to flashover due to contamination since its vertical position made it easier for contaminants to accumulate at the bottom area of the string (due to contaminants falling from the higher cup-and-pin insulator to the lower cup-and-pin insulator). In other words, the self-cleaning for insulator strings of suspension type was less effective.
3.3. UV Emission Area Parameters in Representing the Sporadic Discharge Phenomena
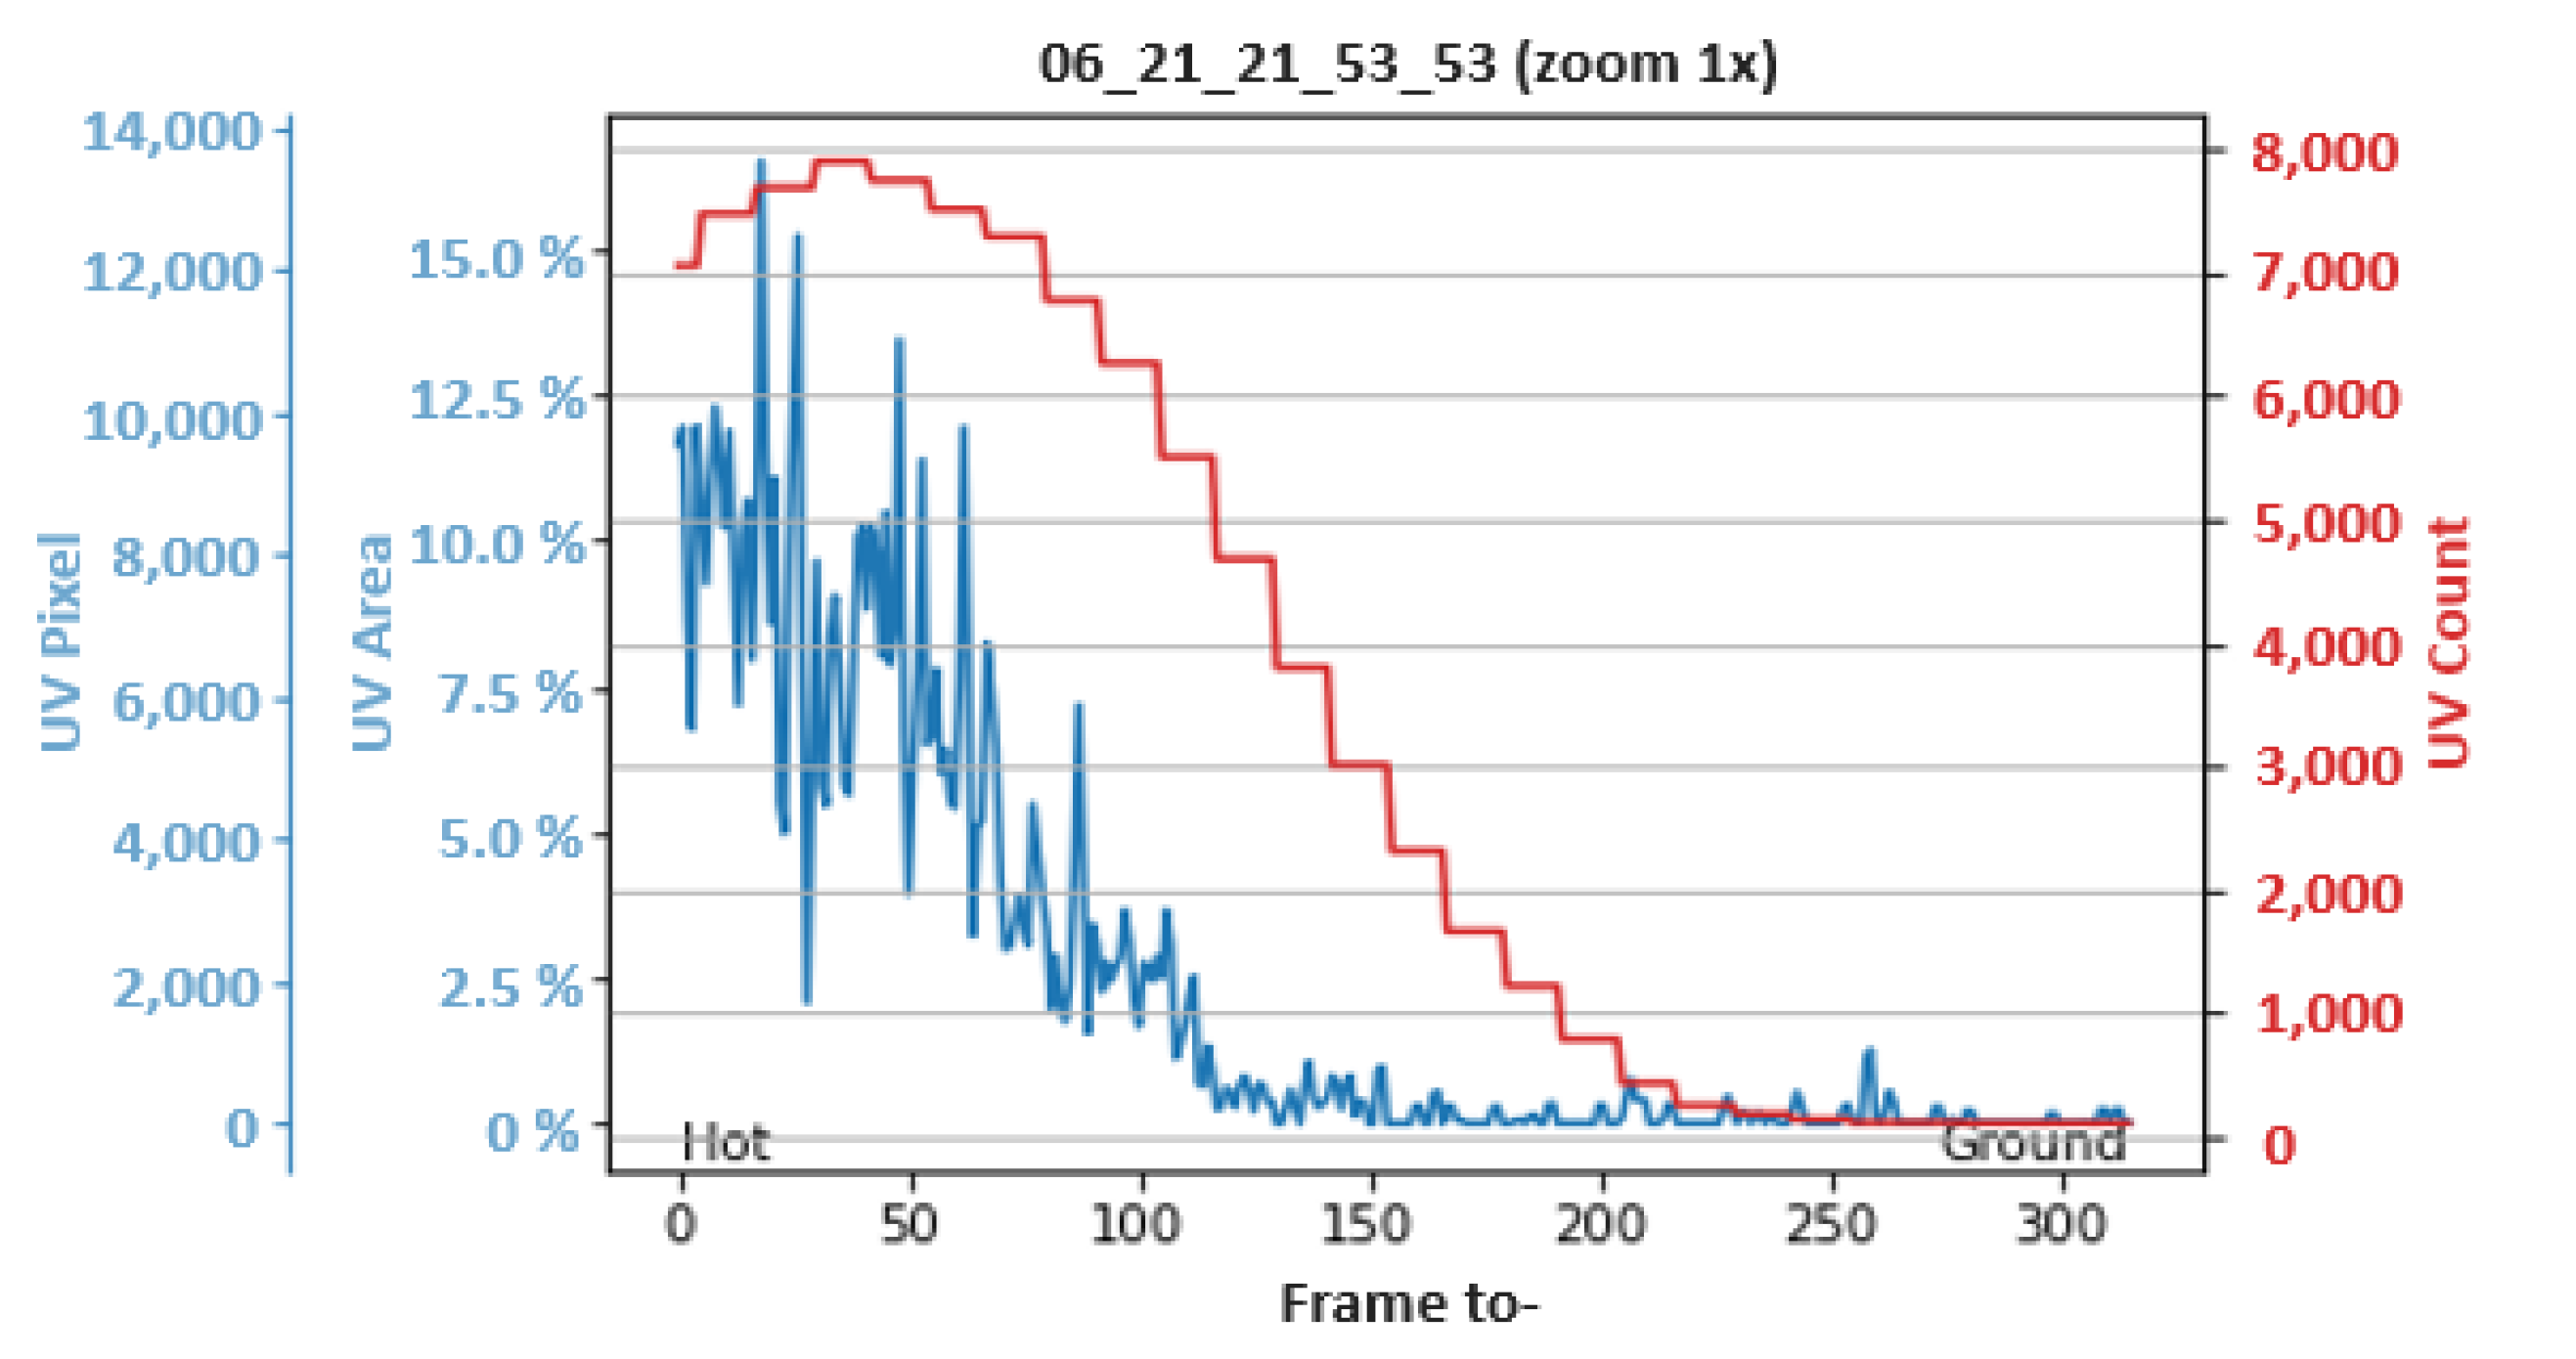
The results of the UV emission area calculation and the UV count extraction for R phase suspension strings at the GIS area are shown in
Figure 5. The graphs of UV count and UV emission area (in pixels and percentage units) had a similar trend. The high values were found on the section close to the energized terminal, while the low values were found on the section close to the grounded terminal. In other words, the graphs had a downward trend from the energized terminal to the grounded terminal.
The UV emission area values obtained from the utilization of image processing on the UV video had very high fluctuations. It proved that this indirect quantization method was able to provide results with satisfactory accuracy as the sporadic nature of discharge could be represented by the fluctuation rate of the UV emission area. On the other hand, the changes in the UV count value were not as fast as the UV emission area values, so the graph of the UV count values looked like a bar curve. It was because the UV count values took time to update the value according to the integration and averaging modes which were carried out directly by the camera.
The UV count value changed in several frames, so the UV count value appearing at time t was the calculation result involving frames appearing before t. The UV emission value changed in each frame, so the UV emission value appearing at time t was the calculation result of the frame appearing at time t. In other words, the UV emission value could be directly correlated with its frame at the same time. The graph of UV count values lagged behind the graph of the UV emission area. With the UV emission advantages, the average UV emission in a video was proven to be properly used as input data for the regression model made. This result was also supported by research [
20].
3.4. Insulator String Condition Based on UV Emission Area and Level Status in Field Test
Some results of the insulator string condition assessment using UV quantitative parameters and visual inspection are shown in
Table 6. The video name represented the insulator string assessed. In general, the insulator string with level three had an average value that was greater than level two, while the insulator string with level two had an average value that was greater than level one.
3.5. Classification Model
The logarithmic correlation had R2 = 0.7164 with y = 0.11424 ln(x) + 3.2598. This value indicated that there was a logarithmic correlation between the average value of UV emission area and the insulator string condition level status. The prediction result produced an accuracy of 82% with nine predictions that were the same as the results of the visual-based assessment. The mean absolute error (MAE) of this prediction was 0.182.
4. Conclusions
An approach to assess the insulator string condition level in case of flashover due to contamination at the 500 kV substations was developed. This approach produced a logarithmic regression-based model (y = 0.11424 ln(x) + 3.2598 with R2 = 0.7164) for classifying the insulator string condition levels. The input data for the model was the UV emission area value extracted by applying the image processing to the UV image (frames from video). The UV emission area value was an average value involving the UV pixels of each cup-and-pin insulator in the observed string, where the UV emissions due to partial discharge and partial arc were also calculated, so the assessment result was fair. In other words, the model was able to bring a visual assessment (manually observing the UV pattern of each frame) into a quantitative assessment that made it easier for the operator. In simple terms, there were three levels of classification: level one was the condition without partial discharge and arc, level two was the condition with partial discharge, and level three was the condition with partial discharge and arc. The field test showed that most strings had category level two, while most strings with level three were of the suspension type. The use of the UV emission area was better at representing the sporadic nature of the discharge phenomenon since the facular area curve was much more volatile and the UV count curve was delayed relative to the facular area curve. With an error rate based on the MAE value = 0.182, this model was quite effective for application in the field. However, the implementation of the model must be followed by the same procedures as described in this paper, except for the insulator string condition level criteria which could be generally accepted.


 and
and 


