
Discovering Irregularities from Computer Networks by Topological Mapping
 , , ,
, , ,
Abstract
:1. Introduction
2. Literature Review
3. Research Methodology
3.1. Objectives
3.2. Significance
3.3. Method
4. Experimental Results
4.1. Main Results
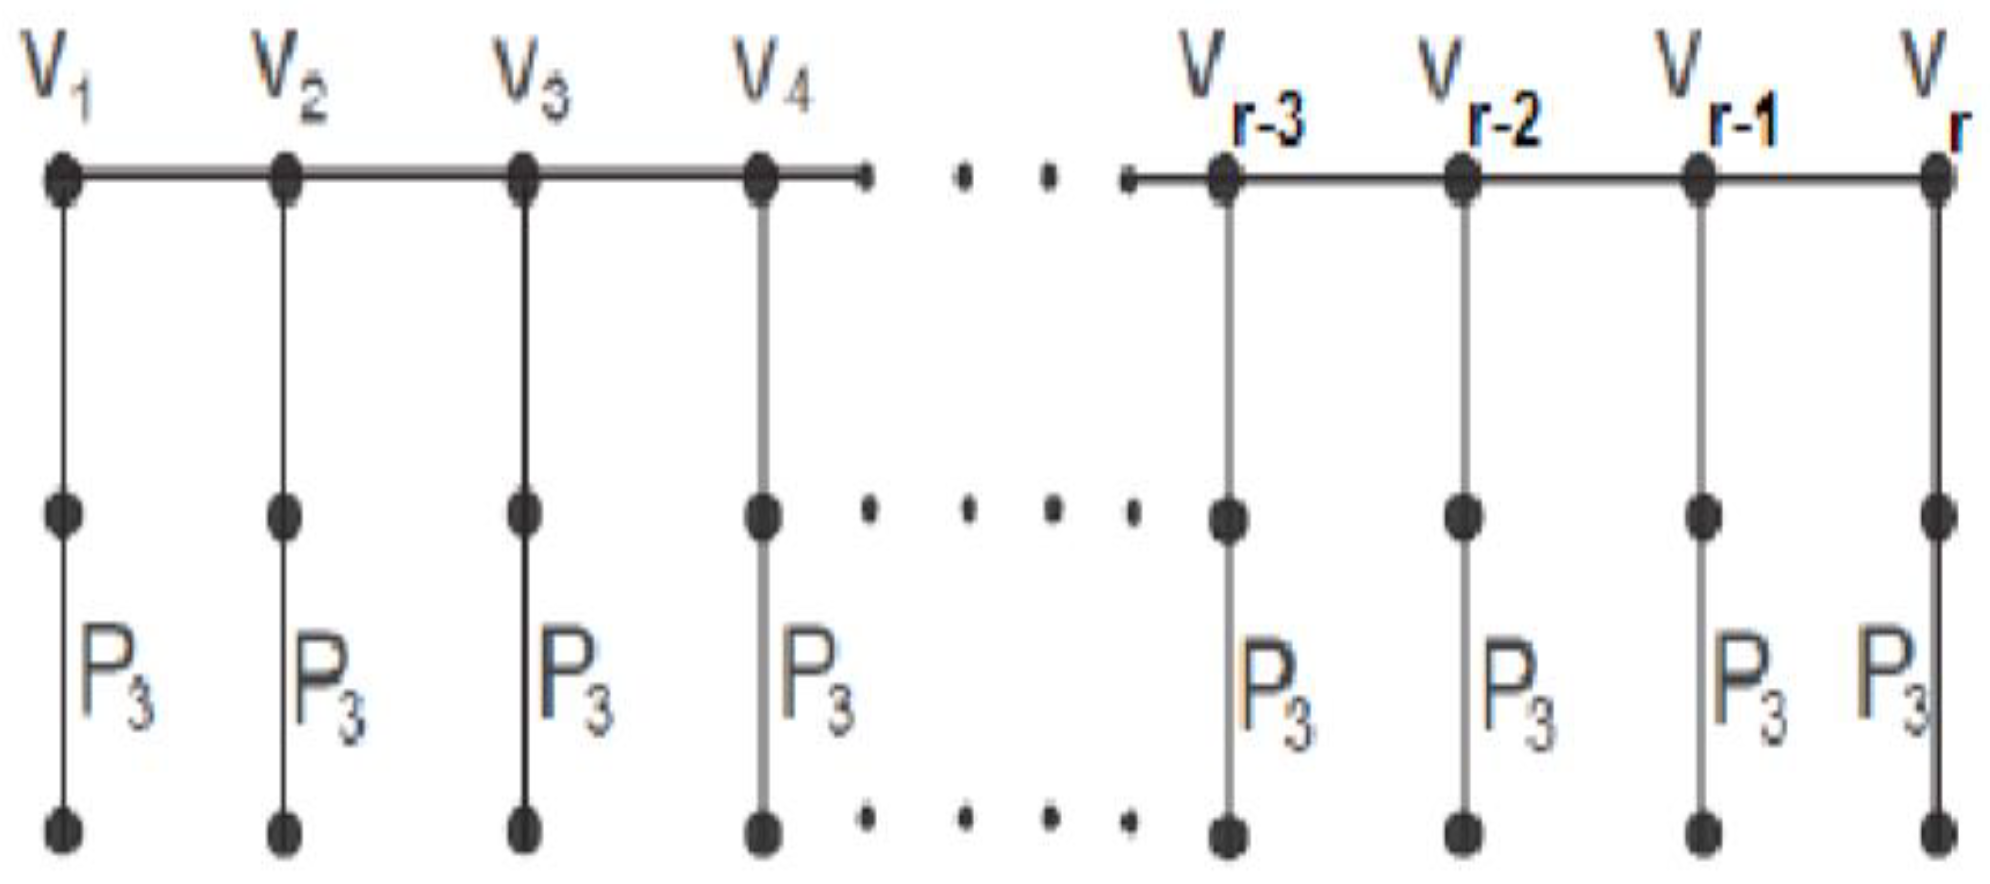
4.1.1. Bridge Graph Gr (Ps, v) over Path
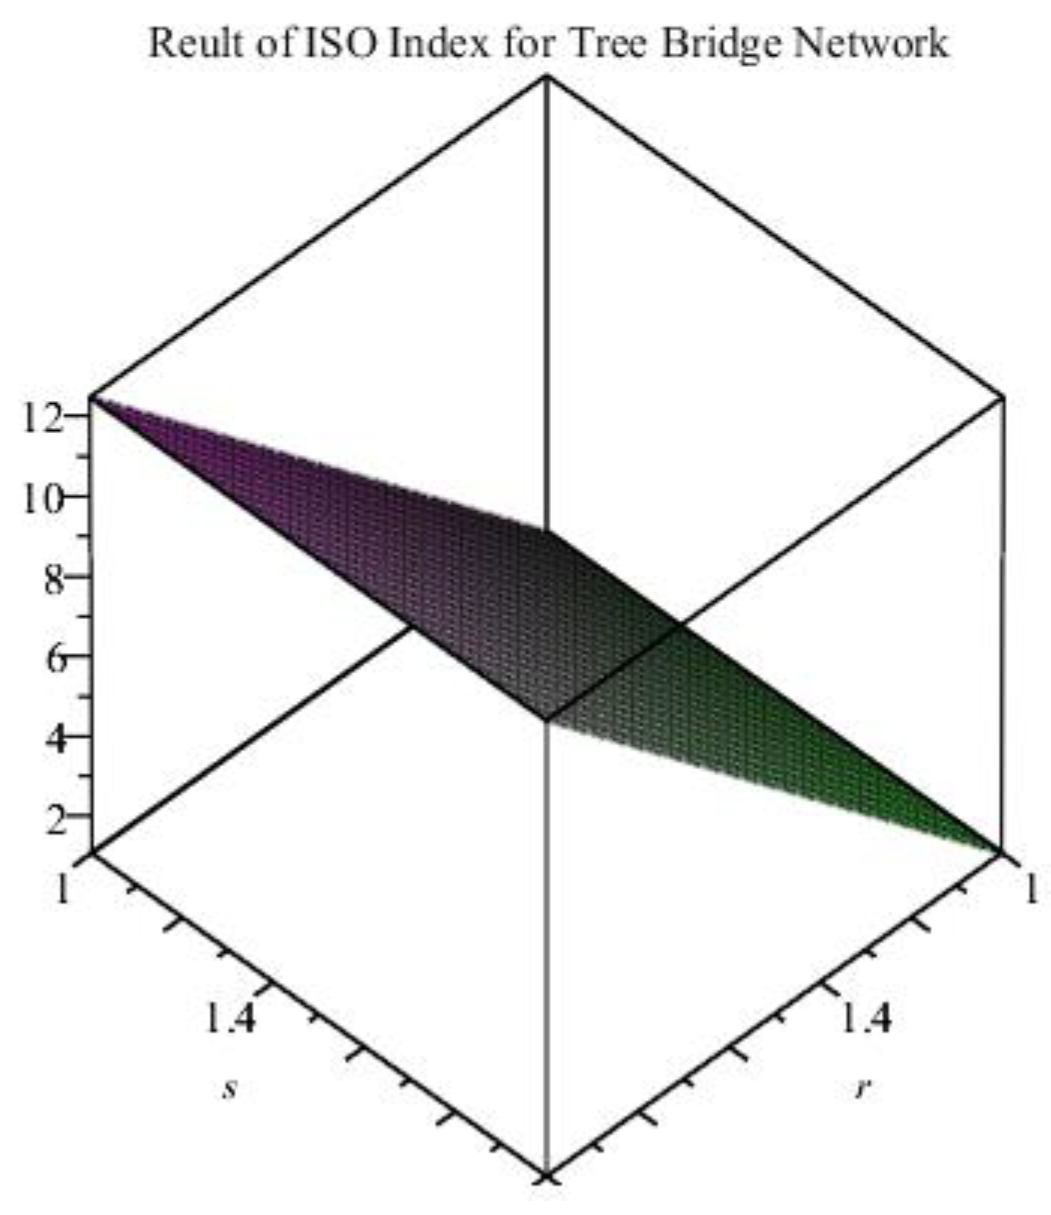
4.1.2. Theorem 1
4.2. Main Results
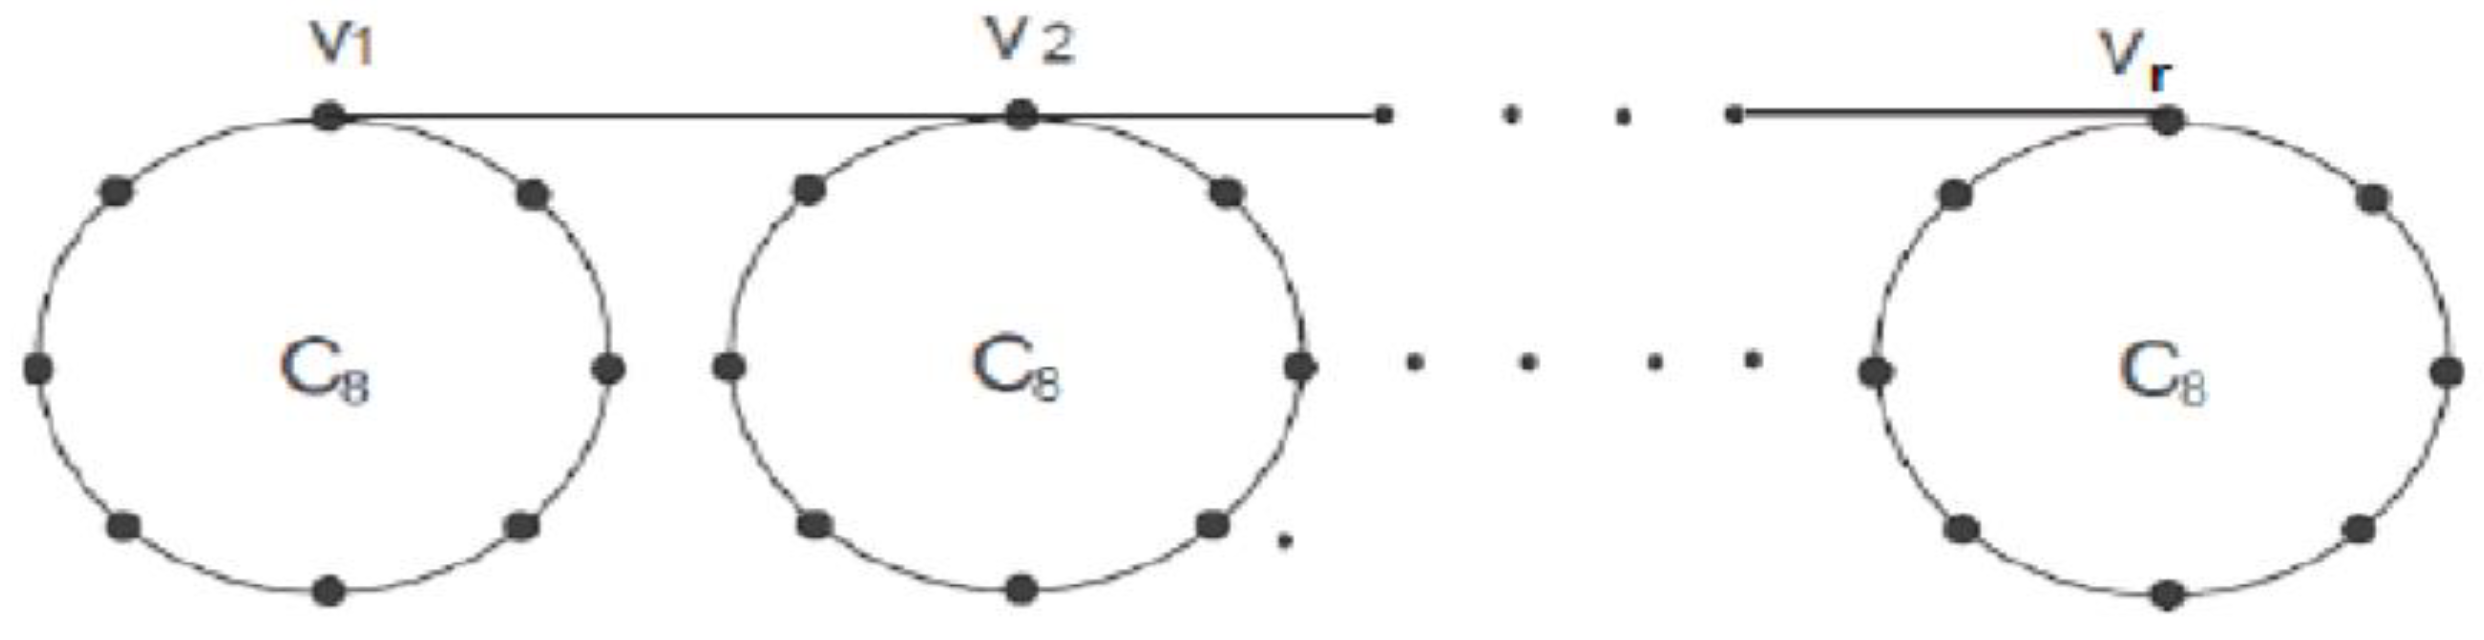
4.2.1. Bridge Graph Gr (Cs, v) over Cycle
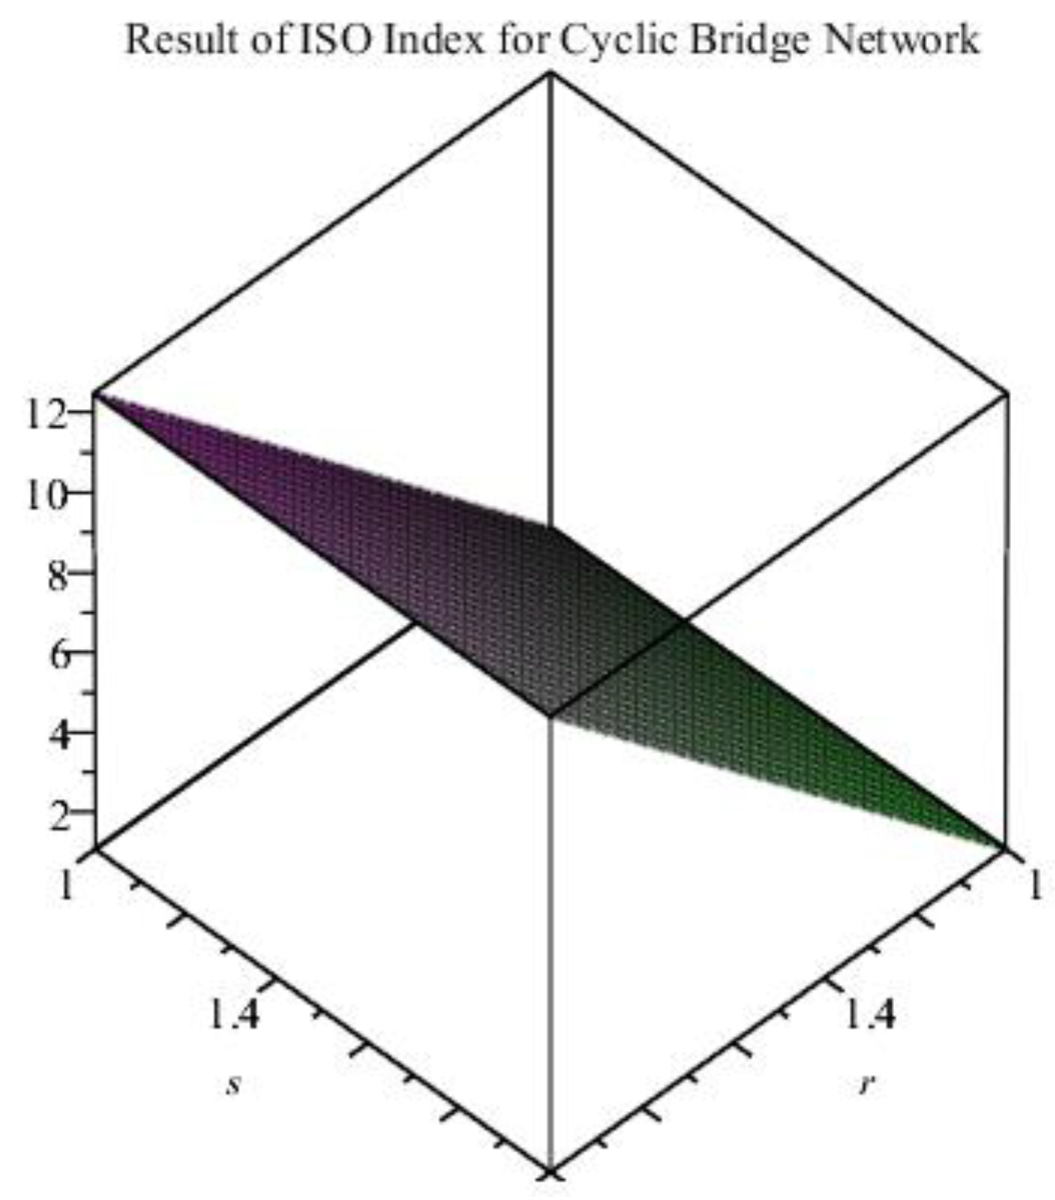
4.2.2. Theorem 2
4.3. Main Results
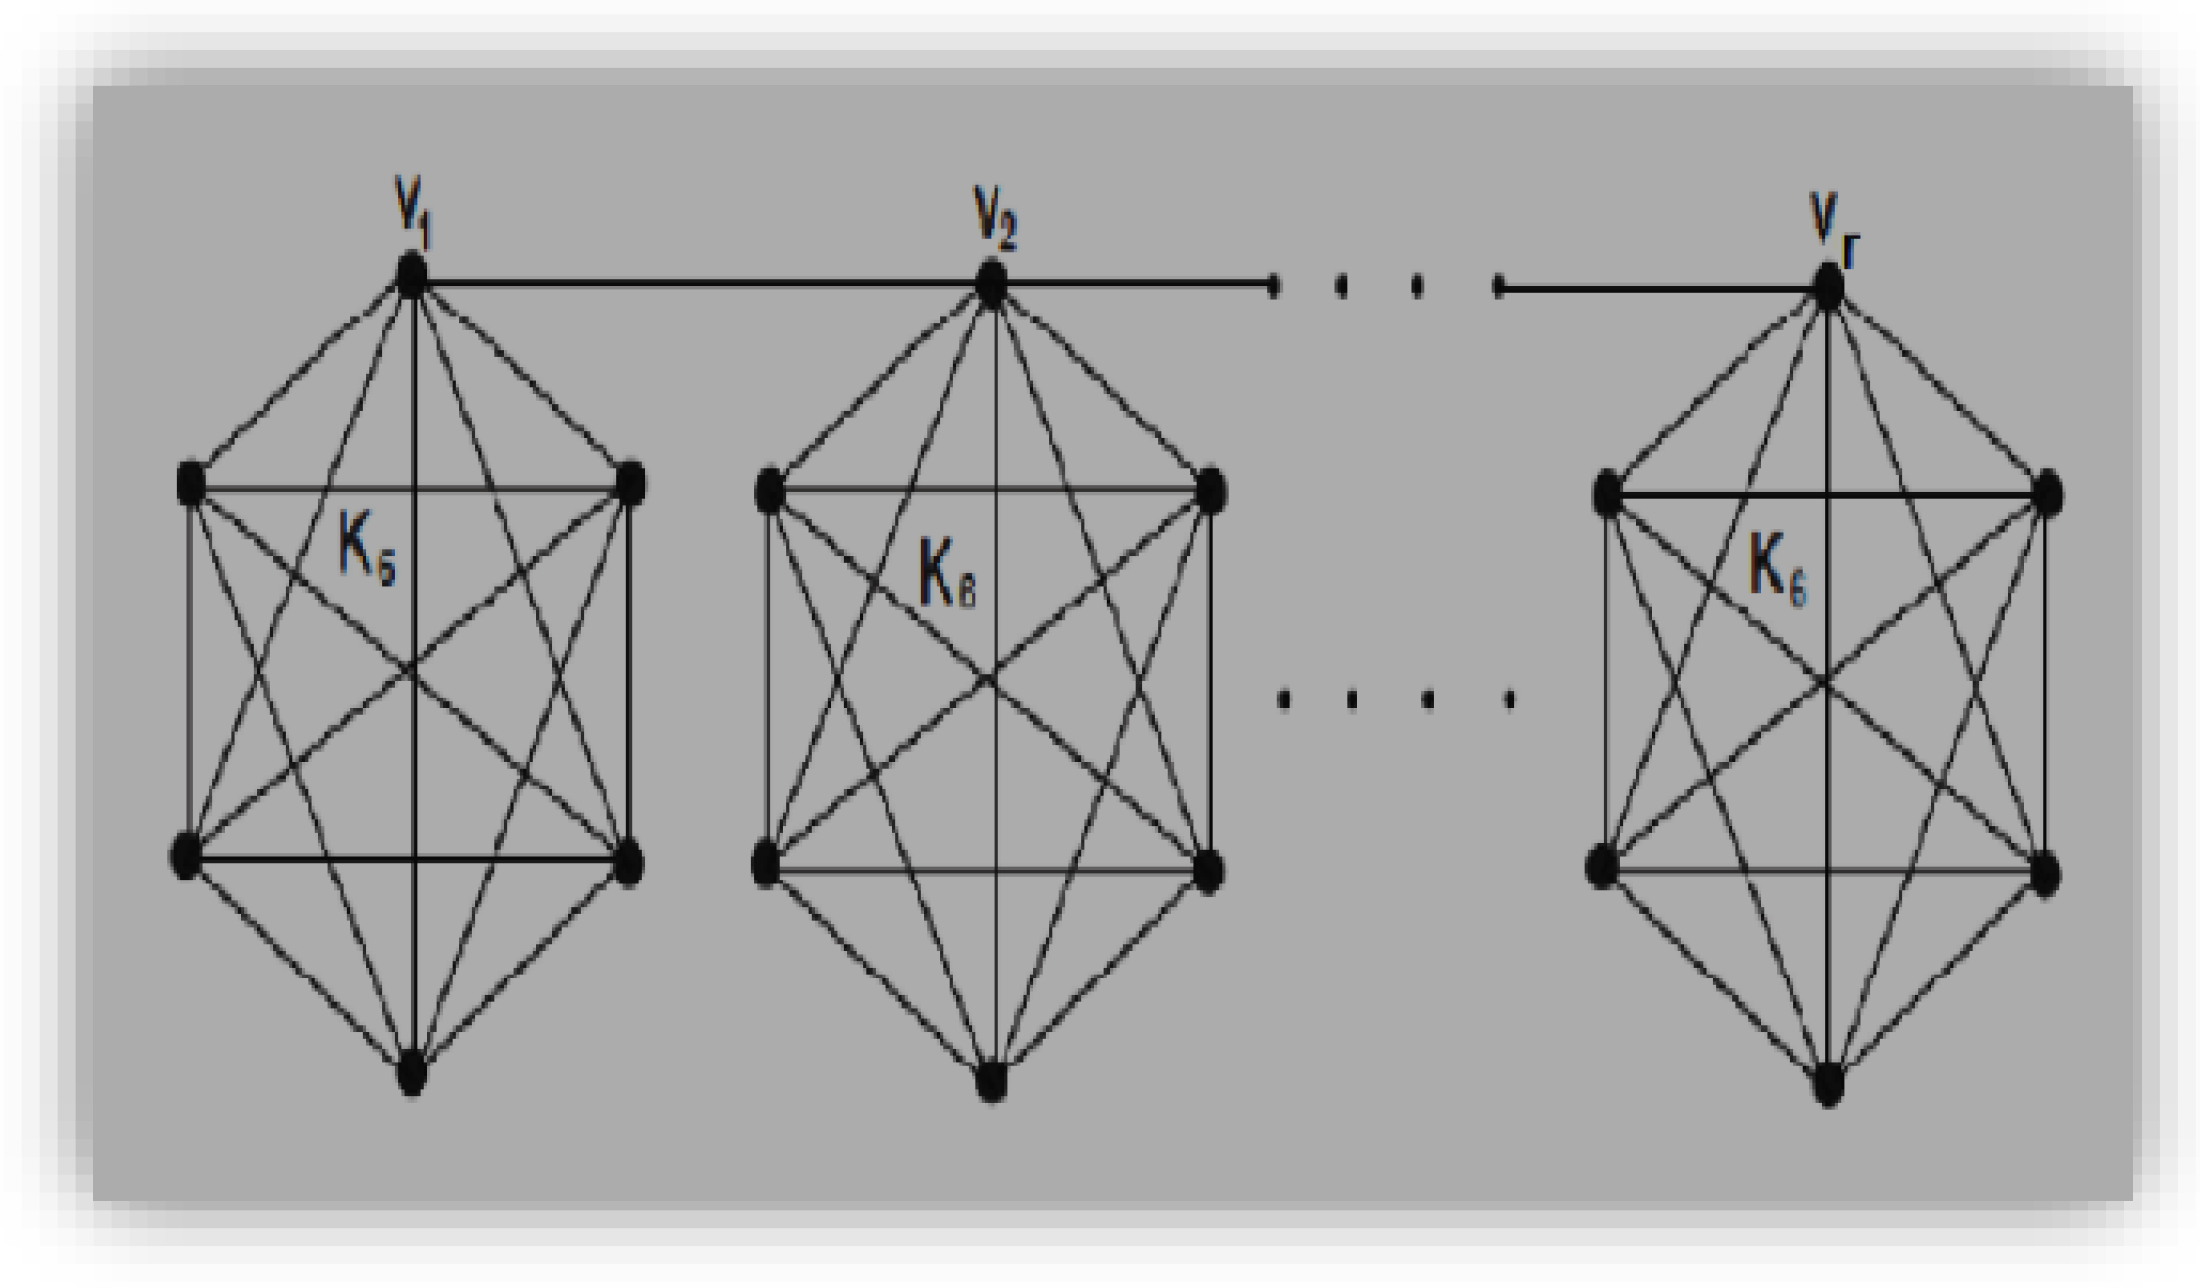
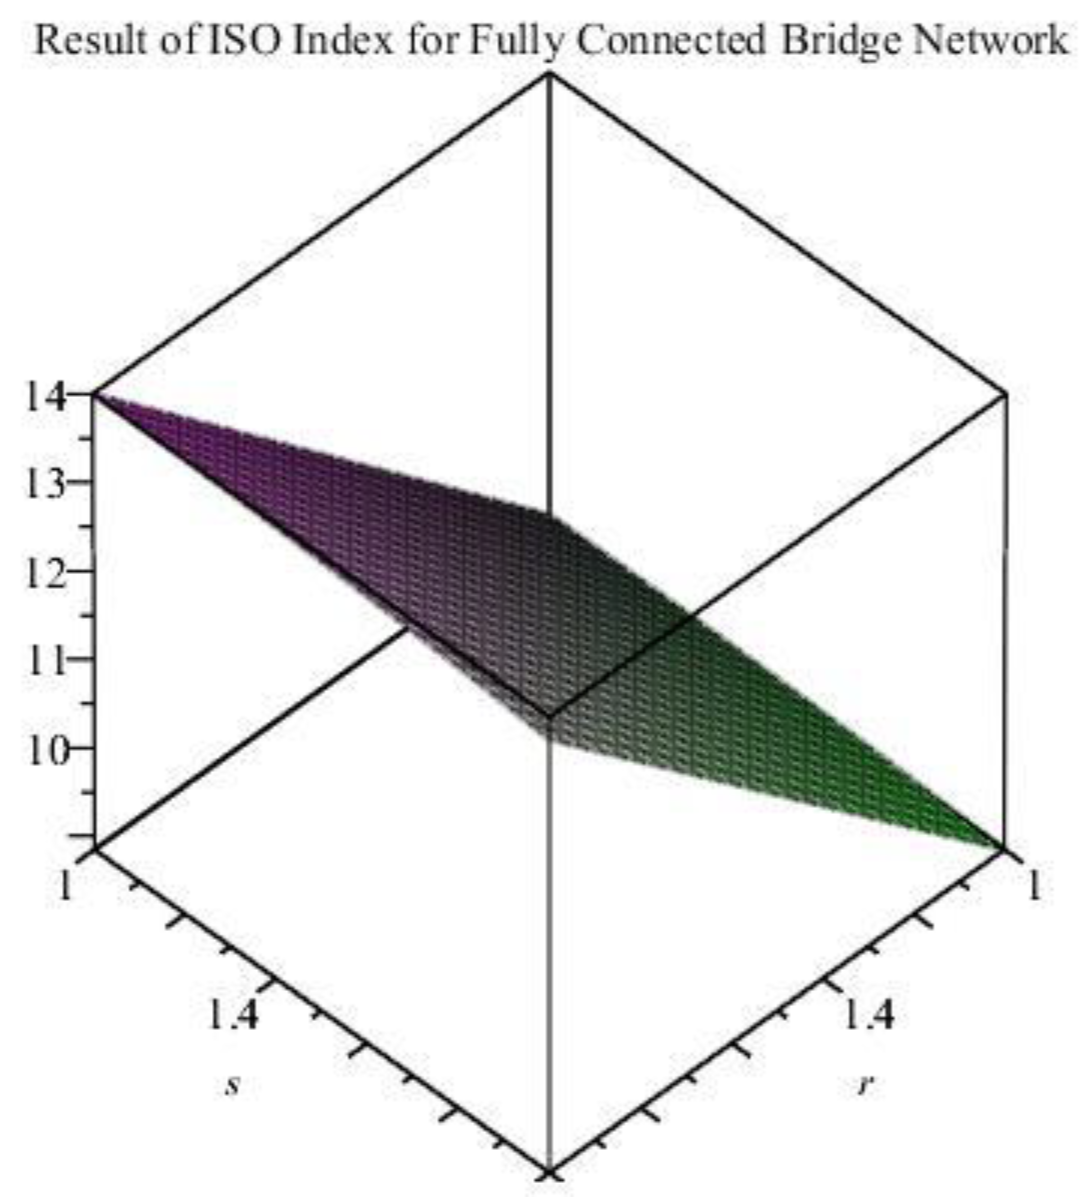
4.3.1. Bridge Graph Gr (Ks, v) over Complete Graph
4.3.2. Theorem 3
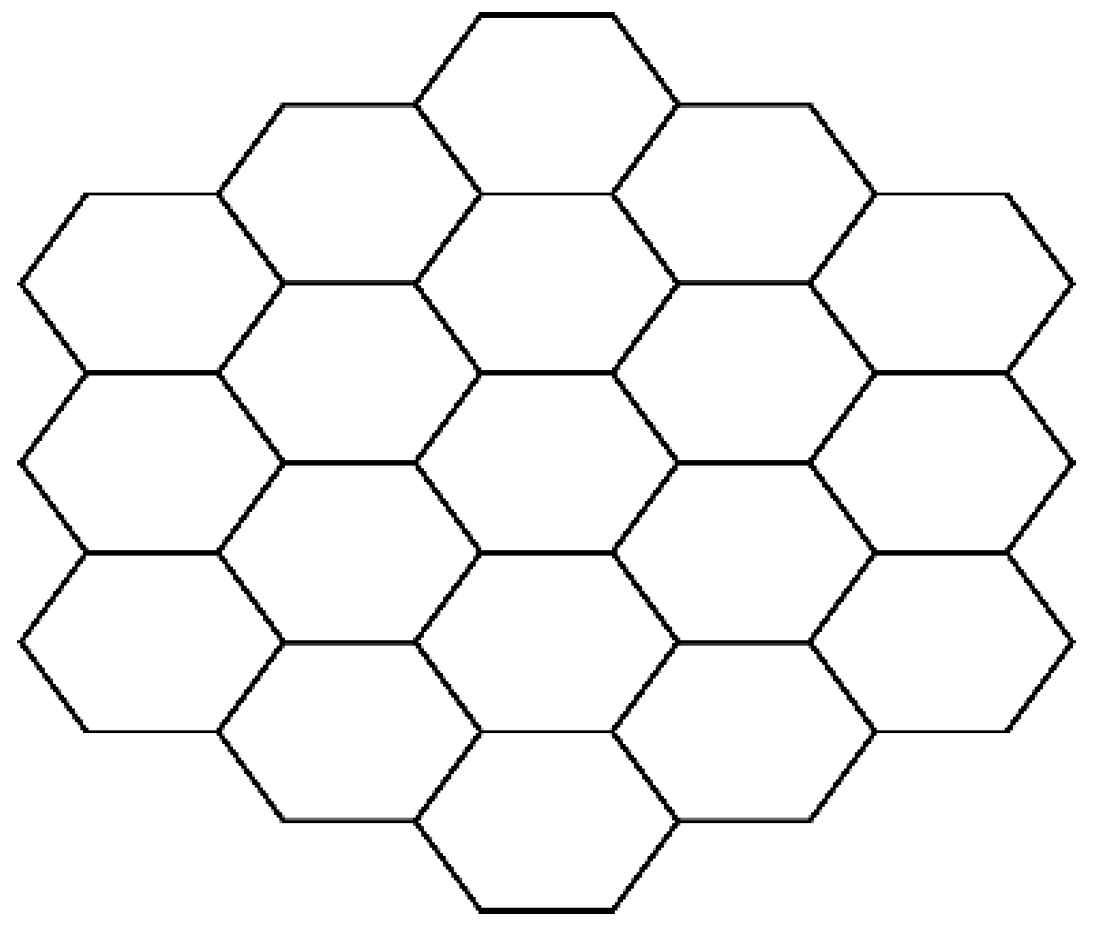
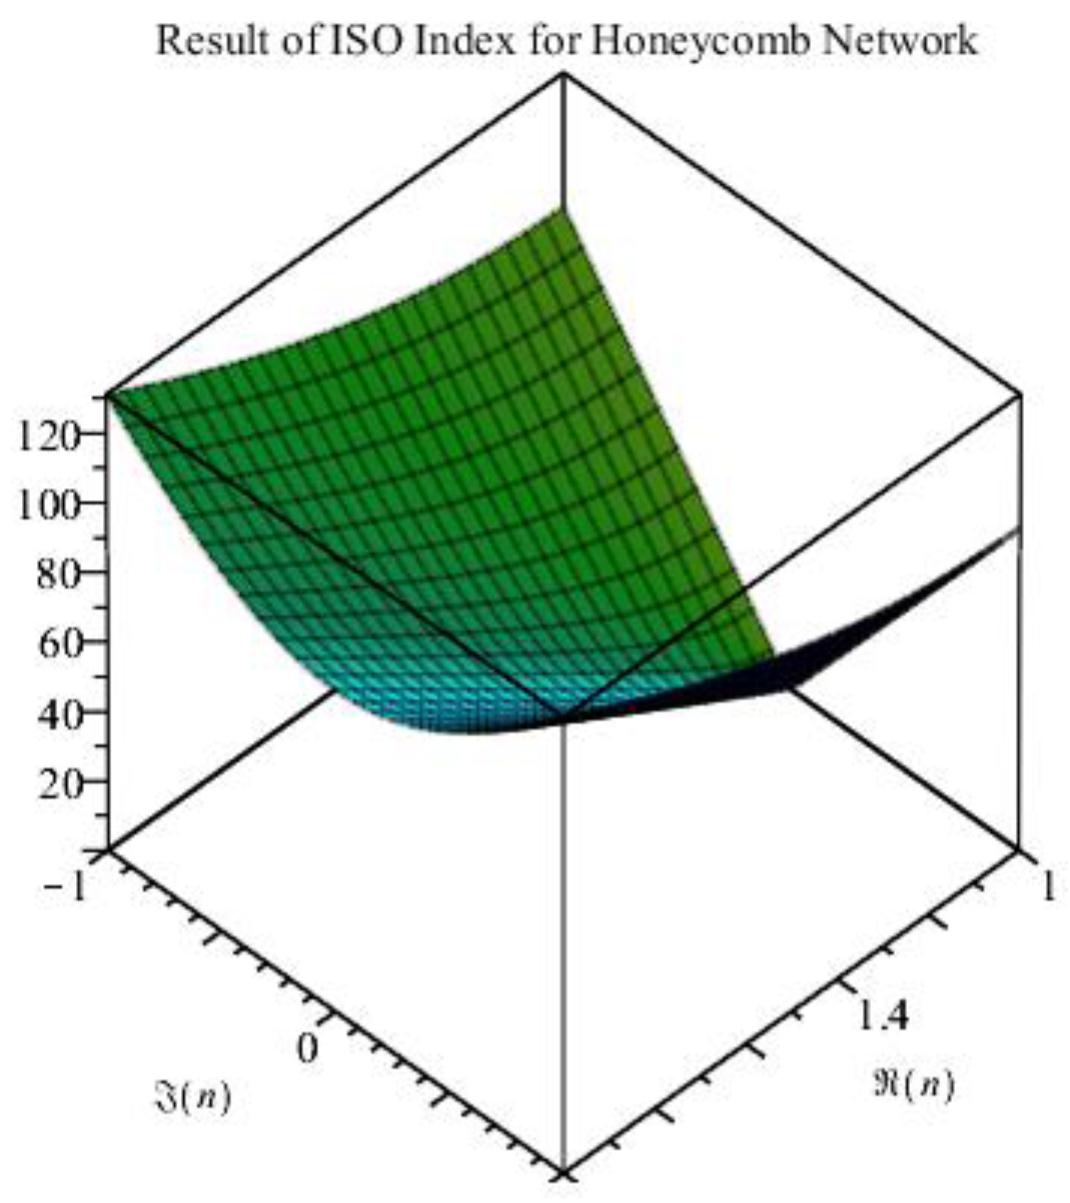
4.4. Main Results of Honeycomb Network
4.4.1. Honeycomb Graph
4.4.2. Theorem 4
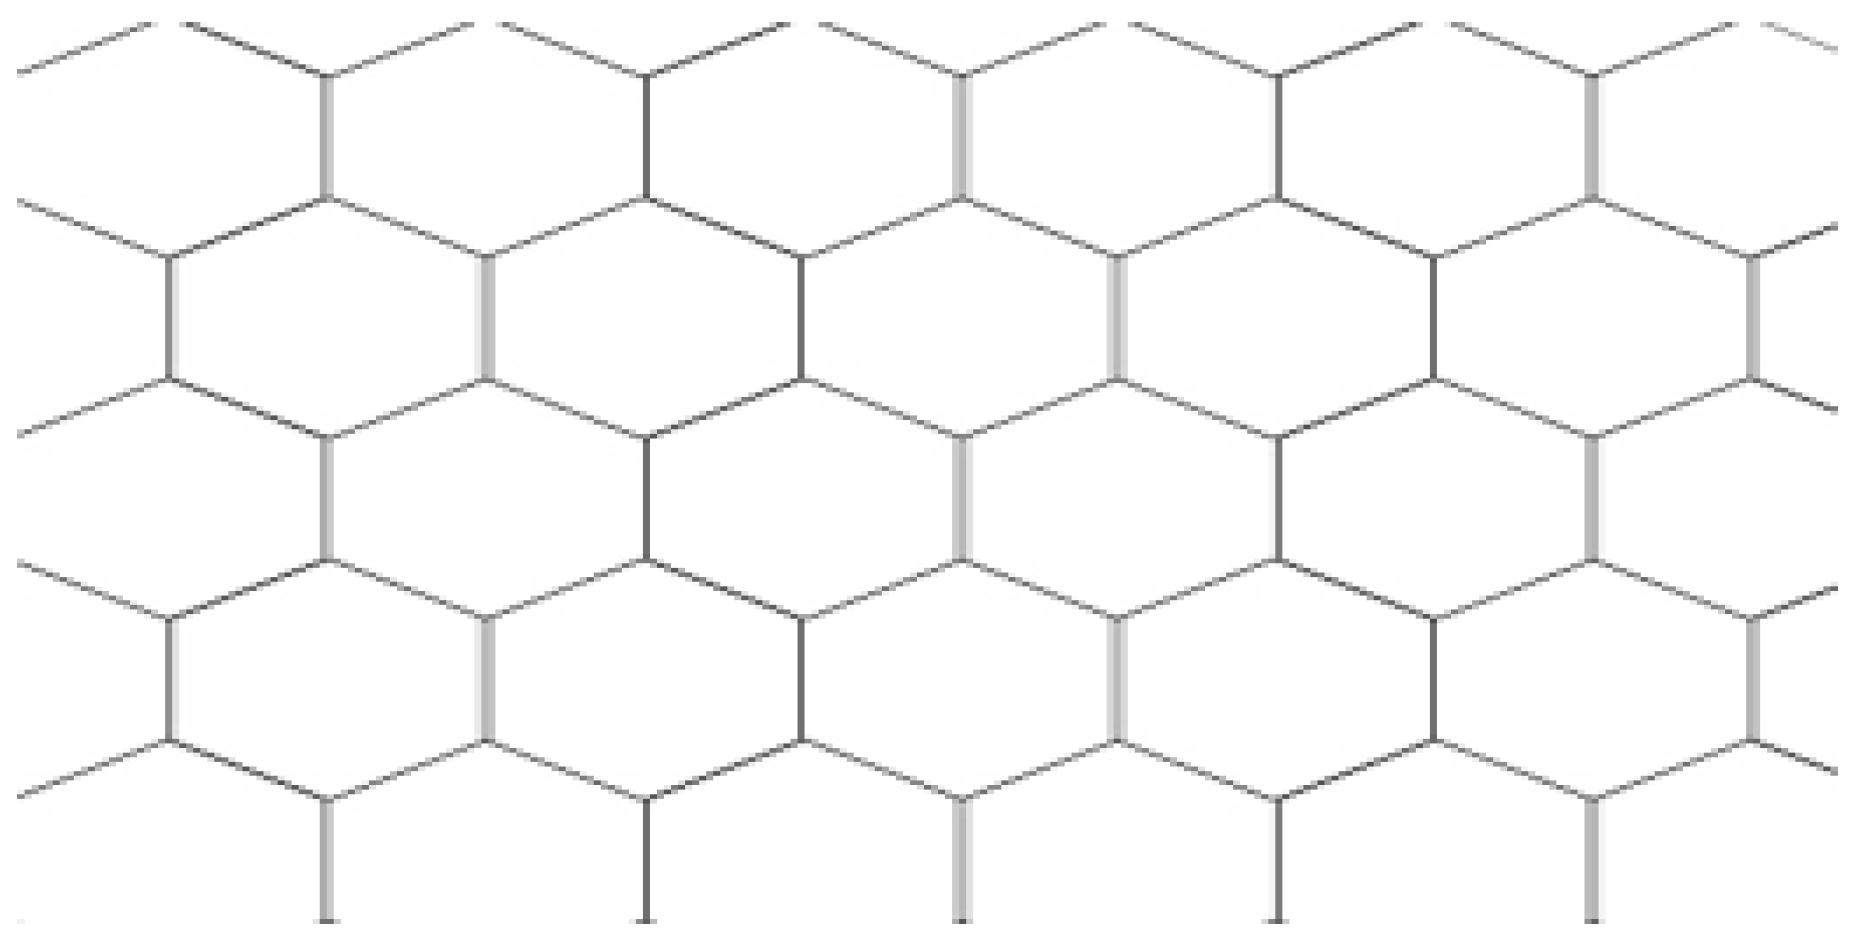
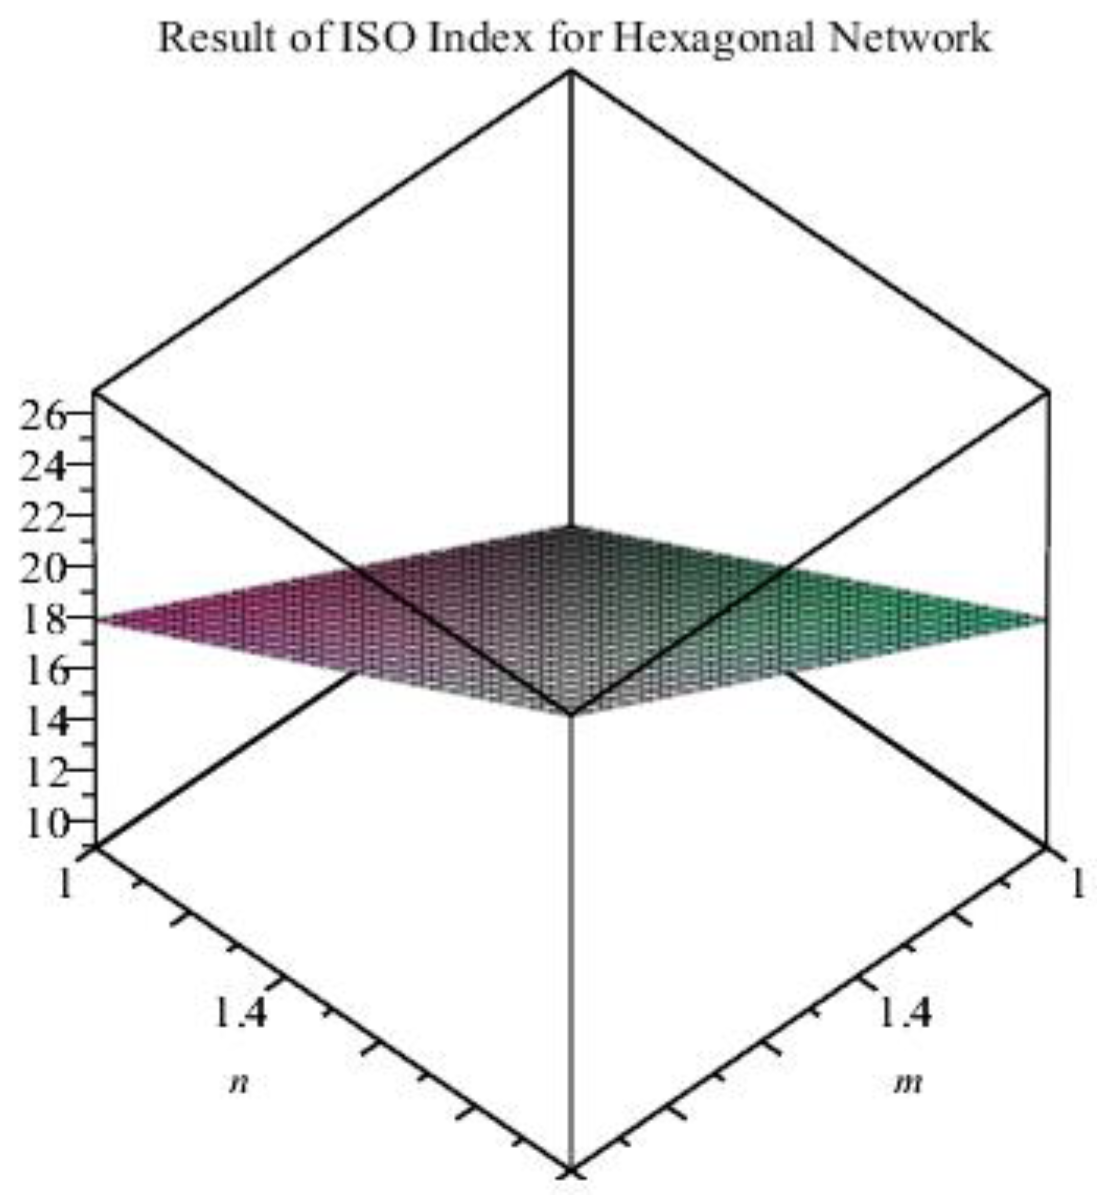
4.5. Main Results of Regular Hexagonal Cell Network
4.5.1. Regular Hexagonal Cells Network
4.5.2. Theorem 5
4.6. Main Results
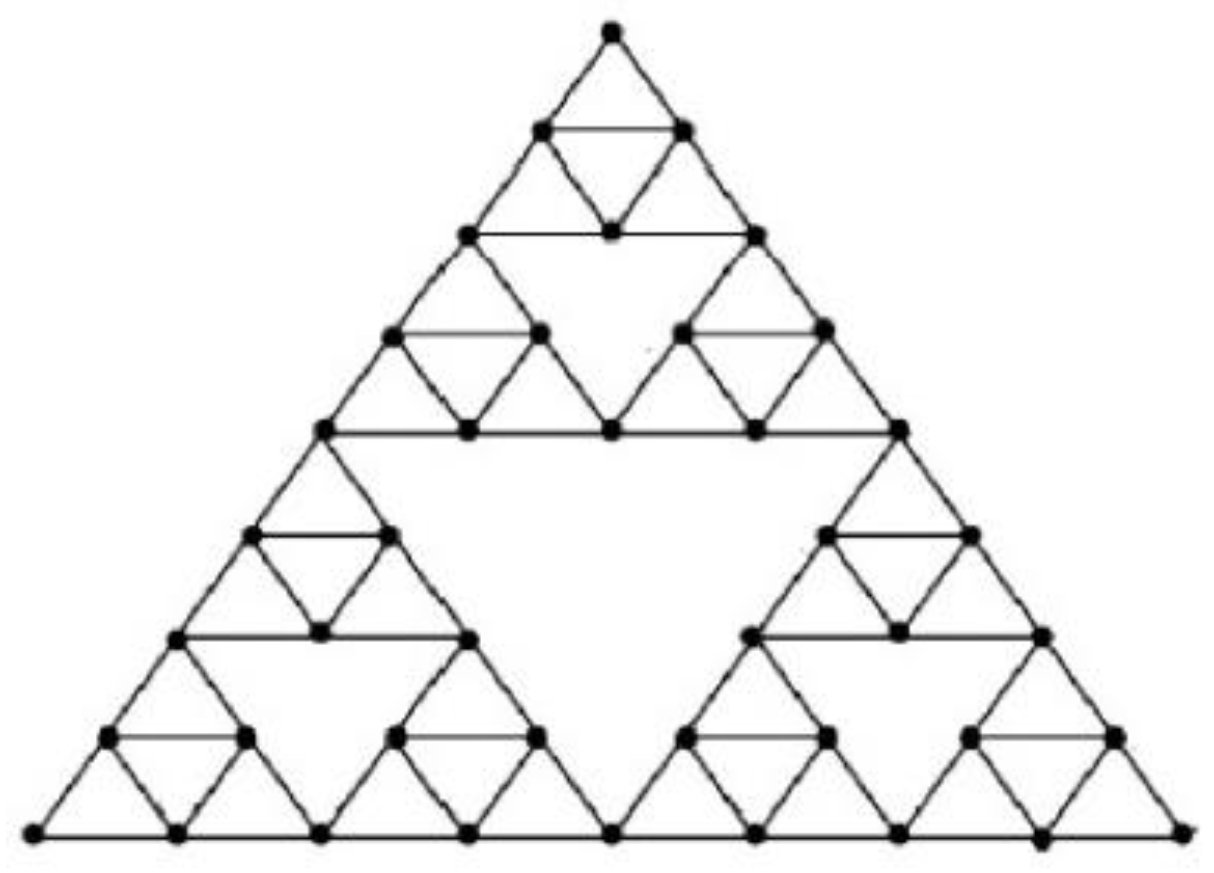
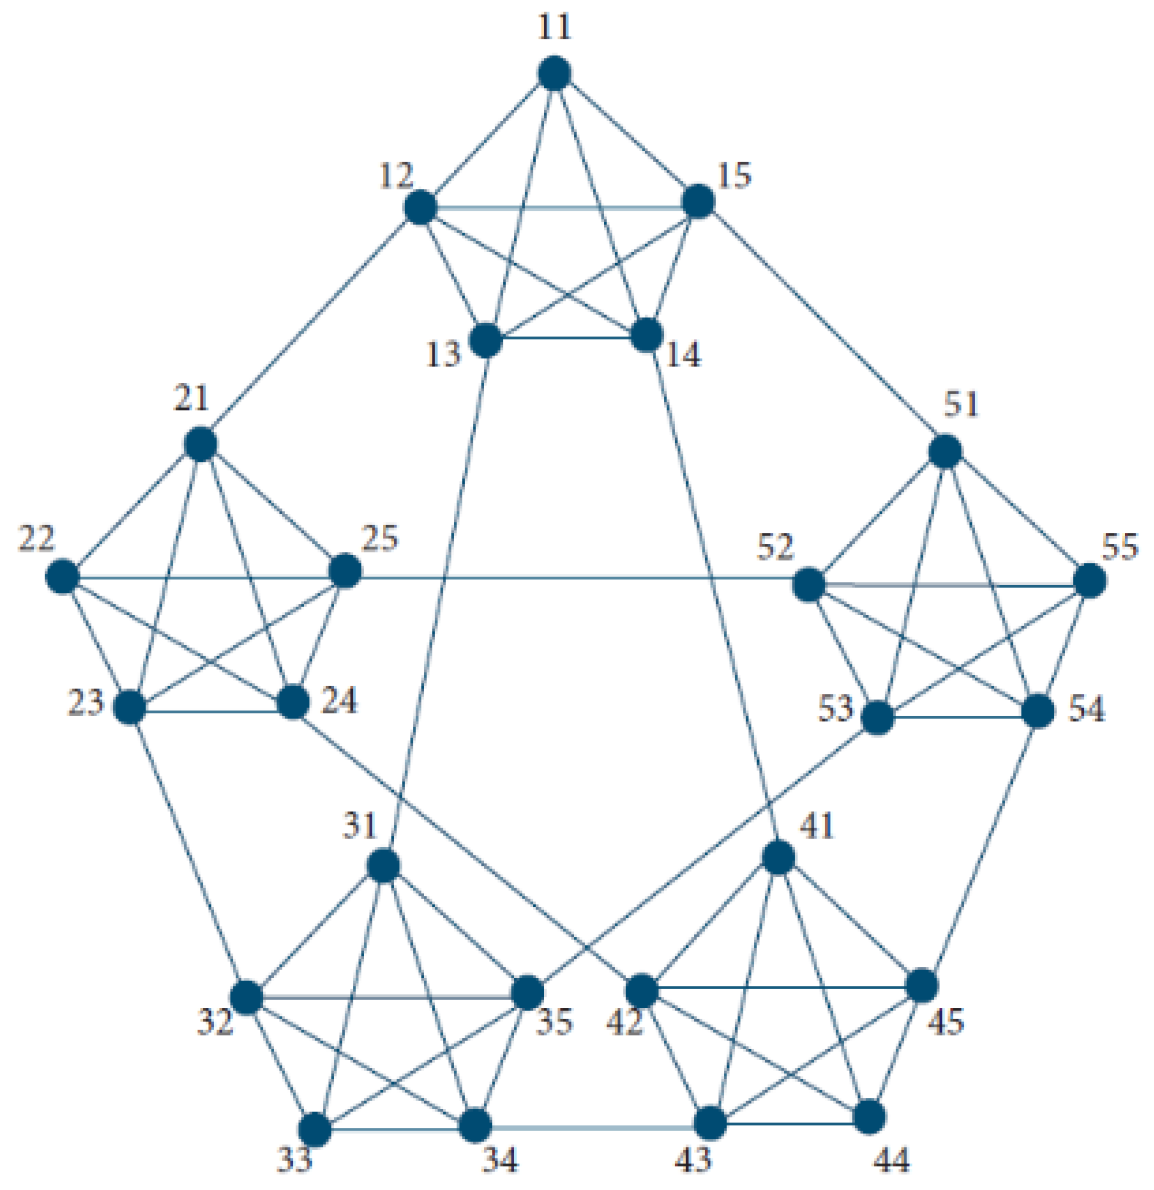
4.6.1. Sierpinski Network Graph
4.6.2. Theorem 6
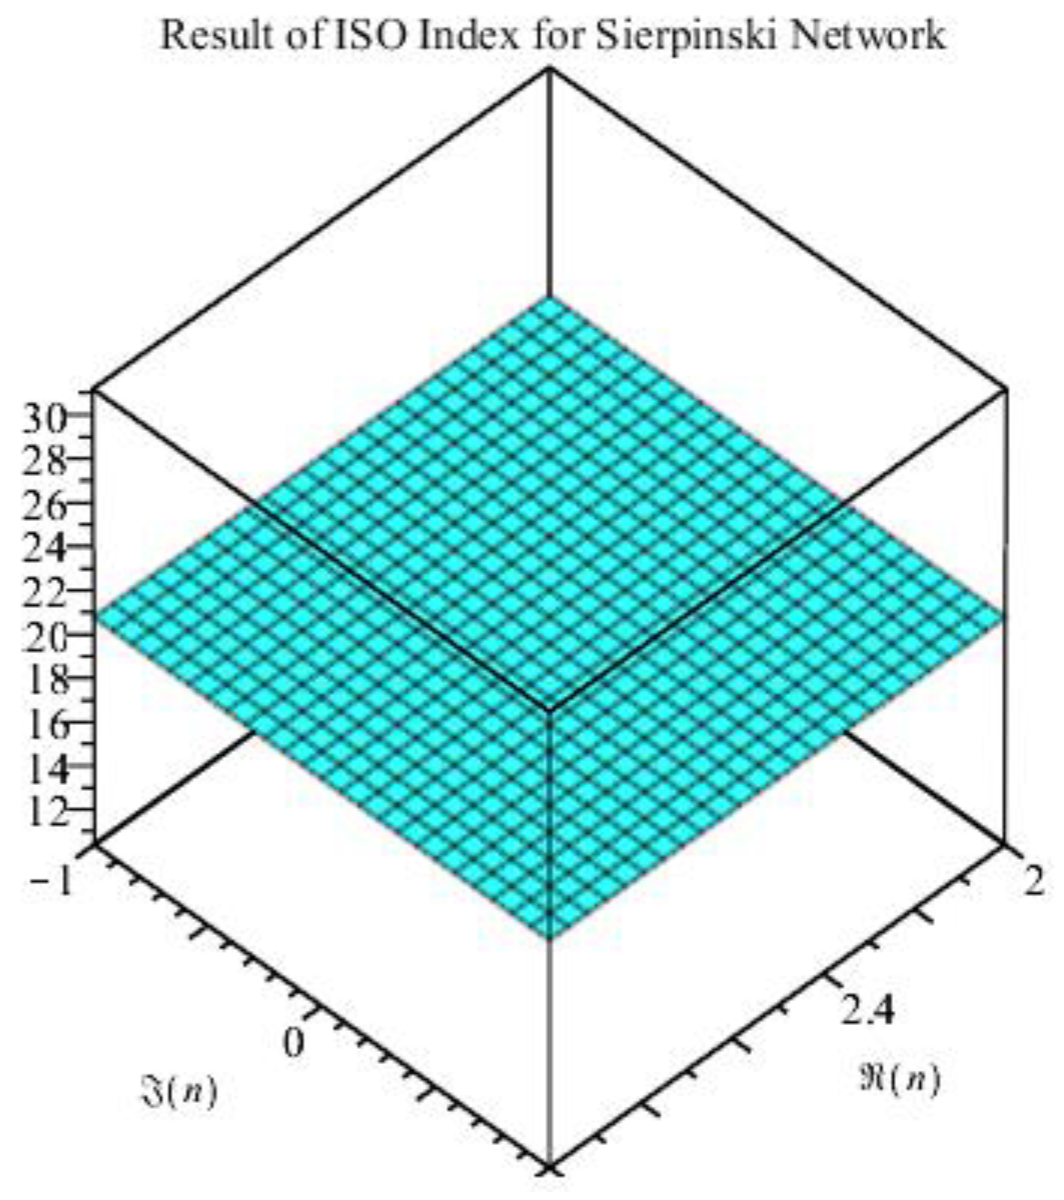
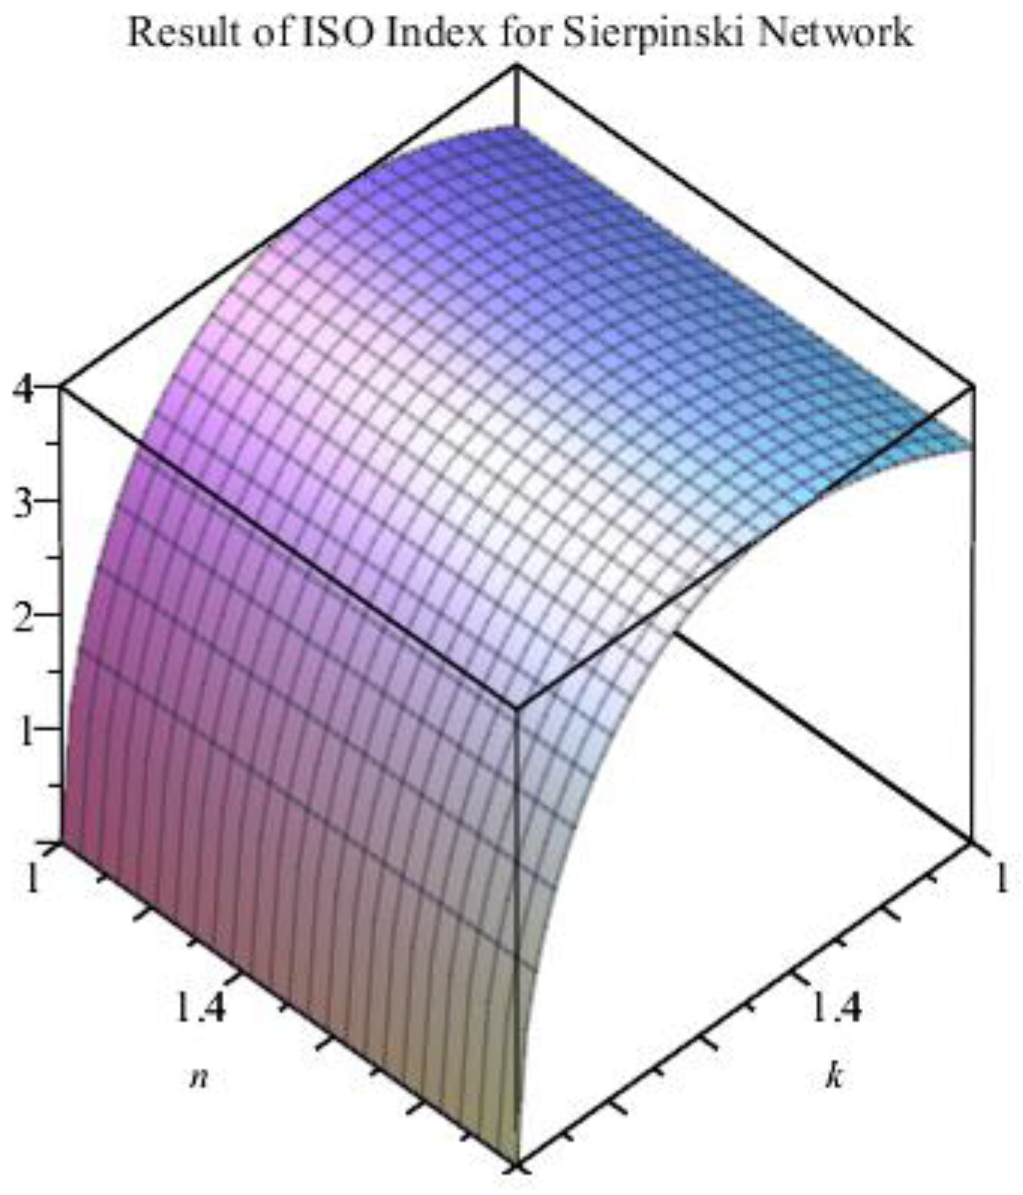
4.7. Main Results
4.7.1. Sierpinski Network S(n, k)
4.7.2. Theorem 7
5. Conclusions
Author Contributions
Funding
Acknowledgments
Conflicts of Interest
References
- Mansour, T.; Schork, M. The Vertex PI Index and Szeged Index of Bridge Graphs. Discret. Appl. Math. 2009, 157, 1600–1606. [Google Scholar] [CrossRef] [Green Version]
- Khalaf, A.J.M.; Farhan, M.; Siddiqui, M.; Farahani, M. On Degree Based Topological Indices of Bridge Graphs [547]. J. Discret. Math. Sci. Cryptogr. 2020, 23, 1139–1156. [Google Scholar] [CrossRef]
- Imran, M.; Sabeel-e-Hafi; Gao, W.; Reza Farahani, M. On Topological Properties of Sierpinski Networks. Chaos Solitons Fractals 2017, 98, 199–204. [Google Scholar] [CrossRef]
- Abbas, S.; Raza, Z.; Siddiqui, N.; Khan, F.; Whangbo, T. Edge Metric Dimension of Honeycomb and Hexagonal Networks for IoT. Comput. Mater. Contin. 2022, 2022, 023003. [Google Scholar] [CrossRef]
- Ahmad, M.; Javaid, M.; Bonyah, E.; Saeed, M. Comparative Analysis of Subdivided Hex-Derived Networks Using Structural Descriptors. J. Chem. 2022, 2022, e6502473. [Google Scholar] [CrossRef]
- Gutman, I. Some Basic Properties of Sombor Indices. Open J. Discret. Appl. Math. 2021, 4, 1–3. [Google Scholar] [CrossRef]
- Kulli, V. Contraharmonic quadratic index of certain nanostar dendrimers. Int. J. Math. 2022, 13, 1–7. [Google Scholar]
- Khalid, H.; Muhammad, I.; Abaid, U.; Muhammad, A.; Ahmed, A.; Adel, B.; Khalid, A. K-Banhatti Sombor Invariants of Certain Computer Networks. Comput. Mater. Contin. 2022, 73, 15. [Google Scholar]
- Zhong, J.F.; Rauf, A.; Naeem, M.; Rahman, J.; Aslam, A. Quantitative Structure-Property Relationships (QSPR) of Valency Based Topological Indices with Covid-19 Drugs and Application. Arab. J. Chem. 2021, 14, 103240. [Google Scholar] [CrossRef]
- Kiralj, R.; Ferreira, M. Basic validation procedures for regression models in QSAR and QSPR studies: Theory and application. J. Braz. Chem. Soc. 2021, 20, 770–787. [Google Scholar] [CrossRef] [Green Version]
- Yousaf, S.; Bhatti, A.A.; Ali, A. On Total Irregularity Index of Trees with given Number of Segments or Branching Vertices. Chaos Solitons Fractals 2022, 157, 111925. [Google Scholar] [CrossRef]
- Valle, M.E.; Francisco, S.; Granero, M.A.; Velasco-Forero, S. Irregularity Index for Vector-Valued Morphological Operators. J. Math. Imaging Vis. 2022, 1, 1007. [Google Scholar] [CrossRef]
- Munir, M.; Nazeer, W.; Shahzadi, Z.; Kang, S.M. Some Invariants of Circulant Graphs. Symmetry 2016, 8, 134. [Google Scholar] [CrossRef] [Green Version]
- Virk, A.U.R.; Rehman, M.A.; Nazeer, W. New Definition of Atomic Bond Connectivity Index to Overcome Deficiency of Structure Sensitivity and Abruptness in Existing Definition. Sci. Inq. Rev. 2019, 3, 01–20. [Google Scholar] [CrossRef]
- Hashmi, M.; Chaudhry, F.; Khalaf, A.J.M.; Farahani, M. Investigation of Dendrimer Structures by Means of Reverse Atomic Bond Connectivity Index. J. Discret. Math. Sci. Cryptogr. 2021, 24, 473–485. [Google Scholar] [CrossRef]
- Kwun, Y.C.; Virk, A.U.R.; Nazeer, W.; Rehman, M.A.; Kang, S.M. On the Multiplicative Degree-Based Topological Indices of Silicon-Carbon Si2C3-I[p,q] and Si2C3-II[p,q]. Symmetry 2018, 10, 320. [Google Scholar] [CrossRef] [Green Version]
- Virk, A.U.R. Multiplicative shingali and kanabour indices for bismuth tri-iodide. J. Prime Res. Math. 2020, 16, 80–88. [Google Scholar]
- Alsheekhhussain, Z.; Réti, T.; Ali, A. Weighted Graph Irregularity Indices Defined on the Vertex Set of a Graph. J. Math. 2022, 2022, e7834080. [Google Scholar] [CrossRef]
- Alrasheed, W.A.; Owayda, A.M.; Hajeer, M.Y.; Khattab, T.Z.; Almahdi, W.H. Validity and Reliability of Intraoral and Plaster Models’ Photographs in the Assessment of Little’s Irregularity Index, Tooth Size-Arch Length Discrepancy, and Bolton’s Analysis. Cureus 2022, 14, 23067. [Google Scholar] [CrossRef] [PubMed]
- Yousaf, S.; Bhatti, A.A. Maximum Total Irregularity Index of Some Families of Graph with Maximum Degree n − 1. Asian-Eur. J. Math. 2022, 15, 2250069. [Google Scholar] [CrossRef]
- Zhang, Q.; Munir, M.M.; Ahmad, H.; Liu, J.-B. Irregularity Molecular Descriptors of Cerium Oxide CeO2 Based on Mathematical Model and Calculation. Arab. J. Chem. 2022, 15, 103567. [Google Scholar] [CrossRef]
- Geneson, J.; Tsai, S.-F. Peripherality in Networks: Theory and Applications. J. Math. Chem. 2022, 60, 1021–1079. [Google Scholar] [CrossRef]
- Yurttaş Güneş, A.; Togan, M.; Demirci, M.; Cangül, İ.N. Inverse Problem for Albertson Irregularity Index. TWMS J. Appl. Eng. Math. 2022, 12, 662. [Google Scholar]
- Hamid, K.; Iqbal, M.; Arif, E.; Mahmood, Y.; Khan, A.; Kama, N.; Azmi, A.; Ikram, A. K-Banhatti Invariants Empowered Topological Investigation of Bridge Networks. Comput. Mater. Contin. 2022, 73, 5423–5440. [Google Scholar] [CrossRef]
- Radanliev, P.; De Roure, D. New and emerging forms of data and technologies: Literature and bibliometric review. Multimedia Tools Appl. 2022, 1–25. [Google Scholar] [CrossRef]
- Hamid, K.; Iqbal, M.W.; Ashraf, M.U.; Gardezi, A.A.; Ahmad, S.; Alqahtani, M.; Shafiq, M. Intelligent systems and photovoltaic cells empowered topologically by sudoku networks. Comput. Mater. Contin. 2023, 74, 4221–4238. [Google Scholar] [CrossRef]
- Alghamdi, A.M.; Hamid, K.; Iqbal, M.; Ashraf, U.; Alshahrani, A.; Alshamrani, A. Topological evaluation of certain computer networks by contraharmonic-quadratic indices. Comput. Mater. Contin. 2023, 74, 3795–3810. [Google Scholar] [CrossRef]
- Wan, B.-F.; Zhou, Z.-W.; Xu, Y.; Zhang, H.-F. A Theoretical Proposal for a Refractive Index and Angle Sensor Based on One-Dimensional Photonic Crystals. IEEE Sens. J. 2021, 21, 331–338. [Google Scholar] [CrossRef]
- Hamid, K.; Iqbal, M.w.; Muhammad, H.; Fuzail, Z.; Nazir, Z. Topological Analysis Empowered Bridge Network Variants by Dharwad Indices. Jilin Daxue Xuebao (Gongcheng Jishuban)/J. Jilin Univ. (Eng. Technol. Ed.) 2022, 41, 53–67. [Google Scholar]


| Sr. No. | Title of Research Paper | Year | Networks Solved | Invariants Used | Results |
|---|---|---|---|---|---|
| 1 | Topological Properties Of Degree-Based Invariants Via M-Polynomial Approach | 2022 | Hexagonal Networks | Zagreb Indices, Randi’C, Product Connectivity Gourava Index and their Forms | Give valuable information about the molecular structure or network and applications in QSPR & QSAR. |
| 2 | Contraharmonic Quadratic Index Of Certain Nanostar Dendrimers | 2022 | Dendrimer Nanostars | Contraharmonic-Quadratic Index and Quadratic-Contraharmonic Index | computed the CQ index for some standard graphs |
| 3 | Some Results On The Sombor Indices of Graphs | 2021 | Degree-Regular Graph/Network | The Sombor Index, The Reduced Sombor Index and the Average Sombor Index | Establishing inequalities related to the aforementioned three graph invariants and proving a recently proposed conjecture concerning the sombor index |
| 4 | Some Basic Properties of Sombor Indices | 2021 | Regular Graph or Network | Vertex-Degree-Based (VDB) Molecular Structure Descriptors (Sombor Index and its Reduced Form) | Any reduced VDB index can be viewed as a reduced sombor-type index |
| 5 | Analysis Of Dendrimer Generation By Sombor Indices | 2021 | Dendrimers Generation Networks | Sombor Index and Reduced Sombor Index | Computed sombor indices for phosphorus-containing dendrimers & types of dendrimers. |
| 6 | Sombor Index of Some Nanostructures | 2021 | Nanostructures | Sombor Index | Computed explicit formulae for sombor index of 2D-lattice, nanotube, and nanotorus |
| 7 | Polynomials And General Degree-Based Topological Indices of Generalized Sierpinski Networks | 2021 | Sierpinski Networks | Connectivity Polynomials Such As m-Polynomial, Zagreb Polynomials, Forgotten Polynomial, (A, Β)-Zagreb Index and Several Other General Indices | These facts can be Physicochemical properties of the molecules modeled on the S(k, n) networks can be forecasted using the results. |
| 8 | The Calculations of Topological Indices on Certain Networks | 2021 | Hexagonal Networks | ABC Index, AZI Index, GA Index, The Multiplicative Version Of Ordinary First Zagreb Index, The Second Multiplicative Zagreb Index, and Zagreb Index | Calculating the correlation index provides potential help for scholars to study networks characteristics better. for further work, if the corresponding networks are replaced by other networks |
| 9 | Discovering Irregularities from Computer Networks by Topological Mapping | 2022 | Bridge Networs, Hexagonal Networks, Honeycomb Networks and Sierpinski Networks | Irregularity Sombor Index | Finding Sharp upper bounds, lower bounds and irregularities |
| ε | ε(du, dv) | de | ε(du, de) | Recurrence |
|---|---|---|---|---|
| ε1 | ε(1, 2) | 1 | ε(1, 1) | R |
| ε2 | ε(2, 2) | 2 | ε(2, 2) | 3r + 2 |
| ε3 | ε(2, 3) | 3 | ε(2, 3) | R |
| ε4 | ε(3, 3) | 4 | ε(3, 4) | r − 3 |
| ε | ε(du, dv) | de | ε(du, de) | Recurrence |
|---|---|---|---|---|
| ε1 | ε(2, 2) | 2 | ε(2, 2) | rs − 2r |
| ε2 | ε(2, 3) | 3 | ε(2, 3) | 4 |
| ε3 | ε(2, 4) | 4 | ε(2, 4) | 2r − 4 |
| ε4 | ε(3, 4) | 5 | ε(3, 5) | 2 |
| ε5 | ε(4, 4) | 6 | ε(4, 6) | r − 3 |
| ε | ε(du, dv) | De | ε(du, de) | Recurrence |
|---|---|---|---|---|
| ε1 | ε(4, 5) | 7 | ε(4, 7) | 2 |
| ε2 | ε(4, S−1) | S + 1 | ε(4, s+1) | 2 |
| ε3 | ε(5, 5) | 8 | ε(5, 8) | r − 2 |
| ε4 | ε(5, S−1) | S + 2 | ε(5, s+2) | r − 2 |
| ε5 | ε(S−1, S−1) | 2s − 4 | ε(s−1, 2s−4) | [rs(r − 1) − 2(r + 1)]/2 |
| Ε | ε(du, dv) | de | ε(du, de) | Recurrence |
|---|---|---|---|---|
| ε1 | ε(5, 5) | 8 | ε(5, 8) | 6 |
| ε2 | ε(5, 7) | 10 | ε(5,10) | 12(n − 1) |
| ε3 | ε(7, 9) | 14 | ε(7, 14) | 6(n − 1) |
| ε4 | ε(9, 9) | 16 | ε(9, 16) | 9n2 − 21n + 12 |
| Ε | ε(du, dv) | de | ε(du, de) | Recurrence |
|---|---|---|---|---|
| ε1 | ε(2, 2) | 2 | ε(2, 2) | 2n + 4 |
| ε2 | ε(2, 3) | 3 | ε(2, 3) | 4m + 4n + 4 |
| ε3 | ε(3,3) | 4 | ε(3, 4) | 6 mn + m − 5n − 4 |
| Ε | ε(du, dv) | De | ε(du, de) | Recurrence |
|---|---|---|---|---|
| ε1 | ε(2, 4) | 4 | ε(2, 4) | 6 |
| ε2 | ε(4, 4) | 6 | ε(4, 6) | 3n − 6 |
| ε | ε(du, dv) | De | ε(du, de) | Recurrence |
|---|---|---|---|---|
| ε1 | ε(2, k) | k | ε(2, k) | 2k |
| ε2 | ε(3, 3) | 4 | ε(3, 4) | (kn+1 − 5k)/2 |
Publisher’s Note: MDPI stays neutral with regard to jurisdictional claims in published maps and institutional affiliations. |
© 2022 by the authors. Licensee MDPI, Basel, Switzerland. This article is an open access article distributed under the terms and conditions of the Creative Commons Attribution (CC BY) license (https://creativecommons.org/licenses/by/4.0/).
Share and Cite
Hamid, K.; Waseem Iqbal, M.; Abbas, Q.; Arif, M.; Brezulianu, A.; Geman, O. Discovering Irregularities from Computer Networks by Topological Mapping. Appl. Sci. 2022, 12, 12051. https://doi.org/10.3390/app122312051
Hamid K, Waseem Iqbal M, Abbas Q, Arif M, Brezulianu A, Geman O. Discovering Irregularities from Computer Networks by Topological Mapping. Applied Sciences. 2022; 12(23):12051. https://doi.org/10.3390/app122312051
Chicago/Turabian StyleHamid, Khalid, Muhammad Waseem Iqbal, Qaiser Abbas, Muhammad Arif, Adrian Brezulianu, and Oana Geman. 2022. "Discovering Irregularities from Computer Networks by Topological Mapping" Applied Sciences 12, no. 23: 12051. https://doi.org/10.3390/app122312051