1. Introduction
In software industries, the employee churn rate is approximately 12–15% [
1]. This percentile shows that the churn rate is prominent in IT industries and cannot be considered good for the industry. When an employee leaves a recognized job, there will be a problem for the organizations as they will have to discover a new valuable employee as a potential replacement. Companies will face various problems when an employee leaves the job, such as salaries, training costs of the new employee, and environment, etc. [
1]. Employees are valuable assets to an organization. When a software company wants to lower the churn rate, it needs to analyze the churn factors and understand the reasons. Some organizations provide researchers with facilities to examine the turnover pattern from their HR data [
2]. The researchers present their conclusion that the sustainability of employees is a challenging job for the companies, because nowadays, more worthy employees are tempted globally by other organizations [
3]. Software companies are growing fast, but on the same side, various researchers have conducted online surveys to examine the churn rate, which comes towards 20.78%, which is relatively high. Attrition means when an employee leaves the job for personal reasons and immediately moves from one organization to another. There are two types of employee turnover, the first type is involuntary, where employees retire or are fired by the companies, and the second type is voluntary, where employees leave their job due to their own personal matters [
4].
Most organizations are focused on voluntary turnover where an employee left the job deliberately. It could be expensive for organizations for the reason that finding a new worthy employee is time-consuming. Different features affect employee churn, such as workload, working conditions, salary, job experience, and job satisfaction level [
5]. In order to maintain the churn rate in the organization, the company owners need to build trust and emotional safety with each employee. They are more inclined to perform and behave responsibly and to be eager to share their knowledge with coworkers if they have confidence in their leaders and fellow employees. The importance of emotions must be recognized by business leaders. Leaders need to have a certain level of emotional intelligence to notice and comprehend their employees’ feelings in order to recognize this. Employees in the company must have emotional intelligence, particularly when working together on activities that call for it. The development of emotional intelligence helps to make interpersonal relationships better [
6]. The global COVID-19 pandemic [
7], which has been going on for two years, has had a significant impact on the current situation. The economics of several nations are being affected globally by this pandemic. Even at the start of the pandemic, the forecasts were unduly pessimistic; some even anticipated a worse economic disaster than in 2009. Since the pandemic’s start, many people have lost their employment, particularly in industrial areas. The world was governed by a coronavirus pandemic in 2020, making it a unique year for the EU economy. The study presented in this paper aims to find the most important features that affect employee churn, and after the churn analysis, we have built a prediction model that predicts the organizations’ churners. At the end of this research, a risk model is also developed for further classification of those employees who have not left. With all this, we achieved our goal of performing statistical analysis by using four EDA techniques and then implementing five ML algorithms. Moreover, a comparison is made between our predictive models with the recursive feature elimination (RFE)-based model to present the effectiveness of this research.
The main contributions of the proposed approach include:
A novel IoT-enabled technique to predict employee churn in the software industry.
An effective risk model development to identify the potential risk of churners.
A novel statistical analysis approach using EDA towards employee churner.
The rest of the paper is written in such a way that
Section 2 discusses related work,
Section 3 elaborates on the detailed methodology of our proposed approach,
Section 4 presents the results of the prediction model and
Section 5 consists of the scientific evaluation of the findings with other methods.
Section 6 discusses the risk model for future churn, followed by the conclusion in
Section 7.
2. Related Work
Nowadays, in order to assess the employee performances in organizations, organizations are considering reward schemes. This related work highlights the idea that if the organization offered a smaller number of rewards schemes, it would be difficult to retain employees. A study conducted an online survey for collecting the data from companies; they applied regression and correlation statistical methods on survey data to obtain the essential facts for the IT sectors [
3]. They identify the essential features that contribute to employee turnover using the SPSS tool. In order to analyze churn factors, they conducted an online survey which is based on a questionnaire. Organizational commitment is a hidden relationship between organizations and employees. To sustain the skilled employees in a company, the most crucial role is that of managers. Their study has three organizational commitments, and they applied mathematical methods for determining the hidden relation between organizational commitment and intention of employee turnover. This related study helps HR managers take proactive steps and create good employee policies [
4]. Another related study determines the essential factors as satisfaction level, workload, and career opportunity. It also suggests that by providing a friendly atmosphere, low burden of work, and increased career opportunities, there will be increased employee retention and a decrease in the churn rate. They also recommend that salaries are not a practical tool to hold employees in organizations [
5]. Some of the analytical approaches applied in this area are presented below.
Data Mining Techniques for Predicting Employee Turnover
The research mentioned in [
8] aims to avoid this negative impact; therefore, their study builds the prediction model to predict future churners. For the comparison and evaluation of algorithms, the research implements the three algorithms and compares them. Employee churn is a severe problem in organizations. If the organization needs economic benefit, then there is a need to minimize attrition. This related research recognizes employees’ related attributes that affect the churn rate. They take a dataset from the higher institutions of Nigeria, and the dataset consists of 309 records of employees. They have applied two methodologies; one is the decision tree, and the other is rule sets for creating the employee churn model [
9].
To identify the most impactful features that affect the employee churn, the researchers in [
10] have used the EDA technique, which is recursive feature elimination, and they have used the HR dataset with 34 features that are openly available on the Kaggle website. This feature selection technique recursively selects the features and evaluates the model accuracy; therefore, this EDA technique takes time to select the most impactful features. After using the EDA technique, their work implements the six classification algorithms with best-selected features from the HR dataset and compares the algorithms’ results. Their objective was to analyze the algorithm results with and without selected features. Researchers in [
11] have used a visual-based EDA technique that shows the statistics about HR data taken from the Kaggle website to find an essential factor. They performed EDA using python libraries and generated a correlation matrix and histogram, which is used to show employee feature relations with output features. After analyzing the employee features, they implemented five classification algorithms and compared the ML algorithms’ results for predicting future churners. In another related study [
12], the authors only developed an employee prediction model using five classification algorithms, which were SVM, random decision forest, logistic regression, naïve Bayes, and decision tree.
Several types of research have been conducted to identify the most influential features that affect employee churn [
13]. Some of the statistical techniques used are not computationally efficient because these techniques are based on model accuracy [
14]. In contrast, some statistical techniques are visually based that show the graphical representations of employee input features with output features, and that type of technique requires time for performing analysis [
15]. For this reason, it is necessary to apply those techniques that will not rely on model accuracy and should not take a long time for factor analysis [
16]. To achieve this, we have used a filter-based method that does not affect model accuracy computationally, and through this, we can quickly analyze factors without taking a long time. Our motivation is to select top-ranked features for the identification of the essential churn features. It is observed broadly that the EDA-based machine learning model is beneficial for the software industry.
3. Methodology
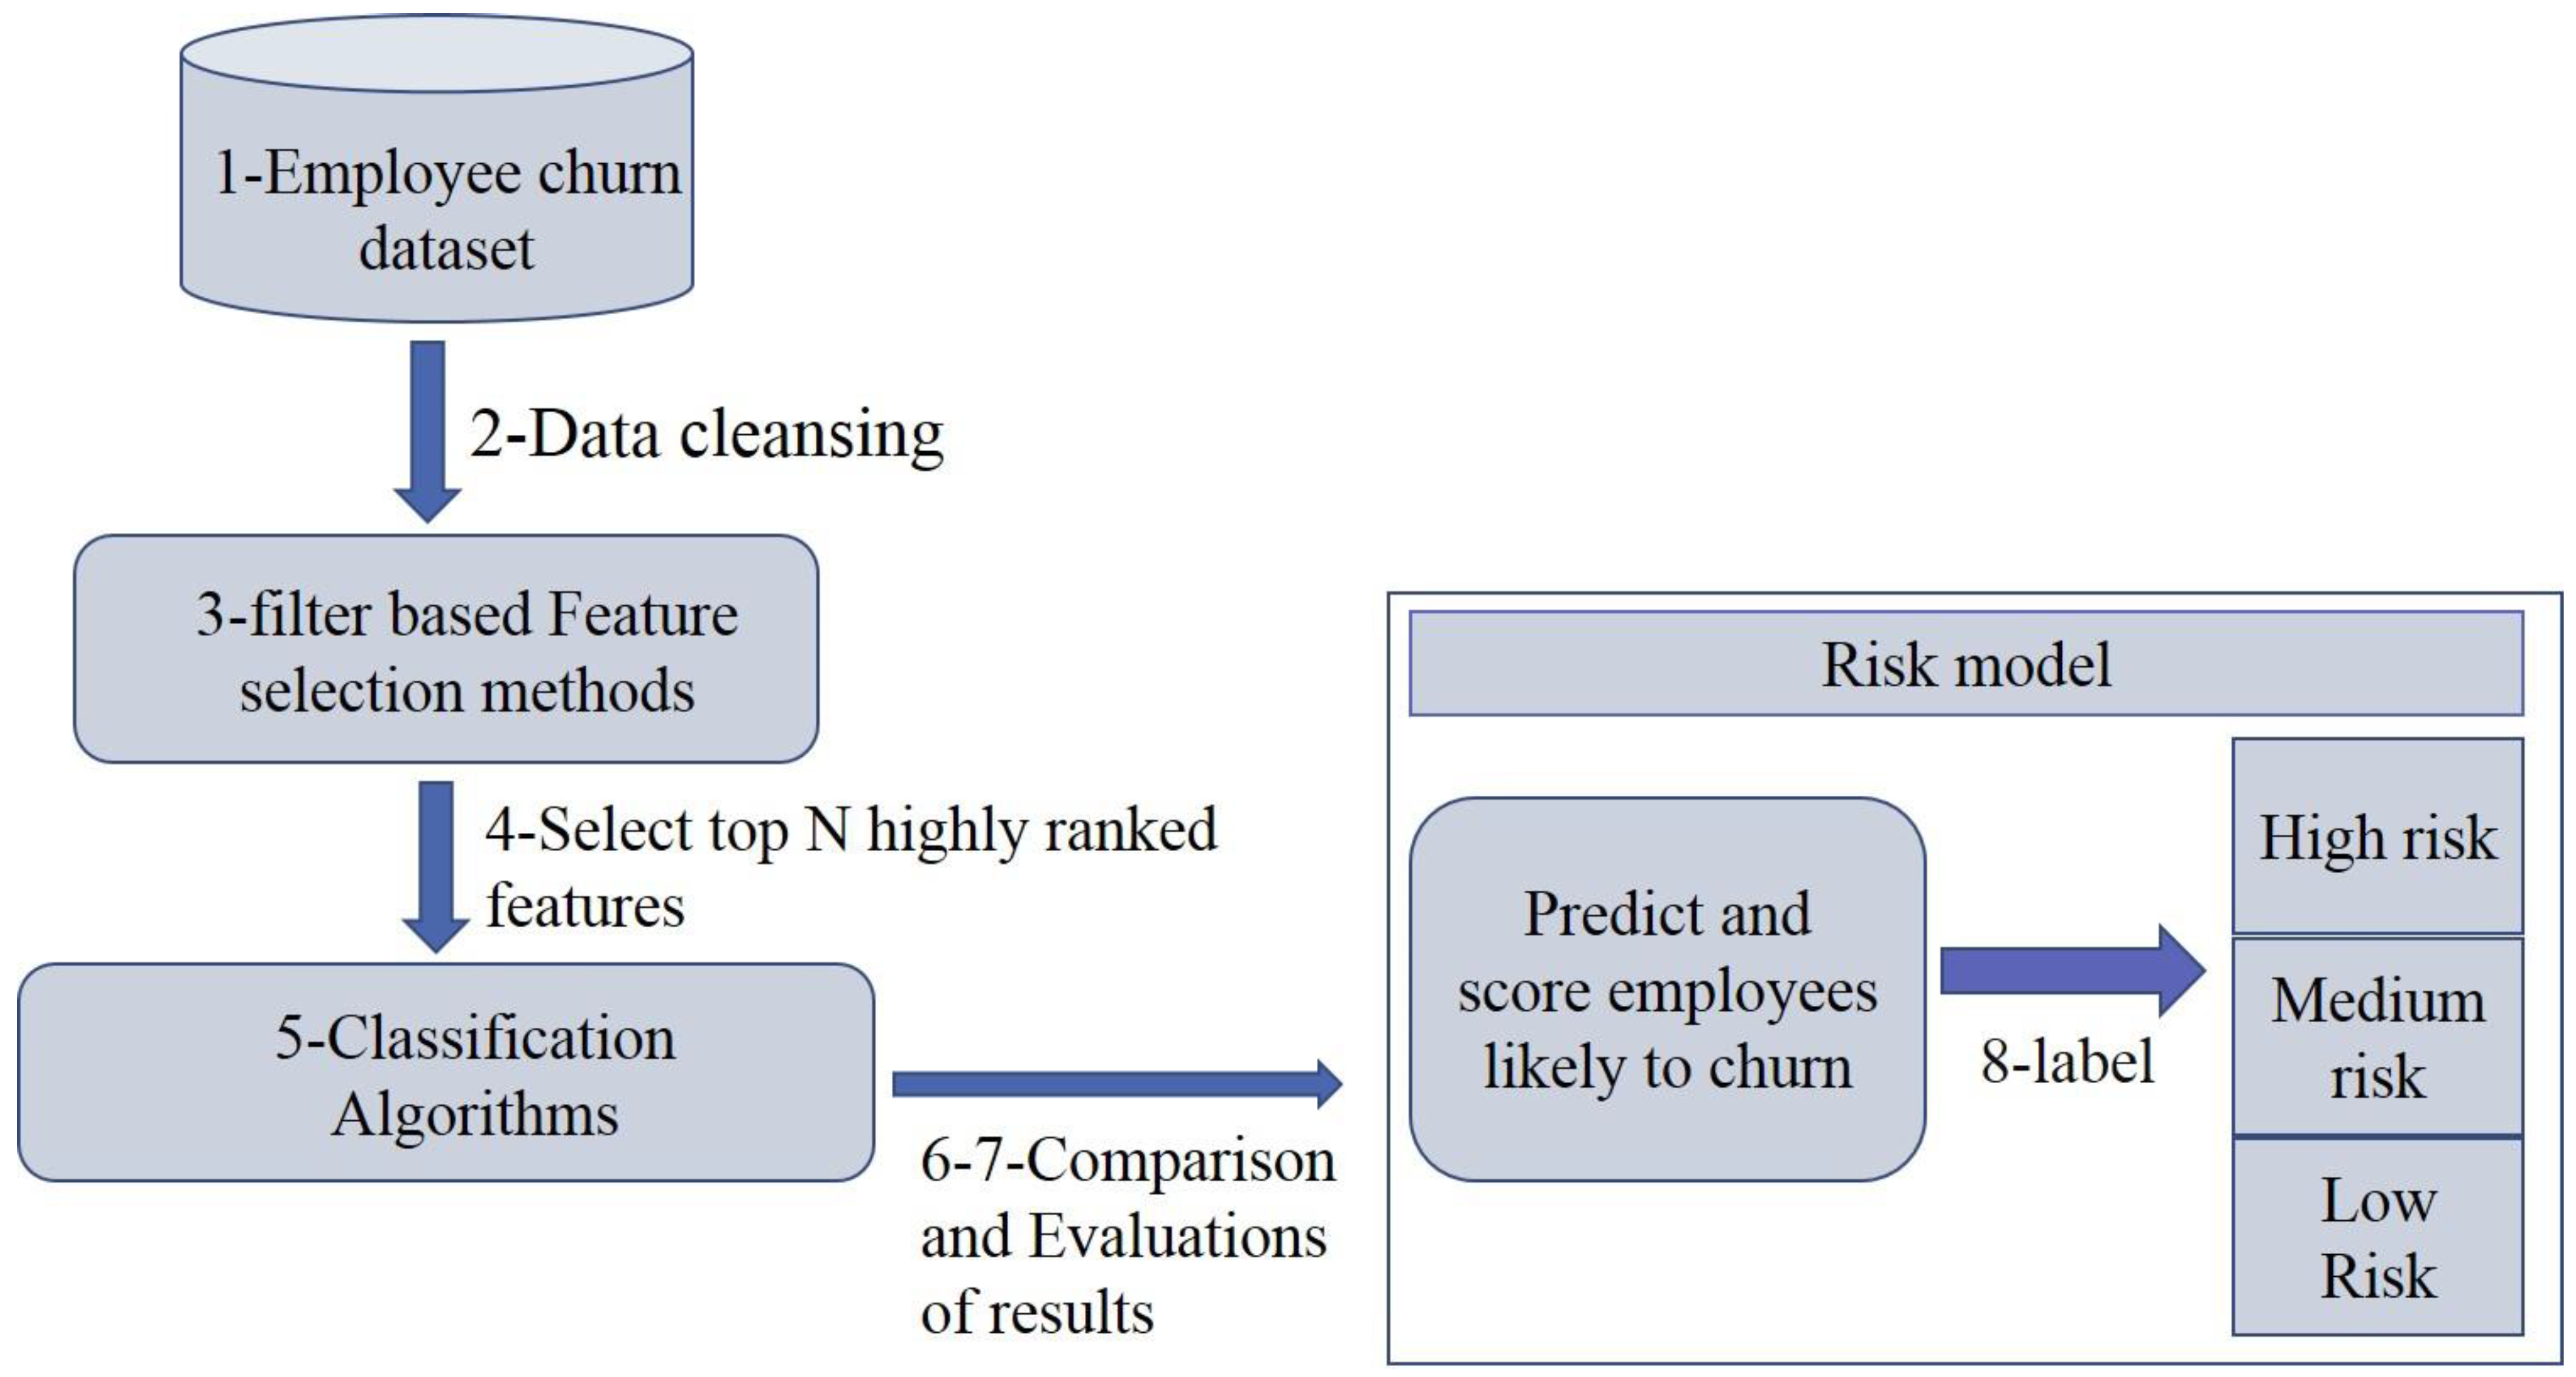
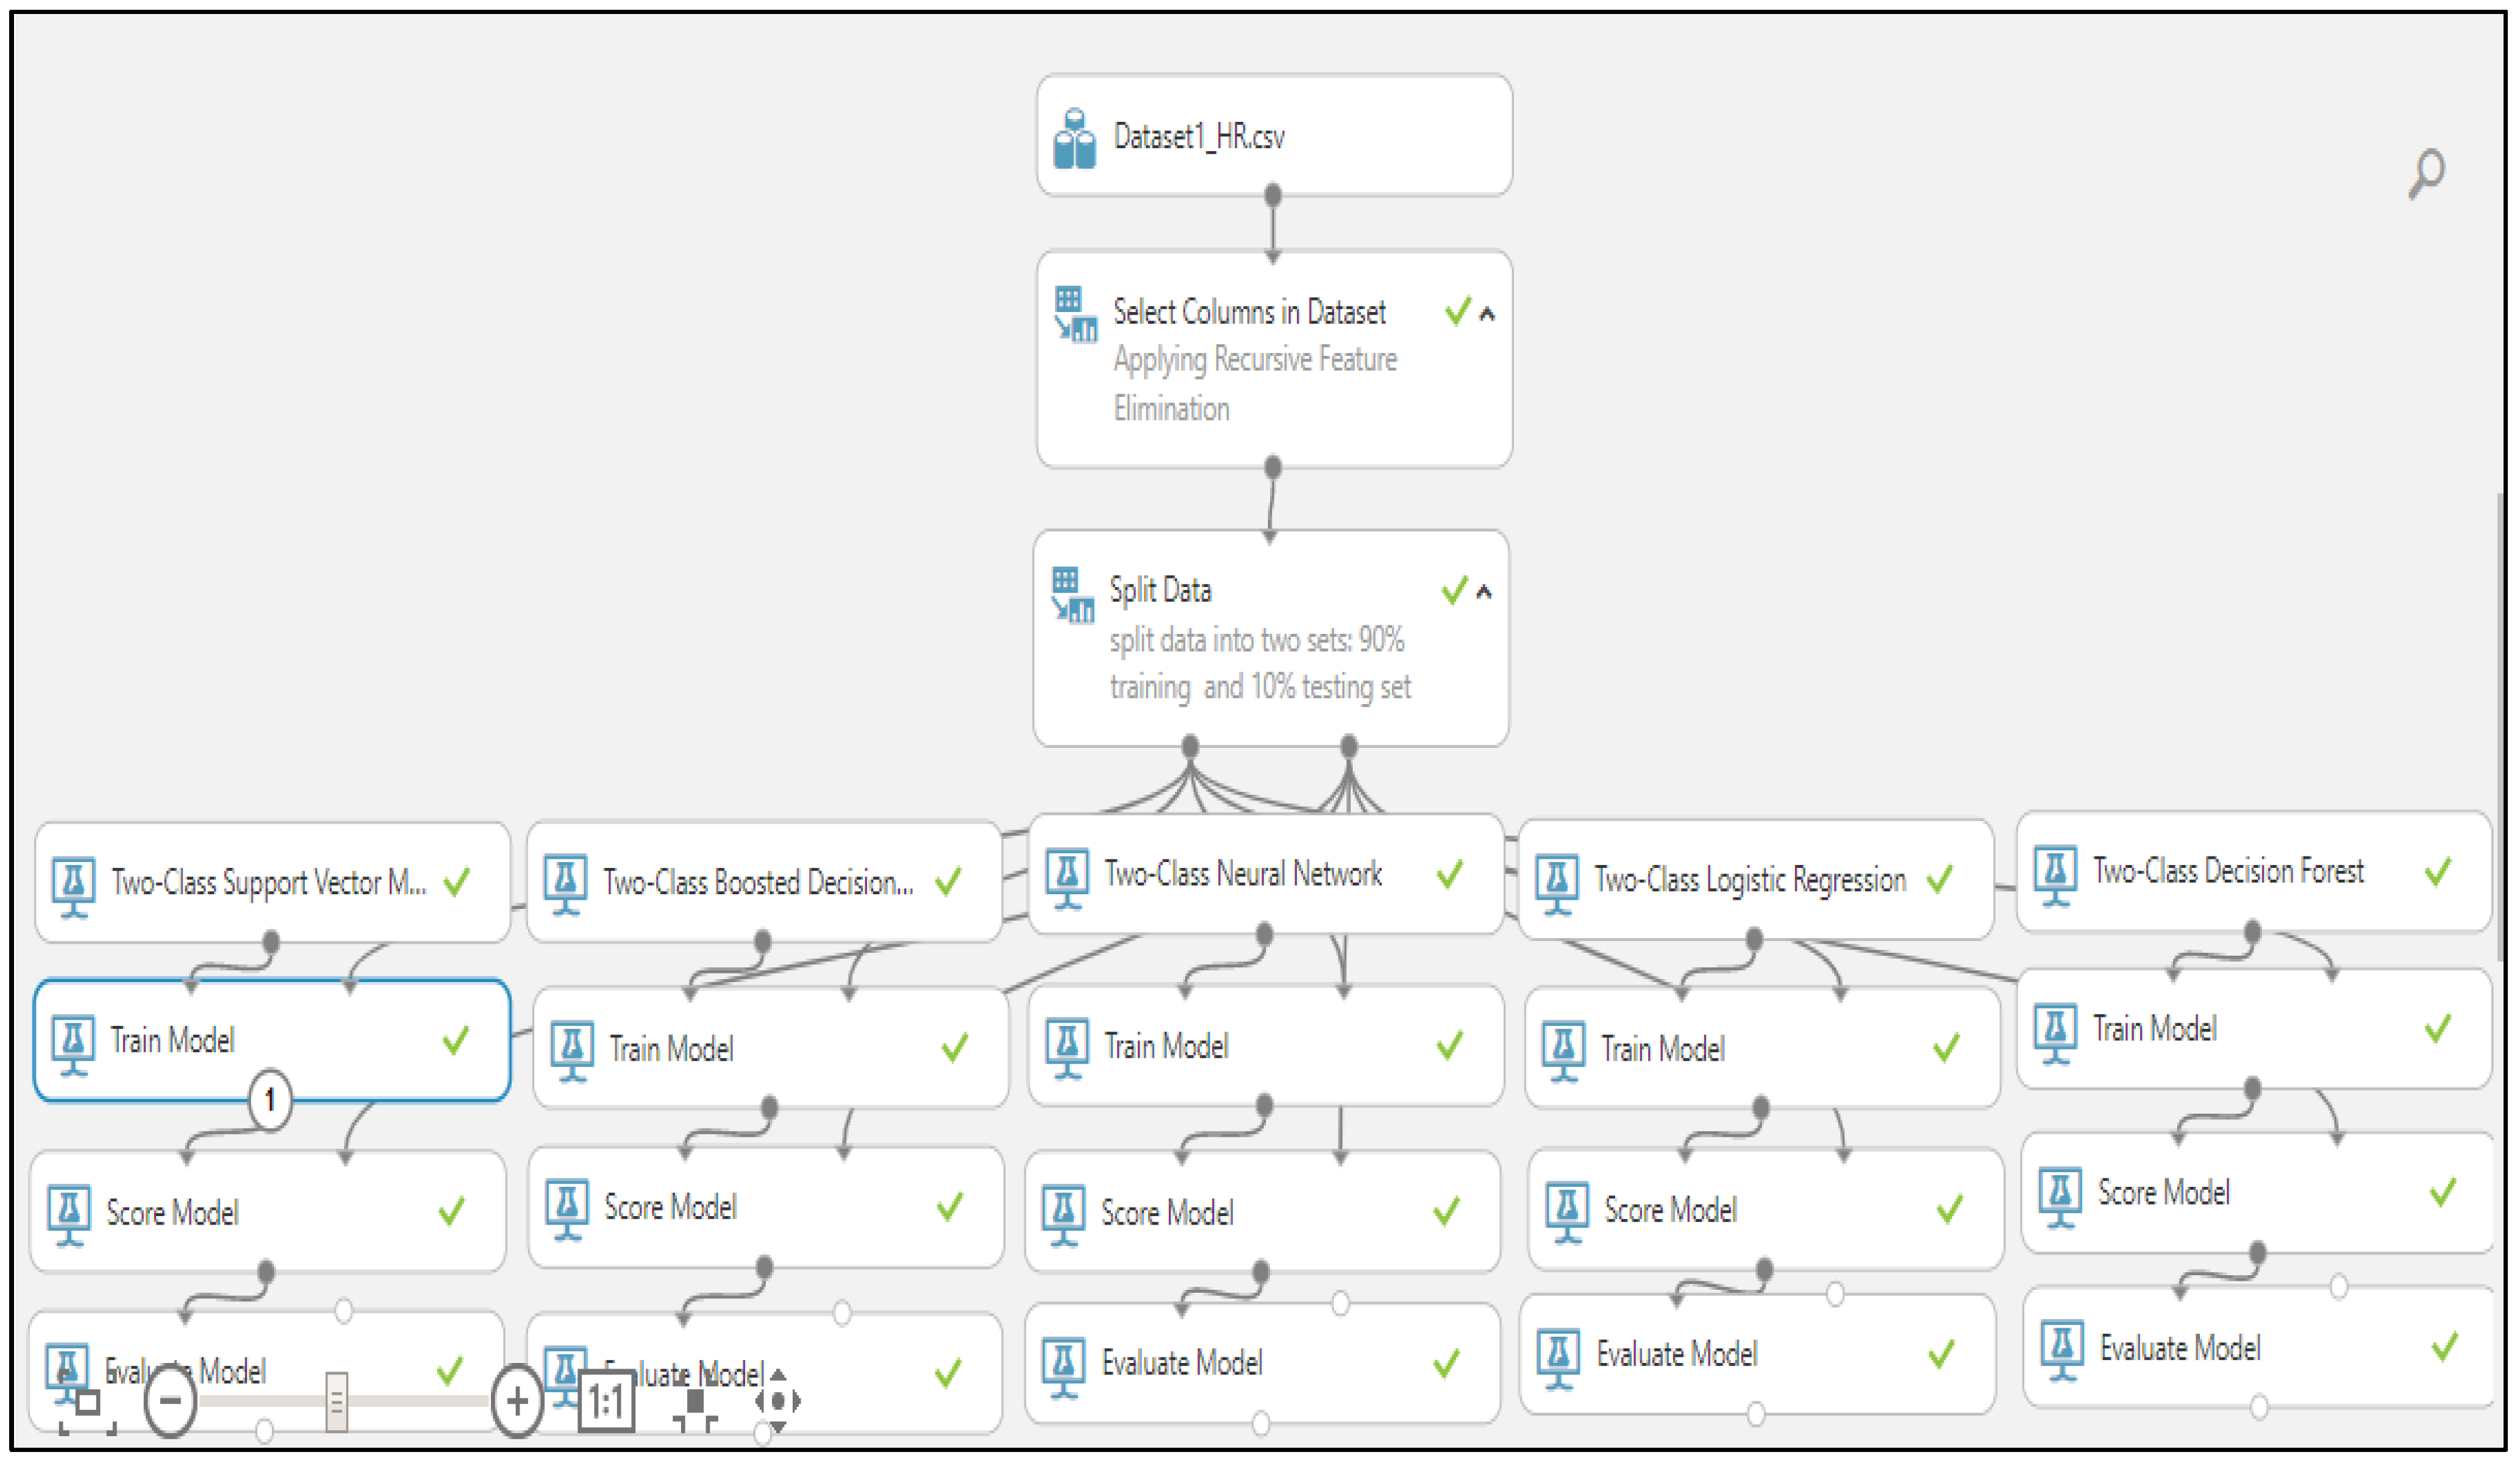
Figure 1, below, demonstrates the methodology adopted in this study. The individual steps are discussed as follows:
We have used an employee churn analytics HR dataset that consists of both types of employees, churn and non-churn.
Data selection and preprocessing are performed in the second step.
In the third step, we have used four filter-based methods.
We have selected the top N highest-ranking variables from these four methods.
After selecting the top features, this research applies five ML algorithms.
Next, we compared the performance parameters (accuracy, precision and recall) of five ML algorithms and evaluated the classification results after splitting the dataset into different ratios with N-ranked features.
We chose the best algorithm with a filter-based method for building the risk model.
Finally, we created a risk model for non-churn employees in order to further classify them into the different risk zones.
3.1. Data Mining Techniques for Predicting Employee Turnover
This research has taken the HR dataset obtained from the Kaggle website [
17], and this dataset contains 14,999 records of employees. This HR dataset consists of ten features; some features are categorical by nature, and some are numeric [
18]. These HR dataset attributes are categorized into three types: employment, job-related, and organizational factors as mentioned in
Table 1 [
19]. There is one output attribute in the dataset: “0” and “1”, where 0 is a label for those employees who left the organization, and 1 is a label for those employees who are currently doing their job in the organization.
3.2. Exploratory Data Analysis
In exploratory data analysis, most of the techniques are used to extract the most important attributes or features from the given dataset [
20]. In EDA, feature selection techniques are widely applied to datasets to identify the most relevant attributes, and these statistical techniques are also used to enhance the accuracy of models. If the dataset consists of many irrelevant features, then the situation exponentially increases the ML algorithms’ training time and the risk of overfitting.
3.3. Filter-Based Feature Selection Methods
When building multiple prediction models with various train data subsets, feature selection methods can be used to identify the features that are and are not relevant for building dependable and accurate models [
10]. The evaluation metric for feature selection in filter methods is feature ranking. Typically, the scores of various statistical tests for a feature’s correlation with the class are used to rank it. Features that score below a predetermined cutoff are eliminated, while those that score above are chosen. A subset of features can then be supplied as input to the classifier algorithm of choice. Contrary to wrapper and embedded feature selection techniques, filter techniques operate independently of the classifier process [
21]. This research applies the four filter-based methods: (i) fisher score, (ii) chi-squared, (iii) Spearman correlation, and (iv) R coefficient correlation for conducting the statistical analysis [
22,
23,
24,
25]. These methods have individual criteria to compute a score for every attribute inside the dataset, and we obtained the attributes in order. This research selects the top five highly ranked attributes and removed the lower-ranked features.
3.4. Split Data
In this research, we have implemented the five ML algorithms for predicting the future churners in organizations [
26]. In order to evaluate the results of these algorithms, we split the dataset into four various testing and training parts.
60% train1 and 40% test1
70% train2 and 30% test2
80% train3 and 20% test3
90% train4 and 10% test4
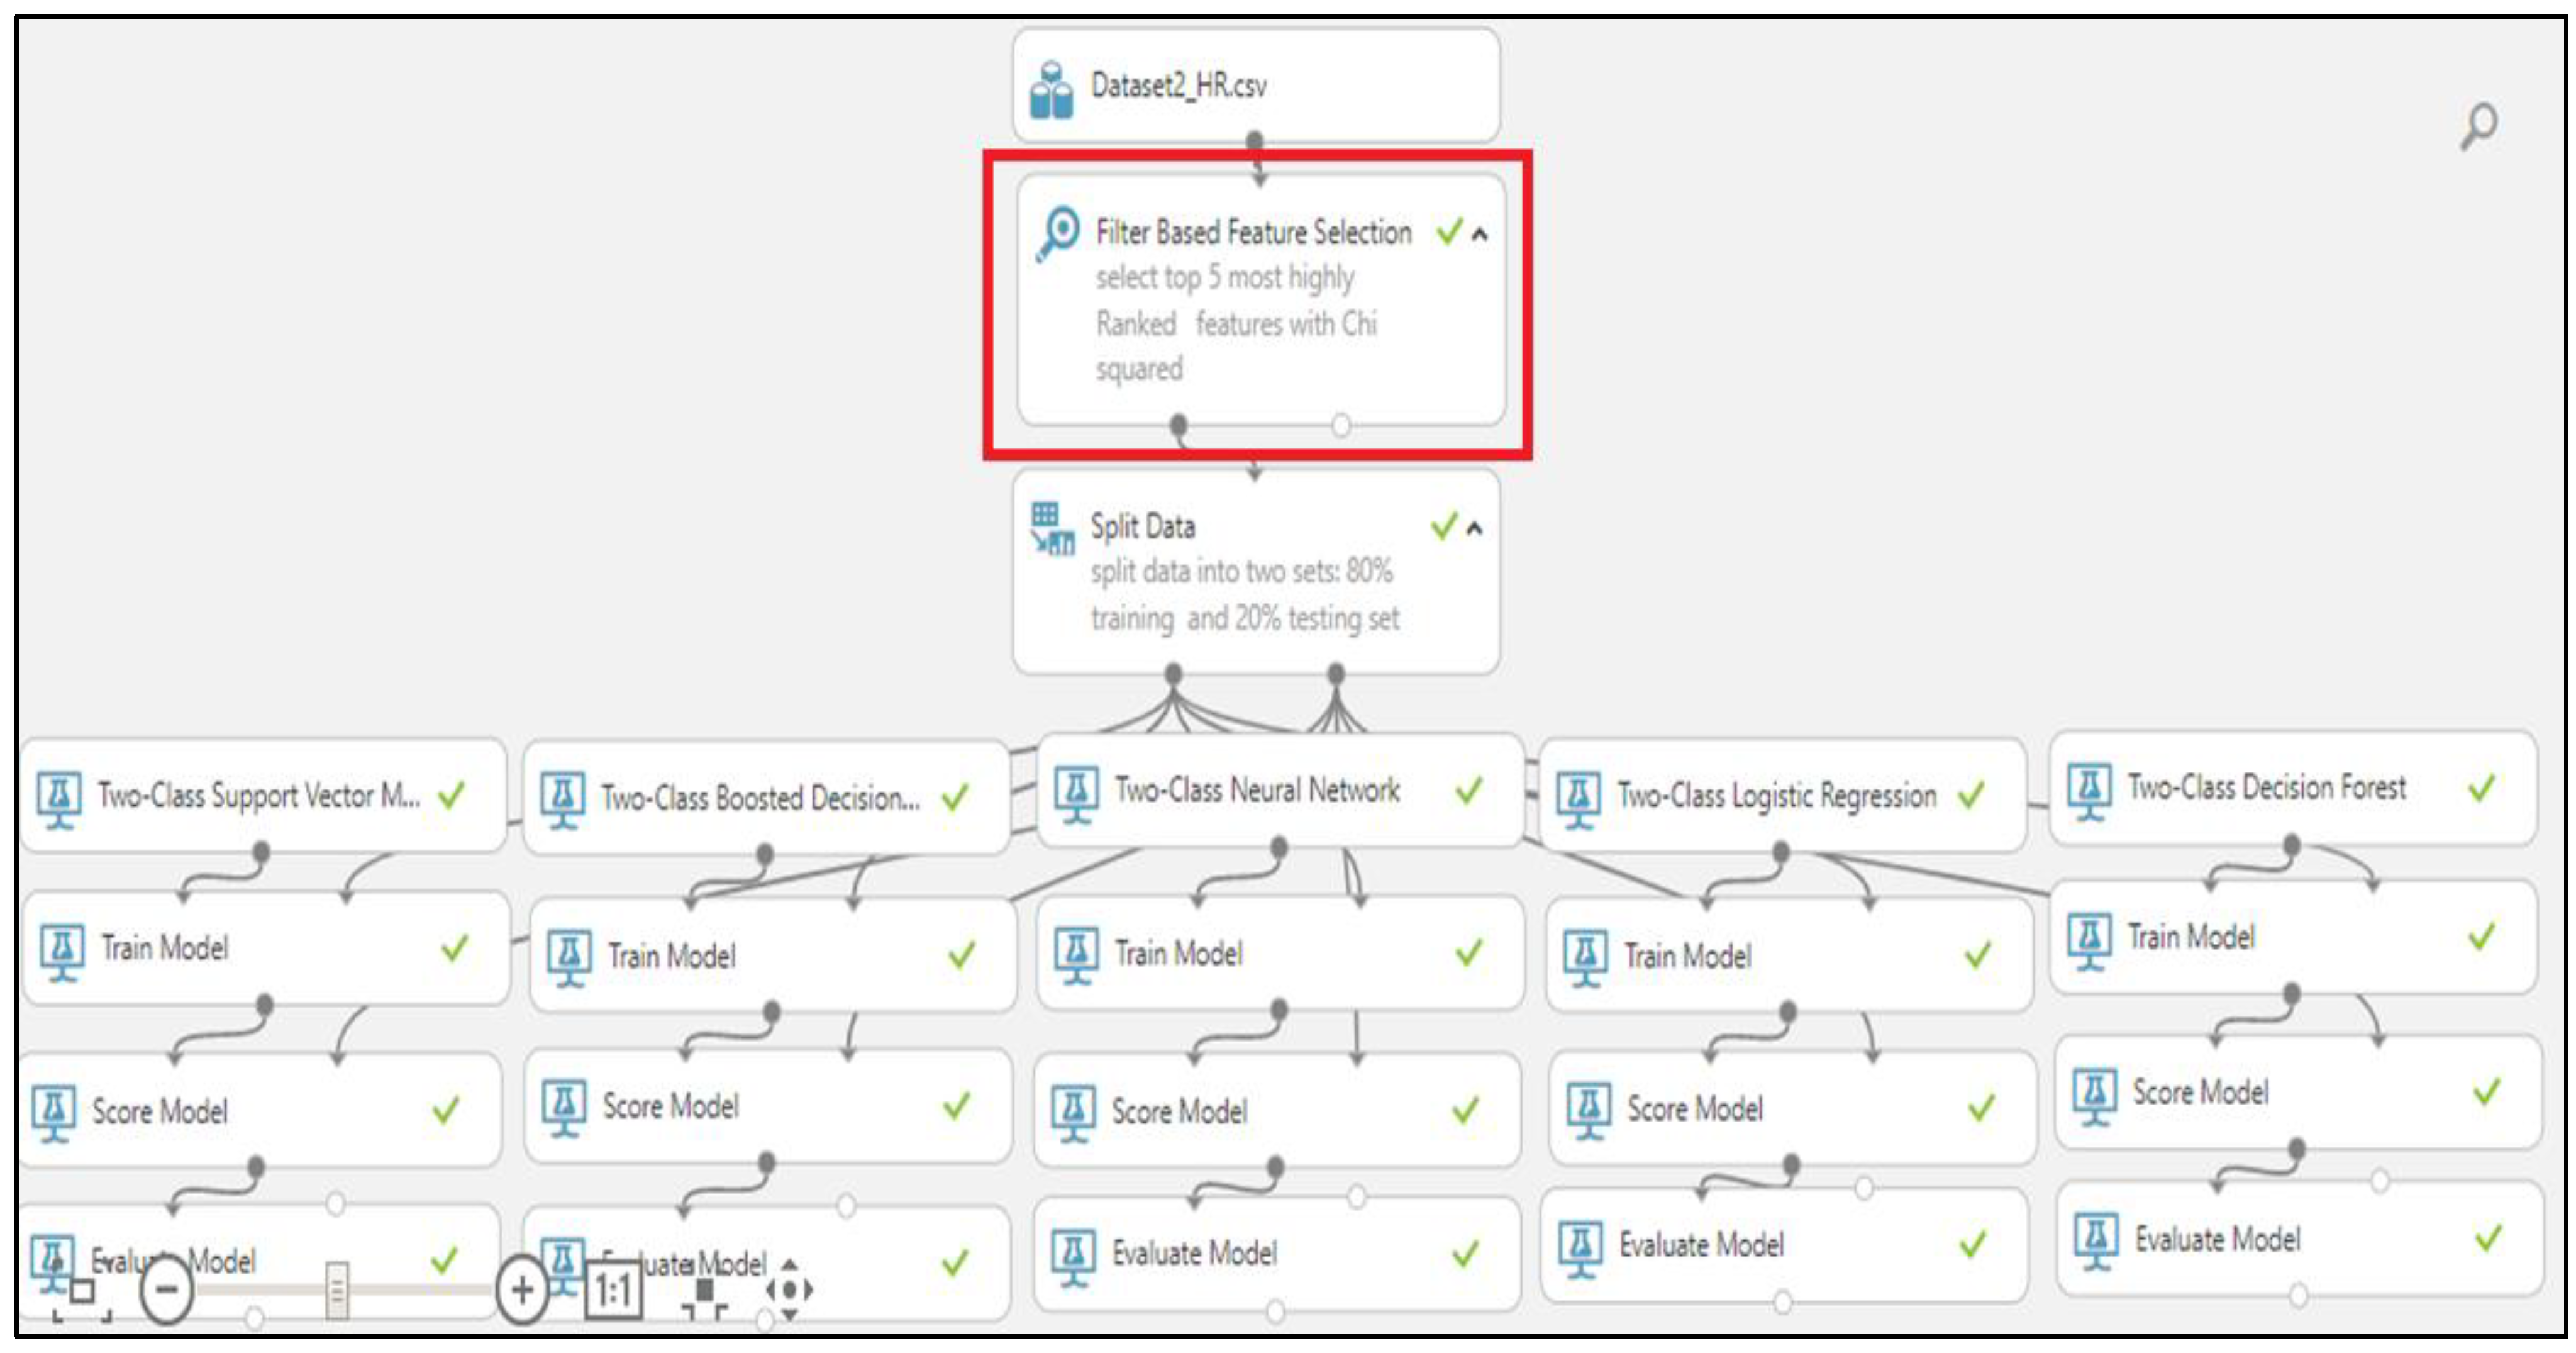
3.5. Comparison of Classification Algorithms
In order to compare the results, this research compared the five classifiers that are shown in
Figure 2 [
27,
28]. After comparing the results of these machine learning models, there is a need to measure the algorithms’ performance using statistical measures such as accuracy, precision, and recall, which are widely used in classification algorithms [
29,
30].
4. Results and Discussion
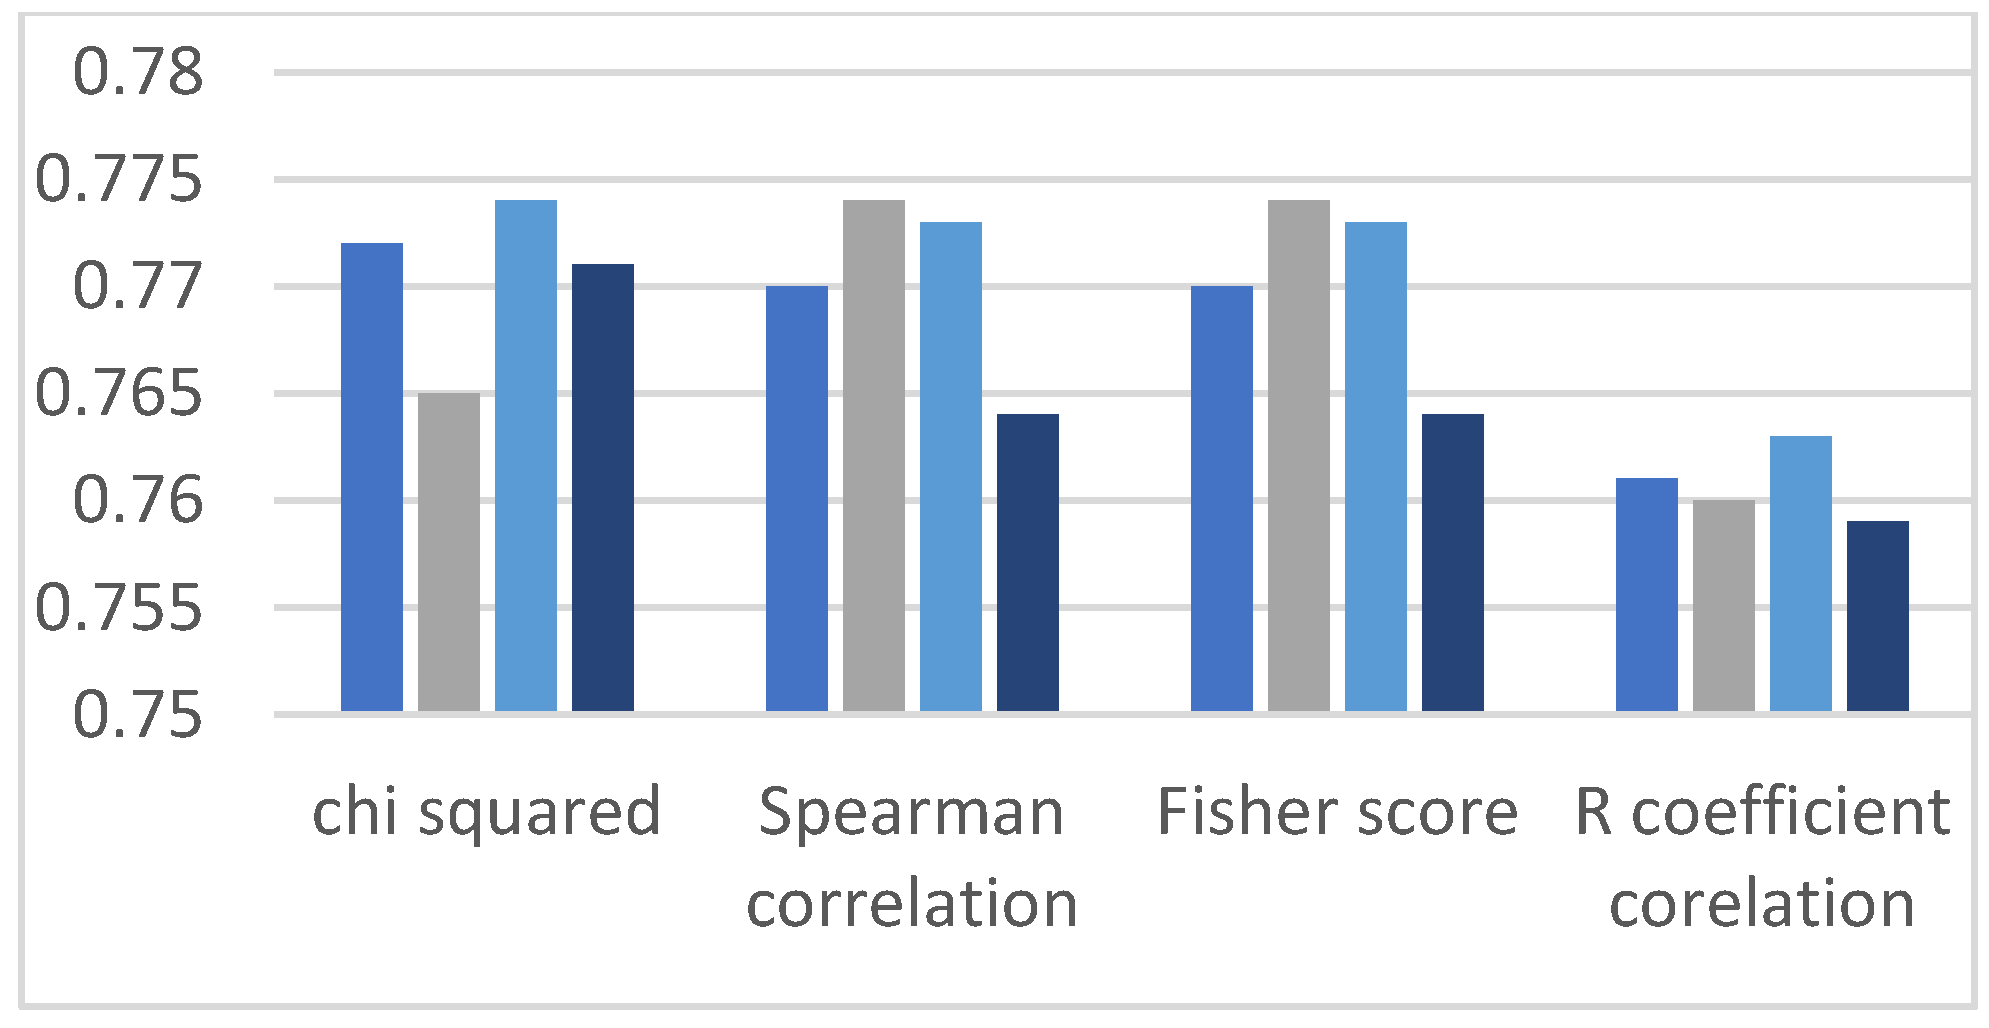
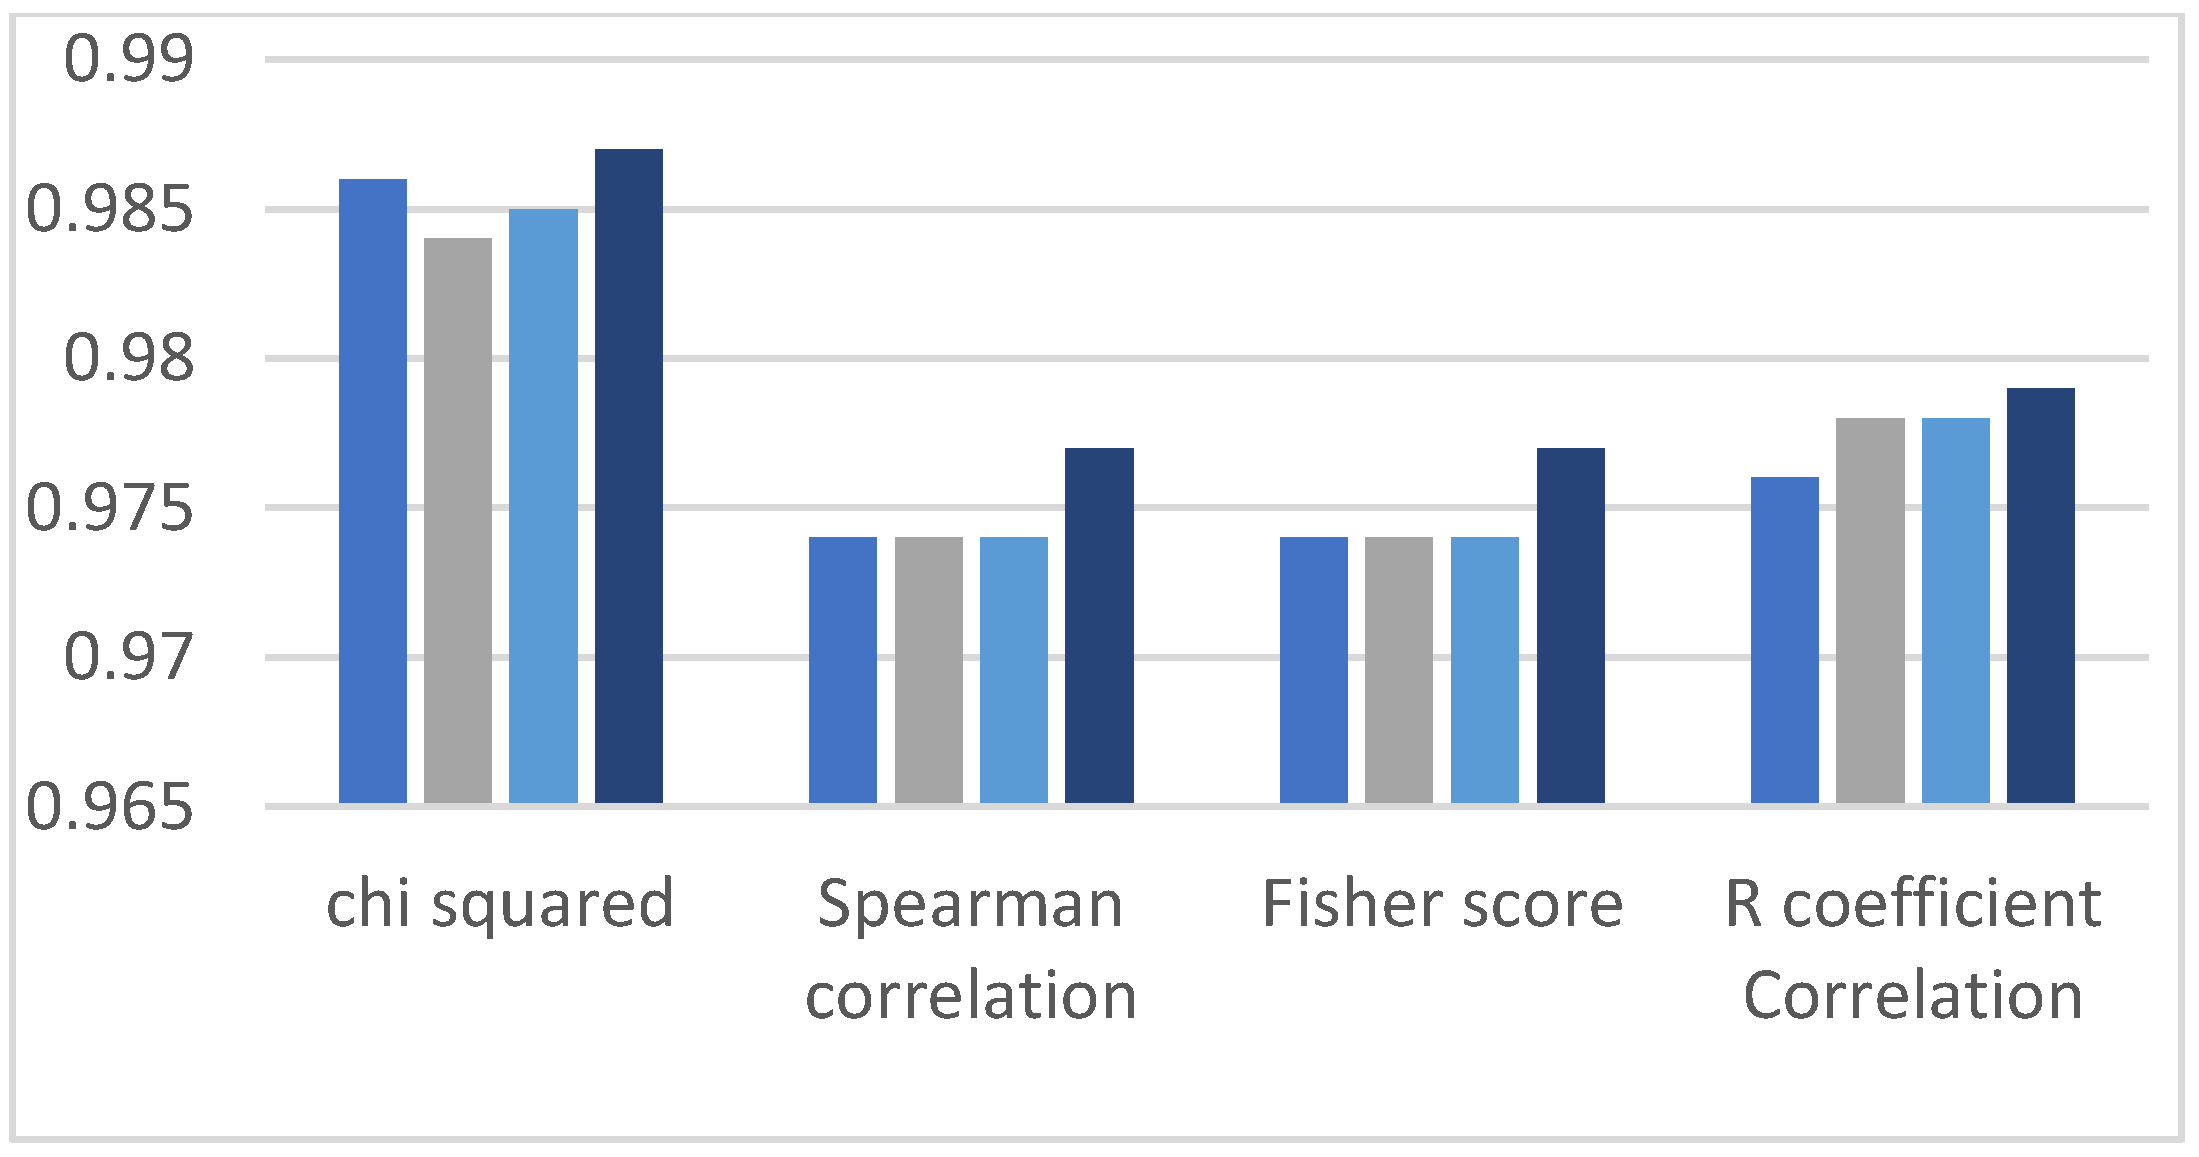
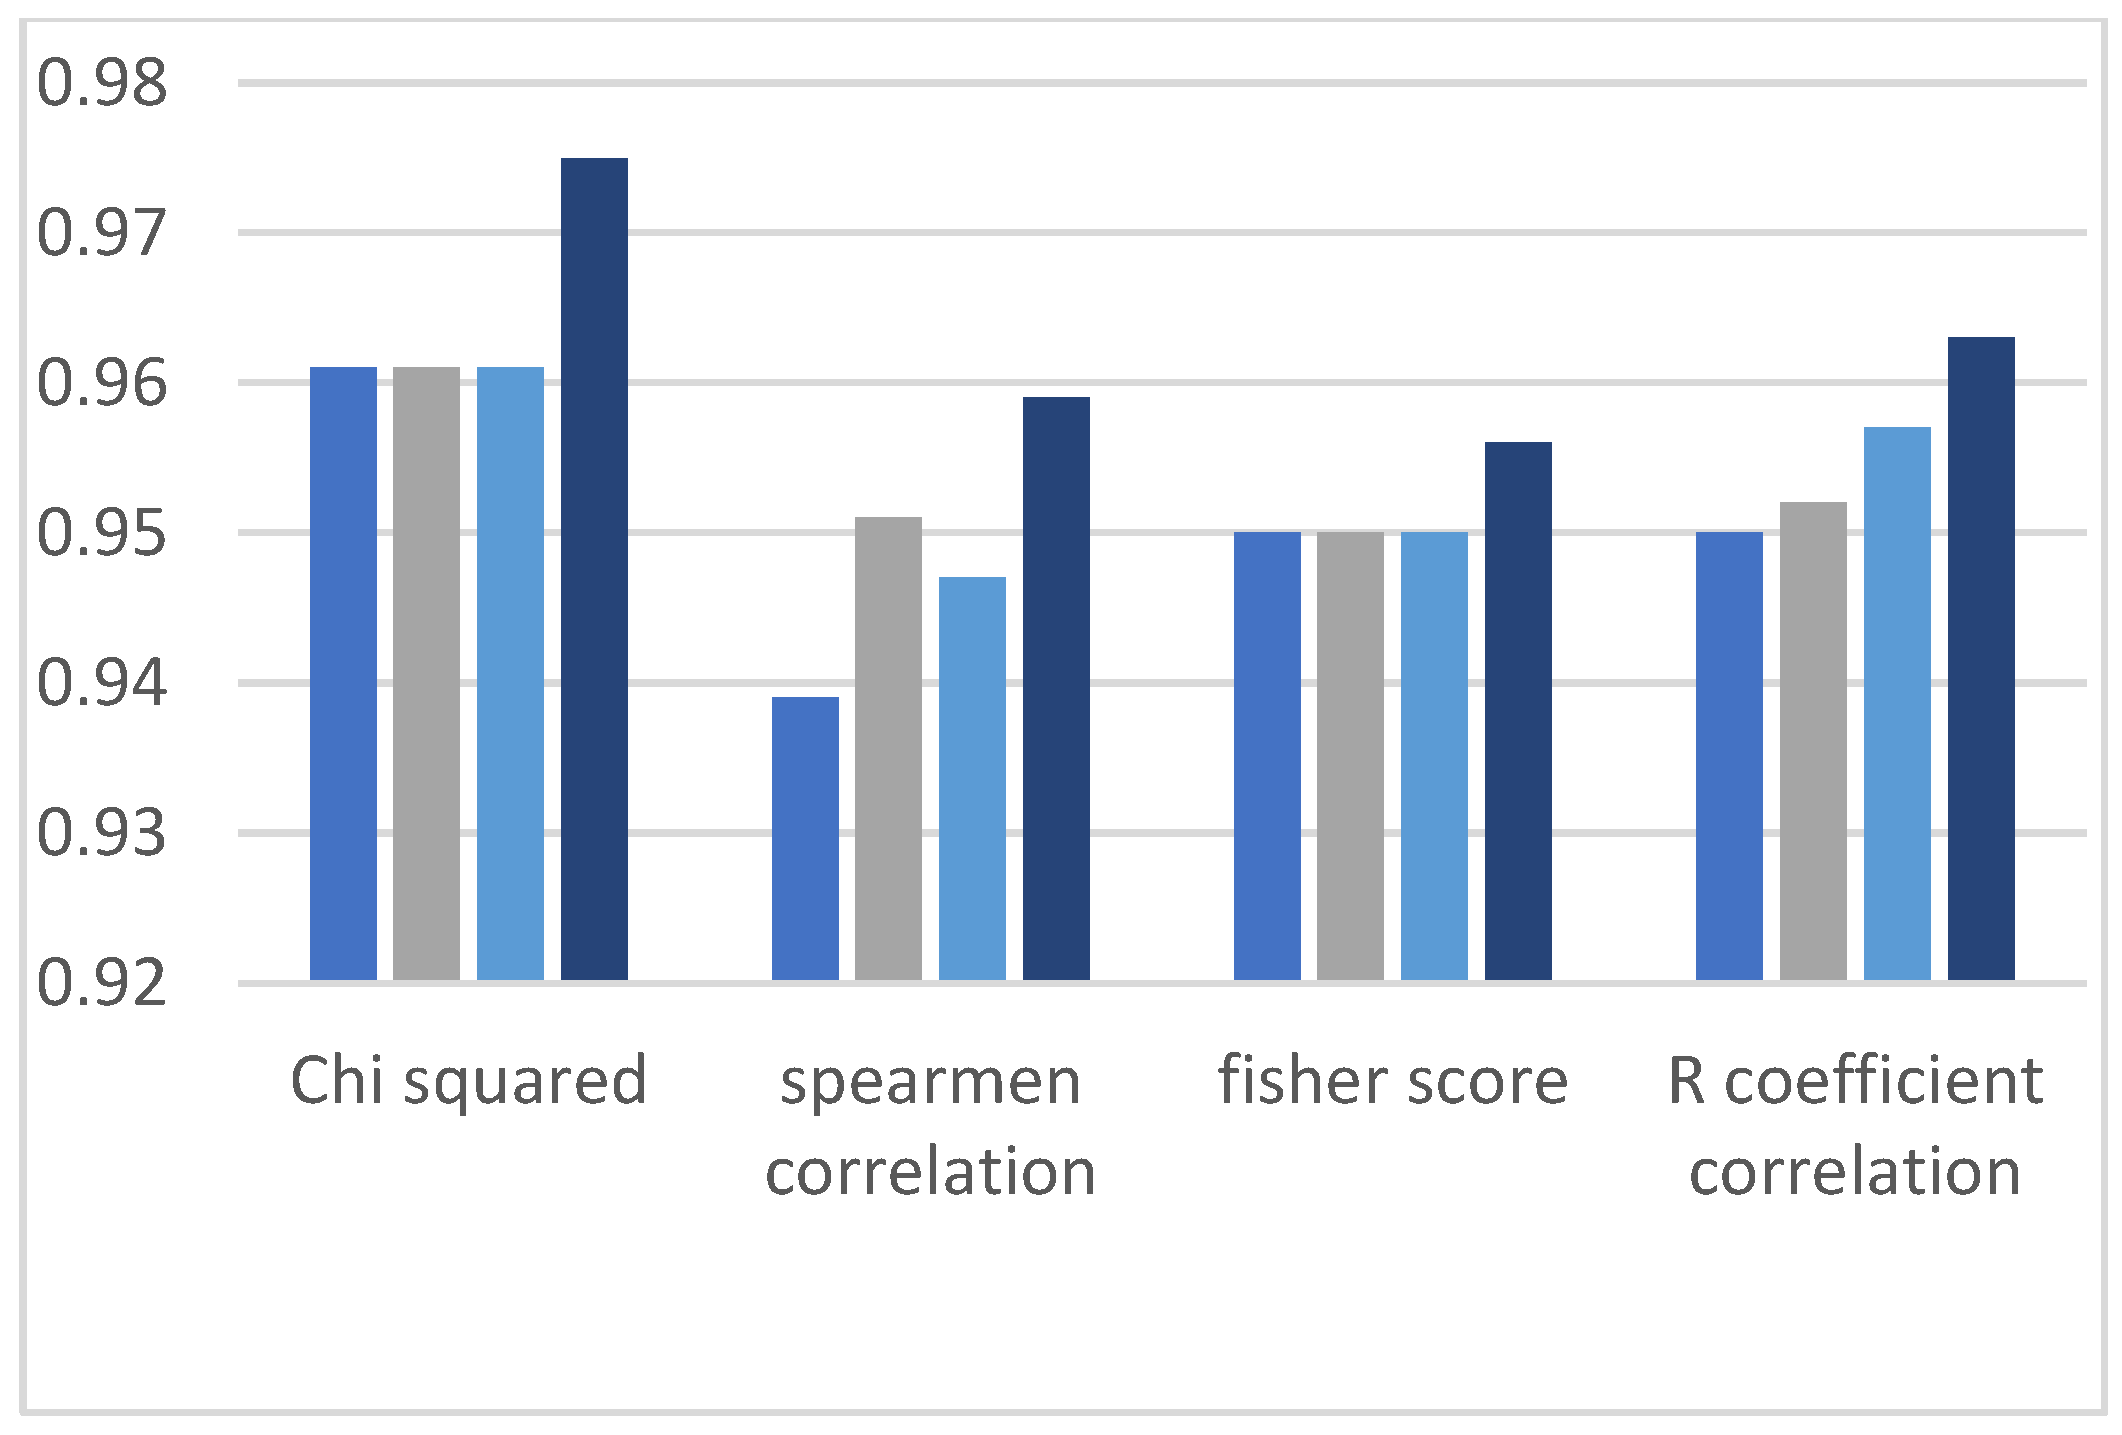
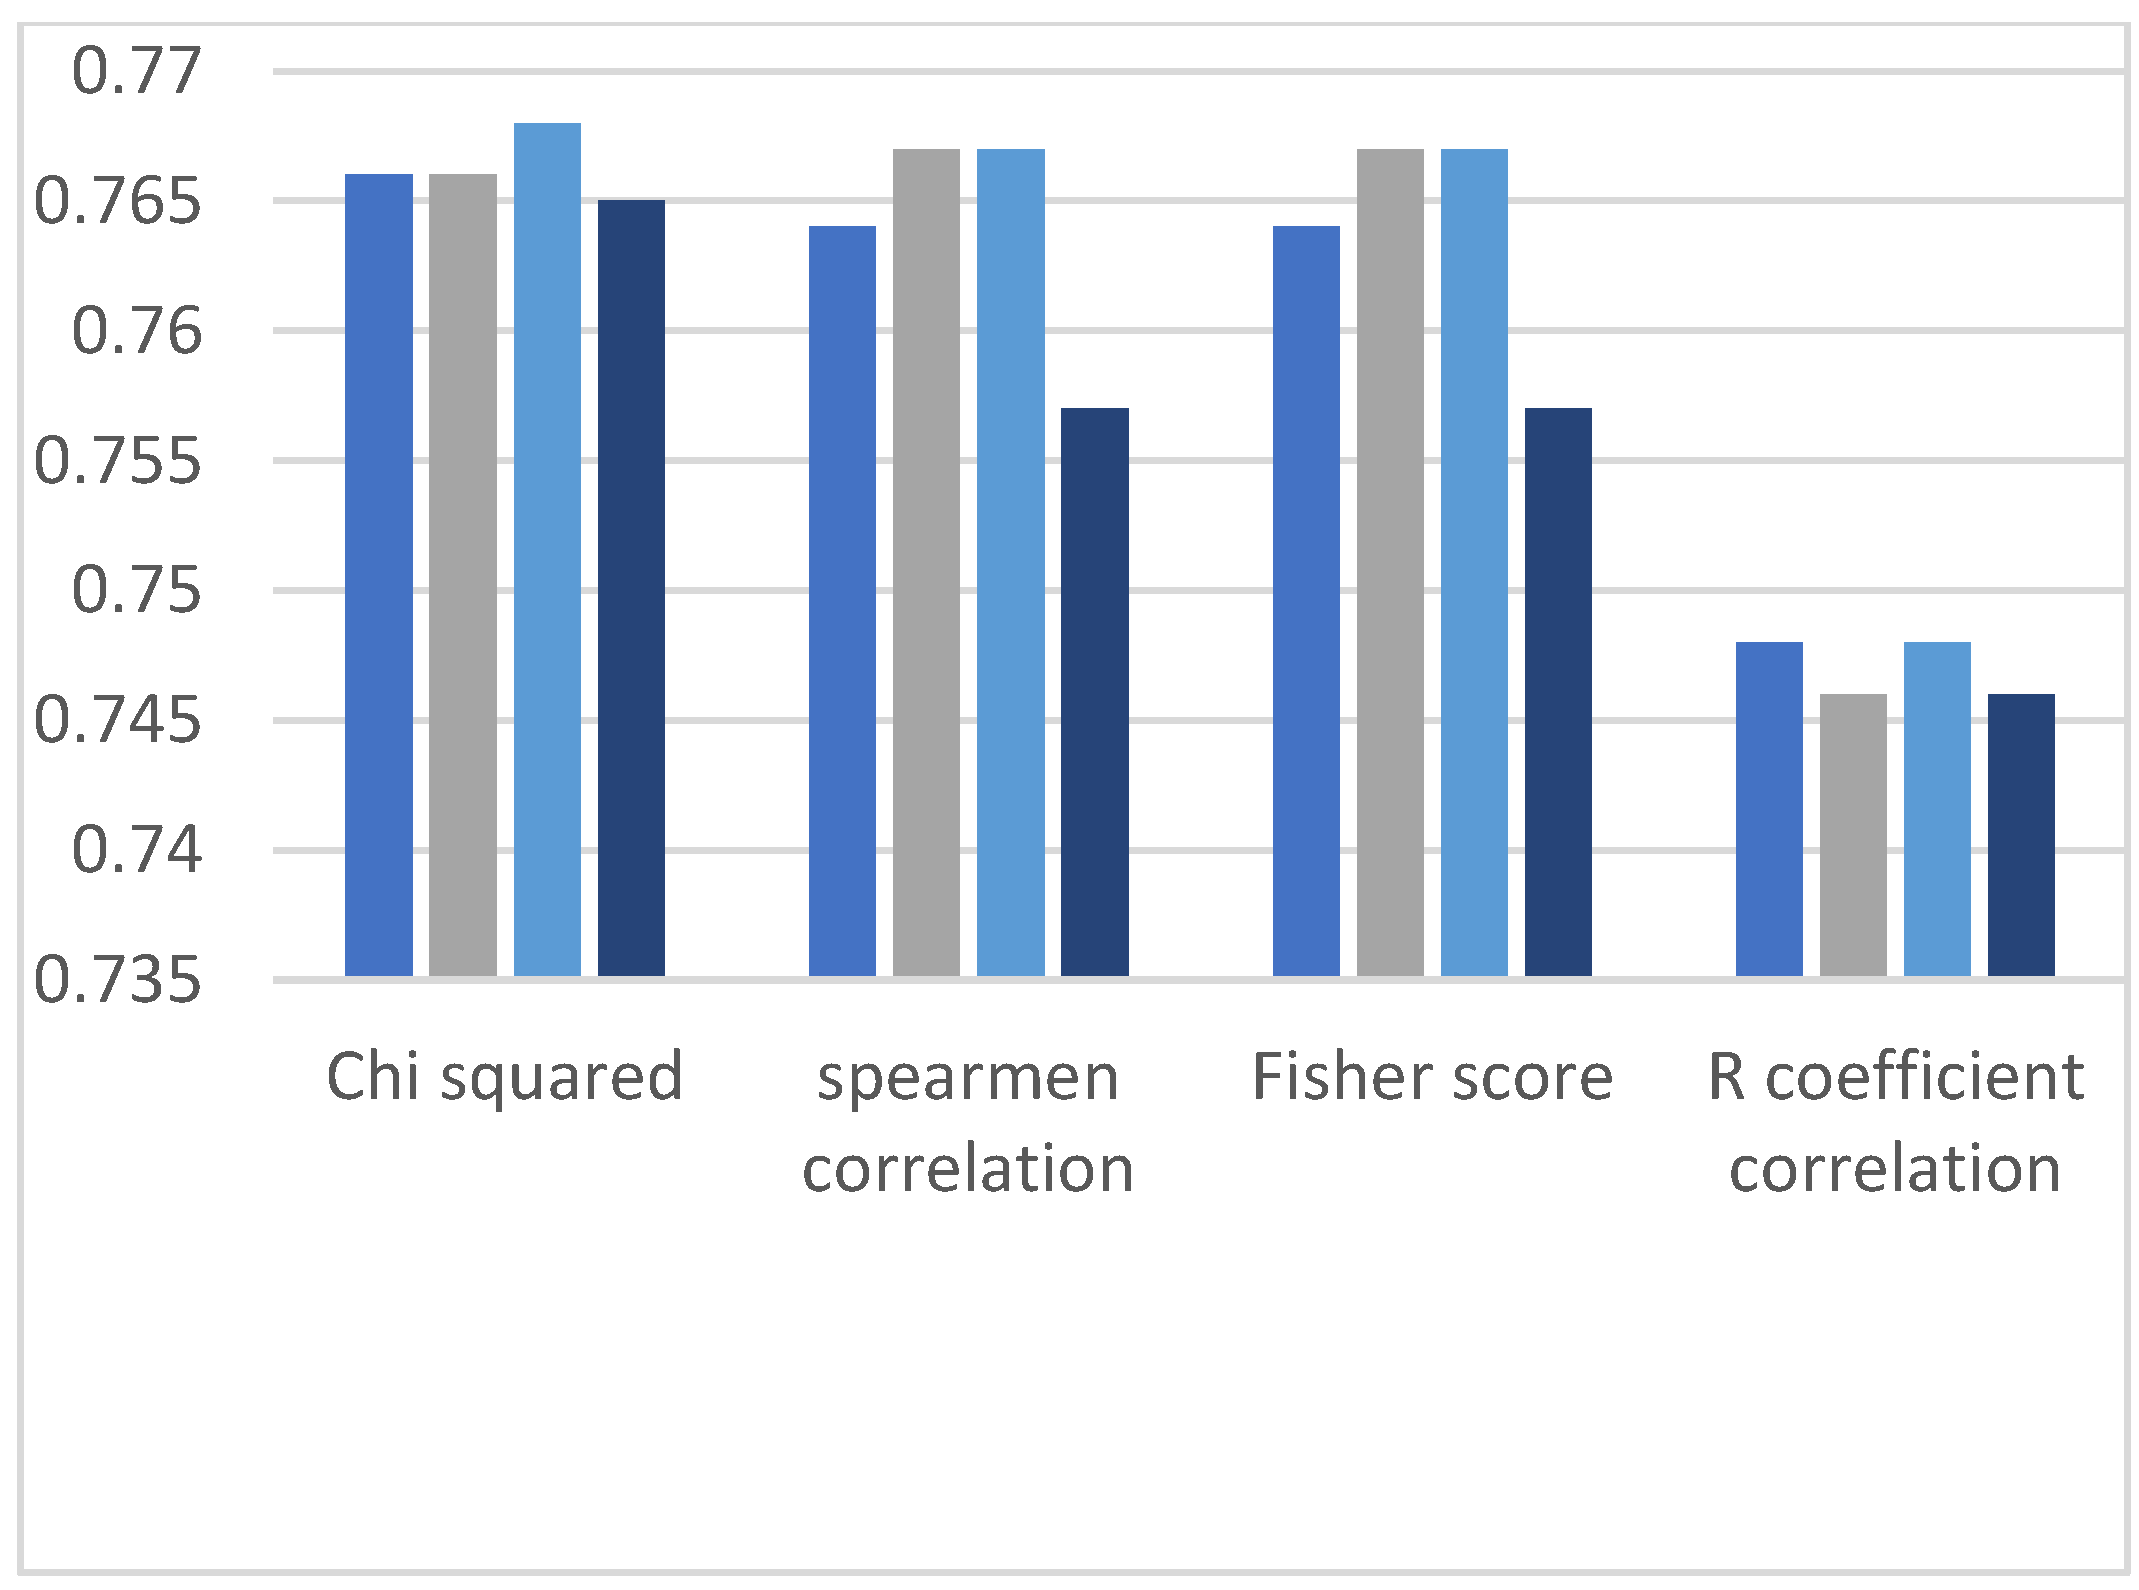
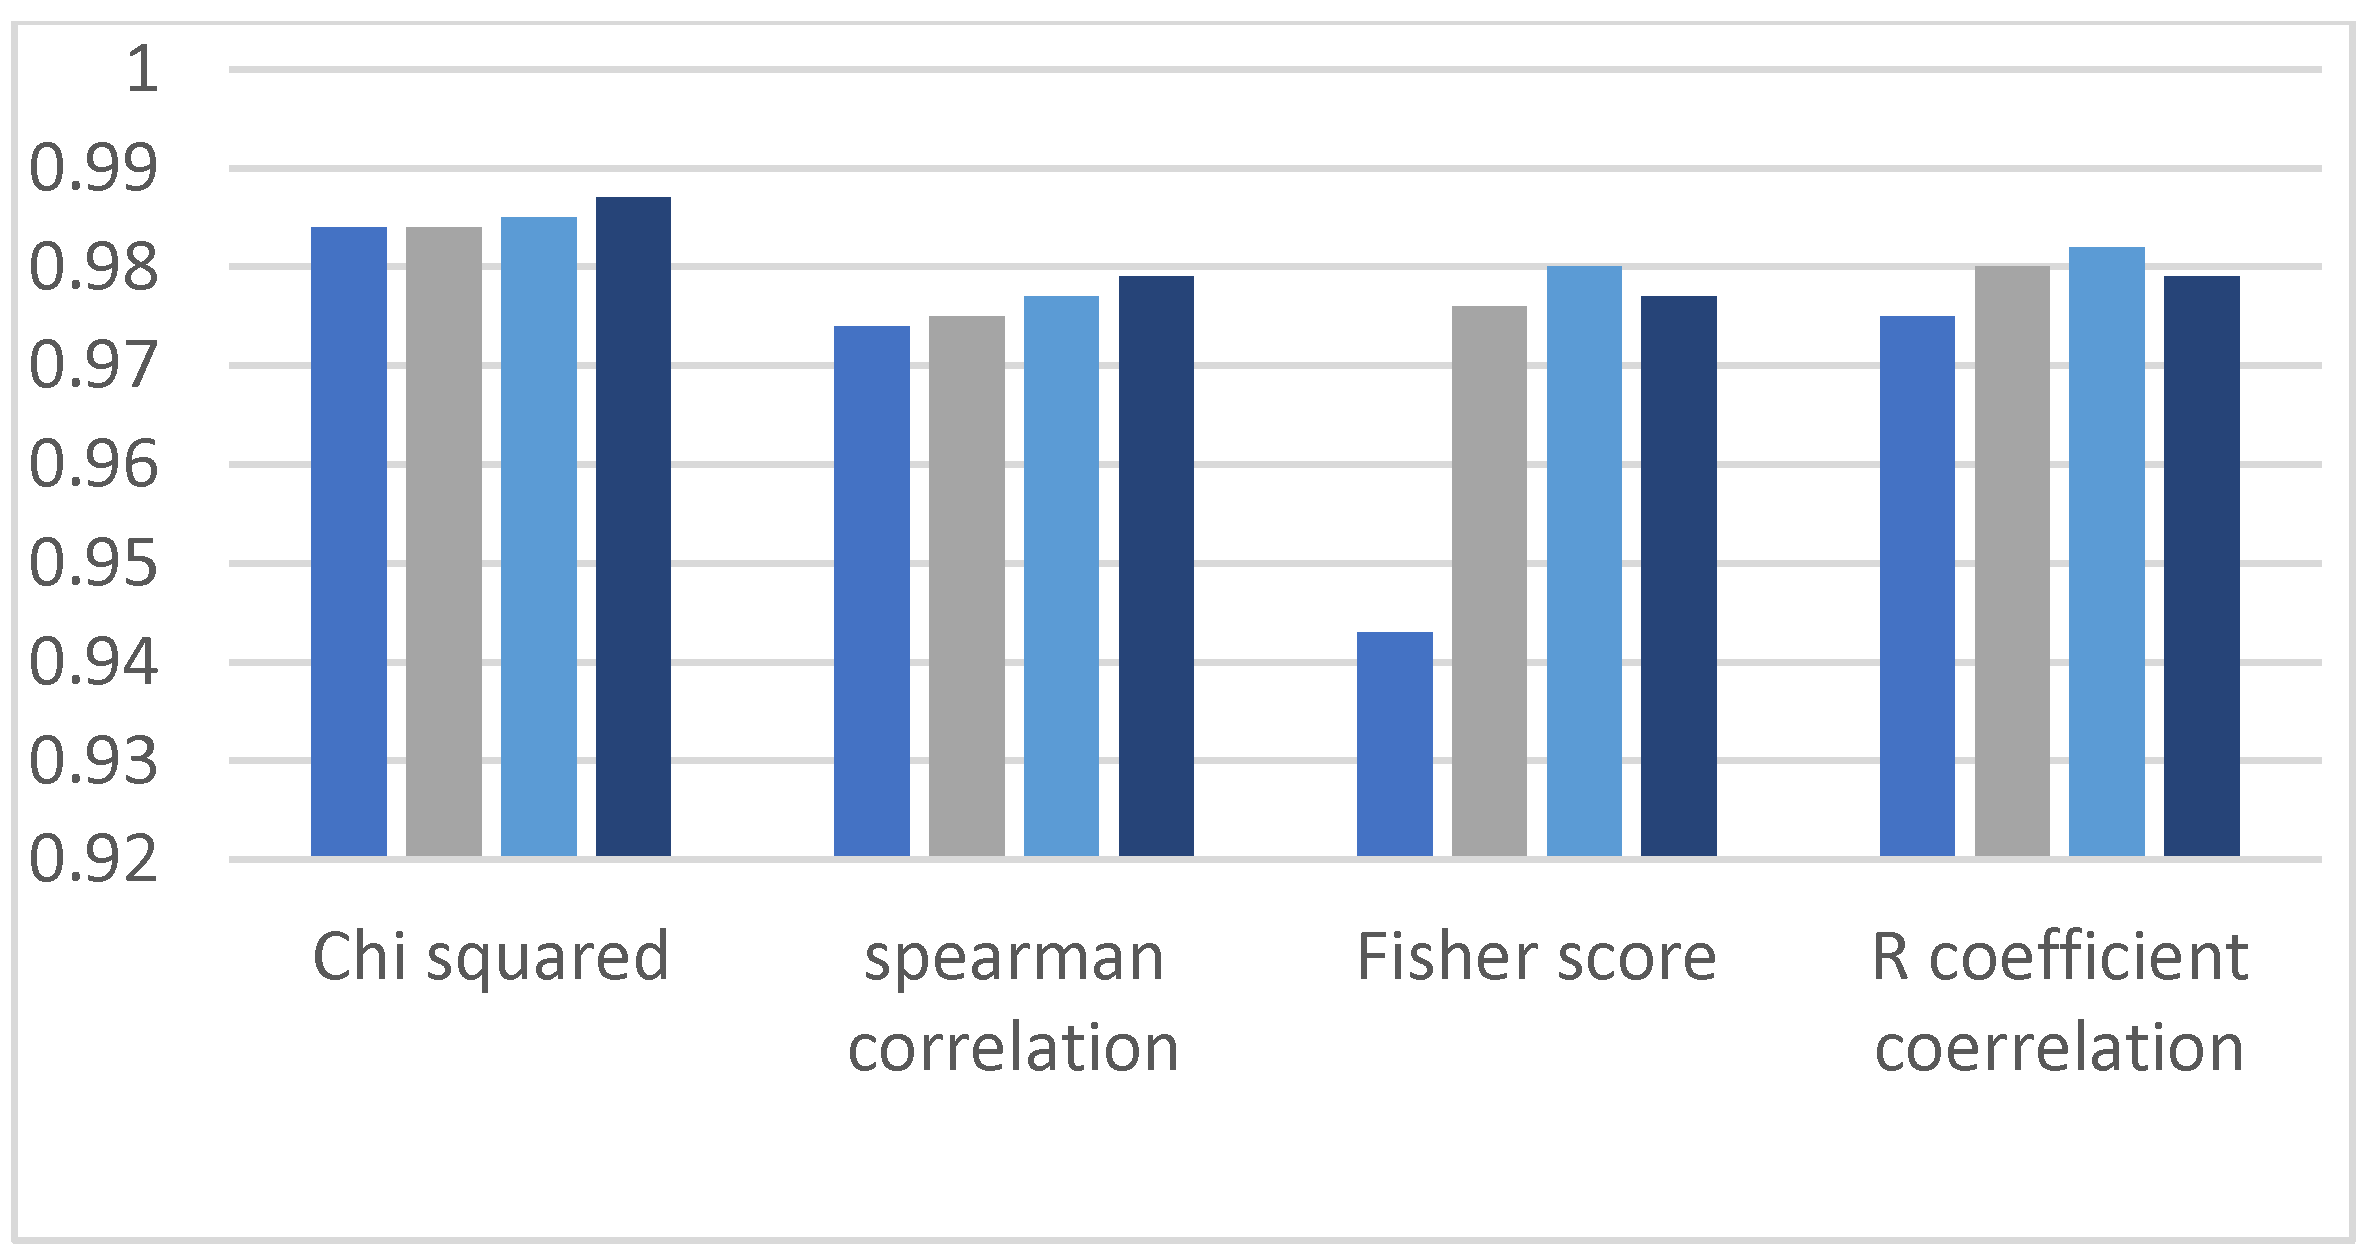
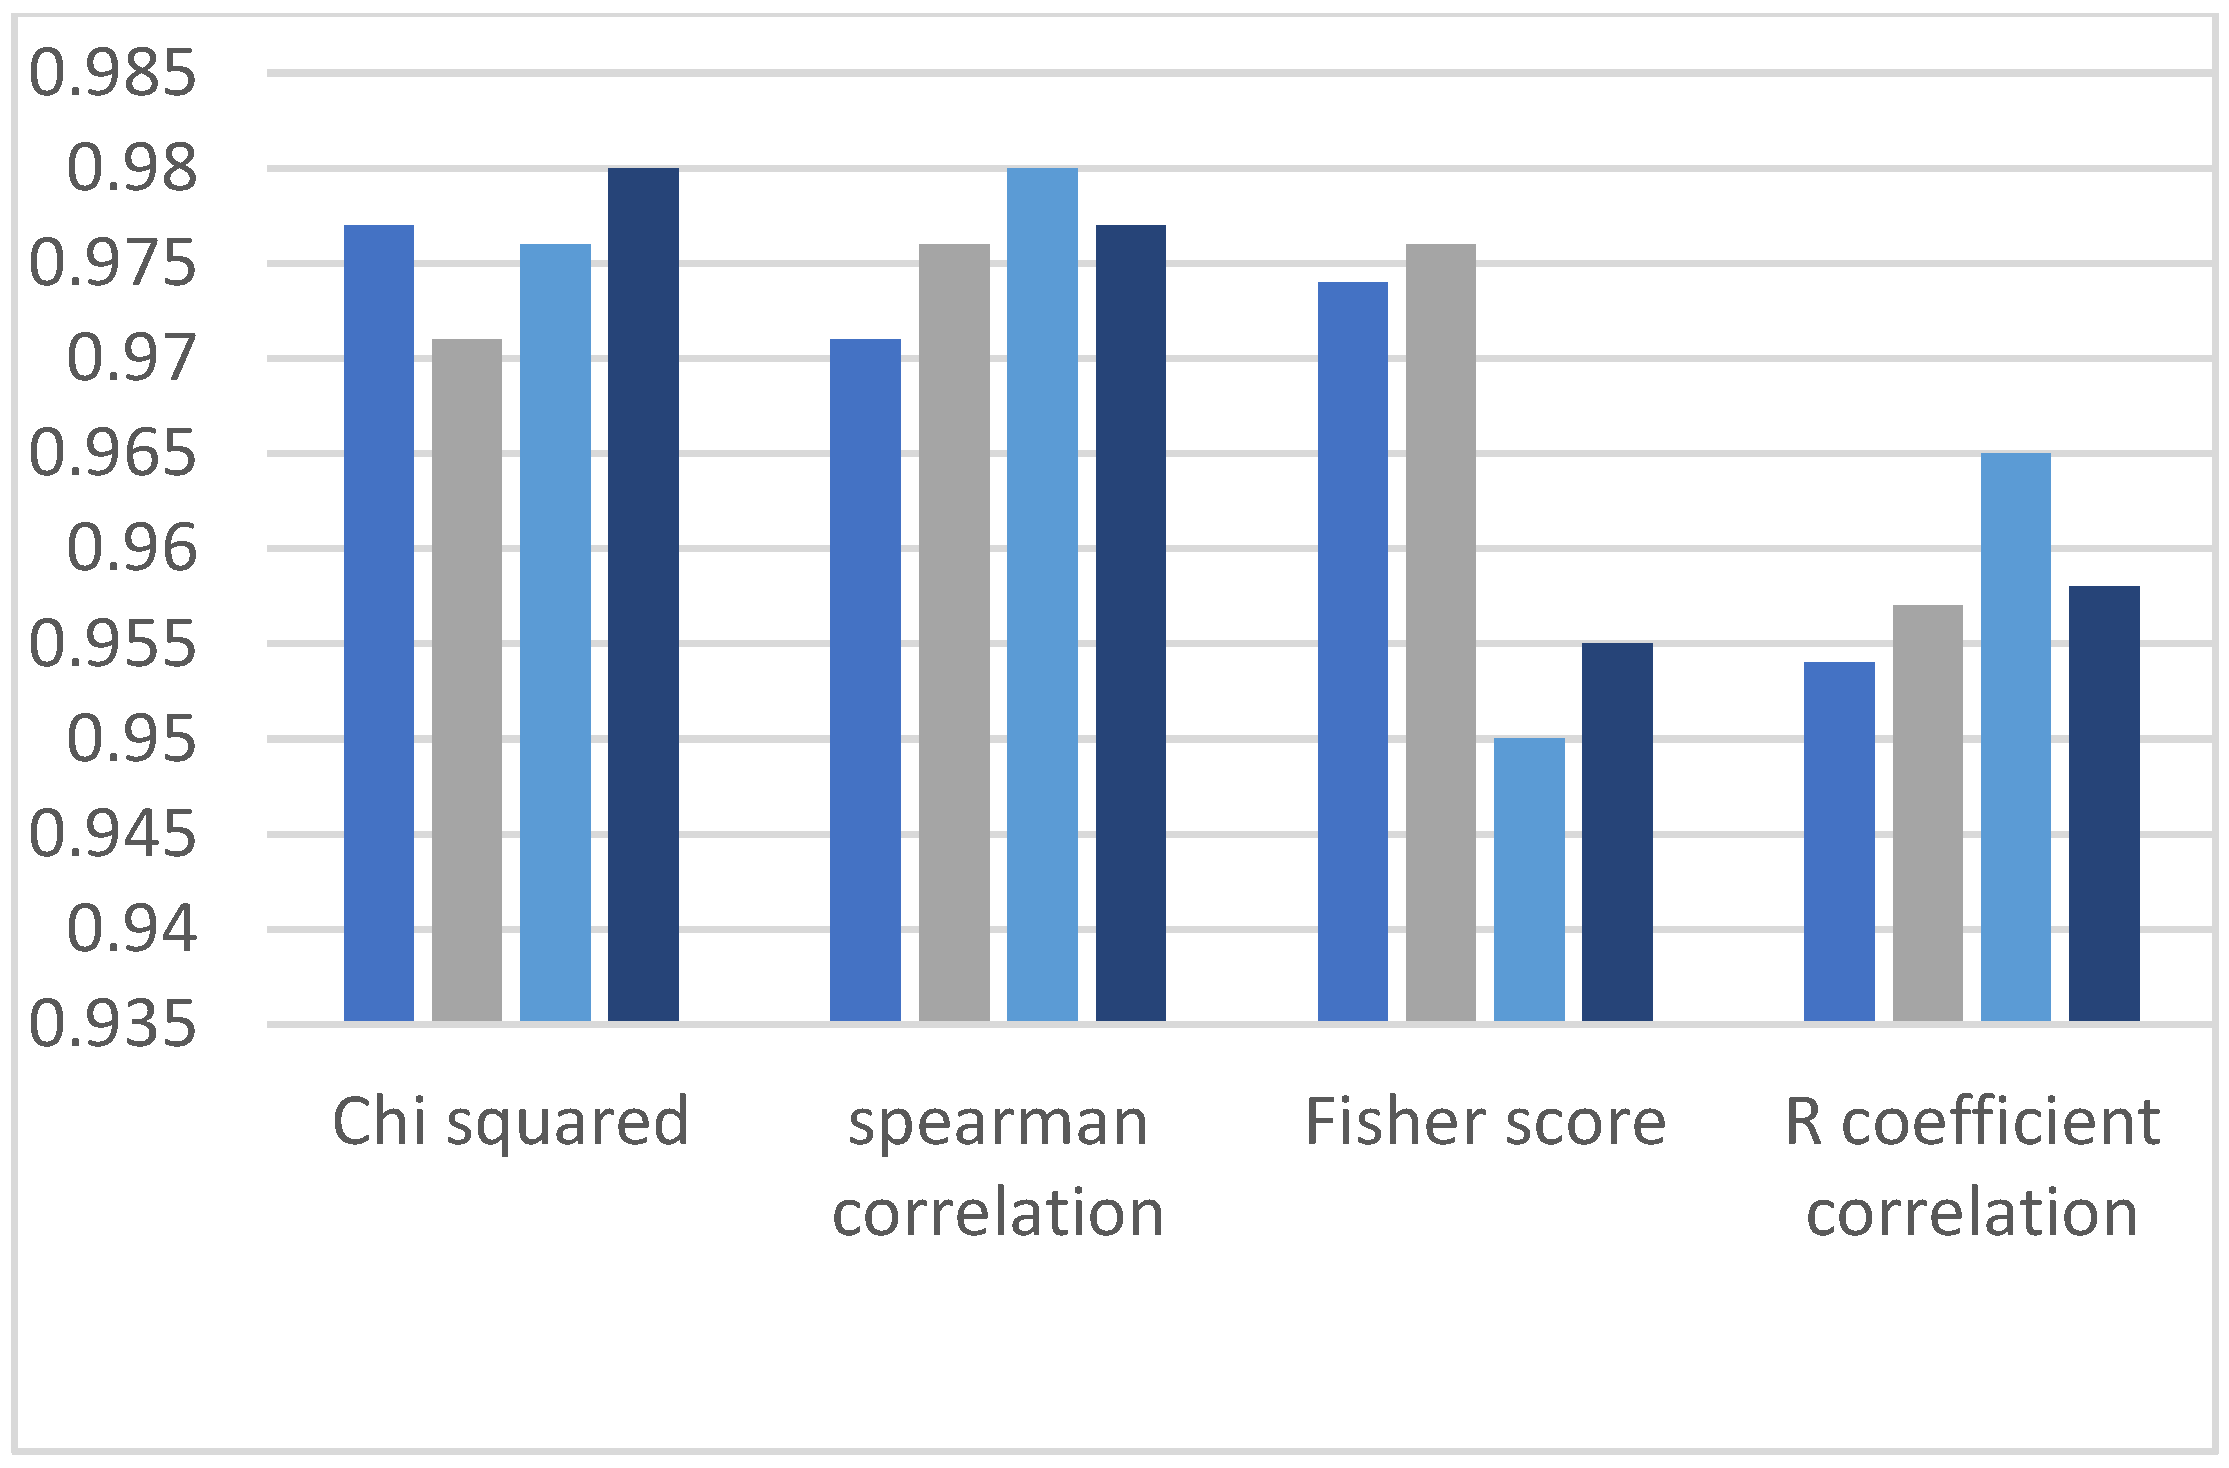
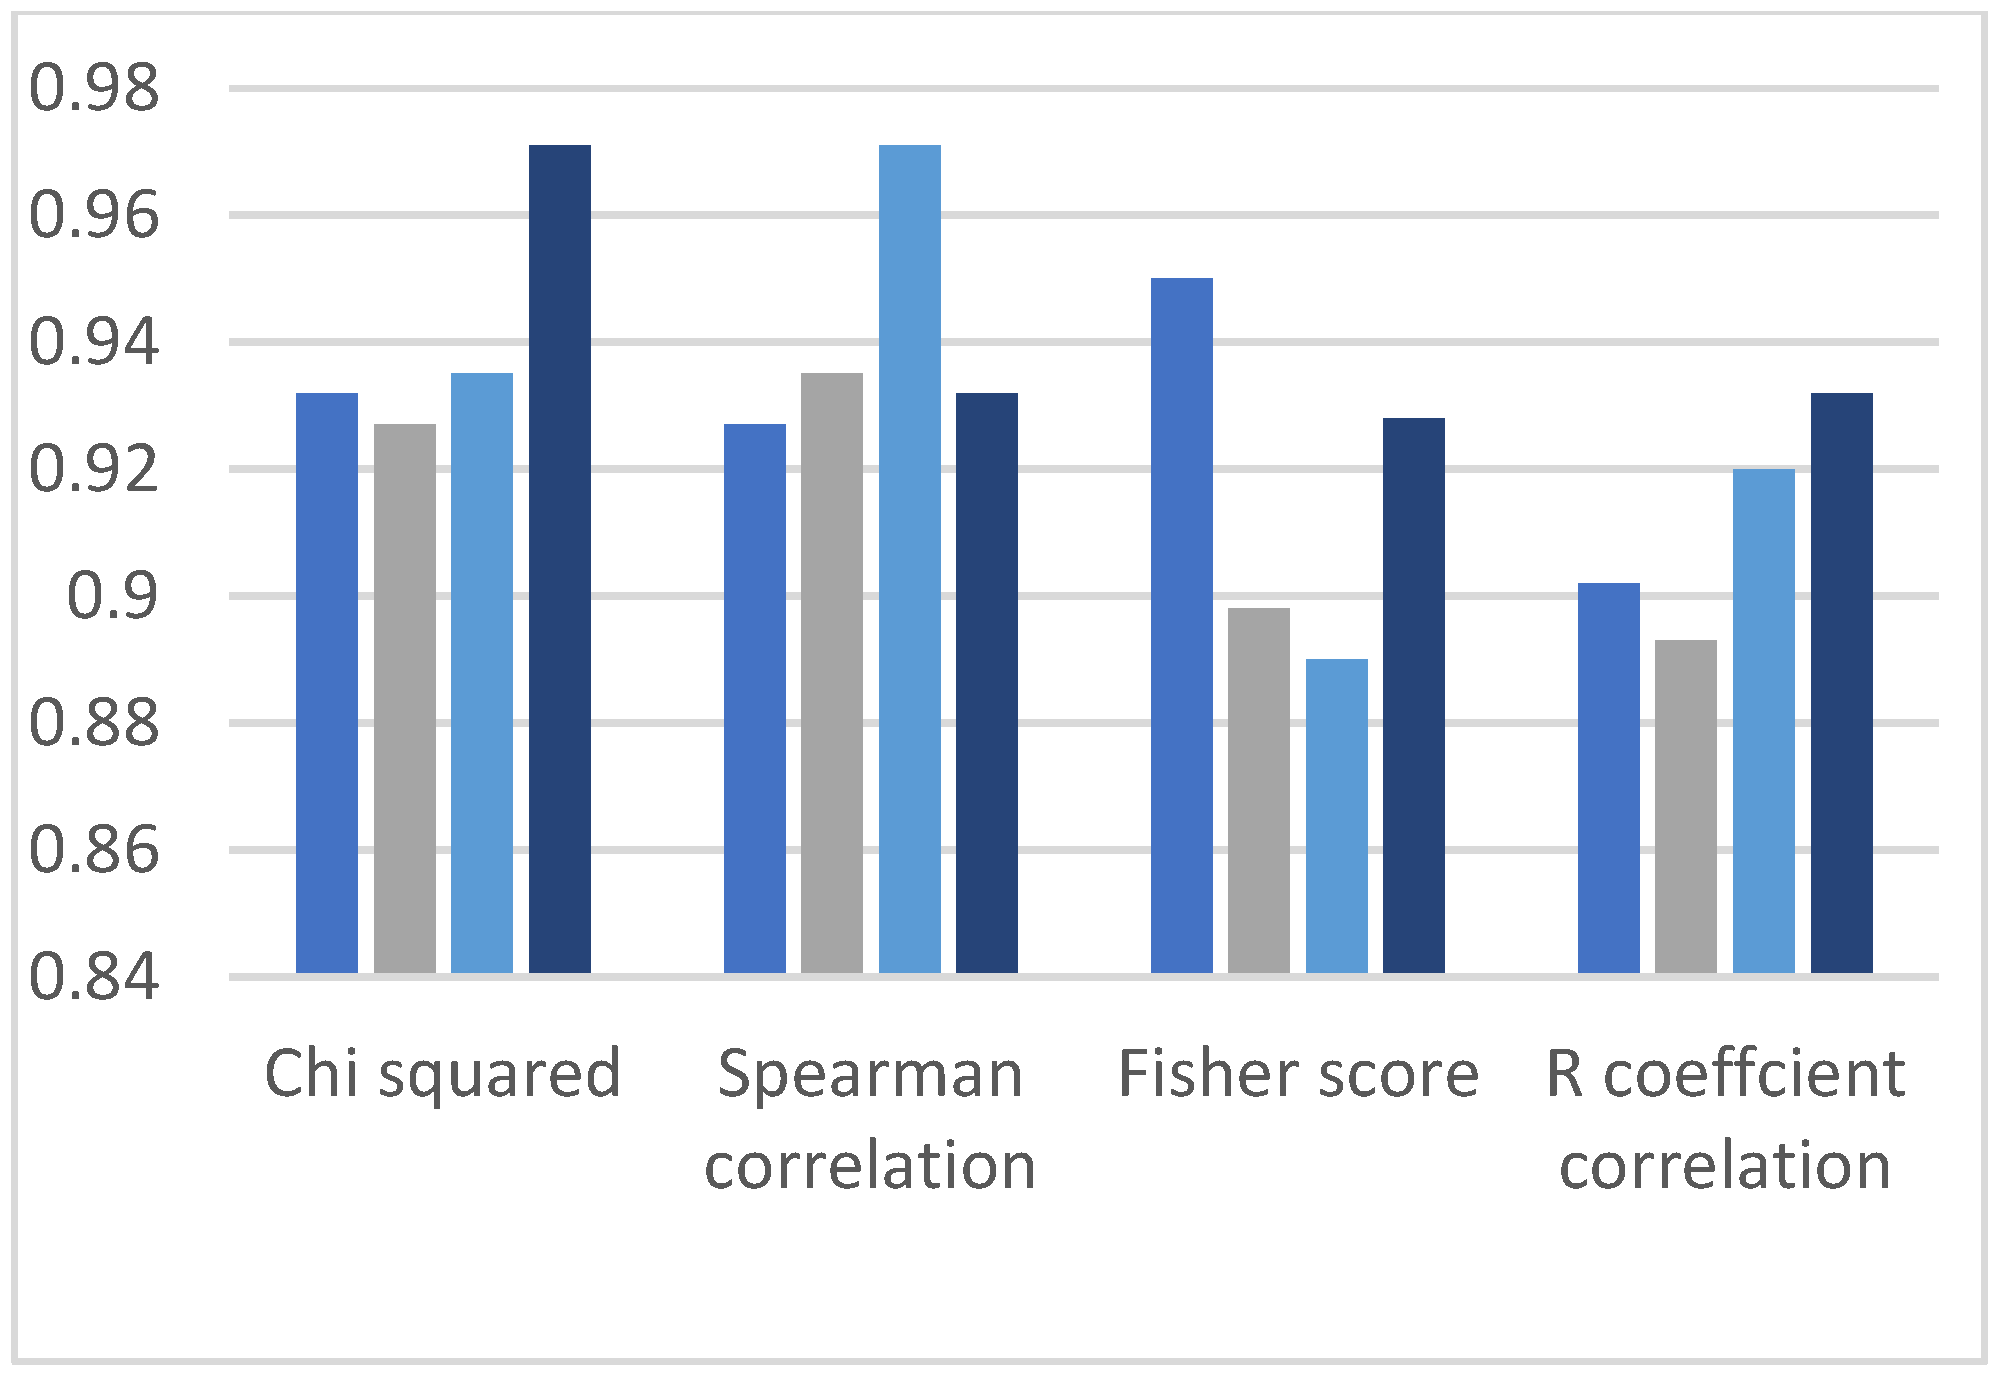
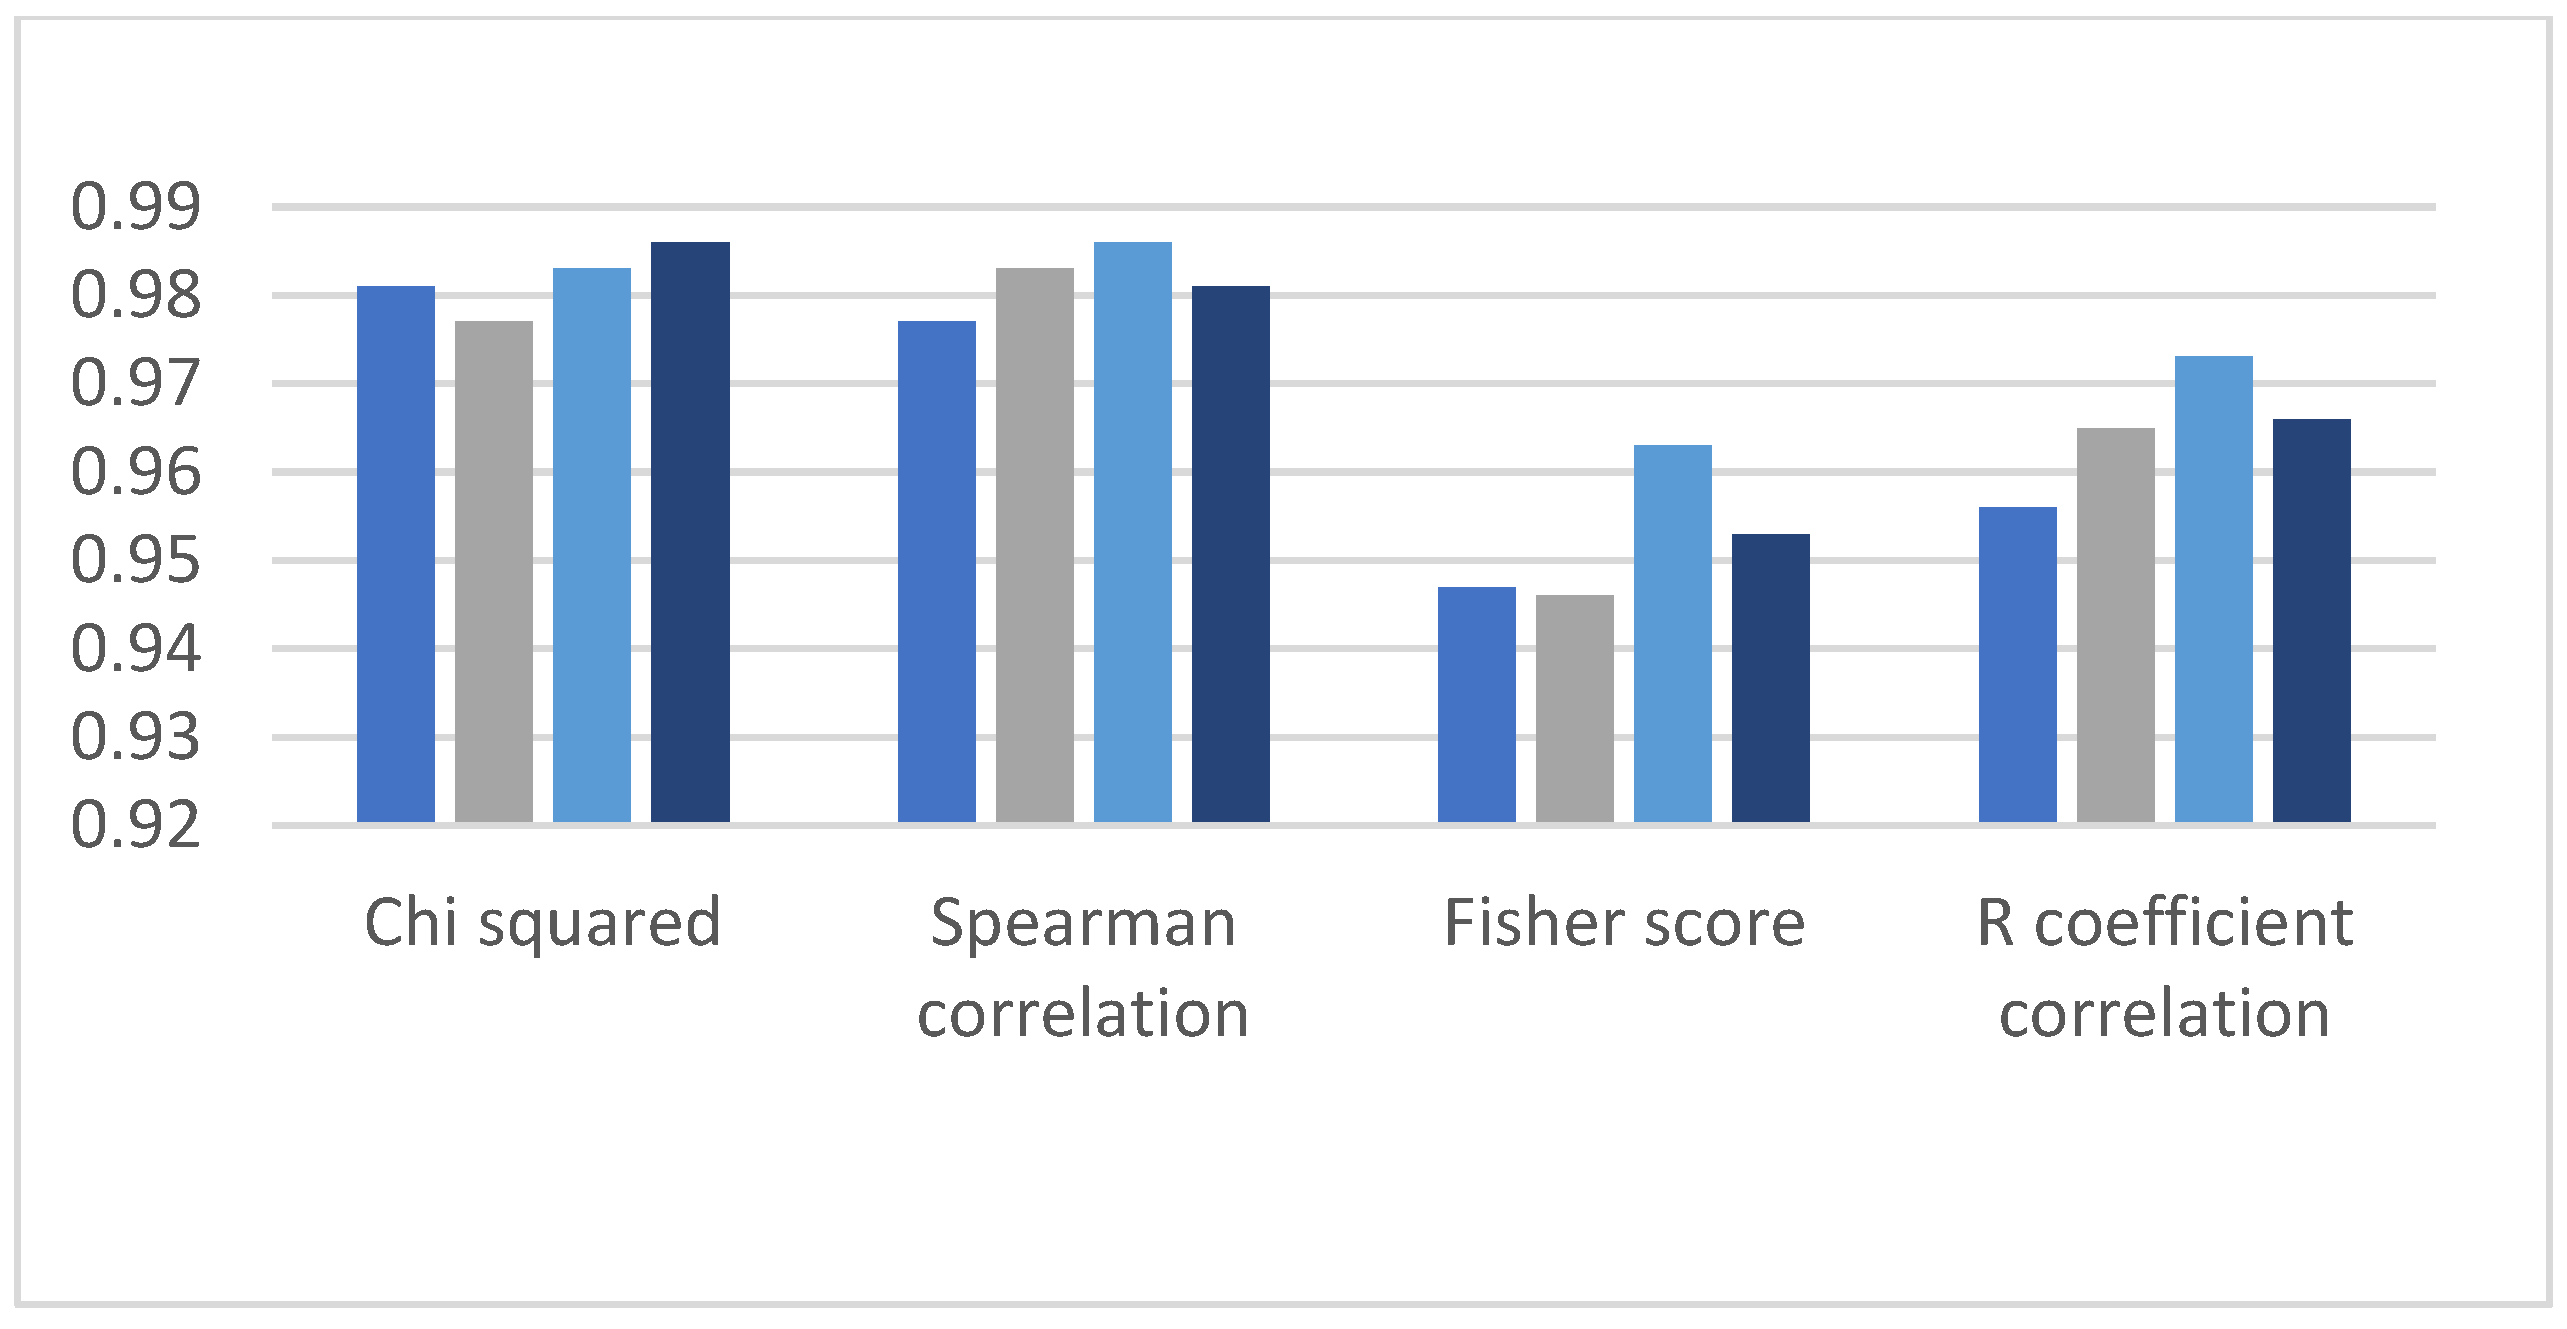
4.1. Comparison of Accuracy of Spearman Correlation, Chi-Squared, R Coefficient Correlation and Fisher Score
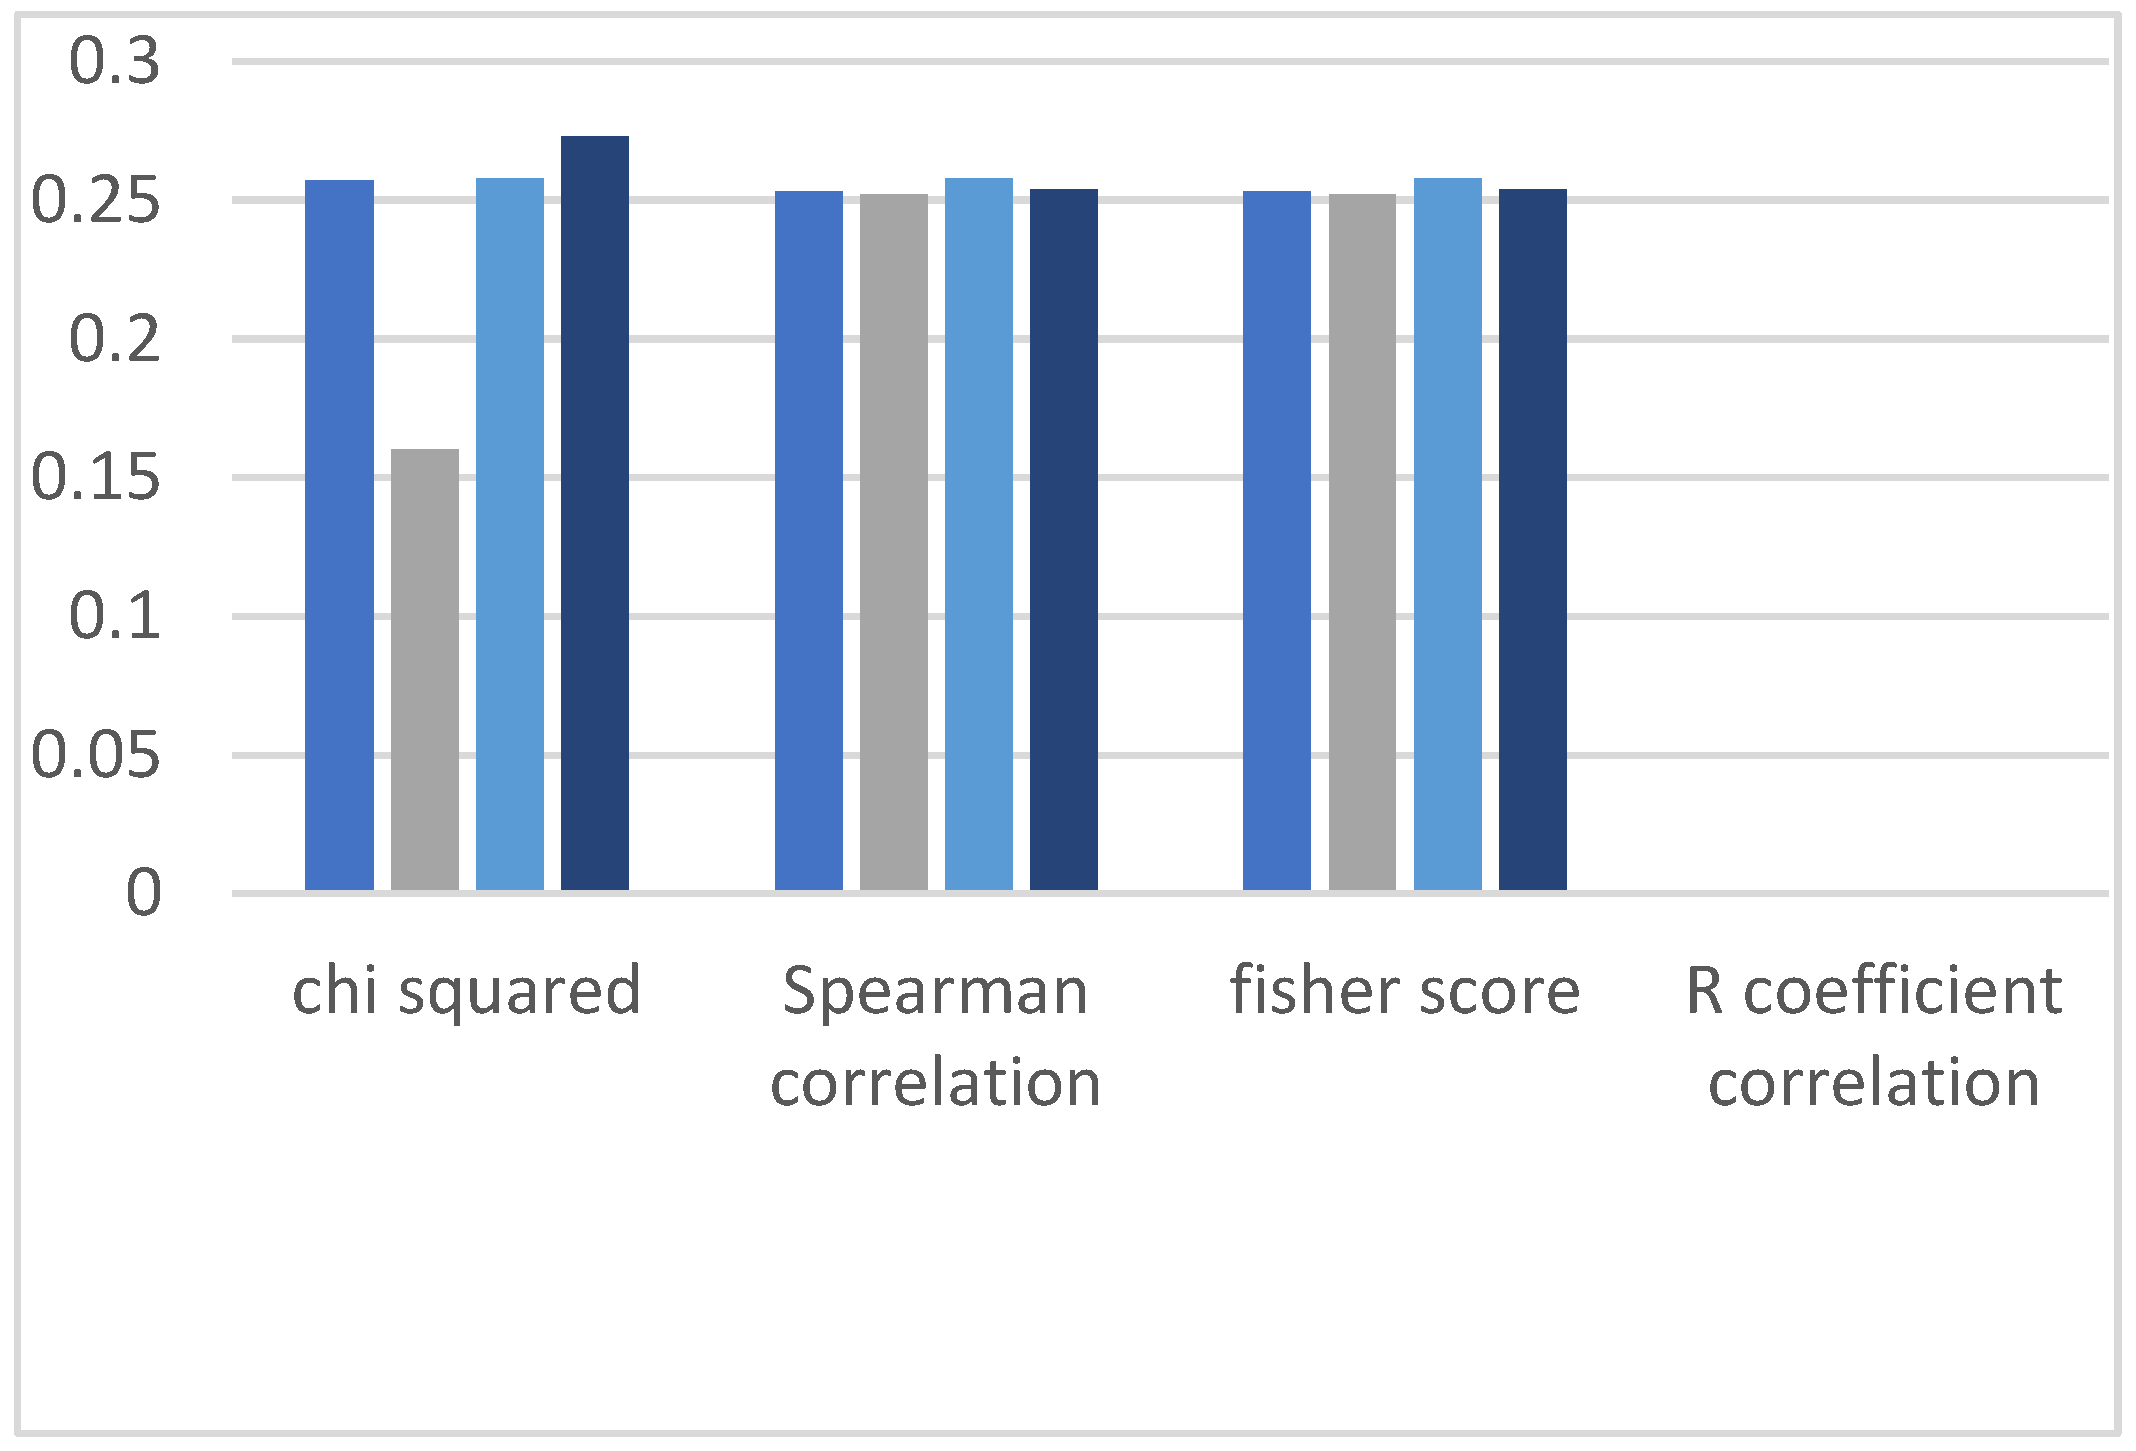
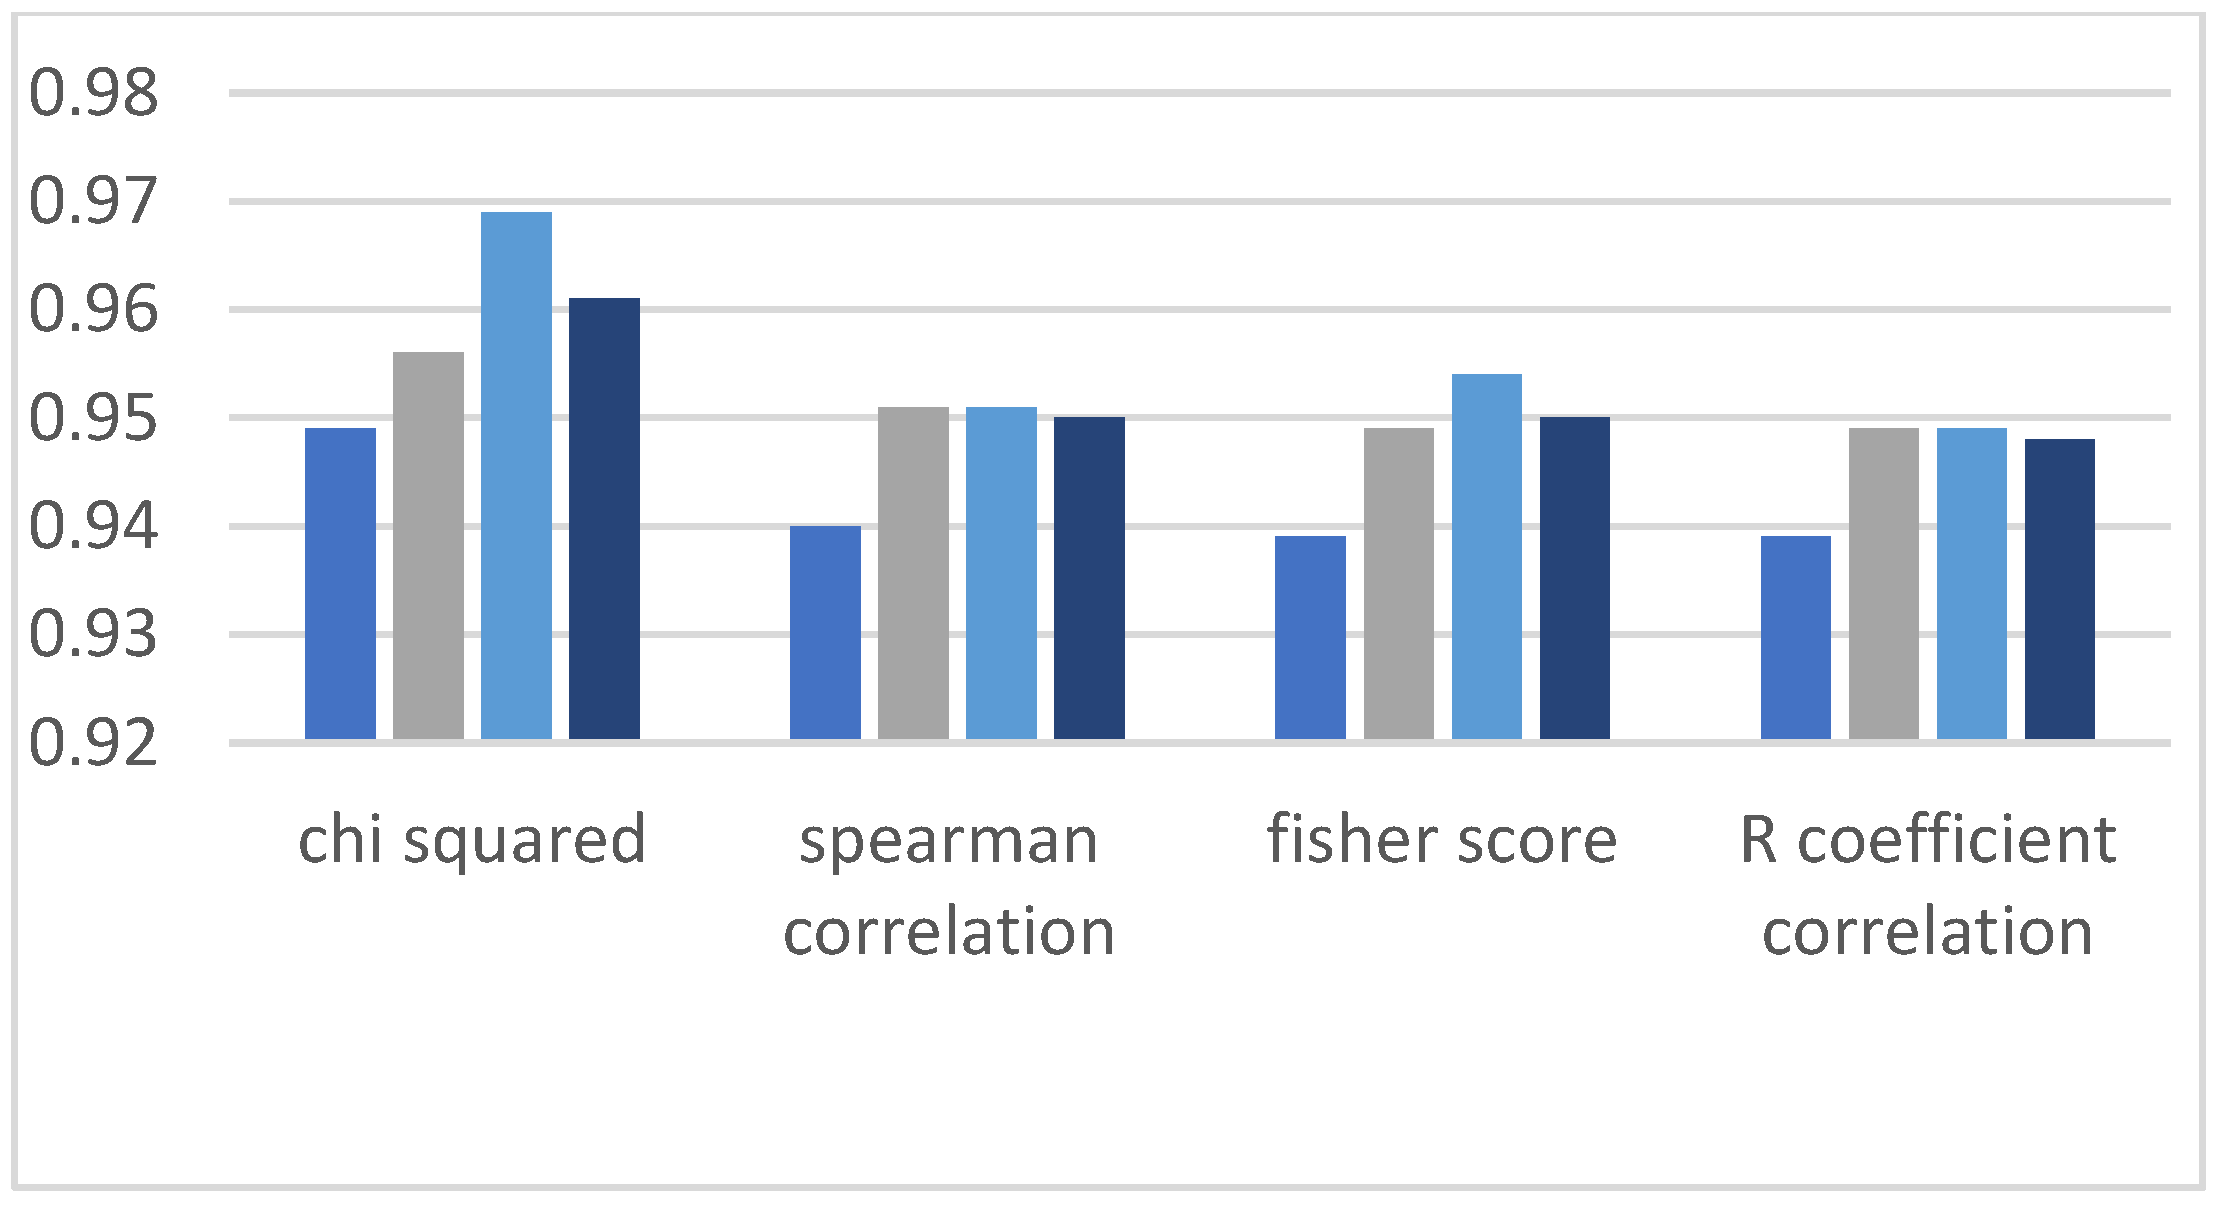
In this section, we analyze the accuracy of classification models with different feature selection methods. The bar charts shown below demonstrate the classified results, and the sets of bars are divided into four different bars. Each bar represents a different feature selection method, and every individual bar of the four different sections represents the evaluation of the ML algorithms by manually dividing the data into training and testing parts. In each set of four bars there are four different data set ratios: the first bar contains the 60% training data and 40% testing dataset, the second bar represents the 70%/30% dataset ratio, the third bar contains the 80%/20% dataset ratio and the fourth bar shows the 90%/10% dataset ratio [
31].
This research work observed two comparisons. The first comparison is among the feature selection methods, which means identifying the method that provides better classification results, and the second comparison is made between all the ML algorithms applied on highly ranked features. Accordingly, it can be observed in the graphs of
Figure 3,
Figure 4,
Figure 5,
Figure 6 and
Figure 7 that in the Chi-squared method, we obtained the best results as compared to other methods. Decision tree delivers the highest accuracy of 98%, and the decision forest provides the second-highest accuracy of 97%, while support vector machine and logistic regression algorithms demonstrate 77% accuracy.
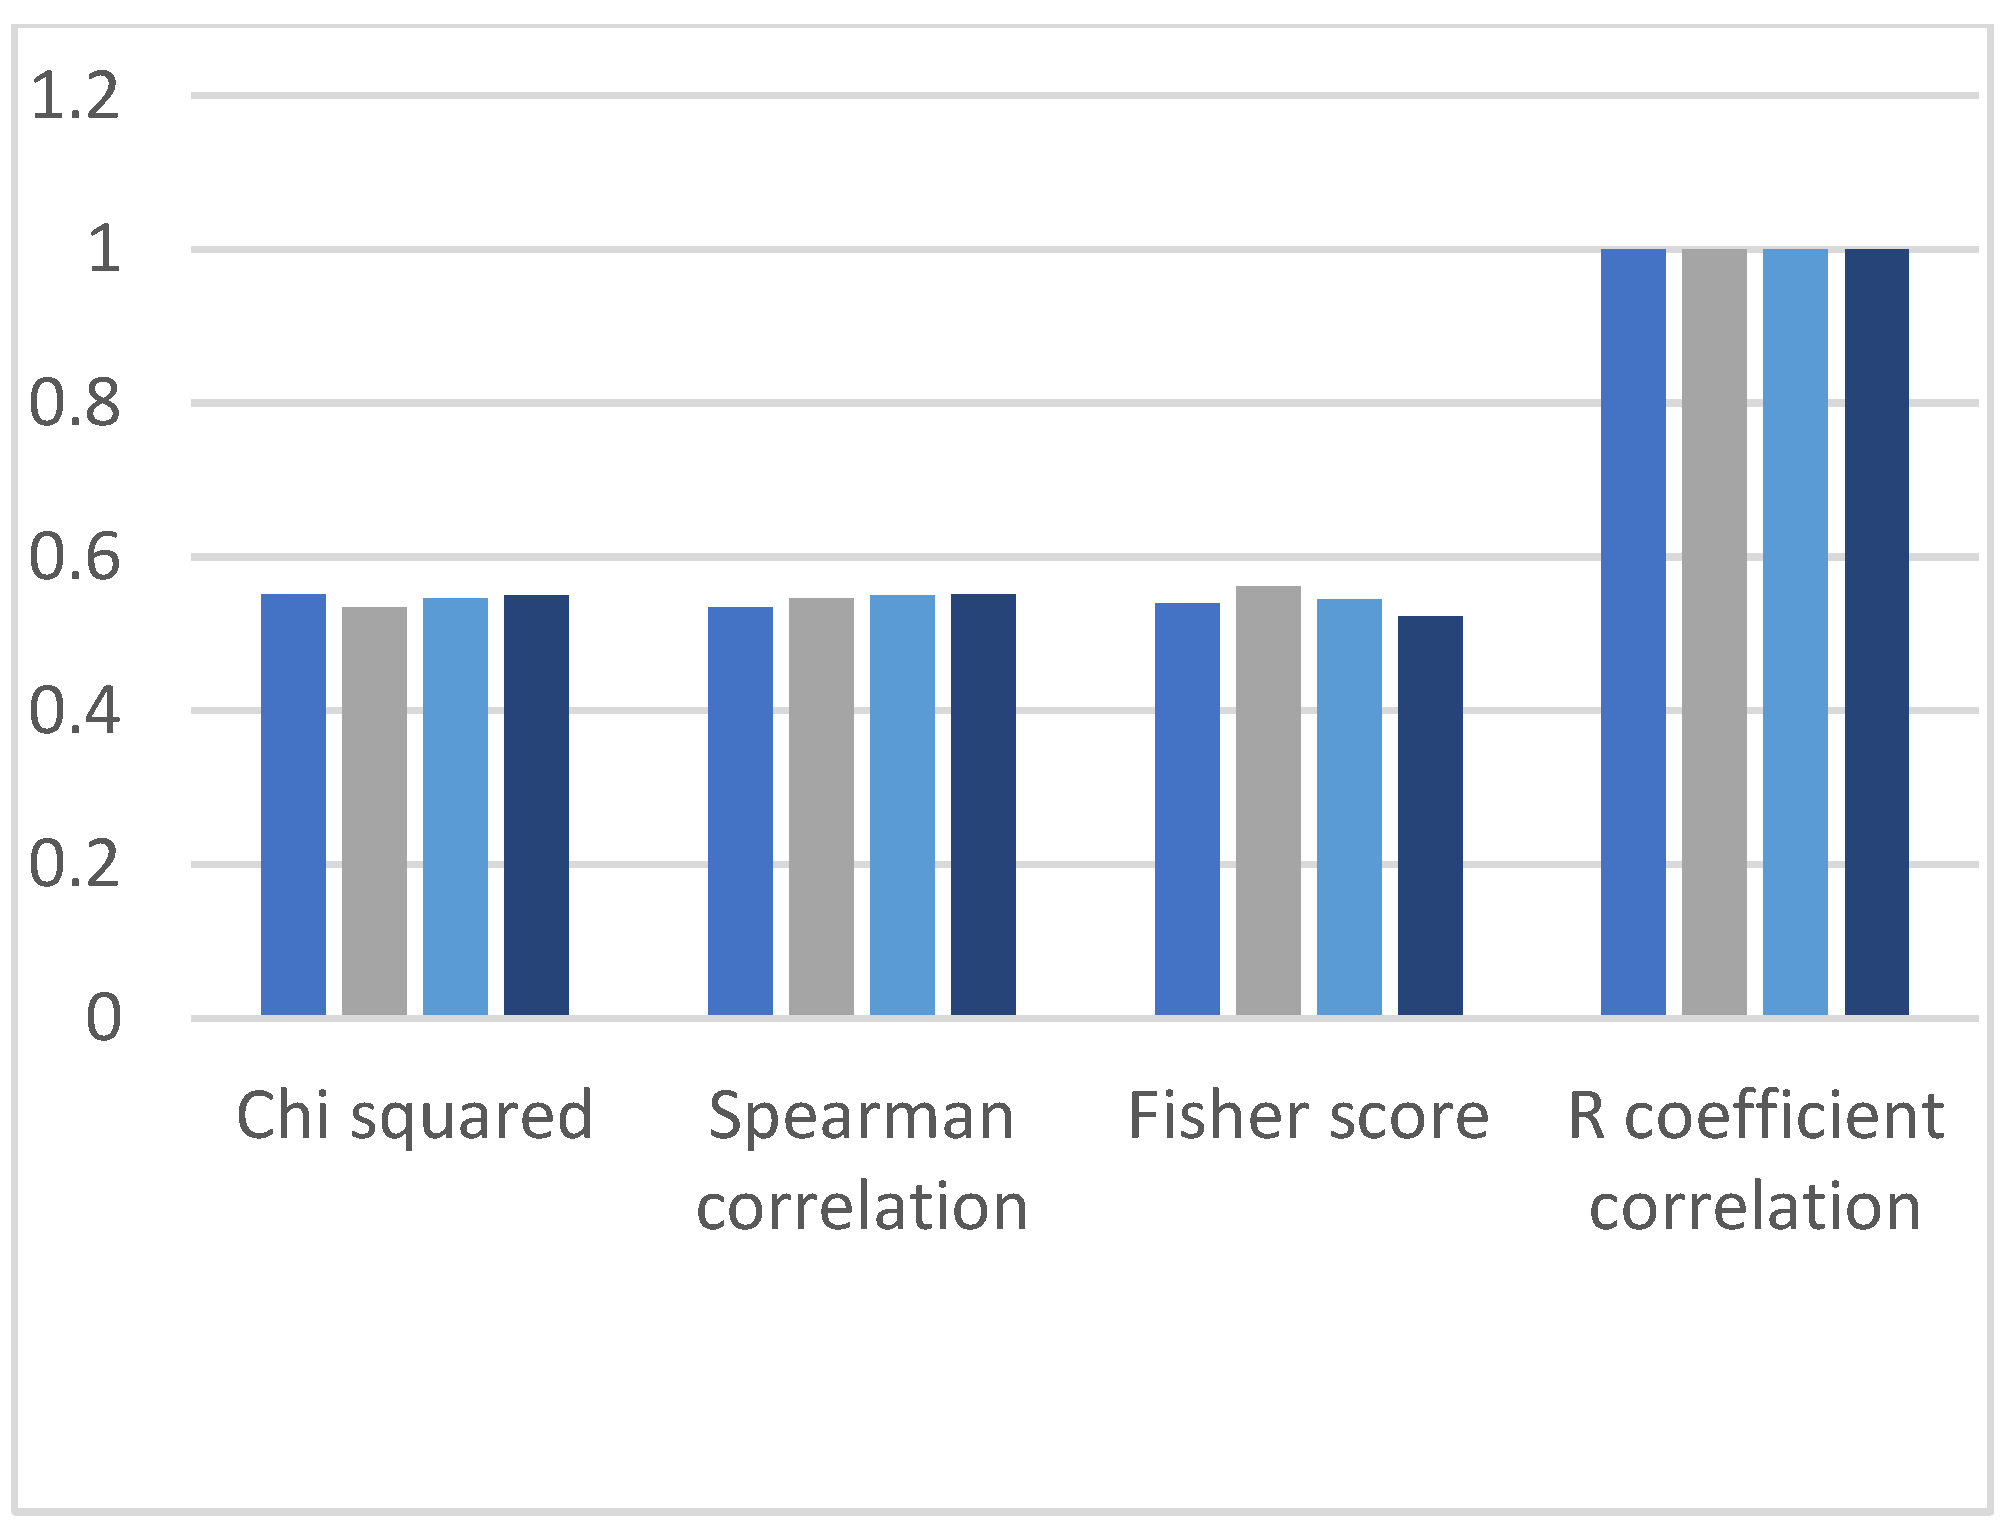
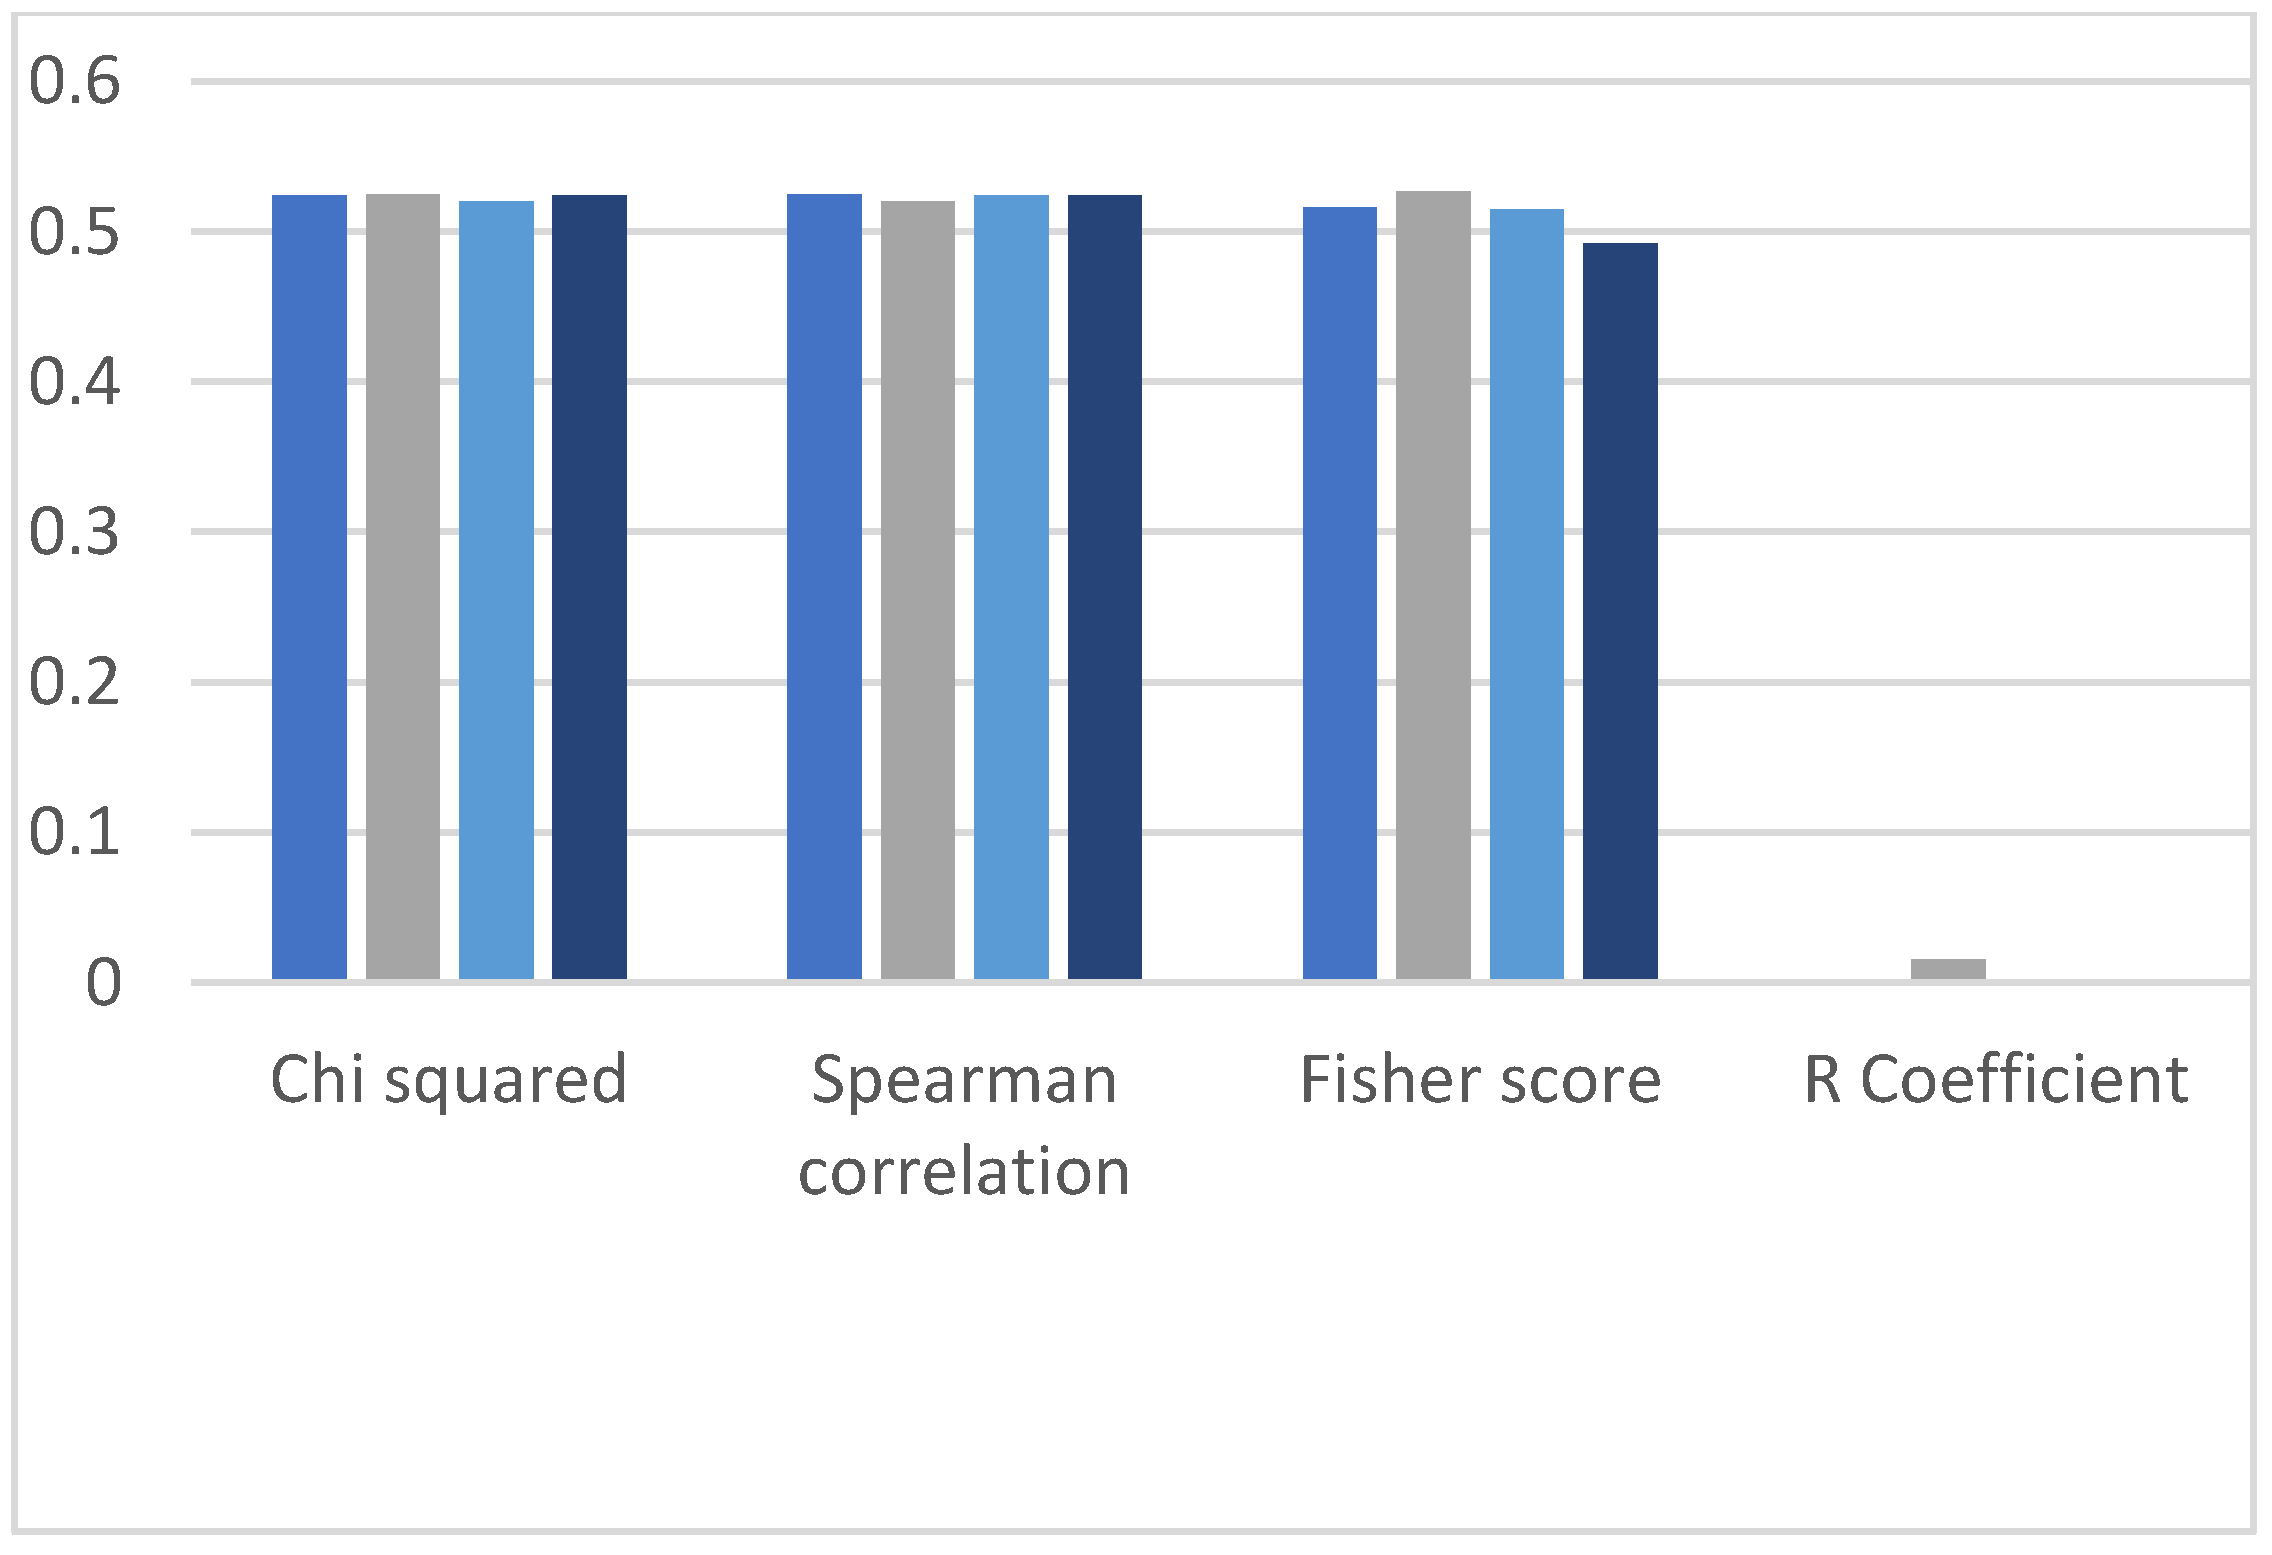
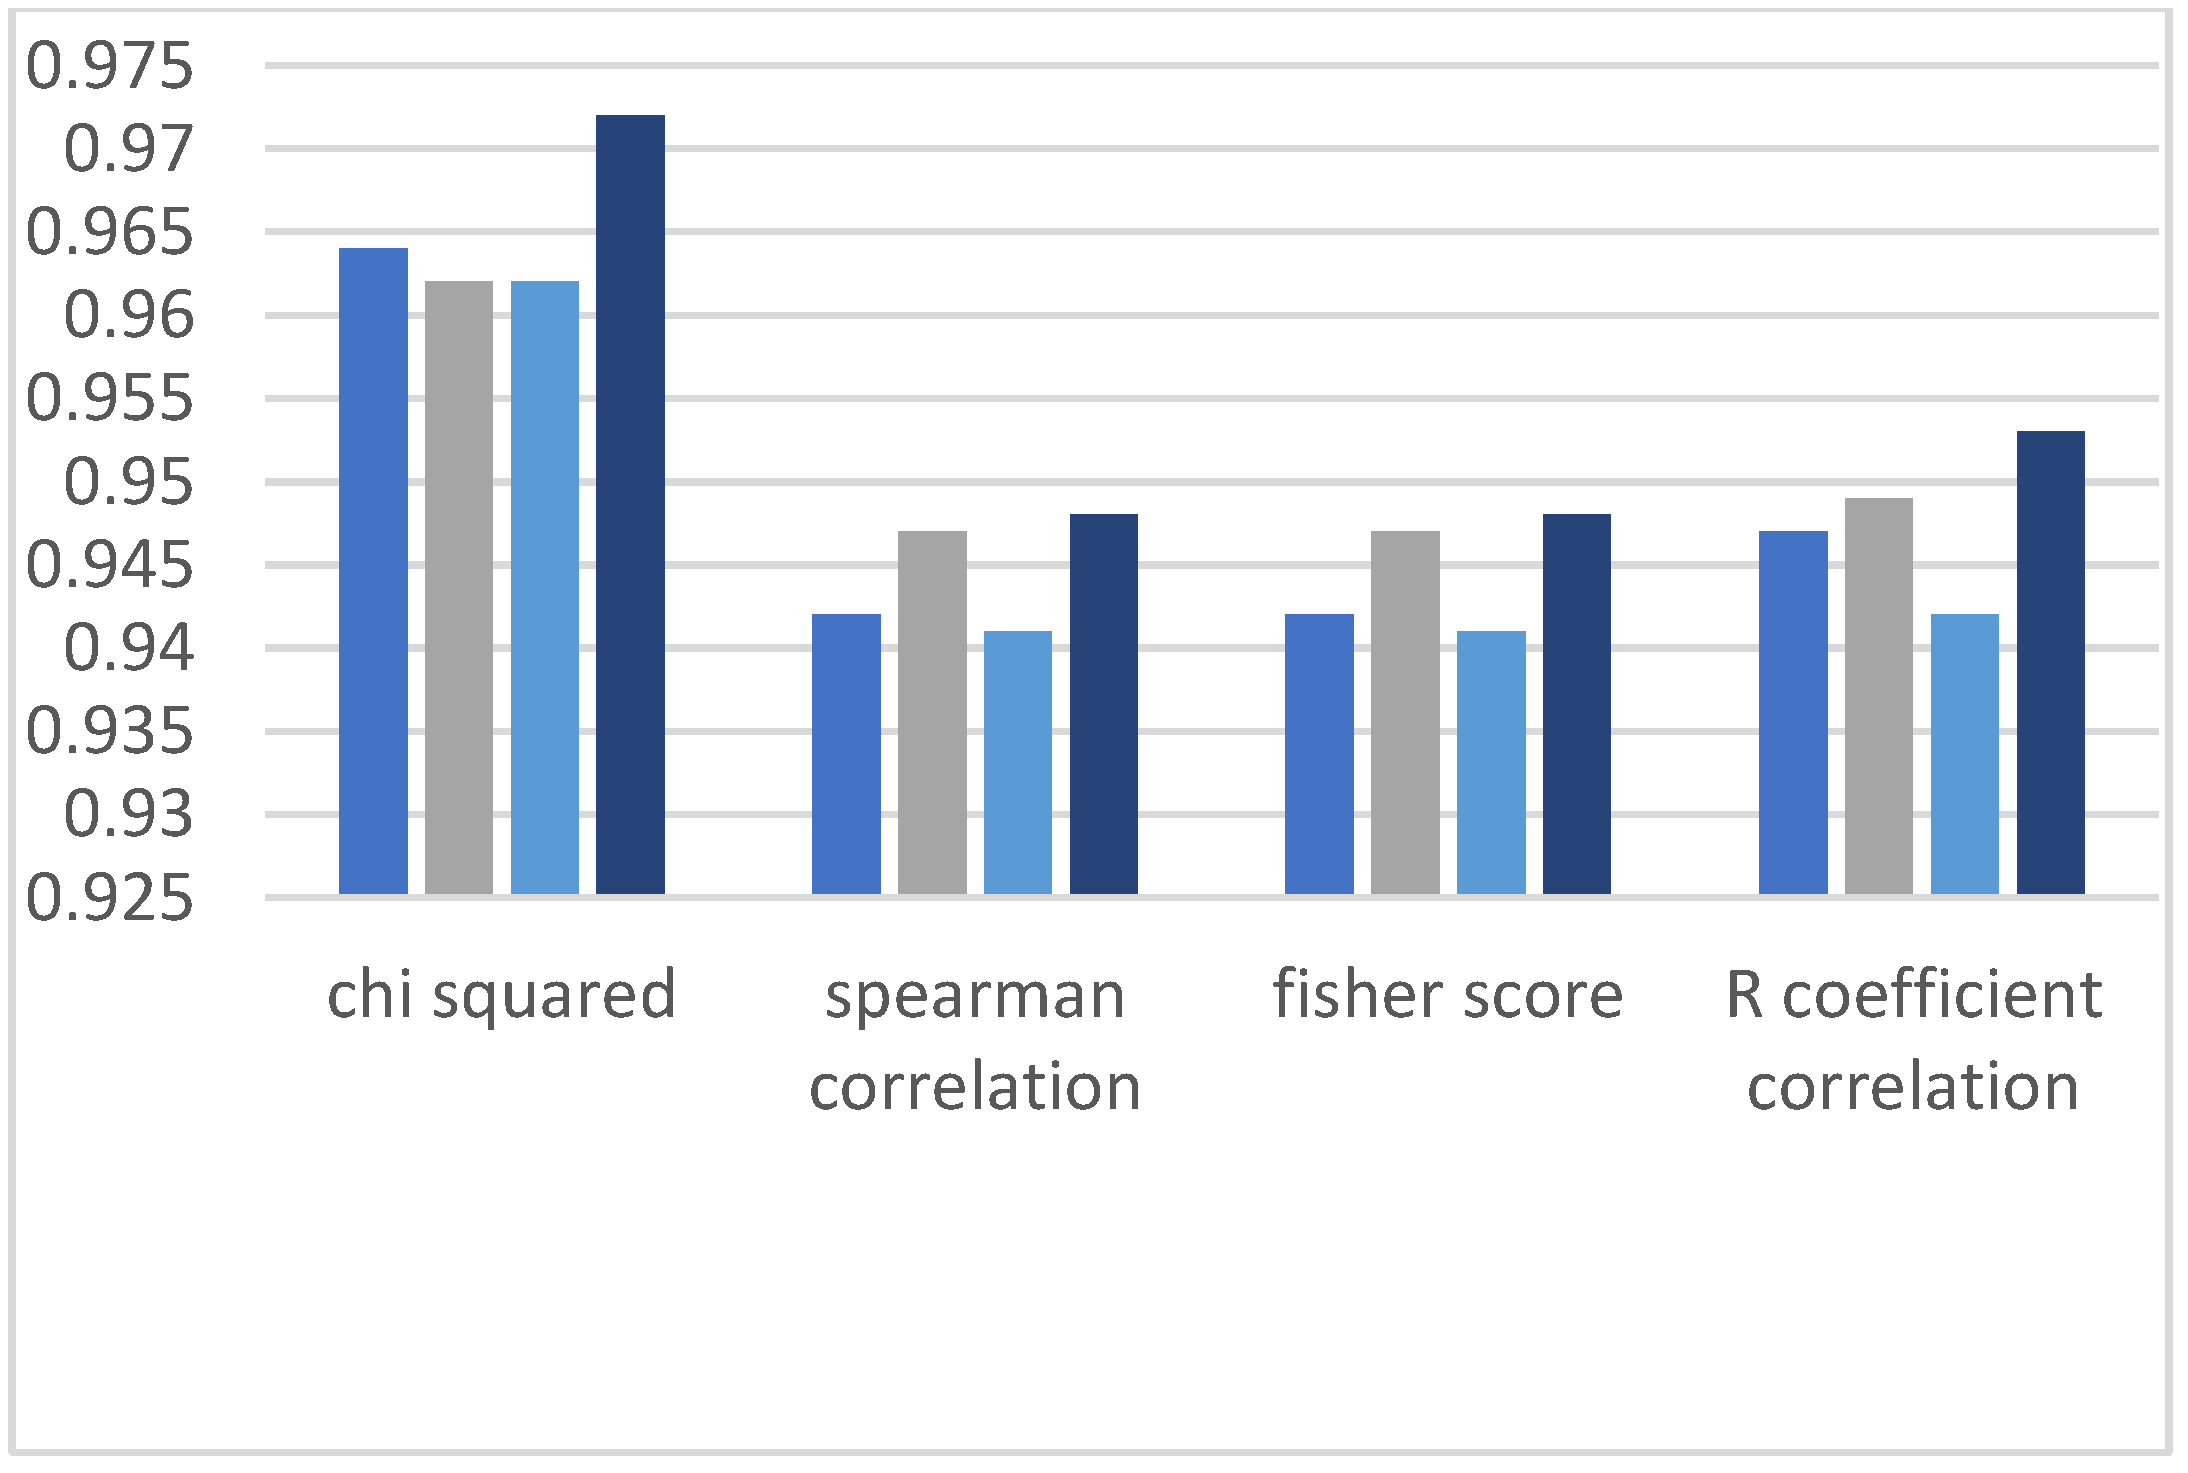
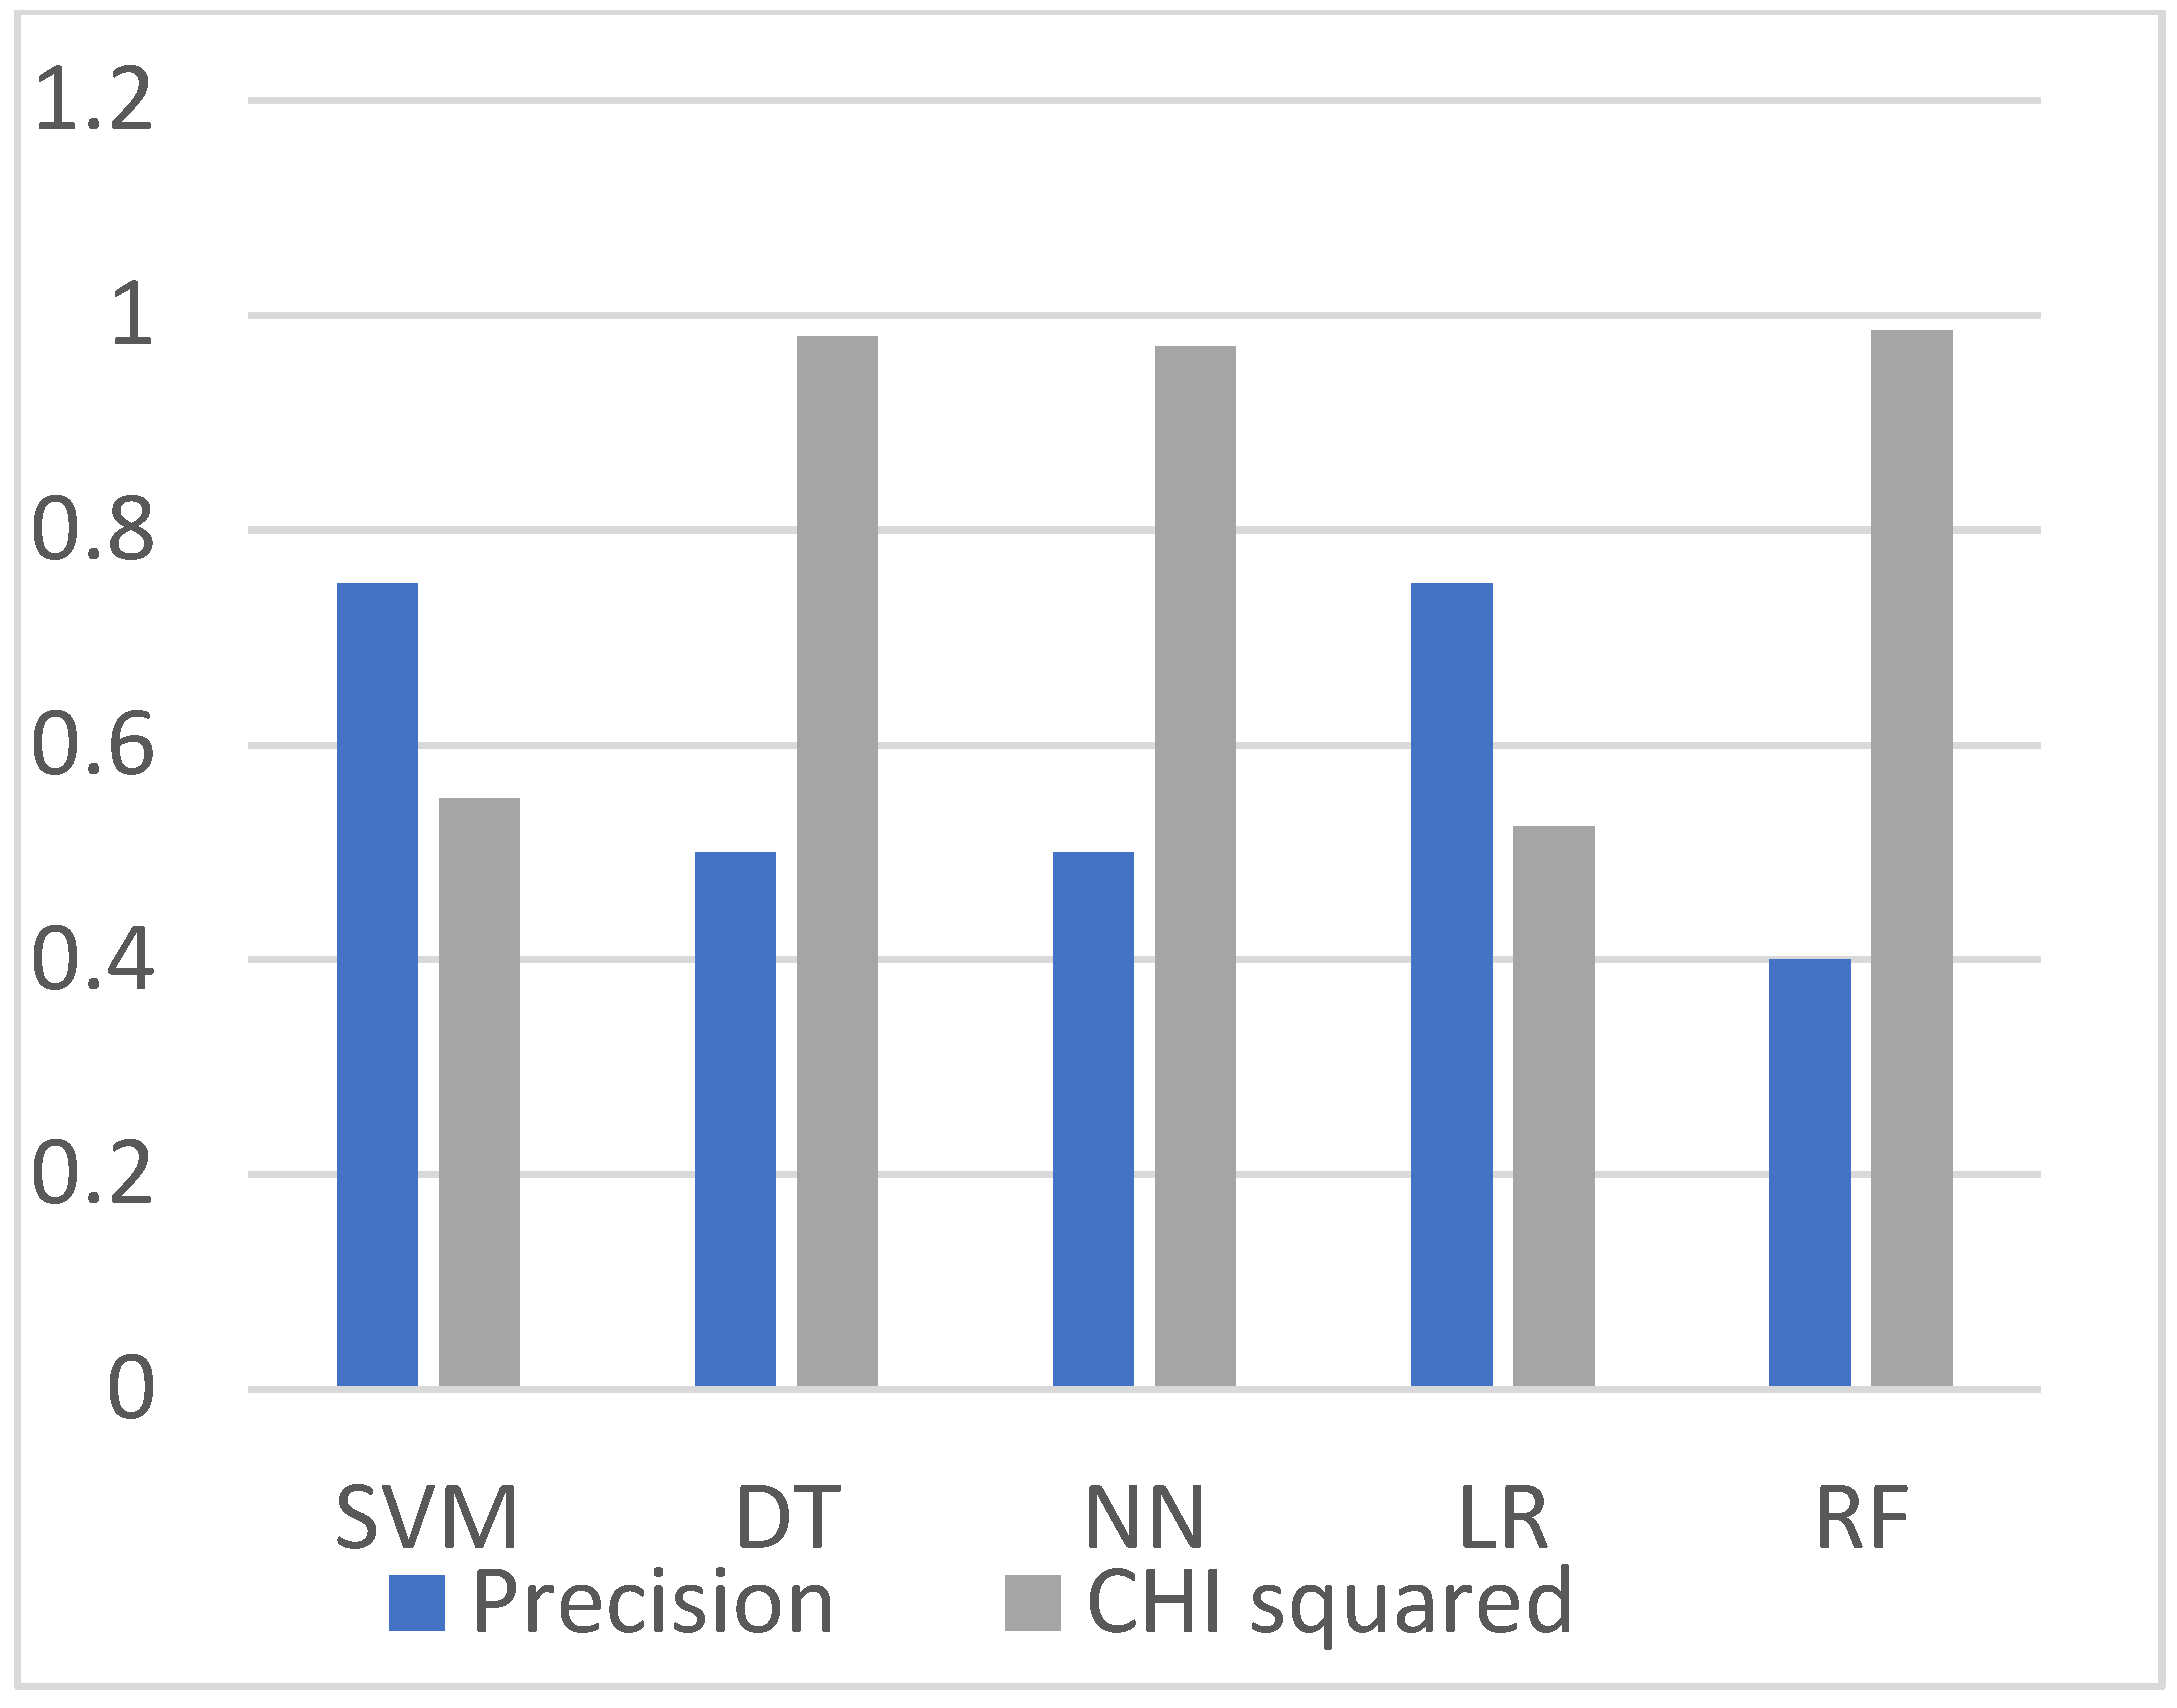
4.2. Comparisons of Precision of Spearman Correlation, Chi-Squared, R Coefficient Correlation and Fisher Score
In this section, each figure represents the evolution (60%/40%, 70%/30%,80%/20%, and 90%/10%) by containing four bars with each filter-based method (Chi-squared, spearman, fisher score and R coefficient relation). Therefore, all evaluation results are based on precision parameters of ML algorithms. We analyzed the classification results of precision measurement, and likewise, we have observed two observations from the dataset. It is observed from the graphs in
Figure 8,
Figure 9,
Figure 10,
Figure 11 and
Figure 12 that the Chi-squared method provides the best classification results, and DT, DF, and NN demonstrate the highest precision results on the HR dataset, and other ML algorithms have the lowest precision.
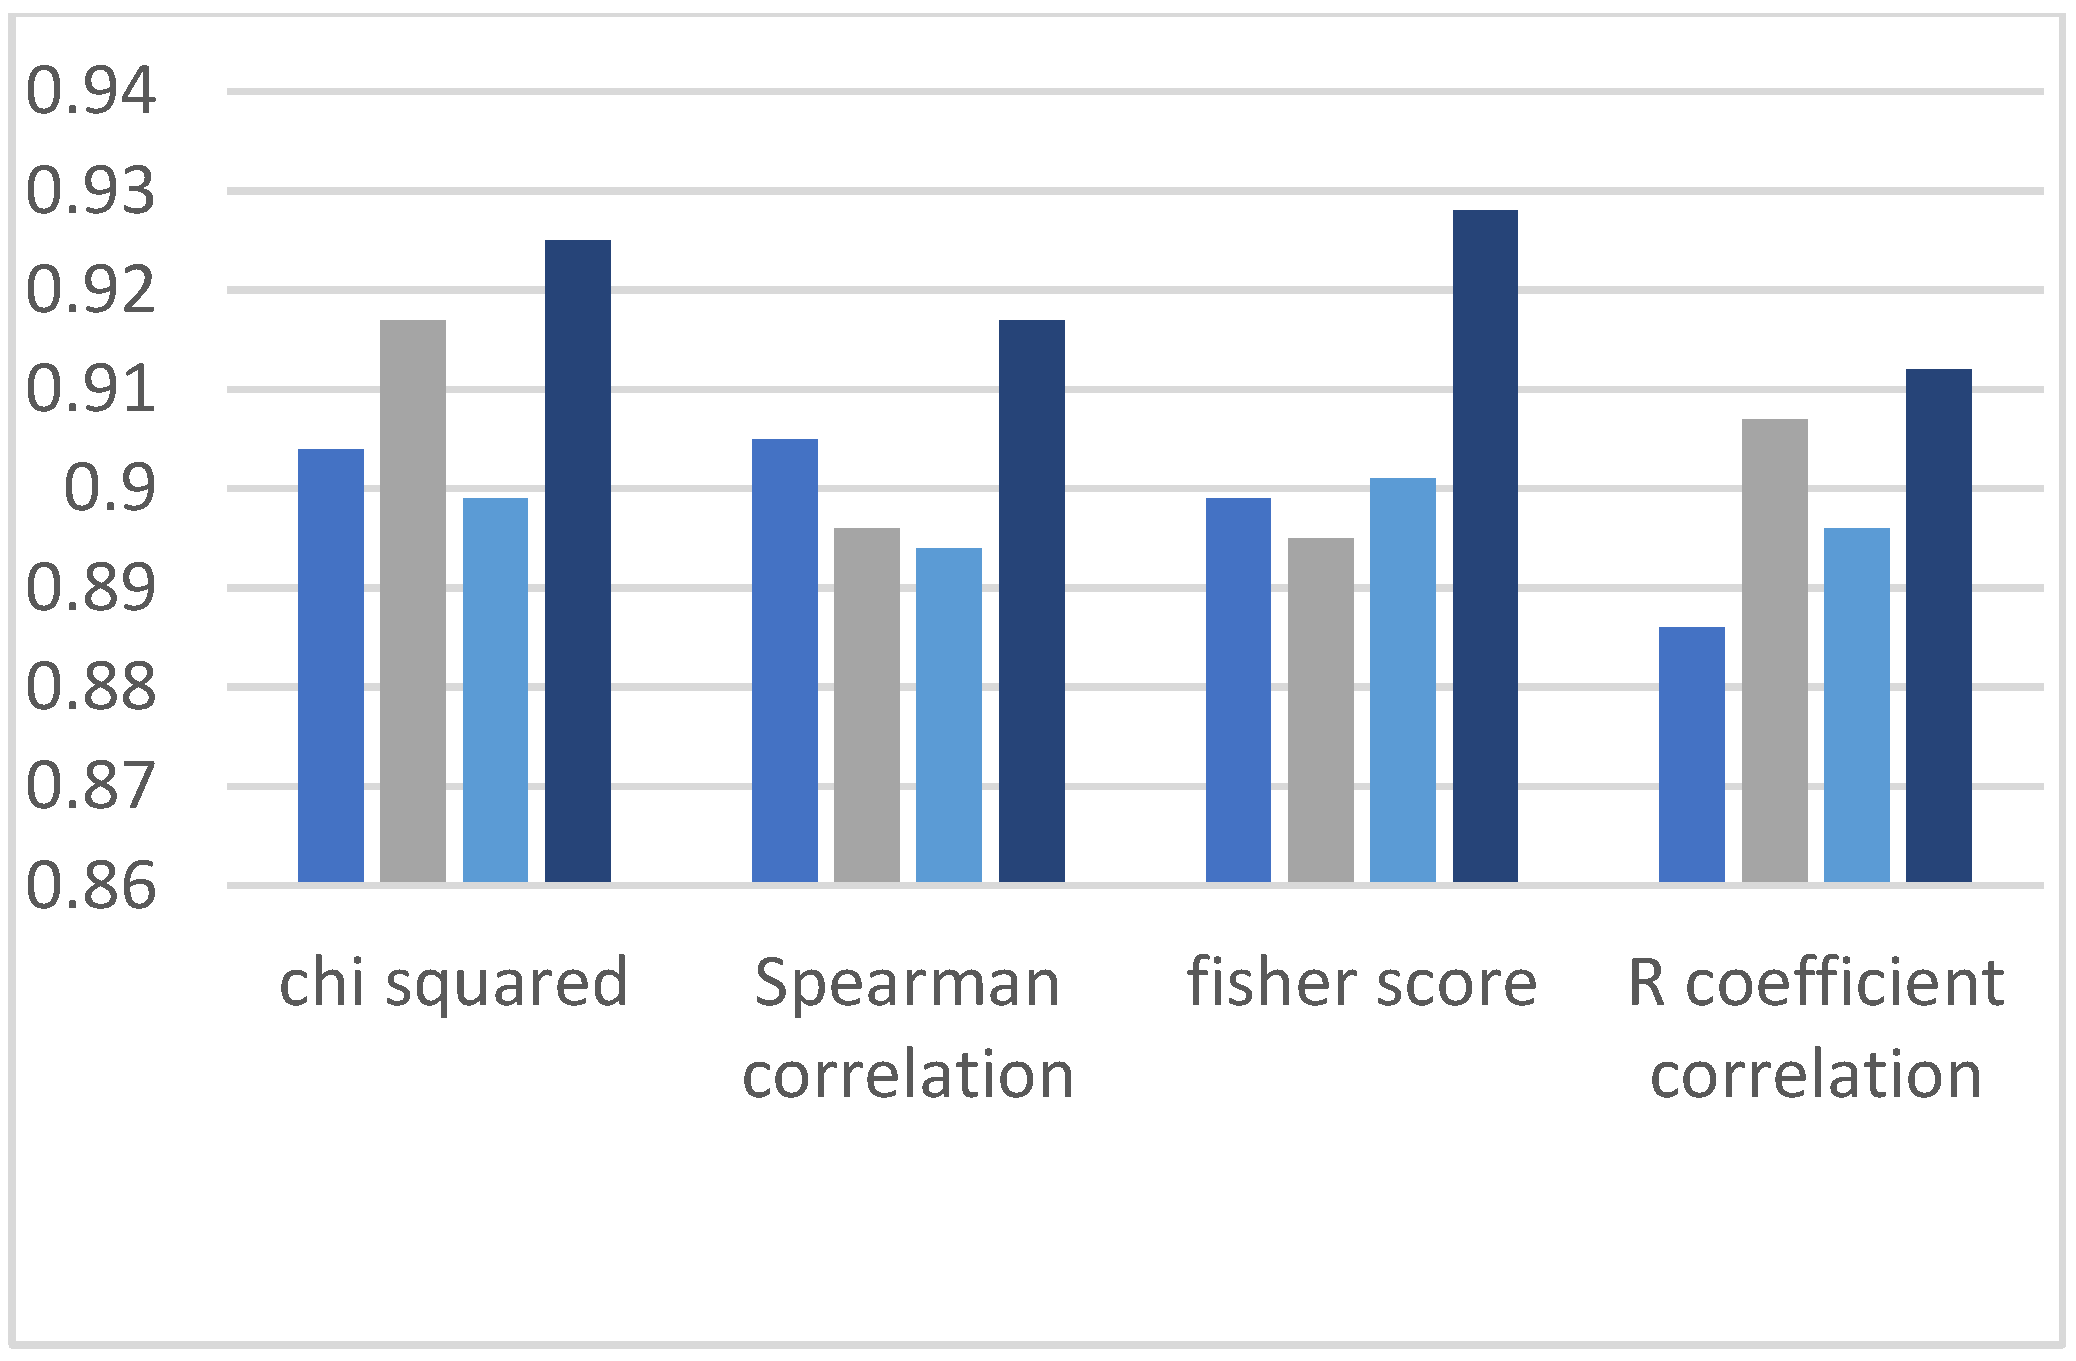
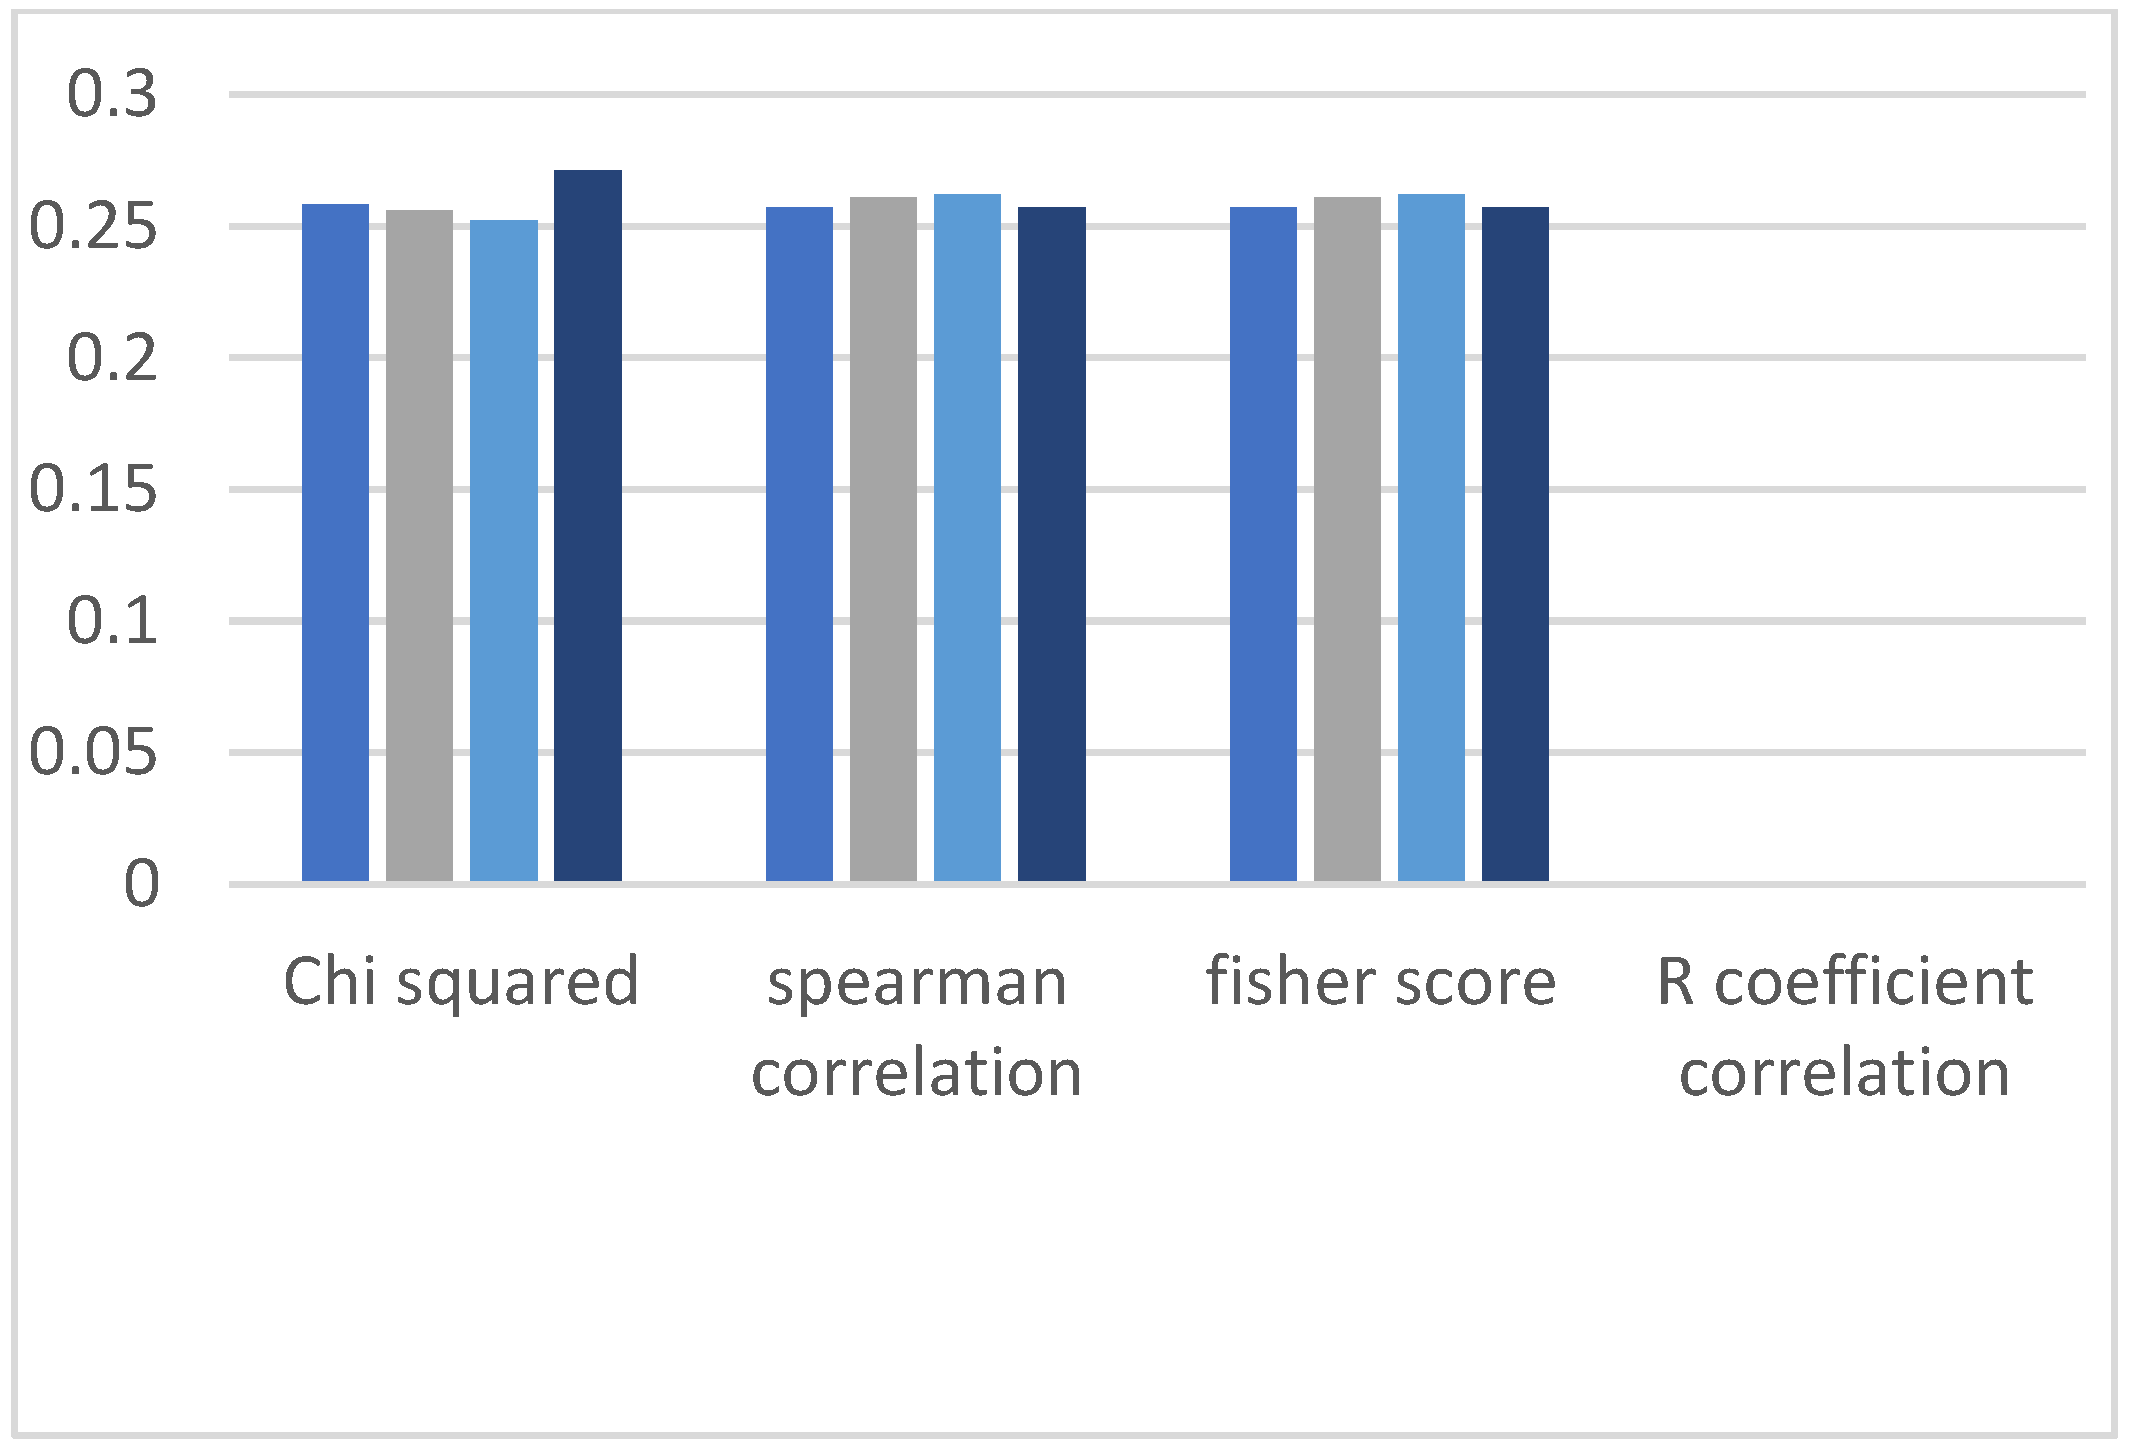
4.3. Comparison of Recall of Spearman Correlation, Chi-Squared, R Coefficient Correlation and Fisher Score
Similarly, each figure in this section represents four evaluation bars of results along with four filter-based methods. In the recall section, we obtain similar observations observed in the classification results’ accuracy and precision parameters. The graphs shown in
Figure 13,
Figure 14,
Figure 15,
Figure 16 and
Figure 17 show high recall values when we applied the Chi-squared method, and the lowest value of recall is observed when the R coefficient correlation method is applied.
Table 2 shows the summarized view of the algorithm results. In this table, we mentioned four filter-based methods which show that this research selected only the top features from the HR dataset and trained 60% and test 40% data. Then, we applied five ML algorithms (SVM, DT, NN, LR, DF) based on the top features. The ML algorithm results are divided into three sub-sections, which are accuracy, precision and recall. The accuracy section provides a detailed view of the algorithm accuracy results, and similarly, the other two sub-sections’ results are divided into precision and recall results of machine learning models. The yellow highlighted single row shows the highest results of all ML algorithms when we select the Chi-squared method, and the orange highlighted columns show the highest accuracy, precision and recall of decision tree when we compared the algorithms’ results.
After this detailed comparison and evaluation, we established an important finding based on this work, that when we add the training data in every scenario for evaluation, the situation does not improve the classification results, and displays the reverse trend of results. If the pattern of results is reversed in machine learning, then there are several reasons [
14]. Our HR dataset consists of large numbers of records, therefore, there is the possibility that these algorithms cannot hold corner cases, which leads to misclassification. Hence, these data need to be represented in a well-classified manner.
Furthermore, the second possibility is overfitting, as we know that overfitting implies that we tried to train our models with many data. In this research, we have applied five ML models over-fitted because we increase the 10% training data in every case, which means there is a much greater chance for the ML algorithm to learn from the noise and outlier points. One solution to avoid overfitting is to use linear models, therefore, we have also applied linear models, i.e., decision tree, decision forest, and neural networks.
5. Performance Evaluation of RFE and Chi-Squared Method
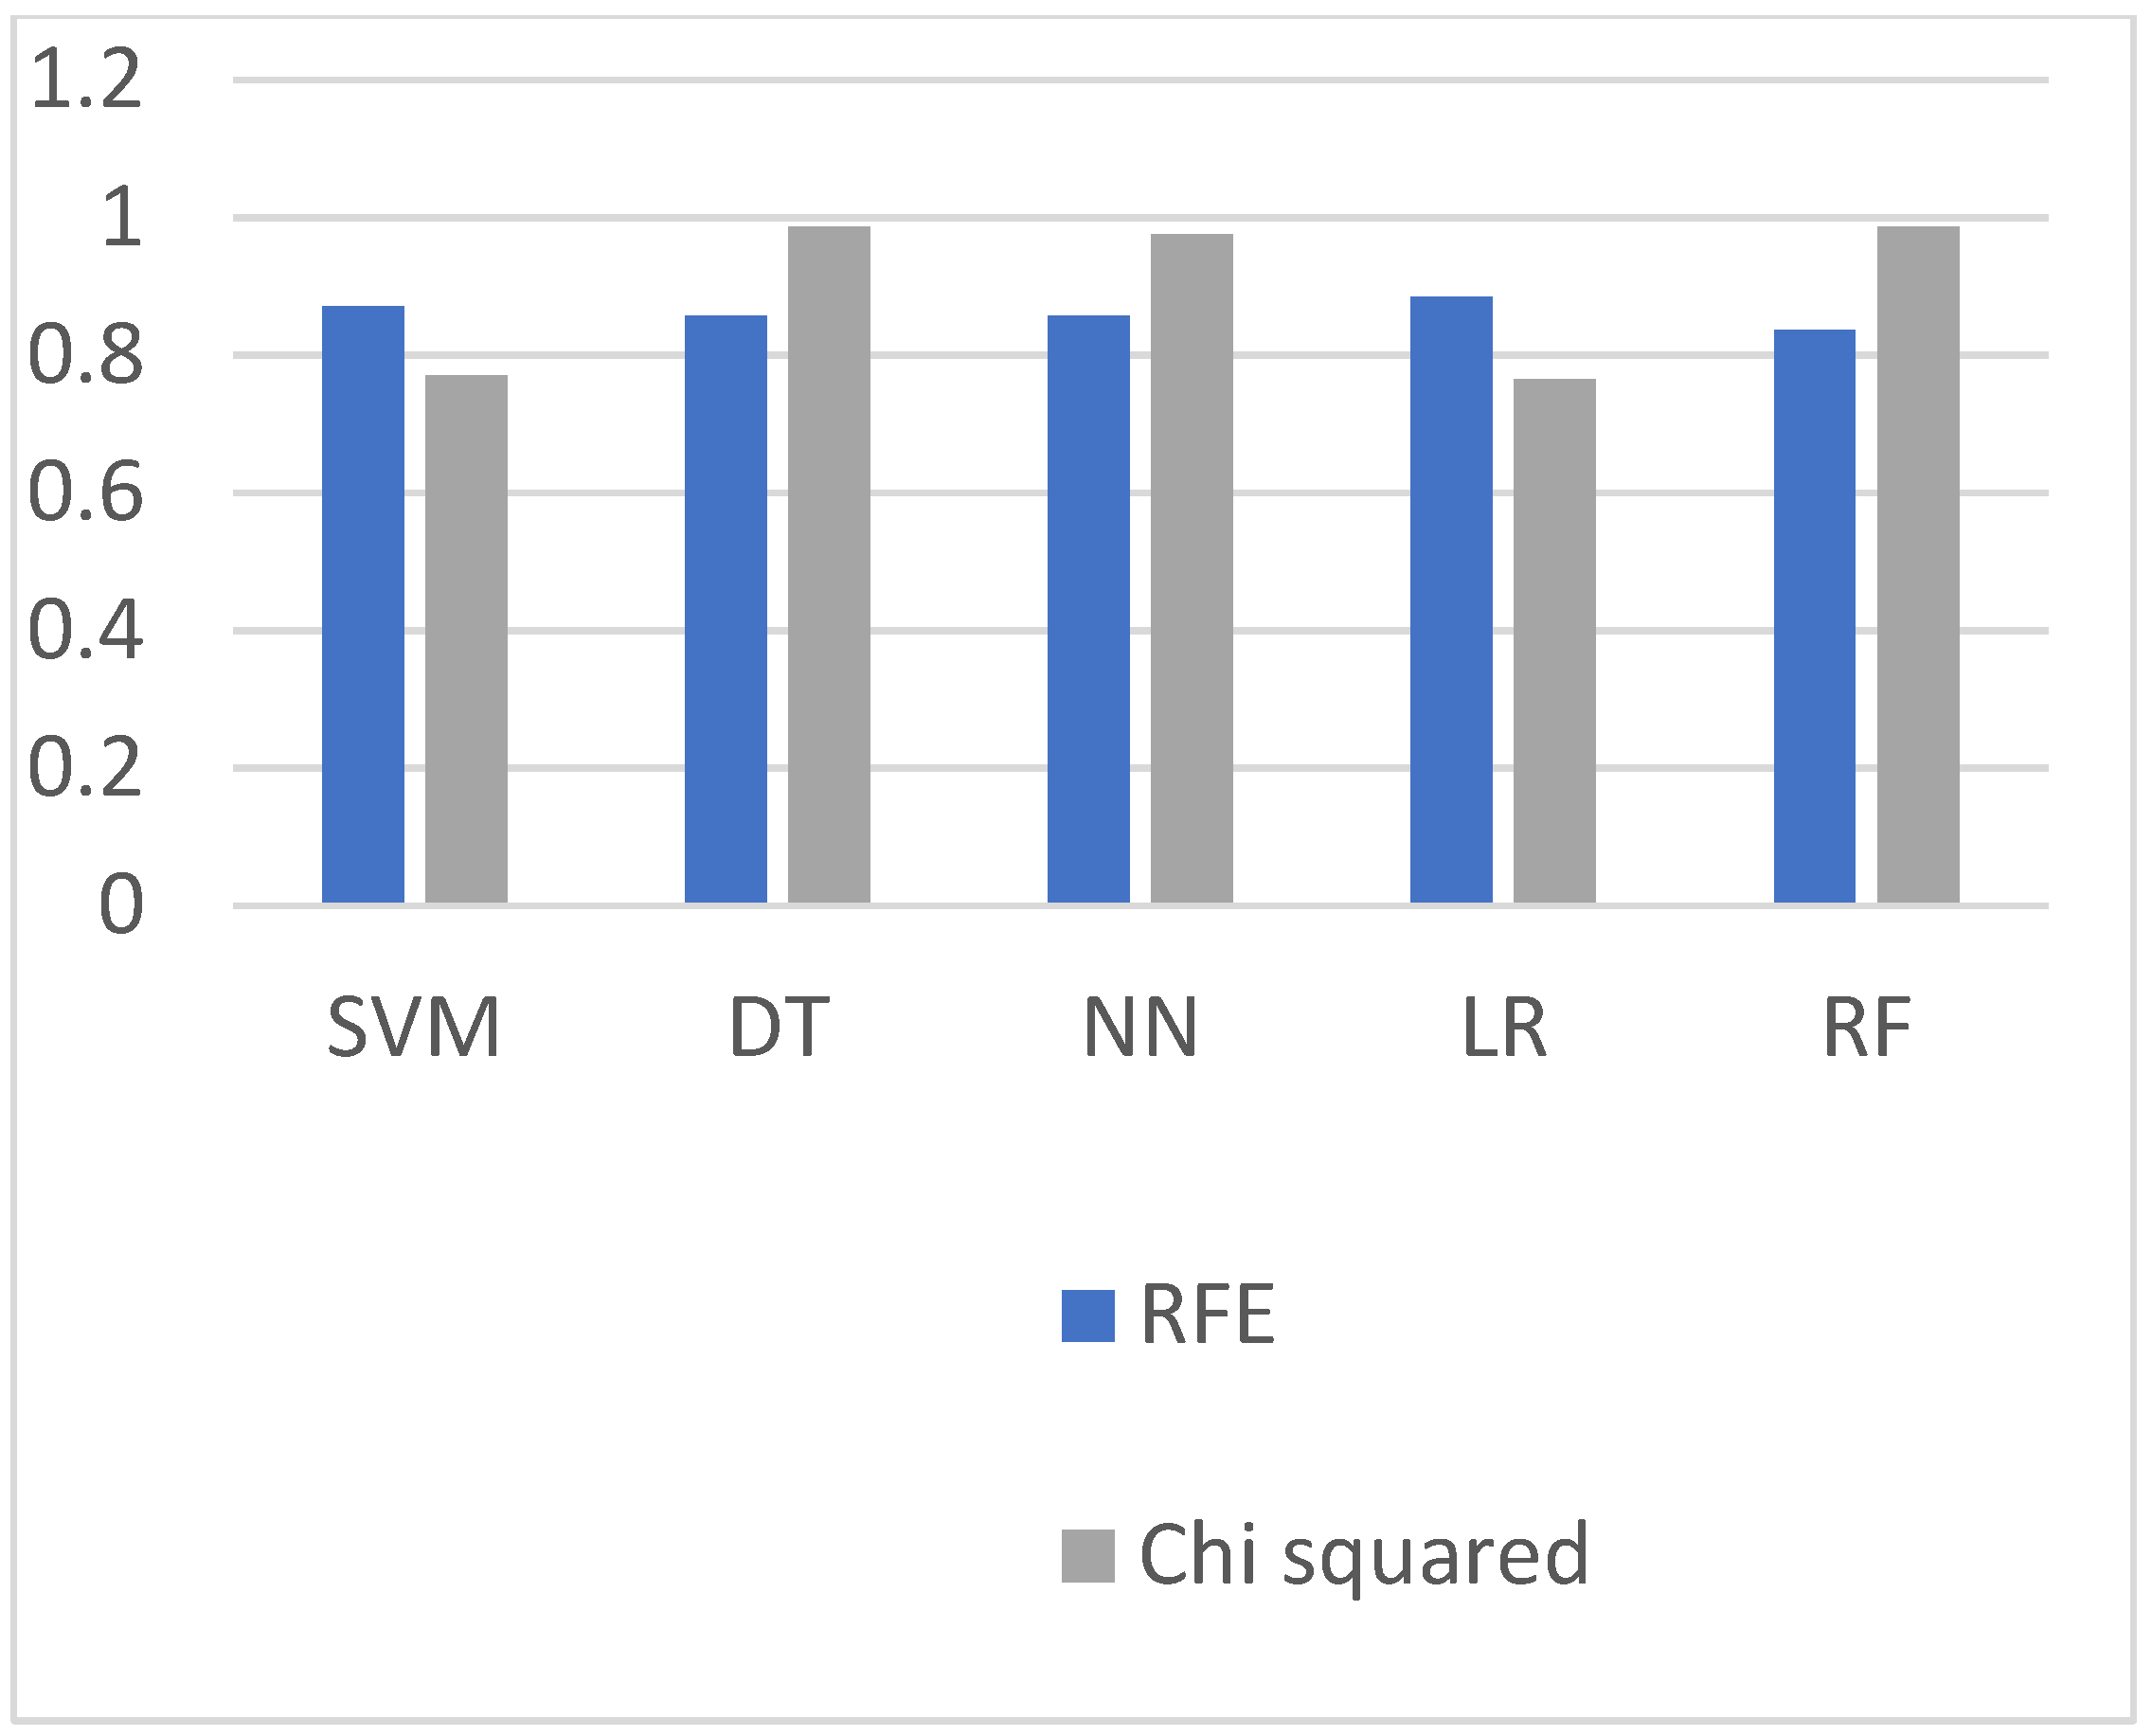
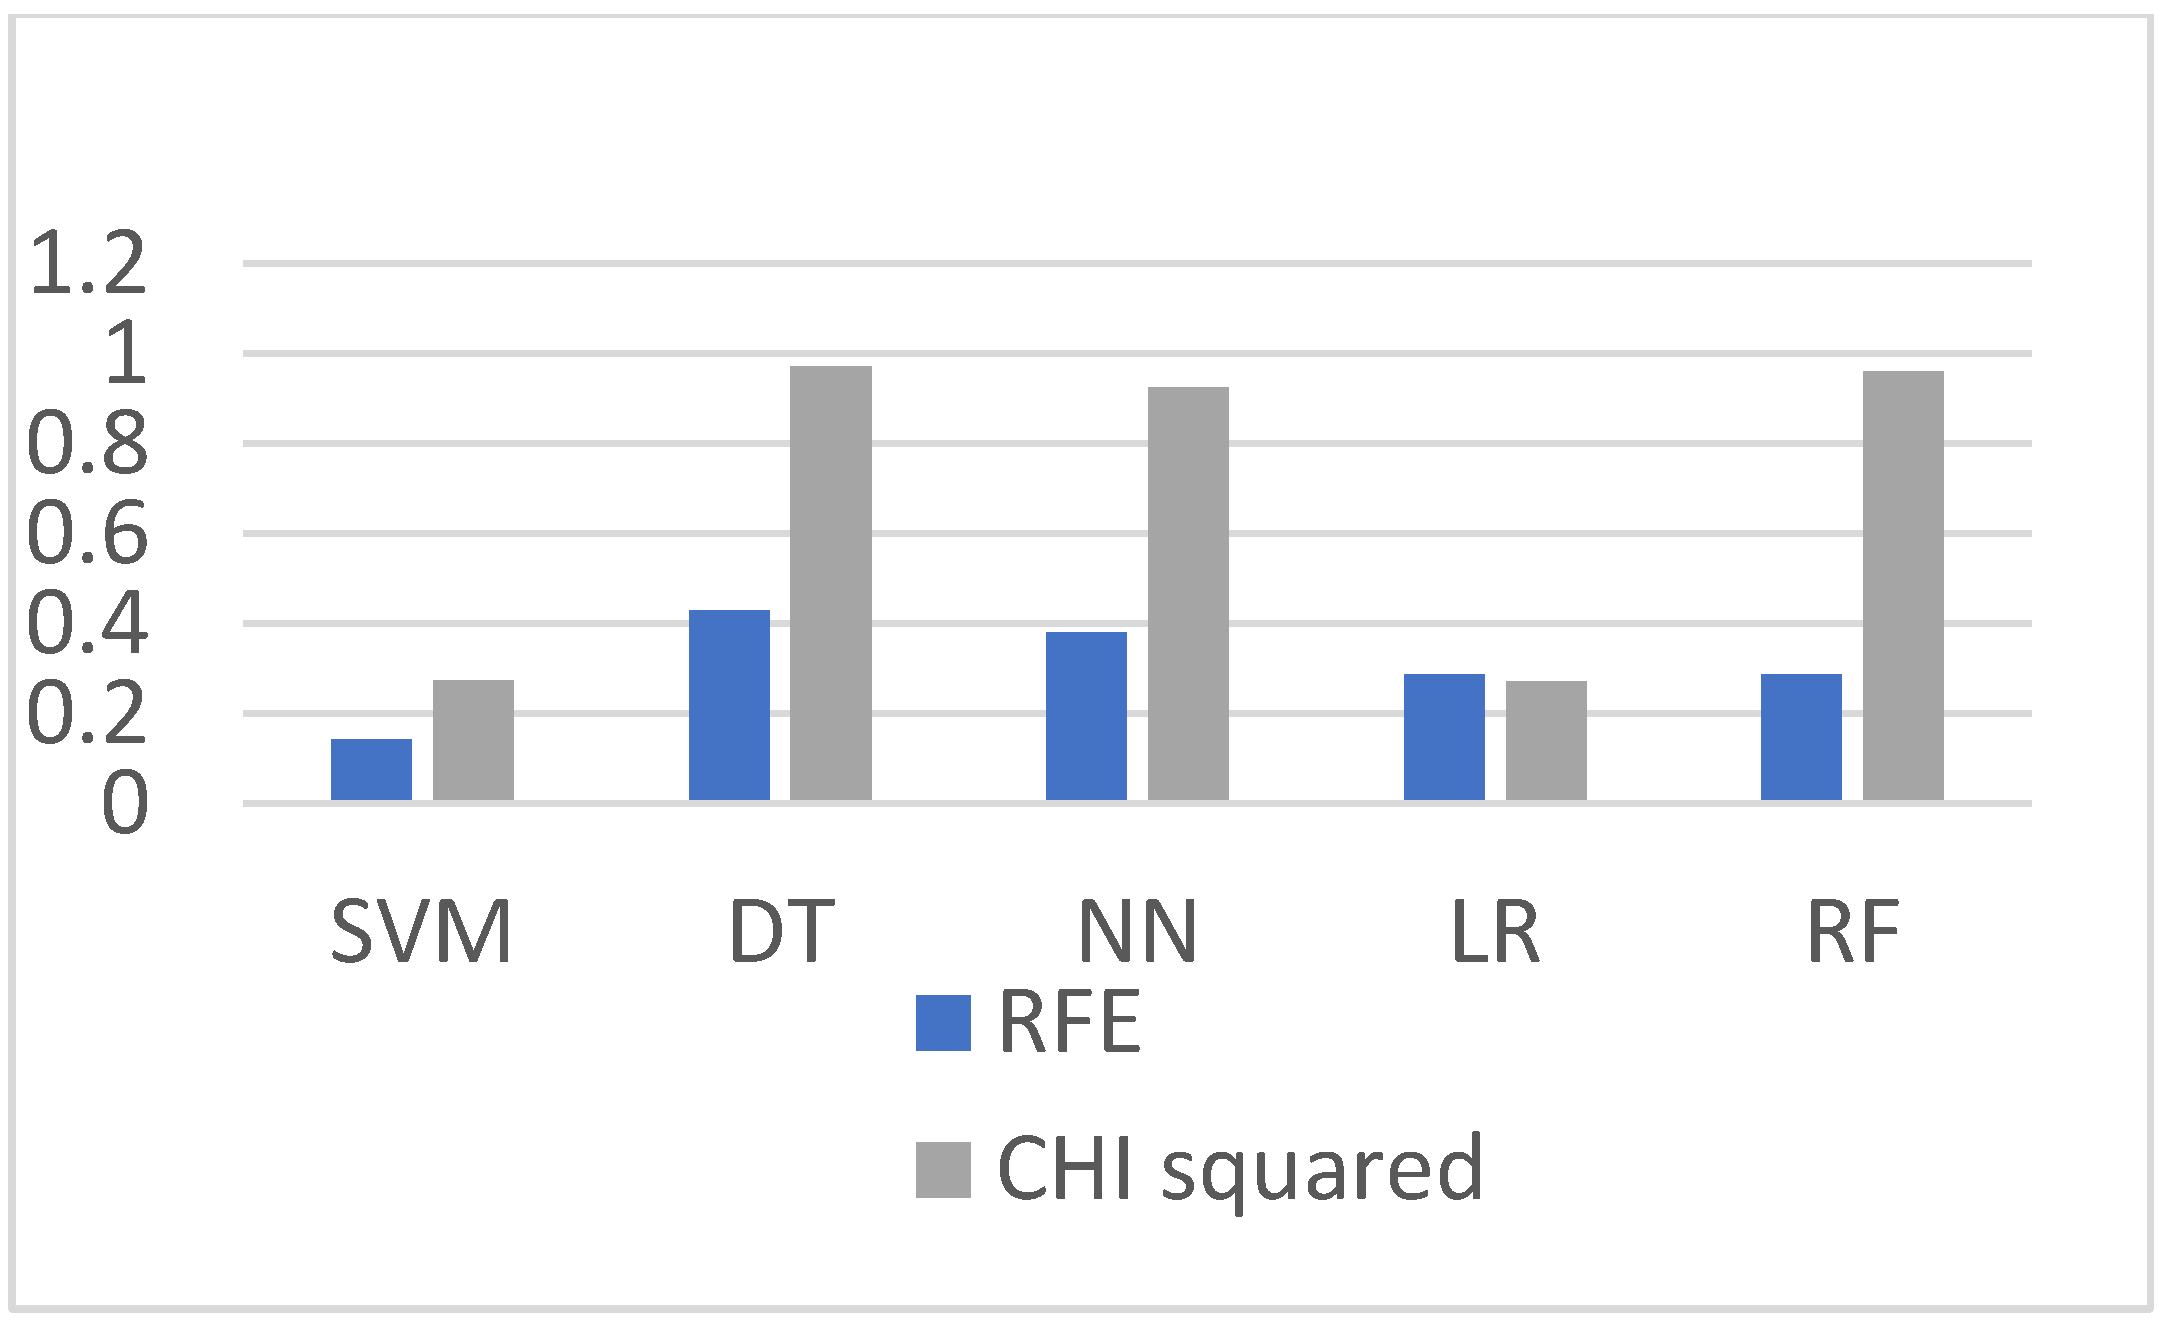
The RFE-based model is mentioned in the literature review, and this section compares and discusses the classification results between the models. RFE is an EDA technique that is used for feature selection. The RFE method’s objective is to select features reclusively; this technique was not computationally effective because the selecting of the features was continued until we did not obtain good results. We compare the results of our prediction model with the RFE-based prediction model shown in
Figure 18. It can be observed from graphs shown in
Figure 19,
Figure 20 and
Figure 21 that the Chi-squared-based algorithms provide more improved results as compared to the RFE-based algorithms.
6. Risk Model of Active/Current Employees
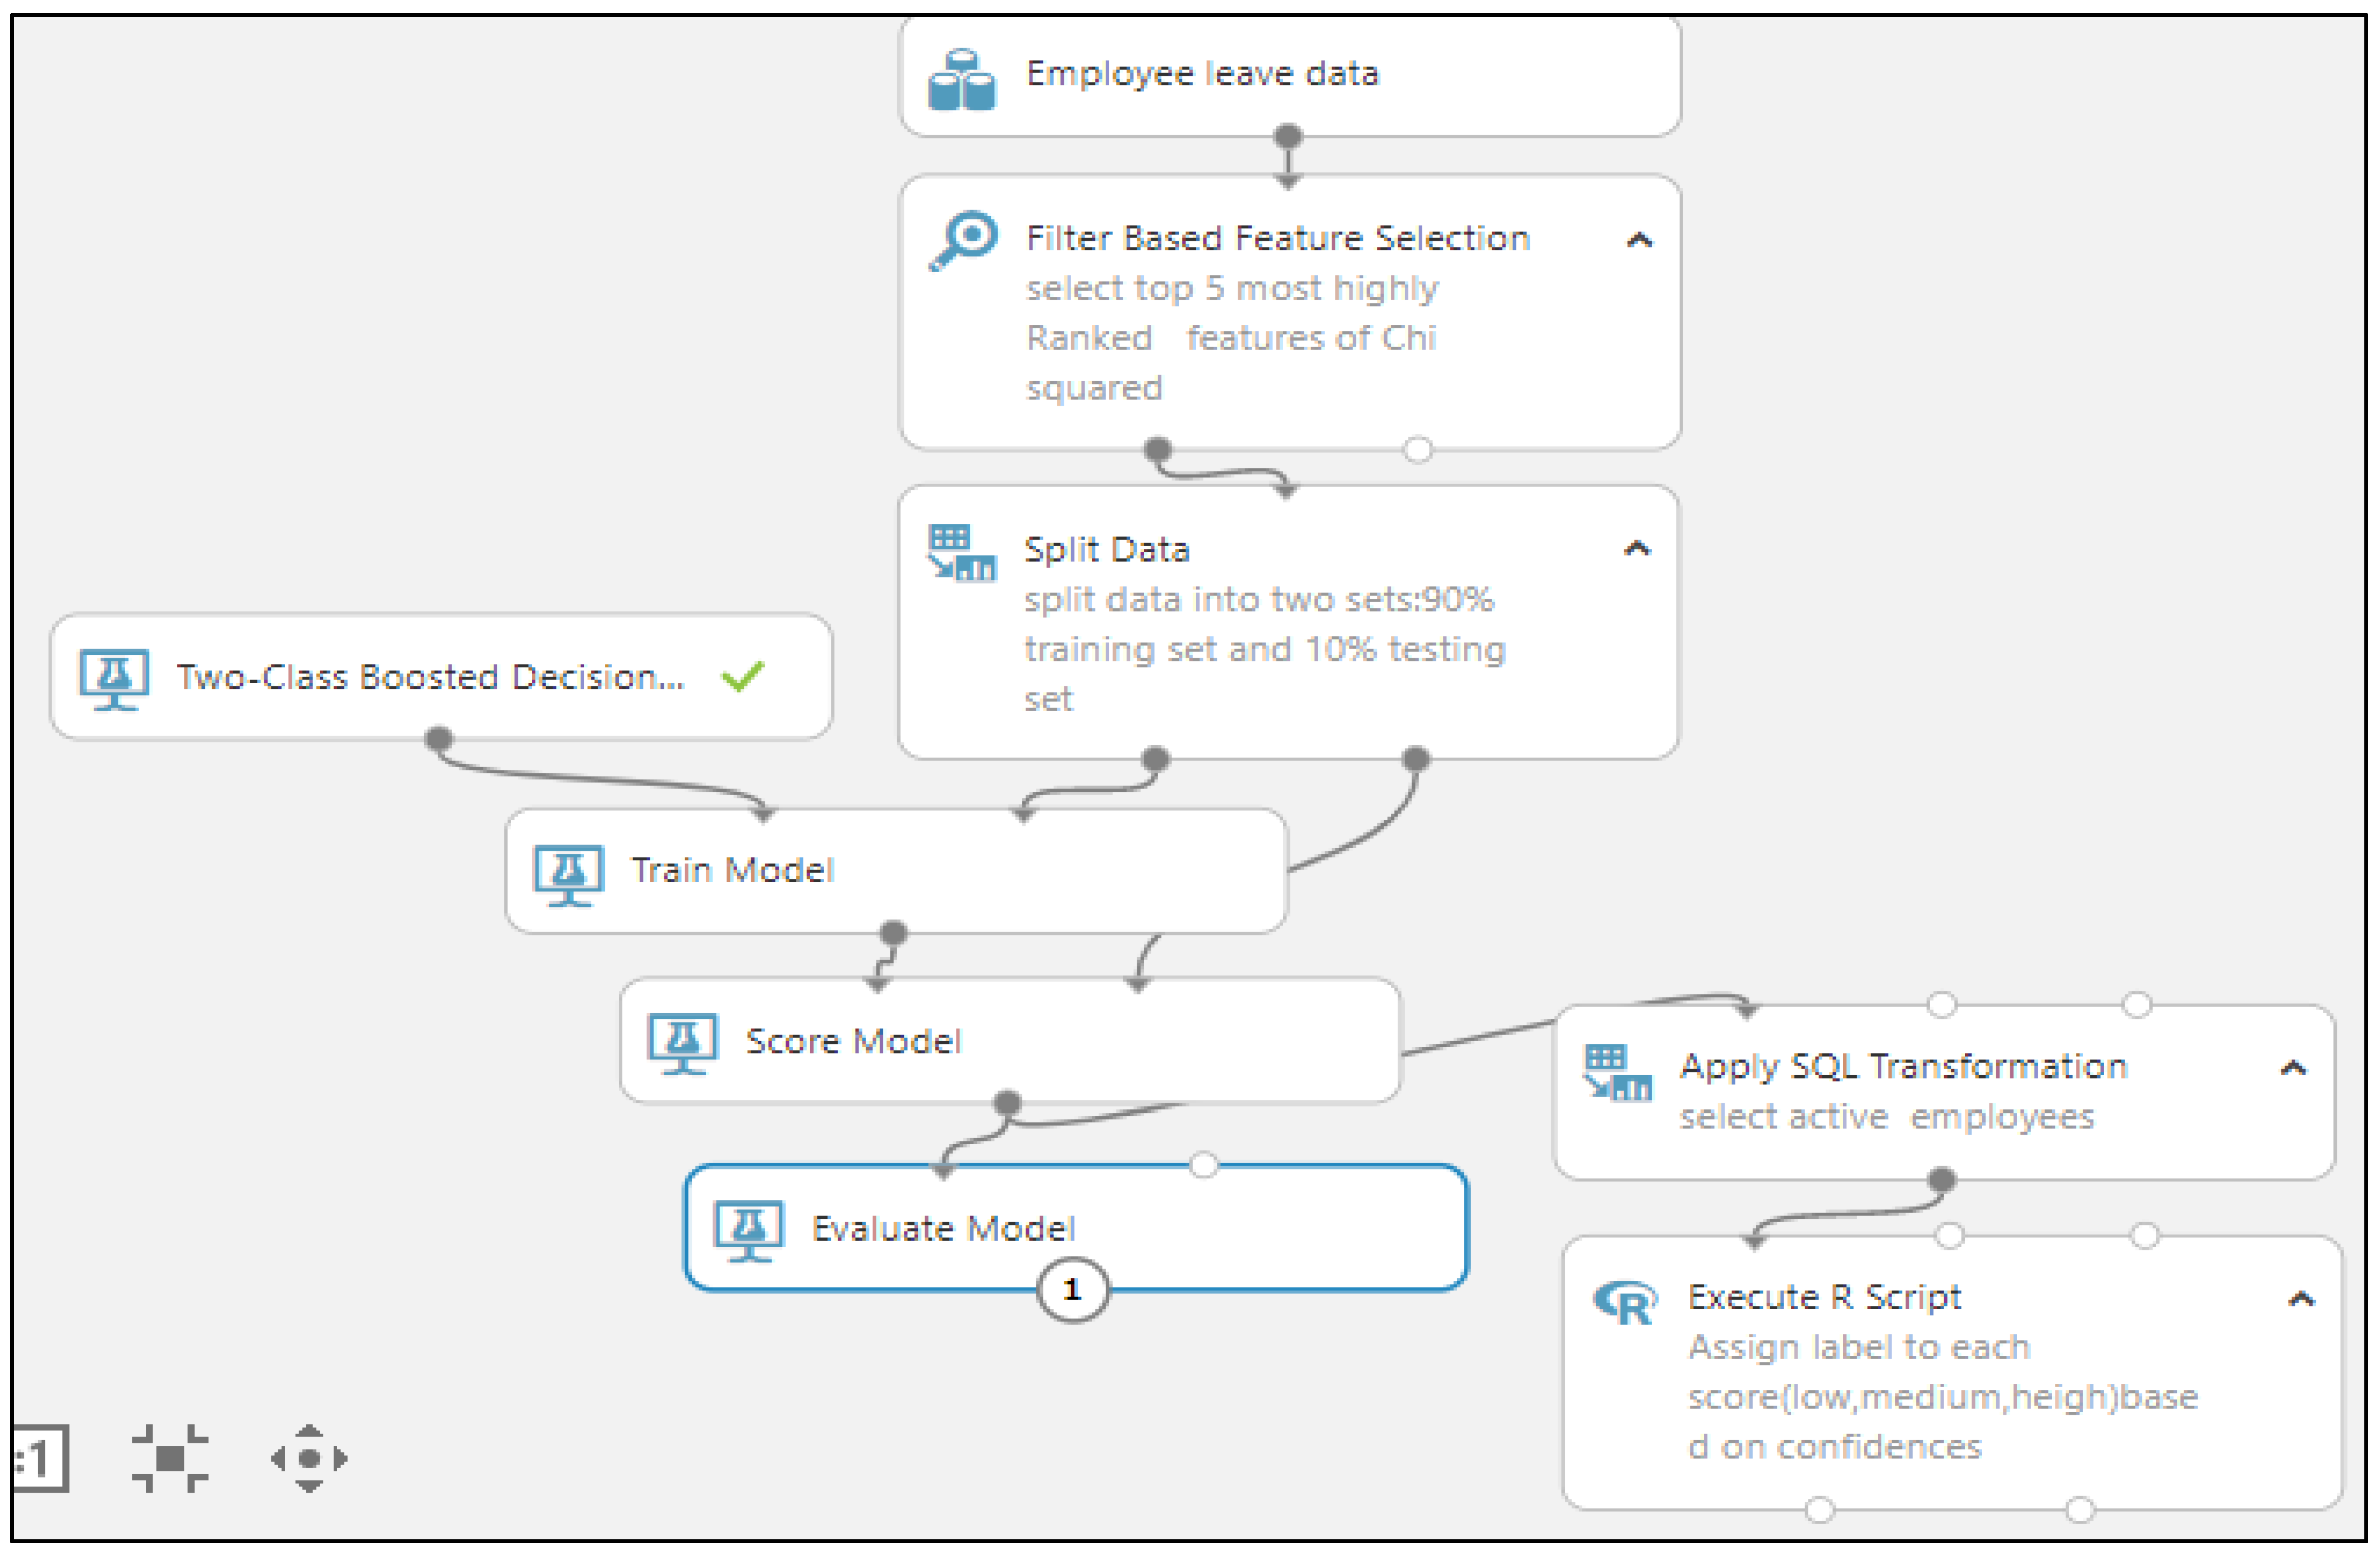
While performing statistical analysis of the employee churn dataset, it is inevitable to identify the future churners. Thus, it is essential to build a risk model for those employees who have not left the organization; nevertheless, the risk of churn is always there. To develop the risk model in this situation, we select the Chi-squared method for most influencing features that contribute to employee turnover and apply the decision tree for future churners. After implementing the DT model, the last step is to classify the non-churn employees into different risk zones using the R script module shown in
Figure 22.
To build the risk model, first, we obtain the non-churn employees from the score model because this model provides the two output values: one is classified value, and the second is the probability of the predicted value. We then applied the SQL transformation module to obtain the probability value of current or non-churn employees. The R script module assigns the different risk labels, such as high, medium, and low, to the obtained probability values.
In
Table 3, the comparison results between the recursive feature elimination method and the Chi-squared method are shown. Similarly, the given table is divided into three sub-sections: accuracy, precision and recall, and in each section, the decision Chi-squared method demonstrates better results.
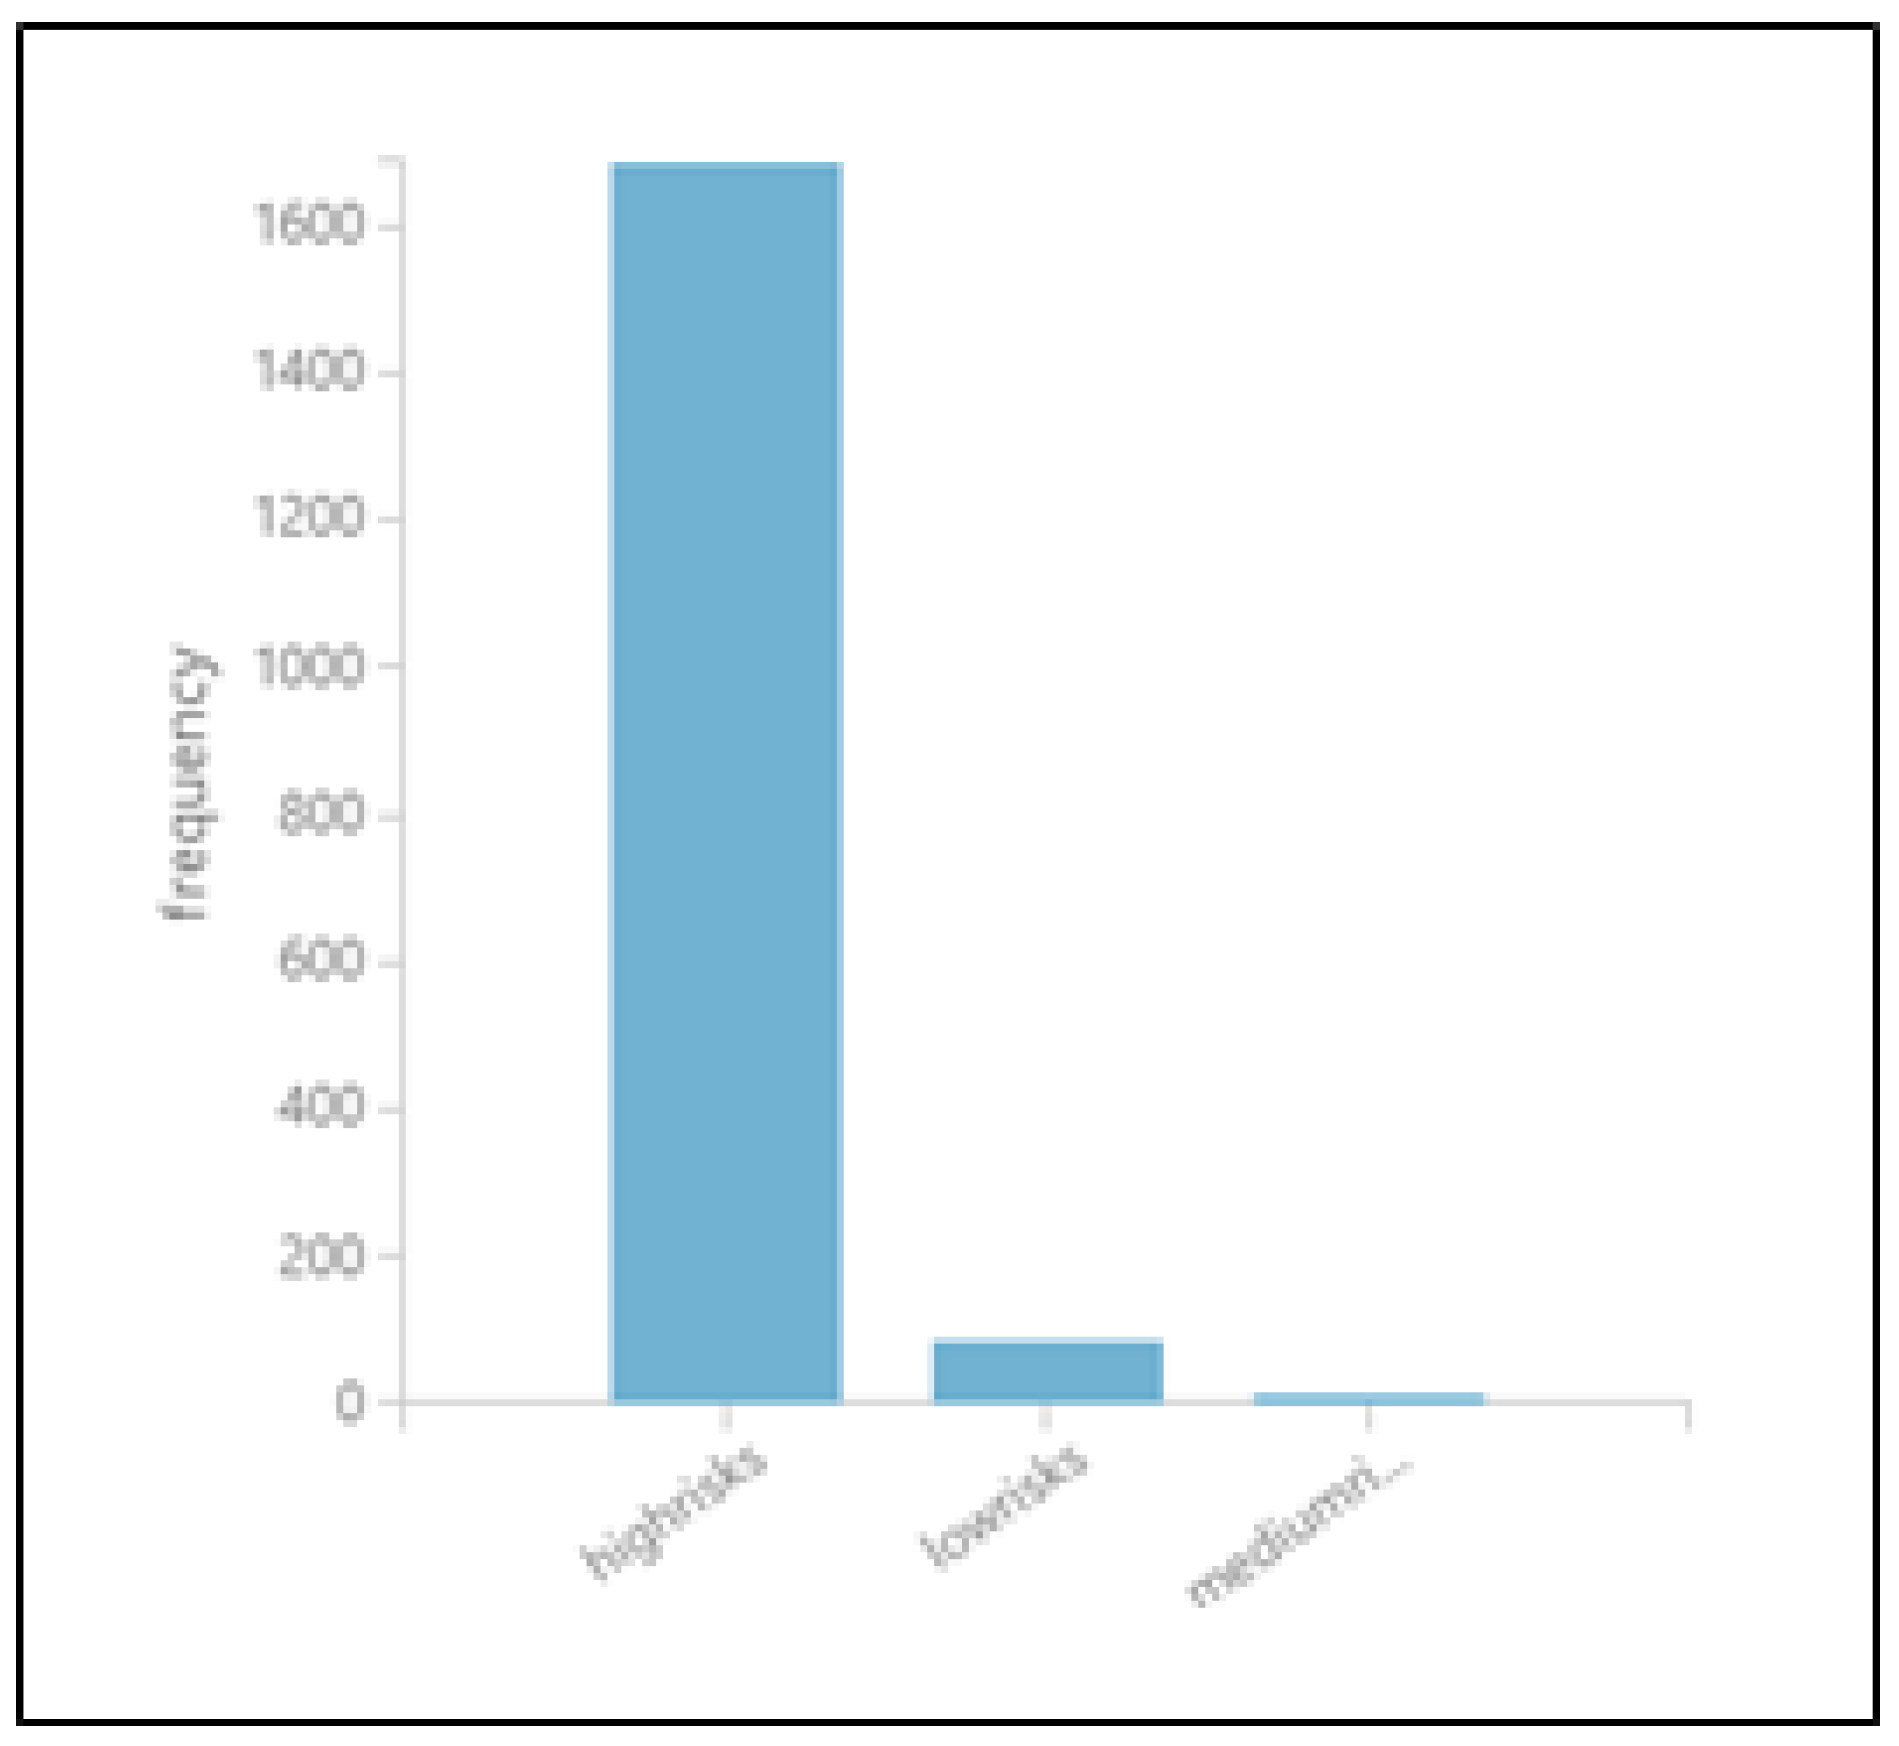
It can be clearly observed from the graph in
Figure 23 that a large number of employees have the highest risk; on the other end, a small number of employees have a middle-level risk, and an average number of employees have the lowest risk as per the available HR dataset. The information used in this risk model will help the software organization and human resource sections in designing retention strategies for non-churn employees.
7. Conclusions
Organizations lose money, time, and effort as a result of employee churn. A trained and experienced person is difficult and expensive to replace, thus this is a major problem. In order to forecast future employee turnover and understand its causes, we examine data on both past and present employees. The findings of this study show that data mining techniques can be applied to create trustworthy and precise forecast models for employee churn. Distinguishing churners from non-churners is only one aspect of the churn prediction challenge. By applying exploratory data analysis and data mining techniques, we can predict the probability of each employee leaving their job and assign them a score to enable them to develop retention strategies. In this research, we determine that the Chi-squared-based predictive model provides more reliable and accurate classification results, which is evident from the obtained 98% accuracy of the decision tree algorithm. The second-highest accuracy is achieved with decision forest, while NN demonstrates 97% accuracy, and the lowest accuracy is observed from the SVM and LR algorithms. The DT provides maximum accuracy with the Chi-squared method and shows that the most influential factors are satisfaction level, the number of projects, time spent on the company, and last evaluation; these top five features cause employee turnover. After the analysis of the classification results, the necessary comparison between the Chi-squared-based model and the RFE-based model is made, and it is observed that the Chi-squared-based model provides improved results. This employee churn prediction model supports the organizations in how to retain valuable employees and to make better decisions. The work’s limitations in this research include only using filter-based methods, which are computationally efficient, but if we want more accurate results of our ML models we could use embedded methods, which are costly for computation. For a future direction we plan to build hybrid-based methods which are a combination of filter- and embedded-based methods in order to build more accurate and comprehensive models for organizations to utilize for the betterment of the employees and future prospects.
Author Contributions
The conceptualization and methodology is proposed by K.N. The validation and formal analysis are covered by I.F.S. The draft preparation and formal analysis is managed by J.K. The software evaluation management and manuscript editing is managed by M.A.K. The final check of manuscript, editing and evaluation are supervised by N.M.F.Q. All authors have read and agreed to the published version of the manuscript.
Funding
This research was supported by Basic Science Research Program through the National Research Foundation of Korea (NRF) funded by the Ministry of Education (2021R1I1A1A01052299).
Institutional Review Board Statement
Not applicable.
Informed Consent Statement
Not applicable.
Data Availability Statement
The data used for evaluation is generated by the churn Software.
Conflicts of Interest
The authors declare no conflict of interest.
References
- Dolatabadi, S.H.; Keynia, F. Designing of customer and employee churn prediction model based on data mining method and neural predictor. In Proceedings of the 2nd International Conference on Computer and Communication Systems (ICCCS), Kraków, Poland, 11–14 July 2017; pp. 74–77. [Google Scholar]
- Weeramanthrie, T.T.; Thilakumara, C.N.; Wijesiri, K.N.A.C.; Fernando, N.I.; Thelijjagoda, S.; Gamage, A. ARROW: A web-based employee turnover analysis tool for effective human resource management in large-scale organizations. In Proceedings of the National Information Technology Conference (NITC), Columbo, Sri Lanka, 14–15 September 2017; pp. 136–140. [Google Scholar]
- Sethunga, S.; Perera, I. Impact of Performance Rewards on Employee Turnover in Sri Lankan IT Industry. In Proceedings of the Moratuwa Engineering Research Conference (MERCon), Moratuwa, Sri Lanka, 30 May–1 June 2018; pp. 114–119. [Google Scholar]
- Wei, G.U.O.; Tai, L.I. An empirical study on organizational commitment and turnover of it industry. In Proceedings of the International Conference on E-Business and E-Government, Guangzhou, China, 7–9 May 2010; pp. 904–906. [Google Scholar]
- David, S.; Kaushik, S.; Verma, H.; Sharma, S. Attrition in “IT” Sector. Int. J. Core Eng. Manag. IJCEM 2015, 2, 74–92. [Google Scholar]
- Mura, L.; Zsigmond, T.; Machová, R. The effects of emotional intelligence and ethics of SME employees on knowledge sharing in Central-European countries. Oeconomia Copernic. 2021, 12, 907–934. [Google Scholar] [CrossRef]
- Szeiner, Z.; Kovács, Á.; Zsigmond, T.; Mura, L.; Sanders, E.; Poor, J. An empirical study of consulting in a transitional economy in the Central European region during COVID-19. J. East. Eur. Cent. Asian Res. (JEECAR) 2022, 9, 471–485. [Google Scholar] [CrossRef]
- Alamsyah, A.; Salma, N. A Comparative Study of Employee Churn Prediction Model. In Proceedings of the 4th International Conference on Science and Technology (ICST), Yogyakarta, Indonesia, 7–8 August 2018; pp. 1–4. [Google Scholar]
- Carraher, S.M. Turnover prediction using attitudes towards benefits, pay, and pay satisfaction among employees and entrepreneurs in Estonia, Latvia, and Lithuania. Balt. J. Manag. 2011, 6, 25–52. [Google Scholar] [CrossRef]
- Yiğit, İ.O.; Shourabizadeh, H. An approach for predicting employee churn by using data mining. In Proceedings of the International Artificial Intelligence and Data Processing Symposium (IDAP), Malatya, Turkey, 16–17 September 2017; pp. 1–4. [Google Scholar]
- Cheripelli, R.; Ajitha, P.V. Evaluation of Machine Learning Models for Employee Churn Prediction. Solid State Technol. 2020, 63, 2482–2487. [Google Scholar]
- Sisodia, D.S.; Vishwakarma, S.; Pujahari, A. Evaluation of machine learning models for employee churn prediction. In Proceedings of the International Conference on Inventive Computing and Informatics (ICICI), Coimbatore, India, 23–24 November 2017; pp. 1016–1020. [Google Scholar]
- Jain, H.; Yadav, G.; Manoov, R. Churn Prediction and Retention in Banking, Telecom and IT Sectors Using Machine Learning Techniques. In Advances in Machine Learning and Computational Intelligence, 1st ed.; Springer: Singapore, 2021; Volume 1, pp. 137–156. [Google Scholar]
- Yeom, S.; Giacomelli, I.; Fredrikson, M.; Jha, S. Privacy risk in machine learning: Analyzing the connection to overfitting. In Proceedings of the 31st Computer Security Foundations Symposium (CSF), Oxford, UK, 9–12 July 2018; pp. 268–282. [Google Scholar]
- Ghosh, P.; Satyawadi, R.; Joshi, J.P.; Shadman, M. Who stays with you? Factors predicting employees’ intention to stay. Int. J. Organ. Anal. 2013, 21, 288–312. [Google Scholar]
- Gu, Q.; Li, Z.; Han, J. Generalized fisher score for feature selection. arXiv 2012, arXiv:1202.3725. [Google Scholar]
- Kaggle HR Analytic Data Set. Available online: https://www.kaggle.com/pavansubhasht/ibm-hr-analytics-attrition-dataset (accessed on 6 September 2022).
- Kaleru, S.; Dhanikonda, S.R. Exploratory Data Analysis and Latent Dirichlet Allocation on Yelp Database. Int. J. Appl. Eng. Res. 2018, 13, 15035–15039. [Google Scholar]
- Microsoft Azure. Two Class Decision Forest. Available online: https://docs.microsoft.com/en-us/azure/machine-learning/studio-module-reference/two-class-decision-forest (accessed on 6 September 2022).
- Mwadulo, M.W. A Review on Feature Selection Methods for Classification Tasks. Report; School of Computing & Informatics, Meru University of Science and Technology: Meru, Kenya, 2016. [Google Scholar]
- Pudjihartono, N.; Fadason, T.; Kempa-Liehr, A.W.; O’Sullivan, J.M. A Review of Feature Selection Methods for Machine Learning-Based Disease Risk Prediction. Front. Bioinform. 2022, 2, 927312. [Google Scholar] [CrossRef]
- Microsoft Azure. Two-Class Support Vector Machine. Available online: https://docs.microsoft.com/en-us/azure/machine-learning/studio-module-reference/two-class-support-vector-machine (accessed on 6 September 2022).
- Mishra, S.N.; Lama, D.R.; Pal, Y. Human Resource Predictive Analytics (HRPA) for HR management in organizations. Int. J. Sci. Technol. Res. 2016, 5, 33–35. [Google Scholar]
- Microsoft Azure. Two Class Logistic Regression. Available online: https://docs.microsoft.com/en-us/azure/machine-learning/studio-module-reference/two-class-logistic-regression (accessed on 6 September 2022).
- Microsoft Azure. What Is Azure Machine Learning? Available online: https://docs.microsoft.com/en-us/azure/machine-learning/overview-what-is-azure-ml (accessed on 6 September 2022).
- Srivastava, D.K.; Nair, P. Employee attrition analysis using predictive techniques. In Proceedings of the International Conference on Information and Communication Technology for Intelligent Systems, Ahmedabad, India, 25–26 March 2017; pp. 293–300. [Google Scholar]
- Esmaieeli Sikaroudi, A.M.; Ghousi, R.; Sikaroudi, A. A data mining approach to employee turnover prediction (case study: Arak automotive parts manufacturing). J. Ind. Syst. Eng. 2015, 8, 106–121. [Google Scholar]
- Saghir, M.; Bibi, Z.; Bashir, S.; Khan, F.H. Churn prediction using neural network based individual and ensemble models. In Proceedings of the 16th International Bhurban Conference on Applied Sciences and Technology (IBCAST), Bhurban, Pakistan, 8–12 January 2019; pp. 634–639. [Google Scholar]
- Xiao, J.; Xiao, Y.; Huang, A.; Liu, D.; Wang, S. Feature-selection-based dynamic transfer ensemble model for customer churn prediction. Knowl. Inf. Syst. 2015, 43, 29–51. [Google Scholar] [CrossRef]
- Xiao, C.; Ye, J.; Esteves, R.M.; Rong, C. Using Spearman’s correlation coefficients for exploratory data analysis on big dataset. Concurr. Comput. Pract. Exp. 2016, 28, 3866–3878. [Google Scholar] [CrossRef]
- Yadav, S.; Jain, A.; Singh, D. Early prediction of employee attrition using data mining techniques. In Proceedings of the 8th International Advance Computing Conference (IACC), Greater Noida, India, 14–15 December 2018; pp. 349–354. [Google Scholar]
Figure 1.
Employee churn analysis for IoT-enabled software industry.
Figure 1.
Employee churn analysis for IoT-enabled software industry.
Figure 2.
Workflow model of filter-based feature selection and classification.
Figure 2.
Workflow model of filter-based feature selection and classification.
Figure 3.
Accuracy using enhanced SVM.
Figure 3.
Accuracy using enhanced SVM.
Figure 4.
Accuracy using enhanced Decision Tree.
Figure 4.
Accuracy using enhanced Decision Tree.
Figure 5.
Accuracy using enhanced NN.
Figure 5.
Accuracy using enhanced NN.
Figure 6.
Accuracy using enhanced LR.
Figure 6.
Accuracy using enhanced LR.
Figure 7.
Accuracy using enhanced decision forest.
Figure 7.
Accuracy using enhanced decision forest.
Figure 8.
Precision using enhanced SVM.
Figure 8.
Precision using enhanced SVM.
Figure 9.
Precision using enhanced decision tree.
Figure 9.
Precision using enhanced decision tree.
Figure 10.
Precision using enhanced NN.
Figure 10.
Precision using enhanced NN.
Figure 11.
Precision using enhanced LR.
Figure 11.
Precision using enhanced LR.
Figure 12.
Accuracy using enhanced decision forest.
Figure 12.
Accuracy using enhanced decision forest.
Figure 13.
Recall using enhanced SVM.
Figure 13.
Recall using enhanced SVM.
Figure 14.
Recall using enhanced DT.
Figure 14.
Recall using enhanced DT.
Figure 15.
Recall using enhanced NN.
Figure 15.
Recall using enhanced NN.
Figure 16.
Recall using enhanced LR.
Figure 16.
Recall using enhanced LR.
Figure 17.
Recall using enhanced DF.
Figure 17.
Recall using enhanced DF.
Figure 18.
Comparison of RFE successful execution with the proposed model.
Figure 18.
Comparison of RFE successful execution with the proposed model.
Figure 19.
Accuracy using active risk model.
Figure 19.
Accuracy using active risk model.
Figure 20.
Precision using active risk model.
Figure 20.
Precision using active risk model.
Figure 21.
Recall using active risk model.
Figure 21.
Recall using active risk model.
Figure 22.
Risk model prediction of employee churn.
Figure 22.
Risk model prediction of employee churn.
Figure 23.
Performance evaluation of the risk model for employee churn.
Figure 23.
Performance evaluation of the risk model for employee churn.
Table 1.
Churn analysis features categorization.
Table 1.
Churn analysis features categorization.
| Factors | Features | Data Types |
|---|
| Organizational factors | Department | Categorical |
| Employment factors | Promotion last 5 years | Categorical |
| Employment factors | Time spend company | numeric |
| Employment factors | Number of projects | numeric |
| Employment factors | Salary | Categorical |
| Employment factors | Average monthly hours | numeric |
| Job related factors | Job Satisfaction level | numeric |
| Job related factors | Workplace accident | Categorical |
| Job related factors | Performance evaluation | numeric |
| factors | Features | Data types |
Table 2.
Algorithm analysis of accuracy, precision and recall.
Table 2.
Algorithm analysis of accuracy, precision and recall.
| Algorithms’ Performance Parameters | Accuracy | Precision | Recall |
|---|
| 60 Train/40 Test | SVM | DT | NN | LR | DF | SVM | DT | NN | LR | DF | SVM | DT | NN | LR | DF |
|---|
| Chi-squared | 0.772 | 0.986 | 0.961 | 0.766 | 0.984 | 0.552 | 0.977 | 0.932 | 0.524 | 0.981 | 0.257 | 0.964 | 0.904 | 0.258 | 0.949 |
| Spearman | 0.77 | 0.974 | 0.939 | 0.764 | 0.974 | 0.534 | 0.971 | 0.927 | 0.525 | 0.977 | 0.253 | 0.942 | 0.905 | 0.257 | 0.94 |
| Fisher score | 0.77 | 0.974 | 0.95 | 0.764 | 0.943 | 0.54 | 0.974 | 0.95 | 0.516 | 0.947 | 0.253 | 0.942 | 0.899 | 0.257 | 0.939 |
| R coefficient relation | 0.761 | 0.976 | 0.95 | 0.748 | 0.975 | 1 | 0.954 | 0.902 | 0 | 0.956 | 0 | 0.947 | 0.886 | 0 | 0.939 |
Table 3.
Comparative analysis of active risk model.
Table 3.
Comparative analysis of active risk model.
| | Accuracy | Precision | Recall |
|---|
| 60 Train/40 Test | SVM | DT | NN | LR | DF | SVM | DT | NN | LR | DF | SVM | DT | NN | LR | DF |
|---|
| RFE | 0.871 | 0.857 | 0.857 | 0.884 | 0.837 | 0.75 | 0.5 | 0.5 | 0.75 | 0.4 | 0.143 | 0.429 | 0.381 | 0.286 | 0.286 |
| Chi-squared | 0.771 | 0.987 | 0.975 | 0.765 | 0.987 | 0.55 | 0.98 | 0.971 | 0.524 | 0.986 | 0.273 | 0.972 | 0.925 | 0.271 | 0.961 |
| Publisher’s Note: MDPI stays neutral with regard to jurisdictional claims in published maps and institutional affiliations. |
© 2022 by the authors. Licensee MDPI, Basel, Switzerland. This article is an open access article distributed under the terms and conditions of the Creative Commons Attribution (CC BY) license (https://creativecommons.org/licenses/by/4.0/).

 ,
, 


