Article

Carbon Dots with Up-Conversion Luminescence as pH Nanosensor

1
Faculty of Physics, M.V. Lomonosov Moscow State University, Leninskie Gory 1/2, 119991 Moscow, Russia
2
D.V. Skobeltsyn Institute of Nuclear Physics, M.V. Lomonosov Moscow State University, Leninskie Gory 1/2, 119991 Moscow, Russia
*
Author to whom correspondence should be addressed.
Appl. Sci. 2022, 12(23), 12006; https://doi.org/10.3390/app122312006
Submission received: 31 October 2022 / Revised: 17 November 2022 / Accepted: 21 November 2022 / Published: 24 November 2022
(This article belongs to the Special Issue New Trends on Nonlinear Optics in Nanostructures and Plasmonics)

Abstract

:
In this study, the up-conversion luminescence for aqueous suspensions of carbon dots with polyfunctional and carboxylated surfaces synthesized by a hydrothermal method was investigated. The obtained quadratic dependence of the luminescence intensity on the power of the exciting radiation indicates that the up-conversion luminescence of these carbon dots is caused by two-photon absorption. The optimal wavelength of the exciting radiation was determined for the studied samples. The dependences of the signal for the up-conversion luminescence of carbon dots on the pH value of the suspension were obtained. It was shown that these carbon dots can be used as the nanosensor of pH of liquid media in a wide range of pH values. The advantage of this nanosensor is that the excitation of the up-conversion luminescence of carbon dots does not entail excitation of autoluminescence of the biological medium. It expands the possibilities of using this sensor in biomedical applications.

1. Introduction

In recent years, there has been a rapidly growing interest in the nonlinear optical properties of carbon nanoparticles [1,2,3]. This interest has been caused, among other things, by the wide prospects for the use of carbon dots (CDs) and nanodiamonds as medical nanoagent photoluminescent markers for the rapid and sensitive detection of analyte, drug carriers, adsorbents, etc. [4,5,6,7,8]. Together with the photostability and a high quantum yield of luminescence, solubility in water, biocompatibility, and the possibility of surface modification, the recently discovered property of various carbon dots to luminesce in the anti-Stokes region significantly expands the prospects for the use of such CDs in biomedicine. Upon excitation of the up-conversion luminescence (UCL) of nanoparticles, the autofluorescence of biological tissue is not excited, while UCL itself falls into the spectral region of the biological “transparency window”, which ensures deep penetration of radiation in tissue.
The first report on the observation of UCL of carbon dots, upon the excitation of CDs obtained by laser ablation by pulsed laser radiation with a wavelength of 800 nm, was made by L. Cao et al. [9] in 2007. The CDs’ UCL spectrum was a broad band with a maximum near 470 nm. The authors found a quadratic dependence of the UCL intensity of the CDs on the excitation power and explained the observed UCL as a result of two-photon absorption.
From 2007 to 2013, numerous publications appeared, including those in high-ranking journals, in which the authors reported on the observation of CDs’ UCL when excited by a conventional xenon lamp of a spectrofluorimeter [10,11,12]. However, the authors of [13,14] showed that the supposed CD UCL signals observed on the spectrofluorimeter are artifacts such as interference from leaking second-order diffraction of the excitation light when broad-band light sources and diffraction gratings are used for excitation wavelength selection. According to [9,14,15], the main criterion for a “real” CD UCL is the quadratic dependence of the UCL intensity on the excitation radiation intensity.
The results of active studies on CDs’ UCL over the past 5 years have shown that the properties of UCL of CDs of different synthesis differ significantly [9,14,16,17,18]. This is explained by the existence of various mechanisms for the formation of UCL [19], including UCL of CDs: two-photon absorption through real and virtual levels [9,14,15,20], multiphoton absorption [21], thermal activation [22], and the state of surface traps [20,23]. In the vast majority of publications, two-photon absorption is considered to be the main one.
However, the dependences of the CDs’ UCL intensity on the power of the exciting radiation are not always quadratic. For example, for CDs doped with nitrogen by the photochemical method, these dependences resembled those for lanthanoid-based up-conversion nanoparticles and was linear in the double-log coordinates with the slope 0.69 [18], while for thermally-activated CDs, this dependence was found to be linear in standard linear coordinates (as well as in the double-log coordinates with the slope 1) [22].
The observed dependences of the CDs’ UCL intensity on the excitation wavelength also differ. For CDs synthesized by different methods or doped with different atoms, these dependences have one [21], two [18,24], or three [25] maxima with different positions. For other CDs, such as CDs simultaneously doped with S and Se [16] and for CDs synthesized by the Hummers method [17], excitation wavelength-independent NIR emission was observed.
Thus, the accumulated results of UCL studies of various CDs at this stage are characterized by many contradictions and uncertainty. The next step is to search for correlations and systematize all the data obtained. It should also be noted that CDs’ UCL with different surface functionalization has not yet been studied, although it is well known that the surface properties of nanoparticles significantly affect their properties, primarily colloidal and optical [26,27].
Despite the contradictions in the results of studying the properties of CDs’ UCL, there are many examples of successful application of CDs with UCL in various fields. The main application of CDs with UCL is the optical visualization of nanoparticles in cancer cells and biological tissues [9,28], in a multiphoton confocal microscope [18], for photothermal therapy of cancerous tumors [12]. It was shown that CDs’ UCL could be detected in tissue from a depth up to 1800 µm [21], which is an important result from the point of view of CDs applicability in biological imaging. The authors of [22] suggested using CDs with UCL for thermosensing. Due to the fact that some substances quench UCL upon interaction with CDs, it was proposed to use CDs with UCL as nanosensors for hypochlorite [29], hydrogen sulfide [30], and Cu2+ ions [31]. CDs with UCL can be used as a laser amplification medium in low-threshold diode-pumped lasers [32].
While pH nanosensors on the basis of CDs’ Stokes luminescence have been actively developed [8,33,34], there are almost no publications devoted to the CDs’ UCL dependence on pH. At the time of writing, we managed to find only one paper, in which such dependence was shown: intensity of UCL (emission with the maximum around 640 nm upon the excitation at 690 nm with pulse laser) for the studied CDs was shown to significantly change in cells upon their incubation at buffers with different pH (from 4 to 8), at tumor/normal muscle mice tissue (pH 6.5–6.8 against pH 7.4), and in zebrafish injected with CDs in buffers of different pH (from 4 to 8). Unfortunately, while this publication presents a dependence on the Stokes luminescence spectra for CDs on pH in wide region 0.5–9 (excitation at 573 nm), the same was not the case for their UCL [35]. The advantage of this nanosensor, based on UCL is that excitation of up-conversion luminescence does not lead to autoluminescence of the biological medium.
This article presents the results of studying the dependence of the intensity of UCL on the wavelength and on the power of the exciting radiation for different functionalized CDs synthesized by the hydrothermal method. The features of CDs’ UCL with a functionalized surface were studied for the first time. The possibility of using CDs with UCL as a pH nanosensor is shown. For the first time, the accuracy of determining the pH of an aqueous solution and biological tissue using the CDs’ UCL spectra was estimated.

2. Materials, Their Characterization, and Research Methods

2.1. Synthesis of Carbon Dots and Functionalization of Their Surface

The objects of study were CDs obtained by the hydrothermal method from citric acid and ethylenediamine. The concentrations of precursors in the initial aqueous solution were 0.15 M for citric acid and 3 M for ethylenediamine (i.e., the ratio of precursors was 1:20, respectively). This solution was placed in a 15 mL polytetrafluoroethylene (PTFE) tube, which was placed in an autoclave. The autoclave with a mixture of precursors was placed in a Sputnik muffle furnace (Russia). The heating temperature was 190 °C, the heat treatment time was 2 h. Next, the autoclave was removed from the oven and cooled at room temperature for 7 h. To remove large particles, the synthesized CDs were passed through a syringe membrane filter with a pore diameter of 0.22 μm.
In this way, CDs with a polyfunctional surface (CD-poly) were synthesized, which were then functionalized with hydroxyl (CD-OH) and carboxyl (CD-COOH) groups. To functionalize CDs with hydroxyl groups (CD-OH), the dried residue of the solution after synthesis was mixed with 1 g of sodium nitride and 3 mL of hydrochloric acid to remove amide groups. To obtain the carboxylated surface of CDs (CD-COOH), 10 mL of water and 4.2 mL of NaOH solution with a concentration of 0.5 M were added to the dried residue.

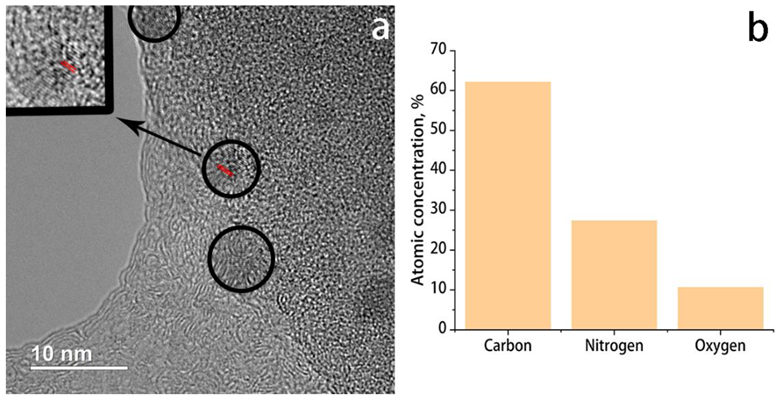
2.2. Electron Microscopy of Obtained Carbon Dots

Studies of the CDs’ structure were carried out by scanning transmission electron microscopy using a high-angle annular dark field detector (HAADF STEM) on a Tecnai Osiris microscope (Thermo Fisher Scientific, USA) at an accelerating voltage of 200 kV. The results are shown in Figure 1a. Elemental analysis was carried out using a special SuperX EDS system, which includes four Bruker silicon detectors, the design of which makes it possible to obtain the distribution of chemical elements in a few minutes. The diagram of elemental analysis is presented in Figure 1b.
As can be seen from the presented image, the synthesized nanoparticles are about 7 nm in size. The lattice fringes are clearly visible (Figure 1, inset, red lines) with the lattice parameter around 0.189 nm that corresponds to the (102) lattice fringes of graphite.

2.3. Preparation and Characterization of Aqueous Solutions of Carbon Dots

Deionized water (Millipore Simplicity UV water purification system) was used to prepare aqueous solutions of CDs. Aqueous solutions of CD-poly, CD-COOH, and CD-OH were prepared with a nanoparticle concentration of 0.1 mg/mL (obtained from gravimetric analysis).
To change the pH in the range from 2 to 12, either an aqueous solution of HCl (Sigma Aldrich, concentration 1 M, pH = 0) or an aqueous solution of NaOH (Dia-M, concentration 1.8 M, pH = 14) was added to the solution. Measurements for the pH value of aqueous solutions of CDs were carried out using the ionometric converter Akvilon I-500 equipped with an InLab Nano pH electrode (Mettler Toledo). All measurements were carried out at a fixed temperature of 22 °C.
Zeta potentials and sizes of nanoparticles in aqueous solutions were measured using dynamic light scattering on a Malvern Zetasizer NanoZS instrument. According to the data obtained, the sizes of the studied CDs were 182 ± 21, 105 ± 12, and 176 ± 23 nm for CD-poly, CD-COOH, and CD-OH, respectively. The corresponding zeta potentials were −39.7 ± 4.3, −29.1 ± 4.5, and −17.2 ± 1.3 mV. The obtained values of the zeta potentials indicate the colloidal stability of aqueous solutions of all CDs.

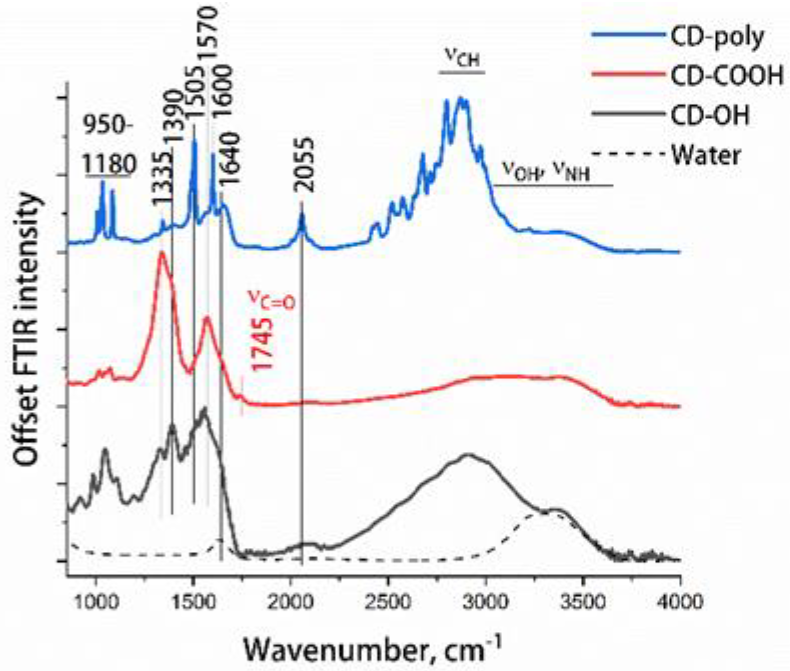
2.4. IR Absorption Spectroscopy of Carbon Dots

Analysis of the structure and functional surface groups of CDs was carried out using FTIR spectroscopy on a Bruker Invenio R IR spectrometer equipped with an ATR attachment based on a diamond crystal. The spectral resolution was 4 cm–1. The obtained IR absorption spectra for the studied CDs are shown in Figure 2.
The IR absorption spectra of three CD samples contain a similar set of bands that differ in relative absorption intensity. In the region of 3000–3700 cm−1, there is a wide band caused by stretching vibrations of the surface hydroxyl and amino groups and OH groups of water molecules adsorbed on the surface of the samples. The relative intensity of this band for CD-poly and CD-COOH is significantly lower than for CD-OH. In the region of 2800–3000 cm−1 there are bands of stretching vibrations of CHx groups. In the region of 2055 cm−1, there is a band that presumably belongs to overtones/combinations of various vibrations in CDs [36].
The band at 1745 cm−1 in the spectrum of CD-COOH corresponds to the stretching vibrations of C=O bonds of surface carboxyl groups. The weak relative intensity of this band is due to the fact that the COOH groups belong exclusively to the surface of this CD, while most other vibrational bands are due to the vibrations of the groups that are also in the CD’s core. This situation is typical for CDs with a size of about 100 nm and does not manifest itself, for example, for nanodiamonds with a carboxylated surface: in them, the diamond core is not active, and the relative intensity of the vibration bands of all surface groups is much higher [37].
In the region of 1640 cm−1, there is a band of bending vibrations of OH bonds. In the spectra of CD-COOH and CD-OH, it manifests itself as a “shoulder” of a wide intense band with a maximum in the region of 1570 cm–1, which is due to stretching vibrations of C=C bonds [36]. In the region of 1580–1650 cm−1, the band of bending vibrations of NH groups overlaps with it.
In the IR spectrum of the CD-poly, intense narrow bands are observed with maxima in the regions of 1600 and 1505 cm–1, which, according to the authors of [36,38], are due to skeletal vibrations of the polycyclic aromatic elements of CDs. The absence of such bands in the spectra of CD-COOH and CD-OH indicates that the functionalization of these CDs occurred primarily due to the rupture and subsequent addition of radicals to such aromatic rings.
The band with a maximum in the region of 1390 cm−1 corresponds to stretching vibrations of C–O bonds in –COOH groups [39]. The band with a maximum in the region of 1335 cm−1 is also due to C–O vibrations, but particularly in the C–O–C groups [40]. The set of bands in the range of 950–1180 cm–1 is mainly due to stretching vibrations of C–O and bending vibrations of C–H bonds in various environments [36].
An analysis of the IR spectra showed that the CD-poly contains a large number of polycyclic aromatic elements and various functional groups, such as C–O–C, C=C, N–H, OH. As a result of the functionalization of the CD-poly, on the surfaces of CD-COOH and CD-OH during the destruction of aromatic rings, a large number of oxygen-containing groups were formed, and the relative intensity of the bands due to vibrations of the C–O–C, C–O, and OH groups bonds increased. Additionally, in the spectra of CD-COOH bands corresponding to vibrations of carboxyl groups appeared. Thus, the results of IR absorption spectroscopy allow us to conclude that the functionalization of CD-COOH and CD-OH was successful (Figure 2).

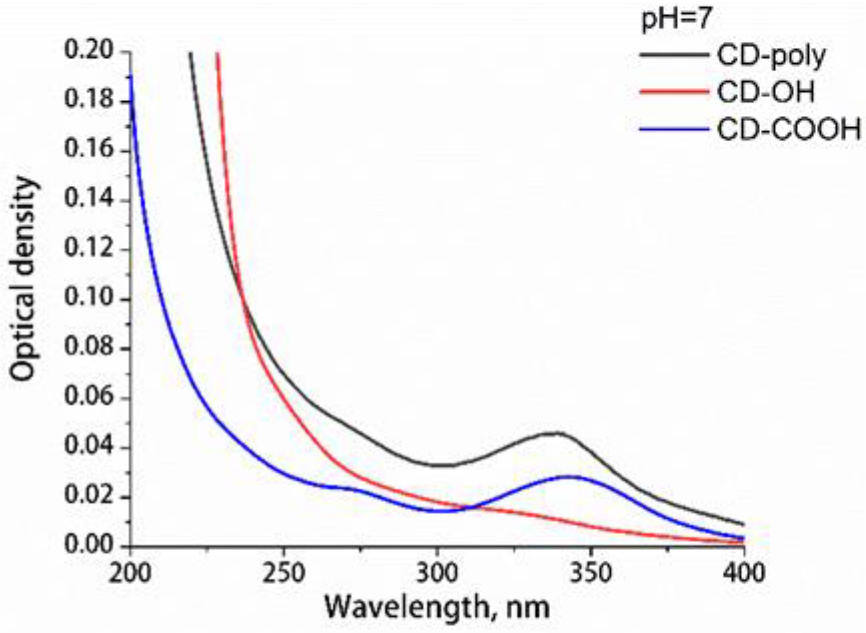
2.5. Spectrophotometry of Aqueous Solutions of CDs

The optical extinction spectra of aqueous solutions of CD-poly, CD-COOH, and CD-OH were obtained on a Shimadzu UV-1800 spectrophotometer in the wavelength range of 190–1100 nm with a resolution of 1 nm. The informative part of the obtained spectra is shown in Figure 3.
As can be seen from the presented data, the extinction spectra of aqueous solutions of CDs have a number of features. In all optical extinction spectra for the studied aqueous solutions, an intense peak is observed in the short-wavelength region, the right shoulder of the band of which extends up to ~250–300 nm. According to the literature data [41], the peak of CDs in this region is due to π–π* transitions in aromatic sp2 carbons. In the extinction spectra of CDs with polyfunctional and carboxylated surfaces, a peak is observed in the region of 275 nm, corresponding to n–π* transitions of C=O [42] bonds and corresponding to n–π* transitions of C=O, C–N, or C–OH bonds in sp3-hybridized domains associated with carboxyl (–COOH) or amine (–NH2) groups on the CDs’ surface [43]. In the optical extinction spectra of CD-OH, these peaks are absent.

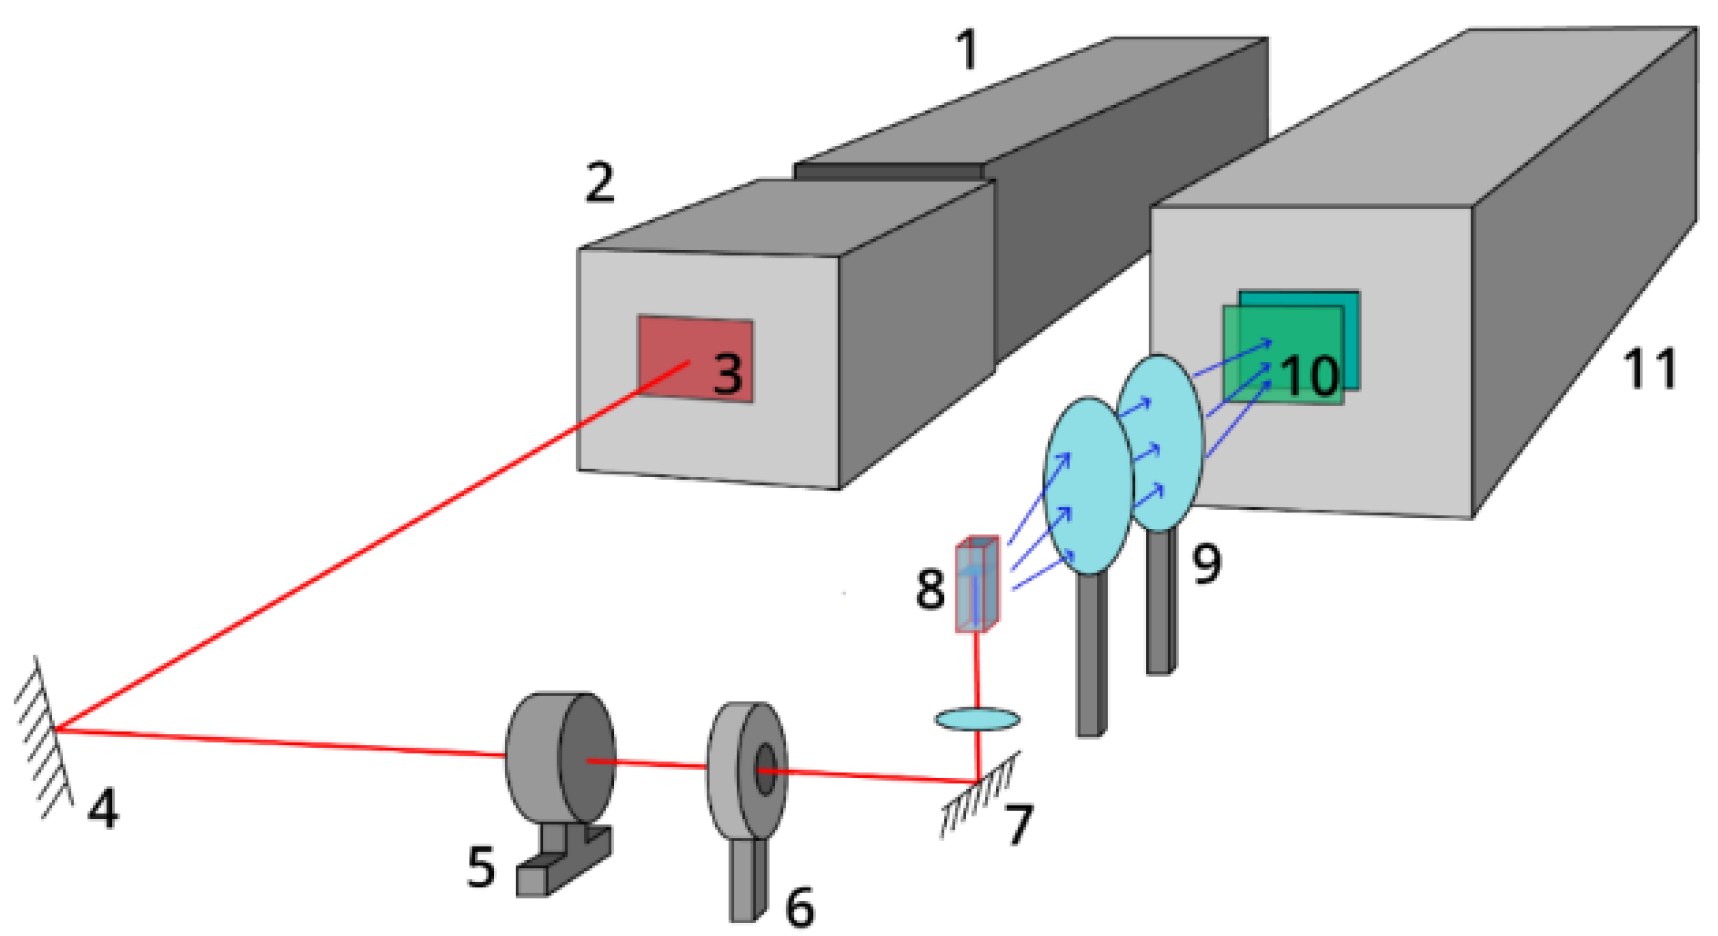
2.6. Photoluminescence Spectroscopy

The up-conversion luminescence of the CDs was studied on the experimental setup shown in Figure 4. A pulsed nanosecond Nd:YAG laser (model LQ629-100, Solar Laser Systems, Belarus) was used as a pump source. The third harmonic (355 nm, pulse duration 10 ns, pulse repetition rate 100 Hz) of the Nd:YAG laser was used to pump an LP603 parametric light generator (Solar Laser Systems, Belarus), whose radiation was the source of excitation of the CDs’ UCL. This laser system allows the pump wavelength to be changed in the range from 532 to 1070 nm. The radiation of the parametric light generator passed through a KS-11 light filter, which did not transmit the third harmonic of the initial laser radiation, and was directed through a rotating mirror to a mechanical optical shutter, which was used to record and then subtract the background signal from the CDs’ UCL spectra. The probing of the sample in the cuvette was carried out through the bottom of the cuvette. The resulting radiation of the sample at an angle of 90° was collected with a lens system to a recording system consisting of a monochromator (MBP80) with a focal length of 500 mm, equipped with a grating of 150 lines/mm, and a CCD camera (Horiba-Jobin Yvon, Synapse BIUV). Light filters SZS-22 and SZS-23 at the entrance of monochromator did not transmit the signal from the pump and isolated the luminescent signal in the spectral range of registration from 418 to 773 nm. The spectral resolution of the experimental setup was 2 nm. The power of the excitation radiation at the sample was recorded using an Ophir Nova 2 power meter equipped with a PE50-DIF-C pyroelectric sensor.

3. Results and Discussion

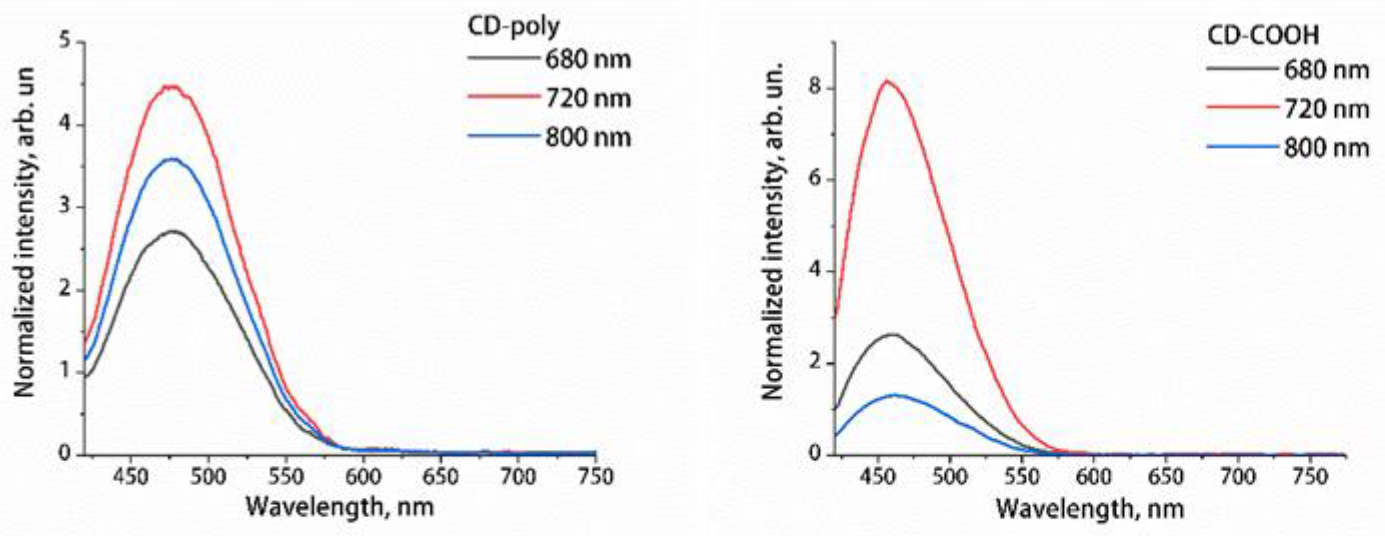
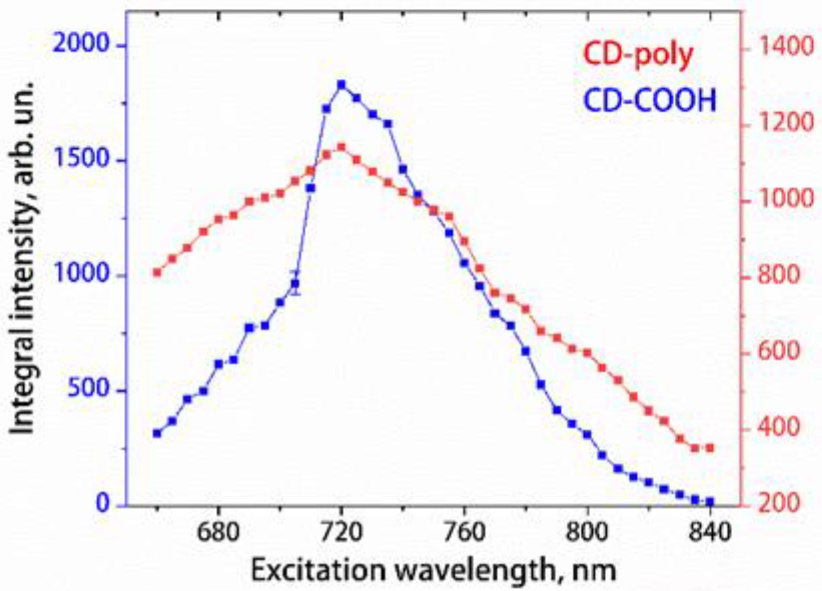
3.1. Dependence of the UCL Intensities of Aqueous Solutions of CDs on the Wavelength of the Exciting Radiation

To study the UCL of CDs, the UCL spectra of CDs’ aqueous solutions at pH 11.7 (initial pH for studied aqueous solutions) were obtained under excitation by laser radiation with different wavelengths in the range from 670 to 840 nm with excitation radiation power of 50 mW (Figure 5). From them, the dependences of the integral intensities of these spectra on the wavelength of the exciting radiation were calculated (Figure 6). For CD-OH, no photoluminescence signal was observed in the specified spectral range, what corresponds to the absence of the intense absorption bands in the optical absorption spectra of this sample in the range from 250 to 500 nm. Additionally, it is worth noting that the synthesized CDs were characterized by stable UCL, both in terms of reproducibility of the up-conversion luminescence of CD aqueous suspension obtained in different synthesis batches under the same synthesis conditions (see Figure S1) and in terms of the UCL stability of aqueous suspensions of CDs for 10 days (see Figure S2).
The processing of the spectra consisted in averaging 4 consecutively recorded spectra and normalizing their intensity to the power of the exciting radiation and to the time of accumulation of the spectra. The spectra were smoothed by a third-order polynomial using the Savitsky–Golay method.
It can be seen from the obtained results that the maxima of the dependences of the UCL integral intensity on the wavelength of the exciting radiation for the two types of CDs are close and are in the region of 720 nm (Figure 6). Therefore, this excitation wavelength can be considered optimal for both types of CDs, and it was used for the excitation of the CDs’ UCL in following measurements. The proximity of the excitation wavelengths that provide the maximum integrated intensity of UCL of CD-COOH and CD-OH is explained by the same adsorption features of these CDs’ solutions related to their functional groups (Figure 3). Nevertheless, it should be noted that, upon excitation of UCL by radiation at a wavelength of 720 nm, the UCL intensity of an aqueous solution of CD-COOH is approximately 1.7 times higher than that of an aqueous solution of CD-poly at pH = 11.7. Thus, the presence/absence of CDs’ UCL and its characteristics depend on the functionalization of the nanoparticle surface.

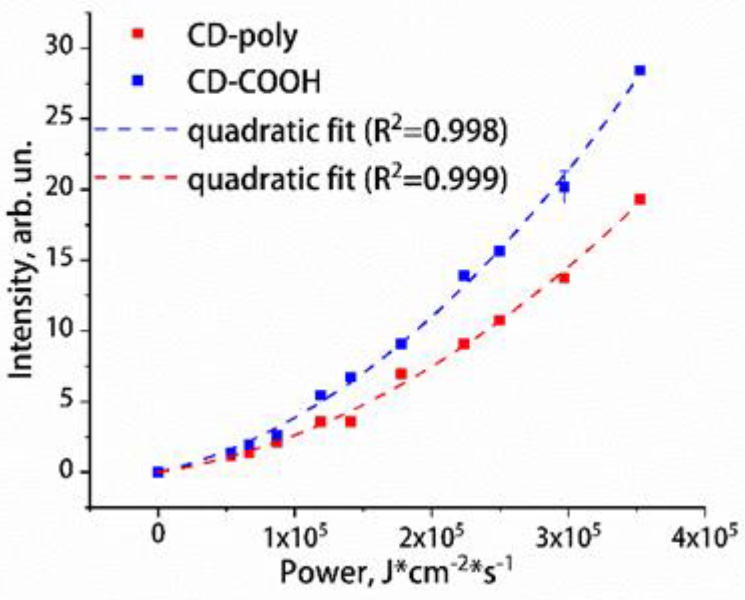
3.2. Dependence of the UCL Intensity of Aqueous Solutions of CDs on the Power of the Exciting Radiation

As discussed earlier, according to some photophysical models, the UCL of CDs is due to a two-photon absorption process. In this case, the CDs’ UCL integrated intensity should depend quadratically on the power of the exciting radiation.
To check this, the UCL spectra of aqueous solutions of CD-poly and CD-COOH were obtained for different values of the excitation radiation power, which varied in the range from 12 mW (5.1·104 J·cm−2·s−1) to 83 mW (3.5·105 J·cm−2·s−1). The dependences of the UCL integrated intensity of CD-poly and CD-COOH in water on the value of the pump power are shown in Figure 7. They are well approximated by a quadratic function.
The obtained quadratic dependences for the intensity of UCL in aqueous solutions of CDs on the power of the exciting radiation prove the fact that the UCL of studied CDs is due to two-photon absorption. In following processing of the spectral data, the intensity of the CDs’ UCL will be normalized to the square of the power of the exciting radiation.
From Section 3.1 and Section 3.2 it can be concluded that the mechanisms for nonlinear (photoluminescence in the result of two-photon absorption) optical properties of CDs, as with linear ones (classic photoluminescence in the Stokes region [34,44]), depend on the type and composition of surface functional groups.

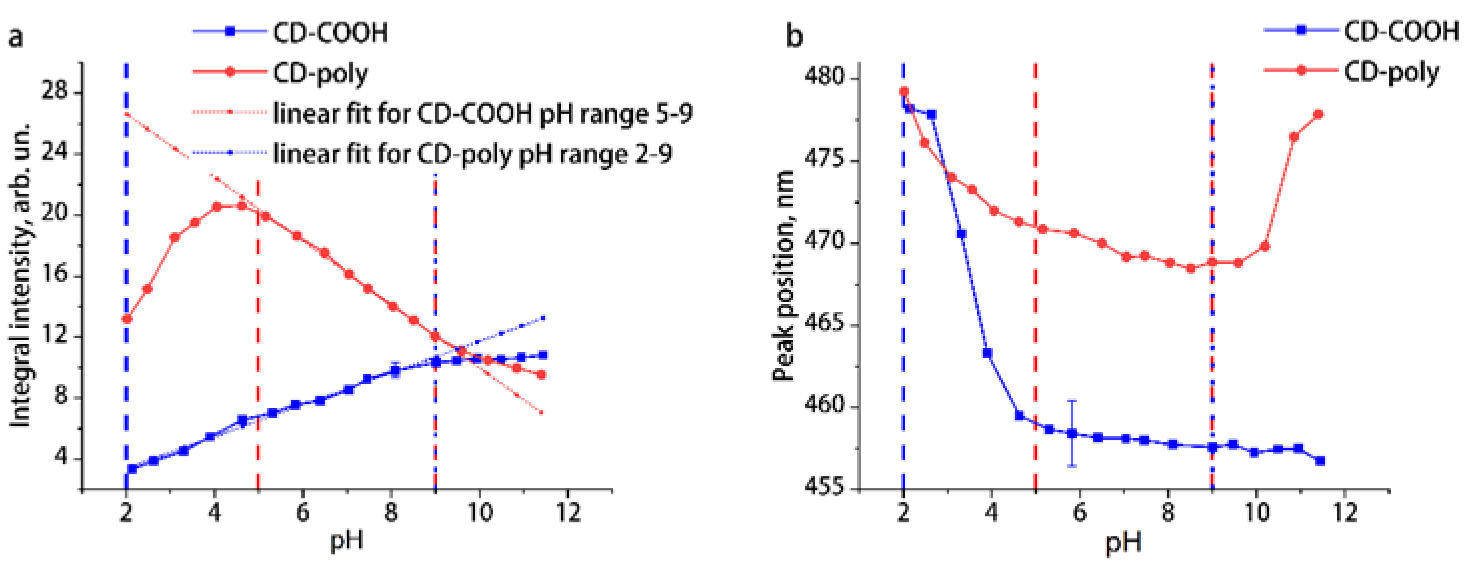
3.3. Dependence of the UCL Intensity of Aqueous Solutions of CDs on pH

The UCL spectra for aqueous solutions of CD-poly and CD-COOH with pH from 2 to 12 were obtained. From them, the dependences of the integrated intensity and position of the maxima of UCL spectra of CDs on the pH of aqueous solutions were calculated (Figure 8). As can be seen, these spectral parameters depend significantly on pH. Moreover, for CDs with polyfunctional and carboxylated surfaces, these dependences differ significantly. The UCL intensity of an aqueous solution of CD-COOH monotonically increases as the pH of the solution increases from 2 to 12, while the UCL intensity of CD-poly increases with the increase in pH from 2 to 5, and then decreases at pH > 5 (Figure 8a).
The maximum of the UCL spectra of CD-COOH sharply shifts to the short-wavelength region by 20 nm with an increase in the pH value of the solution from 2 to 5, while at further increase in the pH its position practically does not change (Figure 8b). It should be noted that in the pH range from 2 to 5, deprotonation of carboxyl groups on the surface of nanoparticles in water occurs, which significantly affects the state of the electronic levels of surface states [37,44]. The maximum UCL spectra of CD-poly gradually shifts to the short wavelength region by 10 nm with an increase in the pH value of the solution from 2 to 10, and then sharply shifts by 8 nm to the long wavelength region with a further increase in the pH of the solution. It can be assumed that the course of the dependences obtained for CD-poly solutions is also to some extent affected by the processes of deprotonation in the COOH, OH, and NH surface groups in water [37,44].

3.4. Carbon Dots with Up-Conversion Luminescence as a pH Nanosensor

It follows from the obtained results that the dependences of the integrated intensity for UCL of CDs’ aqueous solutions on the pH have linear sections: CD-COOH in the pH range from 2 to 9, CD-poly in the pH range from 5 to 9 (Figure 8a). This means that the studied CDs with UCL can serve as promising nanoagents for use as nanosensors of pH in liquid media, including at the cellular level.
Approximations of the linear regions for the dependences of the UCL integrated intensity of aqueous solutions of CDs on pH (Figure 8a) can be used as calibration curves for the determination of the pH of the CDs’ aqueous environment. Using them, the pH of the environment can be measured from the UCL spectra of CD-poly with an accuracy of 0.13, and from the UCL spectra of CD-COOH with an accuracy of 0.21.
Approbation of the pH nanosensor based on the CDs’ UCL was carried out for chicken egg white (Figure 9). For this, the UCL spectra of CDs added to four different egg whites (concentration of CDs was 0.1 mg/mL, the same as for aqueous solutions) were obtained, and the integrated intensity of the UCL of all spectra was determined. For each egg white, five UCL spectra of CD-poly and CD-COOH were obtained. Using the calibration curves of the linear sections of the dependences of the integral intensity of UCL on pH (Figure 8a), the pH values for each sample were determined, and averaged for five corresponding spectra. Parallel to it, the pH value at the probing point of the exciting laser radiation of each chicken egg white was measured using a pH electrode. All of the obtained pH values are presented in Table 1.
As can be seen from the presented results, the pH values of egg whites obtained by two independent methods are in good agreement. The error of the determination of pH for the CD-poly samples is smaller than for the CD-COOH samples, what was already observed for CDs’ aqueous suspensions. In addition, the slope of the calibrations’ straight line for CD-poly is greater in modulus than for CD-COOH (Figure 6), which also affects the accuracy of determining the pH of the medium. Thus, the functionalization of the CDs’ surface with carboxyl groups did not give a benefit in pH measurement. However, it is known that it is the carboxylation of the surface of carbon nanoparticles that provides them with a high degree of biocompatibility, which is extremely important when using CDs in nanomedicine.
It should be noted that the accuracy of pH measurement according to the UCL spectra of CDs in aqueous solution is higher than that in chicken egg white. This is explained by the fact that the calibration dependences of the UCL intensity on pH obtained for an aqueous solution of CDs were used to determine the pH in the egg white. Nevertheless, the accuracy of determining the pH of both water and biological tissue from the UCL spectra of the nanosensor based on CDs (Table 1) satisfies the needs of biomedicine.
Thus, the pH nanosensor on the basis on CDs’ up-conversion luminescence intensity was successfully approbated for the biological substances. Due to the fact that the anti-Stokes luminescence does not overlap with the autofluorescence of the biological medium, a good accuracy of pH determination was achieved. All pH nanosensors based on Stokes luminescence would be hindered by the biological autofluorescence, fully avoided for UCL-based probes.

4. Conclusions

In this work, the UCL for aqueous solutions of carbon dots with a polyfunctional surface and a surface functionalized with carboxyl groups was studied. It was found that UCL is absent in CDs functionalized with hydroxyl surface groups.
The obtained quadratic dependence of the CDs’ UCL intensity on the power of the exciting radiation proves the fact that the UCL for the studied CDs is caused by two-photon absorption processes.
The differences in the UCL of CD-poly and CD-COOH aqueous solutions and its absence for CD-OH indicates that the mechanisms of nonlinear optical properties of CDs (photoluminescence in the result of two-photon absorption), such as linear ones (classic photoluminescence in the Stokes region), depend on the type and composition of surface functional groups.
It was found that the UCL for aqueous solutions of CD-poly and CD-COOH in water depends on the wavelength of the excitation radiation and on the pH value of the solution. The analysis of the obtained results showed that CDs’ UCL is most effectively excited at a wavelength of 720 nm. It has been shown that the studied CD-COOH and CD-poly with up-conversion luminescence can be used as pH nanosensors in the linear response pH ranges from 2 to 9 and from 5 to 9, respectively. In these ranges, the estimated accuracy in the determination of the pH of the environment by UCL spectra for aqueous solutions of CDs was 0.13 for CD-poly and 0.21 for CD-COOH. Approbation of pH nanosensors in biological tissue—chicken egg white—was carried out, which demonstrated the prospects of using the proposed method of using CDs’ UCL to determine the pH of biological media.
Obviously, CD-COOH are more promising for biomedical problems as pH nanosensors, since they have high biocompatibility and can measure pH in a larger range of its linear changes in biological tissue.

Supplementary Materials

The following supporting information can be downloaded at: https://www.mdpi.com/article/10.3390/app122312006/s1, Figure S1: Reproducibility of up-conversion luminescence of CD aqueous suspension obtained in different synthesis batches under the same synthesis conditions, Figure S2: Demonstration of the up-conversion luminescence stability of aqueous suspension of CDs for 10 days.

Author Contributions

Conceptualization, T.D. and K.L.; methodology, S.B., M.K., and K.L.; software, A.V.; validation, M.K. and A.V.; formal analysis, A.V.; investigation, M.K. and K.L.; resources, T.D.; data curation, T.D. and K.L.; writing—original draft preparation, T.D. and K.L.; writing—review and editing, T.D.; visualization, M.K.; supervision, T.D.; project administration, T.D.; funding acquisition, T.D. All authors have read and agreed to the published version of the manuscript.

Funding

The study was carried out at the expense of a grant from the Russian Science Foundation No. 22-12-00138, https://rscf.ru/project/22-12-00138/ (accessed on 2 September 2022).

Institutional Review Board Statement

Not applicable.

Informed Consent Statement

Not applicable.

Data Availability Statement

Not applicable.

Acknowledgments

We acknowledge the Interdisciplinary Scientific and Educational School of Lomonosov Moscow State University “Photonic and Quantum technologies. Digital medicine”. Some of the experimental results used in this study were obtained using a FTIR spectrometer purchased under the Development Program of Moscow State University (Agreement No. 65, 4 October 2021).

Conflicts of Interest

The authors declare no conflict of interest.

References

  1. Mansuriya, B.D.; Altintas, Z. Carbon Dots: Classification, Properties, Synthesis, Characterization, and Applications in Health Care—An Updated Review (2018–2021). Nanomaterials 2021, 11, 2525. [Google Scholar] [CrossRef]
  2. Mikheev, G.M.; Vanyukov, V.V.; Mogileva, T.N.; Mikheev, K.G.; Aleksandrovich, A.N.; Nunn, N.A.; Shenderova, O.A. Femtosecond Optical Nonlinearity of Nanodiamond Suspensions. Appl. Sci. 2021, 11, 5455. [Google Scholar] [CrossRef]
  3. Mikheev, G.M.; Krivenkov, R.Y.; Mogileva, T.N.; Mikheev, K.G.; Nunn, N.; Shenderova, O.A. Saturable absorption in suspensions of single-digit detonation nanodiamonds. J. Phys. Chem. C 2017, 121, 8630–8635. [Google Scholar] [CrossRef]
  4. Sarmanova, O.E.; Burikov, S.A.; Dolenko, S.A.; Isaev, I.V.; Laptinskiy, K.A.; Prabhakar, N.; Karaman, D.Ş.; Rosenholm, J.M.; Shenderova, O.A.; Dolenko, T.A. A Method for Optical Imaging and Monitoring of the Excretion of Fluorescent Nanocomposites from the Body Using Artificial Neural Networks. Nanomed. Nanotechnol. Biol. Med. 2018, 14, 1371–1380. [Google Scholar] [CrossRef] [PubMed]
  5. Zhang, H.; Wu, S.; Xing, Z.; Wang, H.-B. Turning waste into treasure: Chicken eggshell membrane derived fluorescent carbon nanodots for the rapid and sensitive detection of Hg2+ and glutathione. Analyst 2021, 146, 7250–7256. [Google Scholar] [CrossRef]
  6. Zhang, H.; Wu, S.; Xing, Z.; Gao, M.; Sun, M.; Wang, J.; Wang, H.-B. Green synthesis of carbon nanodots for direct and rapid determination of theophylline through fluorescence turn on–off strategy. Appl. Phys. A 2022, 128, 1–10. [Google Scholar] [CrossRef]
  7. Laptinskiy, K.; Burikov, S.; Dolenko, S.; Efitorov, A.; Sarmanova, O.; Shenderova, O.; Vlasov, I.; Dolenko, T. Monitoring of Nanodiamonds in Human Urine Using Artificial Neural Networks. Phys. Status Solidi A 2016, 213, 2614–2622. [Google Scholar] [CrossRef]
  8. Sarmanova, O.E.; Laptinskiy, K.A.; Khmeleva, M.Y.; Burikov, S.A.; Dolenko, S.A.; Tomskaya, A.E.; Dolenko, T.A. Development of the Fluorescent Carbon Nanosensor for PH and Temperature of Liquid Media with Artificial Neural Networks. Spectrochim. Acta A Mol. Biomol. Spectrosc. 2021, 258, 119861. [Google Scholar] [CrossRef]
  9. Cao, L.; Wang, X.; Meziani, M.J.; Lu, F.; Wang, H.; Luo, P.G.; Lin, Y.; Harruff, B.A.; Veca, L.M.; Murray, D.; et al. Carbon Dots for Multiphoton Bioimaging. J. Am. Chem. Soc. 2007, 129, 11318–11319. [Google Scholar] [CrossRef] [Green Version]
  10. Zhu, S.; Zhang, J.; Tang, S.; Qiao, C.; Wang, L.; Wang, H.; Liu, X.; Li, B.; Li, Y.; Yu, W.; et al. Surface Chemistry Routes to Modulate the Photoluminescence of Graphene Quantum Dots: From Fluorescence Mechanism to Up-Conversion Bioimaging Applications. Adv. Funct. Mater. 2012, 22, 4732–4740. [Google Scholar] [CrossRef]
  11. Shen, J.; Zhu, Y.; Chen, C.; Yang, X.; Li, C. Facile Preparation and Upconversion Luminescence of Graphene Quantum Dots. Chem. Commun. 2011, 47, 2580–2582. [Google Scholar] [CrossRef] [PubMed]
  12. Zhuo, S.; Shao, M.; Lee, S.-T. Upconversion and Downconversion Fluorescent Graphene Quantum Dots: Ultrasonic Preparation and Photocatalysis. ACS Nano 2012, 6, 1059–1064. [Google Scholar] [CrossRef]
  13. Tan, D.; Zhou, S.; Qiu, J. Comment on “Upconversion and Downconversion Fluorescent Graphene Quantum Dots: Ultrasonic Preparation and Photocatalysis”. ACS Nano 2012, 6, 6530–6531. [Google Scholar] [CrossRef] [PubMed]
  14. Gan, Z.; Wu, X.; Zhou, G.; Shen, J.; Chu, P.K. Is There Real Upconversion Photoluminescence from Graphene Quantum Dots? Adv. Opt. Mater. 2013, 1, 554–558. [Google Scholar] [CrossRef]
  15. Wen, X.; Yu, P.; Toh, Y.-R.; Ma, X.; Tang, J. On the Upconversion Fluorescence in Carbon Nanodots and Graphene Quantum Dots. Chem. Commun. 2014, 50, 4703–4706. [Google Scholar] [CrossRef] [PubMed]
  16. Lan, M.; Zhao, S.; Zhang, Z.; Yan, L.; Guo, L.; Niu, G.; Zhang, J.; Zhao, J.; Zhang, H.; Wang, P.; et al. Two-Photon-Excited near-Infrared Emissive Carbon Dots as Multifunctional Agents for Fluorescence Imaging and Photothermal Therapy. Nano Res. 2017, 10, 3113–3123. [Google Scholar] [CrossRef]
  17. Santos, C.I.M.; Mariz, I.F.A.; Pinto, S.N.; Gonçalves, G.; Bdikin, I.; Marques, P.A.A.P.; Neves, M.G.P.M.S.; Martinho, J.M.G.; Maçôas, E.M.S. Selective Two-Photon Absorption in Carbon Dots: A Piece of the Photoluminescence Emission Puzzle. Nanoscale 2018, 10, 12505–12514. [Google Scholar] [CrossRef] [Green Version]
  18. Jin, Q.; Gubu, A.; Chen, X.; Tang, X. A Photochemical Avenue to Photoluminescent N-Dots and Their Upconversion Cell Imaging. Sci. Rep. 2017, 7, 1793. [Google Scholar] [CrossRef] [PubMed] [Green Version]
  19. Joly, A.G.; Chen, W.; McCready, D.E.; Malm, J.-O.; Bovin, J.-O. Upconversion Luminescence of CdTe Nanoparticles. Phys. Rev. B 2005, 71, 165304. [Google Scholar] [CrossRef] [Green Version]
  20. Gui, R.; Jin, H.; Wang, Z.; Tan, L. Recent Advances in Optical Properties and Applications of Colloidal Quantum Dots under Two-Photon Excitation. Coord. Chem. Rev. 2017, 338, 141–185. [Google Scholar] [CrossRef]
  21. Liu, K.; Song, S.; Sui, L.; Wu, S.; Jing, P.; Wang, R.; Li, Q.; Wu, G.; Zhang, Z.; Yuan, K.; et al. Efficient Red/Near-Infrared-Emissive Carbon Nanodots with Multiphoton Excited Upconversion Fluorescence. Adv. Sci. 2019, 6, 1900766. [Google Scholar] [CrossRef] [PubMed] [Green Version]
  22. Li, D.; Liang, C.; Ushakova, E.V.; Sun, M.; Huang, X.; Zhang, X.; Jing, P.; Yoo, S.J.; Kim, J.; Liu, E.; et al. Thermally Activated Upconversion Near-Infrared Photoluminescence from Carbon Dots Synthesized via Microwave Assisted Exfoliation. Small 2019, 15, 1905050. [Google Scholar] [CrossRef] [PubMed]
  23. Kumar Reddy Bogireddy, N.; Agarwal, V. Tunable Upconversion Emission from Oil-Based Carbon Nanodots. Mater. Lett. 2022, 313, 131640. [Google Scholar] [CrossRef]
  24. Zhang, Q.; Wang, R.; Feng, B.; Zhong, X.; Ostrikov, K. Photoluminescence Mechanism of Carbon Dots: Triggering High-Color-Purity Red Fluorescence Emission through Edge Amino Protonation. Nat. Commun. 2021, 12, 6856. [Google Scholar] [CrossRef]
  25. Jiang, K.; Sun, S.; Zhang, L.; Lu, Y.; Wu, A.; Cai, C.; Lin, H. Red, Green, and Blue Luminescence by Carbon Dots: Full-Color Emission Tuning and Multicolor Cellular Imaging. Angew. Chem. Int. Ed. 2015, 54, 5360–5363. [Google Scholar] [CrossRef]
  26. Petit, T.; Puskar, L.; Dolenko, T.; Choudhury, S.; Ritter, E.; Burikov, S.; Laptinskiy, K.; Brzustowski, Q.; Schade, U.; Yuzawa, H.; et al. Unusual Water Hydrogen Bond Network around Hydrogenated Nanodiamonds. J. Phys. Chem. C 2017, 121, 5185–5194. [Google Scholar] [CrossRef] [Green Version]
  27. Prabhakar, N.; Näreoja, T.; von Haartman, E.; Şen Karaman, D.; Burikov, S.A.; Dolenko, T.A.; Deguchi, T.; Mamaeva, V.; Hänninen, P.E.; Vlasov, I.I.; et al. Functionalization of Graphene Oxide Nanostructures Improves Photoluminescence and Facilitates Their Use as Optical Probes in Preclinical Imaging. Nanoscale 2015, 7, 10410–10420. [Google Scholar] [CrossRef]
  28. Liu, Q.; Guo, B.; Rao, Z.; Zhang, B.; Gong, J.R. Strong Two-Photon-Induced Fluorescence from Photostable, Biocompatible Nitrogen-Doped Graphene Quantum Dots for Cellular and Deep-Tissue Imaging. Nano Lett. 2013, 13, 2436–2441. [Google Scholar] [CrossRef]
  29. Yin, B.; Deng, J.; Peng, X.; Long, Q.; Zhao, J.; Lu, Q.; Chen, Q.; Li, H.; Tang, H.; Zhang, Y.; et al. Green Synthesis of Carbon Dots with Down- and up-Conversion Fluorescent Properties for Sensitive Detection of Hypochlorite with a Dual-Readout Assay. Analyst 2013, 138, 6551. [Google Scholar] [CrossRef]
  30. Zhu, A.; Luo, Z.; Ding, C.; Li, B.; Zhou, S.; Wang, R.; Tian, Y. A Two-Photon “Turn-on” Fluorescent Probe Based on Carbon Nanodots for Imaging and Selective Biosensing of Hydrogen Sulfide in Live Cells and Tissues. Analyst 2014, 139, 1945–1952. [Google Scholar] [CrossRef]
  31. Ha, H.D.; Jang, M.-H.; Liu, F.; Cho, Y.-H.; Seo, T.S. Upconversion Photoluminescent Metal Ion Sensors via Two Photon Absorption in Graphene Oxide Quantum Dots. Carbon 2015, 81, 367–375. [Google Scholar] [CrossRef]
  32. Ni, Y.; Han, Z.; Ren, J.; Wang, Z.; Zhang, W.; Xie, Z.; Shao, Y.; Zhou, S. Ultralow Threshold Lasing from Carbon Dot–Ormosil Gel Hybrid-Based Planar Microcavity. Nanomaterials 2021, 11, 1762. [Google Scholar] [CrossRef] [PubMed]
  33. Huang, M.; Liang, X.; Zhang, Z.; Wang, J.; Fei, Y.; Ma, J.; Qu, S.; Mi, L. Carbon Dots for Intracellular PH Sensing with Fluorescence Lifetime Imaging Microscopy. Nanomaterials 2020, 10, 604. [Google Scholar] [CrossRef] [PubMed] [Green Version]
  34. Ren, J.; Weber, F.; Weigert, F.; Wang, Y.; Choudhury, S.; Xiao, J.; Lauermann, I.; Resch-Genger, U.; Bande, A.; Petit, T. Influence of Surface Chemistry on Optical, Chemical and Electronic Properties of Blue Luminescent Carbon Dots. Nanoscale 2019, 11, 2056–2064. [Google Scholar] [CrossRef] [Green Version]
  35. Ye, X.; Xiang, Y.; Wang, Q.; Li, Z.; Liu, Z. A Red Emissive Two-Photon Fluorescence Probe Based on Carbon Dots for Intracellular PH Detection. Small 2019, 15, 1901673. [Google Scholar] [CrossRef]
  36. Ţucureanu, V.; Matei, A.; Avram, A.M. FTIR Spectroscopy for Carbon Family Study. Crit. Rev. Anal. Chem. 2016, 46, 502–520. [Google Scholar] [CrossRef]
  37. Vervald, A.M.; Lachko, A.V.; Kudryavtsev, O.S.; Shenderova, O.A.; Kuznetsov, S.V.; Vlasov, I.I.; Dolenko, T.A. Surface Photoluminescence of Oxidized Nanodiamonds: Influence of Environment PH. J. Phys. Chem. C 2021, 125, 18247–18258. [Google Scholar] [CrossRef]
  38. Fan, T.; Zeng, W.; Tang, W.; Yuan, C.; Tong, S.; Cai, K.; Liu, Y.; Huang, W.; Min, Y.; Epstein, A.J. Controllable Size-Selective Method to Prepare Graphene Quantum Dots from Graphene Oxide. Nanoscale Res. Lett. 2015, 10, 55. [Google Scholar] [CrossRef] [Green Version]
  39. Lee, D.W.; De Los Santos, V.L.; Seo, J.W.; Felix, L.L.; Bustamante, D.A.; Cole, J.M.; Barnes, C.H.W. The Structure of Graphite Oxide: Investigation of Its Surface Chemical Groups. J. Phys. Chem. B 2010, 114, 5723–5728. [Google Scholar] [CrossRef] [Green Version]
  40. Zhang, H.; Huang, H.; Ming, H.; Li, H.; Zhang, L.; Liu, Y.; Kang, Z. Carbon Quantum Dots/Ag3PO4 Complex Photocatalysts with Enhanced Photocatalytic Activity and Stability under Visible Light. J. Mater. Chem. 2012, 22, 10501. [Google Scholar] [CrossRef]
  41. Mintz, K.J.; Mercado, G.; Zhou, Y.; Ji, Y.; Hettiarachchi, S.D.; Liyanage, P.Y.; Pandey, R.R.; Chusuei, C.C.; Dallman, J.; Leblanc, R.M. Tryptophan Carbon Dots and Their Ability to Cross the Blood-Brain Barrier. Colloids Surf. B Biointerfaces 2019, 176, 488–493. [Google Scholar] [CrossRef] [PubMed]
  42. De, B.; Karak, N. A Green and Facile Approach for the Synthesis of Water Soluble Fluorescent Carbon Dots from Banana Juice. RSC Adv. 2013, 3, 8286. [Google Scholar] [CrossRef]
  43. Emam, A.N.; Loutfy, S.A.; Mostafa, A.A.; Awad, H.; Mohamed, M.B. Cyto-Toxicity, Biocompatibility and Cellular Response of Carbon Dots–Plasmonic Based Nano-Hybrids for Bioimaging. RSC Adv. 2017, 7, 23502–23514. [Google Scholar] [CrossRef] [Green Version]
  44. Khmeleva, M.Y.; Laptinskiy, K.A.; Kasiyanova, P.S.; Tomskaya, A.E.; Dolenko, T.A. Dependence of the photoluminescence of carbon dots with different functionalization of the surface on the water pH. Opt. Spectrosc. 2022, 6, 882–889. (In Russian) [Google Scholar] [CrossRef]
Figure 1. STEM image of the synthesized nanoparticles (a) and their elemental analysis (b).
Applsci 12 12006 g001
Figure 2. IR absorption spectra of water and powders of synthesized CDs.
Applsci 12 12006 g002
Figure 3. Optical extinction spectra of aqueous solutions for the studied CDs. pH = 7.
Applsci 12 12006 g003
Figure 4. Scheme of the experimental setup for the study of CDs’ UCL: 1—pulsed nanosecond Nd:YAG laser; 2—parametric light generator; 3—light filter KS-11; 4—rotatory mirror; 5—power meter; 6—mechanical shutter; 7—rotatory mirror and lens; 8—cuvette with the solution of nanoparticles; 9—optical system of two lenses; 10—light filters SZS-22 and SZS-23; 11—registration system consisting of a monochromator and a CCD camera.
Applsci 12 12006 g004
Figure 5. UCL spectra of aqueous solutions of CD-poly and CD-COOH upon excitation by laser radiation at wavelengths of 680, 720, and 800 nm (pH = 11.7).
Applsci 12 12006 g005
Figure 6. Dependences of the integrated UCL intensities of aqueous solutions of CD-poly and CD-COOH on the wavelength of the exciting radiation (pH = 11.7).
Applsci 12 12006 g006
Figure 7. Dependences of the UCL integrated intensity of aqueous solutions of CD-poly and CD-COOH (pH = 11.7) on the power of exciting radiation and approximation of experimental data by quadratic dependences.
Applsci 12 12006 g007
Figure 8. Dependence of the integral intensity (a) and the position of the maximum (b) of the UCL spectra of aqueous solutions of CD-COOH and CD-poly on pH. The vertical lines represent the pH limits of applying the linear fit to UCL intensity vs. pH.
Applsci 12 12006 g008
Figure 9. UCL of CDs in chicken egg white (lower half of the image) upon excitation at a wavelength of 720 nm.
Applsci 12 12006 g009
Table 1. The pH values of the water and chicken egg white obtained using a pH electrode and from the spectra of CDs’ UCL.
Measurement MethodWaterEgg White 1Egg White 2Egg White 3Egg White 4
Electrode6.73 ± 0.058.33 ± 0.058.36 ± 0.058.23 ± 0.058.44 ± 0.05
CD-poly6.74 ± 0.128.34 ± 0.168.32 ± 0.188.16 ± 0.198.48 ± 0.16
CD-COOH6.73 ± 0.228.35 ± 0.318.33 ± 0.338.17 ± 0.3688.55 ± 0.33
Publisher’s Note: MDPI stays neutral with regard to jurisdictional claims in published maps and institutional affiliations.

