Article

Self-Healing of Semantically Interoperable Smart and Prescriptive Edge Devices in IoT

by
Asimina Dimara
1,2,*,
Vasileios-Georgios Vasilopoulos
1,
Alexios Papaioannou
1,3,
Sotirios Angelis
2,
Konstantinos Kotis
2,*,
Christos-Nikolaos Anagnostopoulos
2,
Stelios Krinidis
1,3,
Dimosthenis Ioannidis
1 and
Dimitrios Tzovaras
1
1
Centre for Research and Technology Hellas, Information Technologies Institute, 57001 Thessaloniki, Greece
2
Department of Cultural Technology and Communication, University of the Aegean, Intelligent Systems Lab, 81100 Mytilene, Greece
3
Management Science and Technology Department, International Hellenic University (IHU), 65404 Kavala, Greece
*
Authors to whom correspondence should be addressed.
Appl. Sci. 2022, 12(22), 11650; https://doi.org/10.3390/app122211650
Submission received: 25 October 2022 / Revised: 10 November 2022 / Accepted: 14 November 2022 / Published: 16 November 2022
(This article belongs to the Special Issue IoT in Smart Cities and Homes)

Abstract

:
Smart homes enhance energy efficiency without compromising residents’ comfort. To support smart home deployment and services, an IoT network must be established, while energy-management techniques must be applied to ensure energy efficiency. IoT networks must perpetually operate to ensure constant energy and indoor environmental monitoring. In this paper, an advanced sensor-agnostic plug-n-play prescriptive edge-to-edge IoT network management with micro-services is proposed, supporting also the semantic interoperability of multiple smart edge devices operating in the smart home network. Furthermore, IoT health-monitoring algorithms are applied to inspect network anomalies taking proper healing actions/prescriptions without the need to visit the residency. An autoencoder long short-term memory (AE-LSTM) is selected for detecting problematic situations, improving error prediction to 99.4%. Finally, indicative evaluation results reveal the mitigation of the IoT system breakdowns.

1. Introduction

Nowadays, there has been a disruption of the world’s energy market, also due to the recent Ukraine–Russia conflicting situation (REPowerEU) [1]. The quickest and most affordable method to deal with the current energy crisis and lower costs is to save energy. Therefore, based on the European (EU) Commission and the “EU Save Energy Communication”, outlining quick behavioral adjustments must be accomplished to reduce the demand for energy by at least 5% [2]. Demand-side management by mitigating energy consumption while increasing energy awareness may be achieved by building energy management systems (BEMS) [3]. The BEMS core is a building automation and control system (BACS) that transforms conventional buildings into smart buildings [4]. BACS utilizes IoT networks and is exploited by many applications (Figure 1), such as smart homes consisting of automated applications, connected and smart devices (e.g., smart sensors, energy analyzers) to monitor energy and indoor conditions and control devices (e.g., cooling systems: temperature control) [5].
IoT networks may be wired or wireless, and there is a plethora of IoT communication protocols. There are widely used multi-channel power analyzers (e.g., Carlo Gavazzi EM340 MID [6]) utilizing a RS485 serial interface protocol, and supporting the MODBUS/JBUS (RTU) protocol [7]. Wired connections are also provided by home security systems, such as smoke and heat detectors, and hard-wired window contacts [8]. Furthermore, there is an excess number of wireless and full IoT-ready solutions provided by various companies, such as KNX, LONWorks, DALI, BUSing, BACNet, LoRa and others [9].
Heterogeneous technologies and protocols are utilized by widely used wireless IoT systems. The near-field communication (NFC) protocol enables smartphones, tablets, laptops, and other devices to interconnect and exchange data [10]. Bluetooth is also utilized for data exchange, establishing a brief radio link among fixed or mobile devices [10]. ZigBee supports all types of networks, such as point-to-point and point-to-multipoint mesh networks, covering homes of almost all sizes [10]. The Z-Wave protocol connects automotive and/or automatic devices, sensors and appliances [10]. Wi-Fi is an IEEE 802.11-based protocol utilized in many types of networks addressing and routing data [10].
Each of the aforementioned protocols has a different way of communicating with devices to facilitate data exchange. As a result, various problems might occur, others based on the protocol itself, on the edge device, and on the type of the IoT network. Additionally, connectivity issues may occur based on the way data are gathered [11]. The heterogeneity of resources may result in problems, such as CPU, memory, and bandwidth issues or even more serious issues, such as errors in radio channels [11]. Subsequently, IoT networks suffer from short- or even long-term failures and drop downs, producing wide data gaps and monitoring issues that prevent smooth IoT operation and exploitation.
Nonetheless, by 2026, the number of households expected to be “smart” and own an IoT network is 126.8 million [12]. Considering also the technology revolution both in hardware and software components, even more protocols and devices might be launched in the IoT sector. Therefore, it is of ultimate importance to secure a perpetual and GDPR-friendly operation of the IoT network while being able to integrate all types of protocols, devices, and sensors, i.e., both old and new technology. Furthermore, considering the high cost of energy consumption of the edge device hosting, the IoT network should be able to use minimal resources (i.e., in terms of memory, power, and CPU), and therefore utilize both lightweight and efficient services and applications.
Within this context, an innovative and Smart EDGE AI IoT system (SEDGE) is proposed in this paper that is easily adaptable to new configurations, protocols, sensors and devices, while being energy-efficient. The main contributions, and the novelties of the system, are as follows:
  • Easily configurable sensor and device addition to the IoT network, ensuring replicability;
  • Constant monitoring of the edge and IoT network performance while considering various automated self-healing actions;
  • User notifications, alerts, along with specified prescriptions in case the IoT network needs to be manually checked or restored;
  • Edge AI-based lightweight, and efficient services ensuring that sensor raw data are collected and processed locally.
The remainder of the paper is structured as follows: Section 1, introduces the subject, literature gaps, and proposed novelties from our work, while the latest related works are presented in Section 2. Section 3 addresses the methodology followed, highlighting all the main aspects of an IoT network. Section 4 demonstrates a real-life setup of an IoT network including different protocols, experiments, and IoT crash tests. Finally, conclusions are drawn in the last section of the paper.

2. Related Work

To enhance a building’s smartness by either upgrading houses where energy renovation is not an option, or by just upgrading the capabilities of a newer home, residents install sensors and/or actuators. Eventually, sensors and devices of a smart home will have to be integrated into a unique system to be exploited for further processing. BEMS will use all the data streams deriving from the unified IoT system to monitor indoor conditions and in more advanced systems, will take further control actions aiming at saving energy without compromising users’ comfort. Smart homes use various types of sensors, actuators, devices, protocols, applications, and methodologies, resulting in various IoT architectures, topologies, and management. In this section, some indicative IoT network solutions highlighting the latest trends and technologies are provided.
Low power wide area networks (LPWA), such as LoRa [13], are used in applications aiming in extending communication ranges while decreasing power consumption. In [14], the authors proposed an IoT LoRA network utilizing an emulator to extend the coverage range. As reported in this paper, all the IoT networks are based only on a single communication protocol between the IoT sensors (i.e., LoRA). The location of the LoRA sensors is identified and assigned in different clusters based on both their location and predefined use cases. Finally, each cluster is mapped to a gateway, and all the data coming from the gateway are stored to a cloud server. The proposed system lacks the potentiality to be easily integrated along with devices using other protocols; therefore, it is not feasible to be replicated.
Data that are collected from an IoT network are sensitive and must be processed within the IoT network, and therefore must be protected both for security potential breaches and system breakdowns. In [15], a deep neural network is utilized to detect potential data stream problems. If a traffic problem is detected, a notification is pushed to the network administrator. The experiment was conducted using an open dataset (i.e., IoT-Botnet 2020 [16]), the sensors installed were all ZigBee-based [17], and data streams were saved both locally at the edge and at a cloud database. This work does not take further healing actions other than the notification alert.
Another major problem when handling an IoT network is the limited device resources and computational processing. Amanlou et al. [18] proposed lightweight IoT data handling based on fog computing [19]. IoT data require real-time processing and low latency, preventing cloud processing. On the other hand, in [20], authors are exploring fog computing out of the edge, while handling data with an anomaly-based intrusion-detection system. Even though they integrate an IoT detection system, their data are stored in the cloud. In [21], the design of an IoT-management system is addressed, utilizing an edge-computing model. The SNMP protocol [22] is used for device management, along with the SOAP protocol, to connect with the management process. Moreover, in [23], a combination of SDN/NFV-based 5G IoT and machine-learning algorithms is provided, to deliver a stable IoT network, but no further actions are supported to heal the IoT network.
To mitigate IoT breakdowns and failures, the IoT network must be checked and maintained. In [24], to prevent IoT malfunctions of services and applications and broken hardware, a platform is suggested. This platform monitors the IoT nodes, analyzes the errors, and executes certain actions. Their platform concentrates mainly on errors produced by the sensors, IoT middleware, and cloud communication. Dias, João Pedro et al. [25] presented a model to add healing actions for the Node-RED [26] solution. Their model extends Node-RED with new nodes to maintain health mechanisms for the IoT. This model’s main objective is to discover the faulty node and replace it with a spare node (e.g., replace the sensor with another one).
In the same context, Aktas M.S., and Astekin M. [27] proposed a rule-based event monitoring framework to detect faulty processes of the IoT devices. Their framework is based on simulating the life cycle of an IoT event and performing certain actions if these events exceed a predefined threshold value. In [28], a collection of IoT patterns were used to provide error detection and recovery. Their work mainly focuses on designing normal patterns when the sensor is operating properly (e.g., the motion sensor should detect motion when someone enters a room). Finally, in [29], further extension for self-healing extensions for Node-RED is considered, by testing with real devices.
A summary of the above literature is provided in Table 1. Specifically, the literature is compared to the main SEDGE services, applications, and healing actions. Initially, the type of connection and the protocols utilized for an IoT network are checked (i.e., wired, wireless, and type of connectivity protocols) highlighting that SEDGE has the ability to support all connections and protocols. Furthermore, the IoT data-management plan utilized in other approaches is compared to SEDGE, showcasing that both cloud and edge approaches are utilized.
Furthermore, among the available healing solutions, most solely focus on specific platforms, sensors, and middleware, hindering overall IoT network healing as depicted in Table 2, whilst the most common error detection technique is the monitoring of selected node values. To summarize, SEDGE offers a plethora of capabilities and healing actions of the overall edge performance, and not only on the sensors while offering replicability.

3. SEDGE Proposed Methodology

This section presents the methodology followed to design and build the proposed SEDGE architecture. To start with, the proposed architecture framework is briefly presented. Moreover, each layer of the architecture, along with its components, is thoroughly explained. Finally, the communication “out of the edge” is briefly described to clarify how the proposed system could be integrated to a larger and even centralized (e.g., by a centralized BEMS) system, if needed.

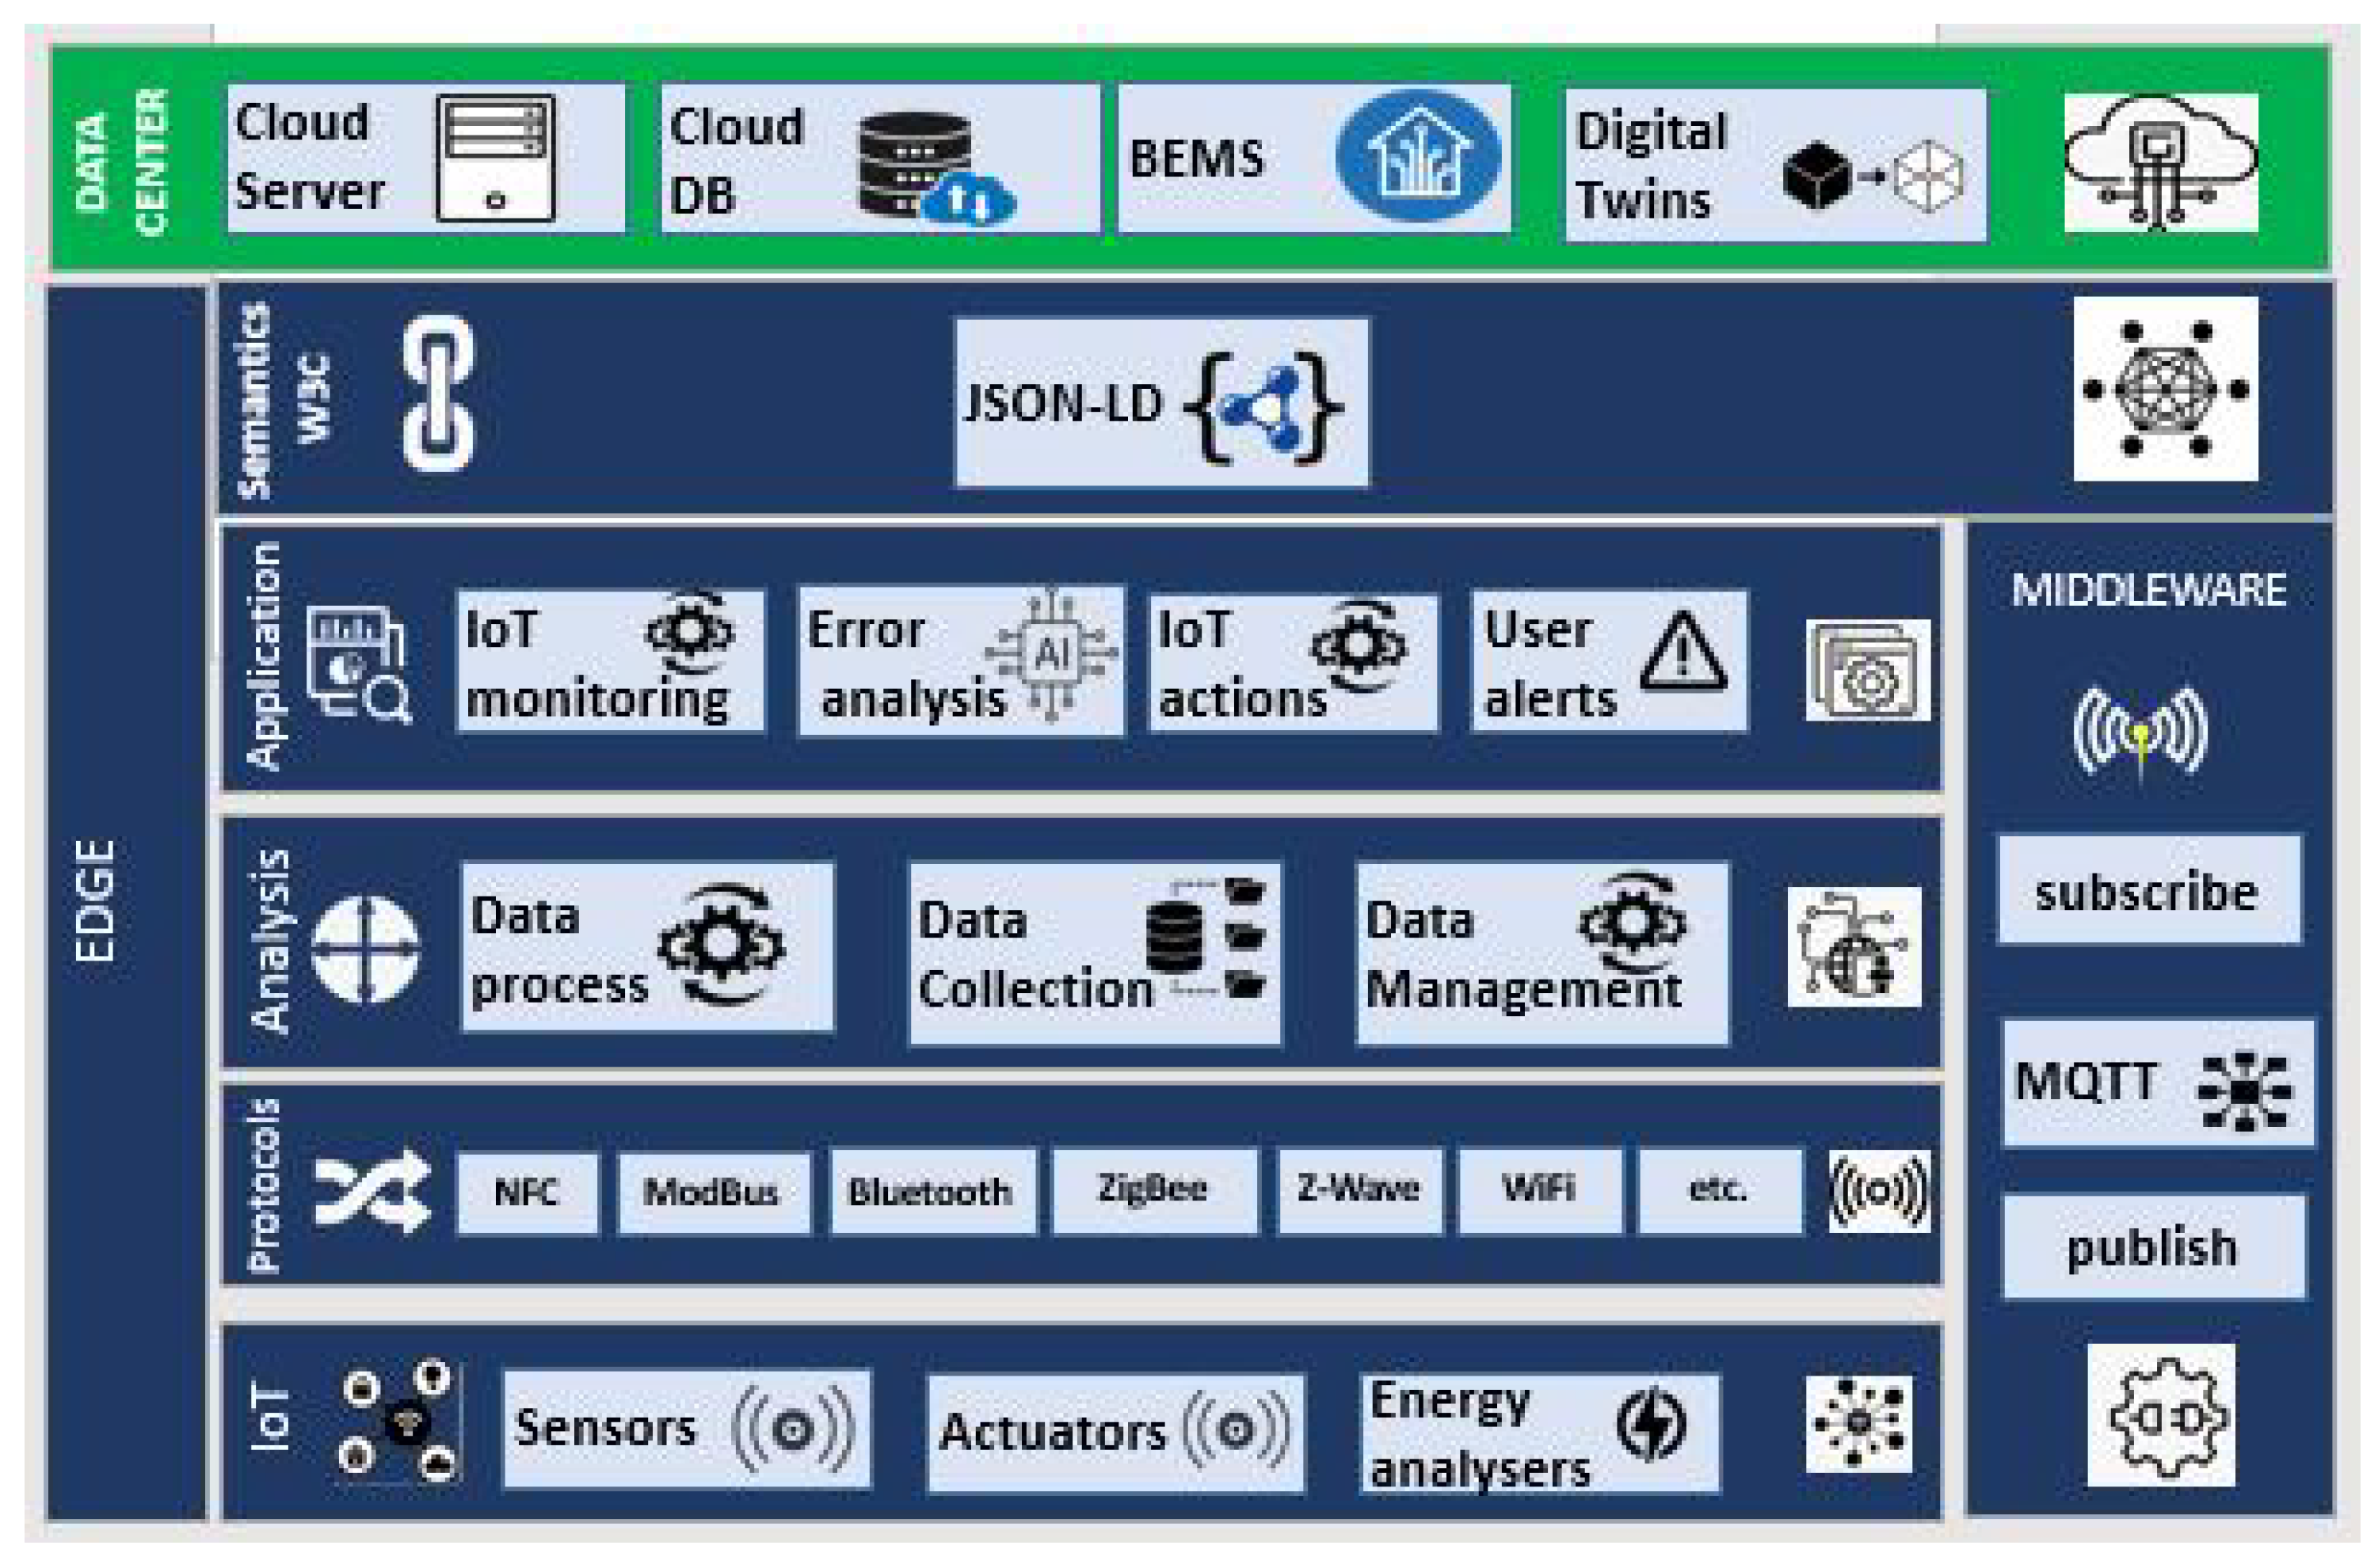
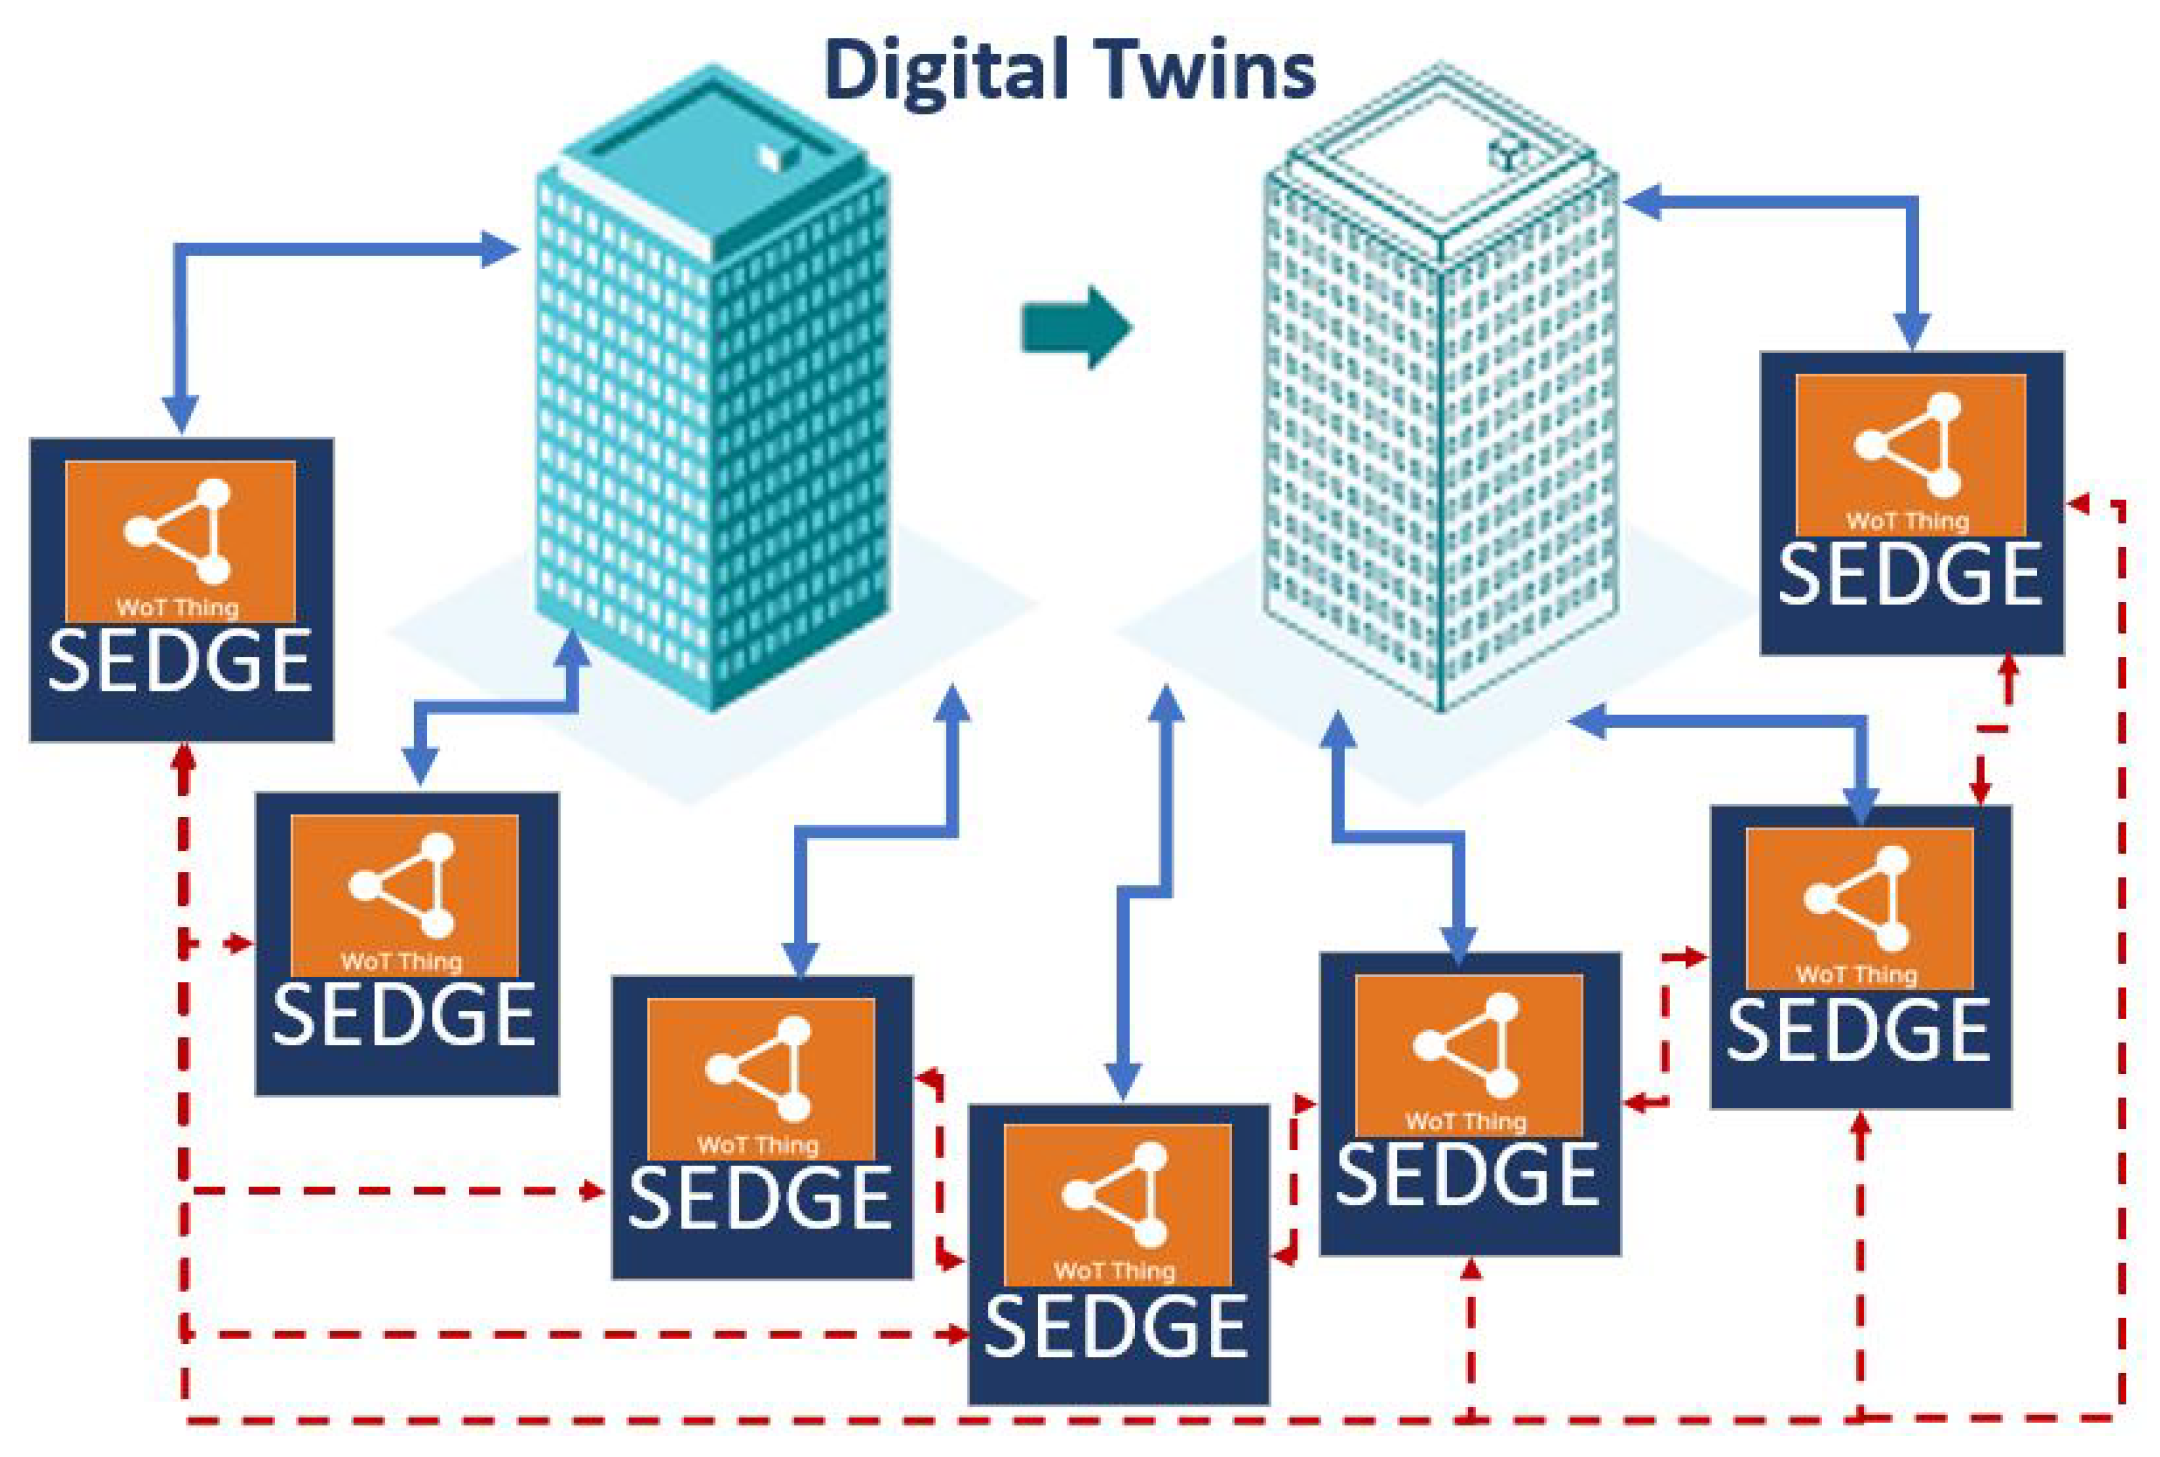
3.1. SEDGE Overall Architecture

The proposed bottom-up layered conceptual architecture is depicted in Figure 2. The first layer consists of devices, sensors and actuators (“things”) composing the nodes of the IoT network. The protocol layer delivers all communication protocols that are utilized from the IoT network. “Climbing” the architecture stack, data analysis and applications are delivered. Furthermore, the middleware layer is used for interlinking and communication both for the edge-to-edge and the edge-to-“outer” world. The final layer presents potential communication with other “external” systems or even other edges, along with a semantic layer to ensure interoperability between various edge devices and other devices/systems. The different parts of the architecture are analyzed layer by layer in the following sections.

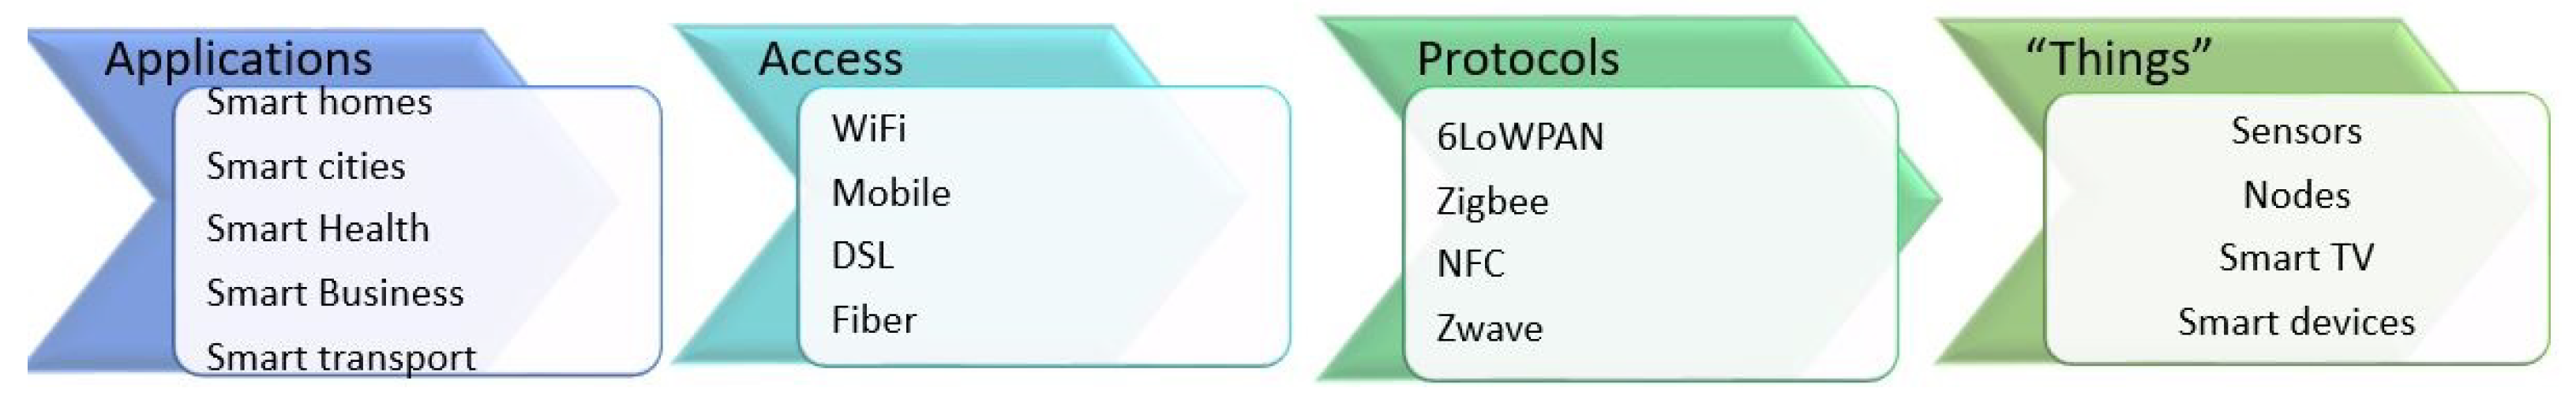
3.2. Iot (Things) Layer

A “thing” in the smart home IoT network could be a sensor, an actuator or an energy analyzer. Nowadays, domesticating the IoT might even include other smart devices, appliances and others (e.g., smart mirrors, smart windows, and robot vacuum cleaners) [30]. In a more general sense, a smart home is a sensed environment that is monitored and/or controlled through automation. Monitoring concerns the utilization of a variety of sensors and energy analyzers, whereas automation concerns the utilization of actuators.
Widely used sensors that are utilized in smart homes are temperature, humidity, motion, illuminace, C O 2 , smoke, occupancy, weather, water leak, freeze, and window/door sensors [31]. Smart homes can include all or some of them, depending on the application, cost, and use-case scenario. Energy/power analyzers, or smart meters, are exploited to monitor electric qualities, such as power, energy, current, voltage, harmonics, and others [32]. Smart meters are mandatory “things” for all building energy management systems (BEMS), as they are used to monitor the energy consumed in a building. Actuators process sensor information and send controls back to home automation or output based on BEMS recommendations [31]. Actuators are able to perform requested actions on specific home elements. Such actuators include actuated blinds, actuated pergolas, smart thermostats, smart valves, and others [31].

3.3. Protocol Layer

Sensors, energy analyzers and actuators that communicate with each other and exchange information with the IoT network use a variety of communication protocols that are wired or wireless. Those actions are performed by exchanging signals between devices. The most popular protocols in smart homes are as follows [33]:
(i)
Wired (they include protocols like the following):
  • Ethernet: a wired communication protocol with susceptibility to electromagnetic interference and range up to 100 m.
  • ModBus: it is used for transmitting information over serial lines.
(ii)
Wireless (they include protocols such as the following):
  • Infrared: offers one-way communication and is usually used for remote controls (e.g., TV control).
  • Wi-Fi: a protocol with a 25-m range based on the IEEE 802.11 standard.
  • Bluetooth: it is a 10 m range protocol that is often used on mobile phones.
  • Thread: devices with this protocol may communicate, even if the Wi-Fi goes down.
  • Zigbee: it operates in a mesh network.
  • Z-Wave: it operates in a mesh network.
  • KNX: a protocol with a decentralized topology.
  • NFC: it is a protocol that transmits data over short distances using radio waves.

3.4. Middleware

Middleware is a software extending the capabilities and common services that the operating system offers to applications. It mostly handles application services, authentication, API management and data management. In addition, it effectively facilitates the creation of applications by developers and serves as the underlying framework that interlinks users, data, and applications. MQTT is probably the most popular messaging protocol for bidirectional communication between IoT components used as middleware. In terms of IoT development, MQTT protocol is more suitable than others, e.g., HTTP, due to ease of use, response time, throughput, lower battery and bandwidth usage. Using the publish/subscribe messaging transport protocol and the use of messaging topics, a client can publish data to a topic on the server where all interested parties can subscribe to receive the data. The protocol specification can be found on the MQTT webpage [34].
The protocol uses a server which hosts the MQTT broker. All clients connect to the broker to publish/subscribe. In the scope of this work, MQTT is used to connect the system’s components locally and offline by taking advantage of its ability to enable communication between different programming languages. The broker is installed as a Linux system [35] service running locally on the edge controller, and binding to the localhost IP. All of the system’s components, including the Z-Wave network manager, energy analyzers, all sensor APIs, weather stations when available, and other occasional entities, are programmed to communicate their data to the broker to ensure robustness and easier addition of further components.

3.5. Analysis Layer

The analysis layer consists of all processes and application that are utilized to manage, process and collect data and information coming from the sensors, devices and actuators. The procedures followed are described in the following subsections.

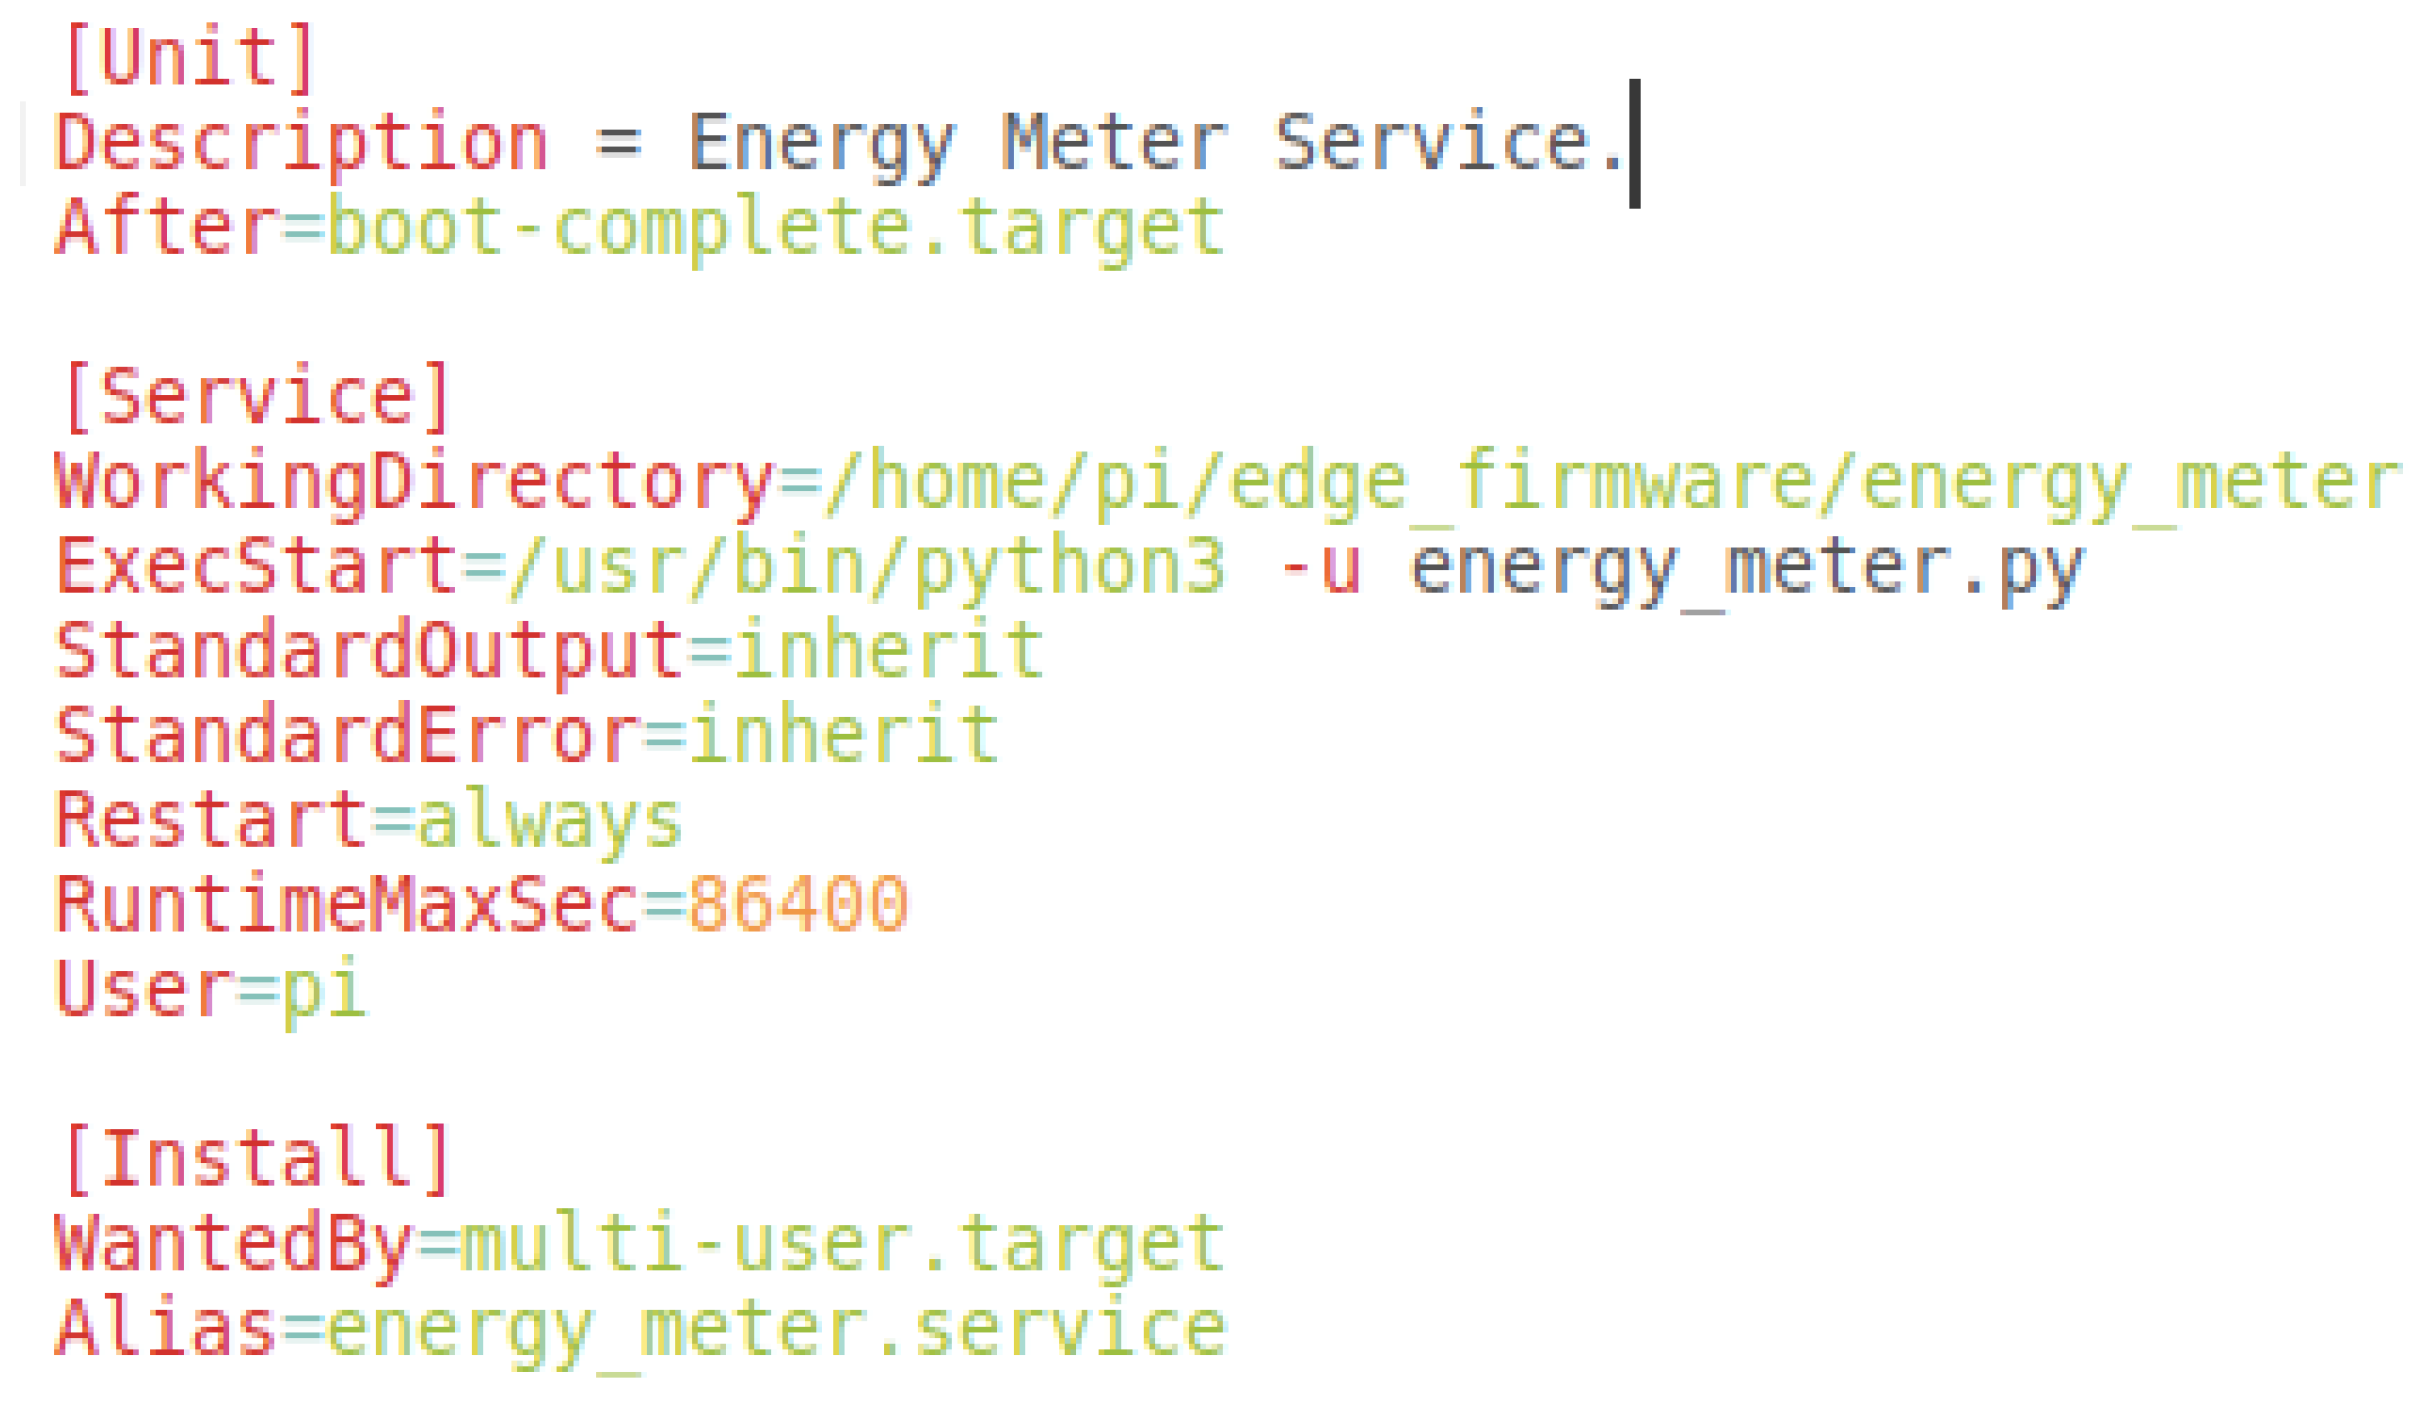
3.5.1. Data Processing: Firmware Deployment

The edge firmware that establishes the system’s component interconnection is developed in Python 3 and installed and maintained in the test sites using Git. The firmware is split into small components, each one assigned with a specific task to ensure system robustness and easier updates.
The DevOps deployment methodology [36] is applied to the development of the set of system components, including the edge firmware, hardware, overlay applications, etc. The DevOps methodology offers continuous system delivery, integration, and deployment.
The edge devices utilize work with Linux-based operating systems. A common example device is a Raspberry Pi 3/4, which was used in test sites. To ensure that the system is perpetually working without faults, all required actions, errors, and updates must be automatically handled and resolved. For the installation of the firmware components, two techniques are currently used. Components that are standard are installed using docker-compose , which creates dockerized containers in the system. An example configuration file can be seen in Figure 3.
The components, which are currently developed, are installed using the Linux service manager (systemctl) as system services. This way, it is easier to monitor the code for errors and warnings and continuously develop. An example service configuration file can be seen in Figure 4.

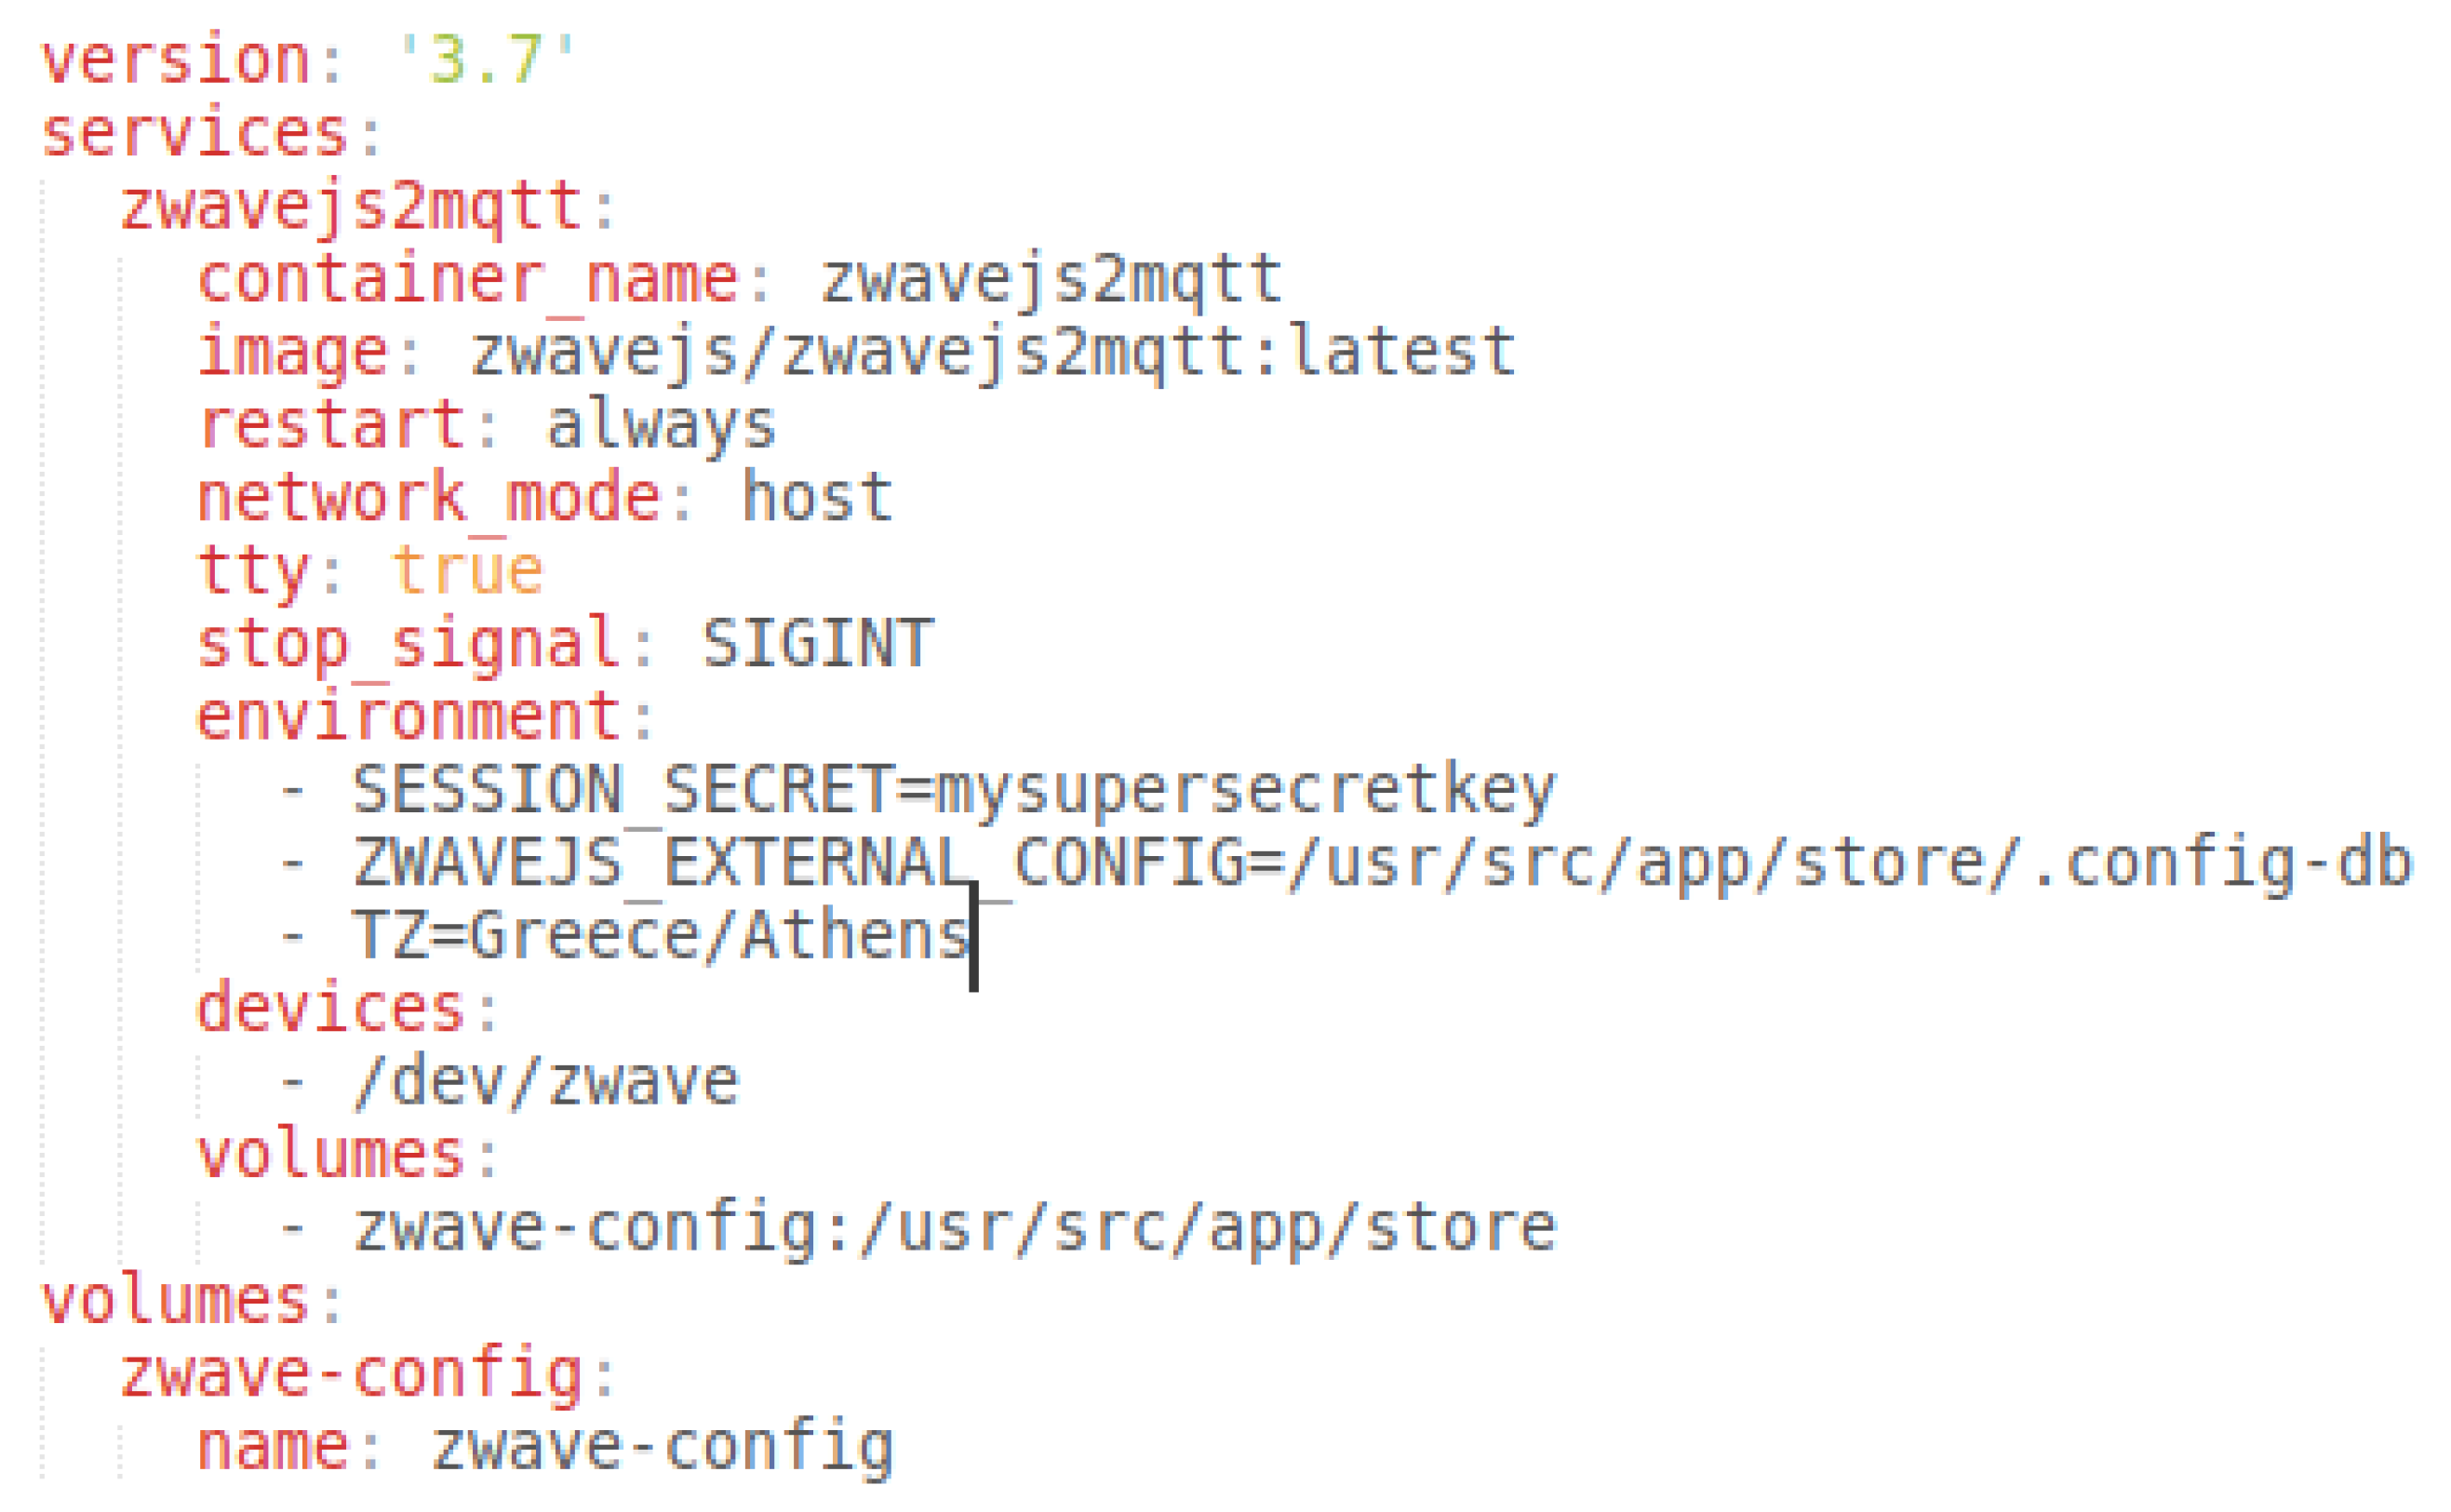
3.5.2. Data Collection—System Entities

Every sensor, energy meter, edge device, and any other devices that produces data, is considered an entity of the system. The data handler service uses a configuration file that includes, among other variables, a map of the entities of the specific system instance, using this map to automatically produce the data format.
In order to facilitate the future addition of system entities in the firmware, each entity is accompanied by a data format template, which is used by the data handler, in addition to the map. The template needs to be manually created the first time a new entity is encountered, and includes predefined information about the entity. Two examples of templates can be seen in Figure 5 and Figure 6. The templates include all information that the system keeps from a Z-Wave smart plug and a Z-Wave multi-sensor.

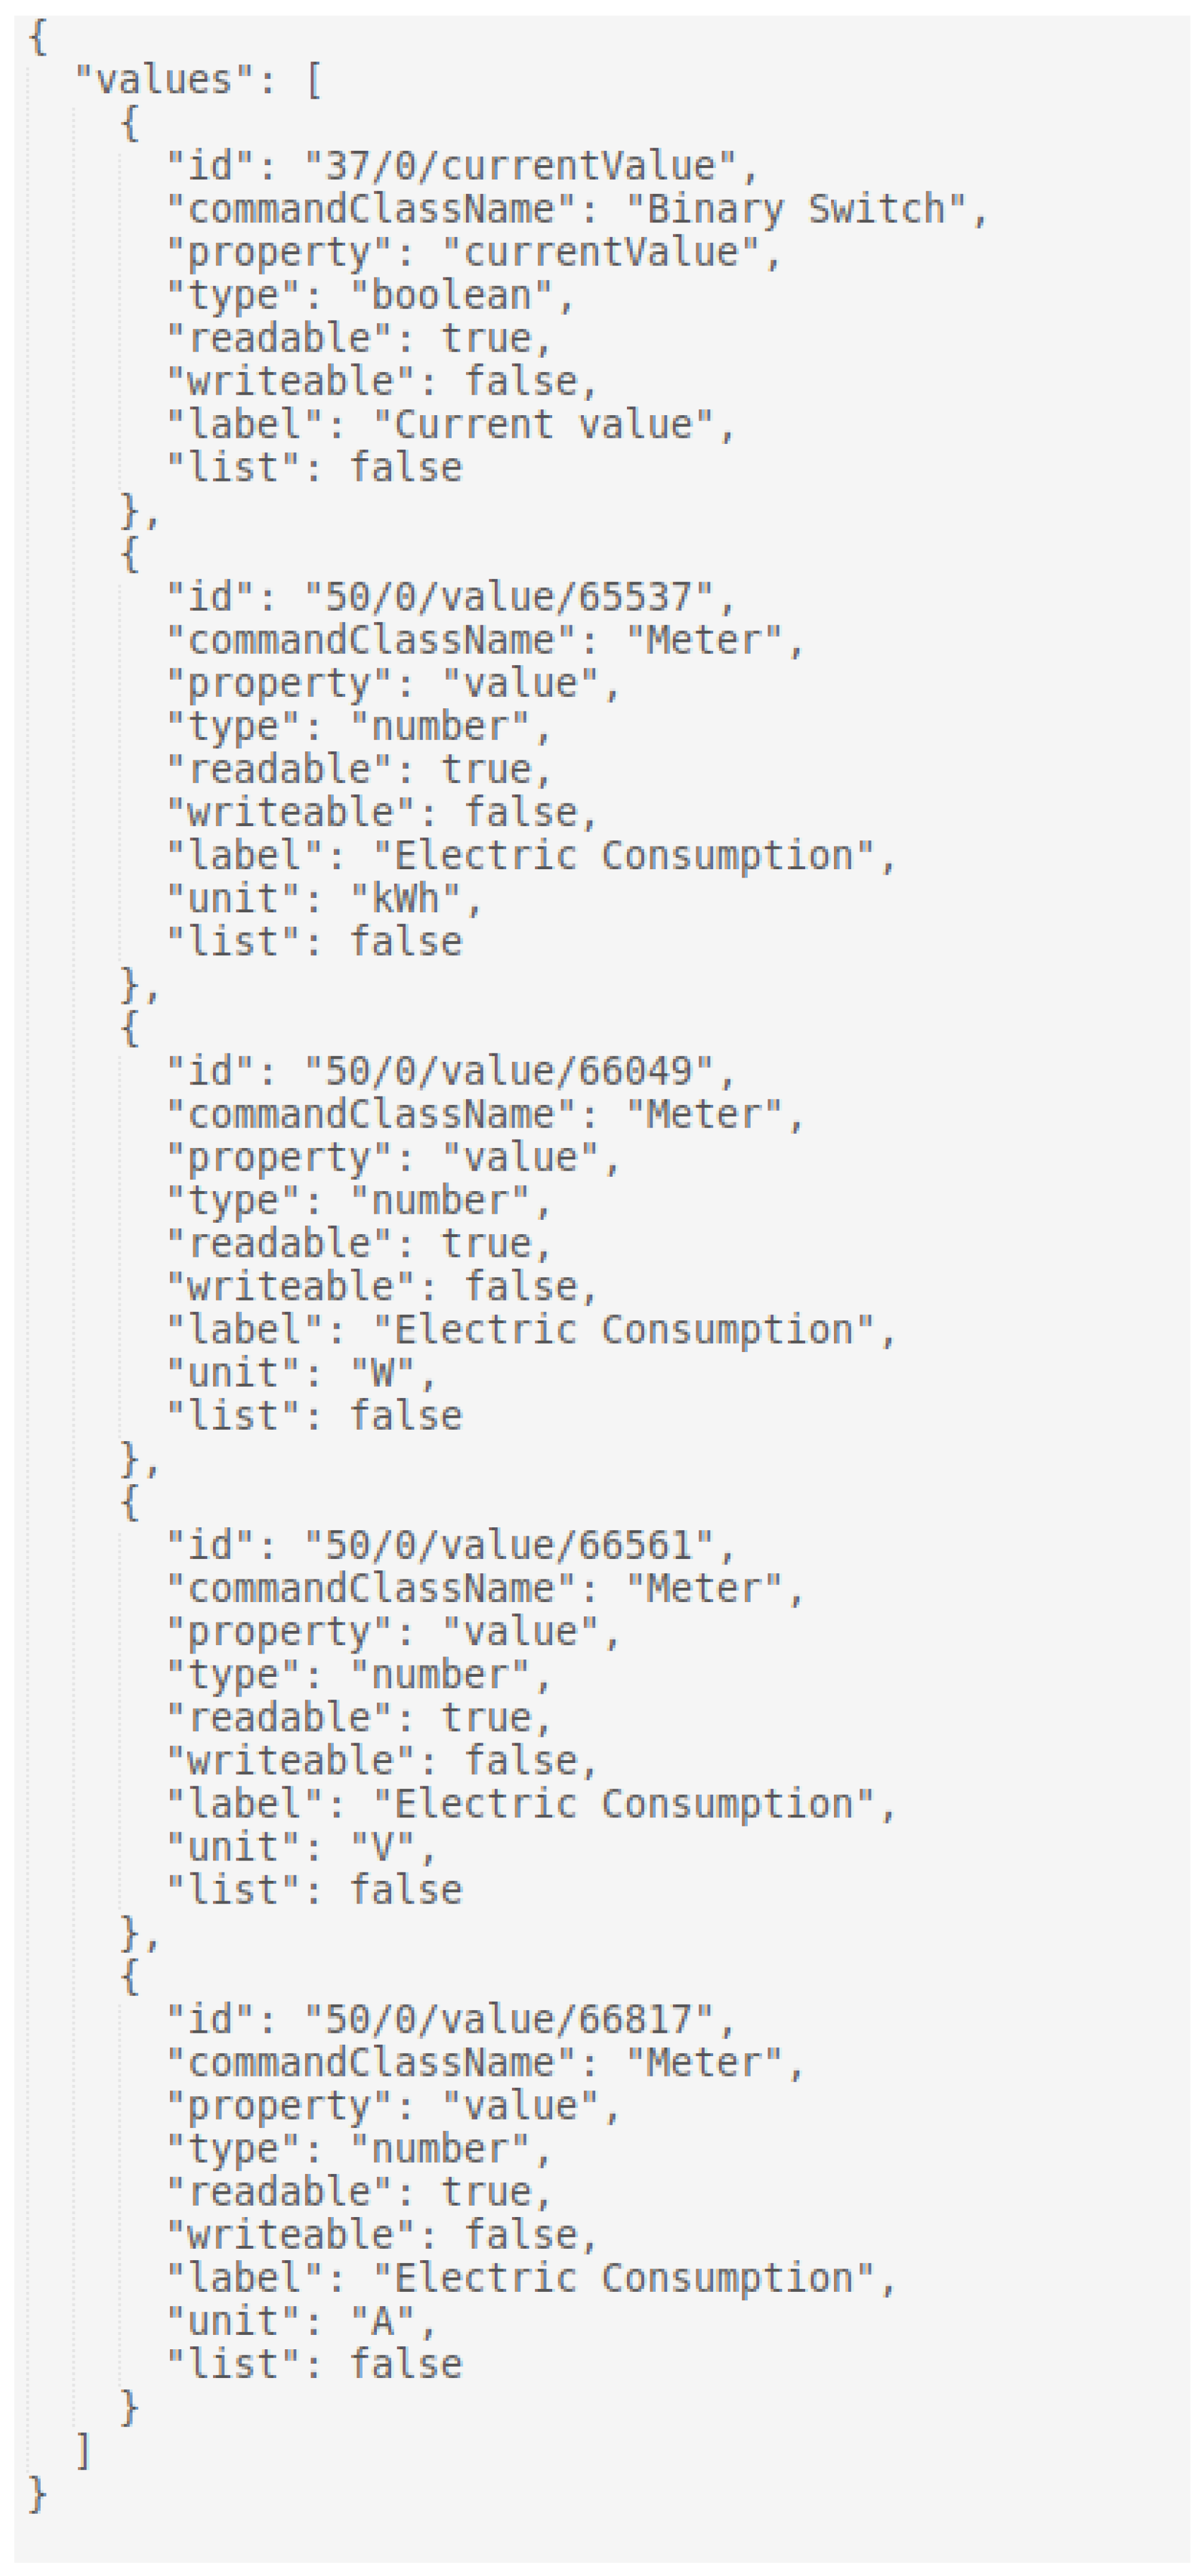
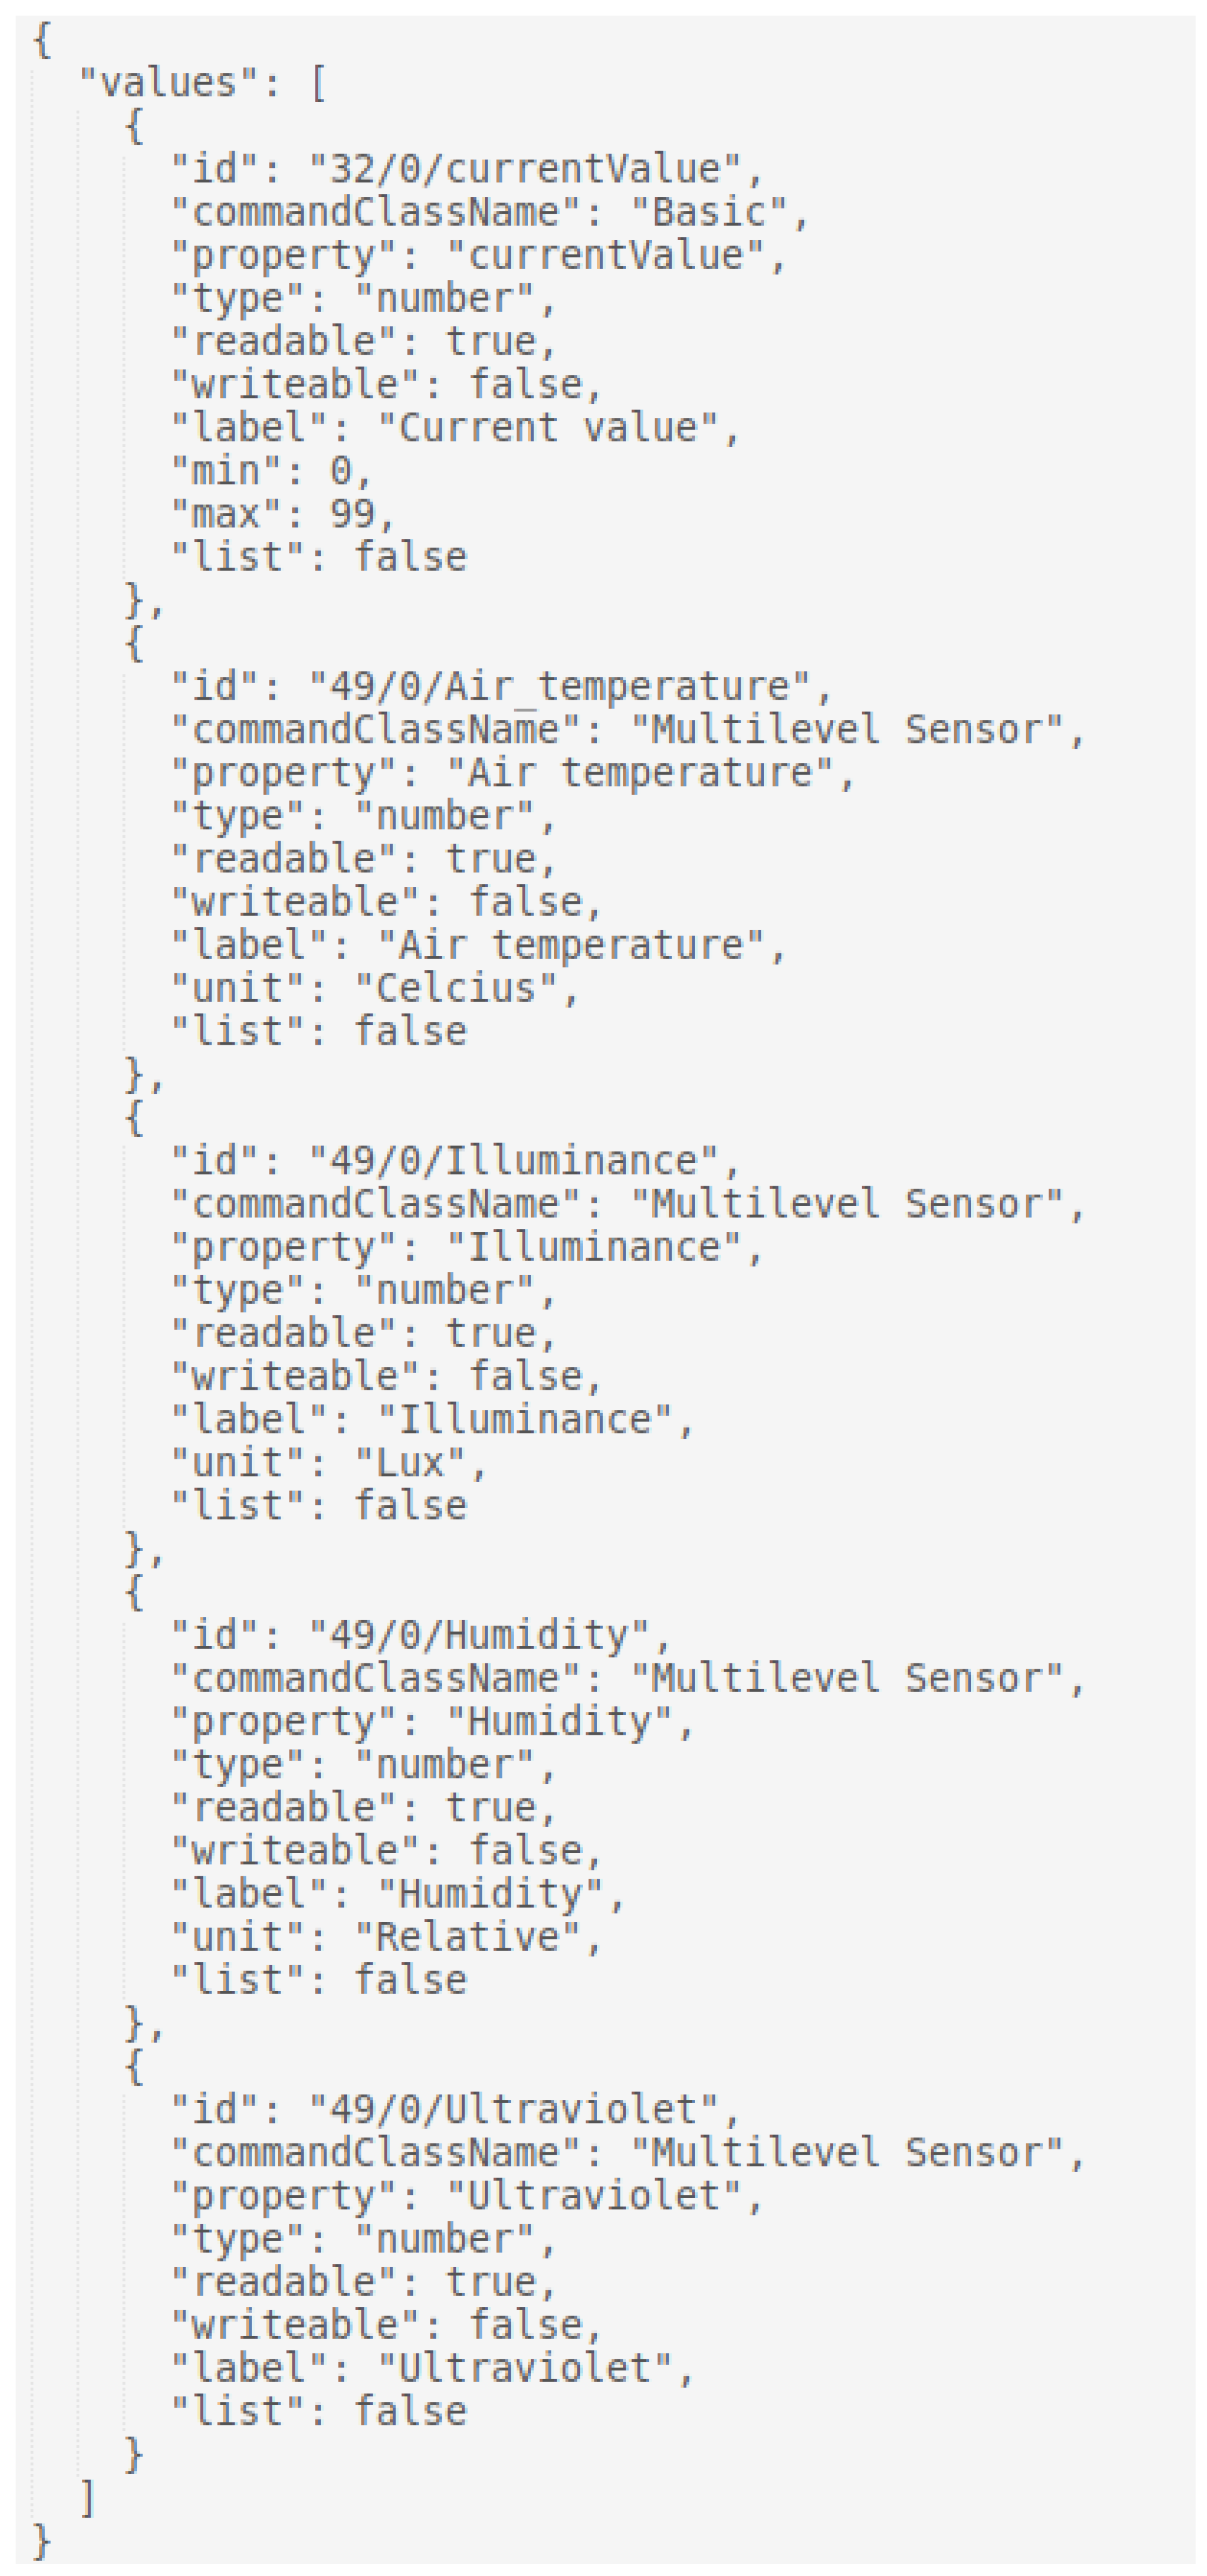
3.5.3. Data Management and Format

Various sensors in the system produce large amounts of data that need to be formatted and stored in order to facilitate their use by the applications that run on the edge device. The main component used to manage the data is the local MQTT broker, which is installed as a Linux service. The main advantage of MQTT in the scope of data management is that many different services in various programming languages can publish their data in the broker and it acts as an abstraction layer. All data-related services are language-agnostic as long as they publish and retrieve data from the broker. The topic, in which every bit of information is published, is predefined in order to facilitate the parallel development of applications that communicate back and forth. For example, Z-Wave sensors will post on the topic /zwave/nodeID/commandClass/endpoint/variableName. Specifically a Z-Wave smart plug with nodeID = 5 will publish the power variable in the topic /zwave/5/49/0/Power.
One of the installed services is responsible for the data handling. It uses an MQTT client, which subscribes to the topics, where all the system entities publish data, gathers all new data periodically, formats them to a predefined JSON structure and posts them to a dedicated database.

3.6. Application Layer

This layer consists of all applications, tools, and services that have been developed to manage the edge resources. Edge-to-edge resource management ensures smaller time latency, lower consumption, and the direct detection of potential malfunctions. This layer comprises basic and crucial processes to monitor the IoT network operation and status, the edge status, taking further actions, such as killing a process that is a waste of memory. Moreover, it alerts the user (or a software agent) to take further actions if needed, such as checking the Wi-Fi signal.
The IoT network is constantly monitored by two main applications, the “IoT monitoring” and the “error analysis” one. Those applications run in parallel and detect various and different problems. The “IoT monitoring” is an instant direct process that detects fatal errors by the real-time monitoring edge performance status (e.g., RAM and CPU usage). The “error analysis” is an indirect machine learning process that utilizes all available edge performance data and information (e.g., edge temperature and number of running processes) to detect potential errors. The overall procedure followed by the application layer is depicted in Figure 7.

3.6.1. Iot System Common Problems/Malfunctions and Healing Actions

Considering the integrated overall IoT system, problems may be detected on either the edge device (PC, Rpi, etc.) and/or the IoT entities (sensors, actuators, and devices). The detected problems or malfunctions may be categorized into two main types: those to which certain remote actions (RA) may be applied, and those that require a physical intervention (PI). Common IoT system problems/malfunctions [37,38] and respective error types are summarized in Table 3:

3.6.2. Iot Monitoring

The “IoT monitoring” application is used to monitor edge performance by exploiting certain built-in functions. Based on the most common errors (Section 3.6.1) and available functions, the operational status of the edge can be monitored non-stop 24/7, showcasing the edge performance. The procedures selected to monitor performance are as follows:
  • c p u _ t e m p e r a t u r e 
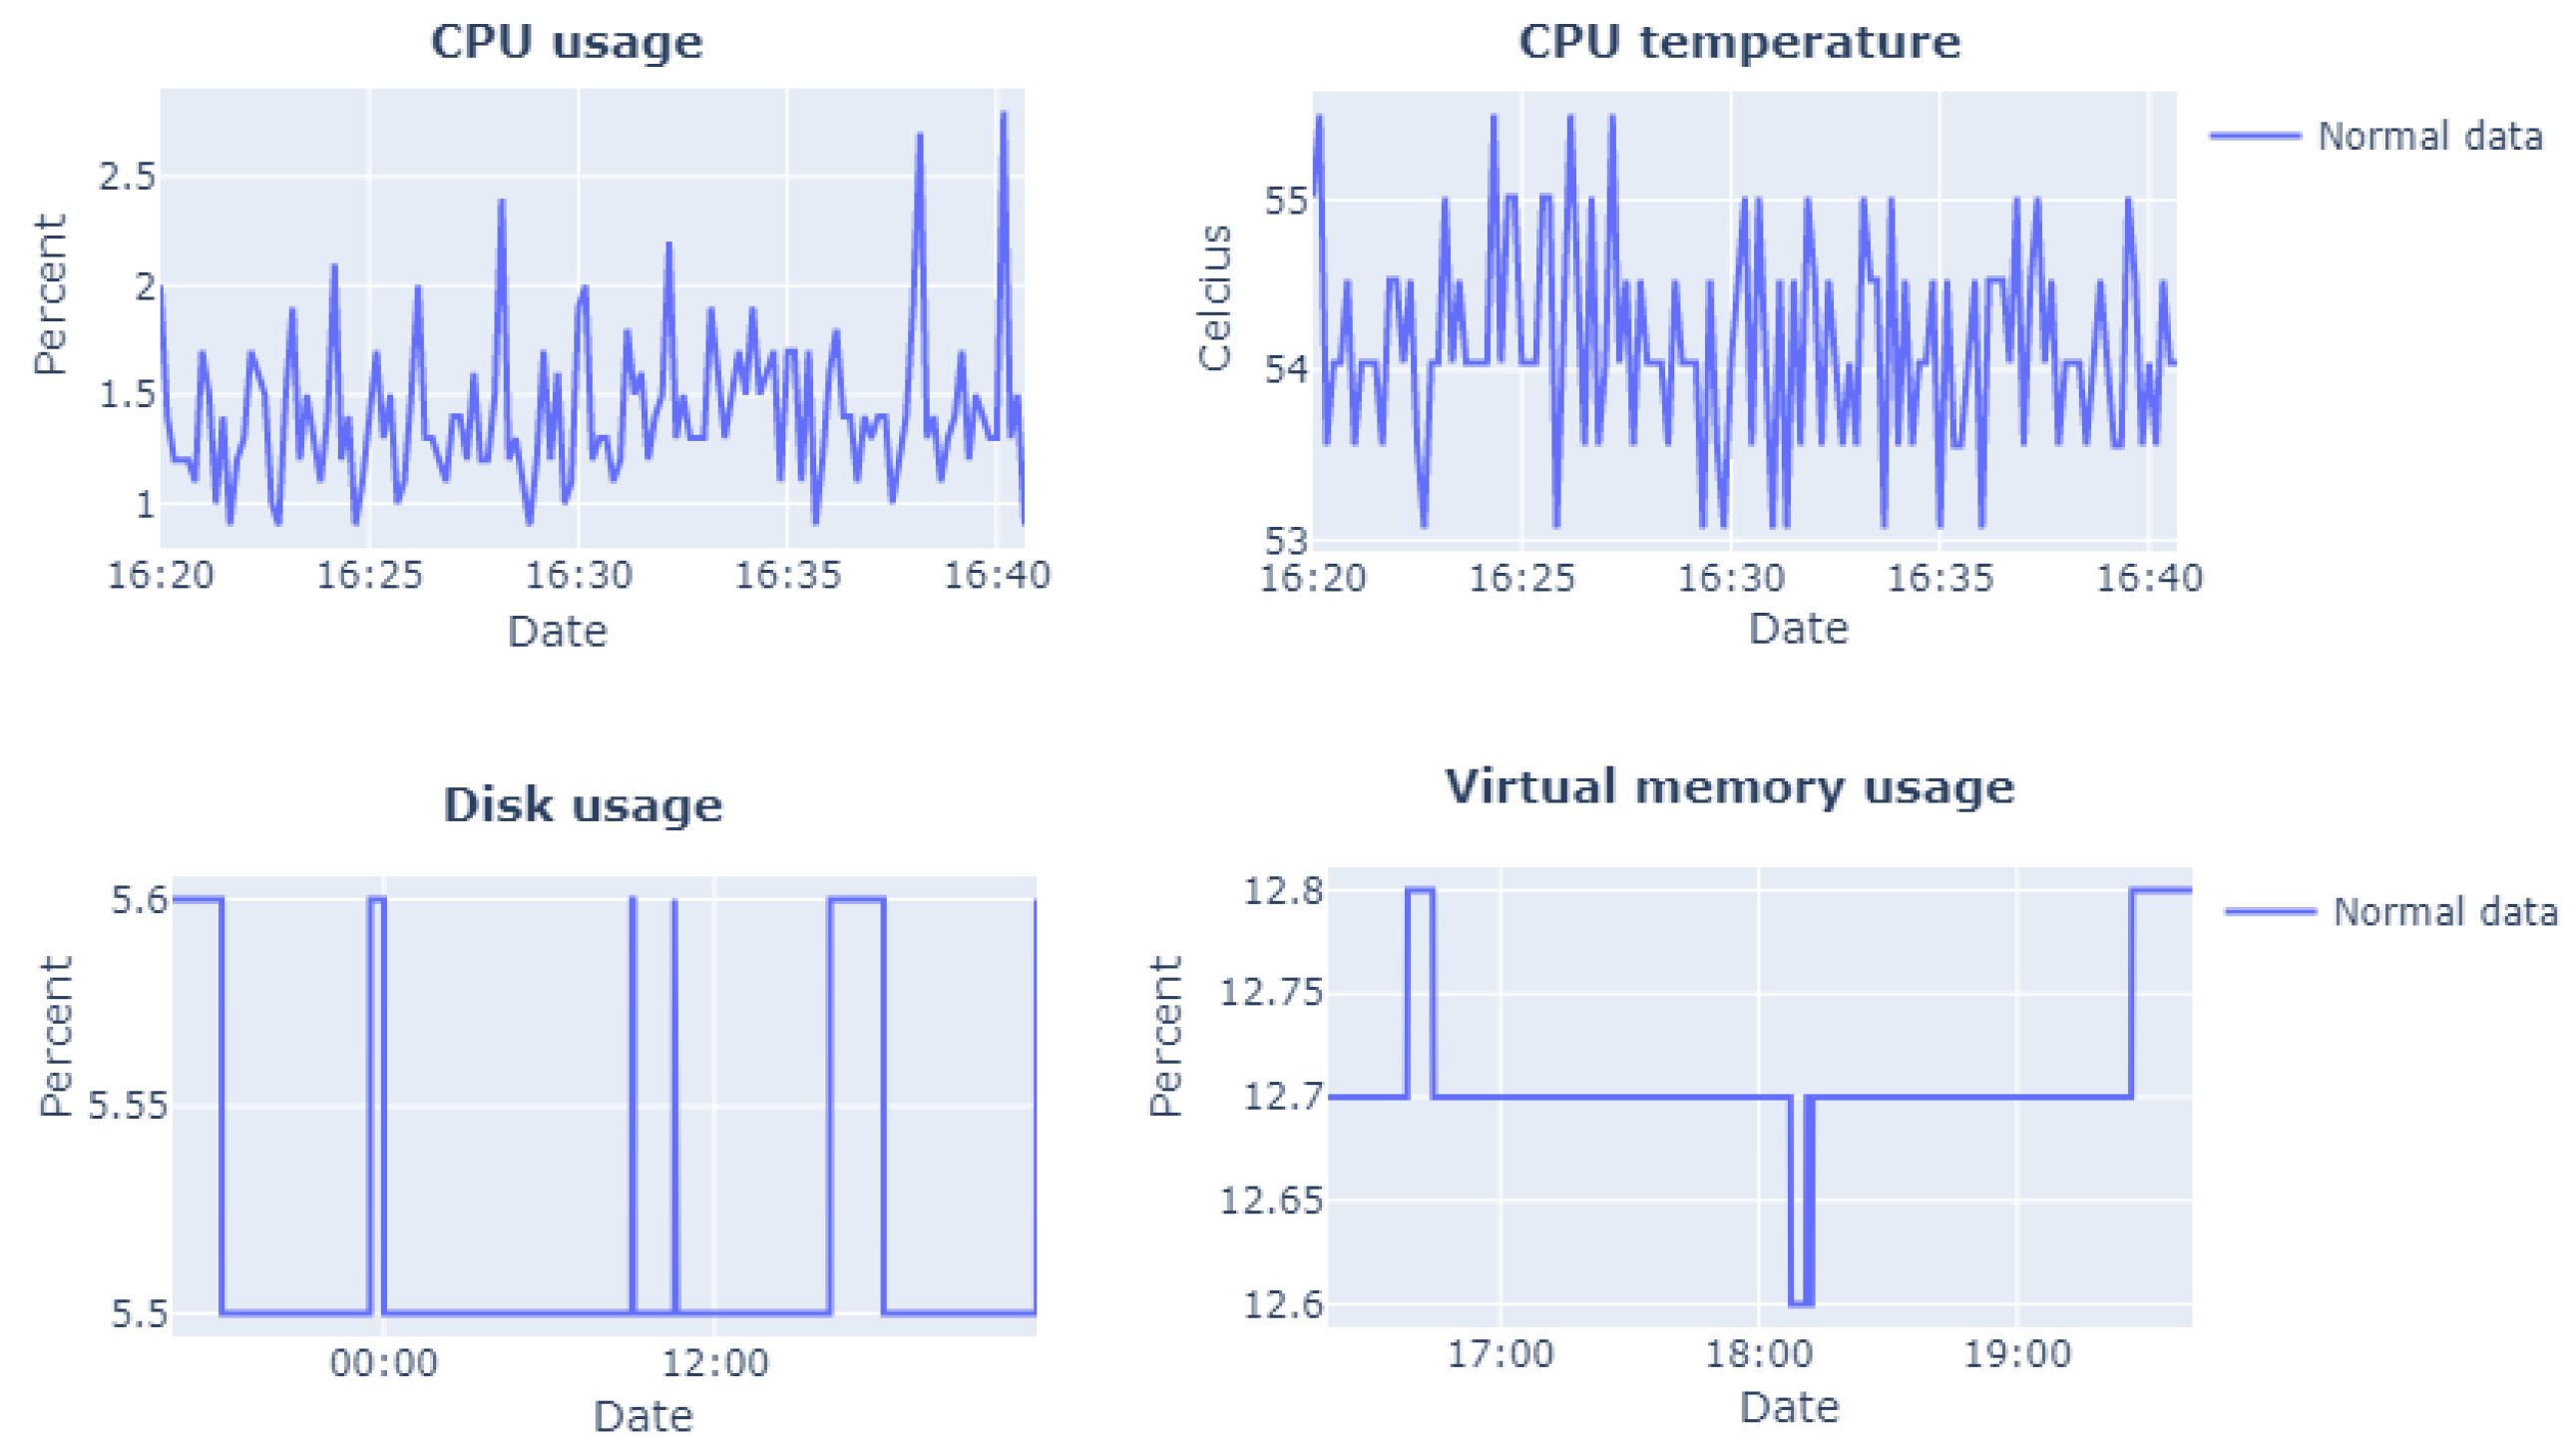
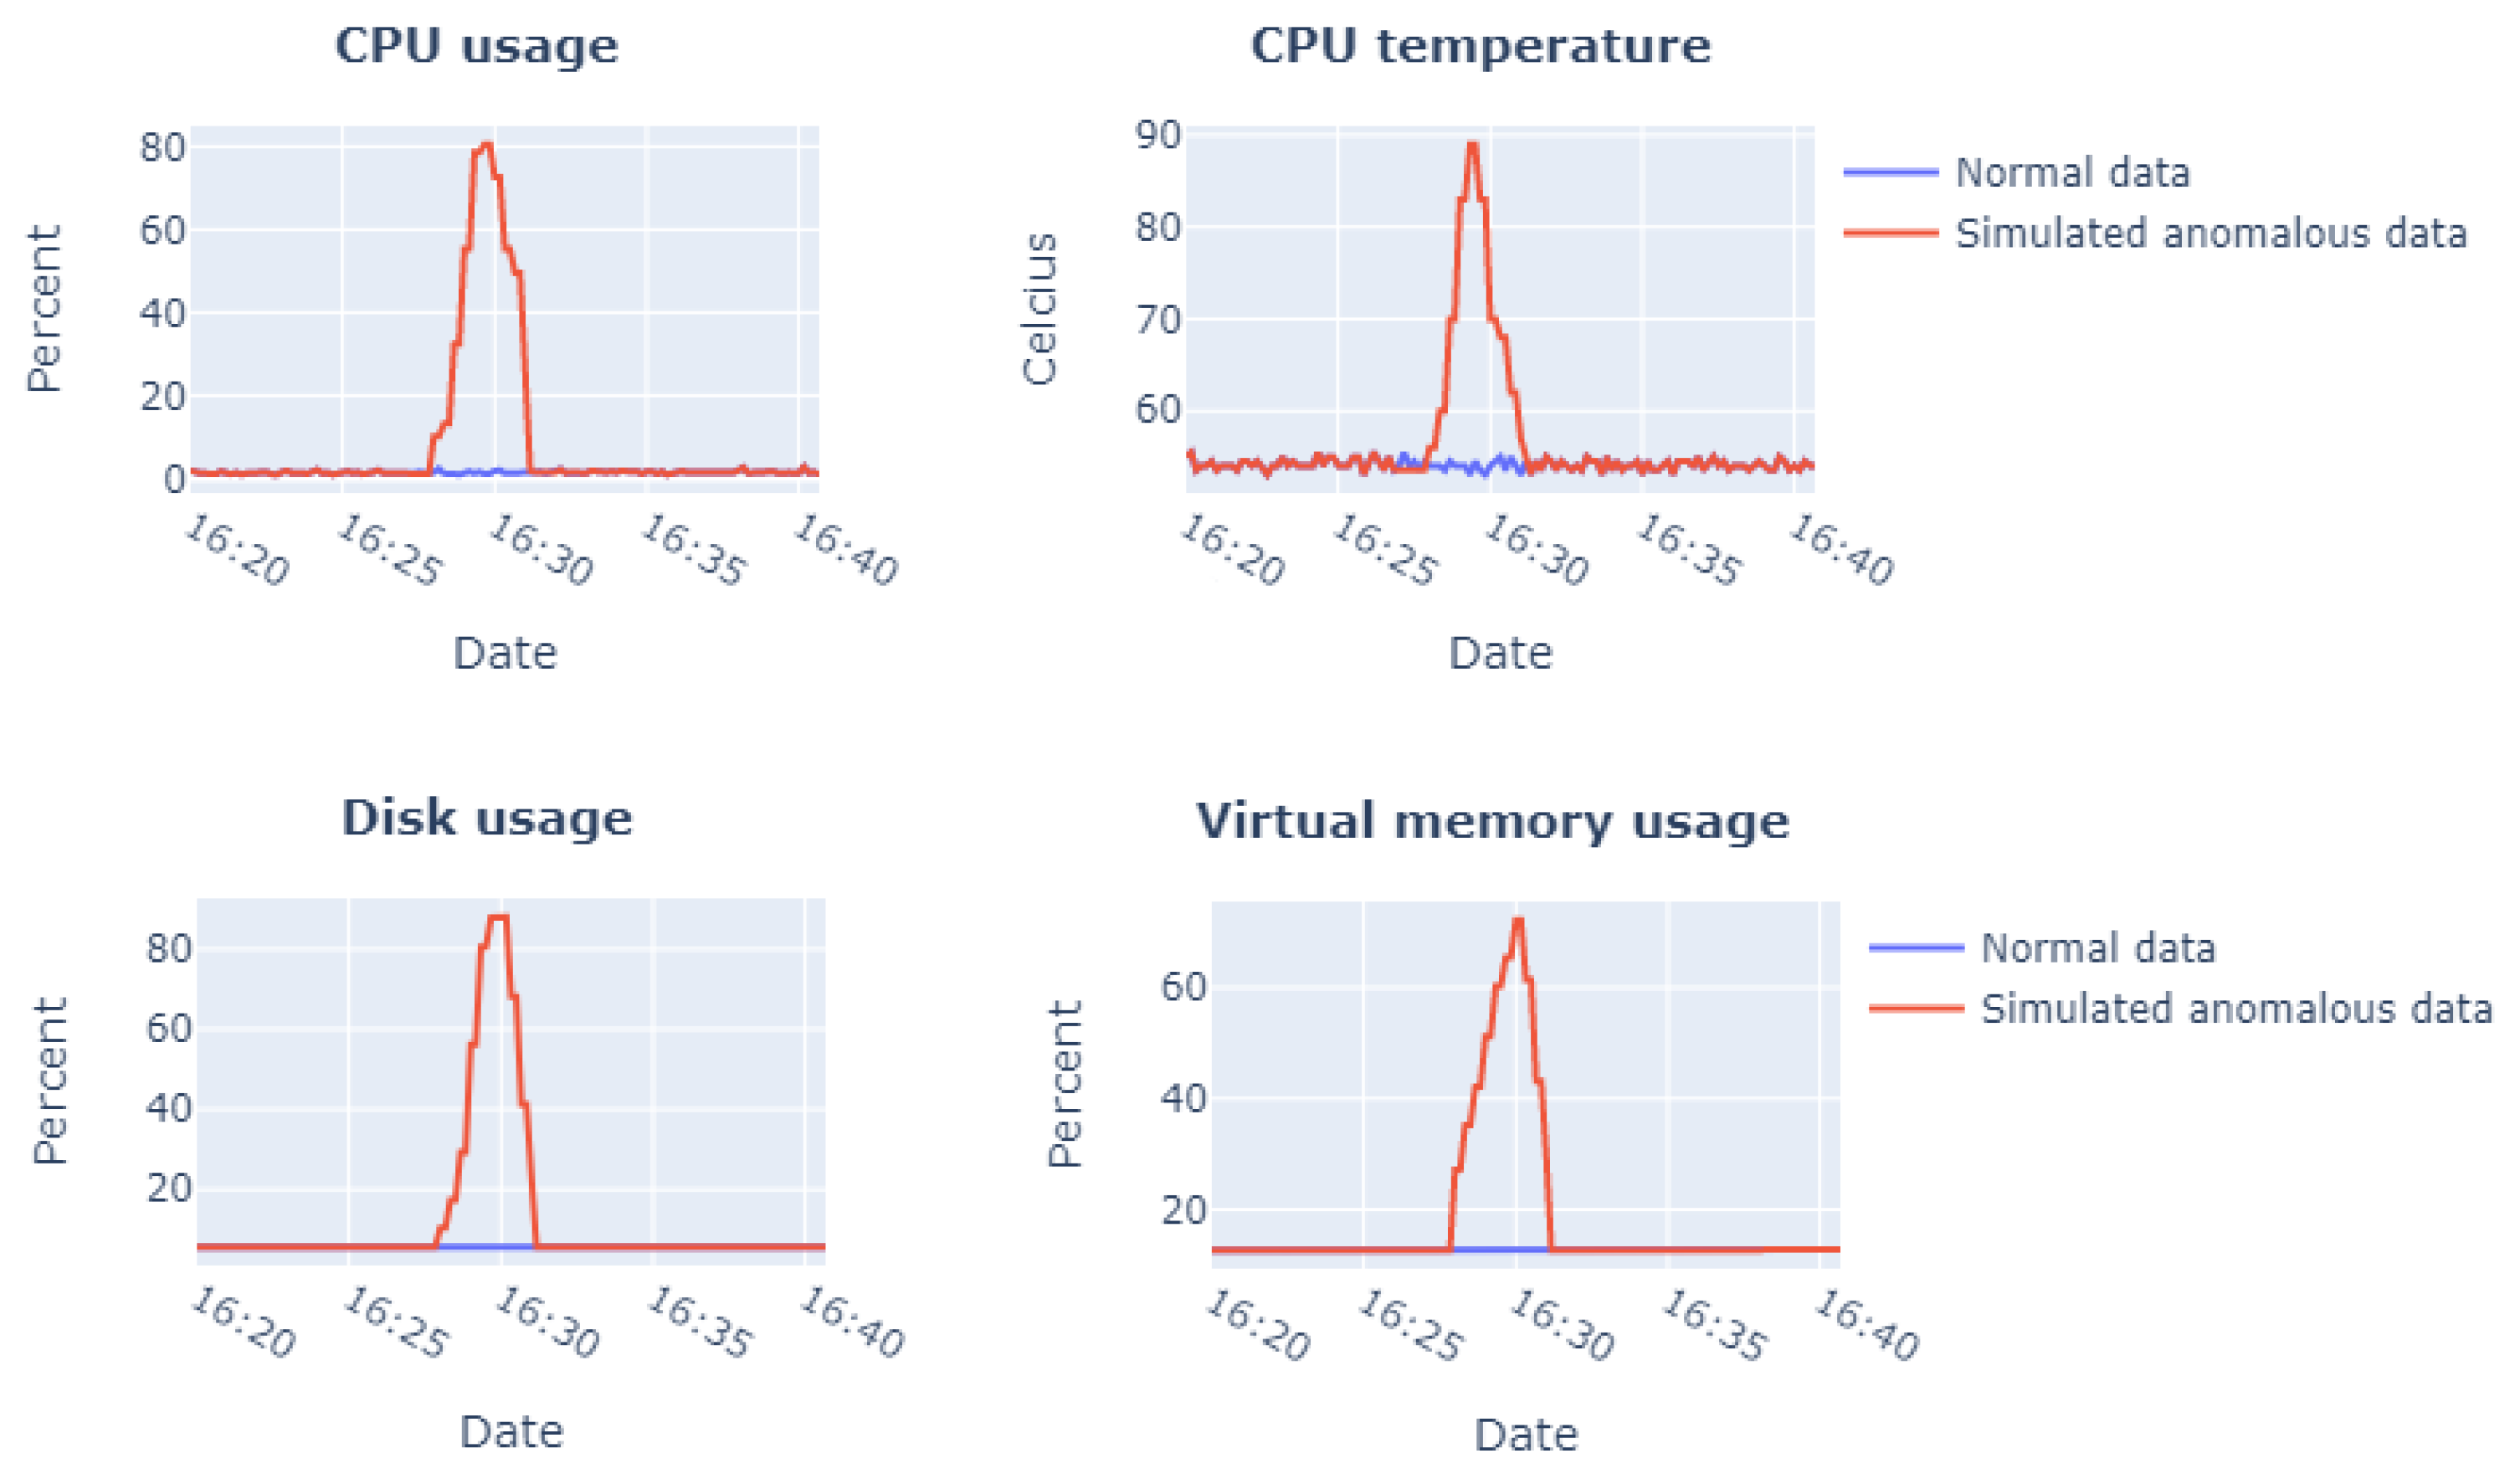
. The CPU temperature refers to the temperature of the core, which is considered a crucial aspect of the edge’s performance. An edge operating with an increased heat range will not only slow its performance, but will eventually cause the system to shut down. The CPU temperature is considered abnormal if it exceeds the normal levels for more than 2 min.
  • c p u _ u s a g e _ p e r c e n t . It refers to the percentage of CPU that is used by running processes, both system and user processes. Normally, the CPU generates about 30% of usage. The CPU usage is considered abnormal if it exceeds the normal levels by more than 10 min.
  • v i r t u a l _ m e m o r y _ u s a g e . Virtual memory utilizes software and hardware, enabling the edge to balance physical memory shortages, temporarily transferring data from (RAM) to disk storage. High virtual memory usage will eventually slow down edge performance.
  • d i s k _ u s a g e . It indicates how much the edge hard disk is utilizing to perform all processes. A high disk usage may cause serious problems (e.g., higher load times, stuttering, and low frame rate (FPS)) and even completely damage the hard-drive if it is constant.
  • n e t w o r k _ u s a g e . Monitors the network bandwidth and measures data usage in megabytes between time intervals. In edge devices with limited network usage plans, the measurement can help reduce the usage to prevent reaching the monthly plan limit.
  • n u m b e r _ o f _ p r o c e s s e s . It refers to all the processes that utilize the resource CPU (i.e., into the “RUNNING” scv tate). This procedure is mainly an insight of the resource CPU utilization.
For all the above procedures, values within the predefined levels are considered normal, while values outside this range are considered fatal errors. The selected procedures to monitor the performance are summarized in Table 4. The IoT monitoring automatically performs all the actions (Section 3.6.4) when the monitored procedures exceed normal levels.

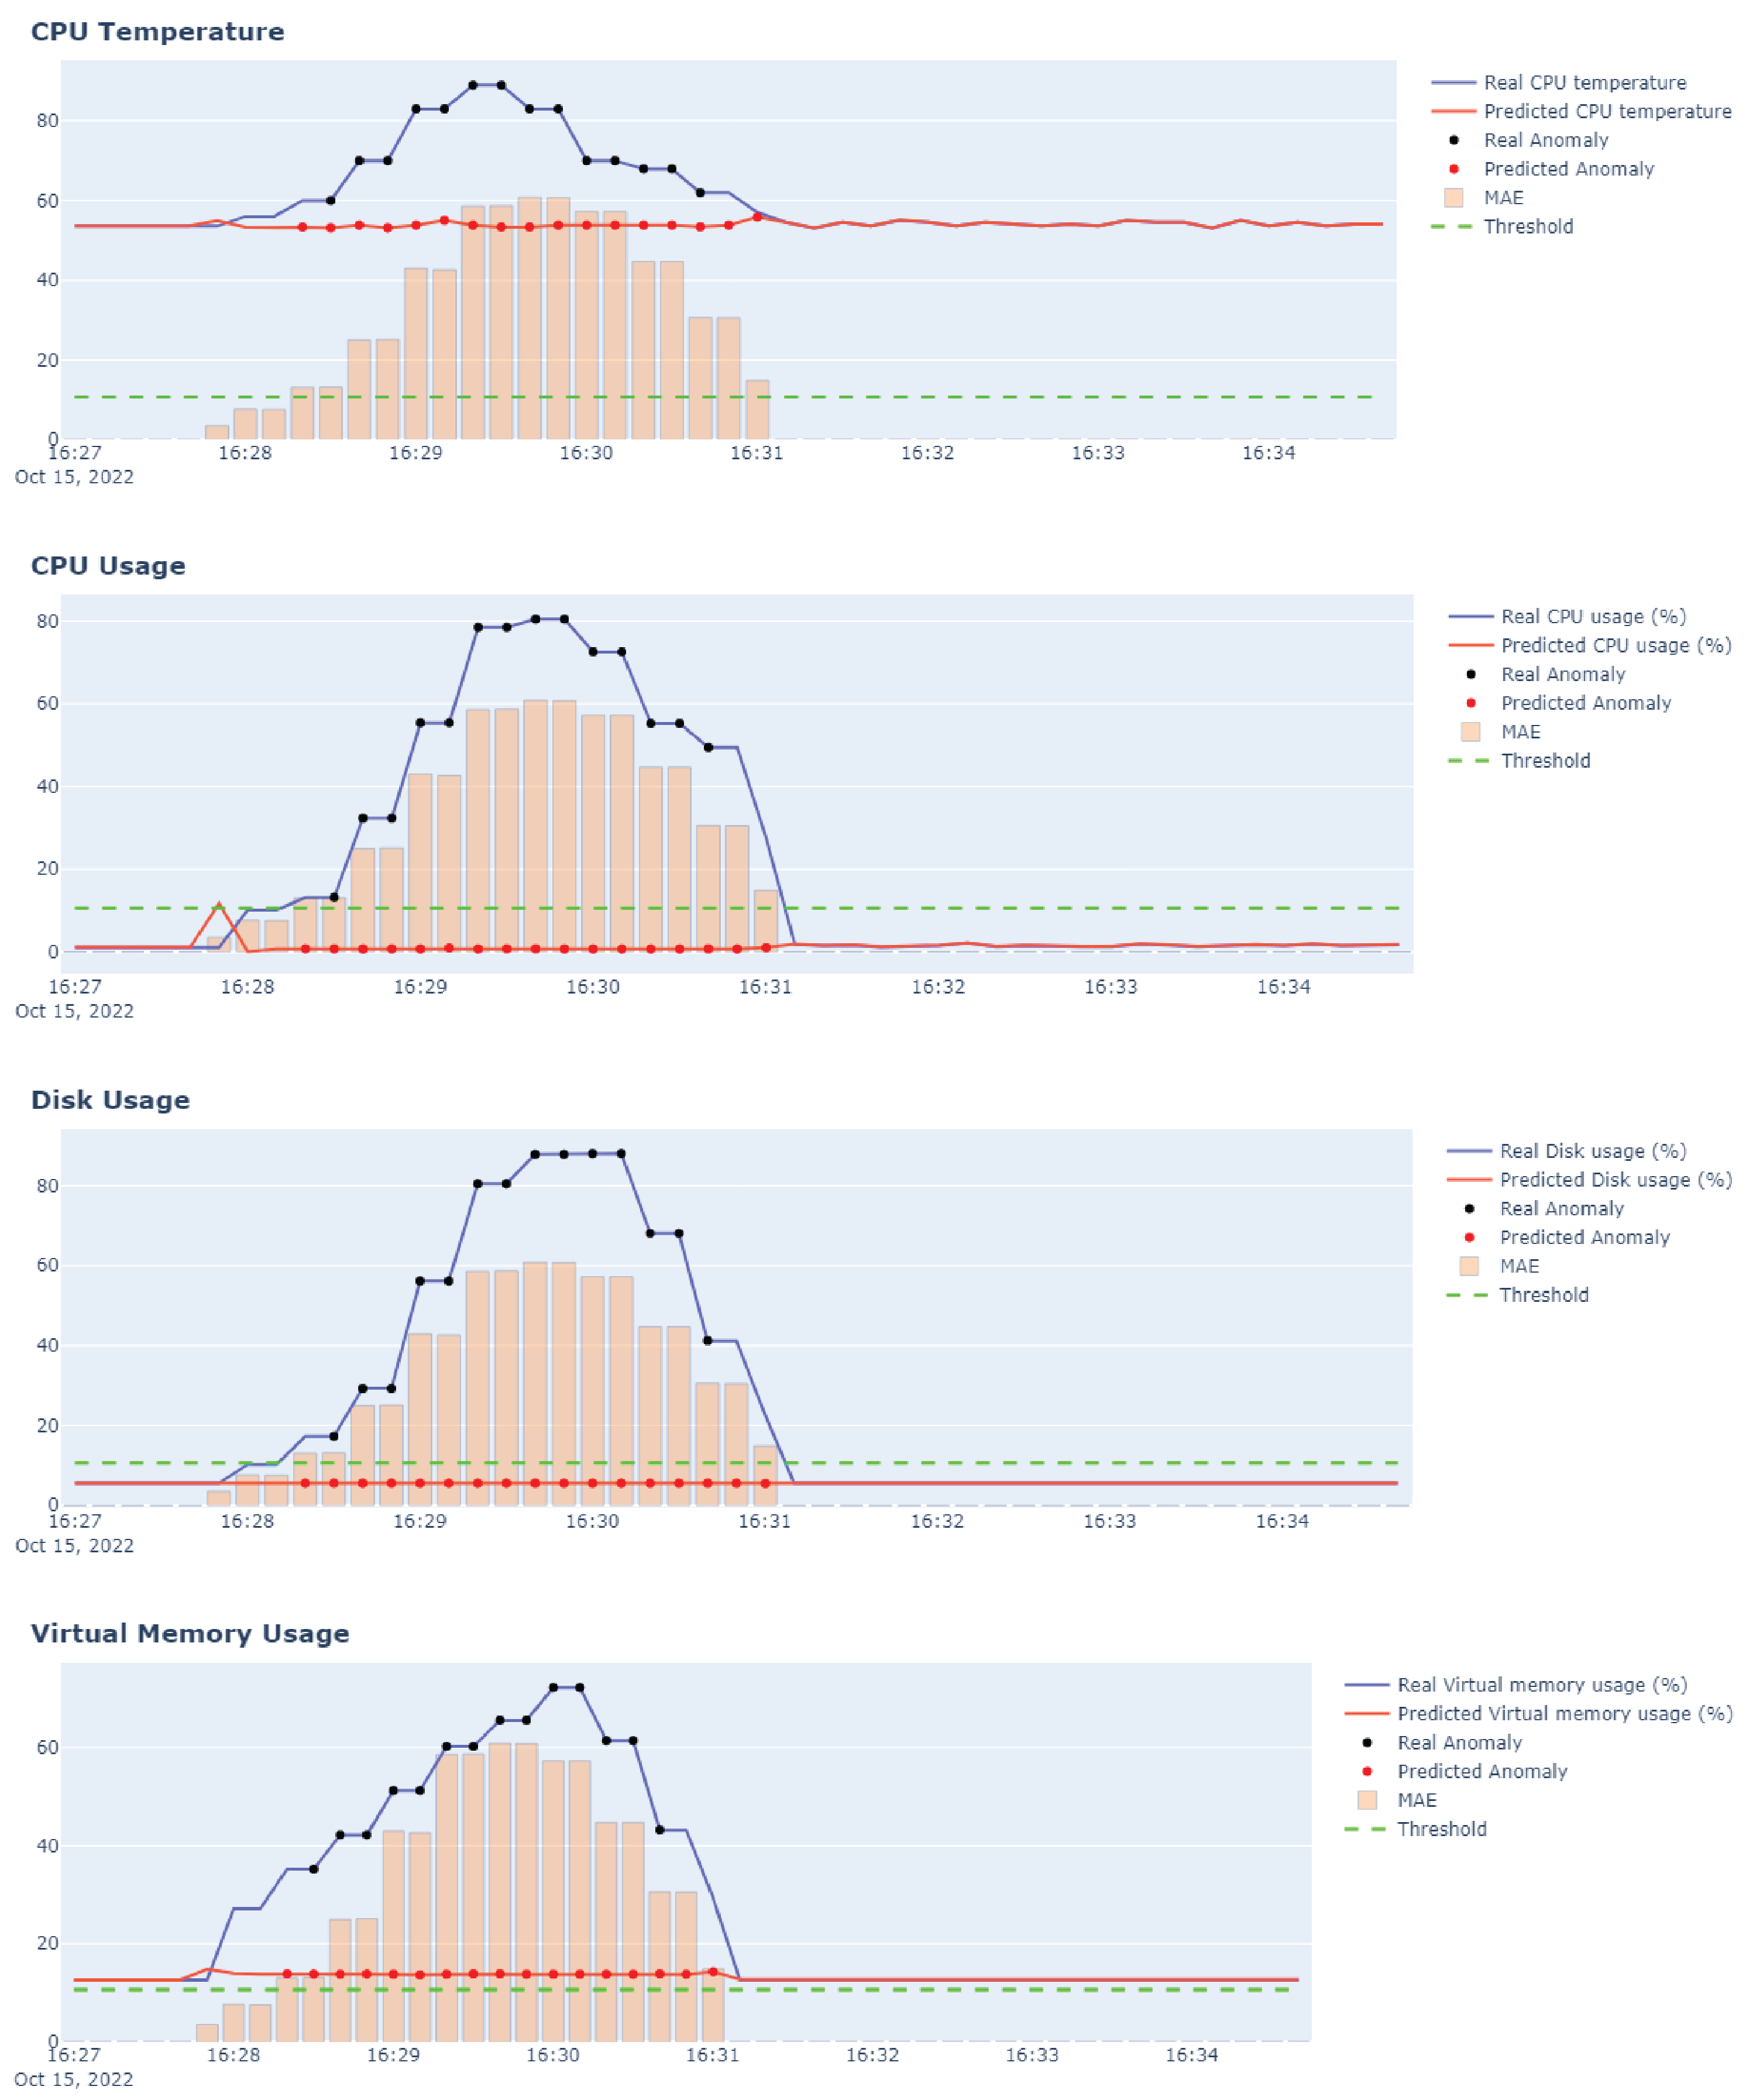
3.6.3. Error Analysis

In this sub-section, a review of the long short-term memory networks (LSTM) and the autoencoder network are presented. Additionally, the proposed algorithm developed for anomaly detection is illustrated.
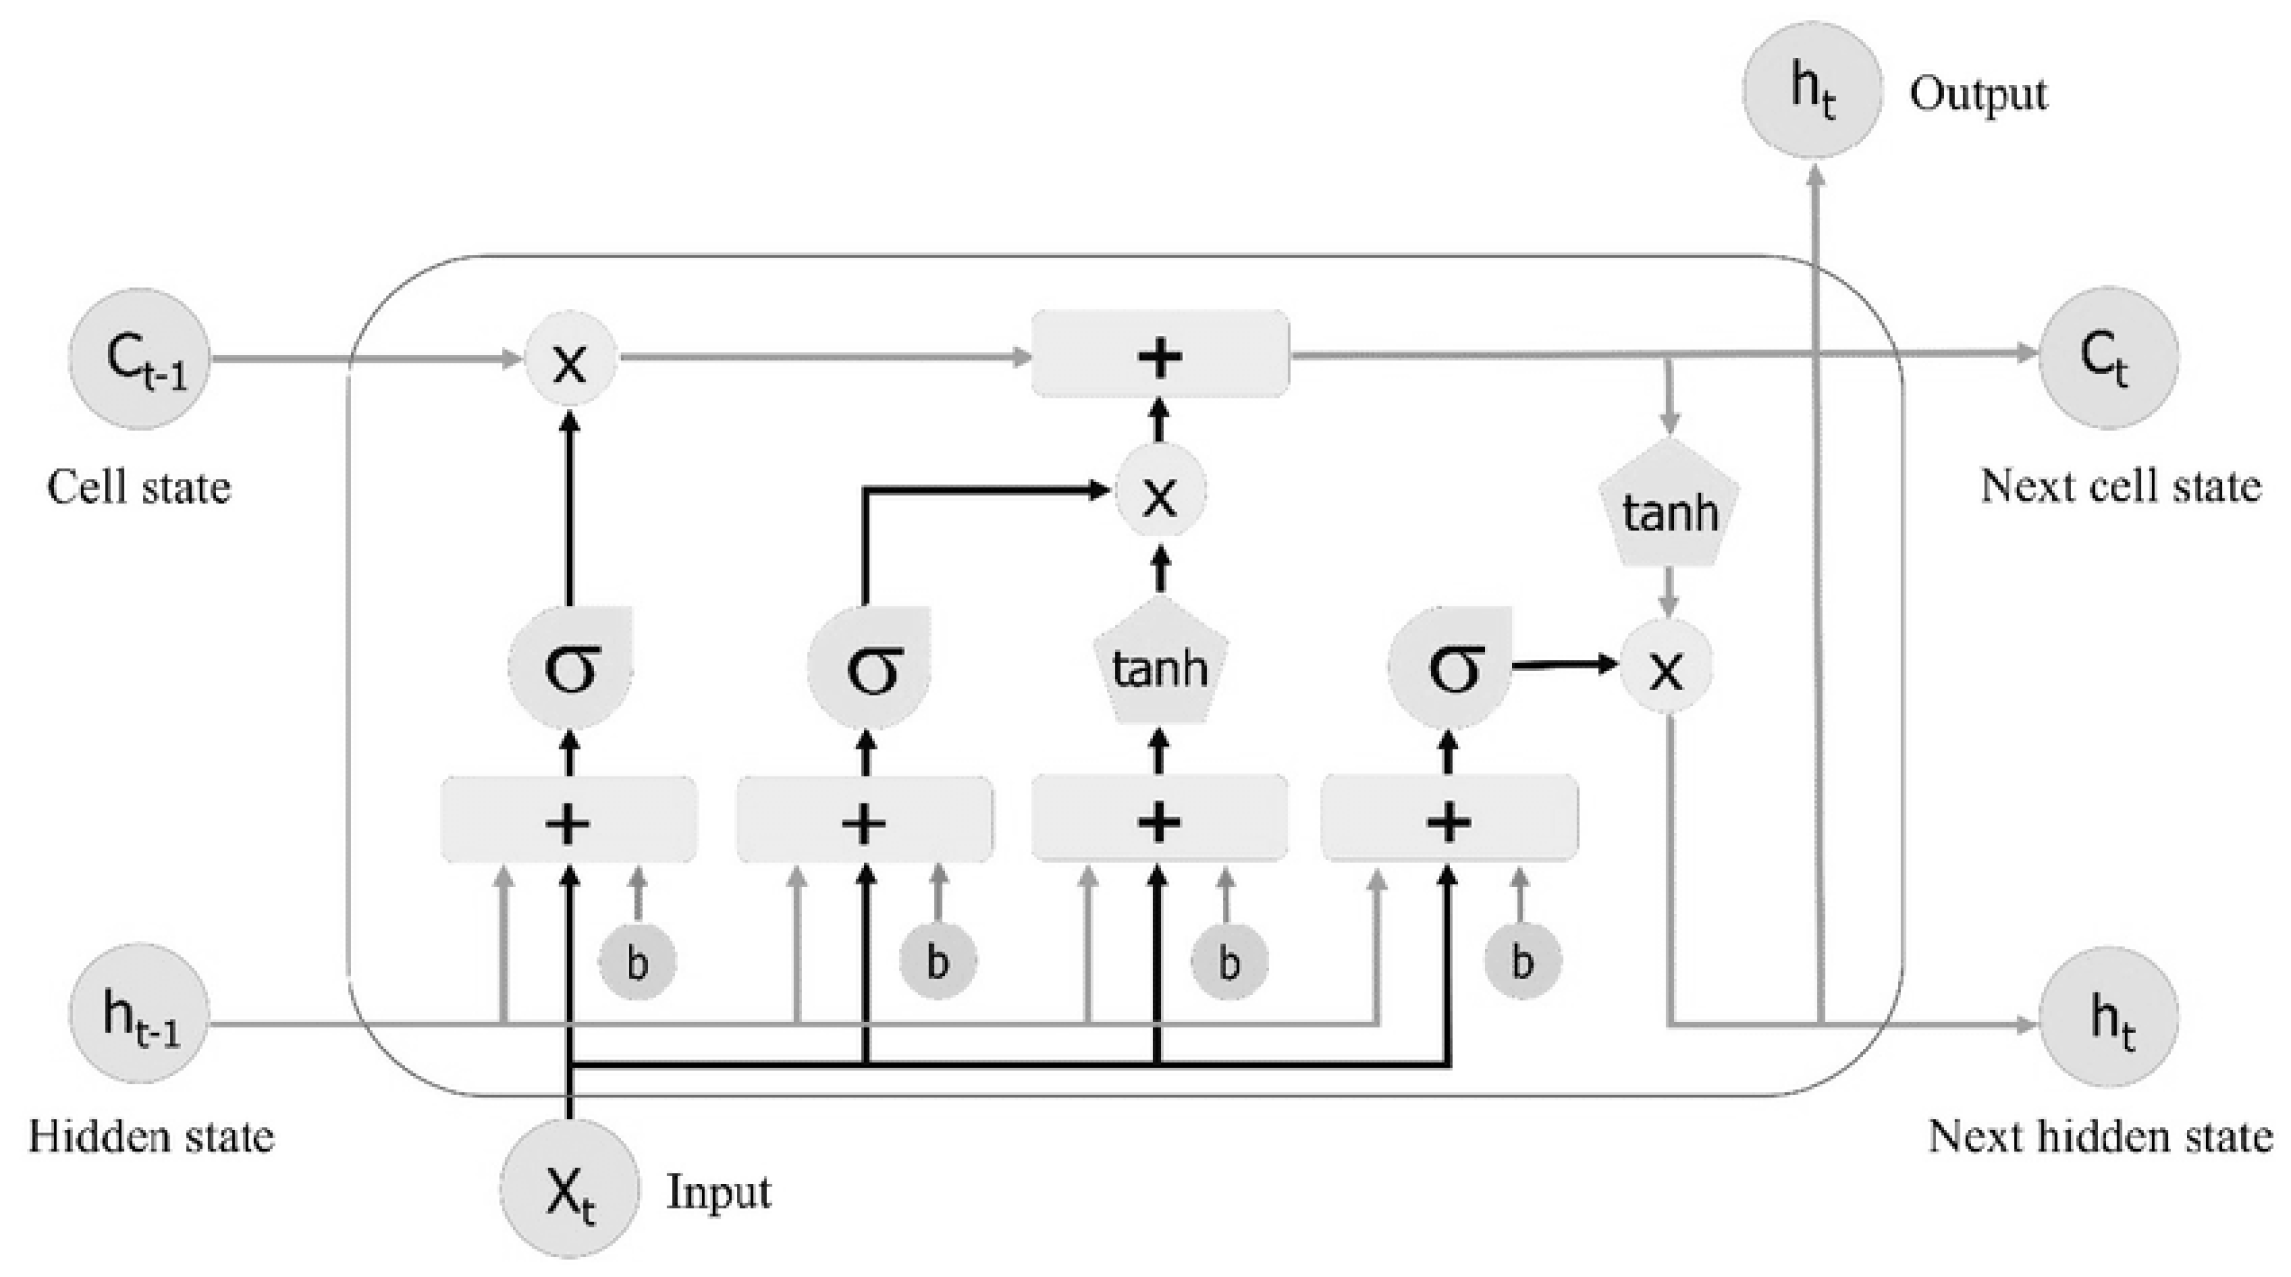
  • Long short-term memory networks (LSTM)
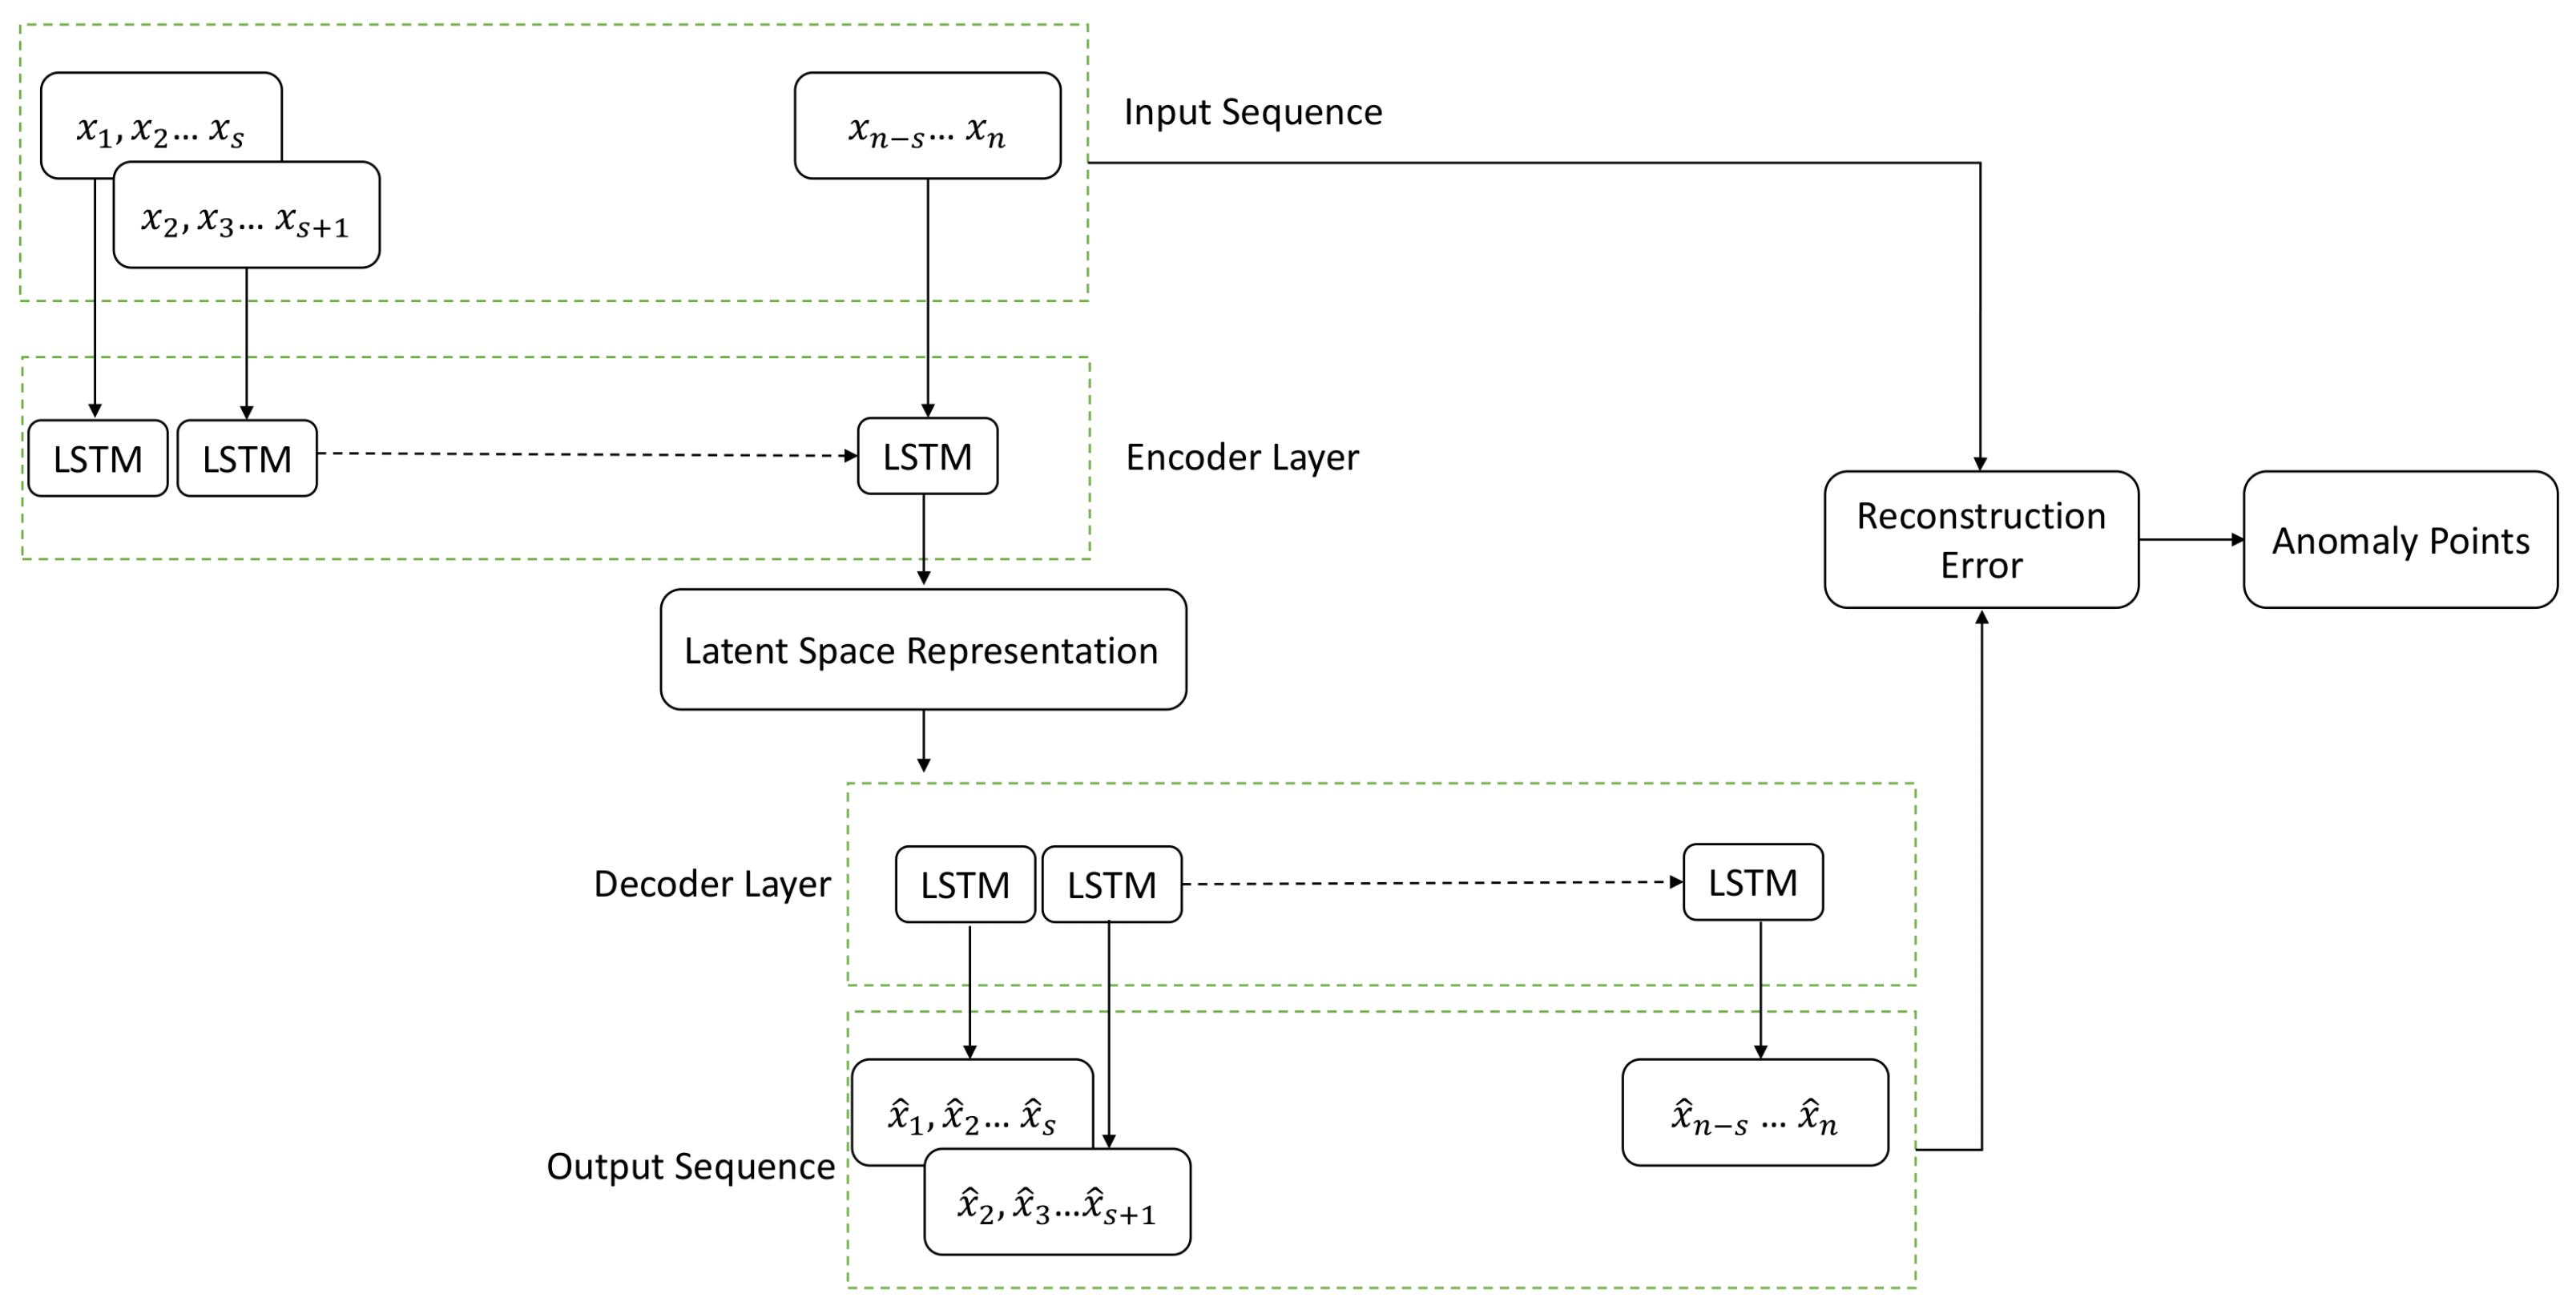
LSTM is a type of recurrent neural network (RNN) which is capable of handling long memory problems. It takes the shape of a series of repeated modules of neural networks, with three control gates in each module: memory cells, memory blocks, and gate units [39]. The different modules of an LSTM are illustrated in Figure 8. LSTM has better long-term information memory than RNN, can learn long-term dependence information, and does not contain the vanishing gradient problem that plagues traditional RNN networks [40].
Like RNN, LSTM reads a series of input vectors x = { x 1 , x 2 , , x t , } , where x t R m represents an m-dimensional vector of readings for m variables at time instance t. The first step of an LSTM module is to decide what information will be discarded from the cell state by generating a number within [0, 1]. The procedure is described by the following formula [41]:
f t = σ 1 ( W f [ h t 1 , x t ] + b f ) ,
where σ 1 represents the sigmoid function, W f is the weight matrices, b f the bias of the forget gate and h t 1 is the output in state t.
The next step of an LSTM is to decide which information is going to be stored in the cell state. The process is split into two parts. The first part includes a sigmoid layer called the “input gate layer”, i t , which decides which values are to be updated. The second includes a tanh layer, which is used to create a vector of new candidate values, C ˜ t , that could be added to the state. The two parts are combined to create an update to the state. The process is described by formulas [41]
i t = σ 2 ( W i [ h t 1 , x t ] + b i ) ,
C ˜ t = t a h n ( W c [ h t 1 , x t ] + b c )
and
C t = f t C t 1 + i t C ˜ t ,
where W i , b i and W c , b c are the weight matrices and the biases of the input gate and the state of the memory cell, respectively. Finally, the output gate is defined [41]:
o t = σ 3 ( W o [ h t 1 , x t ] + b o ) ,
h t = o t t a h n ( C t ) ,
where W o and b o are the weight matrix and the bias of the output gate.
  • Autoencoder Network
Autoencoder is a neural network that aims to learn a compressed representation from input data. It is an unsupervised method, although it is trained using supervised learning methods, referred to as self-supervised. It consists of input and output layers, encoder and decoder neural networks, and a latent space [42]. The encoder network receives data from the input layer and compresses them into the latent space, whereas the decoder network decompresses them and transmits them to the output layer.
The main objective of the autoencoder is to reduce the data dimensions of inputs while maintaining the main information of the data structure. Specifically, using as input x R m , the encoder compresses x to an encoded representation of z = e ( x ) R n . The decoder reconstructs this representation into an output x ^ = d ( z ) R m . Additionally, the autoencoder is trained by minimizing the reconstruction error as described in the following equation [42]:
L = 1 2 x x x ^ 2 .
There are several different types of autoencoders that have been proposed in the literature, including the LSTM autoencoder, convolutional autoencoder, and vanilla autoencoder. The LSTM autoencoder consists of LSTM modules in both the encoder and decoder modules. LSTMs are well-suited for time series forecasting or anomaly detection due to their ability to learn patterns in data over long sequences [43]. Generally, as mentioned in [44], an encoder–decoder model in anomaly detection applications learns the representation of the data using only the normal sequences and then uses the trained model to reconstruct them. When the model is fed with an abnormal sequence, it might not be reconstructed well, leading to a high error. Several studies [45,46] have demonstrated the use of the LSTM autoencoder for anomaly detection in time series data.
  • Anomaly Detection Method
Figure 9 presents the method implemented for anomaly detection application. It consists of two LSTM nodes for the encoder and two for the decoder (AE-LSTM). The training phase of the method includes data with normal points which are scaled using the standardization method. On the other hand, the test phase includes data with normal and anomaly points. Ten days from twelve different Rpi devices were used for the training, with measurements every 10 s. The used dataset for the training and test procedures had the form of (samples × time steps × variables).
The input data are split into smaller parts using a sliding window algorithm, and each part is fed to the encoder layer. For the sliding window, the number 3 was selected as the optimal value. The encoder of the proposed method includes two LSTM nodes with 256 and 64 neurons, respectively. The output from the encoder is passed through the latent space representation, which is operated as a dimension reduction method. Additionally, two LSTM nodes were used for the decoder layer with 64 and 256 neurons, respectively. The ReLU activation function was used for both the encoder and decoder layers [47]. Finally, the reconstructed output is available from the decoder layer.
The proposed method was trained using the Adam optimizer for 200 epochs with learning rate 1 e 2 . Subsequently, the dropout regularization with a value of 0.2 was applied after the output of the encoder and the decoder to improve its accuracy and to avoid over-fitting.
The detection process is held in the final step, and it includes the calculation of the error between the actual and predicted time series as well as a threshold value, which is used to classify the data as normal or anomaly points. The error is calculated using the mean absolute error (MAE), the predicted value x ^ , and the true one x [42]:
M A E = i = 1 D | x x ^ | .
Finally, based on the three-sigma statistic rule, a threshold value was selected to determine whether the prediction errors represent anomalies of the system [48]:
T h r e s h o l d _ v a l u e = m e a n ( s q u a r e d _ e r r o r ) + 3 s t d ( s q u a r e d _ e r r o r )
  • Evaluation Metrics
In order to evaluate the performance of the anomaly detection method, the measures of precision, accuracy, recall, and f-score were used. The precision and recall of a classifier are combined into one metric called the F-score. Sensitivity is a metric that measures the ability of the model to predict the true positives of each class.
The formulas of the previous metrics are displayed in the equations below. TP (true positive) implies that an anomaly is detected and that the anomaly exists in the actual time series, FP (false positive) means that anomalies are detected when there is no anomaly in the actual time series, and FN (false negatives) means that no anomalies are detected, although anomalies exist in the actual time series:
a c c u r a c y = T P + T N T P + T N + F P + F N
p r e c i s i o n = T P T P + F P
r e c a l l = T P T P + F N
f s c o r e = 2 p r e c i s i o n r e c a l l p r e c i s i o n + r e c a l l

3.6.4. Iot Actions

Based on the error and the type (Section 3.6.1), certain healing actions are concerned. For all the PI errors, corresponding messages are sent to the end-users to inform them for the reported problem while urging them to take further steps. On the other hand, for all the RA errors, remote actions are immediately applied to update and heal the IoT network status. Moreover, it was foreseen to take periodic actions (PeriodicNo) even when an error was not reported or detected to prevent system brake-downs. All actions are summarized in Table 5.

3.6.5. User Alerts

If the reported error is PI, the selected messages are sent to the user. The suggested actions are summarized in Table 6. The most feasible way to alert a user is by sending messages using a process to push automatic mails to the end-user with a certain context. Otherwise, pop-up alerts may be pushed to the end-users’ mobile phone.

3.7. Semantics Layer and Data Center

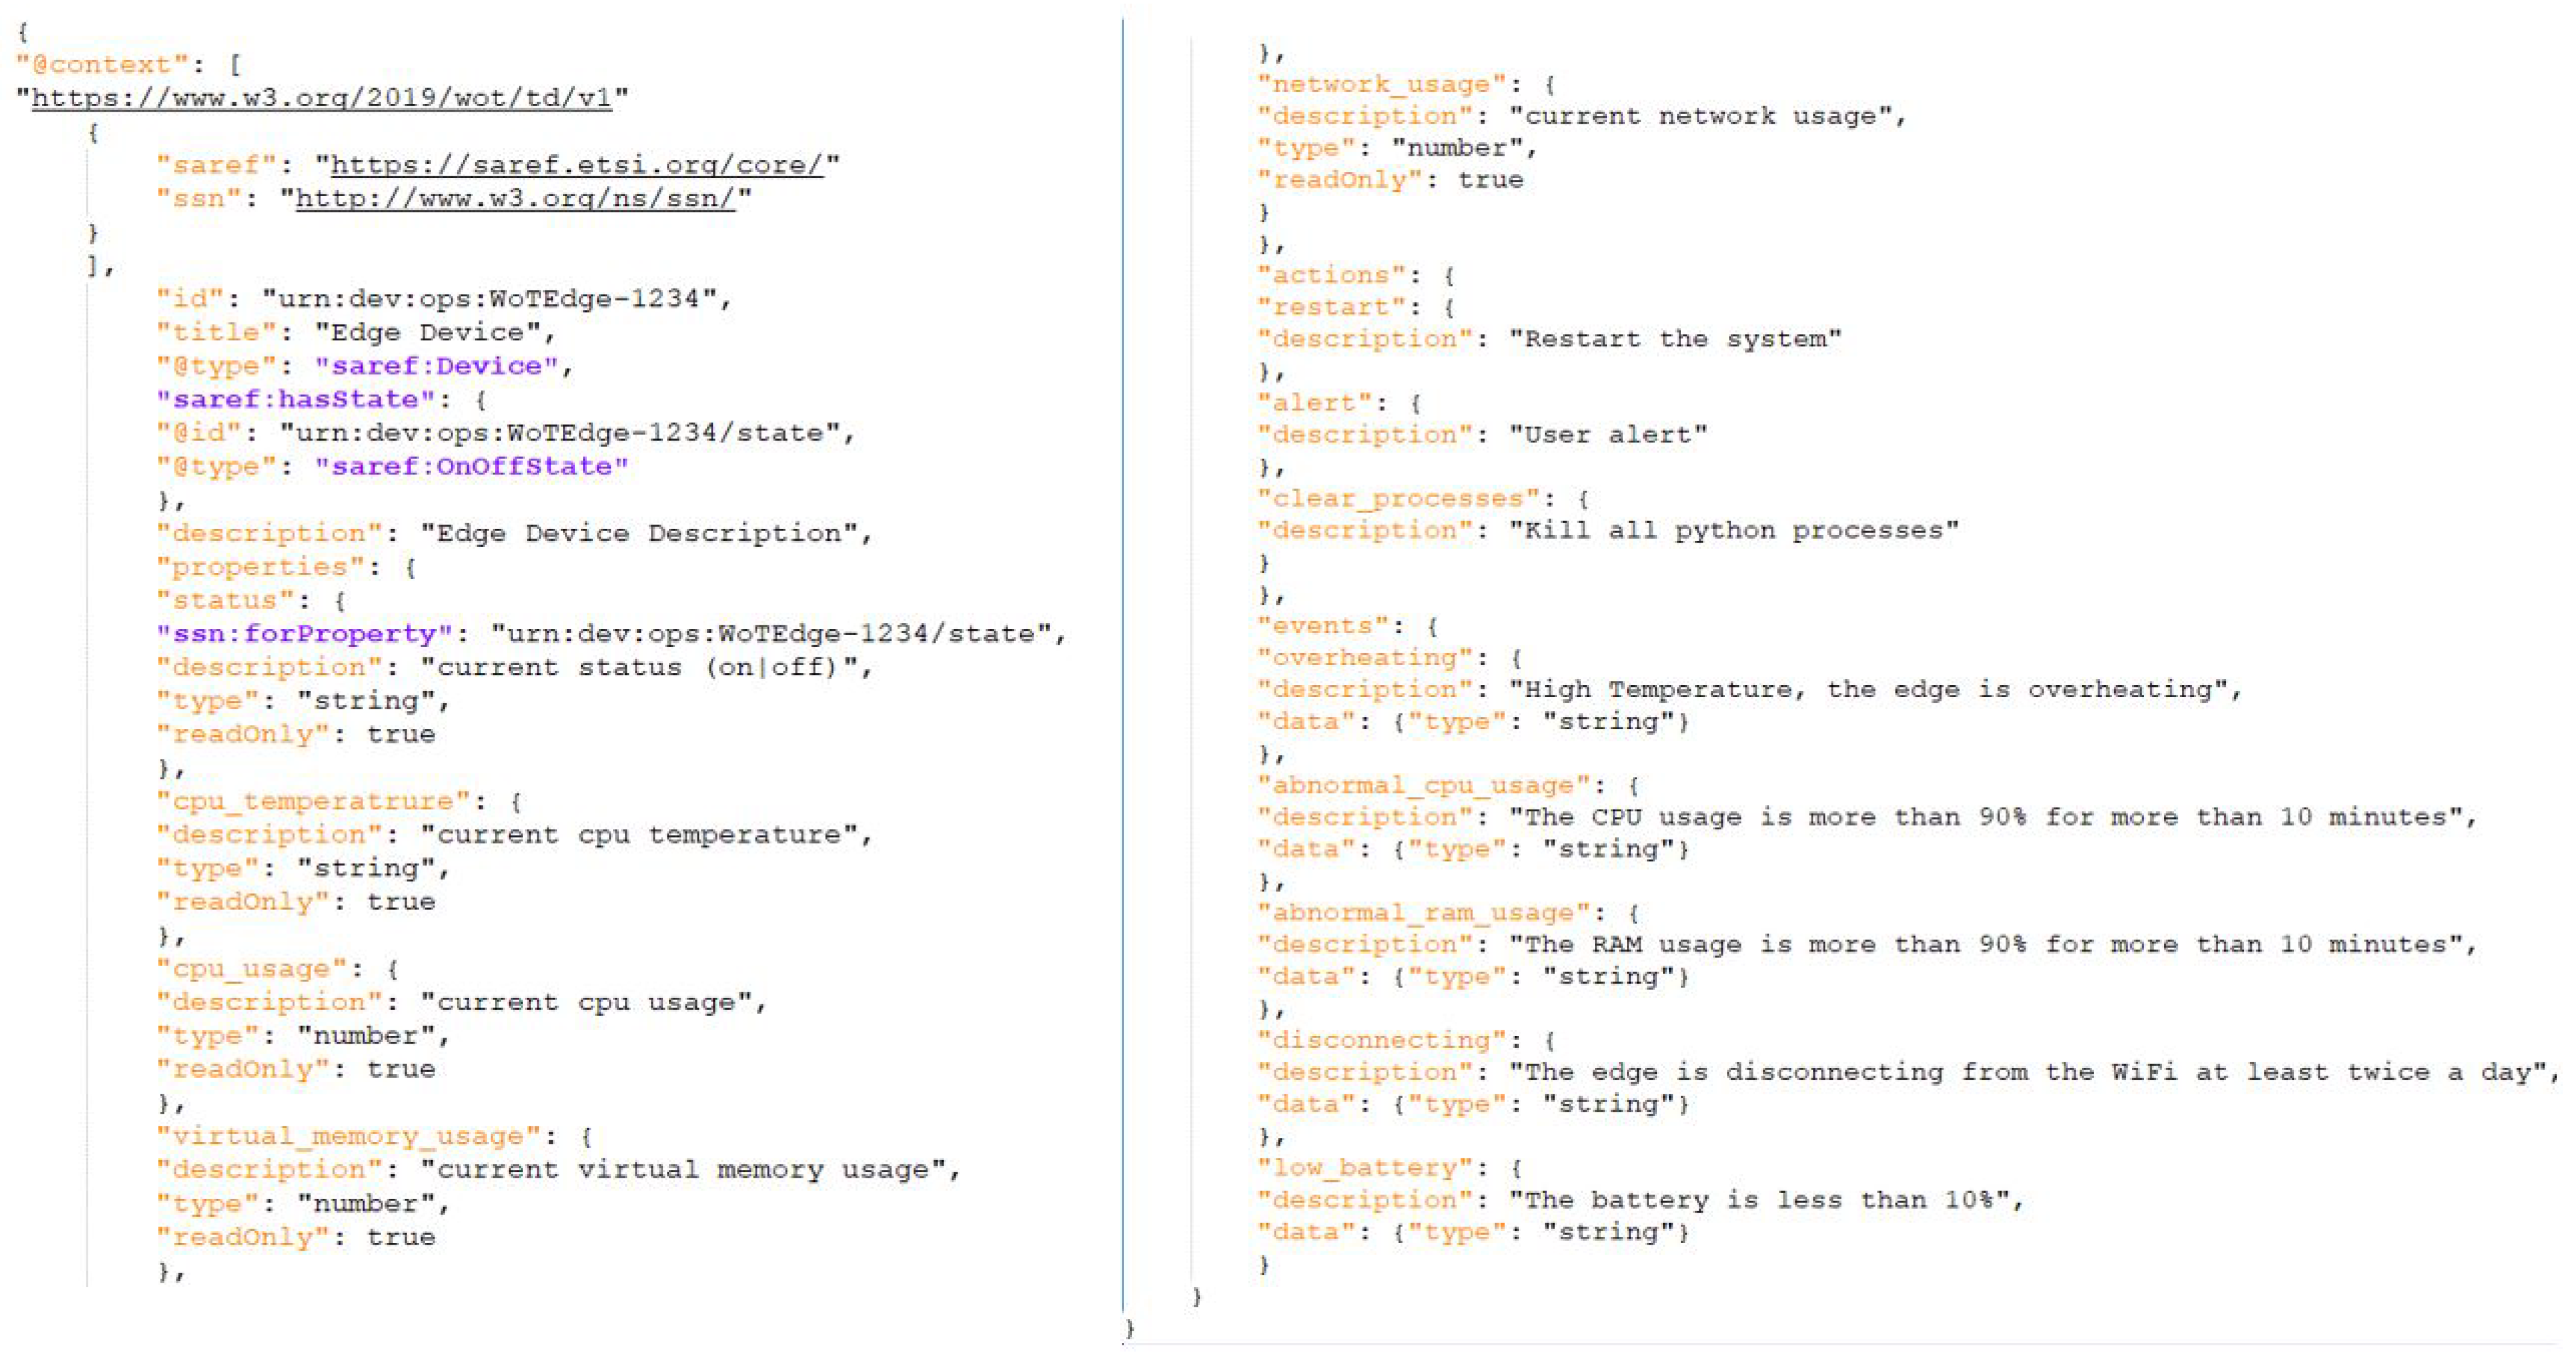
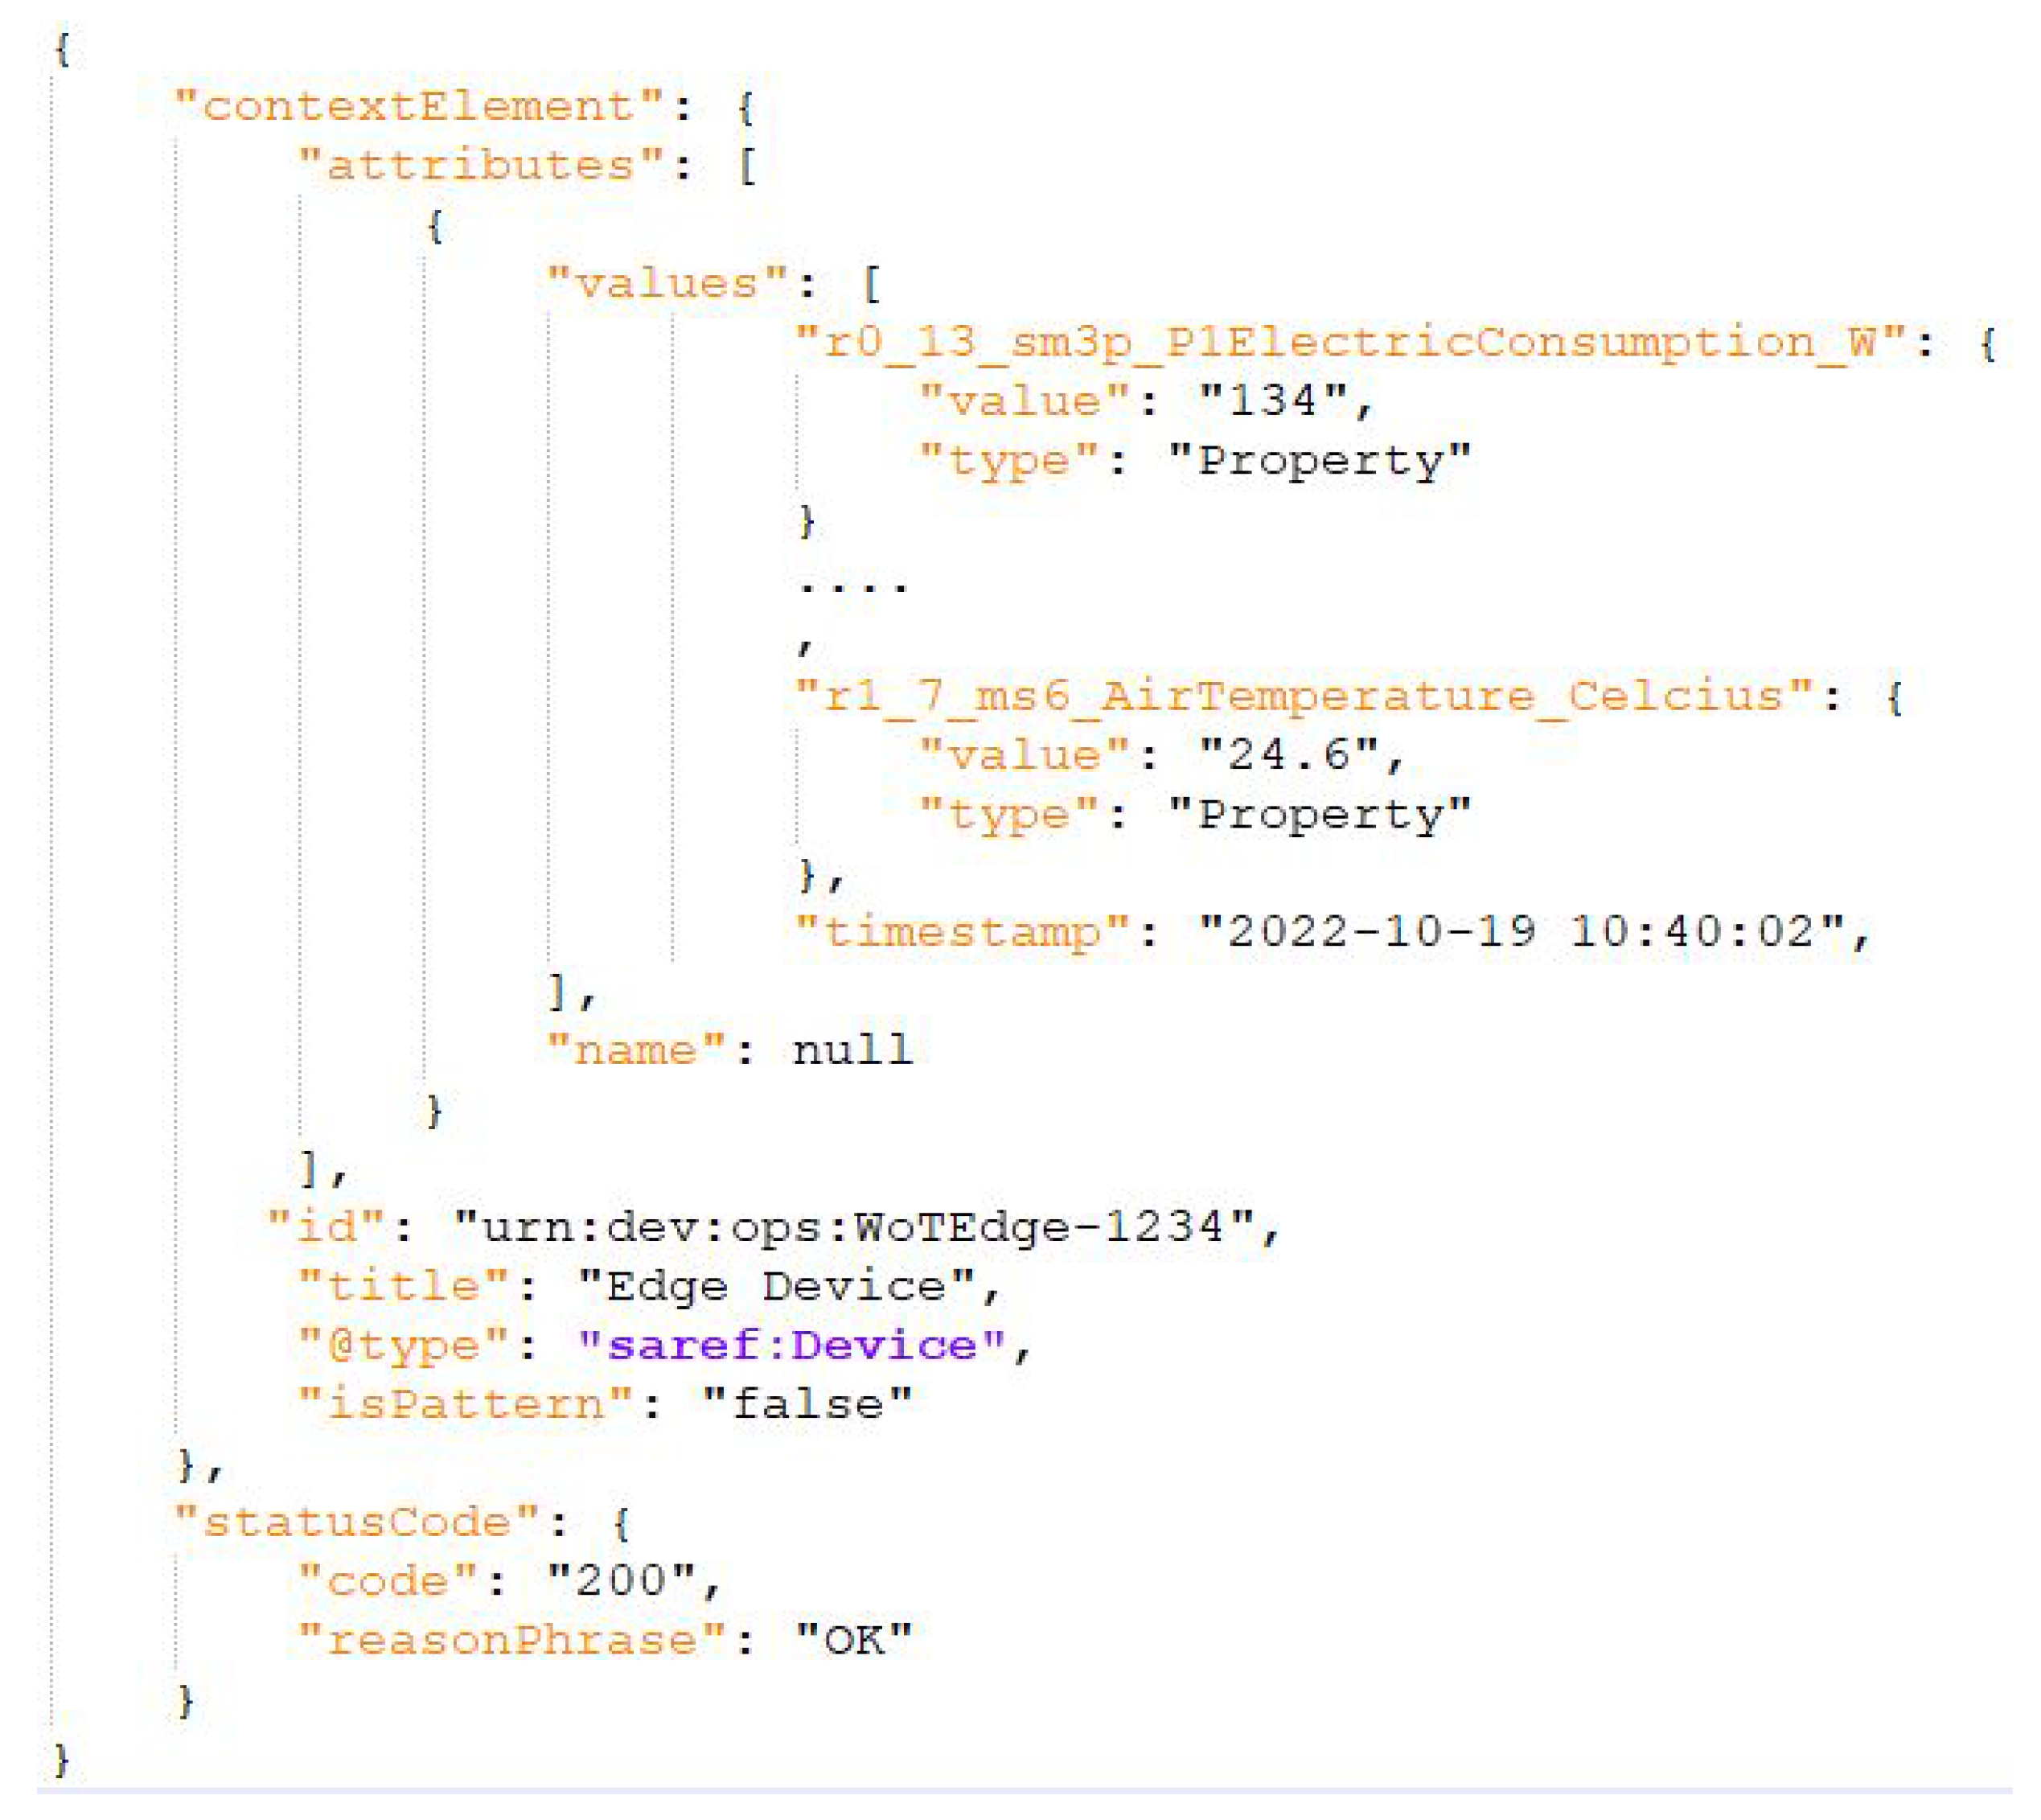
3.7.1. Semantics: Web of Things (WoT) Thing Description

In order to reduce ambiguity and facilitate interoperability between various edge devices and other external systems (Figure 10), the SEDGE architecture follows the web of things (WoT) architecture guidelines [49]. WoT refers to the W3C standards of REST, RDF, and HTTP, which facilitate the efficient interaction and usability of components existing in an IoT network. Edge devices are semantically described in a human-readable and machine-understandable representation, which includes semantic metadata about them, serialized in JSON-LD format. The descriptions are based on standardized vocabularies and ontologies that allow external systems to interpret the capabilities of several interoperating and collaborating edge devices in a unified manner. Edge devices are exposed and open to the web through a WoT scripting API that makes accessible the available interactions provided in the description.
The following example of the description of SEDGE devices in JSON-LD format demonstrates the available properties of the edge devices monitored, the events that can be recognized, and the actions that can be executed for healing the malfunctioning devices (Figure 11). The example uses the SAREF core ontology for the semantic description of the edge device (currently, an edge device is not specifically represented in any of the well-known related ontologies; thus, saref:Device is used).

3.7.2. Data Center: Communication with Other Components

As described in Section 3.7.1, each of the SEDGEs may communicate with other components, such as digital twins and BEMS. All the information of a SEDGE may be saved in a cloud database and processed by a cloud server. Furthermore, BEMS will exploit this information to make decisions and send controls back to the SEDGE utilizing the WoT. Likewise, the SEDGE WoT may be used to push data to a digital twin for sensors’ real-time data visualization.

4. Experimental Results

The experiments took place in a desk office in Thessaloniki, Greece. An IoT network was configured including different protocols (Figure 12). The network was set up following the methodology described above and certain tests and experiments were conducted. In this section, the selected underlying hardware components are presented, along with the protocols and sensors utilized. Furthermore, the results from the monitoring cycle, error analysis, and experiments are addressed.

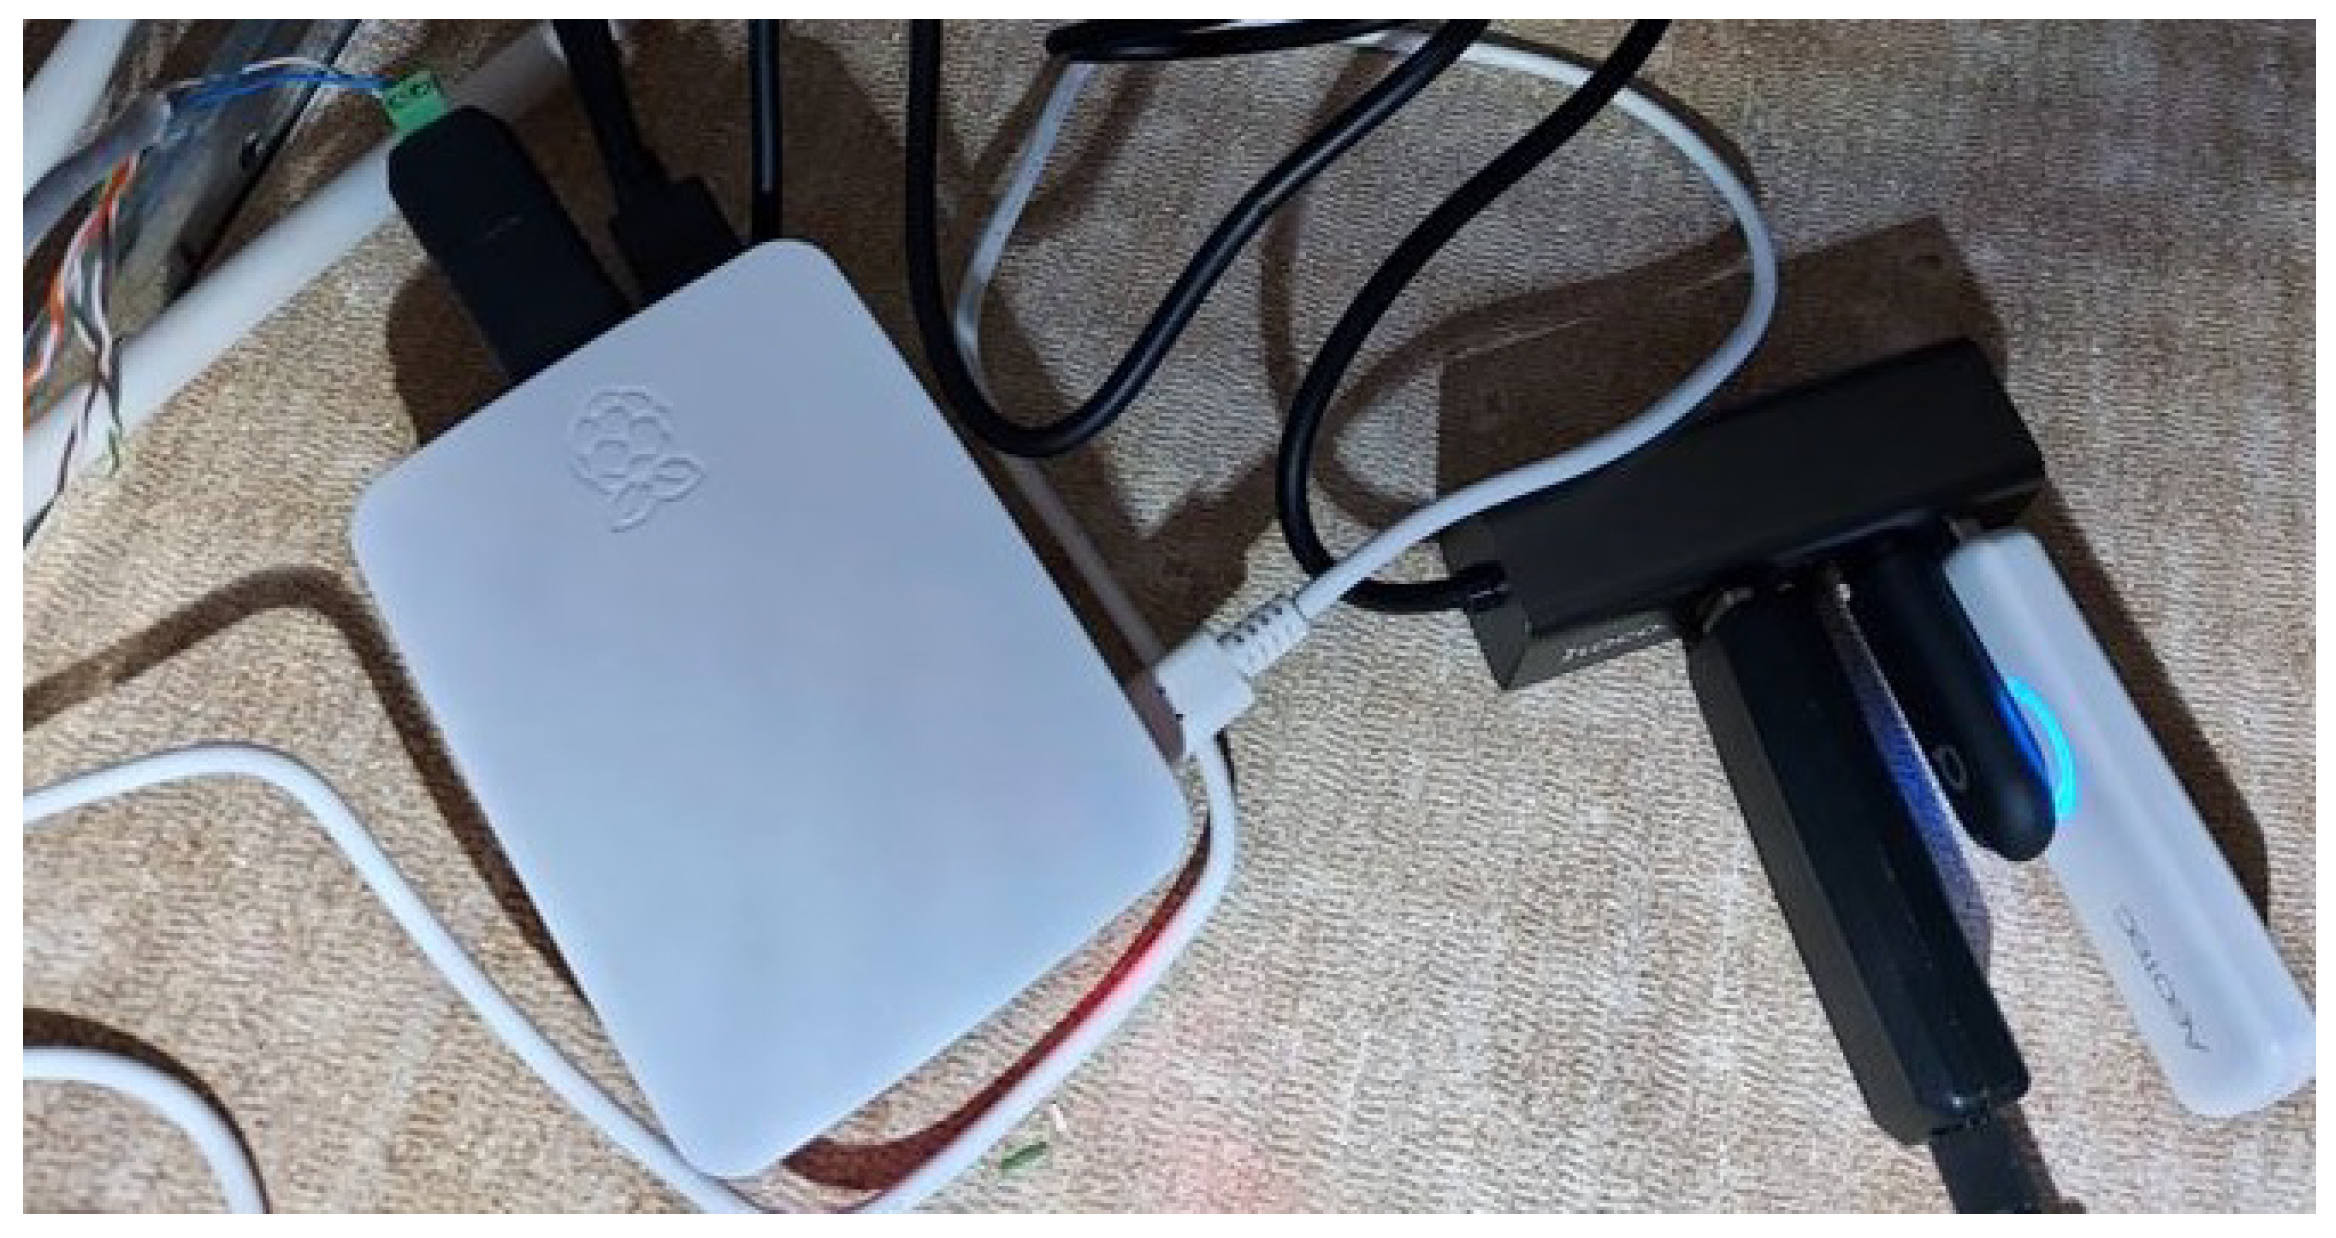
4.1. Underlying Hardware Components

4.1.1. Edge Device

The edge utilized is a Raspberry Pi (Rpi) 3 Model B+ (Table 7). A Rpi offers many advantages and also ensures that the final system is lightweight and therefore operates on it. The Rpi is low-cost, has big processing power, and supports Linux and Python, offering many possibilities to build embedded applications.
To support various protocols, most of the sensors and devices use a dongle stick that allows the communication between them and the edge as depicted in Figure 13.

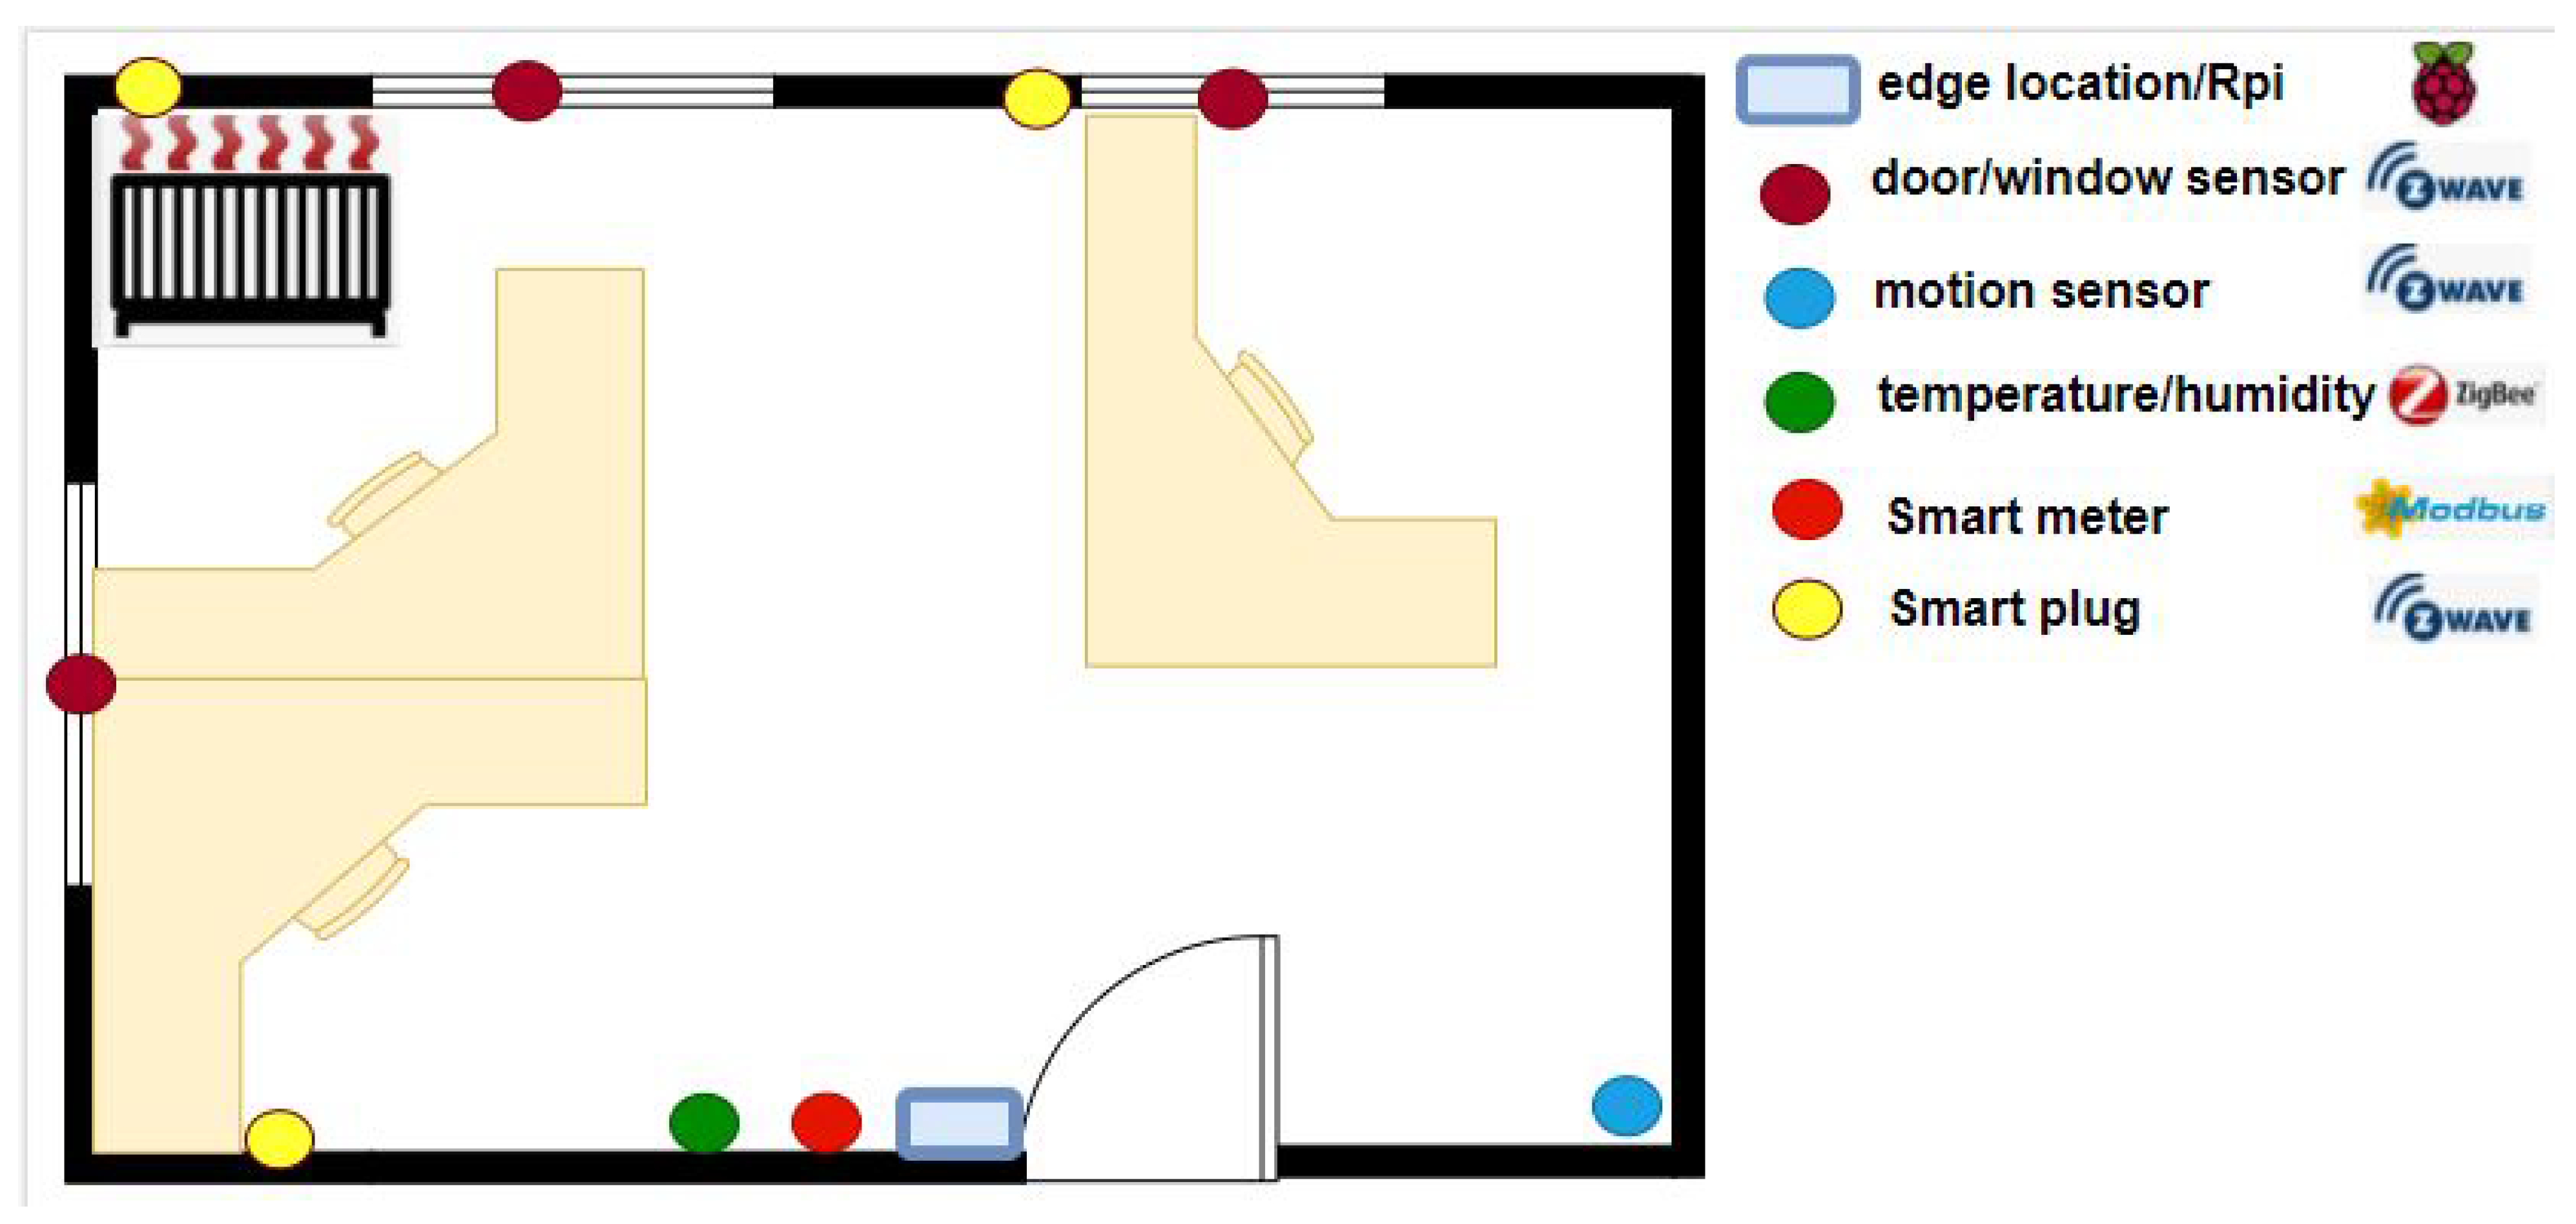
4.1.2. Devices, Sensors, and Protocols

The devices and sensors used are presented in Table 8. The IoT devices consist of three different protocols (i.e., ZigBee, Z-Wave, and ModBus), and they are either wired or wireless. The objective is to test that the proposed SEDGE methodology may support heterogeneous sources.

4.2. Data Set Description for Edge Monitoring Status

A set of data was collected using measurements from 12 different Rpi devices. The raw data that describe the normal and anomaly events were acquired at regular 10-s intervals. The experiment took place in different working and residential areas. In total, 103,680 data points were collected, including information of CPU temperature ( C), CPU usage (%), disk usage (%), and virtual memory usage (%). Table 9 presents the necessary statistics for the used variables.
As the proposed autoencoder (AE) used a gradient descent method as an optimization technique, the input data had to be scaled. A standardization method was used, shifting the distribution of each attribute to have a mean of 0 and a standard deviation of 1.

4.3. SEDGE Real-Time Data Retrieval Test

To ensure and test that real-time data are retrieved, they are pushed through an API to a cloud database [50], following the methodology described in Section 3.5. An example of the response is shown in Figure 14. The response is evaluated based on the received timestamp that must be the current, and also a check from the Z-Wave network that the value posted is also the current. It may be observed that the variables are named in a similar way as in Section 3.5.3. Each variable indicates r o o m N u m b e r _ n o d e I D _ t y p e O f S e n s o r _ V a r i a b l e _ U n i t .

4.4. SEDGE Real-Time Monitoring Test

TensorFlow Lite (TFL) [51] is an open-source machine learning inference framework, which is the lightweight version of TensorFlow that is specifically designed for mobile/IoT devices and embedded platforms. TFL models are converted into micro models using the TensorFlow Lite converter Python API [52]. The proposed model was developed in the TensorFlow framework and was subsequently converted to a TFL model before being loaded to the RPi.
As mentioned in Section 3.6.3, datasets with normal [53] and anomaly points were used for the test phase. Normal monitored edge values are depicted in Figure 15. As it may be observed in this figure, different periods are added for each of the monitored values to observe the sensitivity patterns of all the reported data. As it was difficult to detect anomalies in a normal operation of an RPi, different types of anomalies were simulated based on Table 4. Thus, anomalies in time series were identified based on CPU temperature with values greater than 85°C, CPU usage with values greater than 70%, virtual memory usage with values greater than 75%, and disk usage with values greater than 85% as well as previous values before the measurements exceeded the defined threshold. Examples of normal and simulated anomalies points are illustrated in Figure 16.
Table 10 presents the performance of the proposed model in terms of accuracy, precision, and recall as well as F-score. Additionally, a comparison with state-of-the-art models, including AE-LSTM with one layer in the encoder and decoder layer, isolation-forest (IF) [54], one-class SVM (OCSVM) [55], local outlier factor (LOF) [56] and the DBSCAN method [57] are presented. As it can be observed, the model selected in this paper had an accuracy of 0.994 with an F-score of 0.849, a precision of 0.939, and a recall of 0.775, among the highest among the six presented models. Additionally, the execution time was 237 ms, and the total model size was 2.8 Mb.
One critical parameter which needs to be considered is the threshold value for the AE-LSTM method and the contamination for the IF, OCSVM and LOF [58]. To determine the threshold value of signals as normal or anomalous, the reconstruction error values were used for the AE-LSTM. As mentioned in Section 3.6.3, the MAE was used in order to detect the anomaly points. The results for each variable (CPU temperature, CPU, usage, disk usage, and virtual memory usage) are presented in Figure 17. The red lines depict the predicted values that are the reconstructed values for each variable, as described in the methodology (Section 3.6.3). In Figure 17, the nearly horizontal lines represent how the Rpi would operate under normal conditions. As it may be observed, the reconstructed/predicted values illustrate accurately the normal Pi conditions. The blue lines illustrate the real values, which were collected from the Rpi (simulated error). Any deviation between those two lines indicates that the retrieved values are an anomaly point, and therefore, they are considered malfunctions. The black marker indicates the real anomaly points, while the red illustrates the predicted anomaly points. Additionally, there are bar plots for each variable, which present the reconstruction error using the MAE metrics as well as lines with the threshold value, which is selected using the three-sigma statistic rule. As it can be observed, the proposed method is able to identify the majority of anomaly points at the beginning of the error phase. Therefore, the selected algorithm is efficient for error detection in an IoT network.

5. Conclusions

There is not a unique, established IoT network architecture; therefore, the complexity, number of layers, number of sensors, and use cases of each architecture vary. Nevertheless, it is fundamental that the IoT architecture must support several protocols, maintain interoperability and ensure perpetual monitoring. Within this context, this study presents a suggestion for an IoT edge-to-edge (SEDGE) architecture that can link multiple communication technologies, establish interoperability with other systems and edges while supporting auto-healing actions for monitoring stability.
The main objective of SEDGE is to integrate all necessary features into an autonomous gateway and make it simple to link any gateway to the BMS systems. To allow future SEDGE expansion and modification to incorporate new technologies and/or protocols, each gateway’s network is robustly integrated with several sensor technologies. Moreover, interoperability is provided via an extra semantically enriched layer, providing the capability for the SEDGE to communicate with heterogeneous systems and sources. Moreover, specific healing actions are applied at the edge depending on the type of the error.
SEDGE healing actions are of two types, those for which automated actions may be applied (e.g., kill processes) and those for which the end user must take further actions (e.g., the Wi-Fi network is unstable). Furthermore, continuous monitoring of SEDGE is applied, and an AE-LSTM algorithm detects all the problematic situations. The selected algorithm is 99.4% efficient and is more accurate than other tested algorithms. Finally, to ensure that fatal errors will not affect the SEDGE, automated actions are performed if the monitored SEDGE processes exceed the predefined limits.
Future actions include the integration of new connectivity protocols, such as an M-bus protocol and weather stations that usually communicate with a Wi-Fi protocol. Additionally, the semantics layer will be enriched with more information. Finally, extensive experiments will be made on more SEDGEs, and more auto-healing actions will be provided.

Author Contributions

Writing—original draft, V.-G.V., A.P. and S.A.; Writing—review and editing, A.D., K.K., C.-N.A., S.K., D.I. and D.T. All authors have read and agreed to the published version of the manuscript.

Funding

This research received no external funding.

Institutional Review Board Statement

Not applicable.

Informed Consent Statement

Not applicable.

Data Availability Statement

Not applicable.

Acknowledgments

The research leading to these results was partially funded by the European Commission “LC- EEB-07-2020—Smart Operation of Proactive Residential Buildings”— PRECEPT H2020 project (Grant agreement ID: 958284).

Conflicts of Interest

The authors declare no conflict of interest.

Abbreviations

The following abbreviations are used in this manuscript:
EUEuropean Union
BEMSBuilding Energy Management Systems
BACSBuilding Automation and Control System
AE-LSTMAutoencoder Long Short-Term Memory
SEDGESmart EDGE AI IoT system
LPWALow Power Wide Area networks
RARemote Actions
PIPhysical Intervention
RNNRecurrent Neural Network
LSTMLong Short-Term Memory Networks

References

  1. REPowerEU: A Plan to Rapidly Reduce Dependence on Russian Fossil Fuels and Fast forward the Green Transition. Available online: https://ec.europa.eu/commission/presscorne (accessed on 26 August 2022).
  2. European Commission, EU ‘Save Energy’. Available online: https://eur-lex.europa.eu/homepage.html (accessed on 26 August 2022).
  3. Dimara, A.; Vasilopoulos, V.G.; Krinidis, S.; Tzovaras, D. NRG4-U: A novel home energy management system for a unique loadprofile. Energy Sources Part A Recovery Util. Environ. Eff. 2022, 44, 353–378. [Google Scholar] [CrossRef]
  4. Garzia, F.; Van Thillo, L.; Verbeke, S.; Pozza, C.; Audenaert, A. Co-benefits of building automation and control systems: An analysis of smart office buildings. In Proceedings of the CLIMA 2022 Conference, Rotterdam, The Netherlands, 22–25 May 2022. [Google Scholar]
  5. Touqeer, H.; Zaman, S.; Amin, R.; Hussain, M.; Al-Turjman, F.; Bilal, M. Smart home security: Challenges, issues and solutions at different IoT layers. J. Supercomput. 2021, 77, 14053–14089. [Google Scholar] [CrossRef]
  6. Carlo Gavazzi Automations. Available online: https://www.carlogavazzi.com/ (accessed on 22 September 2022).
  7. Wicaksono, R.; Rif’an, M.; Anugerah, R. IoT Based Smart Energy Meter Using Modbus Protocol as Electricity Saving Effort. In Proceedings of the Conference on Broad Exposure to Science and Technology 2021 (BEST 2021), Online, 31 August 2021; Atlantis Press: Paris, France, 2022. [Google Scholar]
  8. Dadi, V.; Pathakamuri, N.; Ashik, M.; Patnaik, M.R.; Reddy, D.V.R.K.; Ravichandra, B. Manual (Wired) and Control (Wireless) Modes of Automation System with Multi-level Voice Strings. In Sustainable Communication Networks and Application; Springer: Singapore, 2022; pp. 385–396. [Google Scholar]
  9. Chinchero, H.F.; Alonso, J.M.; Ortiz, T.H. LED Lighting System with Magnetic Control and IoT Sensor Integration for Smart Buildings. In Proceedings of the 2020 IEEE International Conference on Power Electronics, Drives and Energy Systems (PEDES), Aipur, India, 16–19 December 2020. [Google Scholar]
  10. Gulati, K.; Boddu, R.S.K.; Kapila, D.; Bangare, S.L.; Chandnani, N.; Saravanan, G. A review paper on wireless sensor network techniques in Internet of Things (IoT). Mater. Today Proc. 2021, 51, 161–165. [Google Scholar] [CrossRef]
  11. Aboubakar, M.; Kellil, M.; Roux, P. A review of IoT network management: Current status and perspectives. J. King Saud Univ.-Comput. Inf. Sci. 2021, 34, 4163–4176. [Google Scholar] [CrossRef]
  12. Smart Home—Europe. Available online: https://www.statista.com/outlook/dmo/smart-home/europe (accessed on 22 September 2022).
  13. Raychowdhury, A.; Pramanik, A. Survey on LoRa technology: Solution for internet of things. Intell. Syst. Technol. Appl. 2020, 1148, 259–271. [Google Scholar]
  14. Al Homssi, B.; Dakic, K.; Maselli, S.; Wolf, H.; Kandeepan, S.; Al-Hourani, A. IoT network design using open-source LoRa coverage emulator. IEEE Access 2021, 9, 53636–53646. [Google Scholar] [CrossRef]
  15. Ahmad, Z.; Shahid Khan, A.; Nisar, K.; Haider, I.; Hassan, R.; Haque, M.R.; Tarmizi, S.; Rodrigues, J.J.P.C. Anomaly detection using deep neural network for IoT architecture. Appl. Sci. 2021, 11, 7050. [Google Scholar] [CrossRef]
  16. Ullah, I.; Mahmoud, Q.H. A Technique for Generating a Botnet Dataset for Anomalous Activity Detection in IoT Networks. In Proceedings of the 2020 IEEE International Conference on Systems, Man, and Cybernetics SMC, Toronto, ON, Canada, 11–14 October 2020; pp. 134–140. [Google Scholar]
  17. Adi, P.D.P.; Sihombing, V.; Siregar, V.M.M.; Yanris, G.J.; Sianturi, F.A.; Purba, W.; Tamba, S.P.; Simatupang, J.; Arifuddin, R.; Subairi, S.; et al. A performance evaluation of ZigBee mesh communication on the Internet of Things (IoT). In Proceedings of the 2021 3rd East Indonesia Conference on Computer and Information Technology (EIConCIT), Surabaya, Indonesia, 9–11 April 2021. [Google Scholar]
  18. Amanlou, S.; Hasan, M.K.; Bakar, K.A.A. Lightweight and secure authentication scheme for IoT network based on publish–subscribe fog computing model. Comput. Netw. 2021, 199, 108465. [Google Scholar] [CrossRef]
  19. Sabireen, H.; Neelanarayanan, V. A review on fog computing: Architecture, fog with IoT, algorithms and research challenges. ICT Express 2021, 7, 162–176. [Google Scholar]
  20. Kumar, P.; Gupta, G.P.; Tripathi, R. Design of anomaly-based intrusion detection system using fog computing for IoT network. Autom. Control. Comput. Sci. 2021, 55, 137–147. [Google Scholar] [CrossRef]
  21. Alsaffar, M.; Hamad, A.A.; Alshammari, A.; Alshammari, G.; Almurayziq, T.S.; Mohammed, M.S.; Enbeyle, W. Network management system for IoT based on dynamic systems. Comput. Math. Methods Med. 2021, 2021, 9102095. [Google Scholar] [CrossRef]
  22. Wang, H. Improvement and implementation of wireless network topology system based on SNMP protocol for router equipment. Comput. Commun. 2020, 151, 10–18. [Google Scholar] [CrossRef]
  23. Lin, B.-S.P. Toward an AI-enabled SDN-based 5G & IoT network. Netw. Commun. Technol. 2021, 5, 7–12. [Google Scholar]
  24. Abdulrazak, B.; Codjo, J.A.; Paul, S. Self-Healing approach for IoT Architecture: AMI Platform. In International Conference on Smart Homes and Health Telematics; Springer: Cham, Switzerland, 2022. [Google Scholar]
  25. Dias, J.P.; Lima, B.; Faria, J.P.; Restivo, A.; Ferreira, H.S. Visual self-healing modelling for reliable internet-of-things systems. In International Conference on Computational Science; Springer: Cham, Switzerland, 2020. [Google Scholar]
  26. Node-RED. Available online: https://nodered.org// (accessed on 8 November 2022).
  27. Aktas, M.S.; Astekin, M. Provenance aware run-time verification of things for self-healing Internet of Things applications. Concurr. Comput. 2019, 31, e4263. [Google Scholar] [CrossRef]
  28. Ferreira, H.S.; Sousa, T.B.; Restivo, A.; Dias, J.P. A pattern-language for self-healing Internet-of-Things systems. In Proceedings of the European Conference on Pattern Languages of Programs 2020, Virtual Event, 1–4 July 2020. [Google Scholar]
  29. Dias, J.P.; Restivo, A.; Ferreira, H.S. Empowering visual Internet-of-Things mashups with self-healing capabilities. In Proceedings of the 2021 IEEE/ACM 3rd International Workshop on Software Engineering Research and Practices for the IoT (SERP4IoT), Madrid, Spain, 3 June 2021. [Google Scholar]
  30. Lu, Q.; Guo, Q.; Zeng, W. Optimization scheduling of home appliances in smart home: A model based on a niche technology with sharing mechanism. Int. J. Electr. Power Energy Syst. 2022, 141, 108126. [Google Scholar] [CrossRef]
  31. Taiwo, O.; Ezugwu, A.E. Internet of things-based intelligent smart home control system. Secur. Commun. Netw. 2021, 2021, 9928254. [Google Scholar] [CrossRef]
  32. Saleem, M.U.; Usman, M.R.; Shakir, M. Design, implementation, and deployment of an IoT based smart energy management system. IEEE Access 2021, 9, 59649–59664. [Google Scholar] [CrossRef]
  33. Tiwari, P.; Garg, V.; Agrawal, R. Changing world: Smart homes review and future. In Smart IoT for Research and Industry; Springer: Cham, Switzerland, 2022; pp. 145–160. [Google Scholar]
  34. MQTT Specification. Available online: https://mqtt.org/mqtt-specification (accessed on 13 October 2022).
  35. System and Service Manager. Available online: https://systemd.io/ (accessed on 19 October 2022).
  36. Hsu, T.H.-C. Hands-On Security in DevOps: Ensure Continuous Security, Deployment, and Delivery with DevSecOps; Packt Publishing Ltd.: Birmingham, UK, 2018. [Google Scholar]
  37. Xu, L. Computer Network Security Problems and Solutions Based on Big Data. In Proceedings of the 2nd International Conference on Computing and Data Science, Stanford, CA, USA, 28–30 January 2021. [Google Scholar]
  38. Washizaki, H.; Ogata, S.; Hazeyama, A.; Okubo, T.; Fernández, E.; Yoshioka, N. Landscape of architecture and design patterns for iot systems. IEEE Internet Things J. 2020, 7, 10091–10101. [Google Scholar] [CrossRef]
  39. Hochreiter, S.; Schmidhuber, J. Long short-term memory. Neural Comput. 1997, 9, 1735–1780. [Google Scholar] [CrossRef]
  40. Yu, Y.; Si, X.; Hu, C.; Zhang, J. A review of recurrent neural networks: LSTM cells and network architectures. Neural Comput. 2019, 31, 1235–1270. [Google Scholar] [CrossRef]
  41. Smagulova, K.; James, A.P. A survey on LSTM memristive neural network architectures and applications. Eur. Phys. J. Spec. Top. 2019, 228, 2313–2324. [Google Scholar] [CrossRef]
  42. Gensler, A.; Henze, J.; Sick, B.; Raabe, N. Deep Learning for solar power forecasting—An approach using AutoEncoder and LSTM Neural Networks. In Proceedings of the 2016 IEEE International Conference on Systems, Man, and Cybernetics (SMC), Budapest, Hungary, 9–12 October 2016; pp. 002858–002865. [Google Scholar]
  43. Staudemeyer, R.C.; Morris, E.R. Understanding LSTM–A tutorial into long short-term memory recurrent neural networks. arXiv 2019, arXiv:1909.09586. [Google Scholar]
  44. Nguyen, H.D.; Tran, K.P.; Thomassey, S.; Hamad, M. Forecasting and Anomaly Detection approaches using LSTM and LSTM Autoencoder techniques with the applications in supply chain management. Int. J. Inf. Manag. 2021, 57, 102282. [Google Scholar] [CrossRef]
  45. Homayouni, H.; Ghosh, S.; Ray, I.; Gondalia, S.; Duggan, J.; Kahn, M.G. An autocorrelation-based lstm-autoencoder for anomaly detection on time-series data. In Proceedings of the 2020 IEEE International Conference on Big Data (Big Data), Atlanta, GA, USA, 10–13 December 2020; pp. 5068–5077. [Google Scholar]
  46. Maleki, S.; Maleki, S.; Jennings, N.R. Unsupervised anomaly detection with LSTM autoencoders using statistical data-filtering. Appl. Soft Comput. 2021, 108, 107443. [Google Scholar] [CrossRef]
  47. Agarap, A.F. Deep learning using rectified linear units (relu). arXiv 2018, arXiv:1803.08375. [Google Scholar]
  48. Pukelsheim, F. The three sigma rule. Am. Stat. 1994, 48, 88–91. [Google Scholar]
  49. Web of Things (WoT) Architecture W3C Recommendation 9 April 2020. Available online: https://www.w3.org/TR/wot-architecture/ (accessed on 19 October 2022).
  50. Korkas, C.; Dimara, A.; Michailidis, I.; Krinidis, S.; Marin-Perez, R.; Martínez García, A.I.; Tzovaras, D. Integration and Verification of PLUG-N-HARVEST ICT Platform for Intelligent Management of Buildings. Energies 2022, 15, 2610. [Google Scholar] [CrossRef]
  51. TensorFlow. TensorFlow Lite|ML for Mobile and Edge Devices. 2021. Available online: https://www.tensorflow.org/lite (accessed on 19 October 2022).
  52. TensorFlow. Tensorflow Lite Converter. 2021. Available online: https://www.tensorflow.org/lite/convert (accessed on 7 October 2022).
  53. Kogler, A.; Weber, D.; Haubenwallner, M.; Lipp, M.; Gruss, D.; Schwarz, M. Finding and Exploiting CPU Features using MSR Templating. In Proceedings of the 2022 IEEE Symposium on Security and Privacy (SP), San Francisco, CA, USA, 22–26 May 2022. [Google Scholar]
  54. Liu, F.T.; Ting, K.M.; Zhou, Z.H. Isolation forest. In Proceedings of the 2008 Eighth IEEE International Conference on Data Mining, Pisa, Italy, 15–19 December 2008; pp. 413–422. [Google Scholar]
  55. Ma, J.; Perkins, S. Time-series novelty detection using one-class support vector machines. In Proceedings of the International Joint Conference on Neural Networks, Portland, OR, USA, 20–24 July 2003; Volume 3, pp. 1741–1745. [Google Scholar]
  56. Alghushairy, O.; Alsini, R.; Soule, T.; Ma, X. A review of local outlier factor algorithms for outlier detection in big data streams. Big Data Cogn. Comput. 2020, 5, 1. [Google Scholar] [CrossRef]
  57. Çelik, M.; Dadaşer-Çelik, F.; Dokuz, A.Ş. Anomaly detection in temperature data using DBSCAN algorithm. In Proceedings of the 2011 International Symposium on Innovations in Intelligent Systems and Applications, Istanbul, Turkey, 15–18 June 2011; pp. 91–95. [Google Scholar]
  58. Le, X.H.; Ho, H.V.; Lee, G.; Jung, S. Application of long short-term memory (LSTM) neural network for flood forecasting. Water 2019, 11, 1387. [Google Scholar] [CrossRef] [Green Version]
Figure 1. IoT applications and “things”.
Applsci 12 11650 g001
Figure 2. SEDGE conceptual architecture.
Applsci 12 11650 g002
Figure 3. zwavetomqttjs docker compose configuration file.
Applsci 12 11650 g003
Figure 4. systemctl service file example.
Applsci 12 11650 g004
Figure 5. Z-Wave smart plug.
Applsci 12 11650 g005
Figure 6. Z-Wave multi-sensor.
Applsci 12 11650 g006
Figure 7. Application layer workflow.
Applsci 12 11650 g007
Figure 8. A module of LSTM network [34].
Applsci 12 11650 g008
Figure 9. Anomaly detection method based on reconstruction errors (AE-LSTM).
Applsci 12 11650 g009
Figure 10. WoT to digital twin architecture.
Applsci 12 11650 g010
Figure 11. Example of the description of SEDGE devices in JSON-LD.
Applsci 12 11650 g011
Figure 12. Sensors and devices installation points.
Applsci 12 11650 g012
Figure 13. Edge: Raspberry Pi with dongle sticks.
Applsci 12 11650 g013
Figure 14. Example of JSON response.
Applsci 12 11650 g014
Figure 15. Examples of normal edge monitored data.
Applsci 12 11650 g015
Figure 16. Examples of normal-simulated/anomalous data.
Applsci 12 11650 g016
Figure 17. The real and reconstructed or predicted time series of the proposed model with real and predicted anomaly points.
Applsci 12 11650 g017
Table 1. Summary of related work and comparison with the SEDGE approach.
WorkWiredWirelessMulti ProtocolsSemantically EnrichedEdge Data SavingNetwork TrackingHealing ActionsReal-Life ScenarioLight Weight ModelsReplicability
[14] 🗸 🗸
[15] 🗸🗸 🗸🗸 🗸
[18] 🗸 🗸 🗸🗸🗸
[20] 🗸 🗸 🗸
[21] 🗸🗸 🗸 🗸
[23] 🗸 🗸 🗸
[24] 🗸 🗸
[25] 🗸
[27] 🗸🗸
[28] 🗸
[29] 🗸🗸
SEDGE🗸🗸🗸🗸🗸🗸🗸🗸🗸🗸
Table 2. Summary of related work and comparison of healing parameters to SEDGE.
WorkNodes (Sensors)MiddlewareCloudData TransferingEdgeError Detection Technique
[24]🗸🗸🗸 Monitoring
[25]🗸 🗸 Monitoring
[27]🗸🗸 🗸 Rule based
[28]🗸 Monitoring
[29]🗸🗸 Monitoring
SEDGE🗸🗸🗸🗸🗸Monitoring, Threshold, AI anomally detection
Table 3. Common problems/malfunctions and healing actions.
NumberResourceError          Draft Description            Type
Ed1EdgeGeneral SlowdownMost of the applications take longer time to executeRA
Ed2EdgeKeeps Disconnecting from Wi-FiThe edge is disconnecting from the WiFI at least twice a dayPI
Ed3EdgeSlow InternetThe internet response is slowPI
Ed4EdgeHigh TemperatureThe edge is overheatingRA
Ed5EdgeAbnormal CPU UsageThe CPU usage is more than 90% for more than 10 minRA
Ed6EdgeAbnormal RAM usageRAM usage is more than 90% for more than 10 minRA
En1EntitiesLow batteryThe battery is less than 10%PI
En2EntitiesNo valuesThe sensor does not push data over a dayPI
En3EntitiesStackThe sensor sends a constant valueRA
EdEn1Edge/EntitiesError analysisDetected error by the error analysis processRA
Table 4. Procedures to monitor edge performance.
ProcedureNormal Limits
cpu_temperature−40 C to 85 C (Rpi)
40–65 C (Desktop)
40–60 C (Laptop)
cpu_usage_percent20–70%
virtual_memory_usage10–75%
disk_usage0–85%
network_usageN/A
number_of_processesN/A
Table 5. Respective actions per IoT error.
NumberAction
Ed1Kill all Python processes
Ed2User alert
Ed3User alert
Ed4Restart the system
Ed5Restart the system
Ed6Restart the system
En1User alert
En2Kill all Python processes, auto-restart processes
En3Kill all Python processes, autorestart processes
EdEn1Kill all Python processes, autorestart processes
Periodic1Autorestart every 24 h
Periodic2Autoupdate every 1 week
Periodic3Autoupgrade every 1 month
Table 6. Respective messages per IoT error.
NumberMessage Context
Ed2Please check your WiFi. Trying restart your router. Else, contact your internet provider.
Ed3Please check your internet. Trying restart your router.
Else, contact your internet provider.
En1Low battery level on XX sensor. Please change the battery.
Else, contact your building manager.
Table 7. Raspberry Pi 3 technical specifications.
MicroprocessorBroadcom BCM2837 64bit Quad Core Processor
Processor Operating Voltage3.3 V
Raw Voltage input5 V, 2 A power source
Maximum current through
each I/O pin
16 mA
Maximum total current
drawn from all I/O pins
54 mA
Flash Memory
(Operating System)
16 Gbytes SSD memory card
Internal RAM4 Gbytes DDR2
Clock Frequency1.2 GHz
GPUDual Core Video Core IV® Multimedia Co-Processor.
Provides Open GLES 2.0, hardware-accelerated
Open VG, and 1080p30 H.264 high- profile decode.
Capable of 1Gpixel/s, 1.5Gtexel/s or 24GFLOPs
with texture filtering and DMA infrastructure.
Ethernet10/100 Ethernet
Wireless ConnectivityBCM43143 (802.11 b/g/n Wireless LAN
and Bluetooth 4.1)
Operating Temperature−40 C to +85 C
Table 8. Sensors and devices information.
Type of SensorNumberModelProtocolType
Door/window3Fibaro FGDW-002Z-WaveWireless
Motion sensor1Motion Sensor (FGBHMS-001)Z-WaveWireless
Temperature/Humidity1SONOFF SNZB-02ZigBeeWireless
Smart meter1Carlo Gavazzi EM341ModBusWired
Smart Plug3Fibaro FGWPF-102 ZW5Z-WaveWireless
Table 9. Dataset statistics.
StatsCPU UsageCPU TemperatureDisk UsageVirtual Memory Usage
Count103,680103,680103,680103,680
Mean1.45754.2495.52613.325
Std.0.51501.6060.0440.416
Min.0.7048.6865.5012.30
25%1.2053.5565.5013.10
50%1.4054.0435.5013.40
75%1.6055.0175.6013.60
Max.42.1063.7835.7015.60
Table 10. Comparison of the proposed model with state-of-the-art methods.
ModelAccuracyPrecisionRecallf-ScoreParameters
AE-LSTM (1 Layer on the Encoder and the Decoder)0.9830.9130.7560.829Threshold = 8.628
AE-LSTM0.9940.9390.7750.849Threshold = 10.628
Isolation Forest (IF)0.9650.8810.7510.822Contam. = 0.001
One-Class SVM (OCSVM)0.9750.9220.6780.792Contam. = 0.005
Local Outlier Factor (LOF)0.9670.9120.7320.781Contam. = 0.001
DBSCAN0.9630.8730.7500.812eps = 0.05, metric = “euclidean”
Publisher’s Note: MDPI stays neutral with regard to jurisdictional claims in published maps and institutional affiliations.

