
Smart Wireless CO2 Sensor Node for IoT Based Strategic Monitoring Tool of The Risk of The Indoor SARS-CoV-2 Airborne Transmission

Abstract
:1. Introduction
2. Materials and Methods
2.1. Carbon Dioxide (CO2) Indoor Source and Health Effect
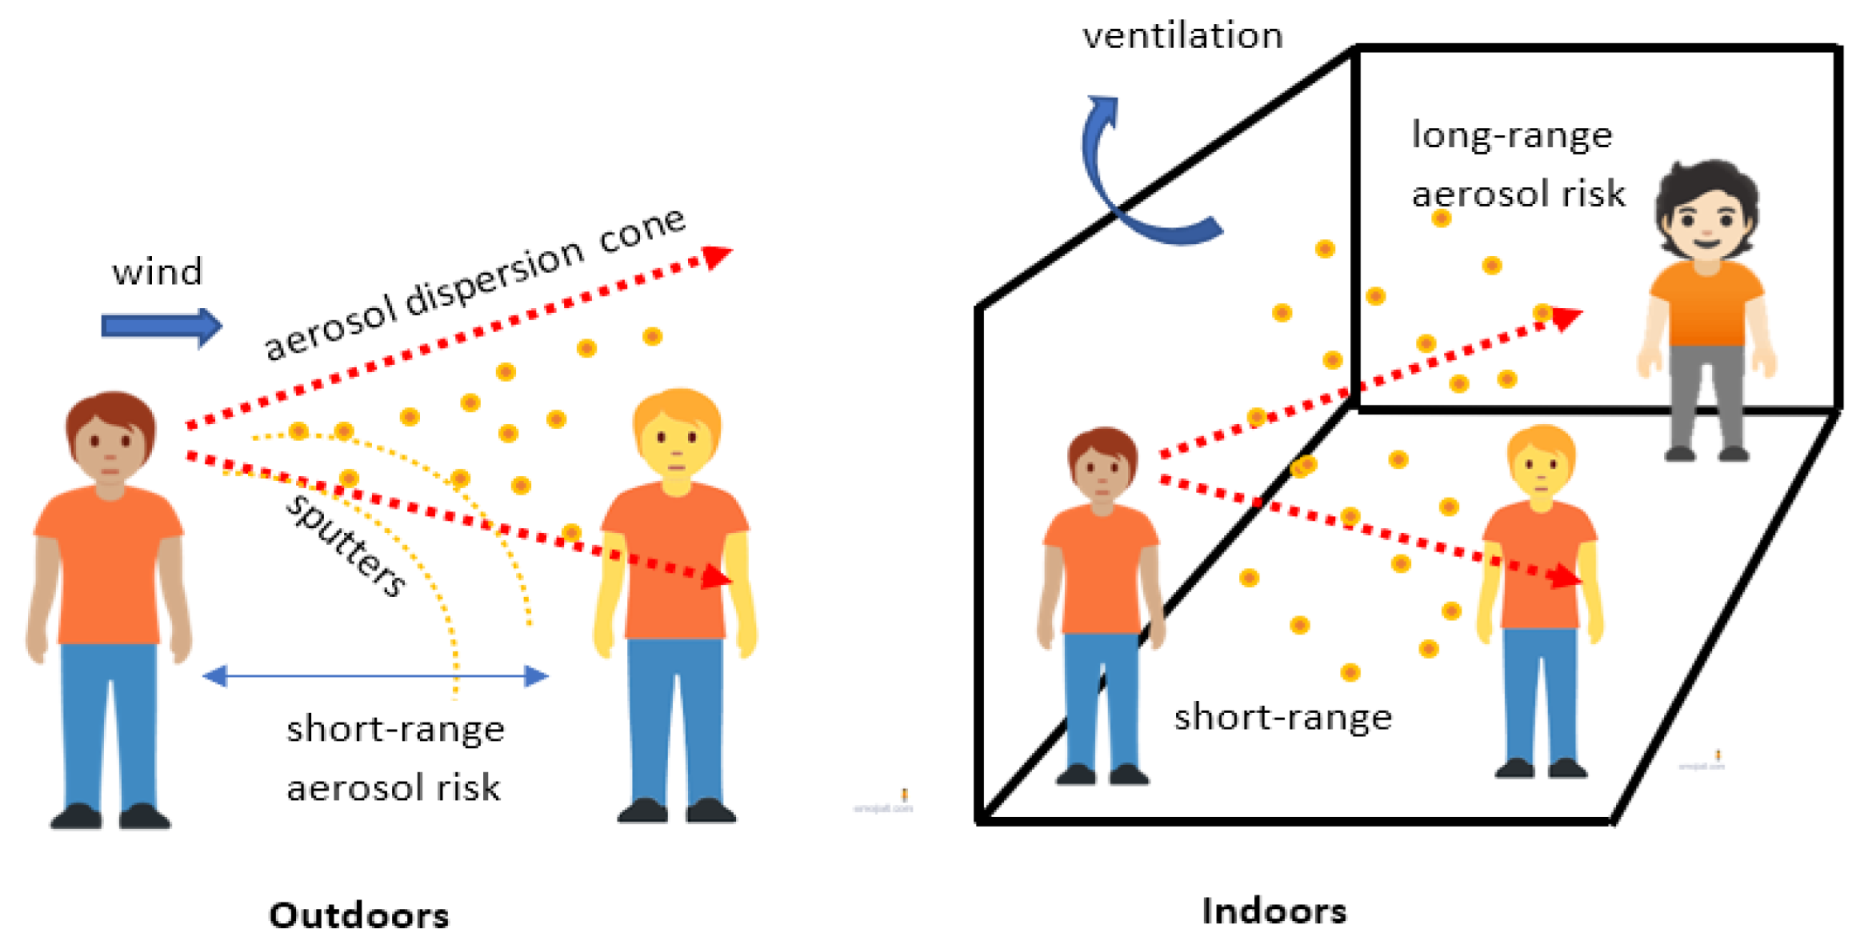
2.2. SARS-CoV-2 Pathway Transmission
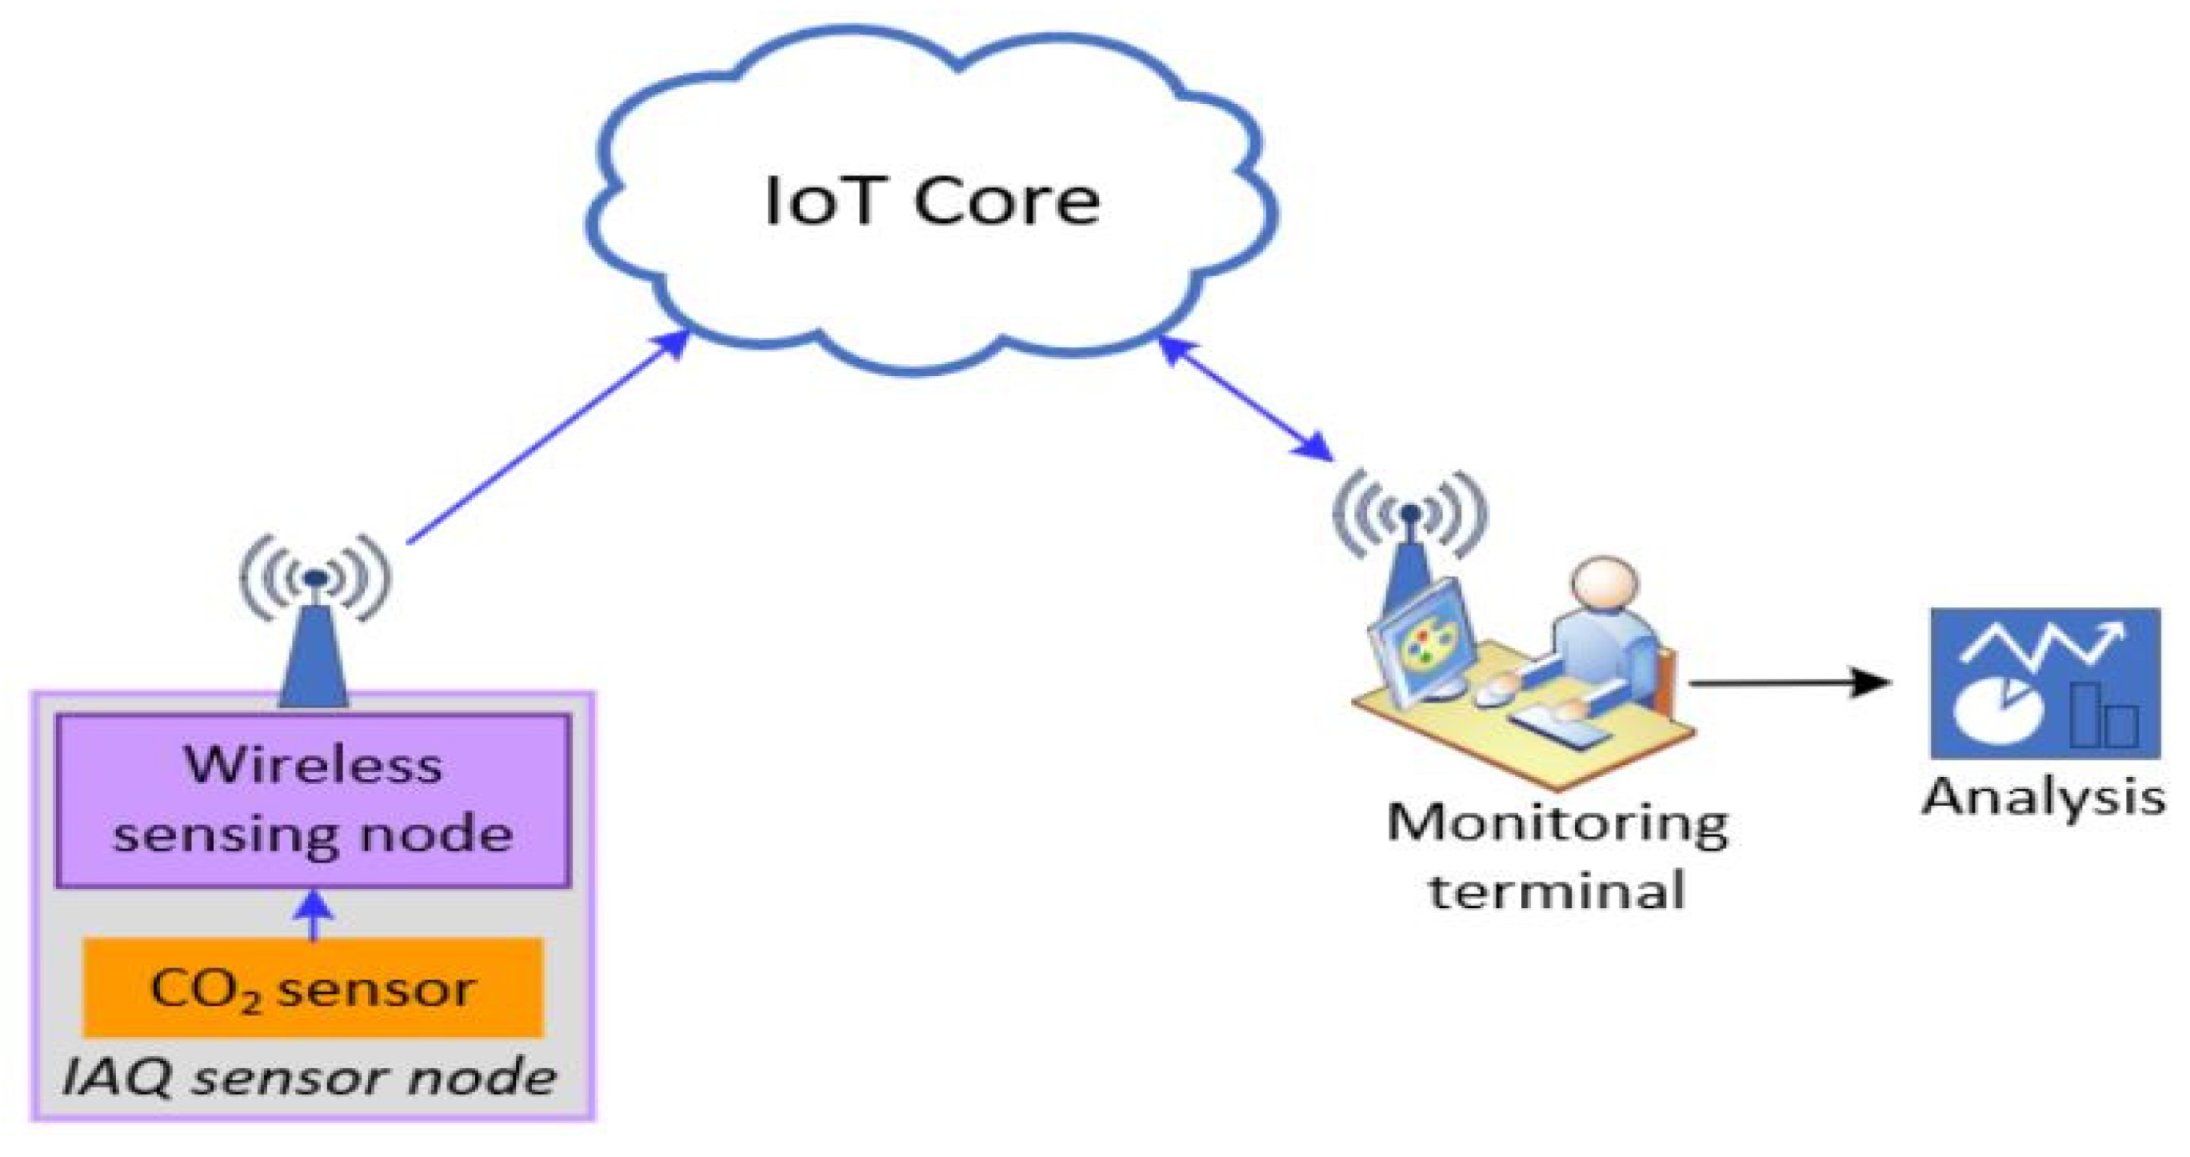
2.3. Proposed CO2 Sensor Node
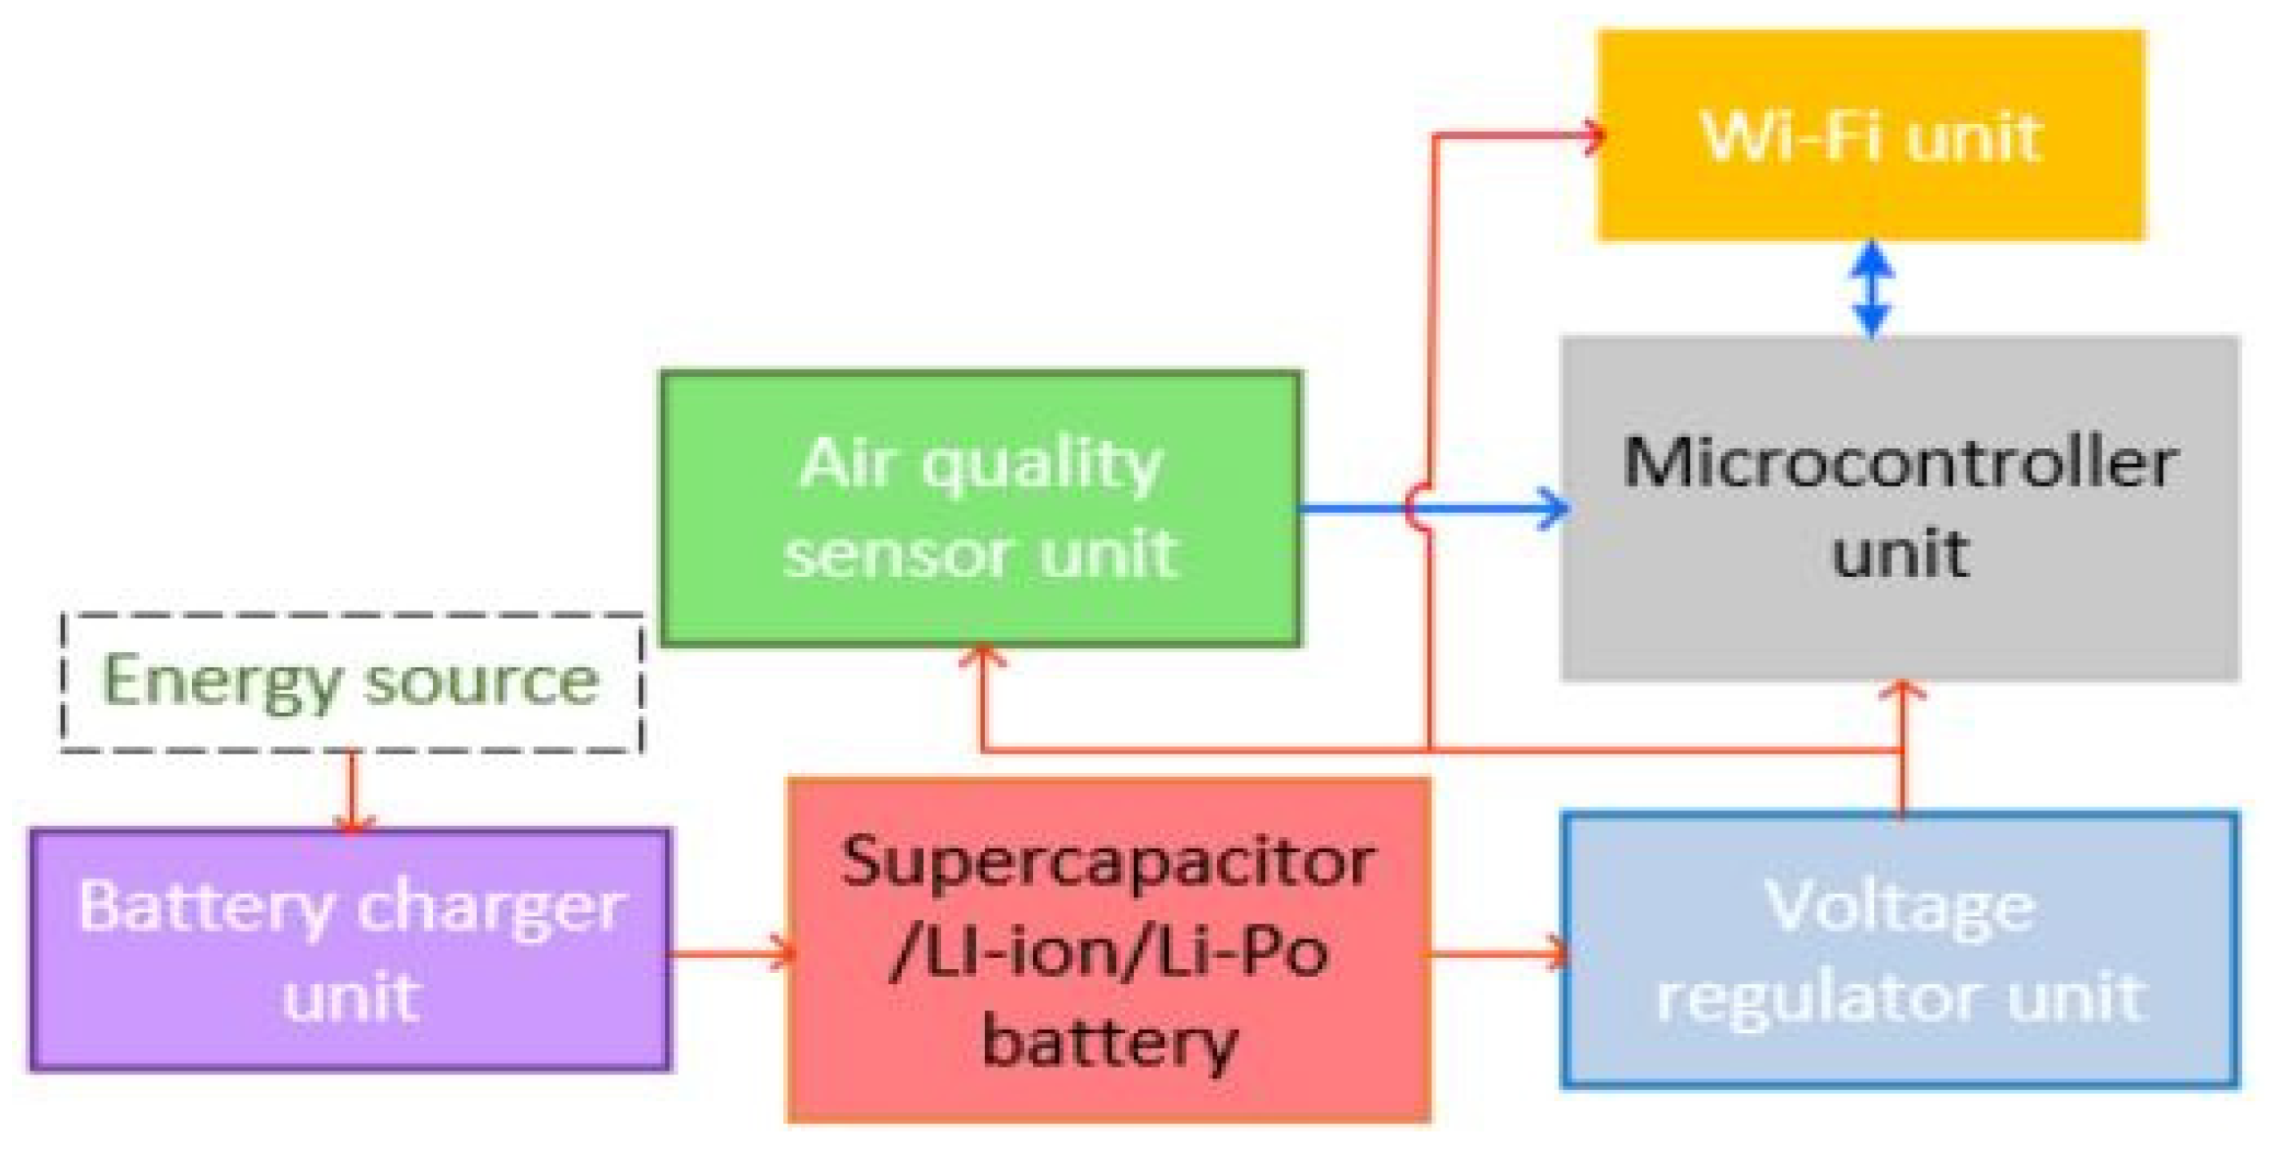
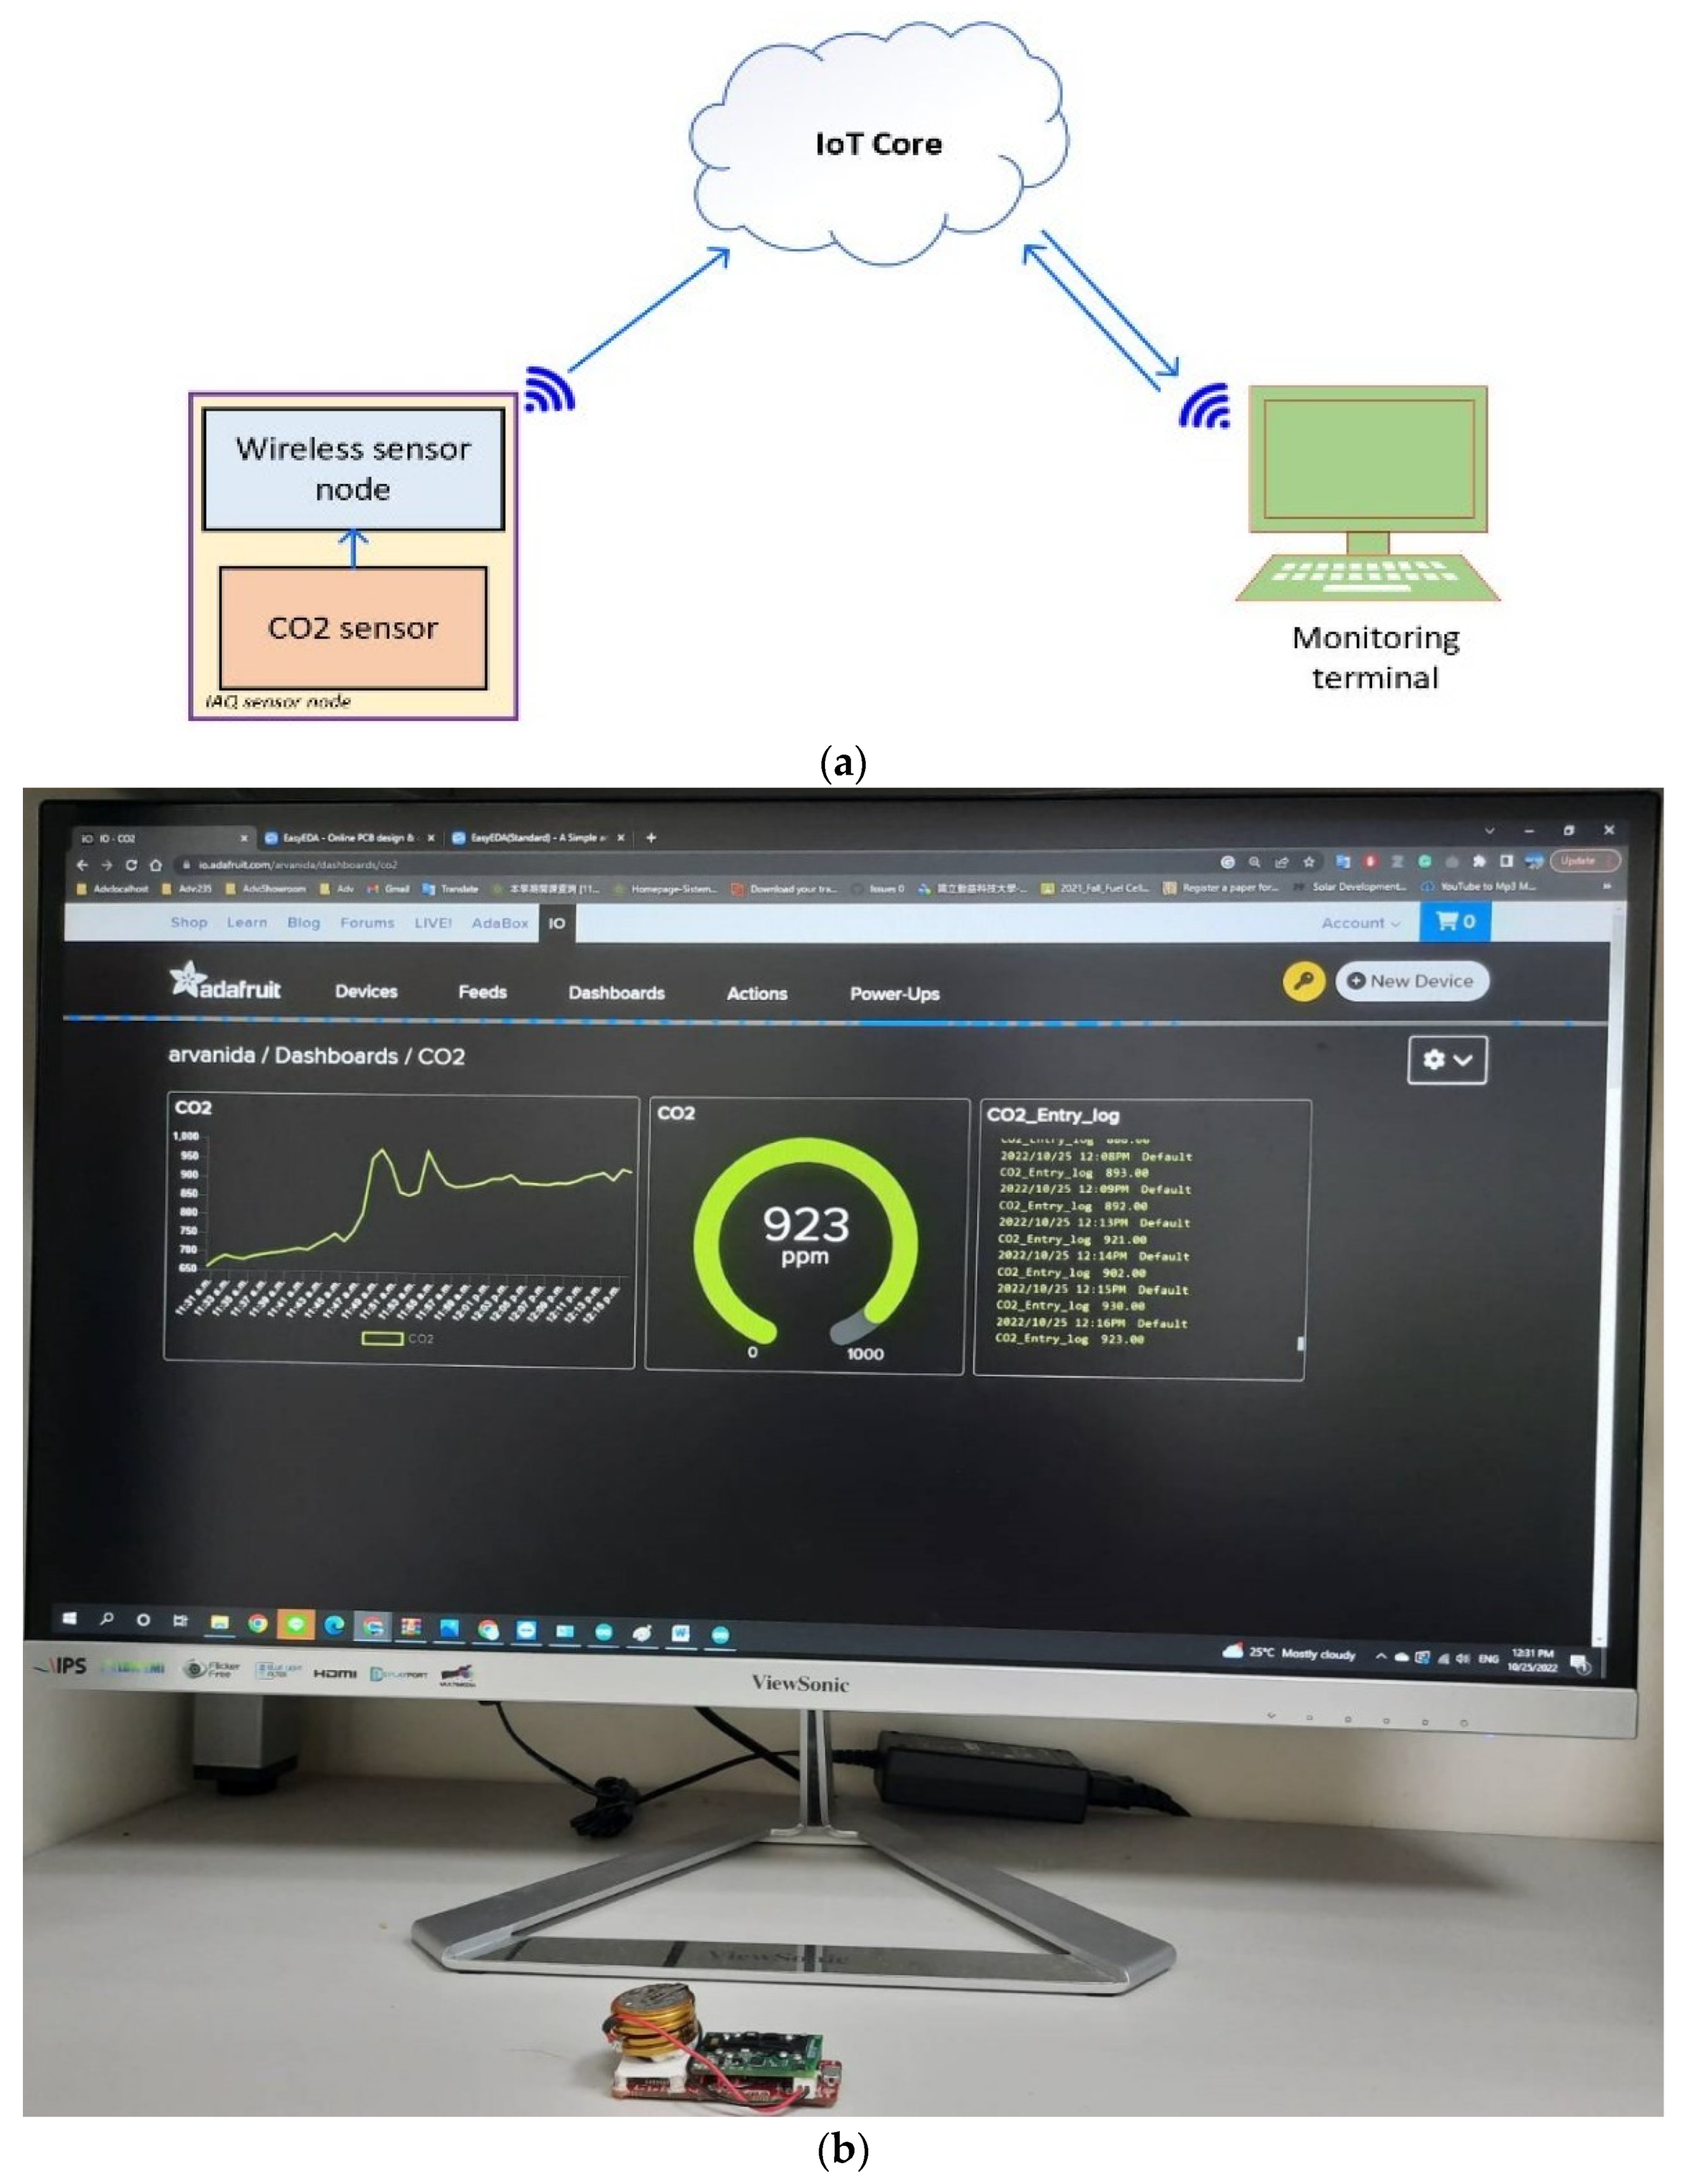
2.3.1. Design Overview
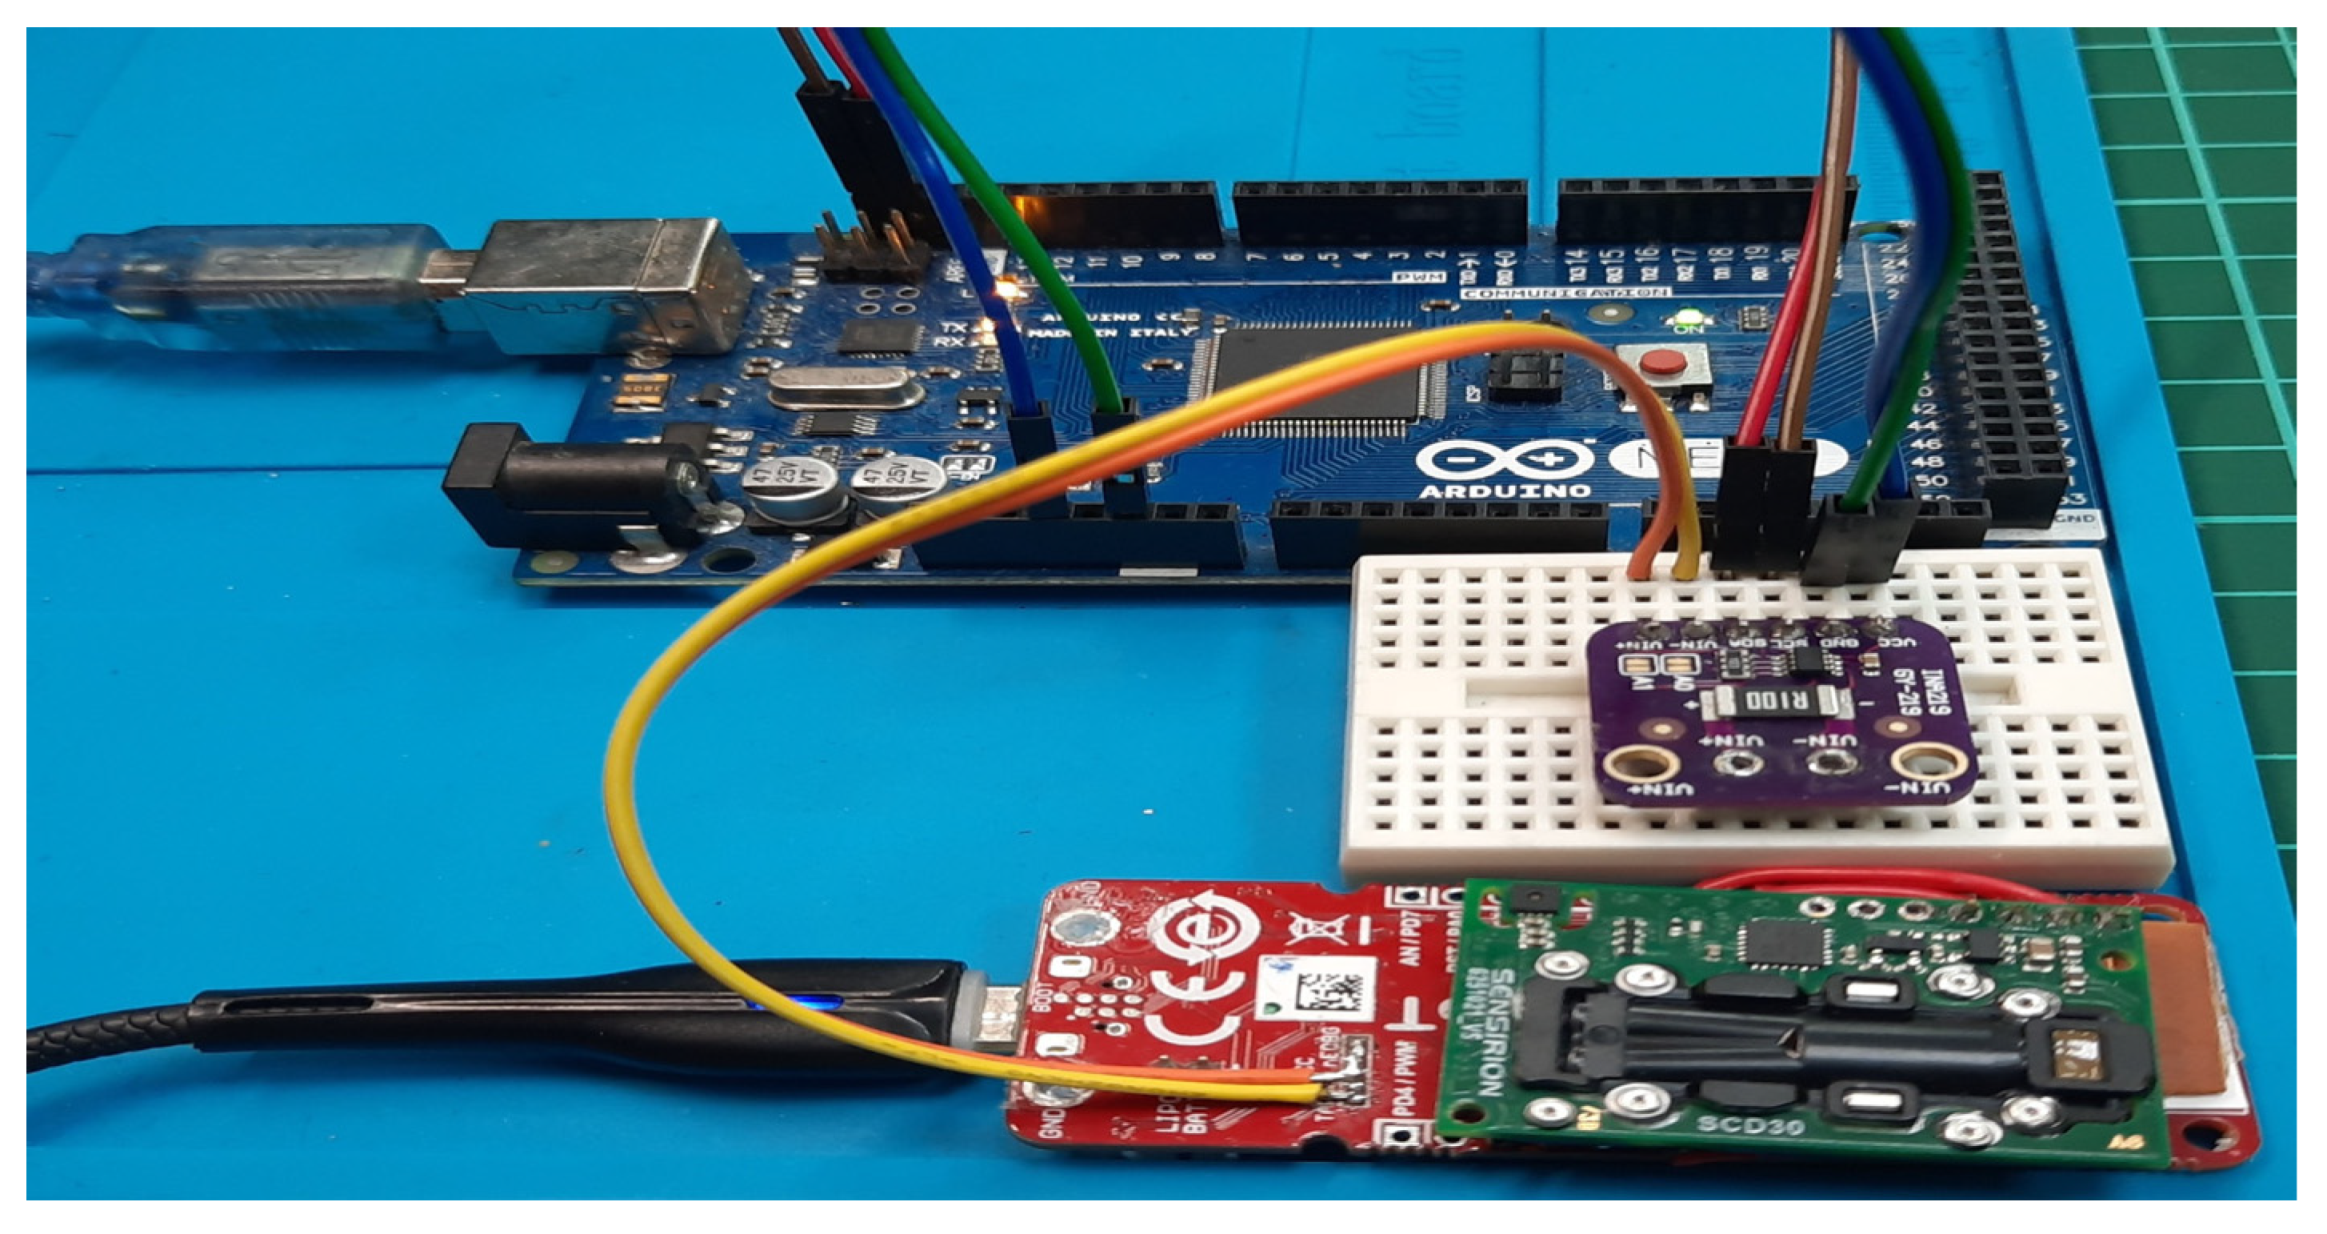
2.3.2. Hardware Design
- A.
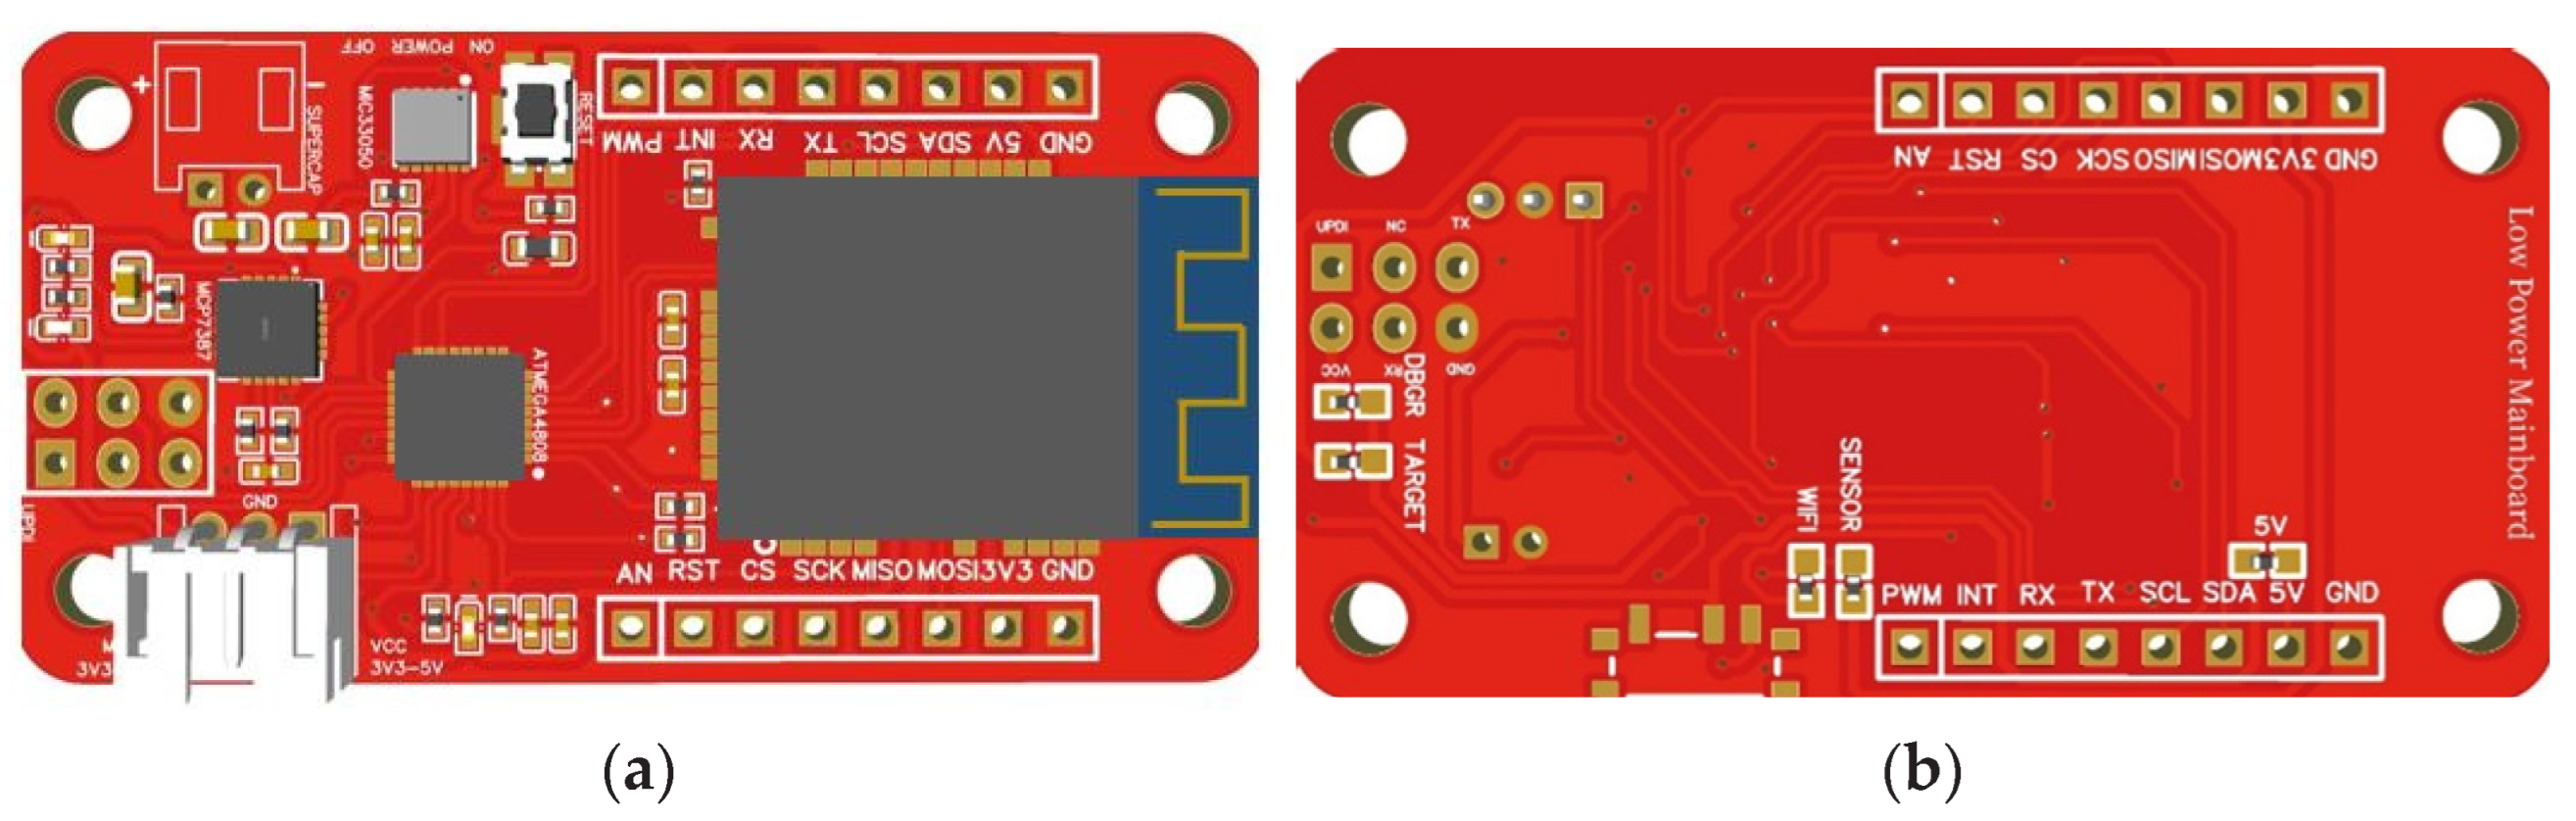
- Main Board
- B.
- Microcontroller
- C.
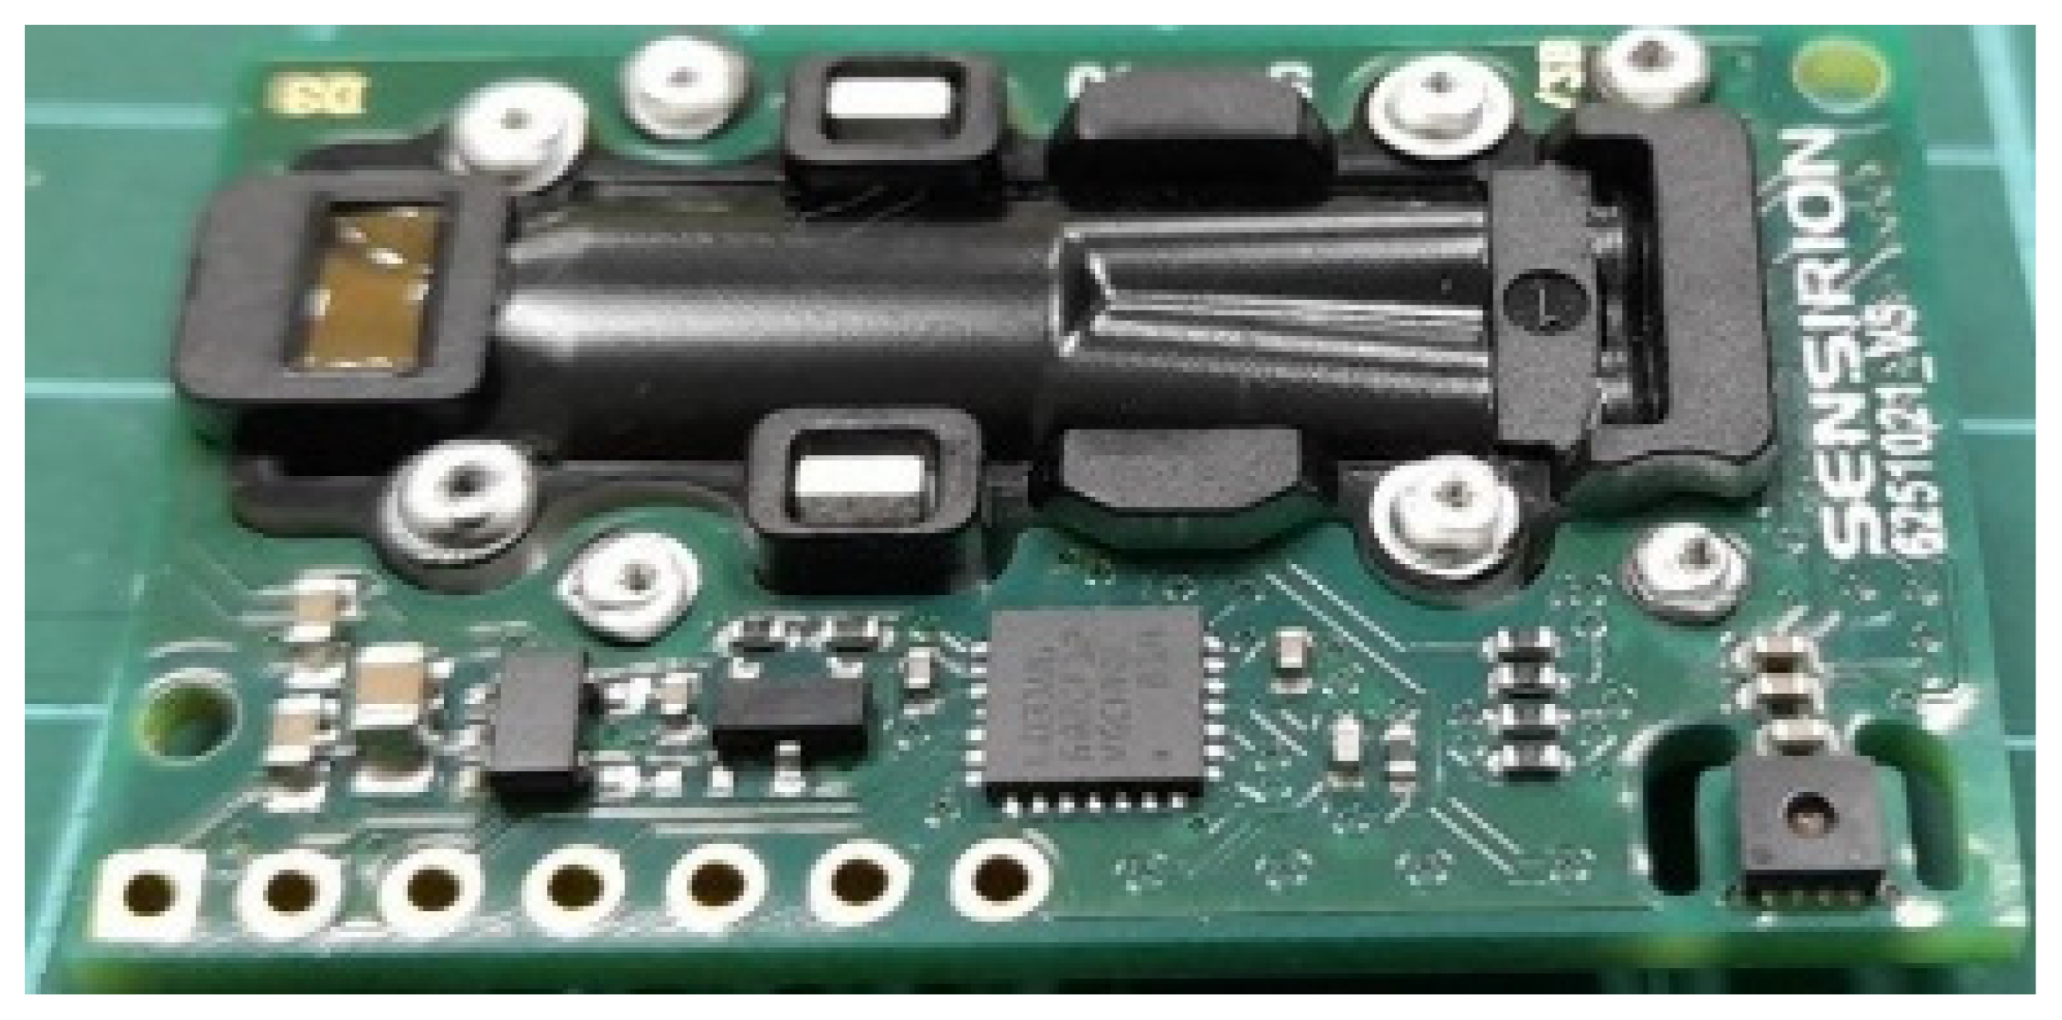
- CO2 sensor module
- D.
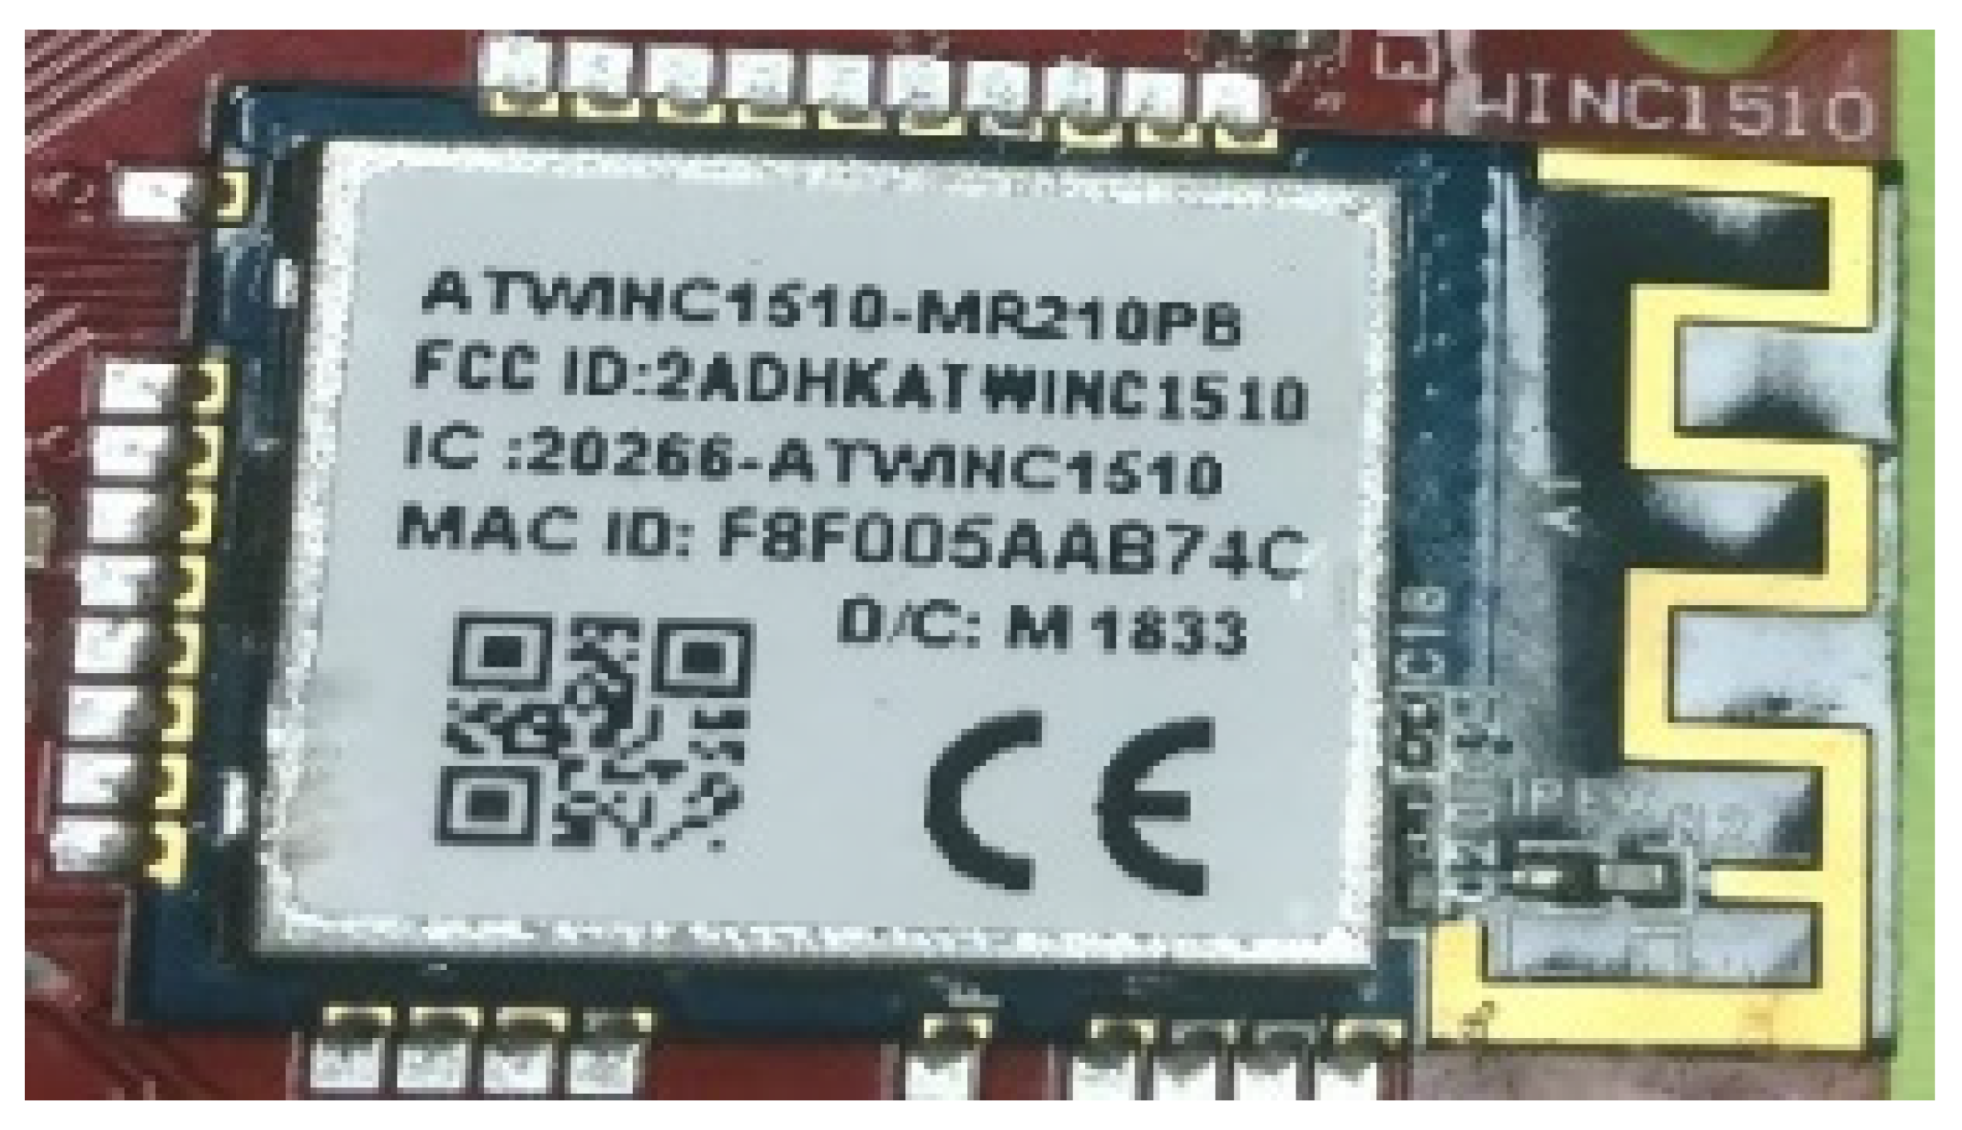
- Wi-Fi Module
- E.
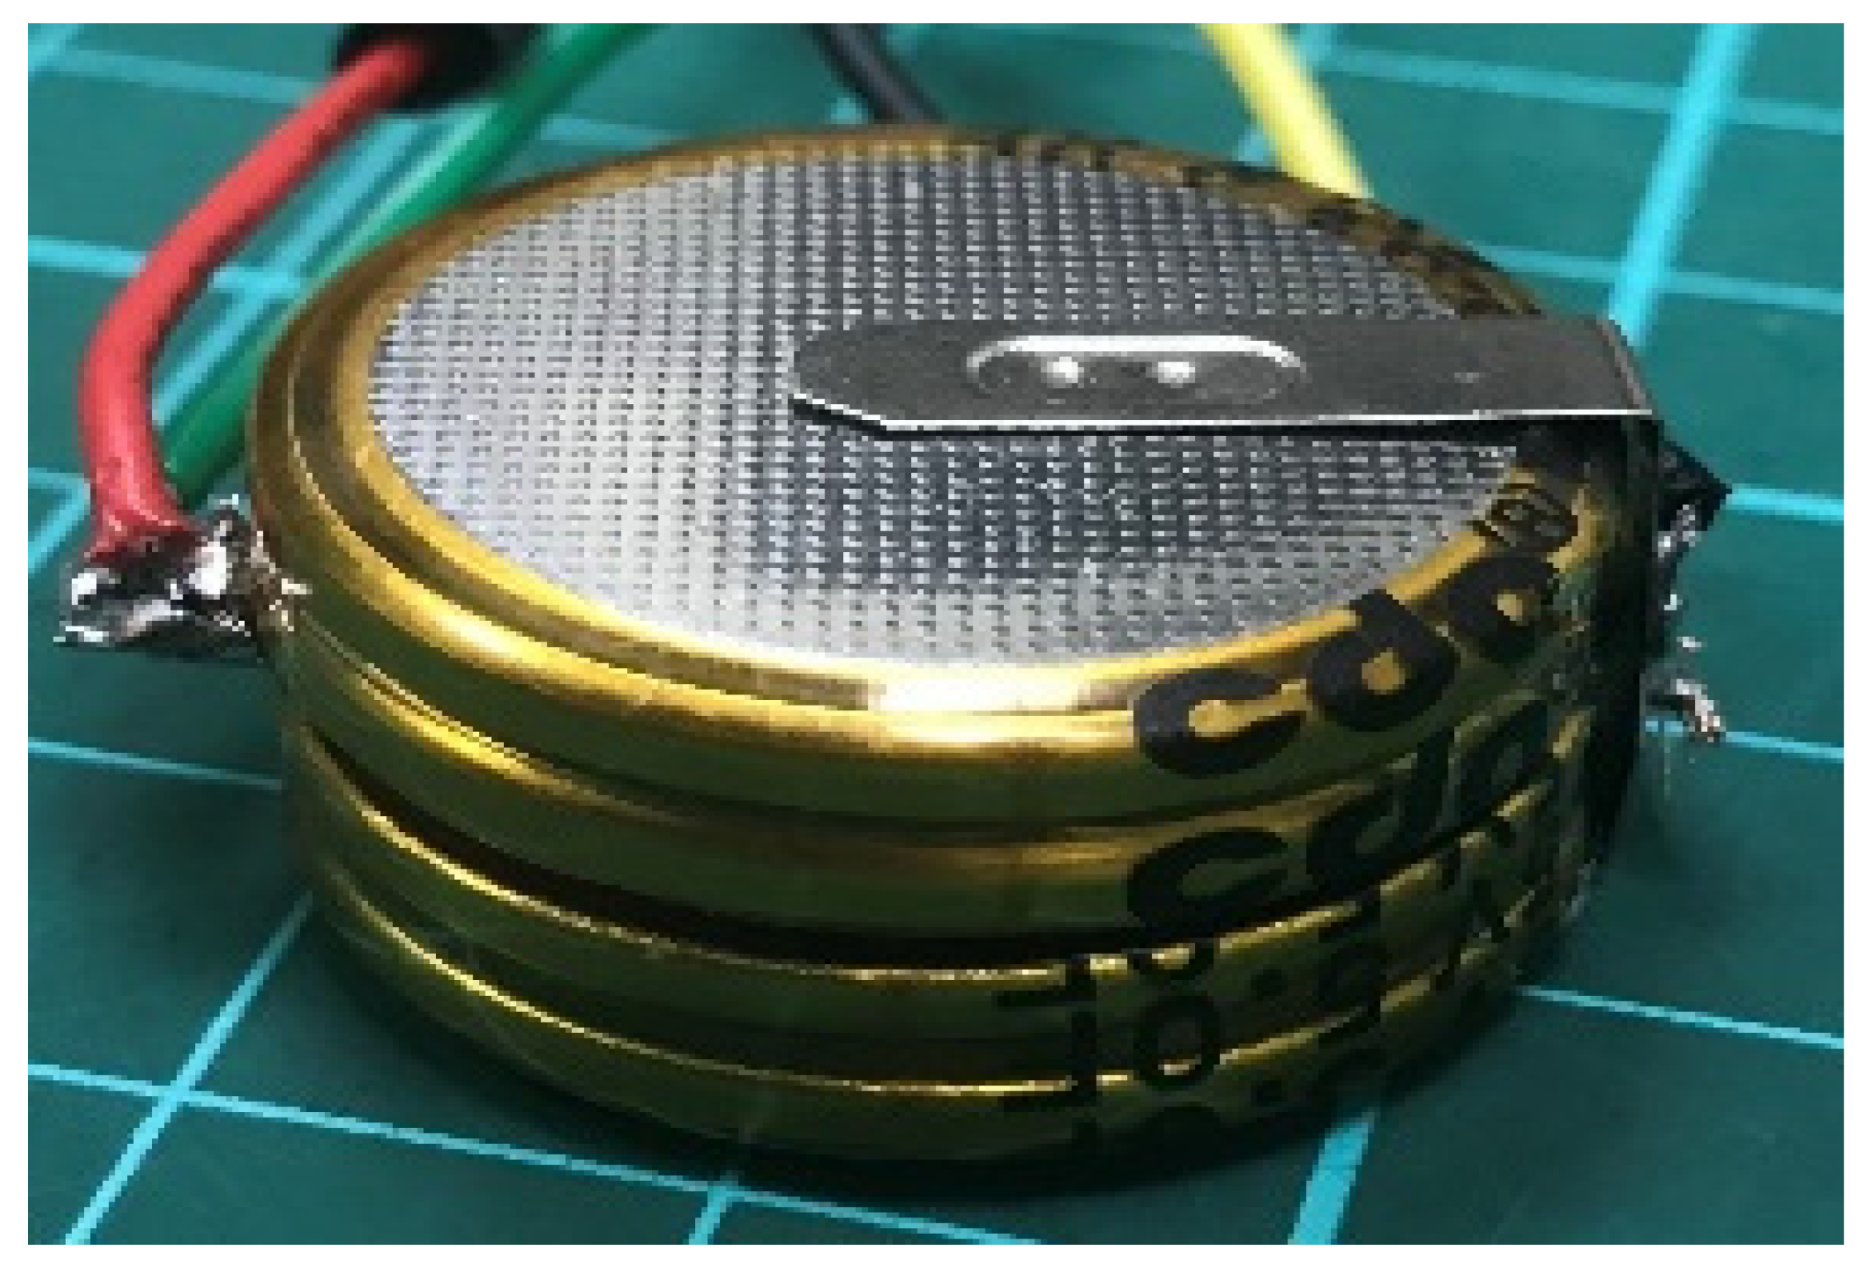
- Power storage
2.3.3. Software Development
3. Result and Discussion
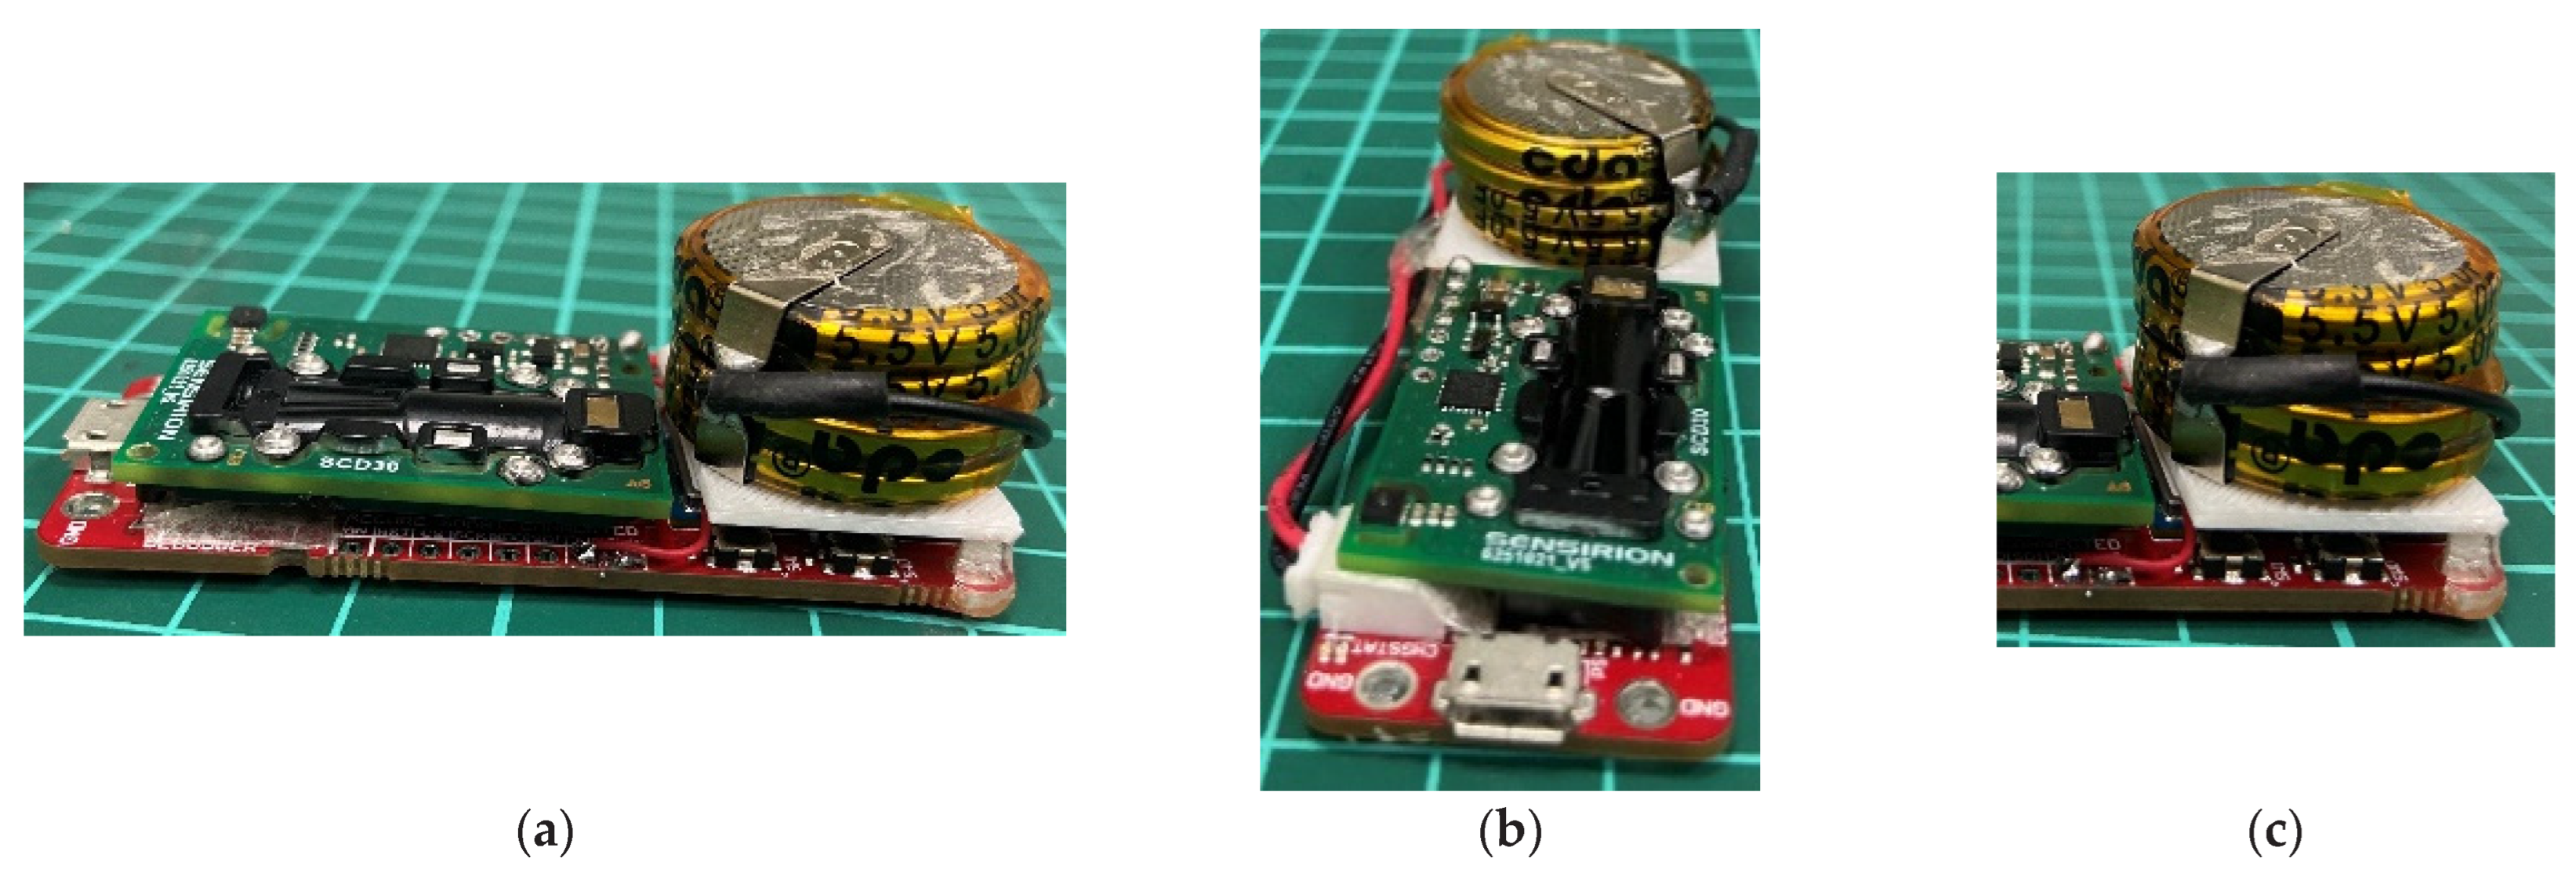
3.1. Device Implementation
| Algorithm 1 The logical flow of CO2 measurement. |
| Start program while sensor node power is ON. |
| Initialization |
| Wi-Fi/internet connection. |
| If Wi-Fi is connected successfully: Start CO2 data sensing, CO2 data processing, CO2 data transmission, Presenting CO2 data on Adafruit dashboard, Logging CO2 data, Sleep mode until interval time is achieved. |
|
Or Else: Retry Wi-Fi/internet connection. Return to repeat measuring data. |
| Stop program while sensor node power is OFF. |
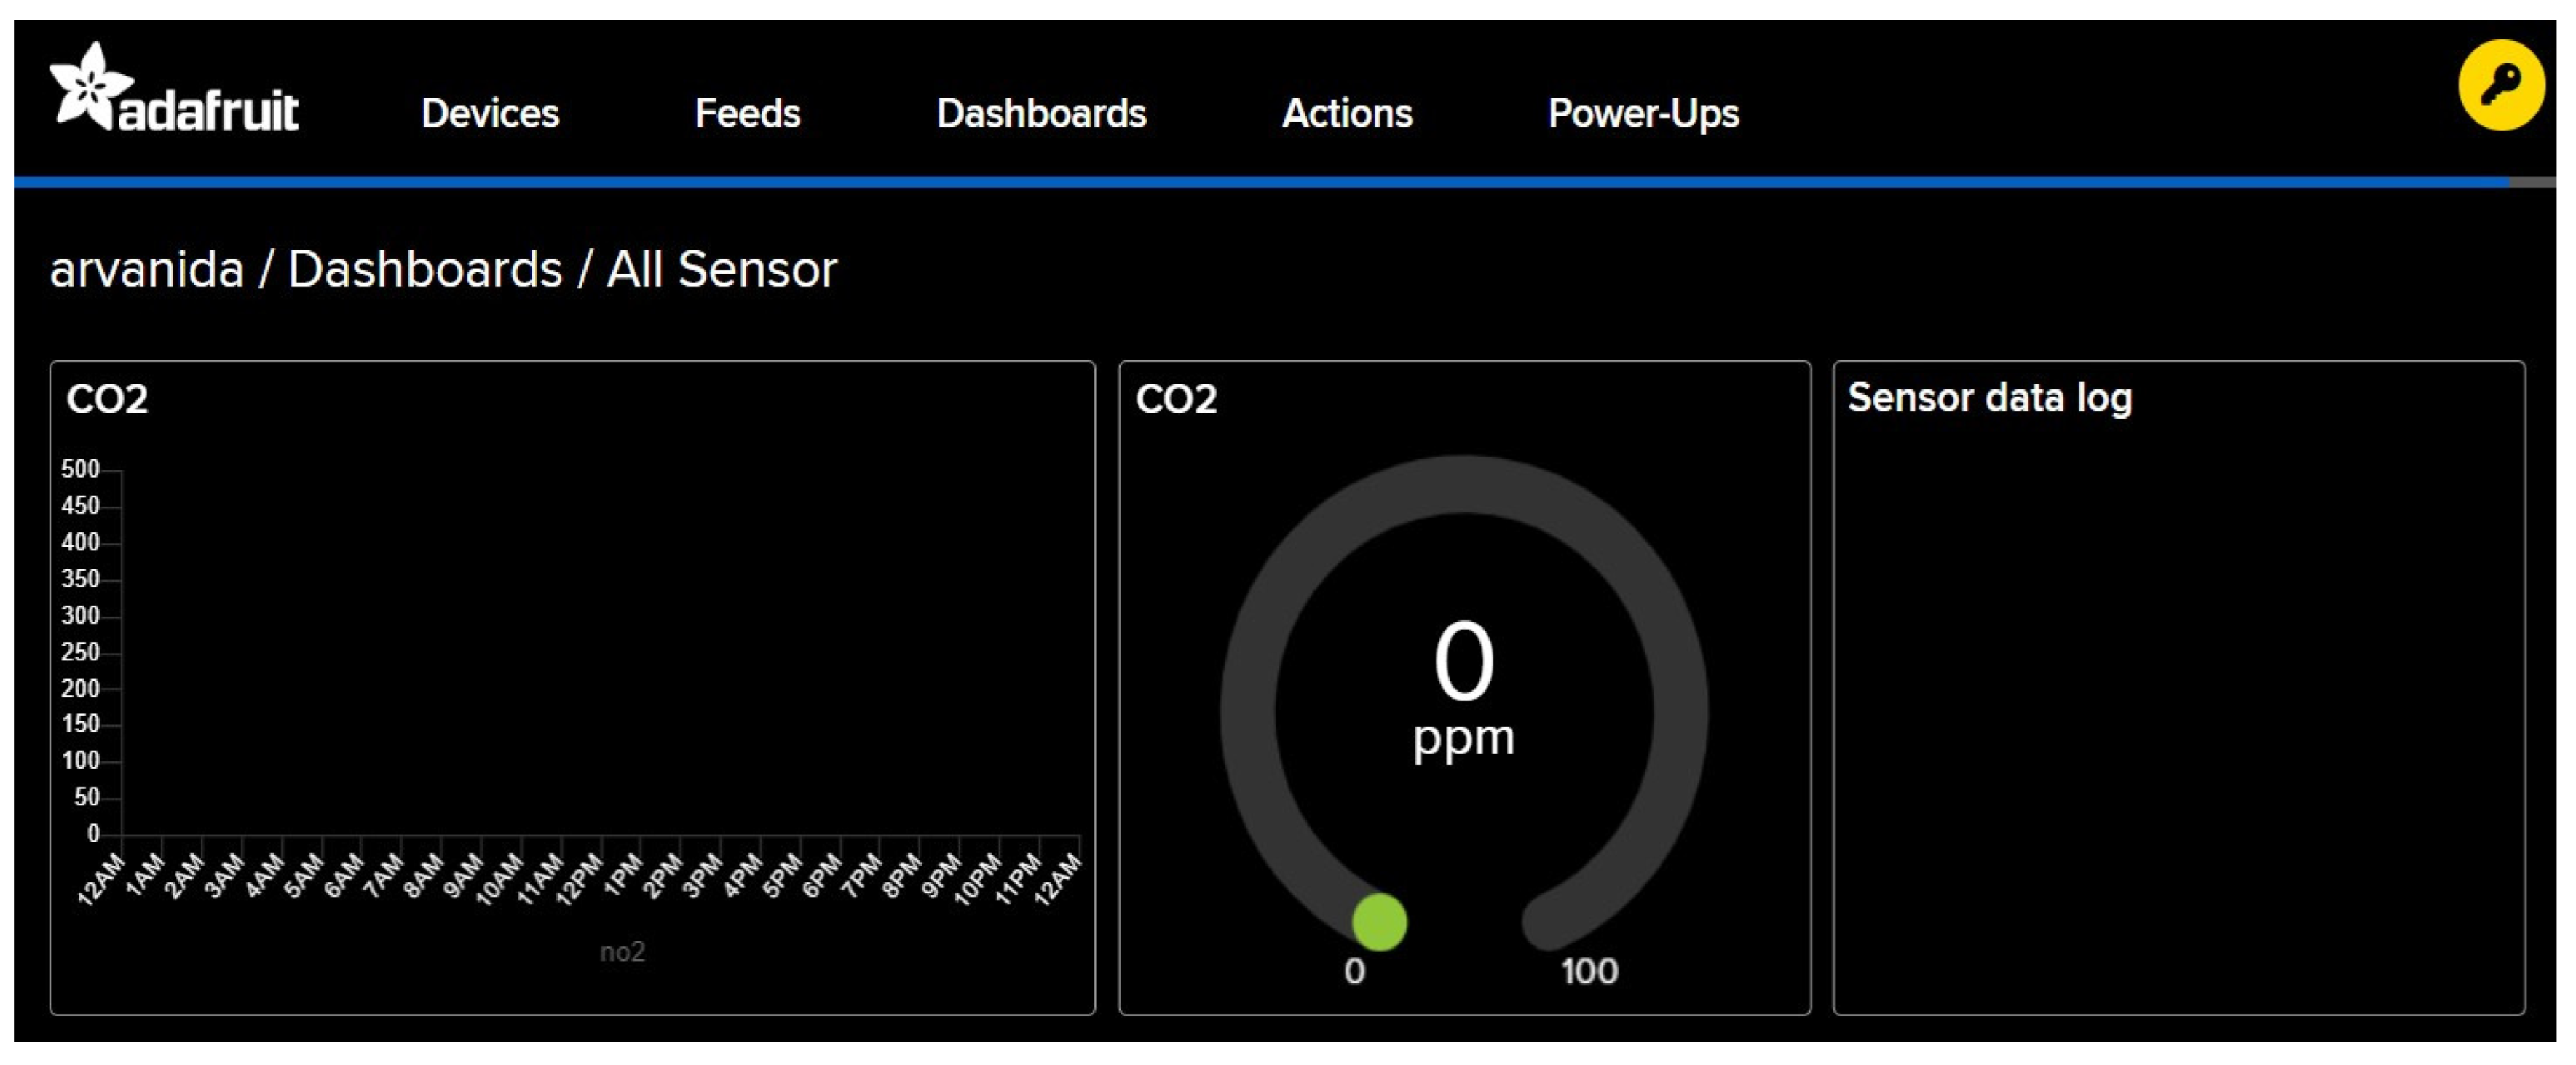
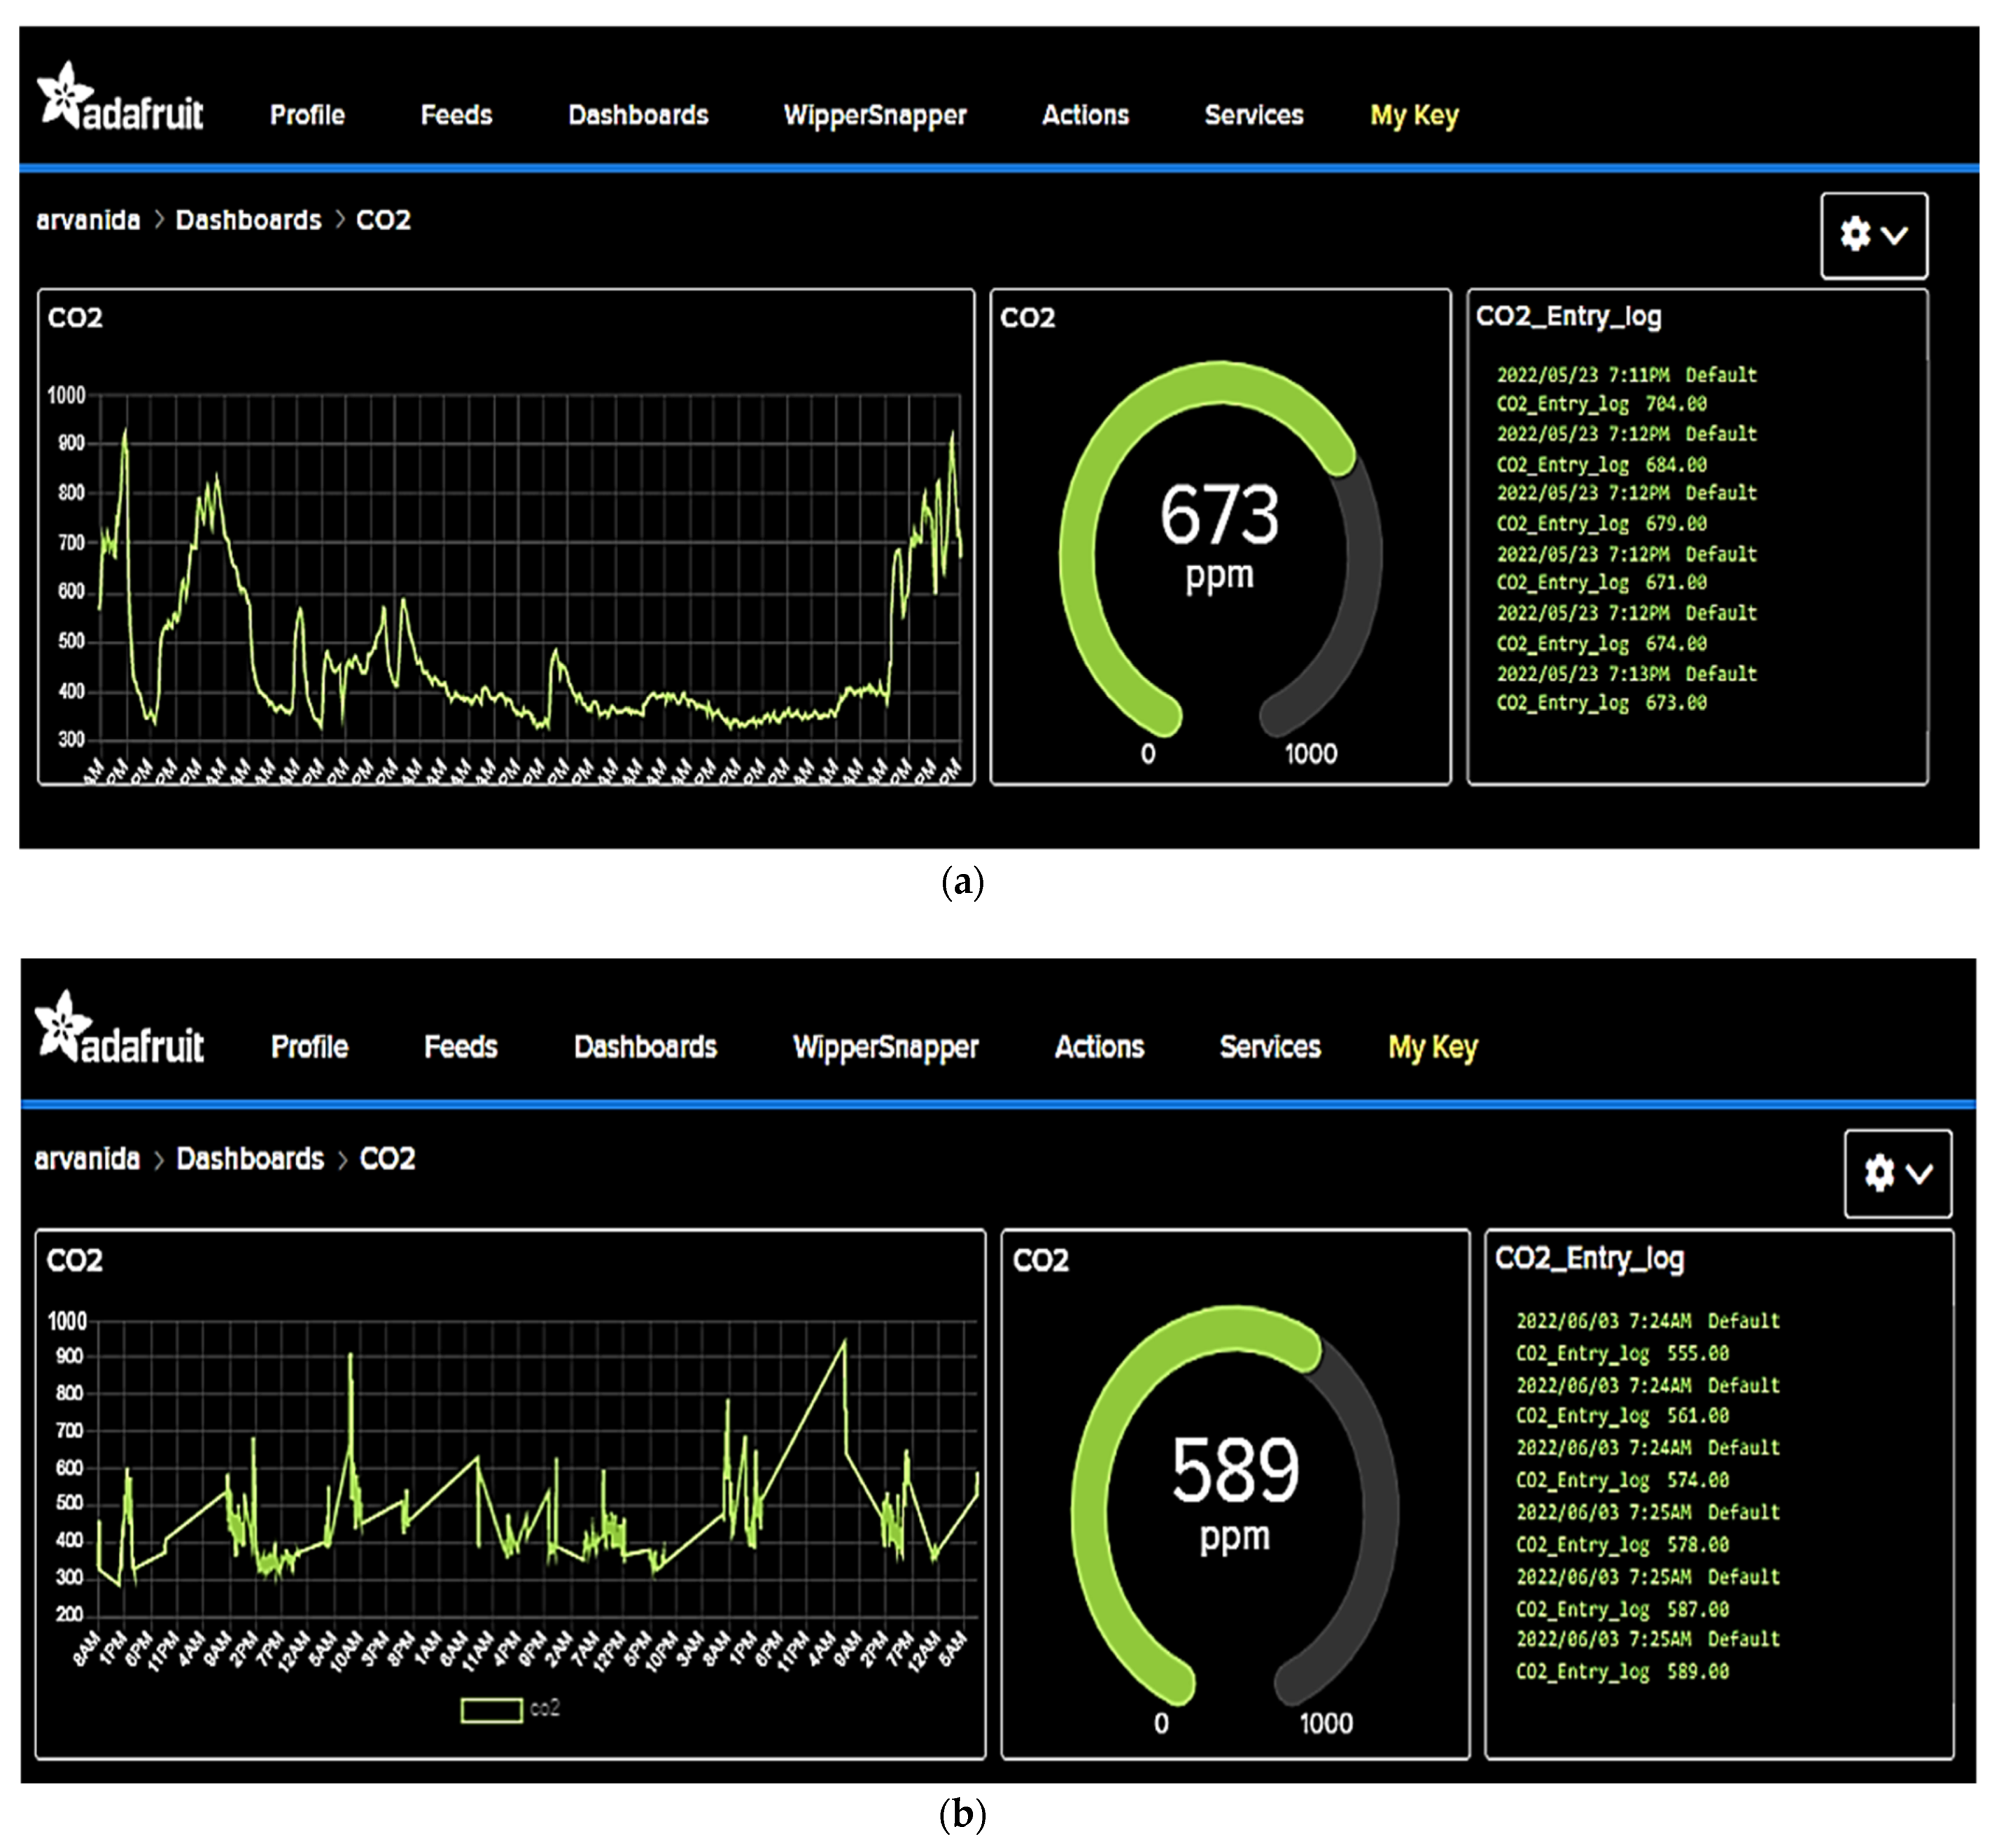
3.2. Graphical User Interface (GUI)
3.3. Functionality Validation Testing
3.4. Calibration
3.4.1. CO2 Concentration Measurement
3.4.2. Calibration Correction Factor Calculation
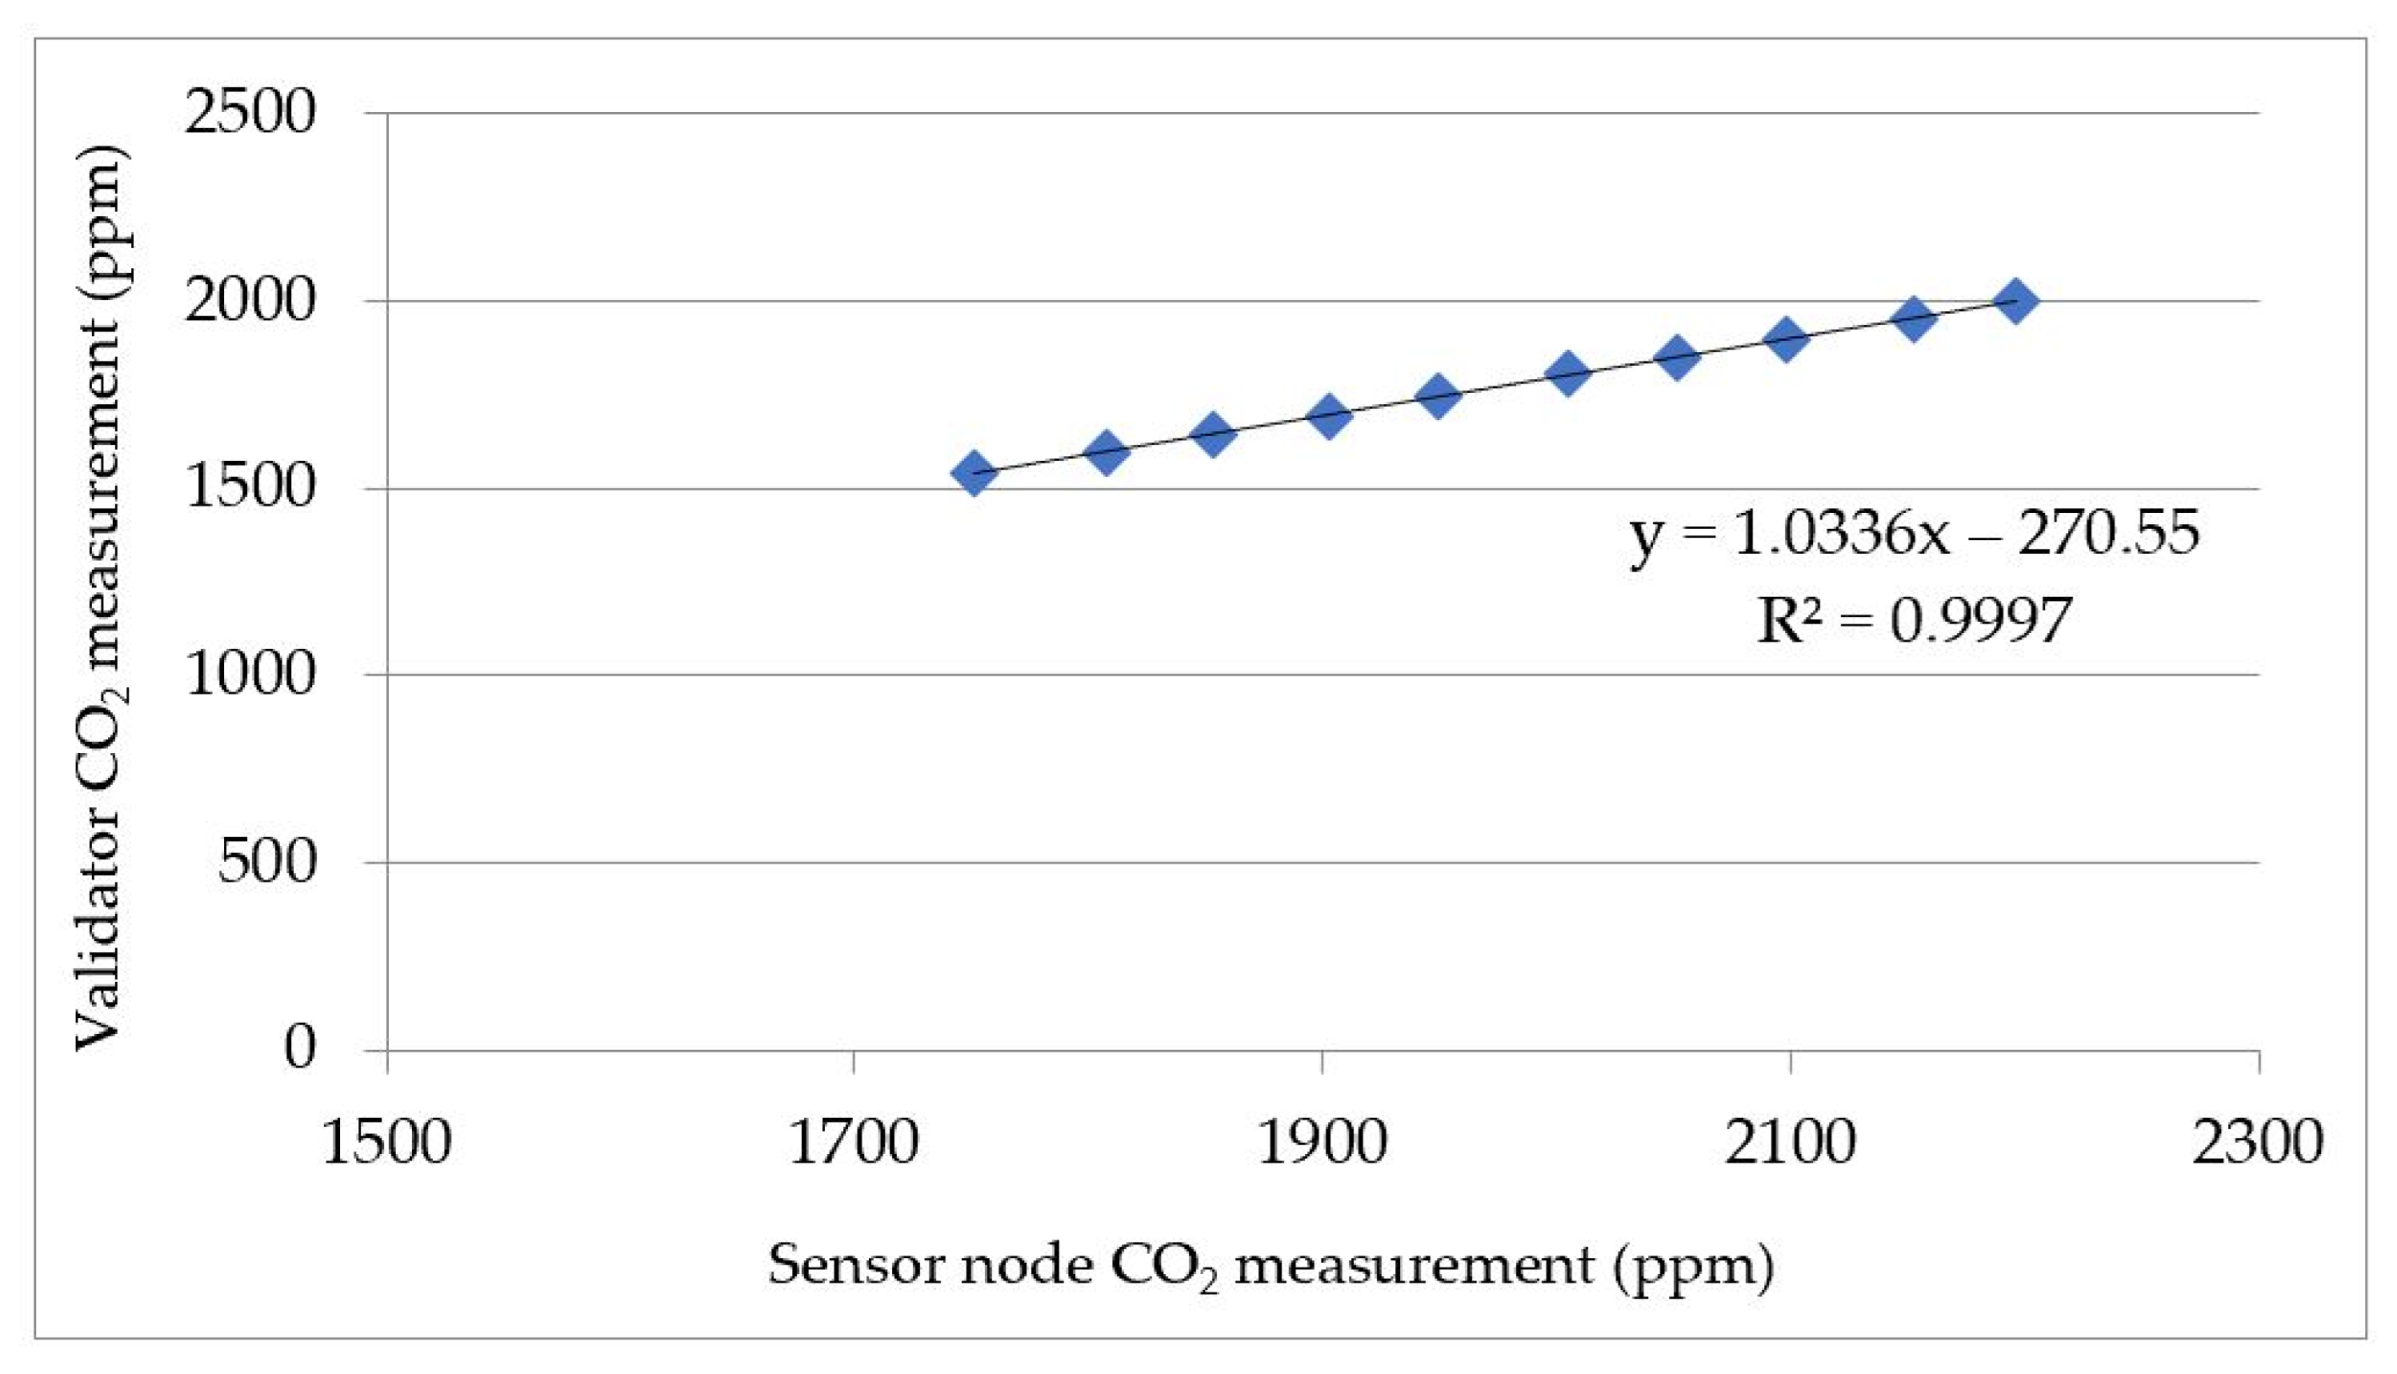
3.4.3. Validation
3.5. Power Capacity Measurement
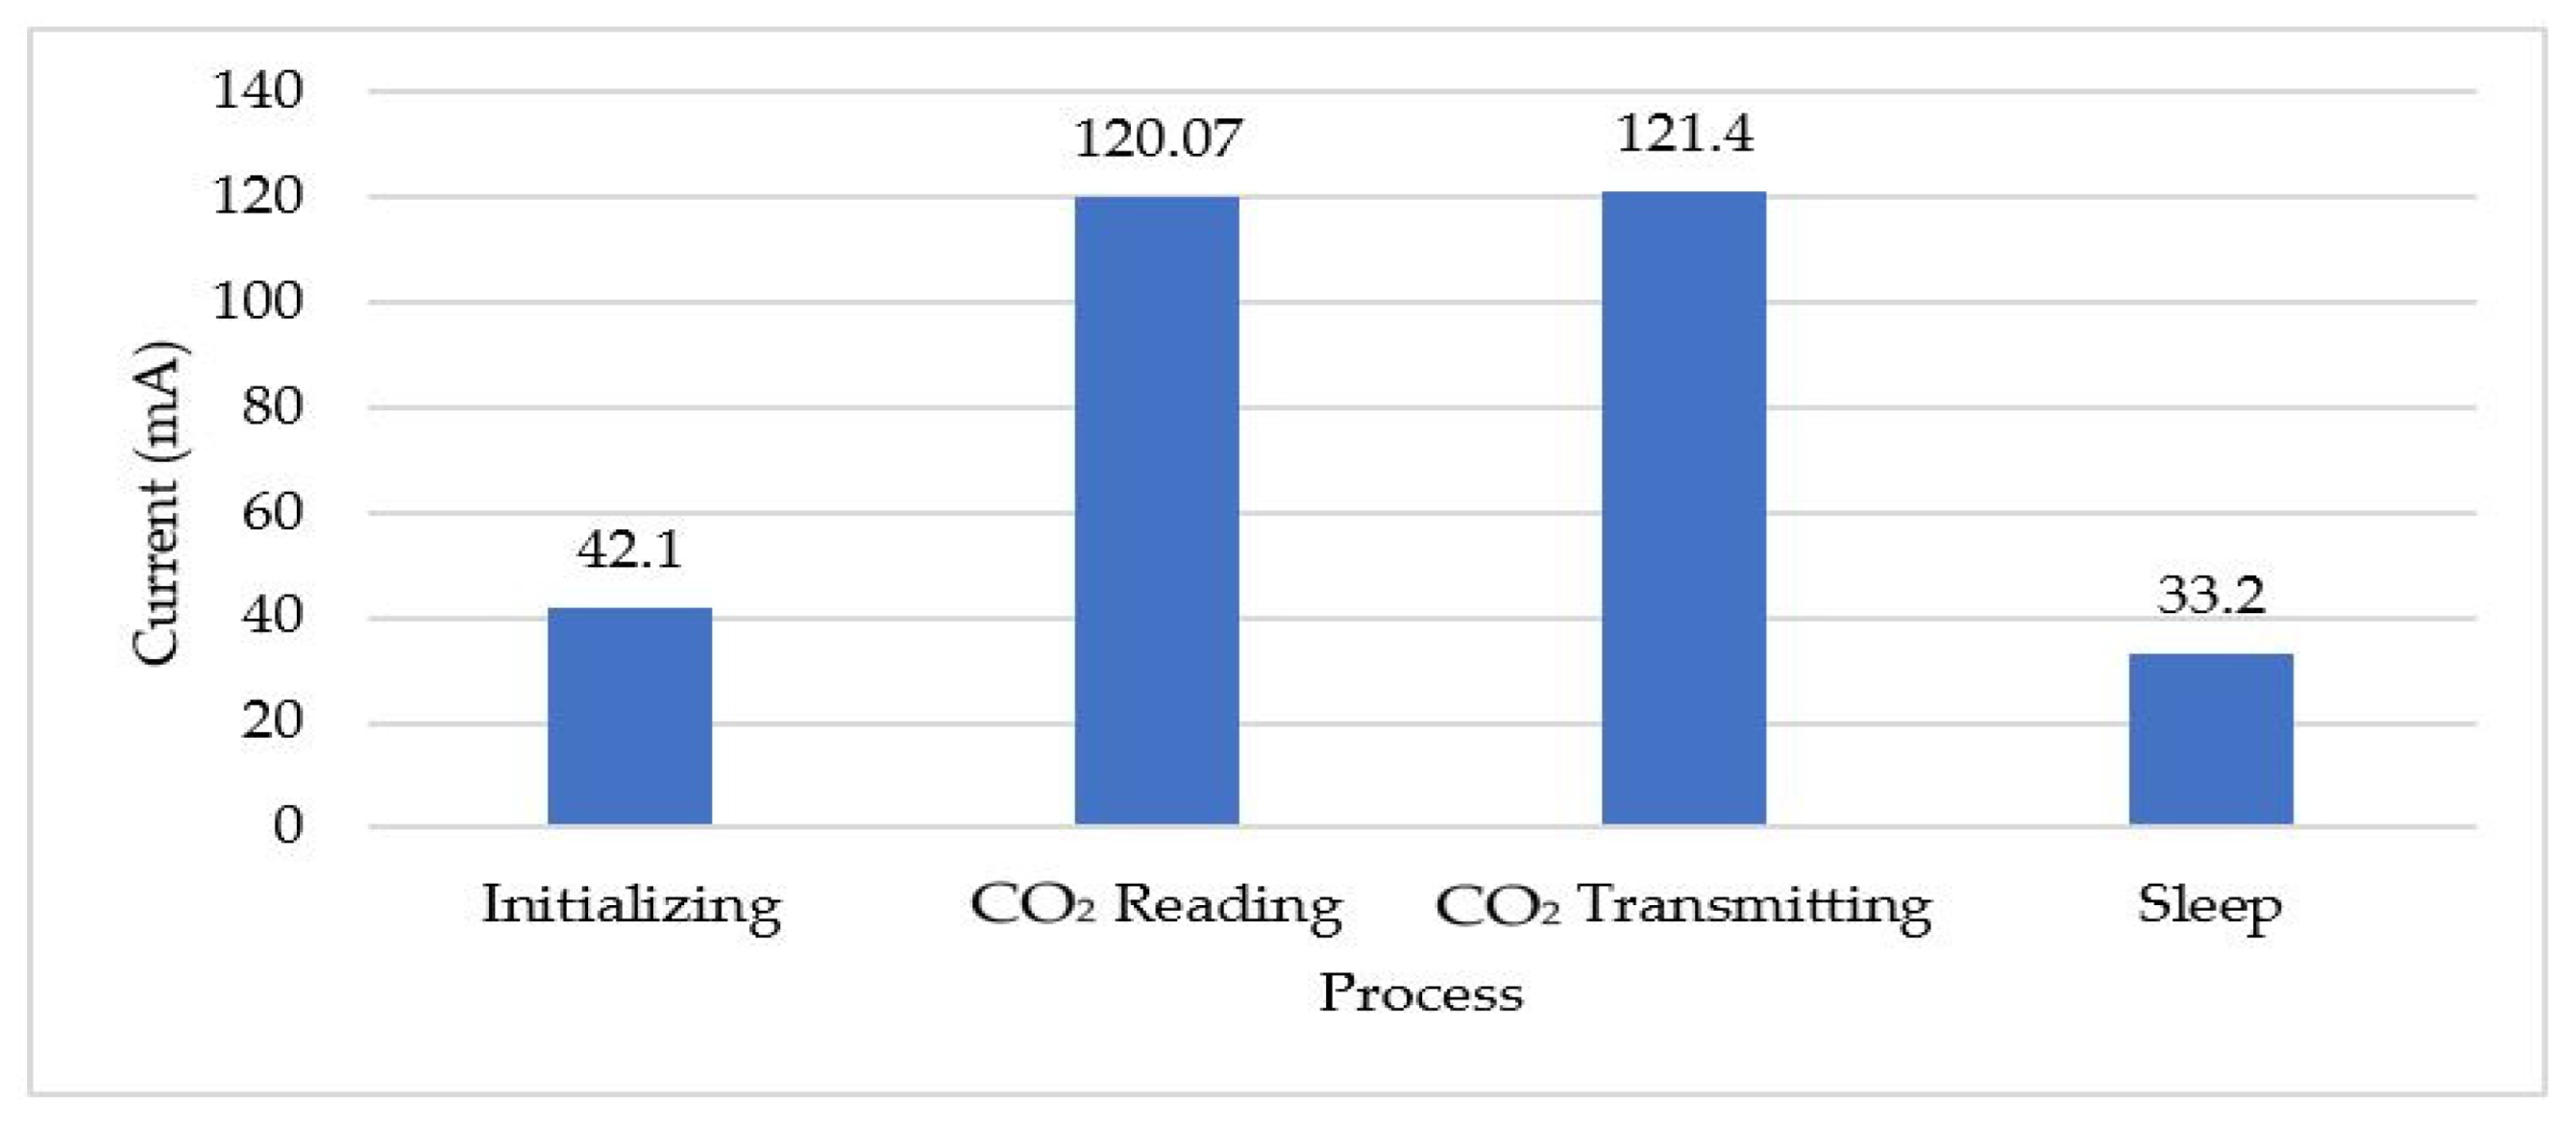
3.5.1. Current Measurement
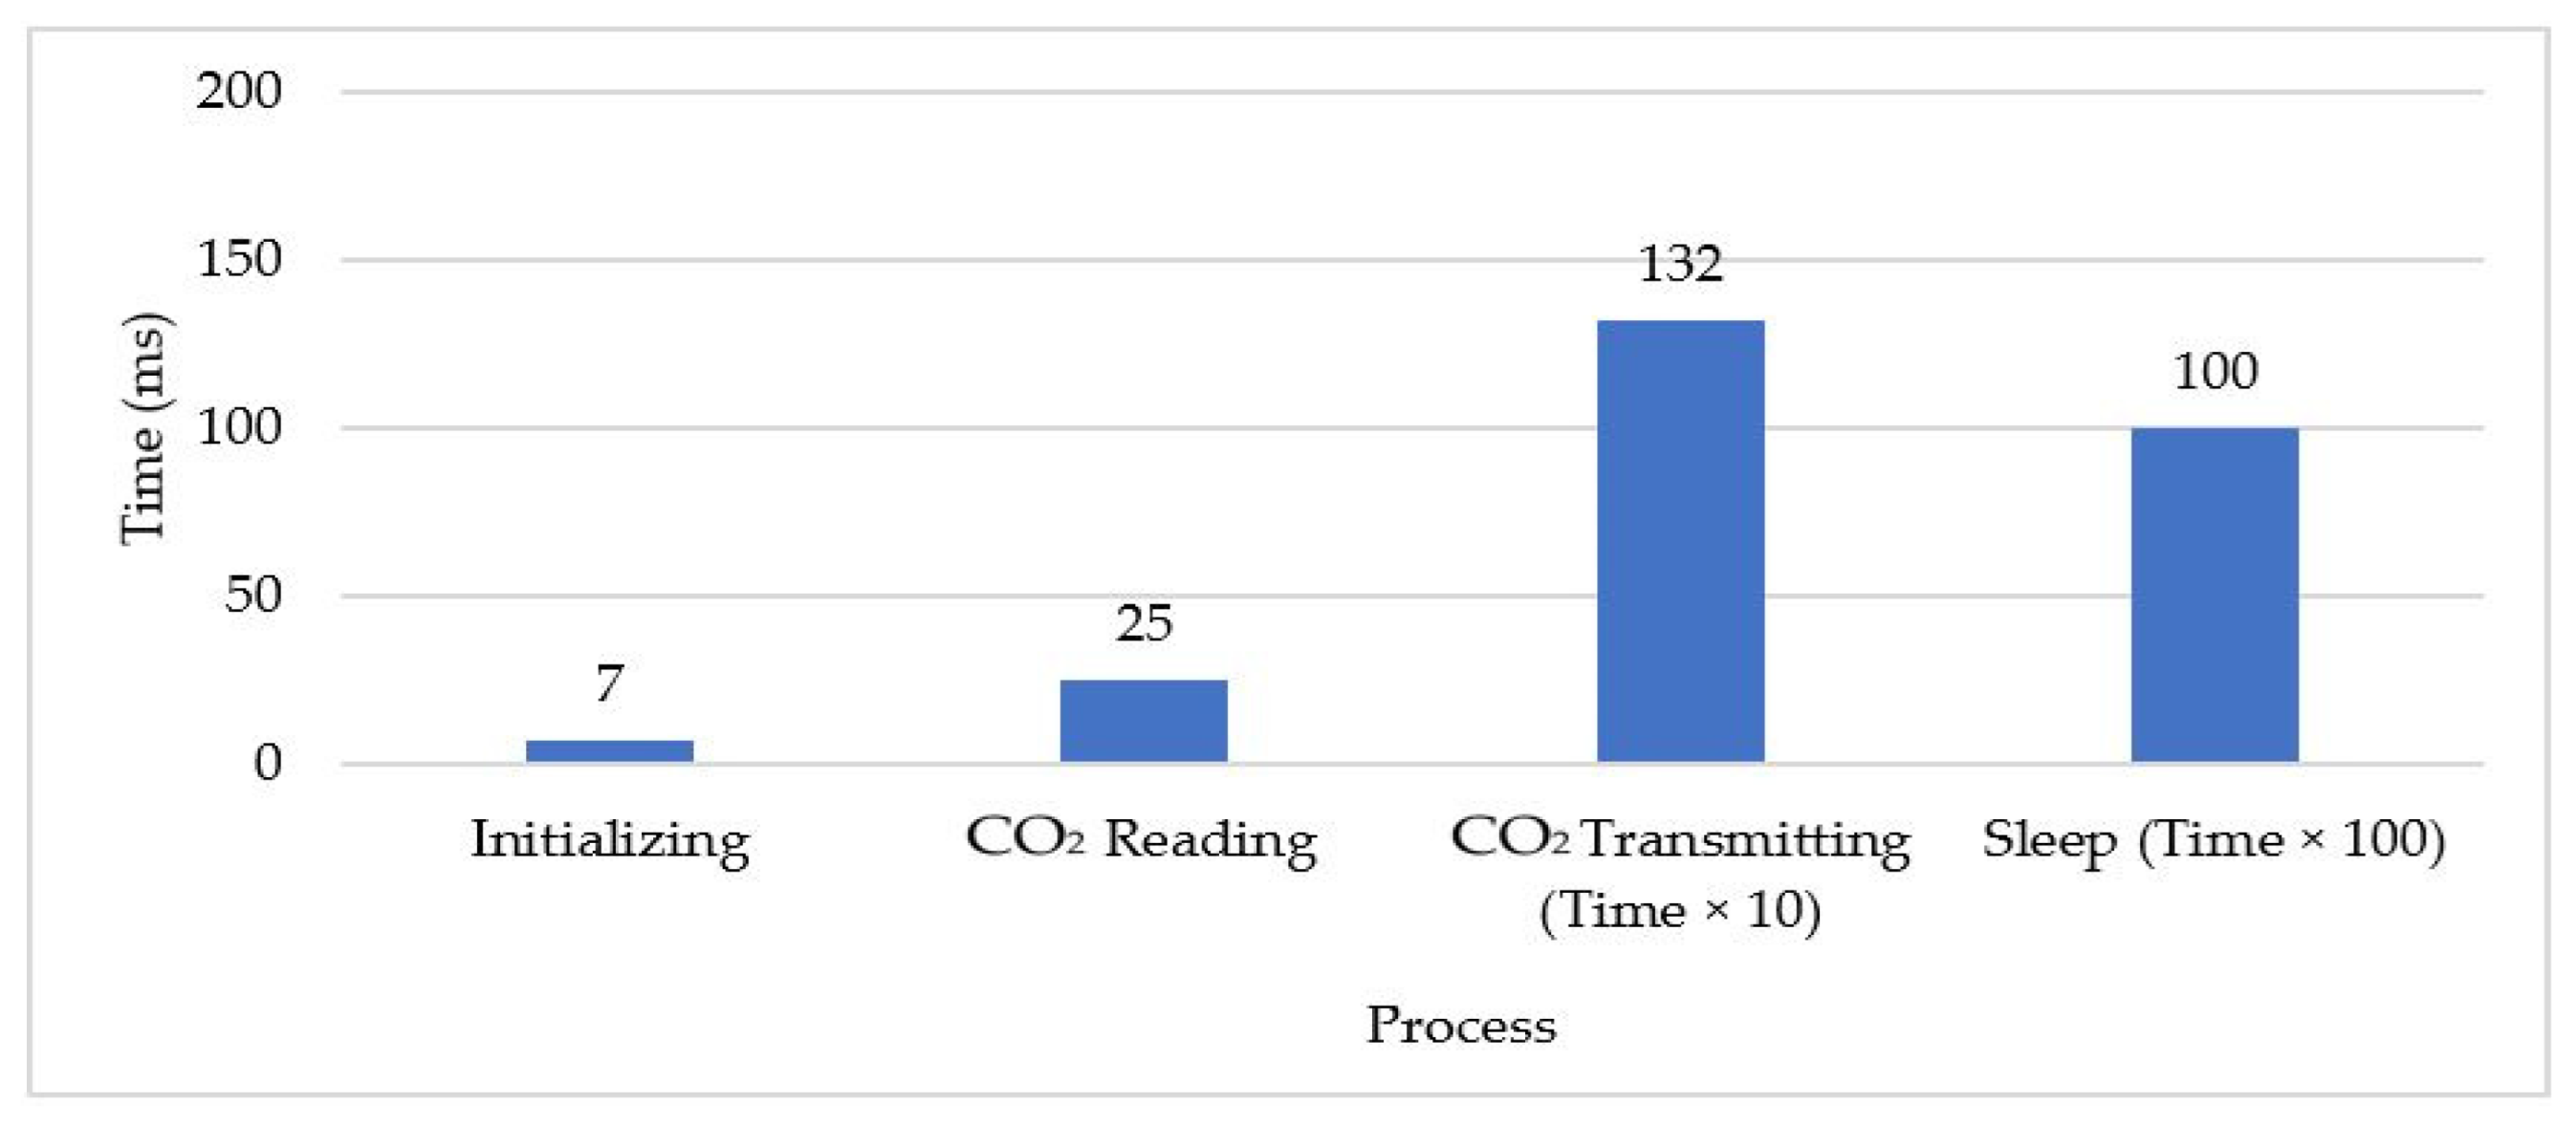
3.5.2. Time Consumption
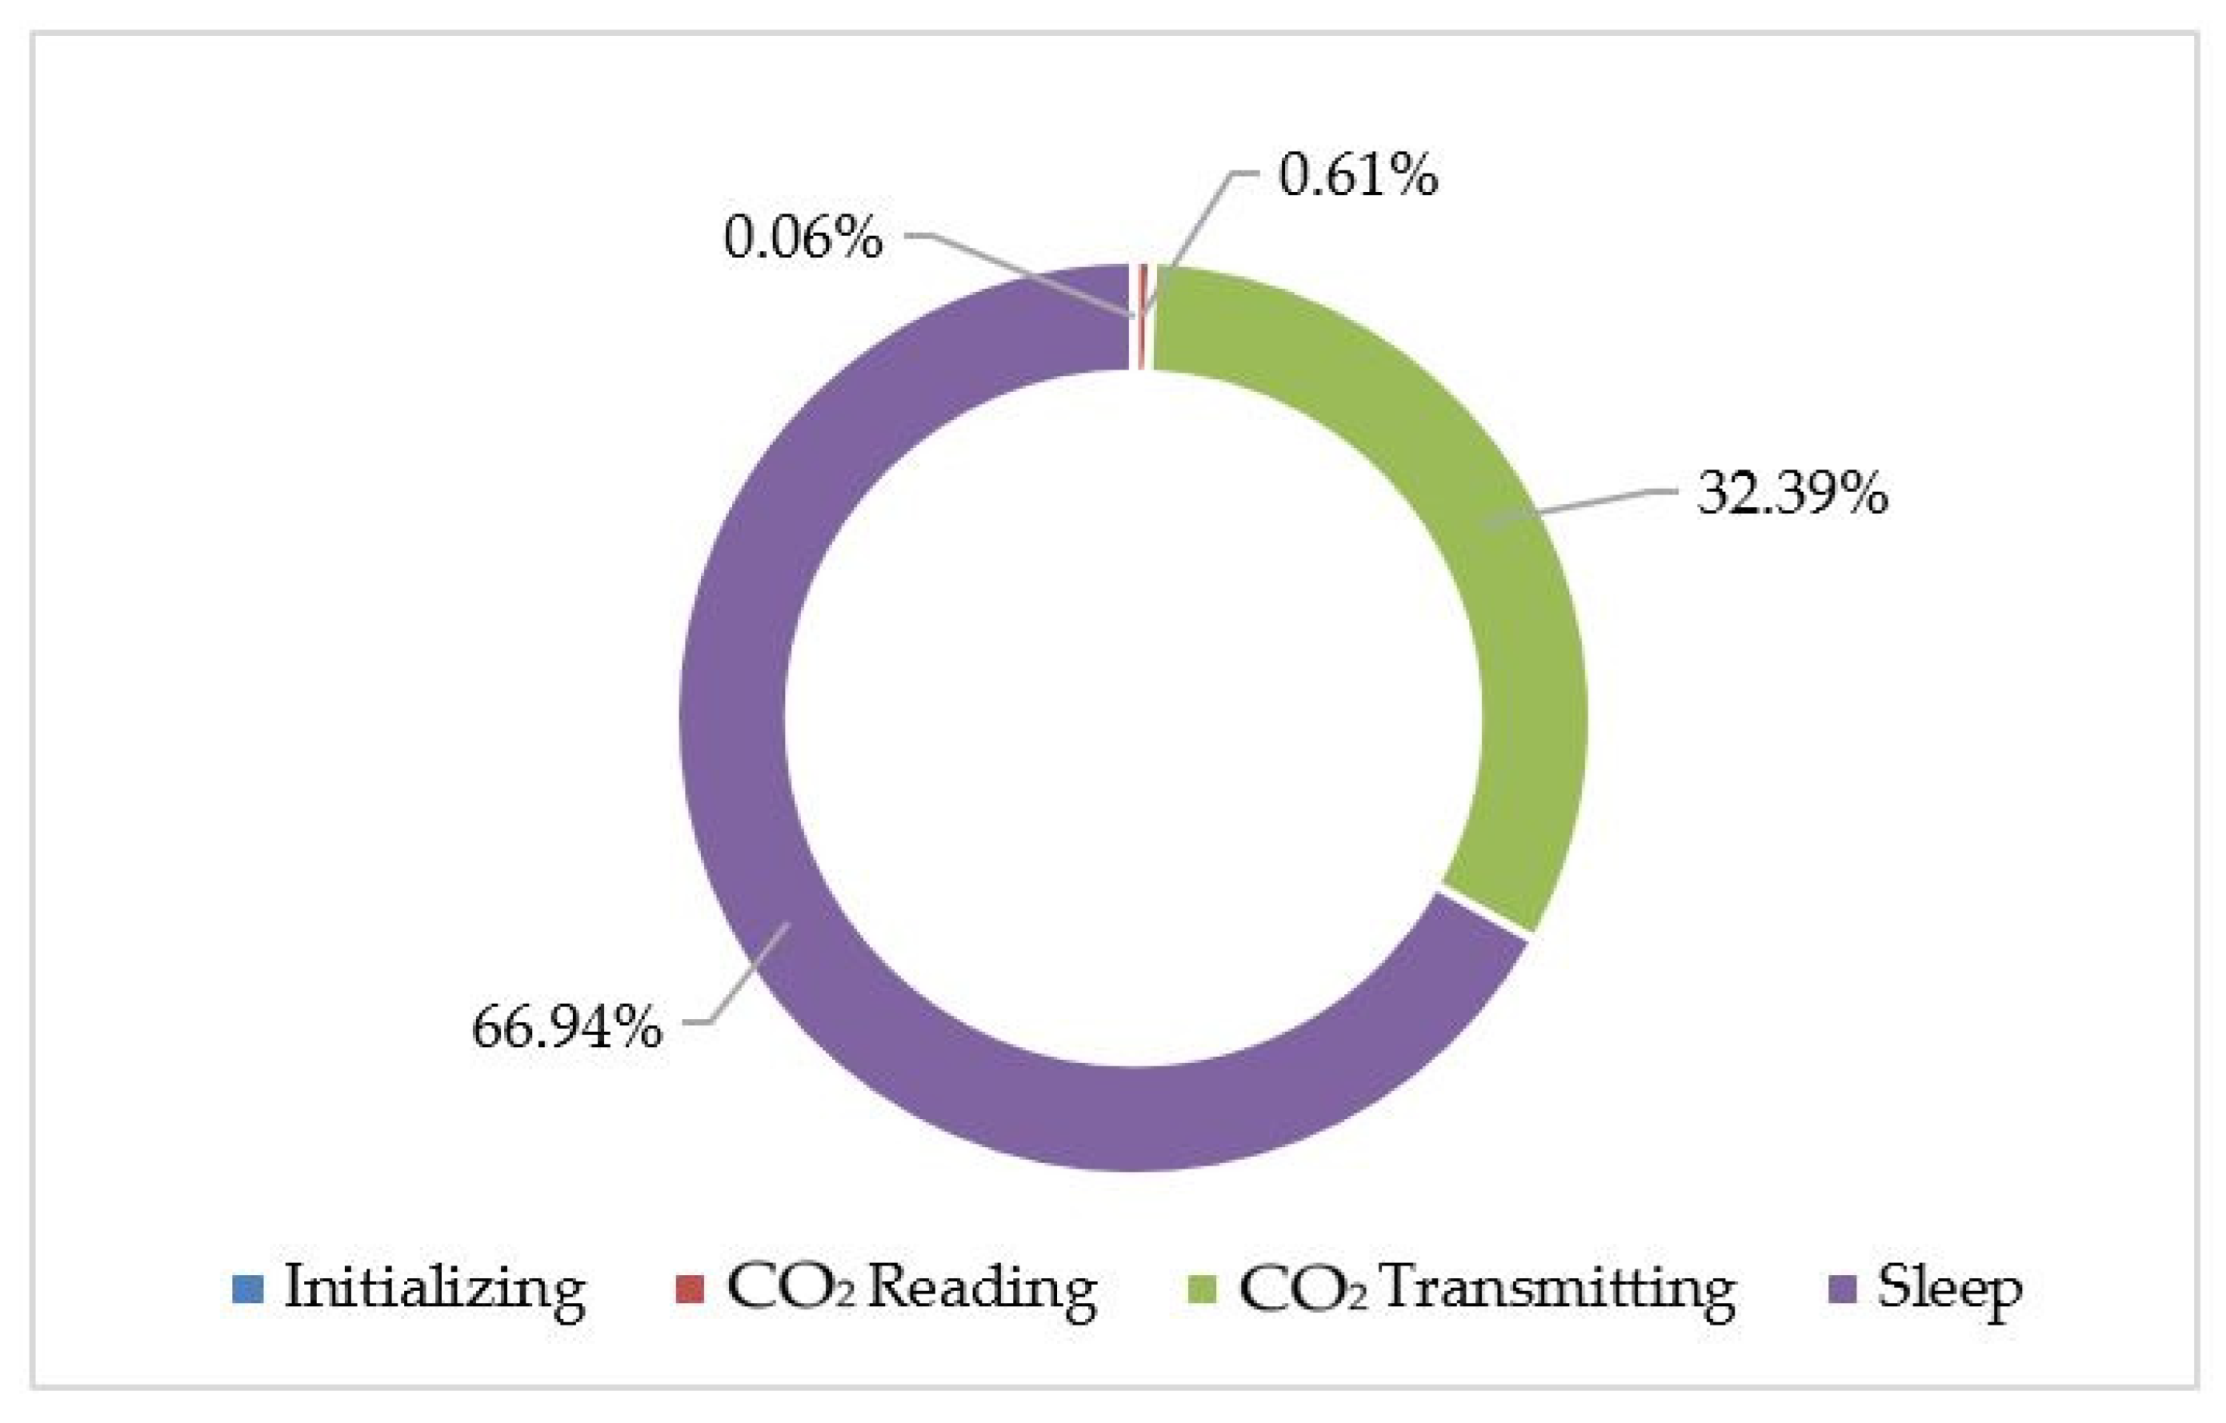
3.5.3. The Energy Capacity
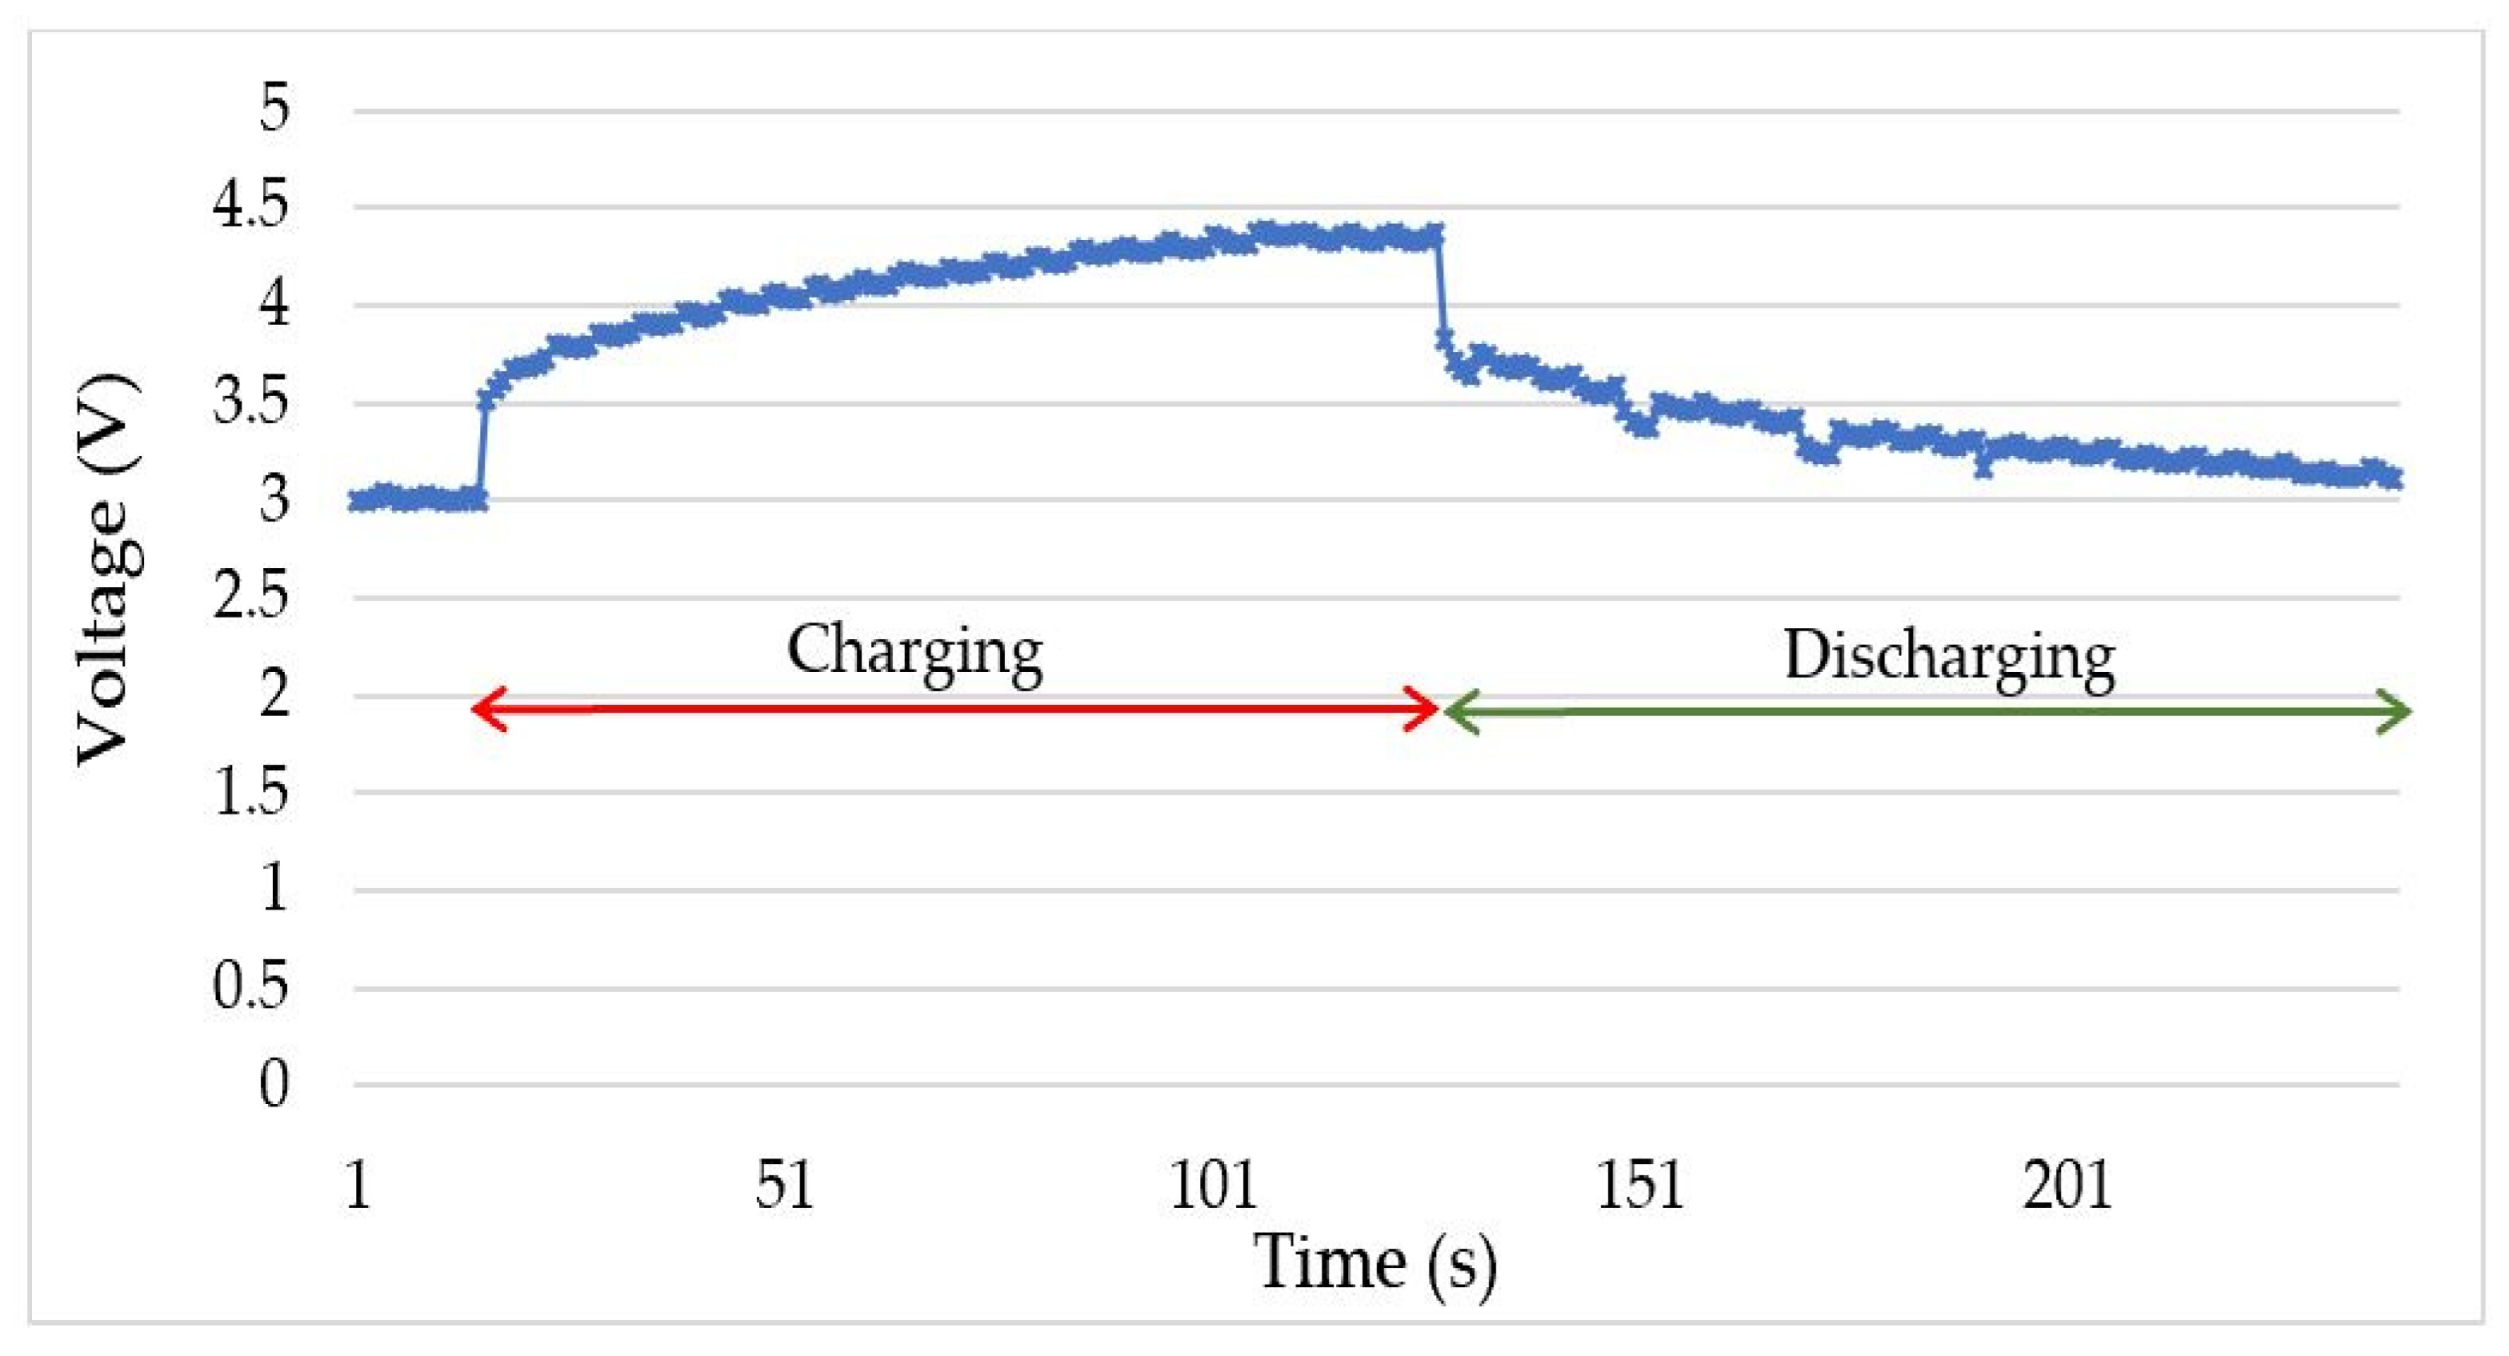
3.5.4. Power Storage Testing
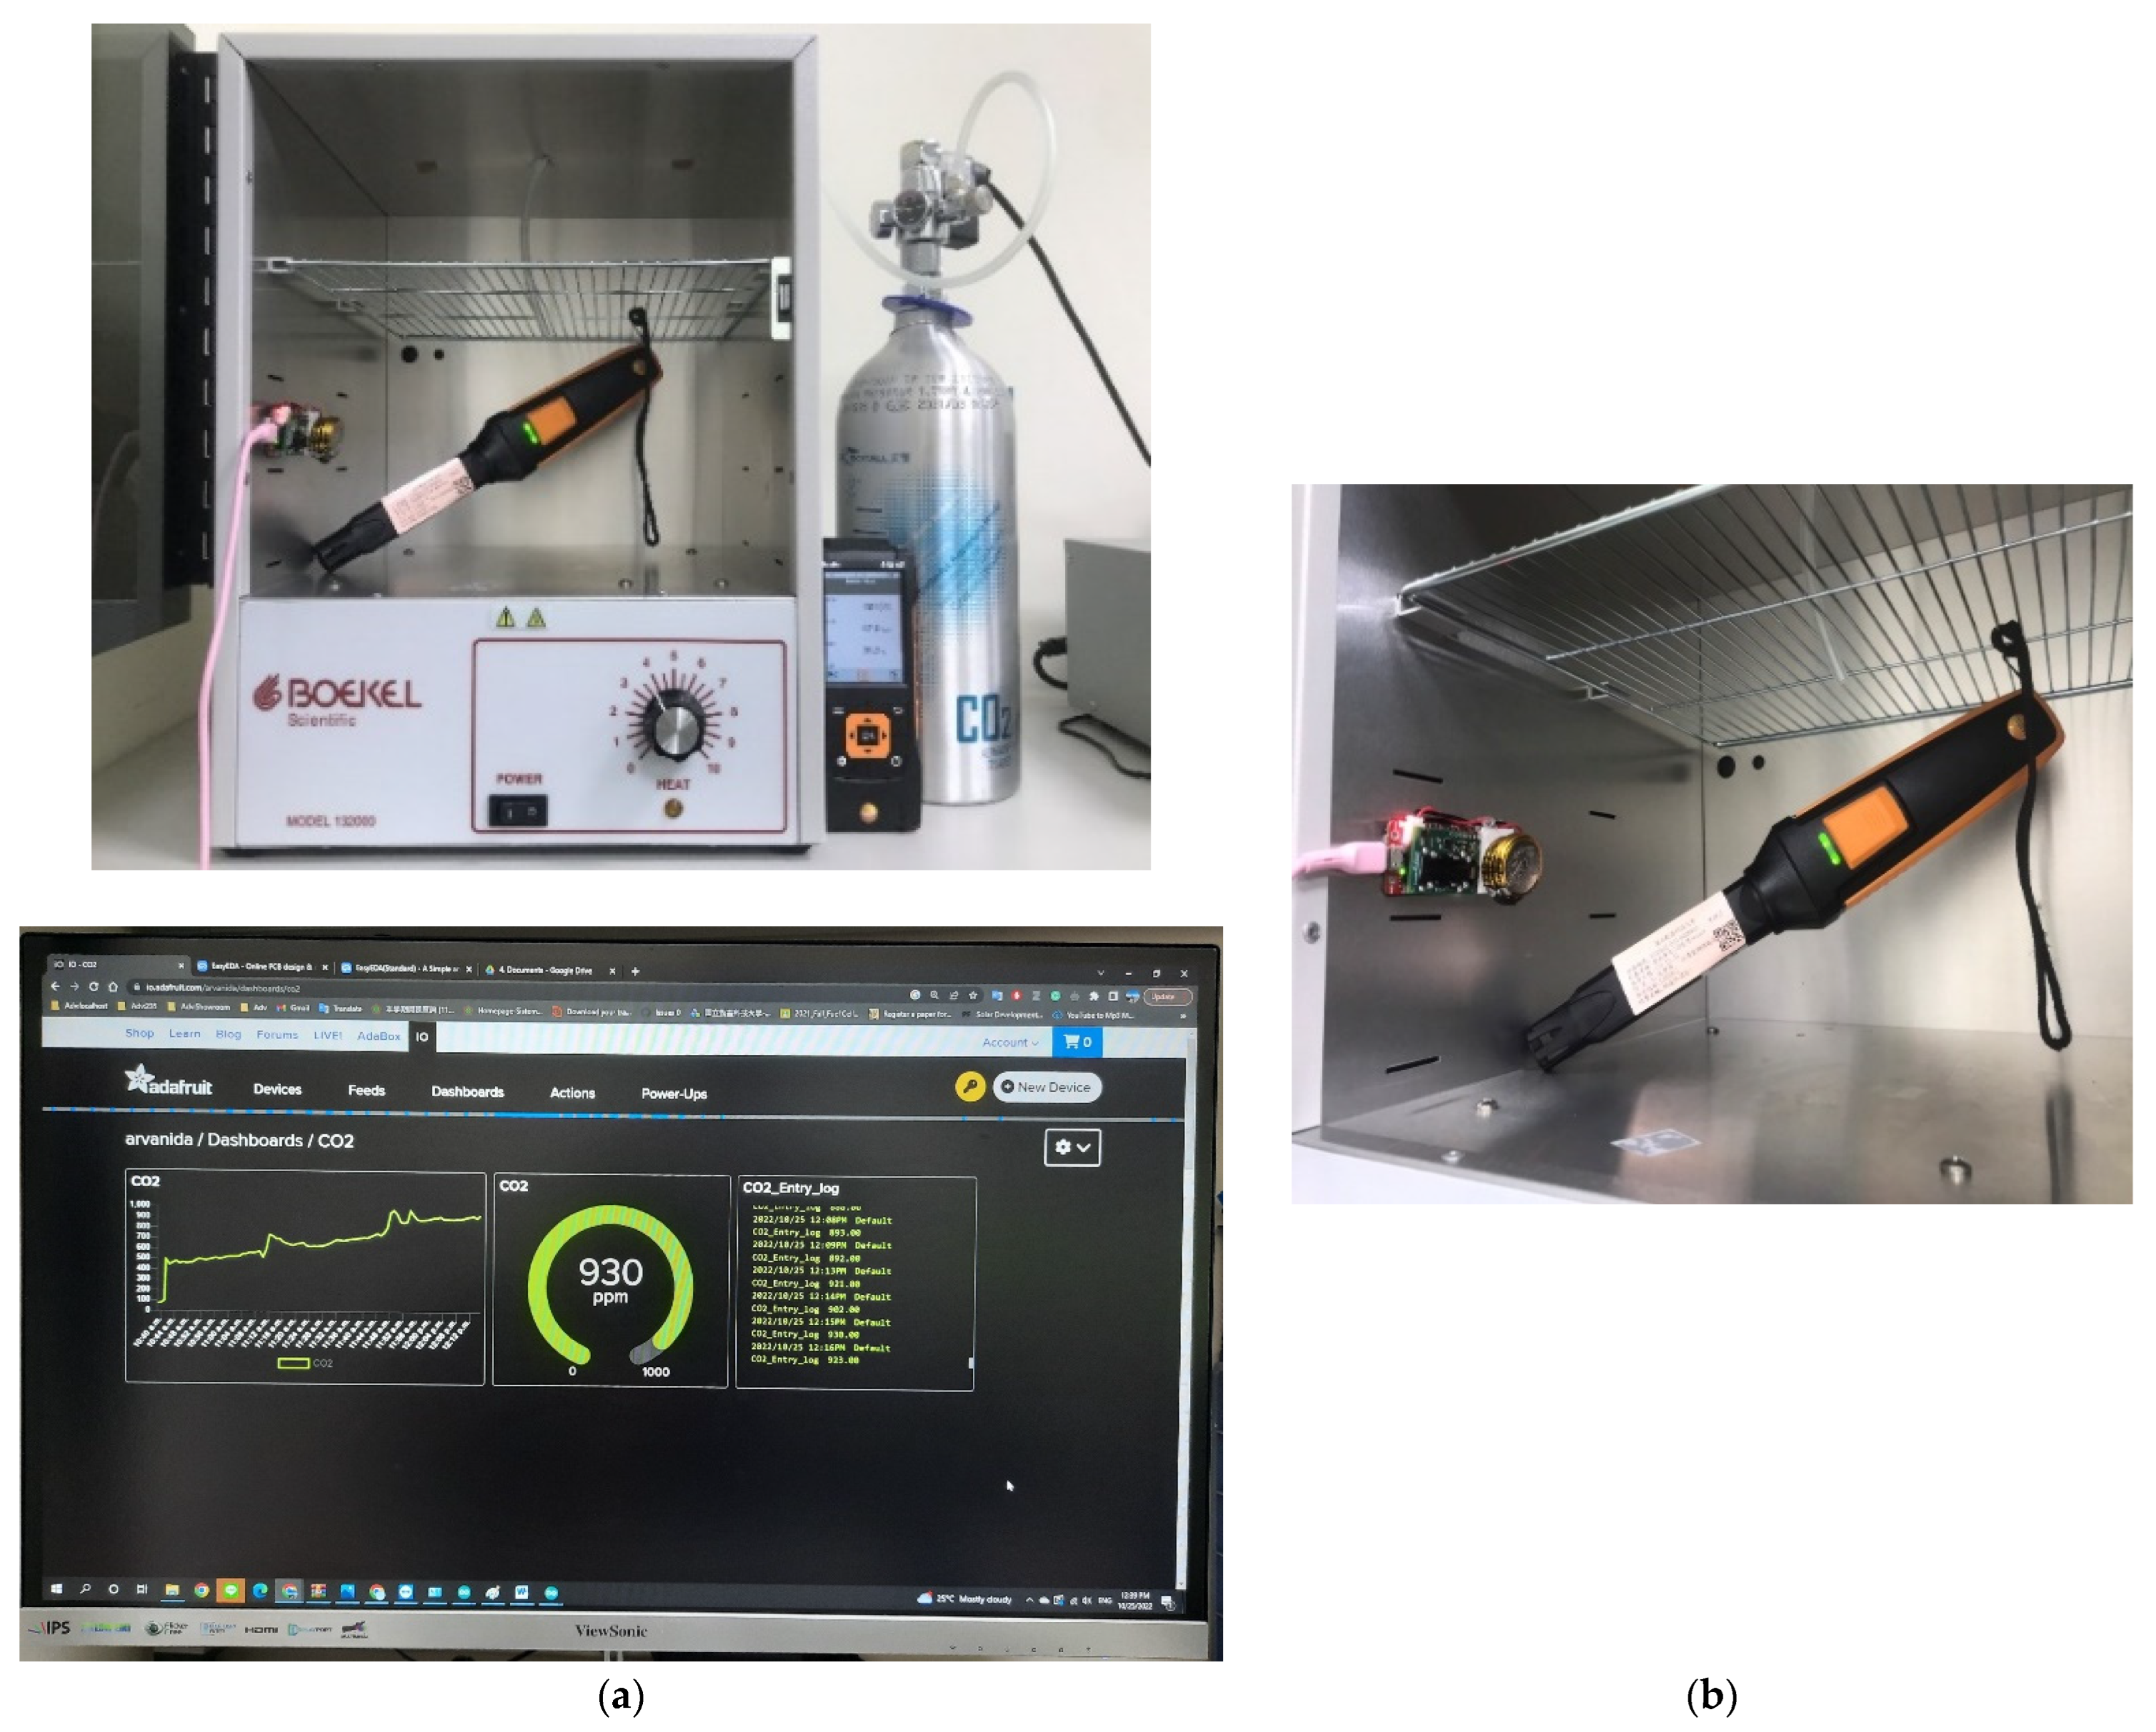
3.6. CO2 Concentration Measurement Experiment
3.6.1. Configuration
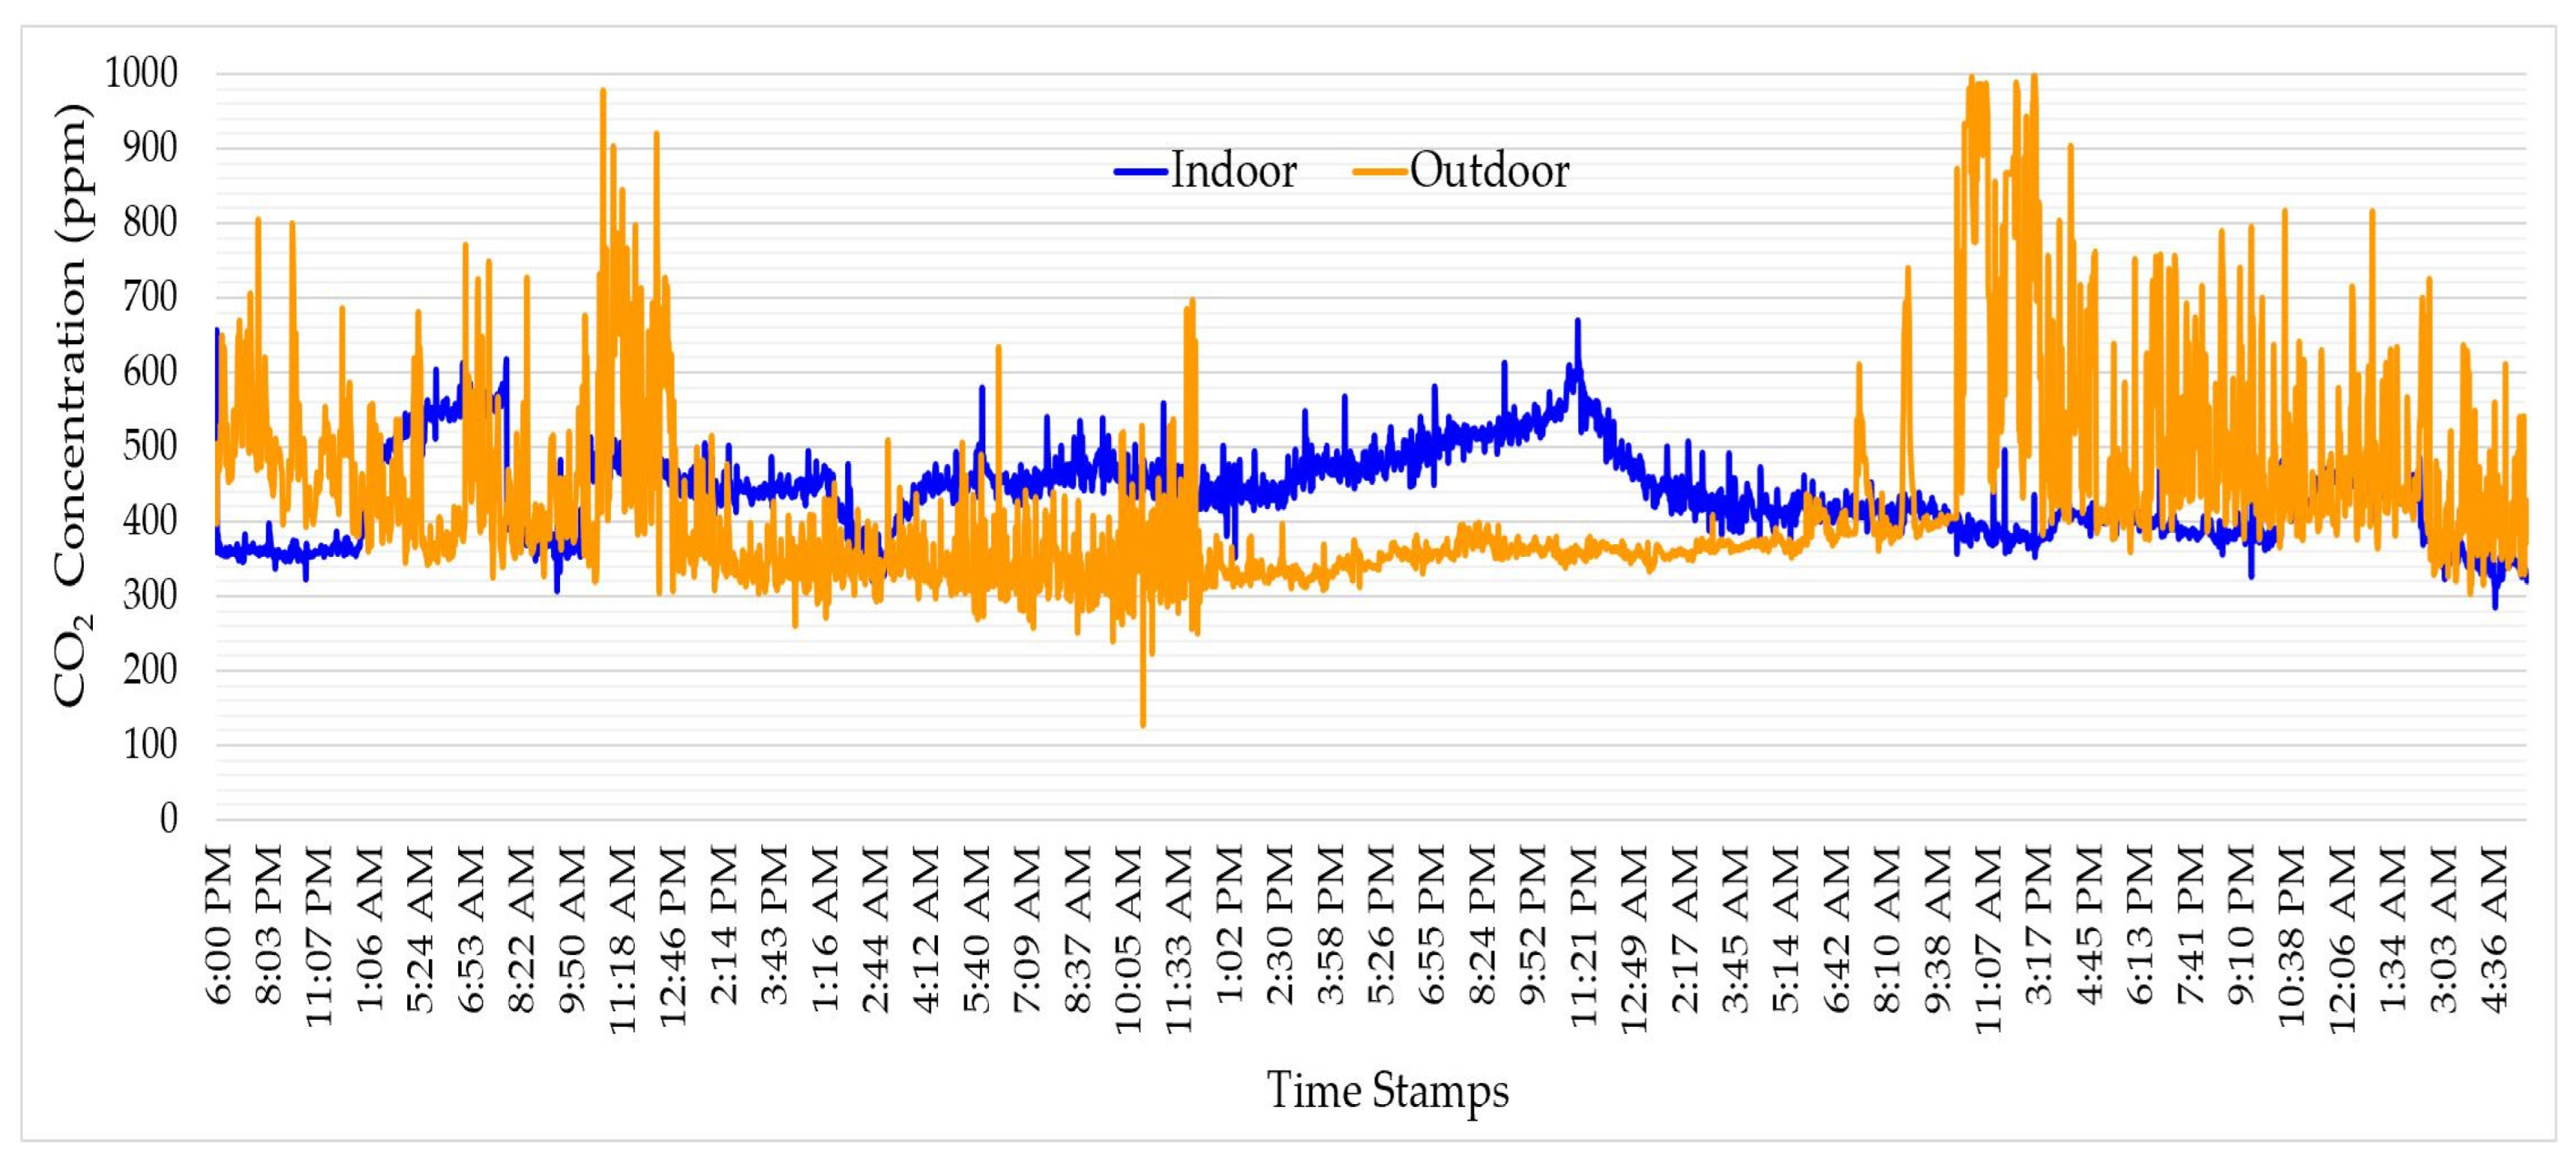
3.6.2. Measurement Result
4. Conclusions
Author Contributions
Funding
Data Availability Statement
Acknowledgments
Conflicts of Interest
References
- Seguel, J.M.; Merrill, R.; Seguel, D.; Campagna, A.C. Indoor Air Quality. Am. J. Lifestyle Med. 2017, 11, 284–295. [Google Scholar] [CrossRef] [PubMed]
- Ana, G.R.; Alli, A.S.; Uhiara, D.C.; Shendell, D.G. Indoor Air Quality and Reported Health Symptoms among Hair Dressers in Salons in Ibadan, Nigeria. J. Chem. Health Saf. 2019, 26, 23–30. [Google Scholar] [CrossRef]
- Theodosiou, T.G.; Ordoumpozanis, K.T. Energy, Comfort and Indoor Air Quality in Nursery and Elementary School Buildings in the Cold Climatic Zone of Greece. Energy Build. 2008, 40, 2207–2214. [Google Scholar] [CrossRef]
- Jafari, M.J.; Khajevandi, A.A.; Mousavi Najarkola, S.A.; Yekaninejad, M.S.; Pourhoseingholi, M.A.; Omidi, L.; Kalantary, S. Association of Sick Building Syndrome with Indoor Air Parameters. Tanaffos 2015, 14, 55–62. [Google Scholar] [PubMed]
- Pitarma, R.; Marques, G.; Ferreira, B.R. Monitoring Indoor Air Quality for Enhanced Occupational Health. J. Med. Syst. 2017, 41, 23. [Google Scholar] [CrossRef]
- Becerra, J.A.; Lizana, J.; Gil, M.; Barrios-Padura, A.; Blondeau, P.; Chacartegui, R. Identification of Potential Indoor Air Pollutants in Schools. J. Clean. Prod. 2020, 242, 118420. [Google Scholar] [CrossRef]
- Lee, S.C.; Chang, M. Indoor and Outdoor Air Quality Investigation at Schools in Hong Kong. Chemosphere 2000, 41, 109–113. [Google Scholar] [CrossRef]
- Branco, P.T.B.S.; Alvim-Ferraz, M.C.M.; Martins, F.G.; Sousa, S.I.V. Children’s Exposure to Indoor Air in Urban Nurseries-Part I: CO2 and Comfort Assessment. Environ. Res. 2015, 140, 1–9. [Google Scholar] [CrossRef] [Green Version]
- World Health Organization. International Labour Organization Preventing and Mitigating COVID-19 at Work: Policy Brief, 19 May 2021; World Health Organization: Geneva, Switzerland, 2021. [Google Scholar]
- Wang, W.; Wang, J.; Chen, J.; Huang, G.; Guo, X. Multi-Zone Outdoor Air Coordination through Wi-Fi Probe-Based Occupancy Sensing. Energy Build. 2018, 159, 495–507. [Google Scholar] [CrossRef]
- Peng, Z.; Jimenez, J.L. Exhaled CO2 as a COVID-19 Infection Risk Proxy for Different Indoor Environments and Activities. Environ. Sci. Technol. Lett. 2021, 8, 392–397. [Google Scholar] [CrossRef]
- Rudnick, S.N.; Milton, D.K. Risk of Indoor Airborne Infection Transmission Estimated from Carbon Dioxide Concentration. Indoor Air 2003, 13, 237–245. [Google Scholar] [CrossRef] [PubMed]
- Bazant, M.Z.; Kodio, O.; Cohen, A.E.; Khan, K.; Gu, Z.; Bush, J.W.M. Monitoring Carbon Dioxide to Quantify the Risk of Indoor Airborne Transmission of COVID-19. Flow 2021, 1, E10. [Google Scholar] [CrossRef]
- Barbieri, P.; Zupin, L.; Licen, S.; Torboli, V.; Semeraro, S.; Cozzutto, S.; Palmisani, J.; Di Gilio, A.; de Gennaro, G.; Fontana, F.; et al. Molecular Detection of SARS-CoV-2 from Indoor Air Samples in Environmental Monitoring Needs Adequate Temporal Coverage and Infectivity Assessment. Environ. Res. 2021, 198, 111200. [Google Scholar] [CrossRef] [PubMed]
- Buonanno, G.; Morawska, L.; Stabile, L. Quantitative Assessment of the Risk of Airborne Transmission of SARS-CoV-2 Infection: Prospective and Retrospective Applications. Environ. Int. 2020, 145, 106112. [Google Scholar] [CrossRef]
- Miller, S.L.; Nazaroff, W.W.; Jimenez, J.L.; Boerstra, A.; Buonanno, G.; Dancer, S.J.; Kurnitski, J.; Marr, L.C.; Morawska, L.; Noakes, C. Transmission of SARS-CoV-2 by Inhalation of Respiratory Aerosol in the Skagit Valley Chorale Superspreading Event. Indoor Air 2021, 31, 314–323. [Google Scholar] [CrossRef]
- Morawska, L.; Milton, D.K. It Is Time to Address Airborne Transmission of Coronavirus Disease 2019 (COVID-19). Clin. Infect. Dis. 2020, 71, 2311–2313. [Google Scholar] [CrossRef]
- Bhagat, R.K.; Davies Wykes, M.S.; Dalziel, S.B.; Linden, P.F. Effects of Ventilation on the Indoor Spread of COVID-19. J. Fluid Mech. 2020, 903, F1. [Google Scholar] [CrossRef]
- Zivelonghi, A.; Lai, M. Mitigating Aerosol Infection Risk in School Buildings: The Role of Natural Ventilation, Volume, Occupancy and CO2 Monitoring. Build. Environ. 2021, 204, 108139. [Google Scholar] [CrossRef]
- Tang, S.; Mao, Y.; Jones, R.M.; Tan, Q.; Ji, J.S.; Li, N.; Shen, J.; Lv, Y.; Pan, L.; Ding, P.; et al. Aerosol Transmission of SARS-CoV-2? Evidence, Prevention and Control. Environ. Int. 2020, 144, 106039. [Google Scholar] [CrossRef]
- van Doremalen, N.; Bushmaker, T.; Morris, D.H.; Holbrook, M.G.; Gamble, A.; Williamson, B.N.; Tamin, A.; Harcourt, J.L.; Thornburg, N.J.; Gerber, S.I.; et al. Aerosol and Surface Stability of SARS-CoV-2 as Compared with SARS-CoV-1. N Engl J Med 2020, 382, 1564–1567. [Google Scholar] [CrossRef]
- Riley, E.C.; Murphy, G.; Riley, R.L. Airborne Spread of Measles in a Suburban Elementary School. Am. J. Epidemiol. 1978, 107, 421–432. [Google Scholar] [CrossRef] [PubMed]
- Kwon, J.; Ahn, G.; Kim, G.; Kim, J.C.; Kim, H. A Study on NDIR-Based CO2 Sensor to Apply Remote Air Quality Monitoring System. In Proceedings of the 2009 ICCAS-SICE, Fukuoka, Japan, 18–21 August 2009; pp. 1683–1687. [Google Scholar]
- Scislo, L.; Szczepanik-Scislo, N. Air Quality Sensor Data Collection and Analytics With IoT for an Apartment With Mechanical Ventilation. In Proceedings of the 2021 11th IEEE International Conference on Intelligent Data Acquisition and Advanced Computing Systems: Technology and Applications (IDAACS), Cracow, Poland, 22–25 September 2021; IEEE: Cracow, Poland, 2021; pp. 932–936. [Google Scholar]
- Abraham, S.; Li, X. Design of A Low-Cost Wireless Indoor Air Quality Sensor Network System. Int. J. Wirel. Inf. Netw. 2016, 23, 57–65. [Google Scholar] [CrossRef]
- Kanál, A.K.; Tamás, K. Assessment of Indoor Air Quality of Educational Facilities Using an IoT Solution for a Healthy Learning Environment. In Proceedings of the 2020 IEEE International Instrumentation and Measurement Technology Conference (I2MTC), Dubrovnik, Croatia, 25–28 May 2020; pp. 1–6. [Google Scholar]
- Ortiz Perez, A.; Bierer, B.; Scholz, L.; Wöllenstein, J.; Palzer, S. A Wireless Gas Sensor Network to Monitor Indoor Environmental Quality in Schools. Sensors 2018, 18, 4345. [Google Scholar] [CrossRef] [PubMed] [Green Version]
- Wisesa, H. CO2 Monitoring System Prototype Using Wireless Sensor Network. Int. J. Inf. Commun. Technol. (IJoICT) 2017, 2, 49. [Google Scholar] [CrossRef]
- Muladi, M.; Sendari, S.; Widiyaningtyas, T. Real Time Indoor Air Quality Monitoring Using Internet of Things at University. In Proceedings of the 2018 2nd Borneo International Conference on Applied Mathematics and Engineering (BICAME), Balikpapan, Indonesia, 10–11 December 2018; pp. 169–173. [Google Scholar]
- Rucsandoiu, M.L.; Antonescu, A.M.; Enachescu, M. Indoor Air Quality Monitoring Platform. In Proceedings of the 2021 International Symposium on Signals, Circuits and Systems (ISSCS), Iasi, Romania, 15–16 July 2021; pp. 1–4. [Google Scholar]
- Dai, X.; Liu, J.; Li, X.; Zhao, L. Long-Term Monitoring of Indoor CO2 and PM2.5 in Chinese Homes: Concentrations and Their Relationships with Outdoor Environments. Build. Environ. 2018, 144, 238–247. [Google Scholar] [CrossRef]
- Palmisani, J.; Di Gilio, A.; Viana, M.; de Gennaro, G.; Ferro, A. Indoor Air Quality Evaluation in Oncology Units at Two European Hospitals: Low-Cost Sensors for TVOCs, PM2.5 and CO2 Real-Time Monitoring. Build. Environ. 2021, 205, 108237. [Google Scholar] [CrossRef]
- Yin, H.; Zhai, X.; Ning, Y.; Li, Z.; Ma, Z.; Wang, X.; Li, A. Online Monitoring of PM2.5 and CO2 in Residential Buildings under Different Ventilation Modes in Xi’an City. Build. Environ. 2022, 207, 108453. [Google Scholar] [CrossRef]
- Fernández-Ramos, M.D.; Moreno-Puche, F.; Escobedo, P.; García-López, P.A.; Capitán-Vallvey, L.F.; Martínez-Olmos, A. Optical Portable Instrument for the Determination of CO2 in Indoor Environments. Talanta 2020, 208, 120387. [Google Scholar] [CrossRef]
- Canada, H. Consultation: Proposed Residential Indoor Air Quality Guidelines for Carbon Dioxide. Available online: https://www.canada.ca/en/health-canada/programs/consultation-residential-indoor-air-quality-guidelines-carbon-dioxide/document.html (accessed on 4 June 2022).
- Pietrucha, T. Ability to Determine the Quality of Indoor Air in Classrooms without Sensors. E3S Web Conf. 2017, 17, 73. [Google Scholar] [CrossRef] [Green Version]
- Vanzo, T. The Dangers of High Carbon Dioxide (CO2) Levels. Smart Air 2021. Available online: https://smartairfilters.com/en/blog/dangers-high-carbon-dioxide-co2-levels/ (accessed on 20 June 2022).
- CDC Coronavirus Disease 2019 (COVID-19). Available online: https://www.cdc.gov/coronavirus/2019-ncov/more/science-and-research/surface-transmission.html (accessed on 23 May 2022).
- Meyerowitz, E.A.; Richterman, A.; Gandhi, R.T.; Sax, P.E. Transmission of SARS-CoV-2: A Review of Viral, Host, and Environmental Factors. Ann. Intern. Med. 2021, 174, 69–79. [Google Scholar] [CrossRef] [PubMed]
- Kampf, G.; Brüggemann, Y.; Kaba, H.E.J.; Steinmann, J.; Pfaender, S.; Scheithauer, S.; Steinmann, E. Potential Sources, Modes of Transmission and Effectiveness of Prevention Measures against SARS-CoV-2. J. Hosp. Infect. 2020, 106, 678–697. [Google Scholar] [CrossRef] [PubMed]
- Curtius, J.; Granzin, M.; Schrod, J. Testing Mobile Air Purifiers in a School Classroom: Reducing the Airborne Transmission Risk for SARS-CoV-2. Aerosol Sci. Technol. 2021, 55, 586–599. [Google Scholar] [CrossRef]
- Drossinos, Y.; Stilianakis, N.I. What Aerosol Physics Tells Us about Airborne Pathogen Transmission. Aerosol Sci. Technol. 2020, 54, 639–643. [Google Scholar] [CrossRef]
- ATMEGA4808|Microchip Technology. Available online: https://www.microchip.com/en-us/product/ATMEGA4808# (accessed on 11 May 2022).
- ATmega4808/4809 Data Sheet. Available online: https://onlinedocs.microchip.com/pr/GUID-4E9DA219-611B-4772-B5D3-9ED908198864-en-US-16/index.html?GUID-0E8898B7-7398-4EBA-A96F-7E9353ECE5E4 (accessed on 11 May 2022).
- Yi, S.; Park, Y.; Han, S.; Min, N.; Kim, E.; Ahn, T. Novel NDIR CO/Sub 2/ Sensor for Indoor Air Quality Monitoring. In Proceedings of the 13th International Conference on Solid-State Sensors, Actuators and Microsystems, 2005. Digest of Technical Papers, Seoul, Korea, 5–9 June 2005; IEEE: Seoul, Korea, 2005; Volume 2, pp. 1211–1214. [Google Scholar]
- SCD30-CO₂ accuracy of ±(30 Ppm + 3% MV) @400-10000 Ppm. Available online: https://sensirion.com/products/catalog/SCD30/ (accessed on 13 May 2022).
- ATWINC1510-IC|Microchip Technology. Available online: https://www.microchip.com/en-us/product/ATWINC1510-IC (accessed on 13 May 2022).
- Kuncoro, C.B.D.; Permana, A.F.; Asyikin, M.B.Z.; Adristi, C. Smart Wireless Climate Sensor Node for Indoor Comfort Quality Monitoring Application. Energies 2022, 15, 2939. [Google Scholar] [CrossRef]


| CO2 Concentration | 350–400 ppm | <600 ppm | 1000 ppm | 1500 ppm | 2000 ppm | >10,000 ppm |
|---|---|---|---|---|---|---|
| Description of indoor air quality with health after effect. | Fresh air and perfect conditions. | Acceptable conditions of IAQ in rooms. | Stuffy and damp air. | Air is perceived as stuffy and not fresh. | People with respiratory illnesses develop a cough, with other weak occupants fainting. | Bad air quality causes increased breathing rates, weakened respiration, headaches, and nausea. |
| CO2 Concentration | 1000 ppm | 2500 ppm | 5000 ppm | 6% (60 kppm) | 7% (70 kppm) | 10–15% | 17–30% | >30% |
|---|---|---|---|---|---|---|---|---|
| Duration | >2.5 h | <2.5 h | >30 min | 1–2 min | 5 min | 1 min | 1 min | 30 s |
| Physiological impact/Health effect. | Decision-making abilities and judgment reasoning skills are harmed. | Cognitively marginal or functional disorder. | Headache, lethargy, mental slowness, emotional irritation, and sleep disruption. | Hearing and visual disturbances. | Death | Dizziness, drowsiness, severe muscle twitching, and death. | Loss of controlled activity, coma, convulsions, and death. | Losing consciousness and having seizures (no cerebral functioning). |
| Parameters | Value |
|---|---|
| Sensor technology | Non-Dispersive InfraRed |
| Sensing range | 0–40,000 ppm |
| Sensor accuracy | ±(30 ppm + 3%) |
| Operating voltage | 3.3–5.5 V |
| Power storage | 5.5 V 10 F supercapacitor |
| Sensor Node (ppm) | Validator (ppm) | Deviation (ppm) | Absolute Percentage Deviation (%) |
|---|---|---|---|
| 1751 | 1539 | −212 | 13.78 |
| 1808 | 1597 | −211 | 13.21 |
| 1853 | 1646 | −207 | 12.58 |
| 1903 | 1692 | −211 | 12.47 |
| 1949 | 1747 | −202 | 11.56 |
| 2005 | 1804 | −201 | 11.14 |
| 2051 | 1850 | −201 | 10.86 |
| 2098 | 1900 | −198 | 10.42 |
| 2152 | 1950 | −202 | 10.36 |
| 2196 | 1999 | −197 | 9.85 |
| Average Deviation | −204.2 | ||
| Average Percentage Deviation | 11.62 | ||
| Sensor Node (ppm) | Validator (ppm) | Deviation (ppm) | Absolute Percentage Deviation (%) |
|---|---|---|---|
| 1514 | 1515 | 1 | 0.07 |
| 1600 | 1609 | 9 | 0.56 |
| 1650 | 1651 | 1 | 0.06 |
| 1705 | 1710 | 5 | 0.29 |
| 1743 | 1749 | 6 | 0.34 |
| 1812 | 1800 | −12 | 0.67 |
| 1853 | 1855 | 2 | 0.11 |
| 1921 | 1899 | −22 | 1.16 |
| 1964 | 1950 | −14 | 0.72 |
| 2024 | 2003 | −21 | 1.05 |
| Average Deviation | −4.5 | ||
| Average Percentage Deviation | 0.50 | ||
| Process | Voltage (V) | Current (mA) | Power (mW) | Time (ms) | Energy Capacity Required (mWh) |
|---|---|---|---|---|---|
| Initializing | 3.22 | 42.1 | 135.56 | 7 | 0.0003 |
| CO2 Reading | 3.22 | 120.07 | 387.83 | 25 | 0.0027 |
| CO2 Transmitting | 3.22 | 121.4 | 392.12 | 1319.33 | 0.1437 |
| Sleep | 3.22 | 33.2 | 106.9 | 10,000 | 0.297 |
| Total Energy Required (one cycle) | 0.4436 | ||||
Publisher’s Note: MDPI stays neutral with regard to jurisdictional claims in published maps and institutional affiliations. |
© 2022 by the authors. Licensee MDPI, Basel, Switzerland. This article is an open access article distributed under the terms and conditions of the Creative Commons Attribution (CC BY) license (https://creativecommons.org/licenses/by/4.0/).
Share and Cite
Kuncoro, C.B.D.; Amaris, A.; Permana, A.F. Smart Wireless CO2 Sensor Node for IoT Based Strategic Monitoring Tool of The Risk of The Indoor SARS-CoV-2 Airborne Transmission. Appl. Sci. 2022, 12, 10784. https://doi.org/10.3390/app122110784
Kuncoro CBD, Amaris A, Permana AF. Smart Wireless CO2 Sensor Node for IoT Based Strategic Monitoring Tool of The Risk of The Indoor SARS-CoV-2 Airborne Transmission. Applied Sciences. 2022; 12(21):10784. https://doi.org/10.3390/app122110784
Chicago/Turabian StyleKuncoro, C. Bambang Dwi, Aurelia Amaris, and Arvanida Feizal Permana. 2022. "Smart Wireless CO2 Sensor Node for IoT Based Strategic Monitoring Tool of The Risk of The Indoor SARS-CoV-2 Airborne Transmission" Applied Sciences 12, no. 21: 10784. https://doi.org/10.3390/app122110784