Article

Performance Evaluation of a Multidomain IMS/NGN Network Including Service and Transport Stratum

Faculty of Electronics, Telecommunications and Informatics, Gdansk University of Technology, Narutowicza 11/12, 80-233 Gdansk, Poland
*
Authors to whom correspondence should be addressed.
Appl. Sci. 2022, 12(22), 11643; https://doi.org/10.3390/app122211643
Submission received: 10 September 2022 / Revised: 11 November 2022 / Accepted: 12 November 2022 / Published: 16 November 2022
(This article belongs to the Special Issue Advance in Digital Signal, Image and Video Processing)

Abstract

:
The Next Generation Network (NGN) architecture was proposed for delivering various multimedia services with guaranteed quality. For this reason, the elements of the IP Multimedia Subsystem (IMS) concept (an important part of 4G/5G/6G mobile networks) are used in its service stratum. This paper presents comprehensive research on how the parameters of an IMS/NGN network and traffic sources influence mean Call Set-up Delay (E(CSD)) and mean Call Disengagement Delay (E(CDD)), a subset of standardized call processing performance (CPP) parameters, which are significant for both network users and operators. The investigations were performed using our analytical traffic model of a multidomain IMS/NGN network with Multiprotocol Label Switching (MPLS) technology applied in its transport stratum, which provides transport resources for the services requested by users. The performed experiments allow grouping network and traffic source parameters into three categories based on the strength of their effect on E(CSD) and E(CDD). These categories reflect the significance of particular parameters for the network operator and designer (most important, less important and insignificant).

1. Introduction

The Next Generation Network (NGN) [1,2] is a packet-based network dedicated to providing various broadband multimedia services (e.g., VolP telephony, IPTV or VoD services) with Quality of Service (QoS) and support for generalized mobility. The basic principle of the NGN is the independence of its service-related functions from underlying transport-related technologies. This principle is reflected in the NGN architecture, which includes a service stratum (based on elements of the IP Multimedia Subsystem (IMS) [3,4,5,6]; thus, the term “IMS/NGN network” is widely used) and a transport stratum (where any transport technology supporting transfer of IP packets can be applied). There are various technologies considered for the IMS/NGN transport stratum. Access networks can be based on—among others—Ethernet, xDSL, fiber, Wi-Fi or 4G/5G/6G mobile networks. Core transport networks may be based on Ethernet, Flow-State-Aware (FSA), Multiprotocol Label Switching (MPLS) [7,8] and other technologies.
Ensuring proper values of standardized QoS parameters is crucial for the operation and commercial success of the IMS/NGN architecture. From the point of view of the service stratum and services provided to users, which are of our interest, call processing performance (CPP) parameters defined by ITU-T [9,10] are very important. They include, among others, Call Set-up Delay (CSD) and Call Disengagement Delay (CDD). These parameters result from the operation of the service stratum and the response times of the transport stratum regarding the allocation and release of transport resources for user services (calls). For MPLS technology, which is considered in this paper, transport stratum response times contain response times of MPLS domains resulting from their structure and operation. Consequently, both the service stratum and the transport stratum of an IMS/NGN network have to be properly designed so that strictly determined values of CPP parameters are not exceeded, which would result in dissatisfaction of users with the provided services.
To achieve this aim, it is necessary to determine how network and traffic source parameters affect guaranteed CPP parameters, which is the goal of this paper. We use our analytical traffic model of a multidomain IMS/NGN network with an MPLS-based transport stratum, proposed in [11], to thoroughly examine the impact of all input parameters on mean Call Set-up Delay (E(CSD)) and mean Call Disengagement Delay (E(CDD)) calculated for various types of successful call scenarios. The performed research and discussion enable the indication of parameters that are very important, less important and irrelevant from the point of view of the network operator and designer.
The rest of the paper is organized as follows. Section 2 contains a review of the related work. Section 3 describes the structure and operation of our analytical traffic model of a multidomain IMS/NGN network with an MPLS-based transport stratum in terms of the performed investigations (presented in Section 4). Section 5 summarizes the paper.

2. Related Work

Our review of the work related to the analysis and design of IMS/NGN networks indicates that standards organizations (e.g., ITU-T, ETSI, 3GPP, etc.) do not provide any guidelines for traffic modeling and traffic engineering which can be used to achieve appropriate values of CPP parameters. Their scope focuses on functionality [1,2], architecture [2,3] and communication protocols [3]. Although the keywords “IMS” and “NGN” lead to many scientific papers, only a small number of them concern the subject of traffic modeling and engineering in an IMS/NGN network. Examples of such papers in which an analytical approach to network analysis and design is used are described in the next part of this section.
In Ref. [12], a trade-off between delay and throughput in IMS session setup is discussed. A scheme for decreasing the excessive signaling in IMS session setup is proposed. To assess this proposition, an analytical traffic model is used. The model focuses only on IMS elements and does not consider reservation of the transport resources necessary for the services. In particular, there is no Resource and Admission Control Function (RACF) unit proposed by the ITU-T for controlling transport resources.
An analytical traffic model allowing estimation of packet delay variation is proposed in Ref. [13]. Despite the authors’ declarations, the proposed model is general and not closely related to the IMS and NGN architecture.
The paper [14] proposes an analytical model for IMS/NGN with G/G/1/N queuing models based on diffusion approximation. The traffic model allows evaluation of average time for establishing multimedia sessions. The authors do not, however, specify the detailed network architecture, number of domains and considered service scenarios. Moreover, no information about verification of the analytical model is provided.
A similar study with the same types of queuing models was performed in Ref. [15]. The described analytical traffic model considers only one IMS domain and does not include resource control mechanisms defined by the ITU-T (RACF unit).
In Ref. [16], an analytical traffic model is presented that allows assessment of bandwidth requirements for IMS architecture. The model contains only the basic elements and a single domain of IMS.
The application of MPLS technology in an NGN is discussed in Ref. [17]. However, this paper is an overview and does not contain any propositions for IMS/NGN performance analysis and resource design.
Papers [18,19] concern the subject of performability of IMS in virtualized containerized environments. They assess availability of a single IMS domain with respect to an extensive set of input parameters. Moreover, an automated procedure aimed at supporting the performability management of IMS deployments that must satisfy the optimal trade-off among high availability requirements, capacity load and deployment costs is proposed in Ref. [19].
Paper [20] proposes an analytical model based on an open queuing network of G/G/m queues to estimate mean response time of a chain of Virtualized Network Functions (VNFs). The presented analytical model is verified using simulations. The proposition is very general and can be applied to model various systems, including IMS/NGN networks.
The described papers demonstrate that the available analytical approaches to IMS/NGN network design and analysis do not cover these aspects completely. They are either very general (not related closely to the IMS/NGN architecture) or consider only the elements of the service stratum (in most cases, it is a single domain of pure IMS without taking into account elements of the transport stratum, including RACF) and only selected network functionalities (services and elements). Moreover, in the majority of cases, there is no information about verification of the abovementioned analytical models using simulations or real networks.
Therefore, we decided to create our own analytical traffic model of an IMS/NGN network which comprehensively models the operation of this network and enables assessment of E(CSD) and E(CDD). The model takes into account the elements of both the IMS-based service stratum and the MPLS-based transport stratum with an extensive set of input variables and service scenarios. Our model is proposed and verified in Ref. [11]. The description of this model is provided in the next section in terms of the performed investigations, which are presented in Section 4.

3. Traffic Model

Figure 1 presents the structure of the considered multidomain IMS/NGN network, which is divided into two domains belonging to two operators (the terms “operator” and “domain” will be used interchangeably with similar meaning). To distinguish between elements of IMS/NGN service and the transport stratum administered by different operators, we designate them with the numbers 1 and 2, respectively. The service stratum of each domain controls service requests sent by user terminals (User Equipment, UE) and includes elements derived from the IMS concept [3,4,5]:
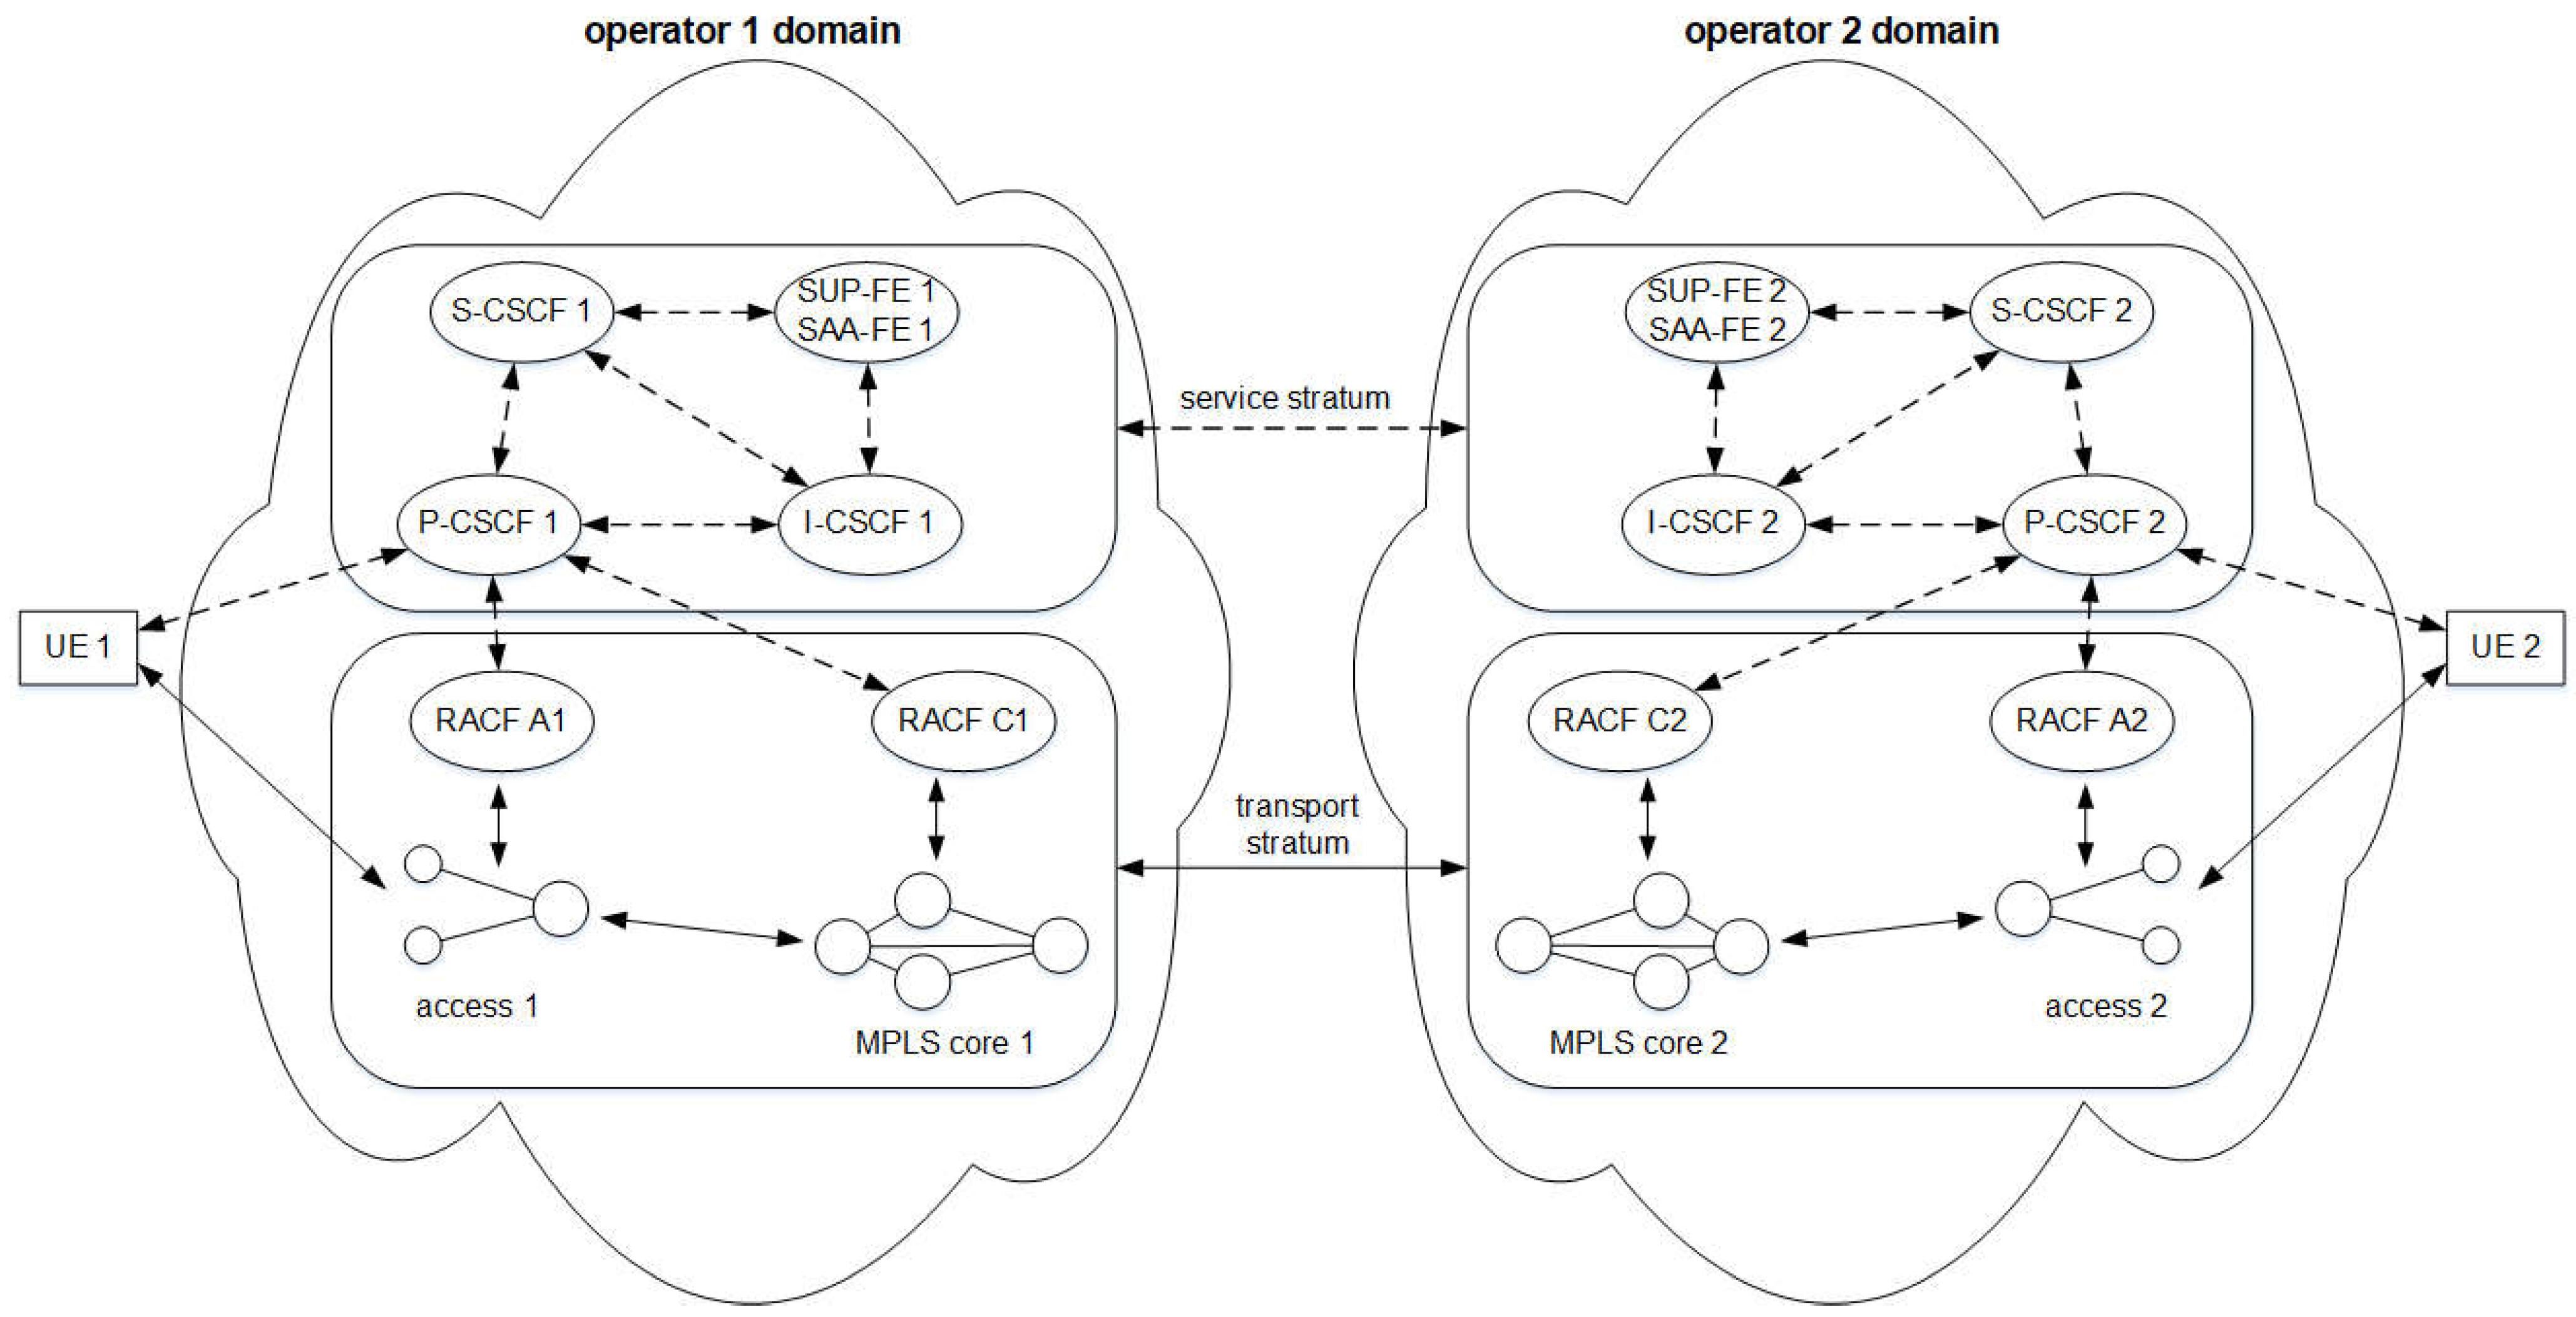
  • Call Session Control Function (CSCF) servers:
    • Proxy-CSCF, P-CSCF—the first contact point for UE;
    • Serving-CSCF, S-CSCF—the main server handling all calls in its domain;
    • Interrogating-CSCF, I-CSCF—the server handling messages coming from other domains.
  • Service User Profile Functional Entity/Service Authentication and Authorization Functional Entity, SUP-FE/SAA-FE—the element storing user profiles and performing AAA functions.
In each domain, the transport stratum includes one access network with several access areas and one MPLS core network. The technology of access networks in domains 1 and 2 is not determined—it may be, for example, xDSL, fiber, Wi-Fi or 4G/5G/6G mobile networks. The resources of all access and core networks are controlled by dedicated Resource and Admission Control Function (RACF) units (RACF A1, RACF C1, RACF A2 and RACF C2; Figure 1).
There are two main assumptions for the operation of MPLS core networks: a static bandwidth reservation mode [8] and a quota-based approach [21] are used for Label Switched Paths (LSPs, logical channels transporting aggregated data). LSPs are created based on routing tables, which are determined by a routing algorithm working in the background. Consequently, routing has a negligible impact on the performance of the IMS/NGN service stratum, which is described by CPP parameters. The assumption of a static bandwidth reservation mode means that LSPs are initially allocated with some bandwidth, which can be modified by RACF through the Label Edge Router (LER) beginning the LSP. The quota-based approach indicates that during network operation, LSP bandwidth is allocated with some reserves so that a part of resource allocation requests generated from the service stratum results only in updating the resource state database of RACF without changing the physical LSP bandwidth. A similar situation takes place for resource release requests generated from the service stratum—they are partially handled by updating the RACF database, and the LSP bandwidth is decreased only when its utilization is low.
Figure 1. Structure of the multidomain IMS/NGN network with an MPLS-based transport stratum.
Applsci 12 11643 g001
The set of service scenarios considered in the modeled network includes UE registration in domains 1 and 2 (scenarios a1 and a2) as well as various type of calls, whose parameters are presented in Table 1. Figure 2 depicts an example of a successful call scenario (inter-operator call originating in domain 2—scenario f2). The most important events for this scenario are as follows:
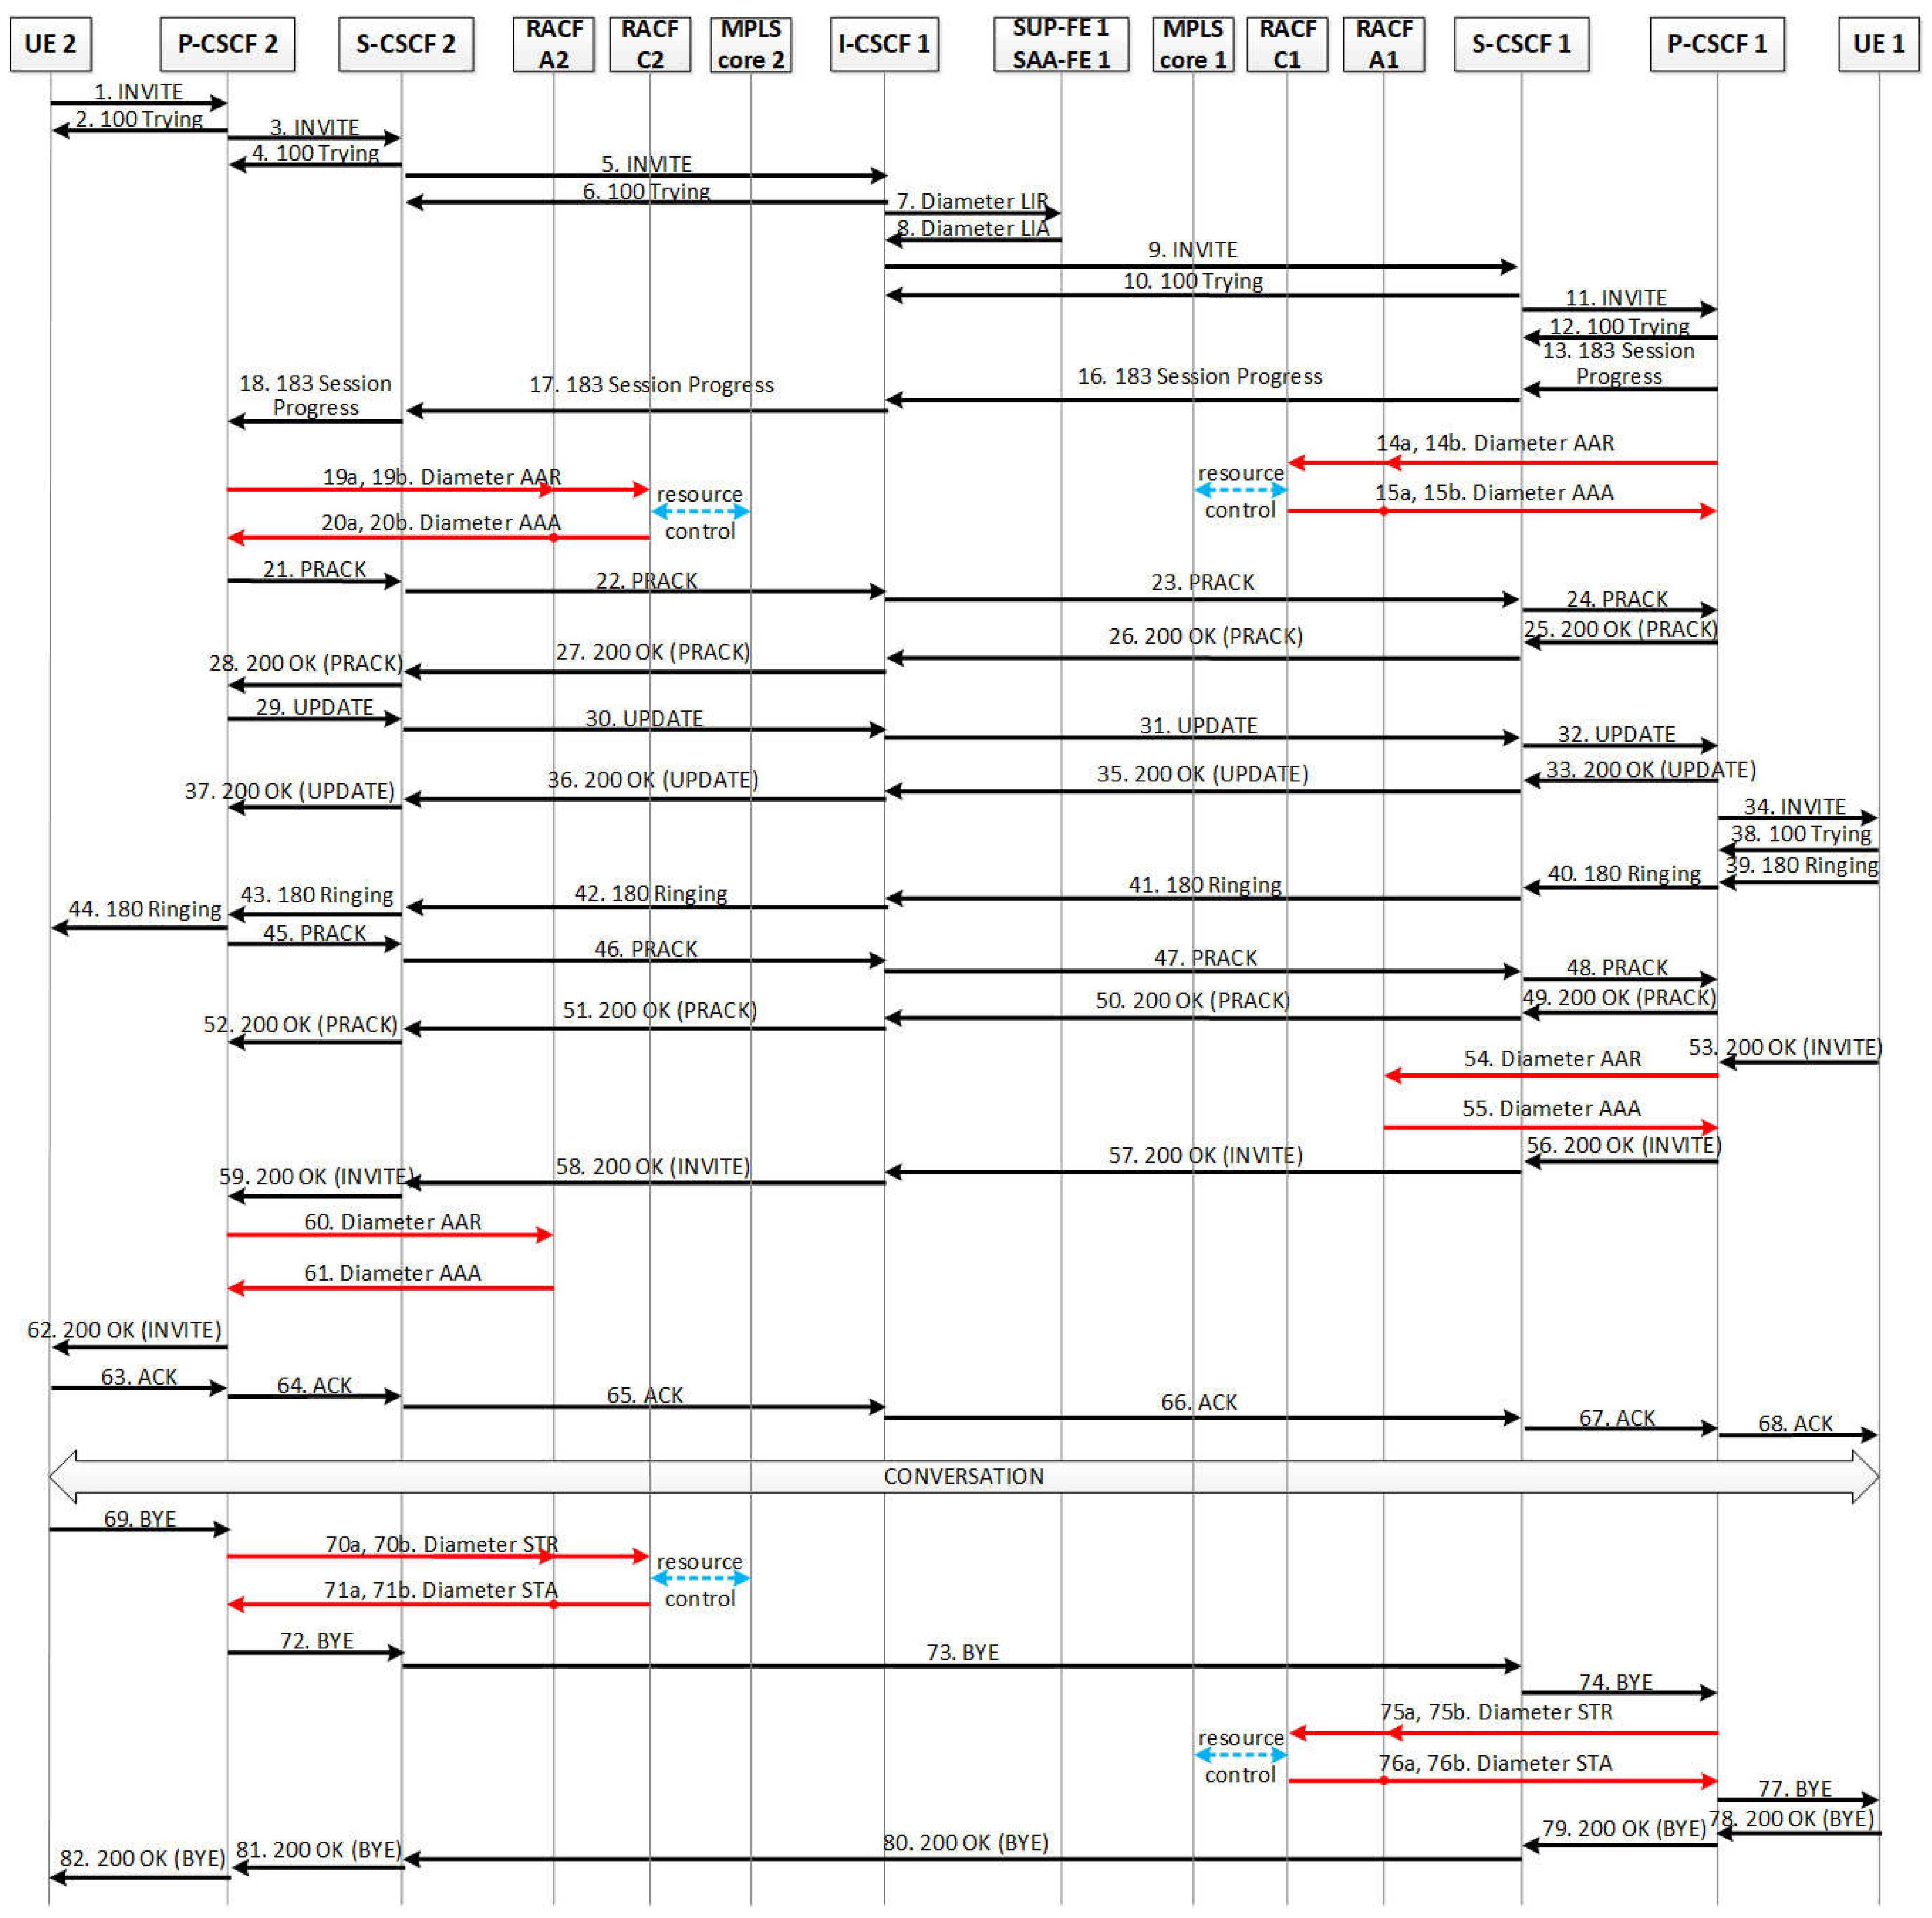
  • Originating UE (UE 2) sends call set-up request (SIP INVITE) to terminating domain (domain 1) (messages 1–11).
  • P-CSCF 1 starts transport resources reservation in access and core networks on behalf of UE 1 (messages 14–15) and informs P-CSCF 2 about initiating this process (messages 13 and 16–18).
  • P-CSCF 2 starts transport resources reservation in access and core networks on behalf of UE 2 (messages 19–20) and confirms receiving message 18 (messages 21–28).
  • P-CSCF 2 informs P-CSCF 1 about successful resource reservation (messages 29–32), and this information is confirmed (messages 33, 35–37).
  • After resources are reserved in both domains, SIP INVITE message (34) is sent to UE 1.
  • UE 1 starts ringing (messages 39–44), it is confirmed by P-CSCF 2 (messages 45–52).
  • UE 1 answers (53–62), which involves updates in packet filtration in access networks (messages 54–55 and 60–61) and ACK confirmation (messages 63–68).
  • UE 2 sends a call disengagement request (SIP BYE), which is forwarded to UE 1 and causes resource release in access and core of domains 2 and 1 (messages 69–77).
  • Resource release is confirmed (messages 78–82).
Table 1. Call scenarios in the modeled IMS/NGN network.
NameType of CallOriginating DomainSame Access AreasNecessary
Resources
SuccessfulRemarks
b1Intra-operator1YesAccess 1Yes
b2Intra-operator2YesAccess 2Yes
c1Intra-operator1YesAccess 1No
c2Intra-operator2YesAccess 2No
d1Intra-operator1NoAccess 1, core 1Yes
d2Intra-operator2NoAccess 2, core 2Yes
e1Intra-operator1NoAccess 1, core 1No
e2Intra-operator2NoAccess 2, core 2No
f1Inter-operator1NoAll networksYes
f2Inter-operator2NoAll networksYes
g1Inter-operator1NoAll networksNoVariant 1
g2Inter-operator2NoAll networksNoVariant 1
h1Inter-operator1NoAll networksNoVariant 2
h2Inter-operator2NoAll networksNoVariant 2
It is very important that, according to the abovementioned quota-based approach used in MPLS core networks, not all resource control operations performed by RACF C1 and RACF C2 involve communication with MPLS LERs (“MPLS core 1” and “MPLS core 2” blocks; Figure 2) for changes of LSP bandwidth. Blue arrows with dashed lines are used in Figure 2 to illustrate this optional communication between RACF units and controlled MPLS networks.
The aim of our research is to evaluate selected CPP parameters in a multidomain IMS/NGN network with an MPLS-based transport stratum, which is depicted in Figure 1. For this reason, an analytical traffic model was developed [11] which uses definable queuing models (M/M/1 or M/G/1; Figure 3) to reflect the operation of CSCF servers and RACF C1 and RACF C2 units as well as all links between network elements. The choice of queuing models will be commented on later in this section. Modeling of the structure in Figure 1 comes down to the network of queuing systems and selected elements represented by random variables (RACF A1, RACF A2, SUP-FE 1/SAA-FE 1, SUP-FE 2/SAA-FE 2 and MPLS domains; details are provided later). Unfortunately, this network does not meet the assumptions of Jackson’s theorem, so it cannot be used to determine the probabilities of the state distributions of this network. Since we are interested in the mean values of delays (E(CSD) and E(CDD)), these distributions are not necessary.
It is assumed in our model that message processing times for CSCF servers, RACF C1 and RACF C2 depend on the message type and are different for each network element. For links, message processing times (message transmission times) depend on the message lengths and link bandwidths. Random variables are used to model the response times for the remaining network elements presented in Figure 1: RACF A1, RACF A2, SUP-FE 1/SAA-FE 1 and SUP-FE 2/SAA-FE 2. For the RACF A1 and RACF A2 units, the response times include the time necessary to configure the controlled access networks.
The response times of particular MPLS domains (“MPLS core 1” and “MPLS core 2”; Figure 1) are also taken into account as random variables in the described analytical model. They include the time of processing the request by the LER beginning the LSP and changing the LSP bandwidth, which requires interaction with all MPLS routers on the path. Thus, the influence of the structure and operation of MPLS domains on the analyzed output parameters is reflected by these random variables.
Figure 2. Message flow for the f2 call scenario (black arrows—communications using SIP protocol; red arrows—Diameter protocol; blue arrows—dedicated MPLS resource control protocol).
Applsci 12 11643 g002
Figure 3. Model of CSCF servers, RACF C1, RACF C2 (left) and links (right).
Applsci 12 11643 g003
To conform to ITU-T standards [9,10] defining CPP parameters, the delays introduced by UE 1 and UE 2 (Figure 1) are not considered in calculations of these parameters.
The output variables of our traffic model are mean values of Call Set-up Delay (E(CSD)) and Call Disengagement Delay (E(CDD)) evaluated individually for all successful call scenarios presented in Table 1 (scenarios b1, b2, d1, d2, f1 and f2). To distinguish between the evaluated CPP parameters, the names of scenarios are used in their indexes—e.g., E(CSD)b1 represents mean CSD for scenario b1. The calculations of the output parameters are based on the input variables of the traffic model, which can be divided into the following groups:
  • Intensities of requests generated in both domains:
    • UE registration request intensity (lambdaR vector);
    • Intra-operator call set-up request intensity (lambda1d vector);
    • Inter-operator call set-up request intensity (lambda2d vector).
  • Processing times for network elements containing message queues (CSCF servers, RACF C1 and RACF C2):
    • Times of processing SIP INVITE message by CSCF servers in both domains (TINV vector);
    • Time of message authorization and request type determination by RACF C1 and RACF C2 (TA vector);
    • Time of performing elementary database operations by RACF C1 and RACF C2 (Tproc vector);
    • Time of processing a response from LER by RACF C1 and RACF C2 (Tresp vector).
  • Response times of network elements modeled as random variables (MPLS domains, RACF A1, RACF A2, SUP-FE 1/SAA-FE 1 and SUP-FE 2/SAA-FE 2):
    • Mean response time of “MPLS core 1” and “MPLS core 2 (ETR vector);
    • Mean time of processing requests by RACF A1 and RACF A2 (EXA vector);
    • Mean time of processing requests by SUP-FE 1/SAA-FE 1 and SUP-FE 2/SAA-FE 2 (EY vector).
  • Parameters of the transport stratum:
    • Ratio of calls involving multiple access areas to all intra-operator calls generated in domains 1 and 2 (rC vector);
    • Probability of transport resource unavailability in all access and core networks (pb vector);
    • Probability of a successful bandwidth reservation or increase without the necessity of increasing LSP bandwidth in MPLS core networks of operators 1 and 2 (p11 vector);
    • Probability of a bandwidth release or decrease without the necessity of decreasing LSP bandwidth in MPLS core networks of operators 1 and 2 (p21 vector).
  • Link parameters:
    • Lengths (d vector);
    • Bandwidths (b vector).
  • Types of queuing models for CSCF servers, RACF C1, RACF C2 and links (M/M/1 or M/G/1).
In our analytical model of a multidomain IMS/NGN network with an MPLS-based transport stratum, the E(CSD) and E(CDD) times for successful call scenarios are calculated based on the definitions given by ITU-T [9,10]. The calculations are performed by summation of mean values of component delays, which correspond to sending messages through links and message sojourn in different network elements. These delays result from the set of messages exchanged in a particular call scenario as well as network elements “visited” by these messages. For m “visited” links and n “visited” network elements:
C P P x = i = 1 m T l i n k i + j = 1 n T N E j ,
where:
  • C P P x is the E(CSD) or E(CDD) for the scenario x = b1, b2, d1, d2, f1 or f2;
  • T l i n k i is a delay corresponding to sending a message through the i-th link;
  • T N E j is a delay corresponding to message sojourn in the j-th network element.
The delays related to sending messages through links ( T l i n k i ) can be further decomposed:
T l i n k i = T l i n k w i + T l i n k t i + T l i n k p i ,
where:
  • T l i n k w i represents mean message waiting time in a communication queue storing messages when links are busy (to obtain the value of this delay, the M/M/1 or M/G/1 queuing model is applied);
  • T l i n k t i is a message transmission time calculated by dividing the message length by the link bandwidth (message lengths are set according to the values measured experimentally in Ref. [22]; link bandwidths are taken from the b vector);
  • T l i n k p i is a propagation time proportional to link length (taken from the d vector) and equal to 5μs/km for optical links.
For network elements whose response times are modeled as random variables, message sojourn times ( T N E j ) are simply included in calculations of E(CSD) and E(CDD) times by taking mean values of these random variables (ETR, EXA and EY vectors). Message sojourn times in the network elements containing queues can be calculated as follows:
T N E j = T N E w j + T N E p j ,
where:
  • T N E w j represents mean message waiting time in the CPU queue buffering messages when the CPU is busy (to obtain the value of this delay, the M/M/1 or M/G/1 queuing model is applied);
  • T N E p j is a message processing time.
For each CSCF server, which is the j-th network element in (1), message processing times are calculated in the following way:
T N E p j = a m s g T I N V ,
where:
  • a m s g is a factor determining the time of processing a message msg in relation to the time of processing the SIP INVITE message (this parameter depends only on the message type and does not depend on the CSCF server type);
  • T I N V   is the SIP INVITE message processing time by a particular CSCF server, and values of this time for all CSCF servers are stored in the TINV vector.
The message processing times ( T N E p j ) of RACF C1 and RACF C2 are obtained by appropriately summing elements of the TA, Tproc and Tresp vectors. Components of these sums are dependent on the type of resource operation and the necessity of adjusting LSP bandwidth. Detailed calculations are described in Ref. [23].
It is worth noting that the method of constructing our analytical model is universal. Therefore, it can be used to develop new analytical models, which would allow analysis of other aspects of the IMS/NGN network operation or even analysis of other network types. For example, IMS/NGN resource virtualization can be investigated in which new instances of individual IMS servers are launched in order to guarantee quality (defined by values of E(CSD) and E(CDD)) as the load increases. Then, new virtual machines for a specific type of server can be added, and when the load decreases, they can be removed, as suggested in Ref. [24]. In this way, the use of resources allocated for service control in the service stratum can be optimized.
Implementation of the analytical traffic model for the IMS/NGN network with service stratum resource virtualization requires modification of the previously presented network model (Figure 1) and the set of service scenarios (Table 1). They must take into account the fact that there are many instances of individual IMS servers in the network working in parallel, to which messages generated in particular service scenarios are distributed. Then, according to the service scenarios, messages handled by these servers are sent to subsequent network elements that may be implemented in one or more instances. Thus, in addition to changing the number of network elements, the number of links and the way of handling messages in the network also change.
The general calculation methodology presented in this section (Formulas (1)–(4)) is suitable for computing mean values of CSD and CDD times in the modified IMS/NGN network structure involving virtualization of service stratum resources. Its advantage is the uncomplicated method of obtaining final results by summation of the mean values of message sojourn times in links and network elements, which is dedicated to engineering applications. Of course, the detailed formulas for E(CSD) and E(CDD) times in the service stratum resource virtualization case need to be modified to take into account the fact that message streams are split into multiple substreams at certain points in the network, served by multiple instances of individual IMS servers, and the resulting messages are then recombined into a single stream. The average time of all the abovementioned operations, taken into account during the calculation of the E(CSD) and E(CDD) times, can be computed as the weighted average of the sojourn time of individual message substreams in the appropriate links and instances of IMS servers. The weights of particular message substreams correspond to their share in the total stream of exchanged messages.
To analyze various configurations of IMS/NGN service stratum virtualization, the described steps should be repeated to create a set of analytical traffic models, each of which includes different considered numbers of IMS server instances.
It is very important that the analytical traffic model of the multidomain IMS/NGN described in this paper was successfully verified by simulations (service stratum and MPLS-based transport stratum separately; [23,25,26]). For the IMS/NGN service stratum and the MPLS-based transport stratum, simulation models were developed [23,25], in which standardized communication scenarios were implemented. The simulators take into account the most important elements of the IMS/NGN network and communication links for exchanging messages between these elements. Network elements handle messages according to definable processing times depending on the element and message type. Messages waiting to be handled are stored in FIFO queues. Similarly, in the case of communication links, FIFO queues are used, and the time of message handling depends on its length and definable link bandwidth. The exchange of messages between the modeled network elements complies with the standards, and the introduced delays result from the operation of elements and links. In this way, the implemented simulation models reflect the phenomena taking place in the real IMS/NGN network and can be a reference for examining the quality of the analytical results.
Our simulation studies described in Ref. [27] demonstrated that for exponential intervals between generated requests, message inter-arrival time distributions at the inputs of IMS/NGN network elements and links are generally not exponential but close to multimodal. This results from the overlapping of many correlated messages sent in particular service scenarios. The nature of message service time distributions is similar, and it results from the assumed method of modeling the operation of network elements and links. Each network element and link processes its own set of messages (resulting from the implemented service scenarios), where the processing times of particular messages depend on their type and the type of element/link.
The simulation model of the service stratum was used to evaluate the quality of the analytical results for overall IMS/NGN network responses (E(CSD) and E(CDD) times for all types of successful call scenarios) [26]. In the analytical research, various types of queuing models were used to calculate mean message waiting times for service in the IMS/NGN network elements and links. A wide range of queuing models were examined, regardless of how well they fit to message inter-arrival and service time distributions previously measured using simulations in Ref. [27]. The set of tested queuing models included M/M/1, M/G/1, G/G/1 approximations based on moments, PH/PH/1 and their special cases (PH/M/1 and M/PH/1) with algorithms for fitting phase-type distributions to arrival and service distributions based on moments or whole histograms. The conducted research demonstrated that M/M/1 and M/G/1 models are sufficient for analysis of E(CSD) and E(CDD) times. They offer good conformity with reference simulation results and lead to fast calculations without the need for additional experimental data. It is worth noting that the compliance of the analytical and simulation results for individual service systems (mean message waiting times) was not analyzed. The aim of the performed research was to assess overall IMS/NGN network responses, which are important for users and operators.
The experiments presented in Ref. [11] indicate that the overall analytical traffic model containing the IMS/NGN service stratum and the MPLS-based transport stratum works correctly. Consequently, it can be used in thorough investigations on how parameters of traffic sources and an IMS/NGN network with an MPLS-based transport stratum influence CPP parameters. The results of these investigations are presented in the next section.

4. Results and Discussion

4.1. Research Assumptions

The performed experiments are described by the input data sets depicted in Table 2. For CSCF servers, RACF C1, RACF C2 and links, M/M/1 queuing models were applied. For each data set, elements of two selected input variables (vectors) corresponding to domain 1 were widely modified according to Table 2, while the remaining elements of the selected vectors (corresponding to domain 2) as well as the elements of other vectors were left unchanged. Such an approach allowed investigating how modifications of particular input variables in domain 1 would affect CPP parameters in both domains. The obtained results can be used to determine changes in all output parameters when more than one input variable in domain 1 or input variables in both domains are manipulated.

4.2. Results

The results of the conducted experiments are summarized in Table 3, where the following terminology is used:
  • + indicates that a particular output variable increases when values of the selected parameter of domain 1 are higher (l represents linear increase; n—nonlinear increase);
  • − indicates that a particular output variable decreases when values of the selected parameter of domain 1 are higher (l represents linear decrease; n—nonlinear decrease);
  • 0 represents no impact of the selected parameter of domain 1 on a particular output variable;
  • ≈0 represents a negligible impact of the selected parameter of domain 1 on a particular output variable.
Table 2. Input data sets (D1 represents values of input variables for domain 1; D2—domain 2; when not specified, the same values of input variables were applied for both domains).
Input VariableData Set 1Data Set 2Data Set 3Data Set 4Data Set 5Data Set 6Data Set 7Data Set 8
lambdaR [1/s]D1: 0–350
D2: 50
50505050505050
lambda1d [1/s]D1: 0–100
D2: 50
50505050505050
lambda2d [1/s]50D1: 0–100
D2: 50
505050505050
TINV [ms]0.5D1: 0–0.8
D2: 0.5
0.50.50.50.50.50.5
TA [ms]0.50.5D1: 0.05–2.5
D2: 0.5
0.50.50.50.50.5
Tproc [µs]5050D1: 5–600
D2: 50
5050505050
Tresp [ms]0.50.50.5D1: 0.05–2.9
D2: 0.5
0.50.50.50.5
ETR [ms]555D1: 0–1000
D2: 5
5555
EXA [ms]10101010D1: 0–400
D2: 10
101010
EY [ms]10101010D1: 0–400
D2: 10
101010
rC0.50.50.50.50.5D1: 0–1
D2: 0.5
0.50.5
pb00000D1: 0–0.1
D2: 0
00
p110.40.40.40.40.40.4D1: 0–1
D2: 0.4
0.4
p210.40.40.40.40.40.4D1: 0–1
D2: 0.4
0.4
d [km]200200200200200200200D1: 1–1000
D2: 200
b [Mbit/s]50505050505050D1: 1–200
D2: 50
Analysis of Table 3 can lead to the conclusion that there are groups of output variables which react identically to modifications of all investigated parameters of domain 1. For these output variables (e.g., E(CSD)d1, E(CSD)f1, E(CDD)d1 and E(CDD)f1), the columns of Table 3 are the same. From the twelve columns of Table 3 corresponding to different types of CPP parameters, only four are unique. Consequently, there are four groups of CPP parameters which are influenced by changes in the parameters of domain 1 in the same way. Of course, within these four groups, there are differences in the values of particular CPP parameters. For example, E(CDD) times are always lower than E(CSD) times for the same types of call scenarios (call disengagement process is less complicated than call set-up process), and mean CSD and CDD times for inter-operator calls are higher than those for intra-operator calls (the former involve much more communication between elements).
In the next part of this section, detailed CPP results (Figure 4, Figure 5, Figure 6, Figure 7, Figure 8, Figure 9, Figure 10 and Figure 11) are presented for the abovementioned four groups of CPP parameters—as their representatives, E(CSD)b1, E(CSD)f1, E(CSD)b2 and E(CSD)f2 are chosen. Moreover, changes in all output variables according to the groups of the input variables described in Section 3 are discussed.
Table 3. Impact of changing input variables in domain 1 on CPP parameters in both domains.
Input
Variable (domain 1)
E(CSD)b1E(CSD)d1E(CSD)f1E(CDD)b1E(CDD)d1E(CDD)f1E(CSD)b2E(CSD)d2E(CSD)f2E(CDD)b2E(CDD)d2E(CDD)f2
lambdaR+n+n+n+n+n+n00+n00+n
lambda1d+n+n+n+n+n+n00+n00+n
lambda2d+n+n+n+n+n+n+n+n+n+n+n+n
TINV+n+n+n+n+n+n00+n00+n
TA0+n+n0+n+n00+n00+n
Tproc0+n+n0+n+n00+n00+n
Tresp0+n+n0+n+n00+n00+n
ETR0+l+l0+l+l00+l00+l
EXA+l+l+l+l+l+l00+l00+l
EY00000000+l000
rC≈0≈0≈0≈0≈0≈000≈000≈0
pb≈0≈0≈0≈0≈0≈0≈0≈0≈0≈0≈0≈0
p110−n−n0−n−n00000−n
p210−n−n0−n−n00000−n
d+l+l+l+l+l+l00+l00+l
b−n−n−n−n−n−n00−n00−n
Figure 4. Selected results for data set 1 from Table 1.
Applsci 12 11643 g004
The registration and call set-up request intensities (lambdaR, lambda1d and lambda2d; Figure 4 and Figure 5) increase the load of network elements and links, resulting in nonlinear growth of the analyzed CPP parameters. As registration and intra-operator calls do not involve elements of multiple domains, modifications of lambdaR and lambda1d in domain 1 affect only mean CSD and mean CDD times for scenarios in which communication is performed in domain 1 (scenarios b1, d1, f1 and f2). When lambda2d (call set-up request intensity for inter-operator calls which use both domains 1 and 2) is increased, the CPP parameters for scenarios b2 and d2 are also affected, but this effect is much weaker than for other types of call scenarios (Figure 5).
Figure 5. Selected results for data set 2 from Table 1.
Applsci 12 11643 g005
Figure 6. Selected results for data set 3 from Table 1.
Applsci 12 11643 g006
The message processing times by CSCF servers and RACF C1 (TINV, TA, Tproc and Tresp; Figure 5, Figure 6 and Figure 7) affect loads of these network elements. Higher values of these parameters nonlinearly increase mean CSD and mean CDD times (similarly to request intensities). When elements of the TINV vector are modified in domain 1, the CPP parameters for all scenarios in which messages are exchanged in this domain are affected (scenarios b1, d1, f1 and f2). Changes in the message processing times (TA, Tproc and Tresp) of RACF C1 influence only mean CSD and mean CDD times for call scenarios with resource reservation in the MPLS core network of operator 1 (scenarios d1, f1 and f2).
Figure 7. Selected results for data set 4 from Table 1.
Applsci 12 11643 g007
Figure 8. Selected results for data set 5 from Table 1.
Applsci 12 11643 g008
For network elements whose response times are specified by random variables, larger mean values of these random variables (ETR, EXA and EY) result in proportionally higher E(CSD) and E(CDD) times (Figure 7 and Figure 8). The set of affected CPP parameters is, however, dependent on the parameter modified in domain 1. Changes in the mean time of processing requests by RACF A1 (EXA) have an impact on the E(CSD) and E(CDD) times for all scenarios with resource reservation in the access network of operator 1 (scenarios b1, d1, f1 and f2). The mean response time of the operator 1 MPLS network (ETR) influences only CPP parameters for call scenarios with resource allocation in this network (scenarios d1, f1 and f2). A very interesting case is that of modifying the mean time of processing requests by SUP-FE 1/SAA-FE 1 (EY). This network element is only used during the set-up of inter-operator calls originated in domain 2, so increasing its processing time increases only E(CSD)f2 and has no impact on other CPP parameters.
Figure 9. Selected results for data set 6 from Table 1.
Applsci 12 11643 g009
Figure 10. Selected results for data set 7 from Table 1.
Applsci 12 11643 g010
Figure 11. Selected results for data set 8 from Table 1.
Applsci 12 11643 g011
Modification of the rC and pb parameters in domain 1 (Figure 9) has a very small influence on CPP parameters. Increasing the ratio of calls involving multiple access areas to all intra-operator calls generated in domain 1 (rC) makes resource reservations in the MPLS core network of operator 1 more common, which results in more messages exchanged in domain 1 and, consequently, a higher load of network elements. As a result, the E(CSD) and E(CDD) times for scenarios b1, d1, f1 and f2 are slightly increased. A higher probability of transport resource unavailability in the access and core networks of operator 1 (pb) leads to more unsuccessful call scenarios, which involves sending and processing less messages compared to successful ones. This results in a slightly lower load of all network elements and links in both domains and lower values of all CPP parameters.
Higher values of the p11 and p21 probabilities describing the operation of the MPLS core network of operator 1 (Figure 10) result in more resource operations (bandwidth reservation or increase—p11; bandwidth release or decrease—p21) performed only by updating the resource state in the RACF C1 database (without communication with LERs). This decreases mean CSD and CDD times for scenarios d1 and f1, in which resource operations in the core network of operator 1 are necessary. A similar decrease can be observed in the values of E(CDD)f2. Interestingly, the values of E(CSD)f2 are not affected by modifications of the p11 and p21 probabilities. It results from the fact that during the set-up of inter-operator calls generated in domain 2 (scenario f2), there are two concurrent processes (Figure 2):
  • Resource reservation in the destination domain 1 (messages 14–15);
  • Communication from domain 1 to domain 2 (messages 13 and 16–18), resource reservation in the originating domain 2 (messages 19–20) and communication from domain 2 to domain 1 (confirmation of resource reservation; messages 29–32).
Typically, the second process is much more time-consuming and has a decisive influence on E(CSD)f2. Such a situation took place for the examined sets of input variables. The time necessary for resource reservation in the core network of operator 1 does not have an impact on E(CSD)f2, independently of the applied values of the p11 and p21 parameters.
The last data set (Figure 11) examines the influence of link parameters in domain 1 on the analyzed CPP parameters. Higher link lengths (d) increase mean CSD and mean CDD times linearly due to distance-dependent propagation times. Such a situation applies for all call scenarios with message exchange in domain 1 (scenarios b1, d1, f1 and f2). The same CPP parameters are affected by the values of the link bandwidth (b) in domain 1. Increasing b in domain 1 decreases mean CSD and mean CDD times nonlinearly. Overly low values of bandwidth can lead to link overload and cause E(CSD) and E(CDD) times to rise to infinity.

4.3. Discussion

The presented results allow drawing synthetic conclusions on how modifying the IMS/NGN network and traffic source parameters in domain 1 affects all analyzed CPP parameters:
  • The intensities of requests significantly affect E(CSD) and E(CSD) times:
    • Registration and intra-operator call set-up requests generated in domain 1 (lambda and lambda1d) increase only CPP parameters for scenarios performed in domain 1 (b1, d1, f1 and f2);
    • Inter-operator call set-up requests generated in domain 1 (lambda2d) increase all investigated CPP parameters.
  • The processing/response times of network elements increase E(CSD) and E(CSD) times dependent on the type of network element and its usage in particular call scenarios:
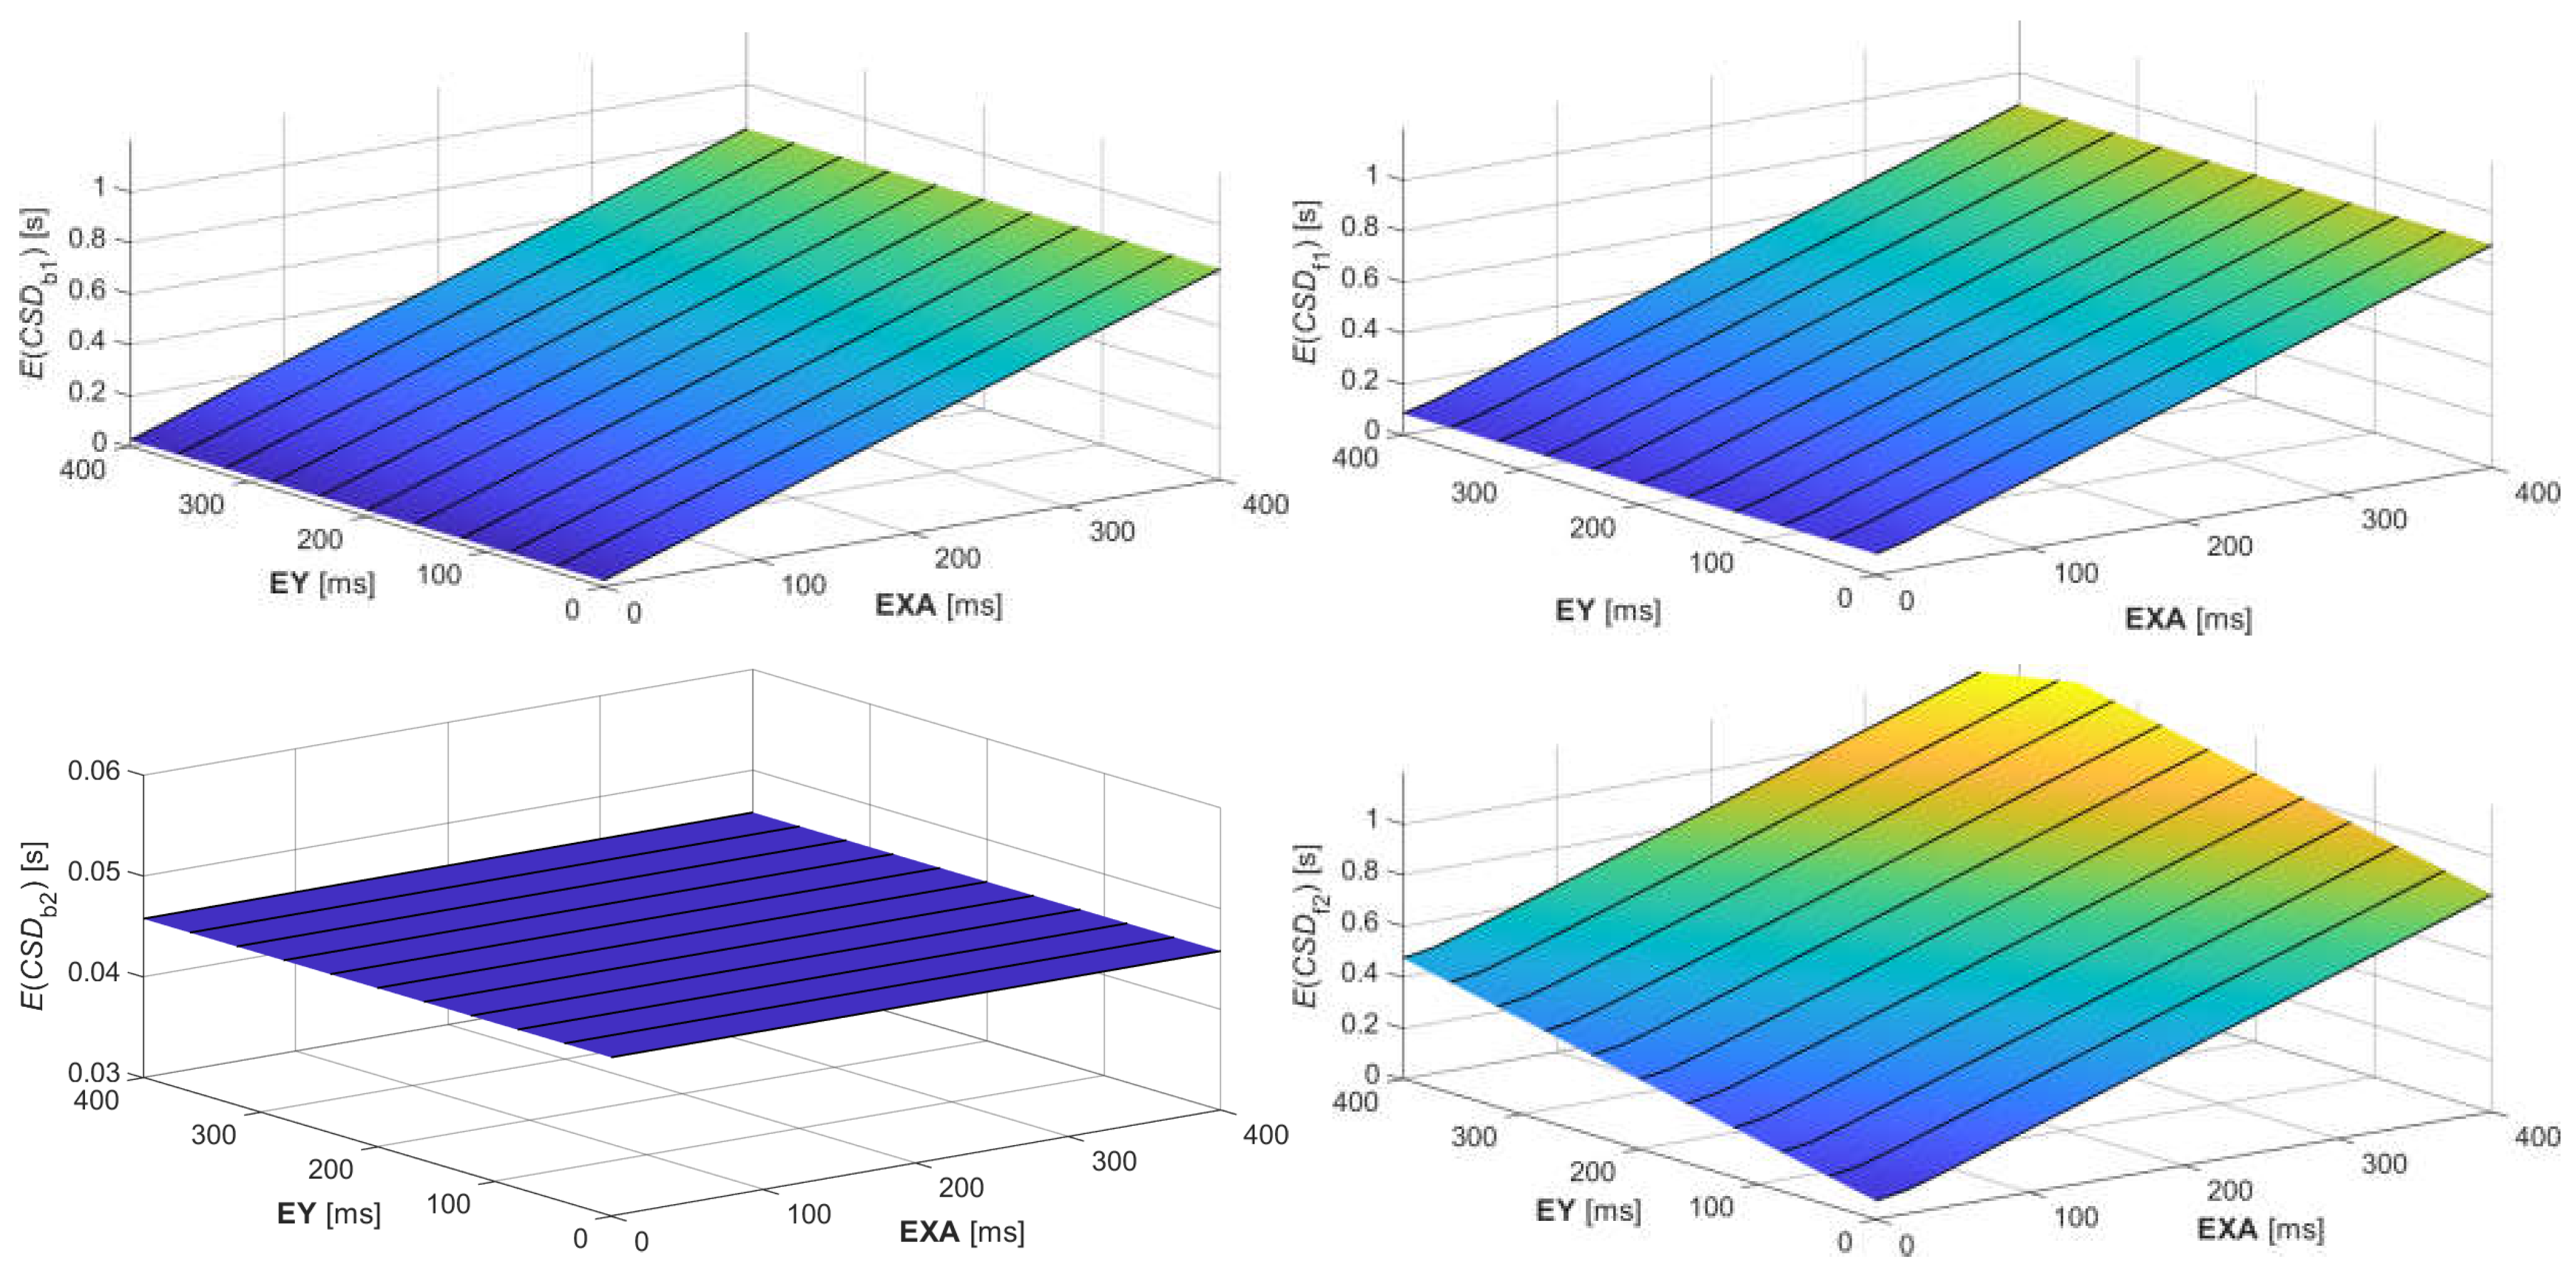
    • Changing the times of processing SIP INVITE messages by CSCF servers in domain 1 (TINV) and the mean time of processing requests by RACF A1 (EXA) affects CPP parameters for all call scenarios performed in domain 1 (b1, d1, f1 and f2);
    • Modification of the message processing times of RACF C1 (TA, Tproc and Tresp) and the mean response time of “MPLS core 1” (ETR) affects only CPP parameters for call scenarios with resource reservation in the core network of domain 1 (d1, f1 and f2);
    • Changing the mean time of processing requests by SUP-FE 1/SAA-FE 1 (EY) influences only E(CSD)f2, as this network element is used solely in establishing inter-operator calls originated in domain 2.
  • Link parameters in domain 1 affect E(CSD) and E(CSD) times for all call scenarios performed in domain 1 (b1, d1, f1 and f2):
    • Link lengths (d) have an influence on propagation delays and increase the analyzed CPP parameters linearly;
    • Sufficient link bandwidths (b) must be assured, as below a certain bandwidth level, E(CSD) and E(CSD) times rise rapidly.
  • Other parameters of our traffic model (rC, pb, p11 and p21) do not have a significant impact on the analyzed CPP parameters.
Based on the abovementioned remarks, it is possible to indicate the influence of the IMS/NGN network and traffic source parameters in domain 2 on the analyzed E(CSD) and E(CDD) times using the rule of symmetry. For example, larger values of lambdaR and lambda1d in domain 1 increase the analyzed CPP parameters for scenarios b1, d1, f1 and f2. Similar changes in lambdaR and lambda1d values in domain 2 will affect the E(CSD) and E(CDD) times for scenarios b2, d2, f2 and f1.
As a result of identifying the relations between the input and output parameters of our traffic model, the performed research (Table 3, Figure 4, Figure 5, Figure 6, Figure 7, Figure 8, Figure 9, Figure 10 and Figure 11) allows grouping the parameters of the IMS/NGN network with an MPLS-based transport stratum into three categories, which correspond to their importance for the network operator and designer. The first group contains input variables with a significant impact on CPP parameters, which must definitely be taken into account during network analysis and design. This group includes most of the input variables of our model: lambdaR, lambda1d, lambda2d, TINV, TA, Tproc, Tresp, EXA, ETR, d and b. The second group consists of network parameters that generally have little effect on E(CSD) and E(CDD) times: EY, p11 and p21. The EY input variable affects only one CPP parameter of the twelve analyzed, while the p11 and p21 probabilities have a very limited impact on several output parameters. The third group includes input parameters with a negligible influence on mean CSD and CDD times: rC and pb.
It is worth noting that from the group of input variables that most affect E(CSD) and E(CDD) times, mainly the request intensities (lambdaR, lambda1d and lambda2d), which have a direct impact on the offered traffic load, change during normal operation of the IMS/NGN network. The results of our research (Figure 4 and Figure 5) can be used to indicate at which threshold values of these intensities E(CSD) and E(CDD) times become unacceptable. As the intensities approach these thresholds, additional instances of IMS servers can be launched, as described in Section 3, which will result in decreasing E(CSD) and E(CDD). For a later decrease in request intensities, these additional instances may be turned off, thus optimizing the resources of the IMS/NGN network service stratum.

5. Conclusions

This paper presents investigations on the impact of IMS/NGN network and traffic source parameters on E(CSD) and E(CDD) times. These times belong to the set of call processing performance parameters, which proper values must be ensured in the network to achieve user satisfaction with the provided services. In the performed research, our analytical traffic model of a multidomain IMS/NGN network based on the MPLS technology in the transport stratum was used. The model allows the calculation of E(CSD) and E(CDD) times for all types of successful call scenarios with respect to an extensive set of input variables regarding the service and transport stratum.
During the investigations, particular input variables in domain 1 were modified, and the effect of these modifications on all E(CSD) and E(CDD) times was examined. The obtained results can be used to determine changes in all output parameters when any combinations of input variables in domains 1 and/or 2 are modified. The performed experiments also allowed indicating the network and traffic source parameters with a significant influence on E(CSD) and E(CSD), which should be definitively taken into account during IMS/NGN network analysis and design. They include the intensities of registration requests as well as intra- and inter-operator call set-up requests; the processing times of CSCF servers, RACF C1 and RACF C2; the mean response time of RACF A1, RACF A2 and MPLS domains as well as link lengths and bandwidths.
Our future work will include extensions of the analytical traffic model. Our aim is to take into account more details regarding the structure and operation of MPLS core networks, which affect, for example, the probability of transport resource unavailability in these networks. We are also planning to include modeling of user (voice) traffic in MPLS transport networks and apply segment routing [28,29] for transport resource optimization. Another planned research pursuit is to use the experience gained from the experiments described in this paper to create a set of analytical traffic models enabling the analysis of IMS/NGN service stratum resource virtualization, which is mentioned in Section 3. In such a solution, there exist several instances of the same types of IMS servers working in parallel, where the number of active instances depends on the network load, which results from, among others, the values of request intensities. Increasing the number of active IMS server instances will reduce the E(CSD) and E(CDD) times for the same values of request intensities.

Author Contributions

Conceptualization, S.K. and M.S.; methodology, S.K. and M.S.; software, M.S.; validation, S.K. and M.S.; formal analysis, S.K.; investigation, S.K. and M.S.; data curation, S.K. and M.S.; writing—original draft preparation, M.S.; writing—review and editing, S.K.; visualization, M.S.; supervision, S.K. All authors have read and agreed to the published version of the manuscript.

Funding

This research received no external funding.

Institutional Review Board Statement

Not applicable.

Informed Consent Statement

Not applicable.

Data Availability Statement

Not applicable.

Conflicts of Interest

The authors declare no conflict of interest.

References

  1. ITU-T Recommendation Y.2001; General Overview of NGN. ITU: Geneva, Switzerland, 2004.
  2. ITU-T Recommendation Y.2012; Functional Requirements and Architecture of Next Generation Networks. ITU: Geneva, Switzerland, 2010.
  3. 3GPP TS 23.228: IP Multimedia Subsystem (IMS), version 17.3.0.; Stage 2 (Release 17); 3GPP: Valbonne, France, 2021.
  4. Chang, Y.-C.; Li, J.-W.; Lv, J.-H. An IP Multimedia Subsystem Services Proxy Gateway Based on a JAVA Dynamic Module System. Appl. Sci. 2018, 8, 2060. [Google Scholar] [CrossRef] [Green Version]
  5. Bahaa, A.; Shehata, M.; Gasser, S.M.; El-Mahallawy, M.S. Call Failure Prediction in IP Multimedia Subsystem (IMS) Networks. Appl. Sci. 2022, 12, 8378. [Google Scholar] [CrossRef]
  6. Liao, L.; Leung, V.C.M.; Chen, M. Virtualizing IMS Core and Its Performance Analysis. In Cloud Computing. CloudComp 2014. Lecture Notes of the Institute for Computer Sciences, Social Informatics and Telecommunications Engineering; Leung, V., Lai, R., Chen, M., Wan, J., Eds.; Springer: Cham, Switzerland, 2015; Volume 142. [Google Scholar]
  7. Rosen, E.; Viswanathan, A.; Callon, R. IETF RFC 3031: Multiprotocol Label Switching Architecture; IETF: Wilmington, NC, USA, 2001. [Google Scholar]
  8. ITU-T Recommendation Y.2175; Centralized RACF Architecture for MPLS Core Networks. ITU: Geneva, Switzerland, 2008.
  9. ITU-T Recommendation Y.1530; Call Processing Performance for Voice Service in Hybrid IP Networks. ITU: Geneva, Switzerland, 2007.
  10. ITU-T Recommendation Y.1531; SIP-Based Call Processing Performance. ITU: Geneva, Switzerland, 2007.
  11. Kaczmarek, S.; Sac, M. Analytical Traffic Model for a Multidomain IMS/NGN Network Including Service and Transport Stratum. In Proceedings of the 30th International Conference on Software, Telecommunications and Computer Networks, SoftCOM 2022, Split, Croatia, 22–24 September 2022. [Google Scholar]
  12. Oveis, A.H.; Asadi, M.A.S.; Homami, S.M.S. A trade-off between delay and throughput in IMS network session setup. In Proceedings of the 22nd Iranian Conference on Electrical Engineering, ICEE 2014, Tehran, Iran, 20–22 May 2014; pp. 1614–1618. [Google Scholar]
  13. Alassane, B.A.; Karim, K. An analytical jitter model in IMS network. In Proceedings of the 2016 IEEE 7th Annual Ubiquitous Computing, Electronics & Mobile Communication Conference, UEMCON 2016, New York, NY, USA, 20–22 October 2016. [Google Scholar]
  14. Hasanov, M.H.; Ibrahimov, B.G.; Mardanov, N.T. Research and Analysis Performance Indicators NGN/IMS Networks in the Transmission Multimedia Traffic. In Proceedings of the 2019 Wave Electronics and its Application in Information and Telecommunication Systems, WECONF 2019, St. Petersburg, Russia, 3–7 June 2019. [Google Scholar]
  15. Ibrahimov, B.G.; Ismaylova, S.R. The effectiveness NGN/IMS networks in the establishment of a multimedia session. Am. J. Netw. Commun. 2018, 7, 1–5. [Google Scholar]
  16. Romanov, O.I.; Nesterenko, M.M.; Veres, L.A.; Hordashnyk, Y.S. IMS: Model and calculation method of telecommunication network’s capacity. In Proceedings of the 2017 International Conference on Information and Telecommunication Technologies and Radio Electronics, UkrMiCo 2017, Odessa, Ukraine, 11–15 September 2017. [Google Scholar]
  17. Rodríguez, M.A.V.; Muñoz, E.C. Review of Quality of Service (QoS) mechanisms over IP Multimedia Subsystem (IMS). Ing. Y Desarro. 2017, 35, 262–281. [Google Scholar] [CrossRef]
  18. Di Mauro, M.; Galatro, G.; Longo, M.; Postiglione, F.; Tambasco, M. Performability Management of Softwarized IP Multimedia Subsystem. In Proceedings of the NOMS 2020—2020 IEEE/IFIP Network Operations and Management Symposium, Budapest, Hungary, 20–24 April 2020; pp. 1–6. [Google Scholar]
  19. Di Mauro, M.; Galatro, G.; Longo, M.; Postiglione, F.; Tambasco, M. IP Multimedia Subsystem in a containerized environment: Availability and sensitivity evaluation. In Proceedings of the 2019 IEEE Conference on Network Softwarization (NetSoft), Paris, France, 24–28 June 2019; pp. 42–47. [Google Scholar]
  20. Prados-Garzon, J.; Ameigeiras, P.; Ramos-Munoz, J.J.; Andres-Maldonado, P.; Lopez-Soler, J.M. Analytical modeling for Virtualized Network Functions. In Proceedings of the 2017 IEEE International Conference on Communications Workshops (ICC Workshops), Paris, France, 21–25 May 2017; pp. 979–985. [Google Scholar]
  21. Zhang, Z.; Duan, Z.; Hou, Y. On Scalable Design of Bandwidth Brokers. IEICE Trans. Commun. 2001, E84-B, 2011–2025. [Google Scholar]
  22. Abhayawardhana, V.S.; Babbage, R. A traffic model for the IP Multimedia Subsystem (IMS). In Proceedings of the IEEE 65th Vehicular Technology Conference, VTC 2007, Dublin, Ireland, 22–25 April 2007. [Google Scholar]
  23. Kaczmarek, S.; Łuczaj, Ł.; Sac, M. Simulation Model of IMS/NGN with Transport Stratum Based on MPLS Technology. Telecommun. Rev. Telecommun. News 2016, 777–784. [Google Scholar] [CrossRef]
  24. Femminella, M.; Giacinti, F.; Reali, G. Optimal deployment of open source application servers providing multimedia services. IEEE Netw. 2014, 28, 54–63. [Google Scholar] [CrossRef]
  25. Kaczmarek, S.; Sac, M. Verification of the Analytical Traffic Model of a Multidomain IMS/NGN Using the Simulation Model. In Information Systems Architecture and Technology: Proceedings of the 36th International Conference on Information Systems Architecture and Technology—ISAT 2015—Part II. Advances in Intelligent Systems and Computing, Karpacz, Poland, 20-22 September 2015; Grzech, A., Borzemski, L., Świątek, J., Wilimowska, Z., Eds.; Springer: Cham, Switzerland, 2016; Volume 430, pp. 109–130. [Google Scholar]
  26. Kaczmarek, S.; Sac, M. Performance Models of a Multidomain IMS/NGN Service Stratum. In Proceedings of the 29th International Conference on Software, Telecommunications and Computer Networks, SoftCOM 2021, Hvar, Croatia, 23–25 September 2021. [Google Scholar]
  27. Kaczmarek, S.; Sac, M. Approximation of message inter-arrival and inter-departure time distributions in IMS/NGN architecture using phase-type distributions. J. Telecommun. Inf. Technol. 2013, 9–18. Available online: https://www.itl.waw.pl/czasopisma/JTIT/2013/3/9.pdf (accessed on 10 September 2022).
  28. Ventre, P.L.; Salsano, S.; Polverini, M.; Cianfrani, A.; Abdelsalam, A.; Filsfils, C.; Camarillo, P.; Clad, F. Segment Routing: A Comprehensive Survey of Research Activities, Standardization Efforts, and Implementation Results. IEEE Commun. Surv. Tutor. 2021, 23, 182–221. [Google Scholar] [CrossRef]
  29. Desmouceaux, Y.; Pfister, P.; Tollet, J.; Townsley, M.; Clausen, T. SRLB: The Power of Choices in Load Balancing with Segment Routing. In Proceedings of the 2017 IEEE 37th International Conference on Distributed Computing Systems, ICDCS 2017, Atlanta, GA, USA, 5–8 June 2017; pp. 2011–2016. [Google Scholar]
Publisher’s Note: MDPI stays neutral with regard to jurisdictional claims in published maps and institutional affiliations.

