Article

Concept and Architecture for Applying Continuous Machine Learning in Multi-Access Routing at Underground Mining Vehicles

VTT Technical Research Centre of Finland Ltd., 90571 Oulu, Finland
*
Author to whom correspondence should be addressed.
Appl. Sci. 2022, 12(20), 10679; https://doi.org/10.3390/app122010679
Submission received: 16 September 2022 / Revised: 13 October 2022 / Accepted: 18 October 2022 / Published: 21 October 2022
(This article belongs to the Section Computing and Artificial Intelligence)

Abstract

:

Featured Application

System and method for continuously improving or adapting multi-access router path selection of autonomous moving vehicles in changing environments.

Abstract

Autonomous moving vehicles facilitate mining of ore in underground mines. The vehicles are usually equipped with many sensor-based devices (e.g., Lidar, video camera, proximity sensor, etc.), which enable environmental monitoring, and remote control of the vehicles at the control center. Transfer of sensor-based data from the vehicles towards the control center is challenging due to limited connectivity enabled by the multi-access technologies of the communication infrastructure (e.g., 5G, Wi-Fi) within the underground mine, and the mobility of the vehicles. This paper presents design, development, and evaluation of a concept and architecture enabling continuous machine learning (ML) for optimizing route selection of real-time streaming data in a real and emulated underground mining environment. Continuous ML refers to training and inference based on the most recently available data. Experiments in the emulator indicated that utilization of a ML-based model (based on the RandomForestRegressor) in decision making achieved ~5–13% lower one-way delay in streaming data transfers, when compared to a simpler heuristic model.

1. Introduction

Autonomous moving vehicles (e.g., loaders and trucks) are developed for facilitating the mining of ore in underground mining [1]. Such moving vehicles may include many sensor devices (e.g., Lidar, radar, and video camera) collecting data for enabling remote control and autonomous operation of the vehicles. The data from the sensor devices may need to be transferred towards a control center [2] for monitoring and remote control purposes. An underground mine may include a wireless communication infrastructure, which supports multiple network access technologies (e.g., 5G/Wi-Fi). Thus, the autonomous vehicles need to choose an optimal wireless access point for routing data transfers towards the control center. Additionally, telecom device manufacturers (e.g., vehicular computing unit manufacturer, wireless communication infrastructure provider) face the challenge of varying customer environments and uses for their products, due to the constant environment-related changes in a mine. Thus, the telecom manufacturers have a need to continuously update features of their products for optimal performance.
Routing and access selection in autonomous vehicles may be studied with simulators or emulators before transitioning solutions into a real mining environment. A simulator tries to mimic behavior of a system in a simulation environment. For example, wireless network topology and connectivity is simulated with the NS-3 simulator engine [3]). On the other hand, an emulator [4] duplicates HW/SW features of a system (e.g., wireless network connection emulation between virtual machines in real wired networks). Simulators simplify many architectural elements, which could alternatively be realized and tested in emulation environments. Thus, transitioning into a real operational mining environment should be easier after preliminary testing in emulation environments. Additionally, simulator-based approaches achieve a lower technology readiness (TRL) level (3), when compared to approaches including emulators (4–5). In this paper, we focused on an emulator-based approach for optimizing the routing and multi-access selection problem of moving vehicles in an underground mine. Particularly, a continuous machine learning (ML)-based approach was selected for facilitating access point selection in order to optimize one-way delay (OWD) between a moving vehicle and control center. A lower OWD should enable better quality of service of the products/services utilized at the control center for monitoring and controlling the mobile vehicles.
Continuous ML refers [5] to the ability to periodically train and evaluate ML-based model(s) (based on the most recent data), which are updated for supporting decision making. For example, an incremental learning method and system for autonomous robot navigation was proposed [6]. Additionally, design of a best path selection algorithm, which can solve the problem of path planning for intelligent driving vehicles in the case of restricted driving, traffic congestions, and accidents, was presented [7]. Continuous ML-based decision making for multi-path radio access routing in an emulated mining environment was not solved, although ML-based decision making in multi-path routing was proposed [8,9]. Development of ML-based models and applications to open radio access network (RAN) emulation environments were recently proposed, focusing on RAN scheduling and slicing [10]. Additionally, continuous ML solutions were proposed for model management (MLFlow) [11] and inference (RedisAI) [12]. MLFlow is a popular open-source platform for managing ML development, including experiment tracking, reproducibility, and deployment [11,12,13,14]. A recent approach is to incrementally train models based on the most recent data (e.g., with River [13,15,16]). Finally, swarm intelligence [17] may be utilized to collectively learn solutions to several problems. However, the current solutions on ML-based decision making in multi-path routing of moving vehicles do not consider emulated mining environments, and do not enable continuous updating of ML-based models [8,9] in such environments.
This paper presents design, development, experiments, and evaluation of multi-path/multi-access routing of moving vehicles based on continuous ML as a design science research (DSR) topic using DSR methodology (DSRM) proposed in [18]. DSR proceeds via design, development, and evaluation of artifacts and meta-artifacts, which have utility value for people and organizations in solving real world problems and achieving their goals [19]. The results in DSR may include new knowledge on artifacts and meta-artifacts for solving identified problems, as well as the artifacts embodying the new knowledge built within the DSR process. The artifacts built within the DSR process enable evaluation of the DSR results in a real-world context via experimentation in multiple phases, incrementally [20]. In this research, DSR artifacts comprise a concept and a system architecture, which is realized in an emulator. Particularly, decision making of multi-access routing in moving vehicles is facilitated based on a continuous ML approach.
The paper is organized as follows: At first, research method and process are described, and a research question is presented in Section 2. Subsequently, the concept for enabling continuous ML in emulated and real underground mining environments is presented in Section 3. Architecture design for implementation of the artifacts in emulation environments is illustrated in Section 4. In the Results Section 5, the experiments are described, and an evaluation of the artifacts is presented. In the last chapters, the results are discussed, validity and potential analyzed, and conclusions drawn and summarized. Appendix A describes the configuration of the emulator and a sequence diagram for measuring OWD in the emulator. Appendix B presents an implementation view and a screenshot of the emulator’s 3D visualization tool.

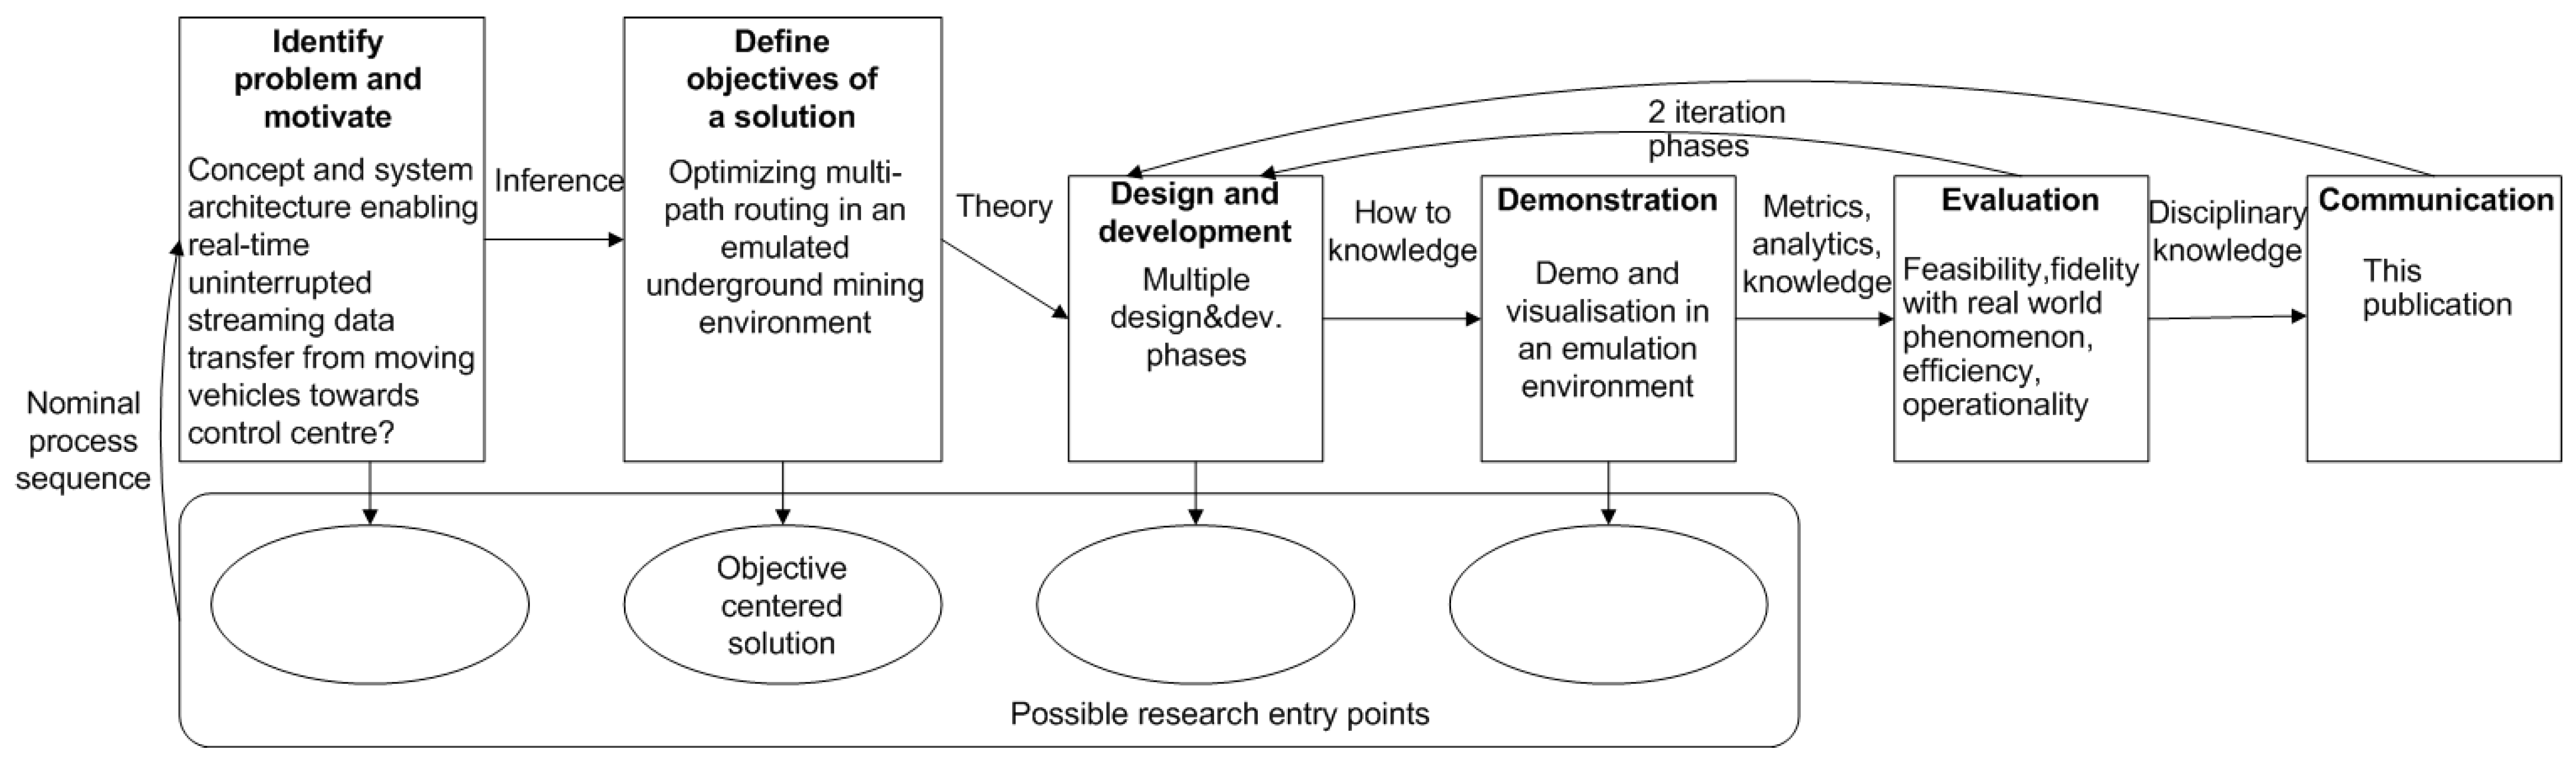
2. Research Method and Process

2.1. Research Method and Research Question

This research applies the existing DSR methodology (DSRM) [18]. The DSRM research process consists of six activities [18] (Figure 1). Initially, a research problem is defined, and the value of a solution is described and motivated. Subsequently, objectives of a solution are specified. Then, an artifact is designed and developed. The artifact can be utilized for demonstrating the solving of the research problem. Evaluation focuses on comparing objectives of a solution to the results obtained with the developed artifact(s) in use. Different evaluation criteria can be used for performing ex-post evaluations [20]. At the end of the evaluation activity, the researcher may iterate back to the design and development activity for improving performance of the solution. Finally, the problem, artifact(s), and results are communicated to the research community (typically in publications). Figure 1 illustrates the DSRM process model and its nominal process sequence and knowledge discovery targets between the phases guiding the research process [18].
In the following, our research applying the DSRM addresses the following research question:
  • What kind of concept and system architecture enables real-time uninterrupted streaming data transfer from moving vehicles towards a control center?

2.2. Research Process

Problem identification and motivation was “What kind of concept and system architecture enables real-time uninterrupted streaming data transfer from moving vehicles towards control center?” The research entry point was “Objective Centered Solution”. As the main objective, the solution should enable transfer of large amounts of delay and loss-sensitive data from moving mining vehicles to a control center. The goal is to achieve (near-) optimal multipath routing in an emulated underground mining environment. Particularly, routing of data from a moving vehicle towards the control center is the focus. Preprocessing or storing of data at the router is out of the scope for this paper.
The architecture and system were designed and implemented for realizing multi-access routing in moving vehicles based on continuous ML. Continuous ML refers to the deployment and inference of models, which are continuously trained based on the most recently available data. In the context of this paper, inference refers to predicting OWD for data transfers when a specific access point is utilized for routing. Particularly, predictions are utilized for decision making regarding the AP to be selected for routing.
Demonstration and evaluation were performed in an environment that could be used for emulating moving vehicles within an underground mining industry. In particular, data transfers from moving vehicles towards a control center (over multiple radio accesses) were emulated, and ML was utilized in decision making, regarding the most suitable path for communication. Performance of two artifact iterations was evaluated in terms of ex-post criteria [20] (feasibility, fidelity with real world phenomenon, efficiency, and operationality).
From a communications perspective, the results are described, published, and communicated in this article. The research process applied is illustrated in Figure 1.

3. Concept

3.1. Continuous ML in Emulation Environments

In the following, continuous ML for enabling multi-access routing for moving vehicles in emulation environments is described (Figure 2). The research artifacts refer to the architectural elements, which are illustrated as part of the conceptual view. The emulation process is prepared by creation of a simulated network and vehicle movement data (pre-calculated files) for emulation purposes (step 1.1). Subsequently, emulation is executed within a distributed computing environment (step 1.2), where vehicles will move and transfer data towards a control center. During emulation, network statistics are collected (step 1.3) with measurement tools (i.e., owping [21]), and the results are saved in a database (InfluxDB [22]). Next, the collected measurements (step 2.1) are used for training (sklearn [23]) a ML-based model (step 2.2) for prediction of OWD. Several models may be trained and evaluated (step 2.3), and the model with the best offline performance is selected (step 2.4) for deployment (MLFlow [11]) in the emulation environment (step 2.5). Finally, a second emulation experiment is performed (step 3.2), where the deployed ML-based model is utilized for providing OWD predictions (step 3.3) during the emulation (RedisAI [12]). The measurement data are saved (step 3.1) and used for evaluation of online performance (steps 3.4–3.5) of the prediction model. In the end, the ML-based model, which achieved the best performance in emulation, is selected for deployment into a real mine environment.
There are several research artifacts (the elements in Figure 2) in this research, which are, in general, related to the emulation environment, and the continuous ML pipeline. The artifacts are evaluated in terms of selected ex-post criteria: feasibility, operationality, fidelity with real world phenomenon, and efficiency.

3.2. Continuous ML in a Real Mining Environment

The purpose of the conceptual view (Figure 3) is to illustrate how continuous ML could be applied into real underground mining environments. Emulations (Figure 2) would be performed prior to the deployment of ML-based models into a real mining environment (step 4 in Figure 3).
A router node could be attached to a moving vehicle. The router would have other on-board devices (e.g., video camera, Lidar, and sensors), which collect data from the environment. The role of the edge node(s) is to act as a fixed access point(s) for communication, offline training of models, and optionally provisioning of inference services to router(s). The control center acts as a coordination point for managing the vehicles and services deployed in them. Additionally, the moving vehicles may communicate via other vehicles with mesh networking.
After emulation(s) are executed (Figure 2), the best performing ML-based model may be deployed directly to the router for facilitating decision making. Additionally, a new ML-based model may be trained from scratch, or an existing model may be retrained (transfer learning). In such cases, the best-performing ML-based training algorithm(s) may be reused for training in the real mining environment. When models are trained/retrained in the production environment (step 6), new monitoring data are collected from the real mining environment (step 5). ML-based models may be continuously evaluated (step 7) and deployed (step 8) into real mobile routers or into edge device(s) for facilitating decision-making purposes.

4. Architecture Design

For evaluation, the artifacts (Figure 2) were designed and implemented. In the following, the artifacts are described as part of the architectural views of the system, which were designed based on the conceptual view (Figure 2) of applying continuous ML in emulated environments.

4.1. Continuous ML Pipeline in an Emulation Environment
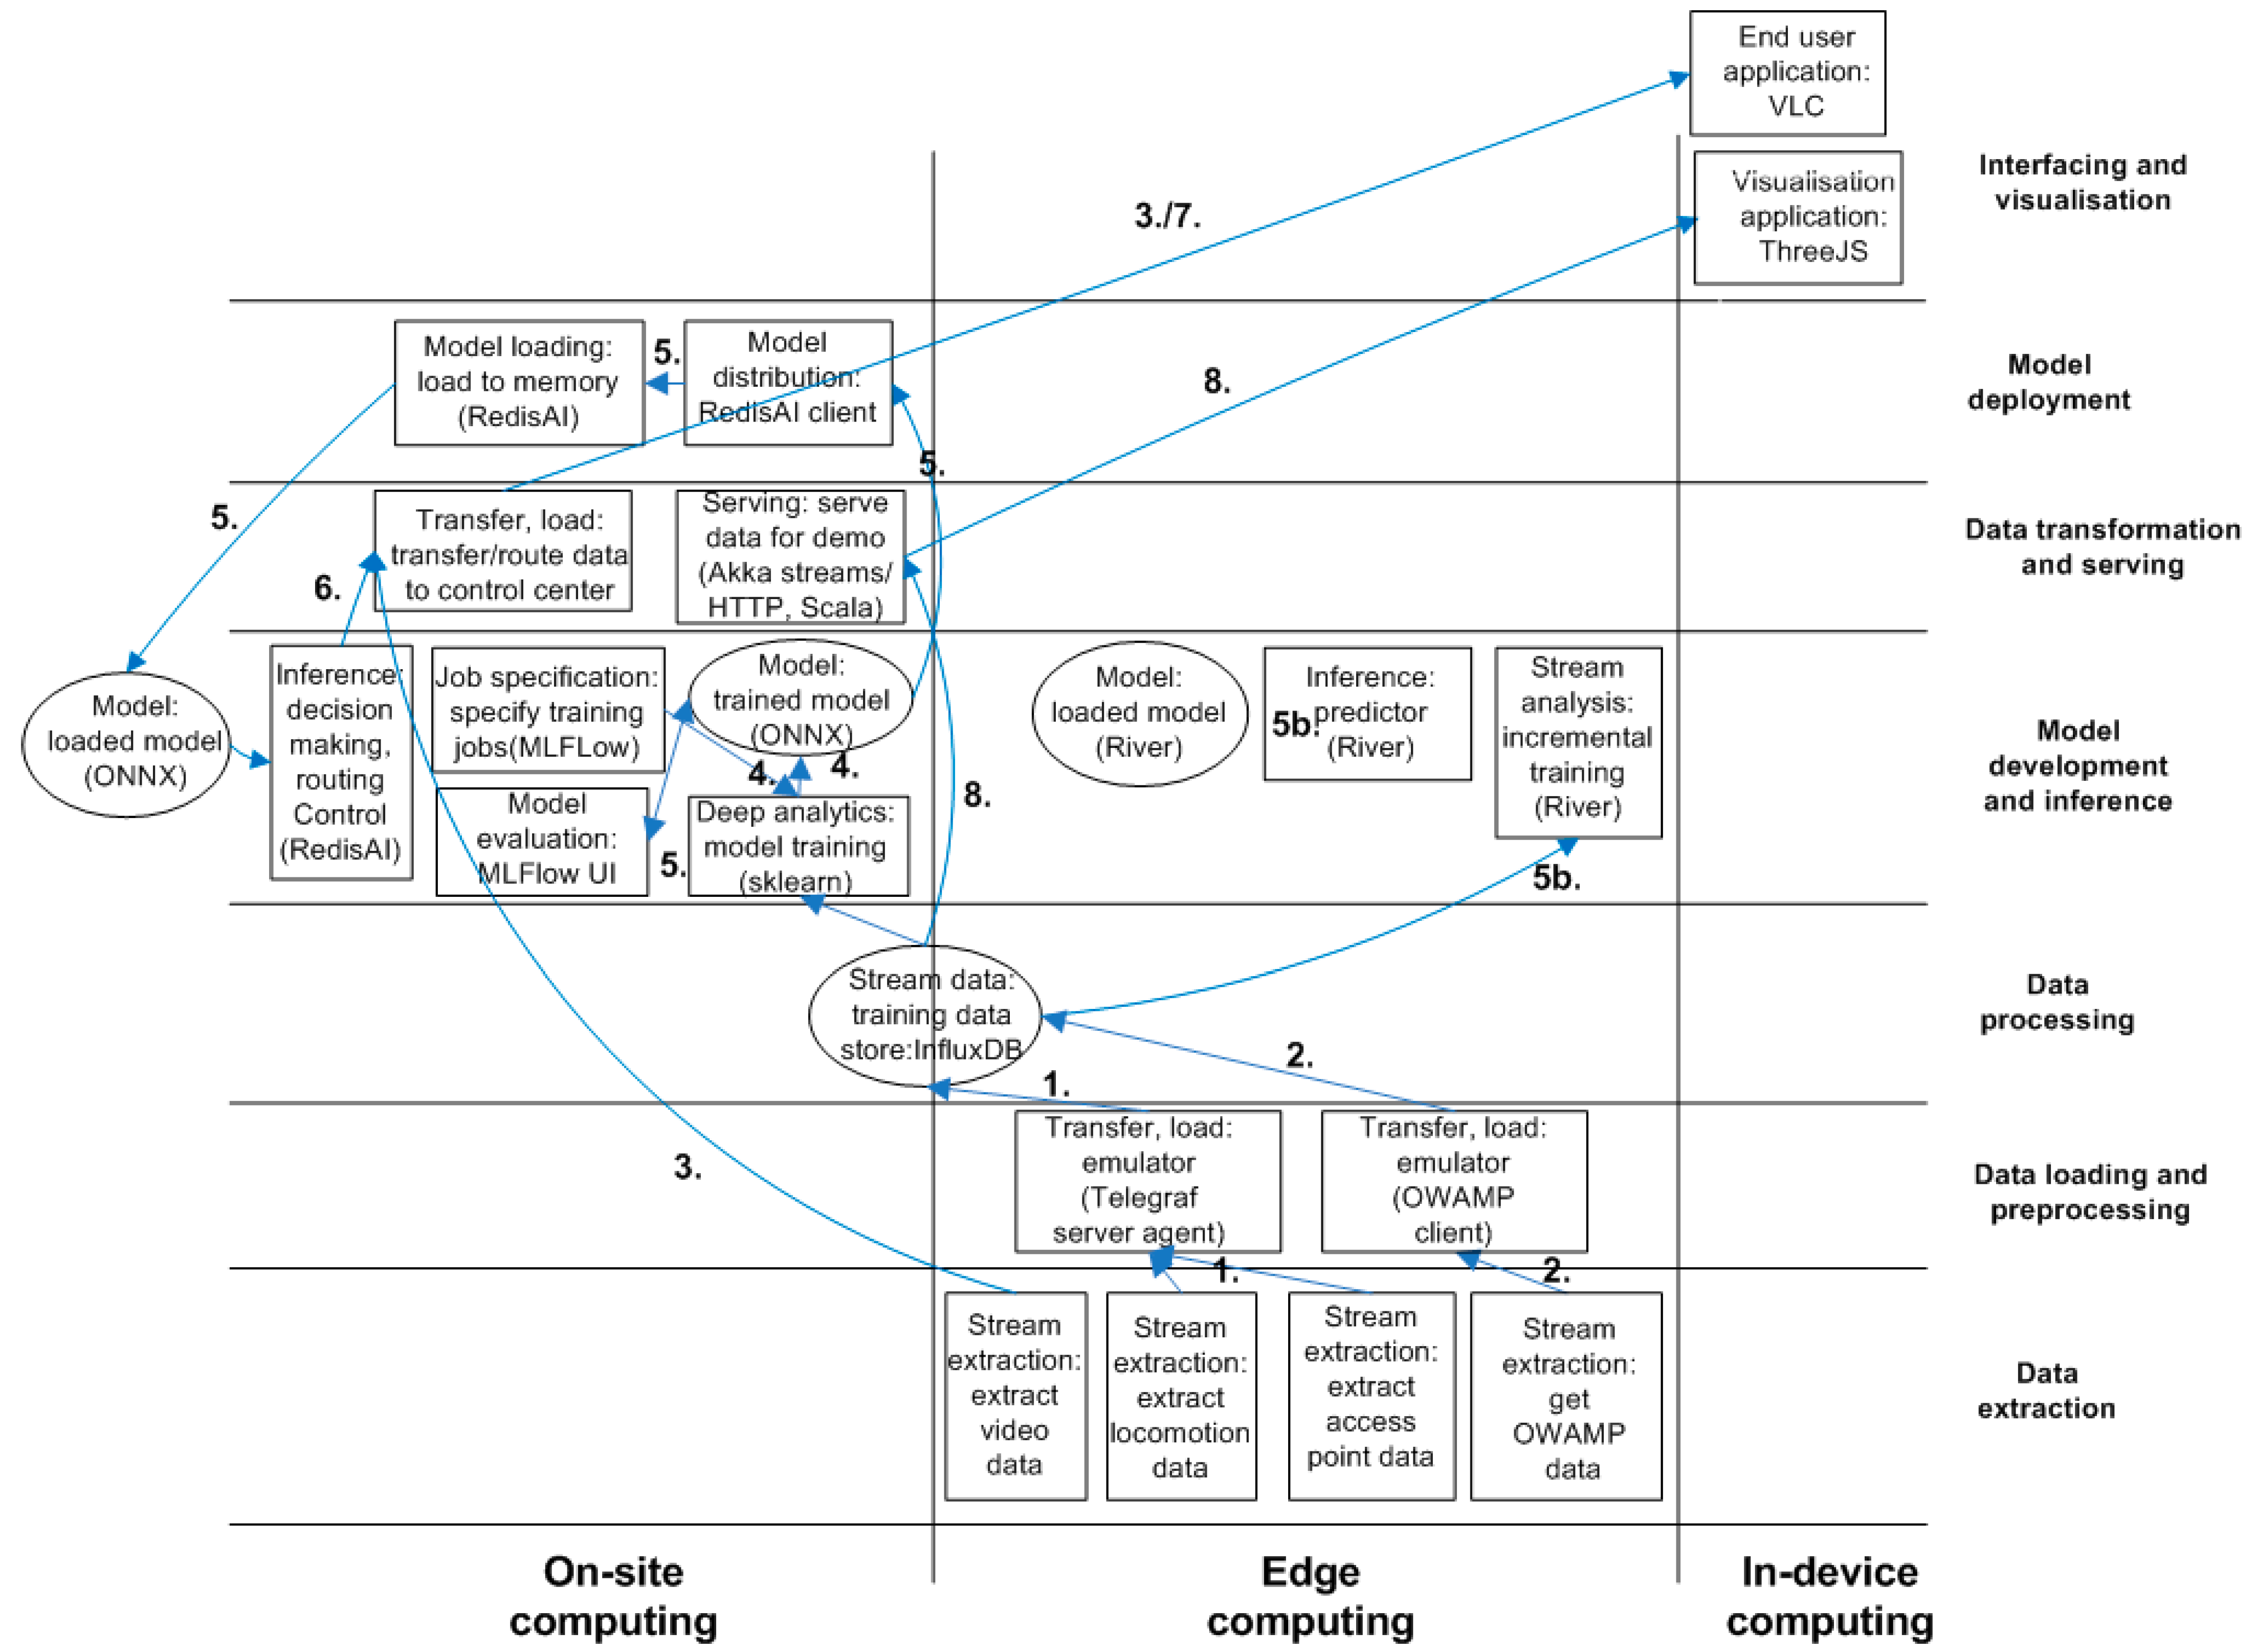
4.1.1. System View

Figure 4 presents a system view of the emulator. A router node emulates a vehicle. The role of the on-site nodes 1 and 2 is to enable continuous training of models and provide an inference service for facilitating decision making at the router. The edge node is used as a data store for training data and enables OWD measurement in the system. The control center acts as a coordination point for managing the vehicles and services deployed in them (only the visualization application was implemented).
Data are collected and loaded into the database at the router for model training purposes (performed at edge node 1 or router). In particular, access point data, vehicle direction, speed, and location data are collected. Additionally, one-way active measurement protocol (OWAMP) tools are used for collecting delay and loss information of utilized network paths. The data are loaded into a database (InfluxDB [22]) at the edge node.
Developers may manage ML pipelines with MLFlow [11], which enables evaluation of models with a user interface. On-site node 1 will distribute selected model(s) to the On-site node 2 for prediction purposes (enabled with RedisAI [12]). A batch-based ML method is utilized in offline training (sklearn [23]). Alternatively, the model may be incrementally trained at the router. In such a case, the model is updated/retrained with the most recent data (enabled with River [13]). Trained models are evaluated in terms of performance, and performance results will be utilized for determining model distribution and deployment.
A predictor at the router or at on-site node 2 will provide predictions for decision-making purposes. In particular, ‘Decision making and routing control’ will utilize predictions for deciding the optimal route to be utilized for data transfers towards the control center.
Service components may be managed at the control center based on service descriptions (not implemented). Additionally, services maybe updated continuously (not implemented).

4.1.2. Deployment Environment View

Figure 5 presents a deployment environment viewpoint of the system. The view is described based on the big data reference architecture (RA) framework, which was published earlier [24]. Architectural elements in the RA are described with ellipsis (data stores), rectangles (functionalities), and arrows (data flows). The architectural elements were placed/divided into vertical functional areas, where data flows typically from the data sources (bottom) towards the interfacing/visualization applications (up). Five deployment environments were defined for computing in the framework: in-device, on-site, MEC/edge, private cloud, and public cloud. The deployment environments are described horizontally in association with the functional areas of the high-level view of the RA as a matrix [24].
The architectural elements of our system were deployed to edge, on-site, and in-device computing environments. Edge environment refers to the nodes (i.e., edge node in Figure 4) extracting and loading data from sources. On-site computing refers to nodes (i.e., the router node and on-site nodes 1 and 2 in Figure 4) one hop closer towards the point of use (control center). Finally, in-device computing refers to mobile devices with a user interface for visualization purposes. In the following, functionality in the deployment environments is presented.
  • 1: Access point data, vehicle speed, direction, and location were extracted (at the router), transferred, and loaded into a training data store (InfluxDB) from the emulator.
  • 2: OWD was measured/extracted with OWAMP tools and the results were saved.
  • 3: Video data were streamed and transferred towards the control center for visualization purposes at end-user application (VLC).
  • 4: A ML engineer/data scientist specified jobs for model training (deep analytics), and the results were logged to MLFlow.
  • 5: The trained model(s) were evaluated via MLFlow UI, transformed to open neural network exchange (ONNX) format [25], and distributed to the inference service (RedisAI), and loaded into memory.
  • 5b: Alternatively, a ML engineer/data scientist may manage incremental ML (stream analysis) at the router. In such a case, a local inference service would be executed at the router.
  • 6: Predictions provided by RedisAI were utilized for decision-making purposes regarding multi-point routing (i.e., video stream).
  • 7: Video streams were visualized with a video player (VLC).
  • 8: Emulation data were served for 3D visualization purposes of the moving vehicles in a mining environment.
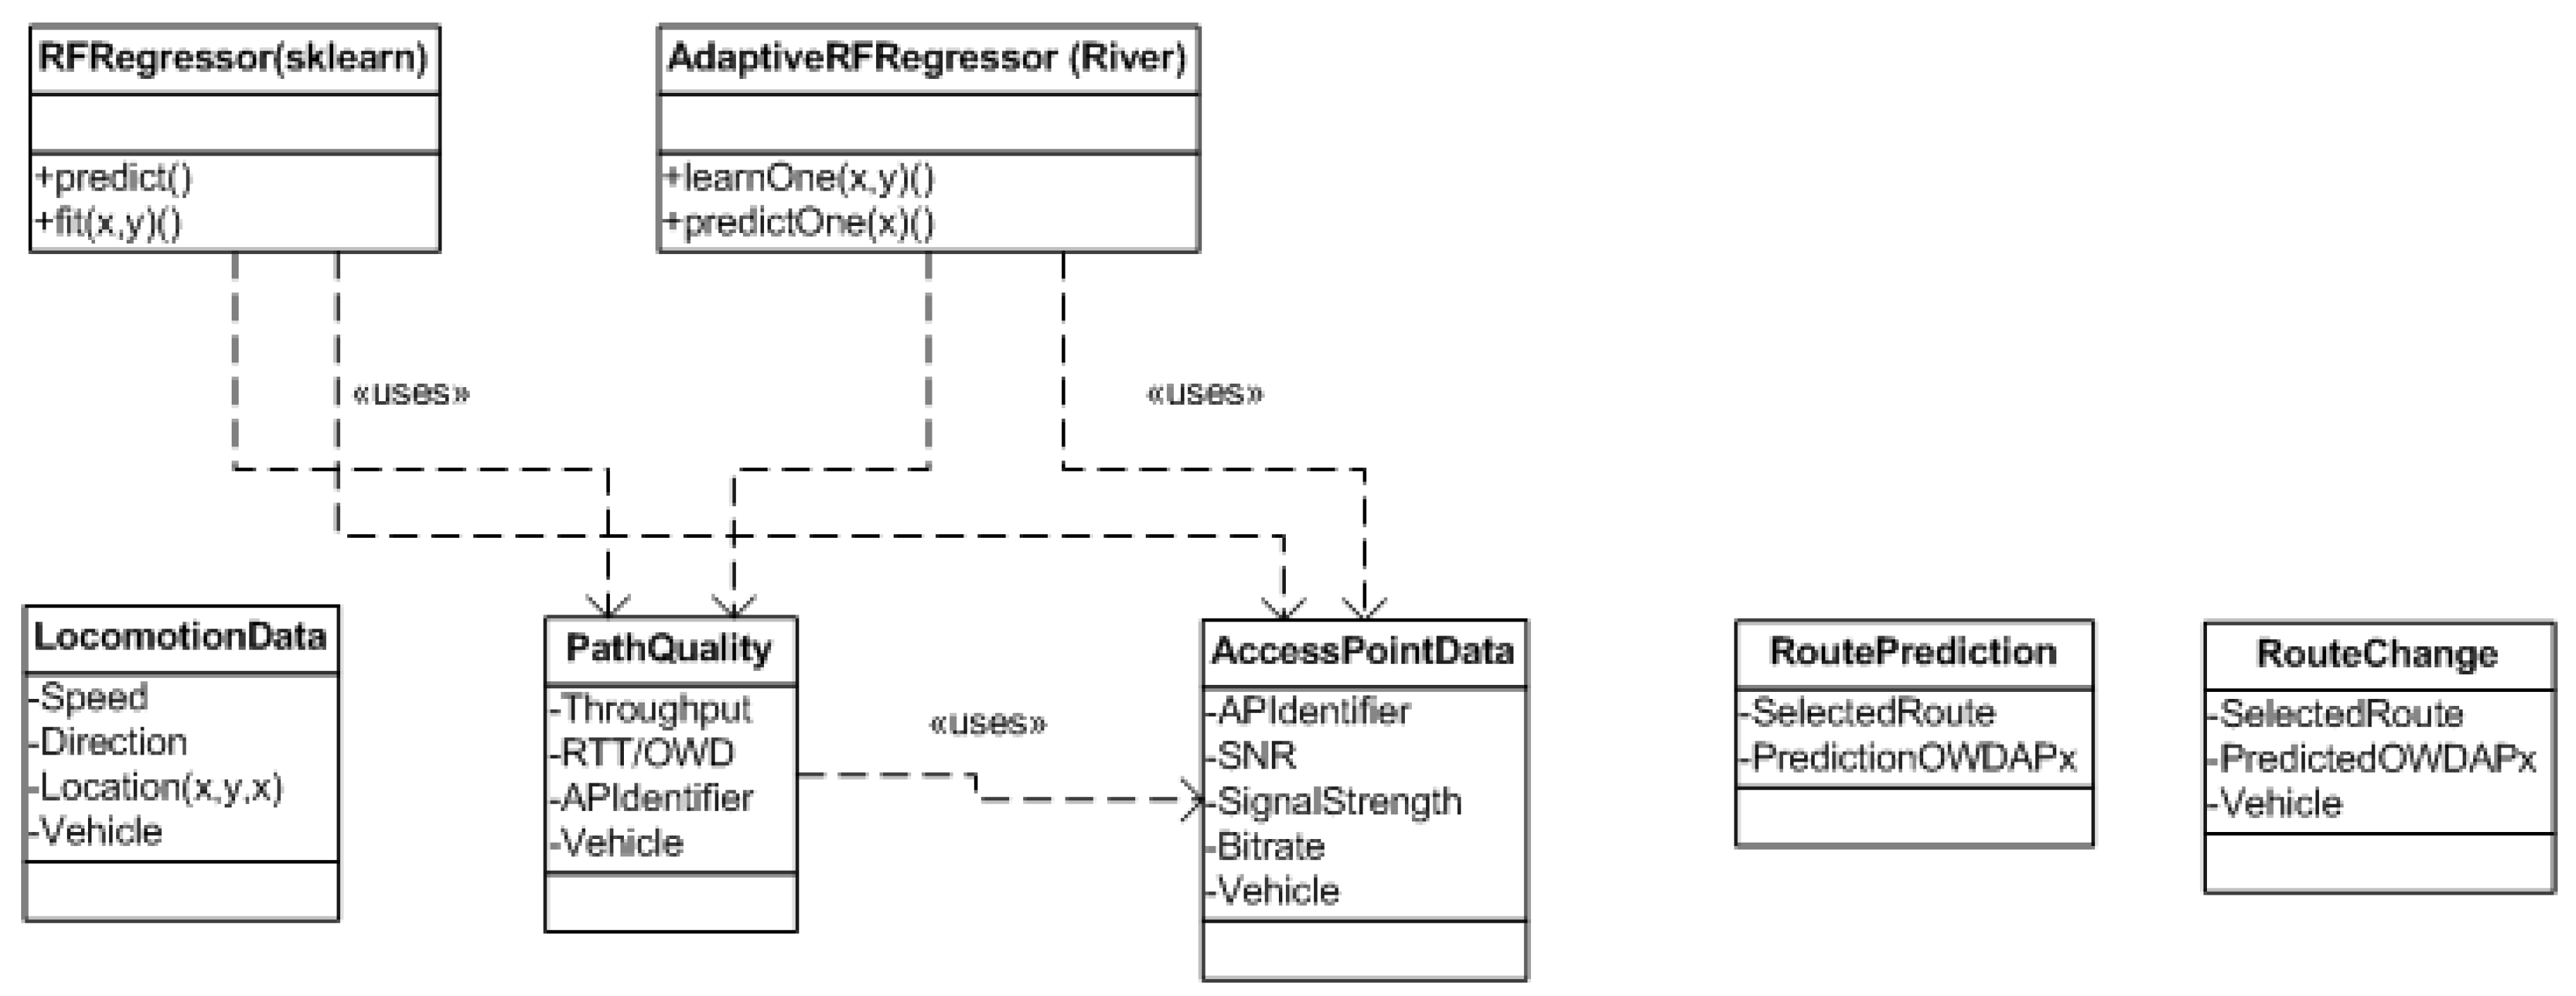
4.1.3. Data View

The class diagram in Figure 6 illustrates a data viewpoint of the architecture (i.e., InfluxDB data model). Access point and locomotion data are utilized for emulation purposes (based on pre-calculated files). OWD measurement data were collected with an OWAMP measurement tool [21] to the PathQuality table.
Collected data were used for model training purposes (RFRegressor, AdaptiveRFRegressor). The trained models were used for providing predictions, which are useful for decision making regarding multi-point routing. The RoutePrediction table was used for storing live predictions during emulation for enabling evaluation of prediction accuracy (vs. measured OWD stored in the PathQuality table). The RouteChange table was utilized for debugging of route change behavior in the emulator.

4.1.4. Model Training and Deployment

The sequence diagram (in Figure 7) illustrates model training and deployment in the system. The steps of the sequence are congruent with the conceptual view of research artifacts (Figure 2), and they are described in the following:
  • Steps 1.2–1.3: The OWAMP client is started for measurement of OWD during emulation. During/after emulation, measurement data are saved into a database (Figure 6) at the edge node.
  • Step 2.1: The ML engineer/data scientist manages ML pipelines, which includes mainly model training with different parameters. Model training is started.
  • Steps 2.11–2.3: A model training job reads training data from the database and trains a prediction model. The model is logged into MLFlow.
  • Steps 2.4–2.5: The ML engineer/data scientist may evaluate different versions of models via MLFlow UI. After evaluation, the most suitable model is selected for deployment.
  • Steps 2.5–2.53 The model is transformed into ONNX format. Subsequently, the model file is transferred to RedisAI (with a RedisAI client), where the model is loaded into memory.

4.1.5. ML-Based Inference

The sequence diagram in Figure 8 illustrates utilization of ML-based inference for facilitating decision making in multi-access routing. The steps are congruent with the conceptual view of research artifacts (Figure 2), and they are described in the following:
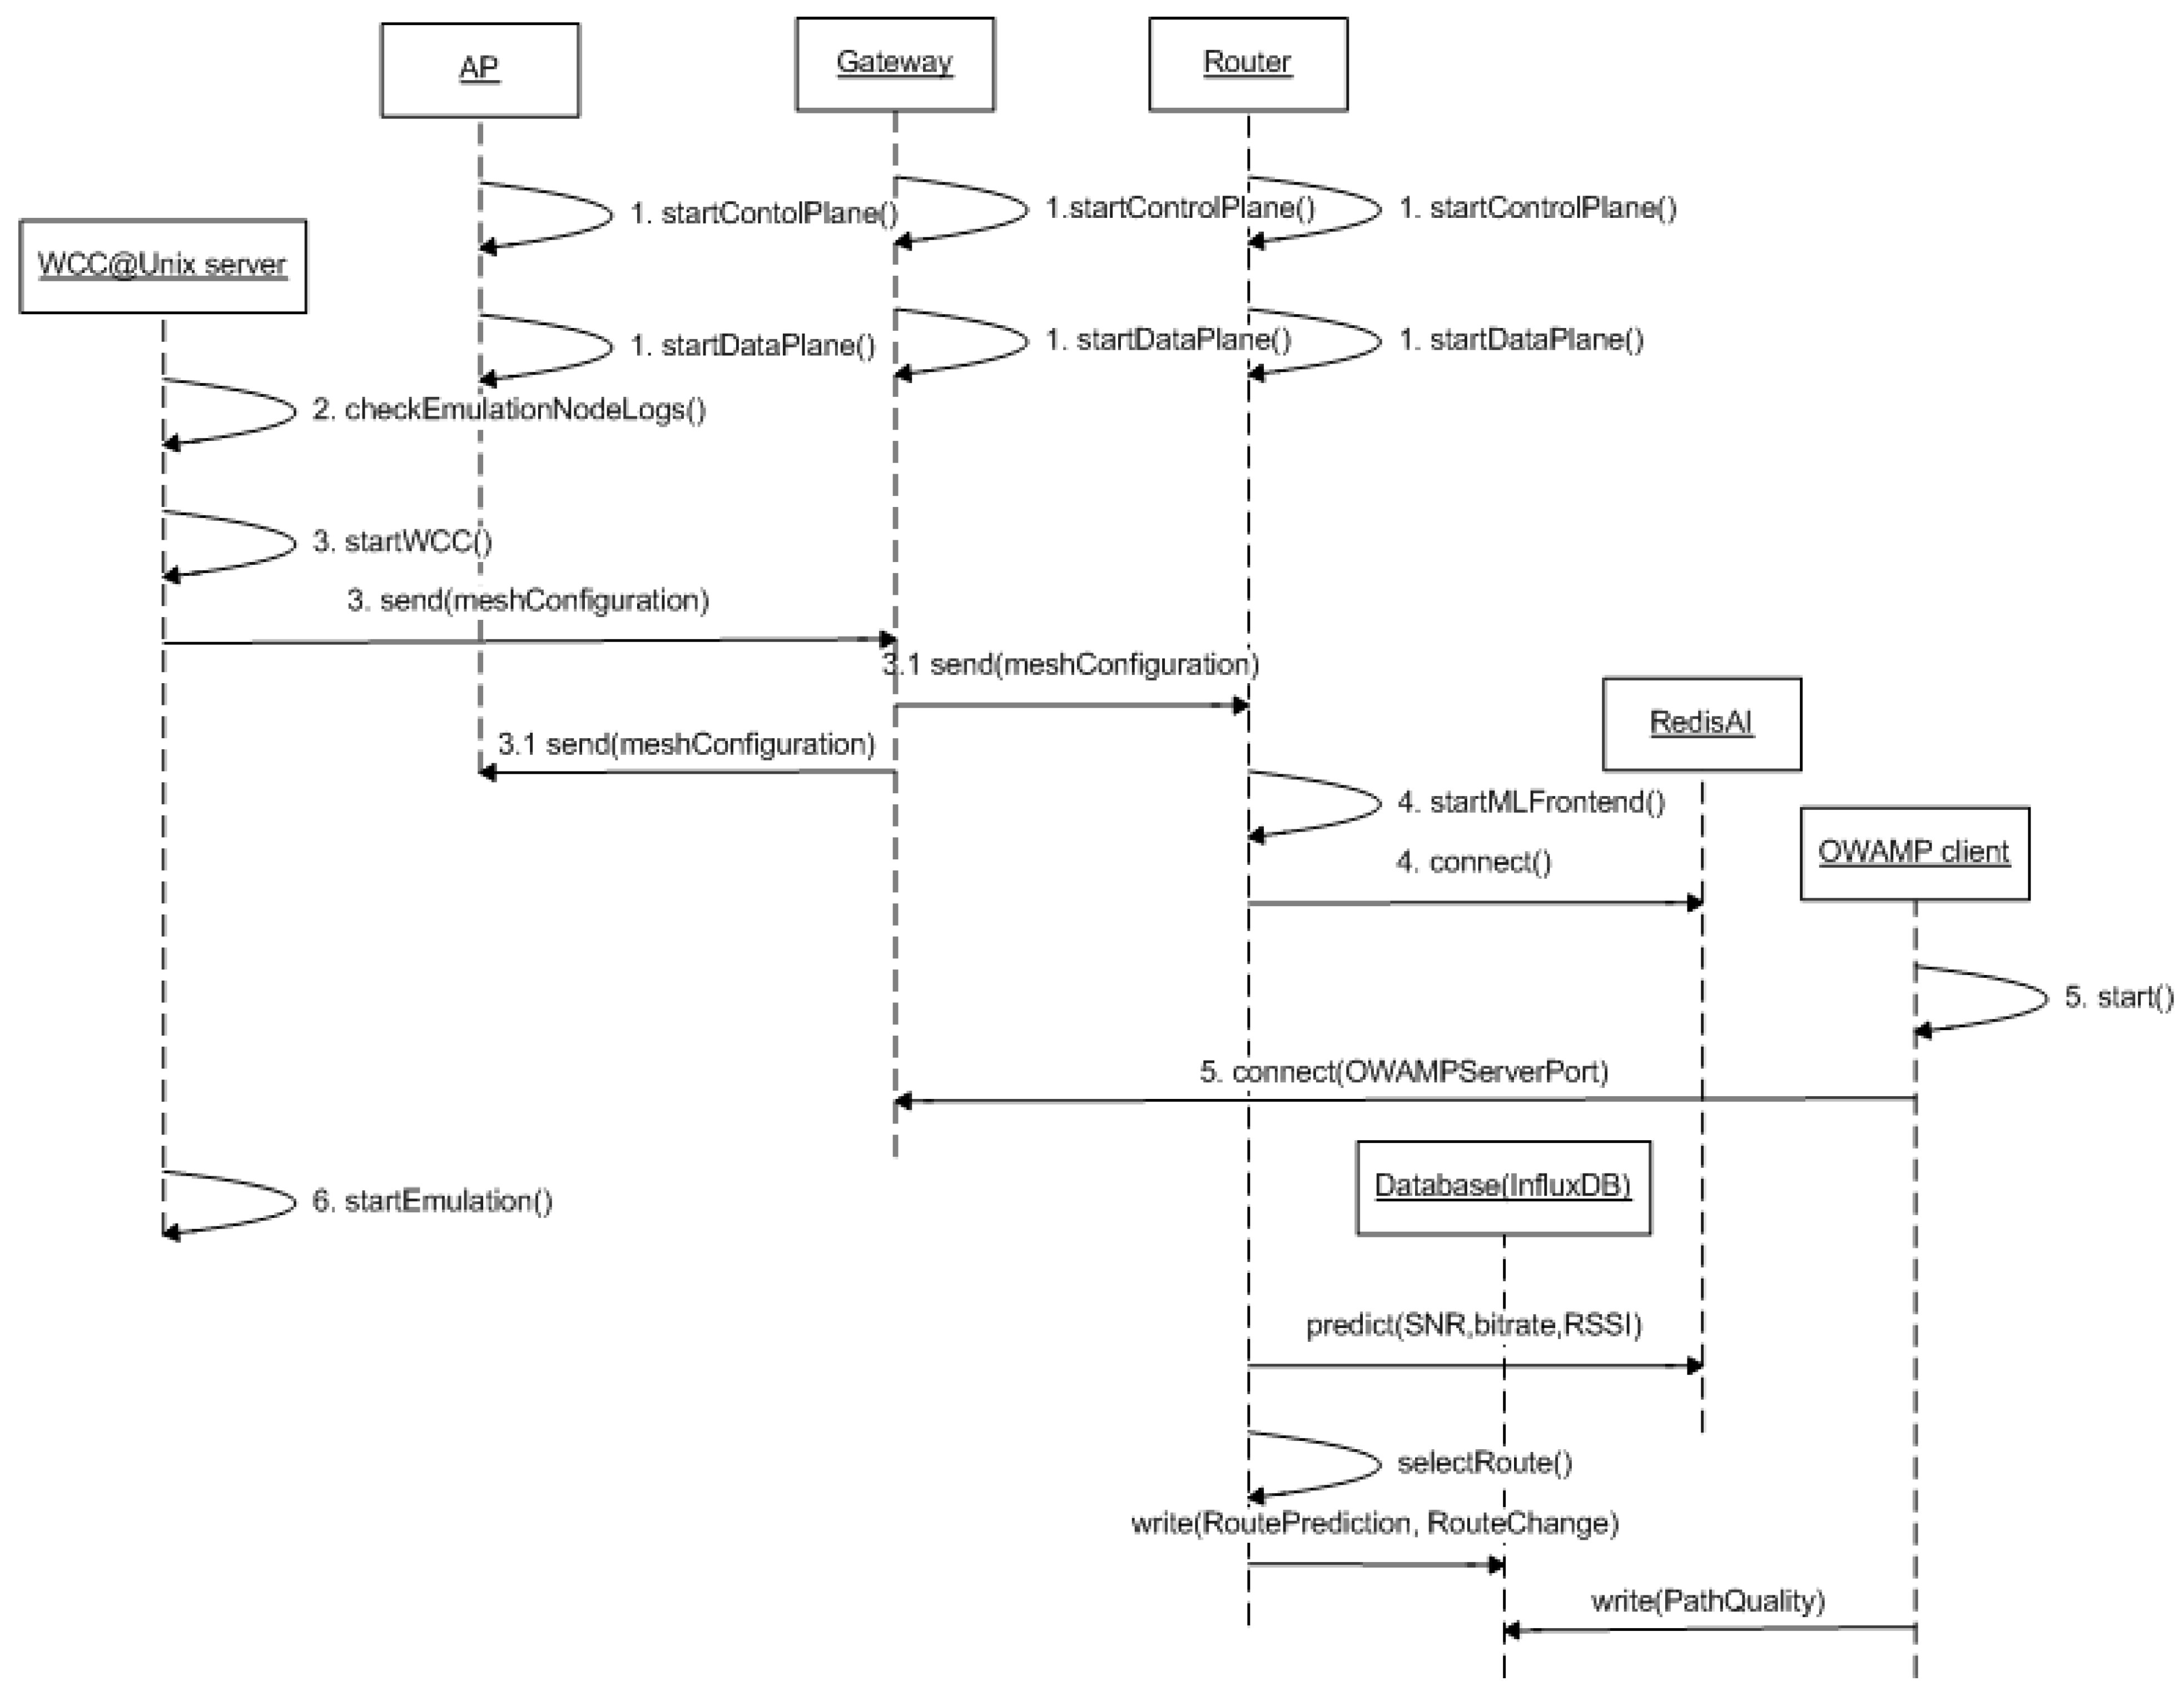
  • Steps 3.1–3.2: OWAMP client is started for measurement of OWD. Additionally, the emulation is started.
  • Step 3.3: The emulator reads access point data from a pre-configured file regarding communication quality in real time. The data are provided to the predictor (RedisAI), which returns OWD predictions for different APs.
  • Steps 3.31–3.32: The prediction(s) are used for decision-making purposes regarding multi-access routing. The AP associated with the lowest (predicted) OWD is selected for routing.
  • Step 3.33: The predicted and measured OWD, AP data, route predictions, and routing table changes are saved into the database during emulation.
  • Steps 3.4–3.5: The ML scientist reads predicted and realized OWD from the database and evaluates performance of the ML-based model after emulation.
  • Step 4: The ML scientist selects a model for deployment after comparing the performance of several ML-based models with emulations.

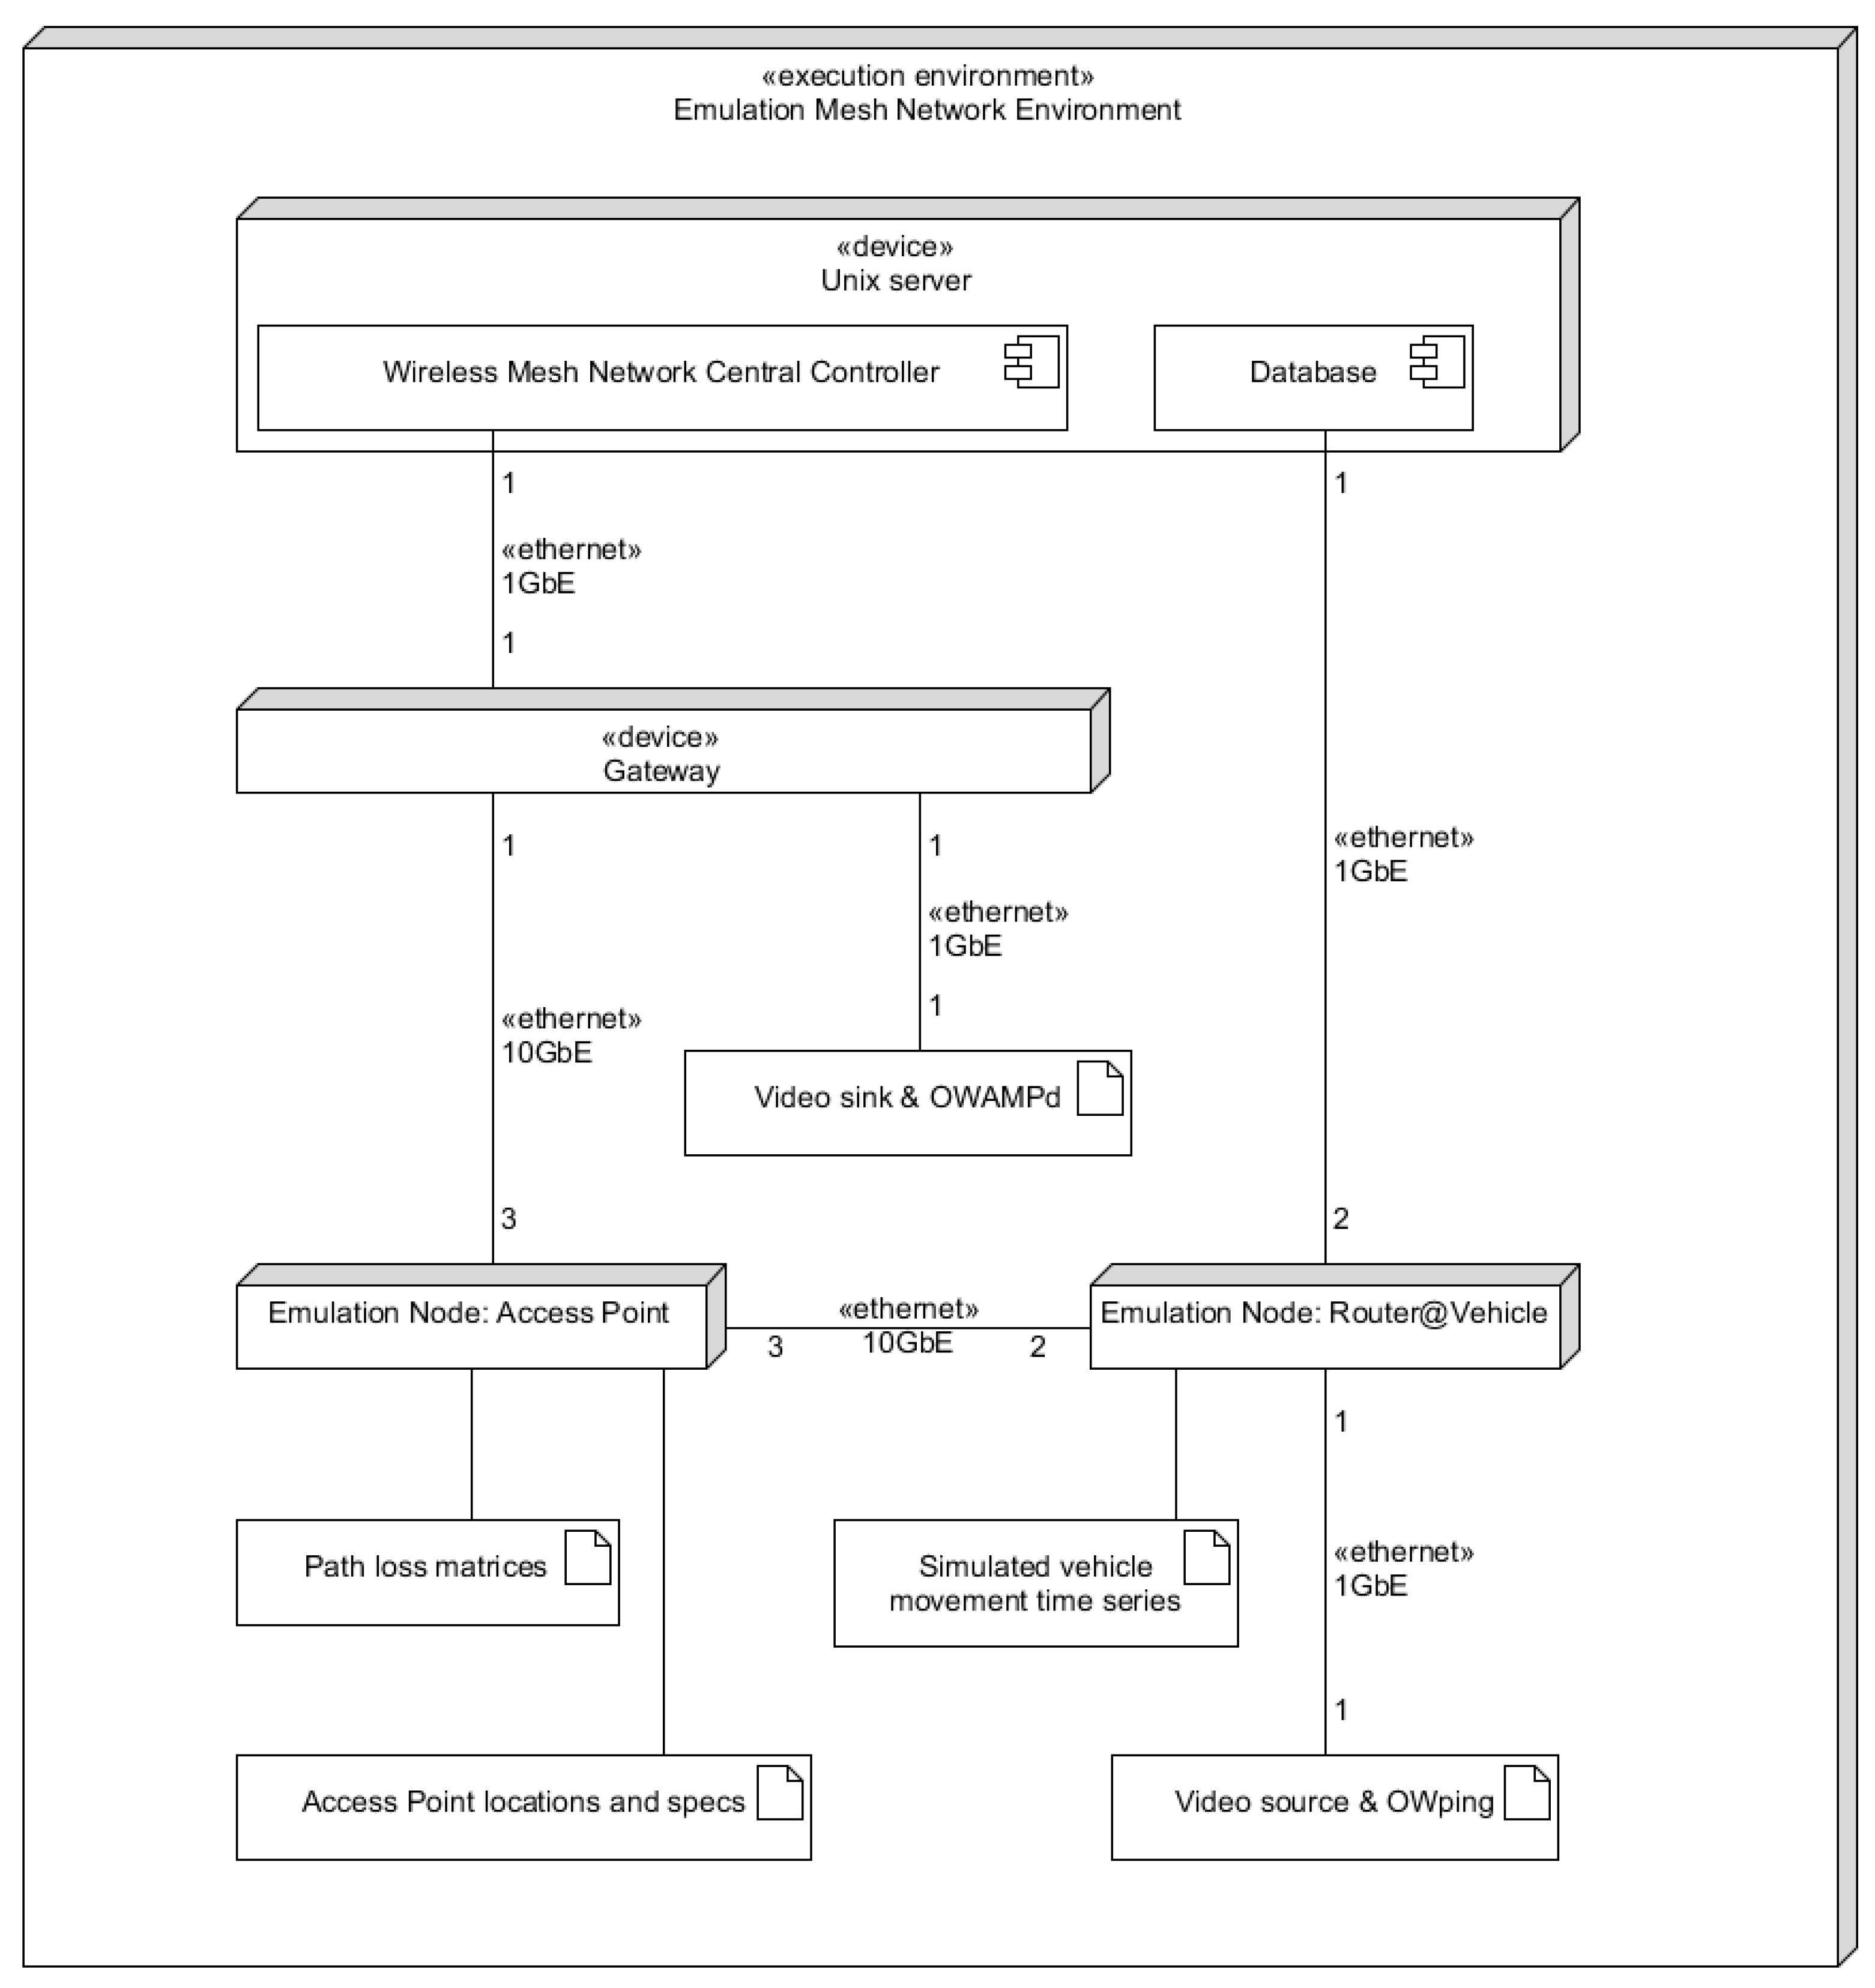
4.2. Emulation Environment

The architecture and implementation for multi-access routing for moving vehicles based on continuous ML is tested and evaluated in an emulation environment. The following sections describe the creation of network and vehicle movement simulation data for emulation purposes. Additionally, mesh network architecture of the emulator is presented.

4.2.1. Network and Vehicle Movement Simulation

R precomputation (implementation with R programming language) produces two main inputs for the execution of emulation scenarios: Path loss matrices (used to determine throughput and connectivity) and vehicle movement (location, speed, and heading at user-defined time intervals). Three inputs are needed: topology specification, access point locations and specifications, and vehicle waypoints and speed profile. The activity diagram in Figure 9 illustrates the creation of network and vehicle movement simulation data for emulation purposes.
At this phase, our simulation model does not yet contain proper propagation models to compute path loss matrices. Instead, we are using an approximate ad hoc model that should produce results that are sufficiently close to published results from real measurements, e.g., [26]. While such an ad hoc model is of course inaccurate, we believe that it captures the dynamics needed in the evaluation of this proposed emulation system at this early phase of development. Some samples of simulated signal levels are shown in Figure 10. Furthermore, the vehicle mobility model is fully deterministic; that is, vehicles follow the path defined by the waypoints using the given speed profiles.

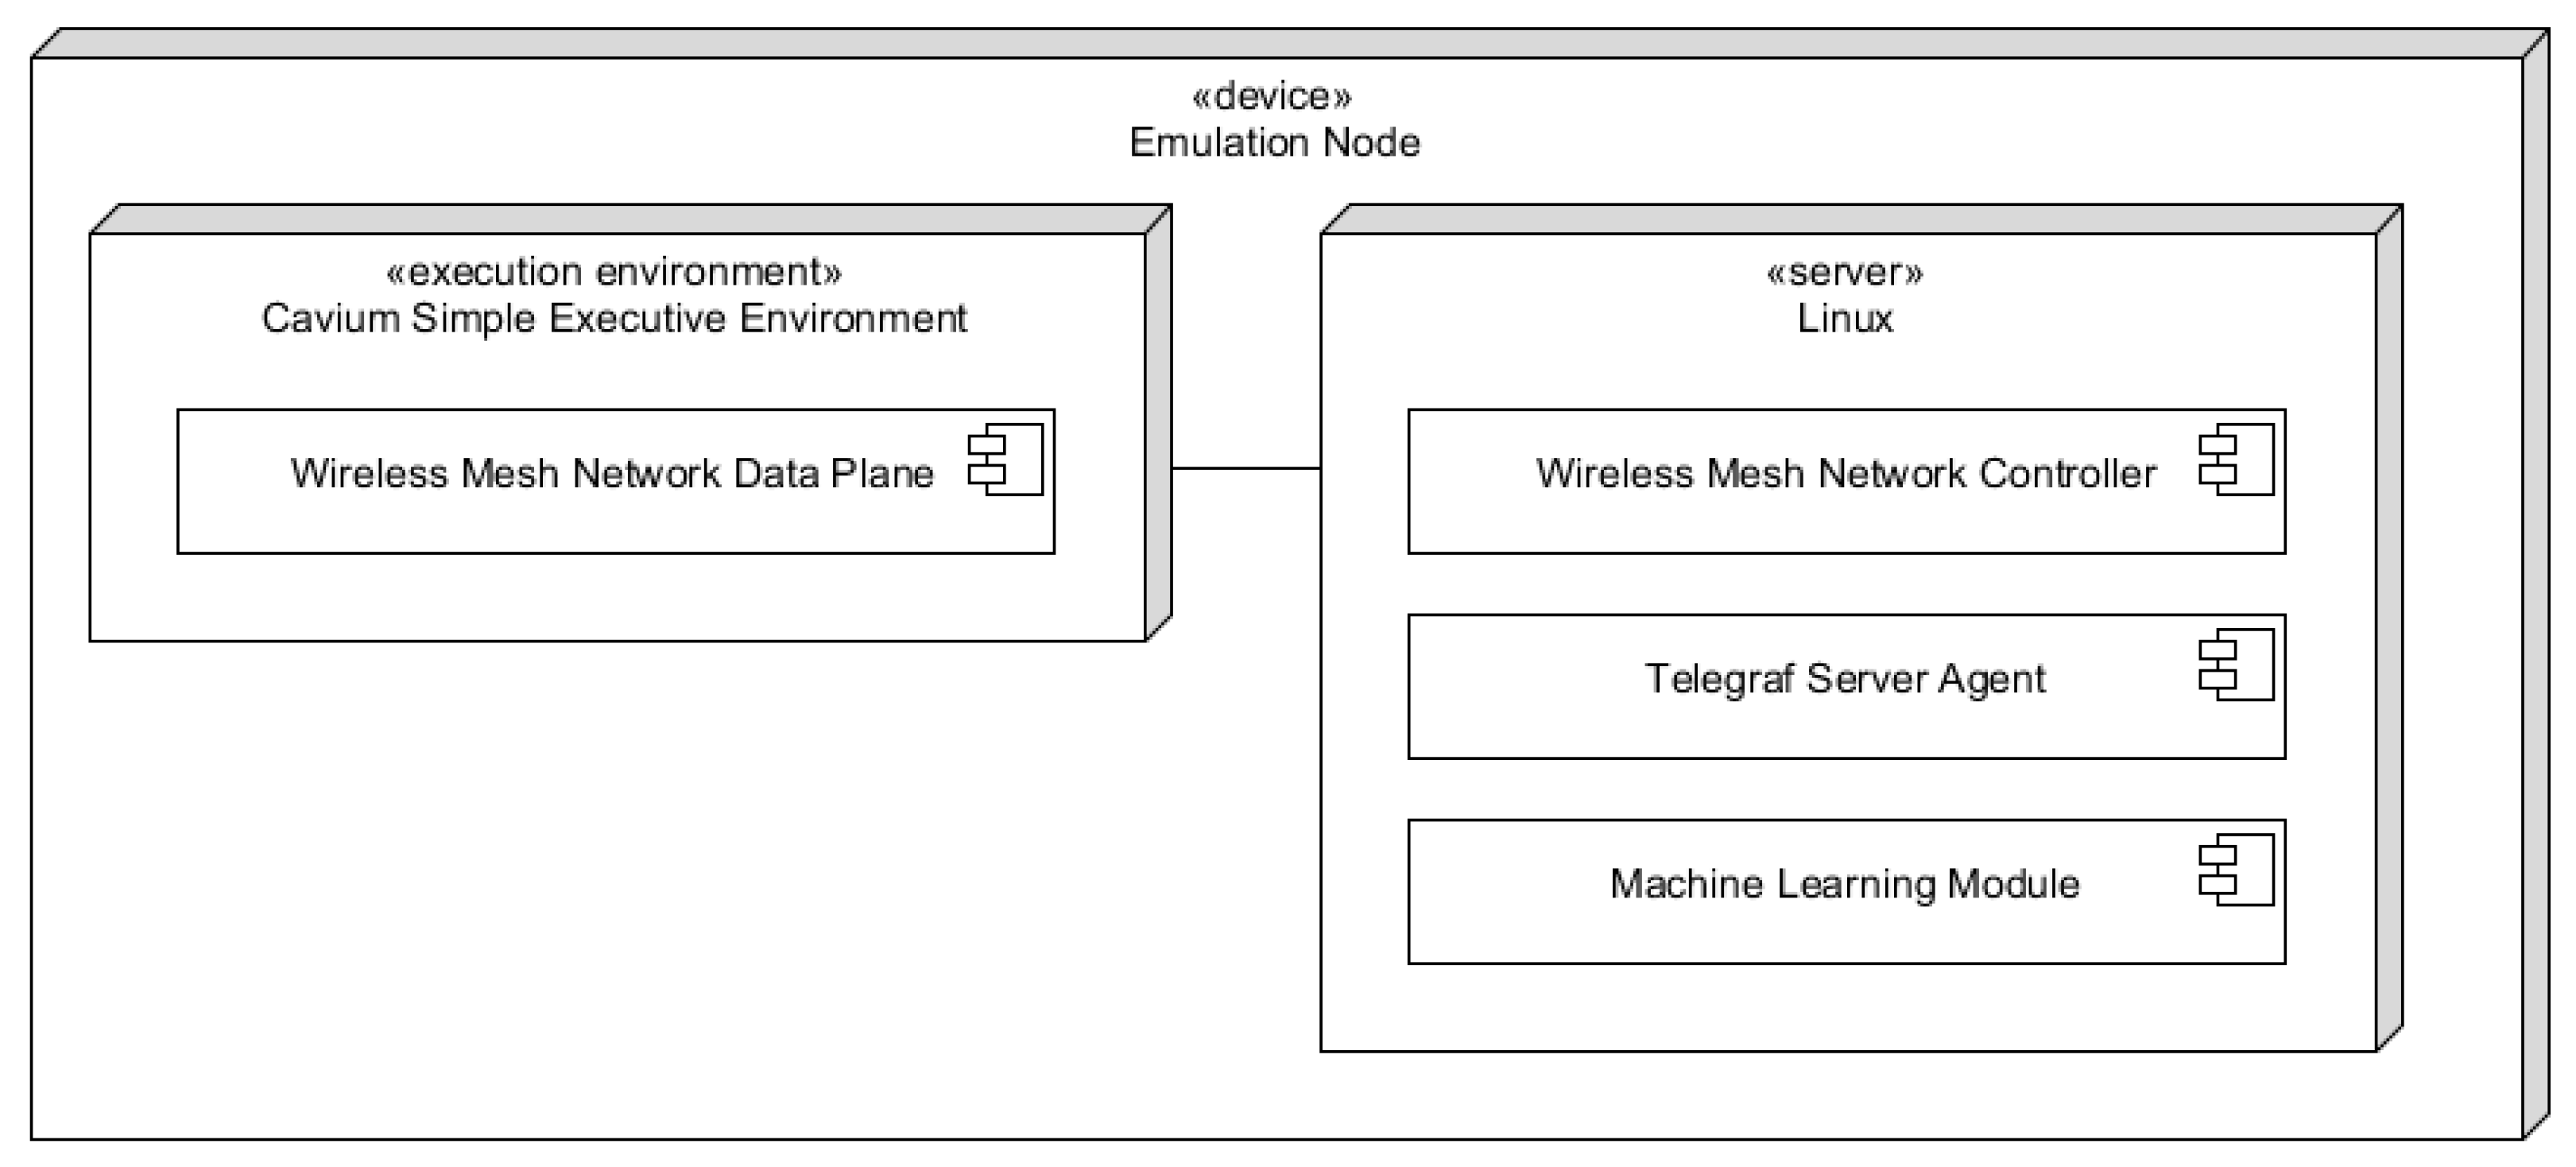
4.2.2. Wireless Mesh Network Emulation Environment

The emulation mesh network environment is based on earlier in-house development of the millimeter-wave wireless mesh network (WMN) emulation environment [27,28] that was modified by adding support for omnidirectional APs and moving nodes. The emulator contains emulation nodes, which act as mobile routers (V1 and V2), access points (AP1, AP2, and AP3), and a gateway. Emulation nodes are connected to each other with emulated wireless RF links that are implemented over optical fiber via their 10 gigabit Ethernet (Gbe) ports. The nodes additionally have two 1 Gbe ports for outside communication. One 1 Gbe port gives its control level (Linux) access to programs running on a FreeBSD server. Mobile routers send signal data to InfluxDB, and the gateway node communicates with the centralized network control program WMN centralized controller (WCC, that manages WMN resources, such as routing and link scheduling). WCC calculates the mesh topology configuration and sends it via the gateway to the nodes. The other 1 Gbe node port is connected to mesh user computers, which send and receive payload traffic via the mesh network.
The deployment diagrams in Figure 11 and Figure 12 illustrate the emulation node and emulation mesh network environment. The components of emulation nodes (Figure 11) are described as follows:
Wireless mesh network data plane:
  • Handles packet routing between 10 Gbe mesh ports and between mesh ports and 1 Gbe user data ports. In access points, it manipulates packet flow according to emulation rules received from the wireless mesh network controller.
Wireless mesh network controller:
  • The mobile router sends emulated AP signal quality data to the machine learning module, receives delay predictions from it, and makes a routing decision, which it sends to the data plane, and via Telegraf server agent, to InfluxDB.
  • The access point node reads emulated packet flow rules from the received files and sends them to the data plane.
  • The gateway node receives a network topology configuration from WCC and sends it to the data plane to be broadcasted to other nodes.
Telegraf server agent:
  • Receives routing data from the controller and sends it to the InfluxDB data base.
Machine learning module:
  • Communicates received AP signal quality data to RedisAI, receives predictions, and returns them to the caller (wireless mesh network controller).

5. Results

5.1. Experiments

Configuration of the emulator and test sequences for the execution of experiments for evaluation of ML prediction accuracy (efficiency evaluation) are described in the Appendix A.

5.2. Evaluation of the Artifacts

The artifacts (Figure 2) were evaluated based on the following criteria: feasibility, operationality, fidelity with real-world phenomenon, and effectiveness. Formative evaluation was performed in a laboratory setting with an emulator for two artifact iterations: Iteration 1 (basic functionality) and Iteration 2 (improved performance and optimization).

5.2.1. Feasibility Evaluations

Iteration 1: Feasibility of predictions in decision making regarding multi-access routing was evaluated utilizing offline ML with a RF regressor, MLFlow and RedisAI. The following lessons were learned:
  • RF regressor was trained with sklearn and integrated with MLFlow for visualization of performance (10-fold cross validation) with MLFlow UI. MLFlow had to be executed on the same node with a model training process (sklearn) for realizing performance evaluation with MLFlow UI.
  • The RF regressor-based model was converted to ONNX format (with sklearn-onnx library [29]) for transferring to RedisAI. PMML-based models were also experimented with (converted with sklearn2pmml library [30]), but initial inference performance was slower (~19 ms vs. ~1 ms with ONNX-based model in RedisAI).
  • A new MLFlow plugin for RedisAI was needed for realizing model deployment (to RedisAI), because the existing RedisAI plugin only supported Tensorflow models. The new MLFlow plugin enabled transfer of ONNX models to RedisAI. The trained ONNX-based model was deployed from MLFlow to RedisAI by executing the plugin from the command line.
  • RedisAI was executed as a Docker image and provided predictions for the emulator (via redisai-py library [31]).
  • RedisAI had to be placed near the decision-making point. Initially, ~30 ms inference latency was observed, when RedisAI was placed further from the decision-making point (emulator). This led to large OWD peaks in experiments. OWD predictions were needed for each AP for making a decision regarding the most suitable AP for routing (total prediction latency = number of APs * RedisAI prediction latency). Thus, to perform timely/real-time decisions, prediction latency needed to be minimized (~1 ms latency) by placing RedisAI close to the emulator, which led to improved OWD performance.
Iteration 2: Feasibility of online decision making was evaluated utilizing continuous ML with River. The following lessons were learnt:
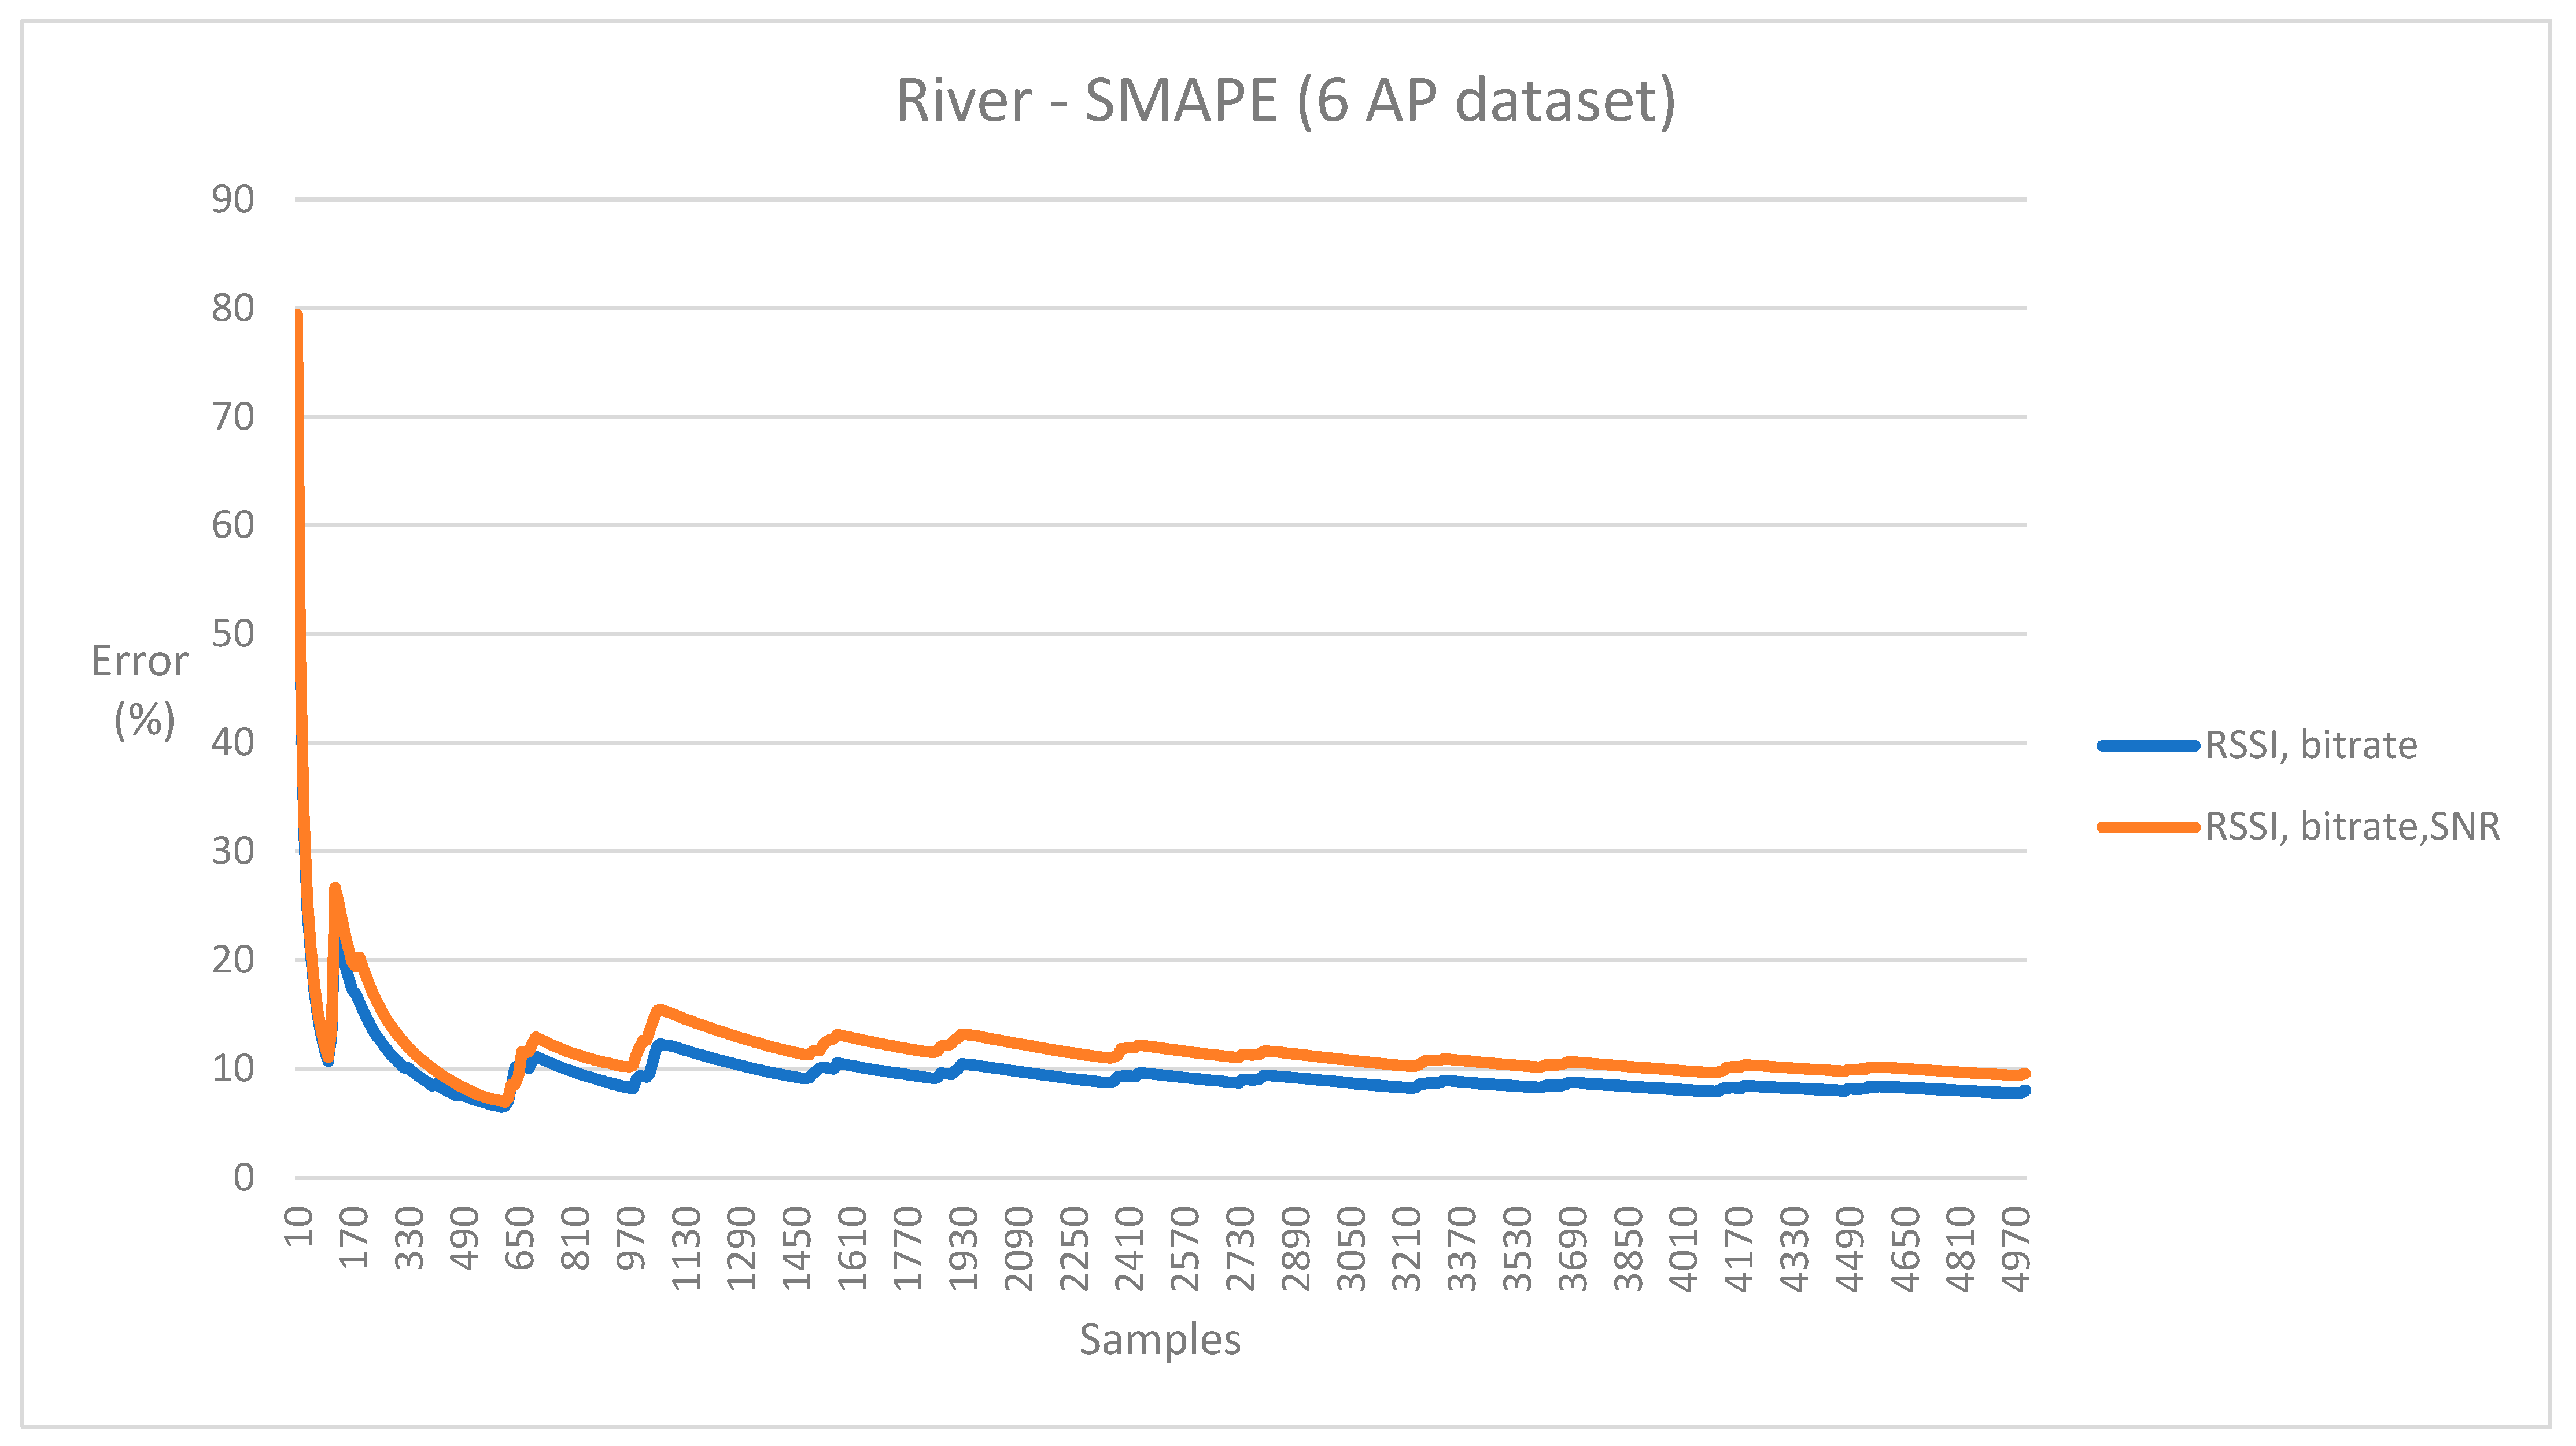
  • River-based training could not be integrated with MLFlow. Instead, the training process was managed manually.
  • Online training was experimented with using River by updating and retraining the model periodically with new data samples (every 2 s). The trained model was kept in memory.
  • The model was locked periodically for both training and inference process with multi-threading. This approach was feasible, since training takes a short time, and the model is available most of the time for prediction purposes (~1.5–1.8 s/2 s). However, this approach also caused occasional inference peaks when the model was trained during inference requests. Prediction delays in the emulator were typically ~1 ms, with occasional peaks (~10–50 ms) during model updates, when predictions were fetched every 200 ms.
  • Utilization of the model in online emulation experiments was hindered by not having real time OWD measurements available for training purposes (future work).

5.2.2. Efficiency Evaluations

Iteration 1: Offline accuracy of ML algorithms was evaluated for facilitating decision making of multi access routing. The evaluation was performed with a training set, which was collected with an emulation (see Appendix A), where two vehicles moved for a duration of 20 min, and six access points routed data. The size of the data set was 143,751 samples. The offline accuracy of RandomForestRegressor and River is provided in Table 1.
Figure 13 presents the error of incremental ML with River as a function of data samples. Two (RSSI and bitrate) and three (RSSI, bitrate, and SNR) feature sets were experimented with. The results indicate that River, with both feature sets, could facilitate decision making of multi-access routing with a reasonable accuracy. Incremental learning with River took ~2040 samples until error was lower than 10% (with RSSI and bitrate-feature set). Thus, a reasonable accuracy should be achieved in less than 3.4 min from the beginning of the emulation (10 samples/second were collected). In the end of the experiment, error/SMAPE was ~6.6% with both feature sets (Table 1); sklearn’s RandomForestRegressor also indicated that RSSI and bit rate were the most significant features (see Table 1) from an accuracy point of view.
Iteration 2: Evaluation of efficiency in decision making regarding routing of the data transfers/communication. Efficiency of the architecture was evaluated based on online experiments in the emulator (see Appendix A for the detailed testing procedure). Particularly, a RandomForestRegressor-based model (see Table 1) was trained offline with sklearn, and the model was deployed to RedisAI inference engine. Emulated vehicles fetched online predictions from RedisAI by providing RSSI, bit rate, and signal-to-noise ratio (SNR) to the prediction service as input parameters.
Two different emulation scenarios were executed (6 min and 1 h), where two vehicles moved according to pre-calculated routes, and six access points enabled data transfer towards the control center. The OWAMP tool was utilized for measuring OWD in emulation. OWD and predictions were saved in InfluxDB and matched together afterwards based on timestamps (every 100 ms) for error/accuracy evaluation. Additionally, an emulation was performed with a reference case, which utilized a heuristic RSSI-based model for decision making.
Figure 14 presents the OWD of vehicle 2 in the short (6 min) emulation experiment. The ML-based model achieved ~11.5% lower OWD, when compared to the RSSI-based model.
The results of all emulation experiments are summarized in Table 2. The results indicate that the ML-based model achieved ~5–13% lower OWD, when compared to the reference model. The prediction error was ~5.4–7.5%, which is within the same range as the offline accuracy (0.935 ± 0.05). Thus, it seems that a ML-based model can facilitate decision making of online routing with a decent accuracy, which improves OWD in comparison to the heuristic approach.

5.2.3. Operationality Evaluation

The sequence diagrams on model training, deployment (Figure 7) and inference (Figure 8) illustrate how decision making of route selection is facilitated with a ML-based model in the emulator. Operationality of the proposed architecture is supported by the online prediction error (~6–8%) being close to the offline accuracy (0.935 ± 0.05). Additionally, realized OWD based on the ML-based model was lower in comparison to a heuristic approach (Figure 14).
Figure 2 illustrated the conceptual view of continuous ML in emulation environments. The execution time of each processing step can be estimated based on the experiments. First, new data had to be collected for model training purposes by running initial emulations, where the vehicles moved and transferred data (steps 1.2–1.3). In practice, the duration of an offline emulation was 20 min, and the emulation had to be executed separately for each access point and moving vehicle combination. Thus, execution of the initial emulations (Section 5.2.2) took 12 × 20 = 240 min (six Aps and two moving vehicles). Subsequently, training and evaluation of the models were performed (steps 2.1–2.4) with three algorithms (Table 1). The duration of training a model with RandomForestRegressor, as well as saving and conversion of the model to ONNX-format took 78.7 s. The selected ONNX-model (491 kB) was transferred and deployed from MLFlow to RedisAI in a few seconds (step 2.5). Finally, emulations with the selected ML model (and reference case) were executed (step 3.2). The emulations had to be performed separately for each moving vehicle. Thus, the total time required for the online emulations with the ML model and the reference case (Figure 14) was emulation time × number of emulations (6 min × 4 + 60 min × 4 = 4 h 24 min).
The total execution time (~8 h, 30 min) of the continuous ML cycle was largely dependent on the execution time of emulations. Additionally, manual configuration of the emulations in a distributed computing environment, configuration of ML training jobs, and evaluation of ML-based models required additional effort. Thus, minimization of the total execution time for continuous ML remains an item for future work.

5.2.4. Fidelity to Real World Phenomenon Evaluation

A real-world environment for facilitating routing decisions in moving vehicles based on continuous ML is visioned in Figure 3. The evaluated concept and architecture for the emulation environment (Figure 2) should be applicable also to the real underground mining environment (Figure 3) from a continuous ML point of view. For example, data storage (InfluxDB [22]), continuous model training and evaluation (MLFlow [11]), model deployment and inference (MLFlow plugin and RedisAI [12]), and OWD measurement (OWAMP [21]) may also be realized into a real environment.
In a real-world mining environment moving vehicles may have limited connectivity, and low bandwidth available for data transfers. This may be considered in the definition of access point specifications and topologies based on which the path-loss matrices will be calculated (Figure 9) for emulation purposes. Furthermore, multipath propagation in mining tunnels can result in destructive self-interference, so-called dead zones, where throughput suddenly drops to zero. This can be modelled with proper propagation models if the 3D tunnel structure is known with sufficient accuracy. However, we are using a simplified propagation model, and thus, dead zone simulation is enabled by a simple attenuation function for which the level of attenuation and the location in mining tunnels can be given as a simulation parameter.
When a mobile vehicle has limited connectivity, access to predictions from RedisAI may be delayed. An alternative approach would be to initially transfer and deploy the prediction model to the moving vehicle. In this case, connectivity to the prediction service would not be needed. The downside of the approach is the need to deploy a new model to every moving vehicle, and the additional processing required for executing a prediction service/inference in the moving vehicle.
Finally, emulator functionality would need to be replaced with real mining vehicles moving autonomously with a wireless communication infrastructure. Evaluation of the proposed architecture within the conceptual view (Figure 3) of a real mining environment is left for future work.

6. Discussion

The system realized optimized data transfers over multi-access networking technologies, which should enable better performance (lower latency/higher throughput) at the control center regarding monitored vehicles. The system should enable development, execution, and evaluation of real applications in an emulation environment, which is more difficult in simulations (e.g., NS-2/NS-3 [3]). Development of ML-based solutions in an emulation environment lowers the cost of early experimentation. Existing research on multipath routing can be compared to our proposed architecture. Multipath routing for QUIC is optimized with reinforcement learning in an emulation environment (NetEm, Mininet) [8], whereas we developed a custom emulation environment. They used session related parameters (SRTT, congestion window, and bytes in flight) for prediction of throughput, but we focused on prediction of OWD. Multipath TCP decision making was optimized with random forest trees in 4G/Wi-Fi networks with mobile devices [9]. Particularly, access point-related parameters (signal strength from the associated Wi-Fi AP, data rate, TCP throughput, gateway RTT, end-to-end RTT and interference degree) were used in the training and prediction of path quality. We also used signal strength and signal-to-noise ratio (interference degree in [9]) in model training, but instead used OWD for estimation of path quality. Additionally, their performance measurements focused on throughput improvement, whereas we focused on OWD. A recent proposal on the development of ML-based models and applications with emulators focuses on RAN scheduling and slicing [10]. Instead, our focus was to enable ML-based decision making for moving vehicles. They experimented with online reinforcement learning and learned that incremental online learning enabled better performance (vs. a model trained offline) by adapting to the changes of the environment. This evidence suggests that incremental online learning should also be integrated to our emulation environment for supporting decision making in the future.
We compared offline performance of RandomForestRegressor, River (with AdaptiveRandomForestRegressor) and multi-layer perceptron (MLP) algorithms (Table 1). We chose random forest-based algorithms for experimentation, because of their utilization and performance in an earlier study [8], and suitability for our regression problem (OWD prediction). However, in the future, deeper neural network models (besides MLP) may also be experimented with, which may require utilization of other (besides sklearn) ML libraries (e.g., Tensorflow).
Another possible ML approach to be experimented with in the future might be swarm intelligence [17]. Our current approach is to collect measurement data from multiple moving vehicles for training purposes. Thus, the data may also be suited for offline training of models based on swarm intelligence methods. Online distributed training with swarm intelligence would require network connectivity between learning agents, which may become challenging in a mining environment.
Additionally, ML aspects of our architecture can be compared to earlier work. A few studies exist [15,16] on the application of River [13] for solving incremental learning problems. River was used for online analysis of encrypted traffic for identifying malware based on AdaptiveRandomForestClassifier [16]. Additionally, performance of River and Crème was analyzed with logistic regression (LR), k-nearest neighbors (KNN), and Gaussian naive Bayes classification, where several datasets were used for evaluation [15]. In general, River achieved good performance in terms of classification accuracy (except for bananas dataset in [15]). However, neither of the studies experimented River for usage in a real time system (such as our emulator).
Offline experiments indicated the potential of River in the research context (Figure 13), although online experiments were left for future work. Our approach was to train and predict simultaneously in one thread, which led to occasional peaks in prediction latency. Separating training and inference processes may be used for improving prediction latency in the future. River enables an alternative approach to centralising training and the evaluation of ML-based models (e.g., with MLFlow), because models may be trained online from scratch. However, integration of River with MLFlow may be useful in the future, to enable management of continuous/incremental training/inference processes.
Technical systems and methods were implemented and evaluated with an emulator (steps 1–4 in Figure 2). It is assumed that the relevant parts of the technical system and method regarding continuous ML are similar in a real mining environment (steps 5–10 in Figure 3), but this was never implemented nor evaluated in this research (future work). Lack of evaluation in a real environment sets limitations of the validity to the method; for example, because topologies of the networks are larger, dead zones may be present, and radio interference phenomena may occur.
In our research, the presented concept (Section 2) was associated with the underground mining context by creation of an emulation environment (topology specification, access point locations and specifications, and vehicle waypoints (Figure 9)), which should be typical for underground mining (e.g., see visualization of emulated caves in Figure A3). However, emulation environments may also be created based on contexts beyond underground mining (e.g., autonomous moving vehicles loading cargo in a dock environment). Evaluation of the concept and related architecture in other contexts is left for future work.

7. Conclusions

The research question focused on designing a concept and system architecture for enabling real-time uninterrupted streaming data transfer from moving vehicles towards a control center. The presented concept (Section 2) enables continuous ML-based route optimization in emulated and real-world underground mining environments. The system architecture was designed from several viewpoints (Section 3) based on the conceptual view for emulated environments. Additionally, the architecture was realized in research artifacts related to the continuous ML pipeline and emulation environment. The artifacts enabled streaming data transfer from moving vehicles towards the control center in an emulated environment. Additionally, behavior of the moving vehicles can be demonstrated with a 3D visualization. Finally, the artifacts were evaluated based on DSRM research criteria (feasibility, operationality, effectiveness, and fidelity with a real-world environment). Several lessons learnt were presented regarding operationality/feasibility. The ML-based model (based on RF regressor) enabled ~5–13% lower OWD in streaming data transfers, when compared to a simpler heuristic model (effectiveness). Comparison to earlier literature indicated the novelty of the proposed architecture design for emulating data transfers of moving vehicles within an underground mining environment when routing decisions are facilitated within a continuous ML architecture.

Author Contributions

Conceptualization, P.P., D.P. and K.S.; methodology, D.P. and P.P.; software, P.P., J.P., K.S. and K.A.; validation, P.P. and J.P.; formal analysis, P.P.; writing—original draft preparation, J.B.; writing—review and editing, J.B. and P.P.; visualization, K.S.; supervision, D.P.; project administration, P.P.; funding acquisition, P.P., K.S. and D.P. All authors have read and agreed to the published version of the manuscript.

Funding

This research was funded by VTT Technical Research Centre of Finland Ltd.

Institutional Review Board Statement

Not applicable.

Informed Consent Statement

Not applicable.

Acknowledgments

Authors acknowledges support from Jyrki Huusko and Tuomas Paaso, VTT Technical Research Centre of Finland Ltd.

Conflicts of Interest

The authors declare no conflict of interest. The funders had no role in the design of the study; in the collection, analyzes, or interpretation of data; in the writing of the manuscript, or in the decision to publish the results.

Appendix A

Configuration of experiments in the emulator:
R precomputation produces two main inputs for actual emulation: path loss matrices (used to determine throughput and connectivity) and vehicle movement (location, speed, heading at user-defined time intervals). Three inputs are needed (Figure 9): topology specification, access point locations and specifications, and vehicle waypoints and speed profile.
Preparations (emulation nodes are illustrated in Figure 12):
  • Copy emulation CSV files (“ap_data”, “signal_obs”, and “vehiclemove”) into mesh nodes (Rainier machines; e.g., router@vehicle).
  • Copy “roles.csv” into mesh nodes. It contains information about nodes meant to act as AP:s or vehicles in emulation). The format is:
“node”, ”role”
2, “AP1”
4, “AP2”
5, “AP3”
6, “AP4”
7, “AP5”
8, “AP6”
16, “V1”
“node” number is node ID known by each node. “role” is AP or vehicle name used in emulation CSV files.
  • Set emulation topology in WMN centralized controller (WCC) configuration file [control center]. The topology determines the links and interfaces of mesh nodes used for vehicle–AP communication.
  • In WCC configuration file, the gateway and vehicle nodes must be configured to accept the same combination of IP subnets in user data.
  • Ensure, that servers (Edge-node 3, OWAMP-client node) connected to mesh gateway node and vehicle (Router@vehicle) user data ports and the gateway node itself are connected to the network time protocol (NTP) network. The IP addresses of server interfaces to the nodes must belong to a subnet accepted by the gateway and vehicle nodes in WCC configuration.
  • Start OWAMP daemon in a server machine (edge node) connected to the gateway node user data port.
Test stages (see Figure A1):
  • Send SSH command to emulation nodes [router@vehicle] to start the data and control planes in them. The control plane application “wmn_control” check from “roles.csv” if the node has an AP or vehicle role in emulation and reads the corresponding data from the CSV files.
  • Check from control plane traces [monitored in control center], that all needed links come up in emulation nodes. If not, reboot the node and restart data and control planes.
  • Start WCC in a server machine [control center]. WCC sends the mesh configuration to the nodes, which organize according to the configured topology. AP and vehicle nodes receive information from their neighbor emulation nodes.
  • Log with SSH to vehicle node [router@vehicle]. Start the ML service front end script “ml_frontend_redis.py”. It connects to the Redis server [Edge-node 2] and the local control plane.
  • Start OWAMP client [OWAMP client] in a server machine [OWAMP-client node] connected to the vehicle node user data port. The ping interval should be the same as the vehicle node ML query interval, e.g., 300 ms with six AP:s. The destination address is the server interface address connected to the gateway user data port. The client dumps the measured delays into a file.
    owping -t -c 12000 -i 0.3f -L 10 -R 192.168.200.2 > res.txt
  • Start emulation from the WCC command prompt [control center]. Give optionally a number indicating delay (seconds) before emulation start (if omitted, delay is 10 s)
Output:
The vehicle node [router@vehicle] control plane dumps all delay prediction data received from ML into a CSV file. When it changes route according to the data, it dumps the data into different CSV file. The files have identical format:
“time”, “route”, “AP1”, “AP2”, “AP3”, “AP4”, “AP5”, “AP6”, “quantity”, and “vehicle”.
When the emulation is finished, the results are taken from the OWAMP client output file and vehicle node CSV files into the Influx database measurement tables with Python scripts [Training data store: InfluxDB] [edge node 3]. The OWAMP raw data are put into “pathquality” table and the prediction and change dumps into “route_prediction_6” and “route_change_6” tables, respectively.
Figure A1. Sequence diagram of test stages for OWD measurement in the emulator.
Applsci 12 10679 g0a1

Appendix B

A real-time 3D visualization system (Figure A2) was developed to support monitoring the system during tests and to provide perceivable visual output for demonstrations. The visualization system is based on a backend, which receives real-time measurement stream from InfluxDB and collects statistics for relevant performance parameters and web browser-based frontend that receives the data for visualization via WebSocket. Additionally, a screenshot of the visualization (Figure A3) was provided, which illustrates how moving vehicles and real-time data (OWD and RSSI) are visualized.
Figure A2. Implementation view of real time 3D visualization system of the emulator.
Applsci 12 10679 g0a2
Figure A3. Screenshot of 3D visualization tool showing RSSI (multicolored solid voxels) and OWD (pale blue orbs). The moving vehicles are illustrated with red diamond shapes.
Applsci 12 10679 g0a3

References

  1. Sandvik Underground Trucks. Available online: https://www.rocktechnology.sandvik/en/products/underground-loaders-and-trucks/underground-trucks/ (accessed on 29 August 2022).
  2. Sandvik Automine. Available online: https://www.rocktechnology.sandvik/en/products/automation/automine-equipment-and-teleoperation-systems/ (accessed on 29 August 2022).
  3. Network Simulator NS-3. Available online: https://www.nsnam.org/ (accessed on 29 August 2022).
  4. EXata Network Emulator. Available online: https://www.ncs-in.com/product/exata-network-emulator/ (accessed on 29 August 2022).
  5. Baylor, D.; Haas, K.; Katsiapis, K.; Leong, S.; Liu, R.; Menwald, C.; Miao, F.; Polyzotis, N.; Trott, M.; Zinkevich, M. Continuous Training for Production ML in the TensorFlow Extended (TFX) Platform. In Proceedings of the USENIX Conference on Operational Machine Learning, Santa Clara, CA, USA, 20 May 2019. [Google Scholar]
  6. Luong, M.; Pham, C. Incremental Learning for Autonomous Navigation of Mobile Robots based on Deep Reinforcement Learning. J. Intell. Robot. Syst. 2021, 101, 1–11. [Google Scholar] [CrossRef]
  7. Liu, X.; Zhang, D.; Yan, H.; Cui, Y.; Chen, L. A New Algorithm of the Best Path Selection Based on Machine Learning. IEEE Access 2019, 7, 126913–126928. [Google Scholar] [CrossRef]
  8. Roselló, M.M. Multi-path Scheduling with Deep Reinforcement Learning. In Proceedings of the European Conference on Networks and Communications (EuCNC), Valencia, Spain, 18–21 June 2019. [Google Scholar]
  9. Chung, J.; Han, D.; Kim, J.; Kim, C. Machine learning based path management for mobile devices over MPTCP. In Proceedings of the IEEE International Conference on Big Data and Smart Computing (BigComp), Jeju, Korea, 13–16 February 2017. [Google Scholar]
  10. Polese, M.; Bonati, M.; D’Oro, S.; Basagni, S.; Melodia, T. ColO-RAN: Developing Machine Learning-based xApps for Open RAN Closed-loop Control on Programmable Experimental Platforms. IEEE Trans. Mob. Comput. 2022. [Google Scholar] [CrossRef]
  11. MLflow. Available online: https://mlflow.org/ (accessed on 29 August 2021).
  12. RedisAI. Available online: https://oss.redislabs.com/redisai/ (accessed on 29 August 2021).
  13. Montiel, J.; Halford, M.; Mastelin, S.M.; Bolmier, G.; Sourty, R.; Vaysse, R.; Zouitine, A.; Gomes, H.M.; Read, J.; Abdessalem, T.; et al. River: Machine learning for streaming data in Python. arXiv 2020, arXiv:aabs/2012.04740. [Google Scholar]
  14. Chen, A.; Chow, A.; Davidson, A.; Cunha, A.; Ghodsi, A.; Hon, S.; Konwinski, A.; Mewald, C.; Murching, S.; Nykodym, T.; et al. Developments in MLflow: A System to Accelerate the Machine Learning Lifecycle. In Proceedings of the Fourth International Workshop on Data Management for End-to-End Machine Learning, Portland, OR, USA, 14 June 2020. [Google Scholar]
  15. Ray, S.K.; Susan, S. Performance Evaluation using Online Machine Learning Packages for Streaming Data. In Proceedings of the International Conference on Computer Communication and Informatics (ICCCI), Coimbatore, India, 25–27 January 2022. [Google Scholar]
  16. Niu, Z.; Xue, J.; Qu, D.; Wang, Y.; Zheng, J.; Zhu, H. A novel approach based on adaptive online analysis of encrypted traffic for identifying Malware in IIoT. Inf. Sci. 2022, 601, 162–174. [Google Scholar] [CrossRef]
  17. Tang, J.; Liu, G.; Pan, Q. A review on representative swarm intelligence algorithms for solving optimization problems: Applications and trends. IEEE/CAA J. Autom. Sin. 2021, 8, 1627–1643. [Google Scholar] [CrossRef]
  18. Peffers, K.; Tuunanen, T.; Rothenberger, M.A.; Shatterjee, S. A Design Science Research Methodology for Information Systems. J. Manag. Inf. Syst. 2007, 24, 45–77. [Google Scholar] [CrossRef]
  19. March, S.T.; Smith, G.F. Design and natural science research on information technology. Decis. Support Syst. 1995, 15, 251–266. [Google Scholar] [CrossRef]
  20. Sonnenberg, C.; vom Brocke, J. Evaluations in the Science of the Artificial–Reconsidering the Build-Evaluate Pattern in Design Science Research. In Proceedings of the International Conference on Design Science Research in Information Systems and Technology, Las Vegas, NV, USA, 14–15 May 2012. [Google Scholar]
  21. OWAMP. Available online: https://software.internet2.edu/owamp/owping.man.html (accessed on 29 August 2022).
  22. InfluxDB. Available online: https://www.influxdata.com/ (accessed on 29 August 2022).
  23. SKLearn/Scikit-Learn. Available online: https://scikit-learn.org/ (accessed on 29 August 2022).
  24. Pääkkönen, P.; Pakkala, D. Extending reference architecture of big data systems towards machine learning in edge computing environments. J. Big Data 2020, 7, 1–29. [Google Scholar] [CrossRef] [Green Version]
  25. Open Neural Network Exchange (ONNX). Available online: https://onnx.ai/ (accessed on 29 August 2022).
  26. Jacksha, R.; Zhou, C.; Sunderman, C. Measurement of the Influence of Antennas on Radio Signal Propagation in Underground Mines and Tunnels. Prog. Electromagn. Res. C Pier C 2019, 94, 1–12. [Google Scholar] [CrossRef] [PubMed]
  27. Wainio, P.; Seppänen, K. Self-optimizing last-mile backhaul network for 5G small cells. In Proceedings of the IEEE International Conference on Communications Workshops (ICC), Kuala Lumpur, Malaysia, 23–27 May 2016. [Google Scholar]
  28. Seppänen, K.; Kilpi, J.; Paananen, J.; Suihko, T.; Wainio, P.; Kapanen, J. Multipath routing for mmWave WMN backhaul. In Proceedings of the IEEE International Conference on Communications Workshops (ICC), Kuala Lumpur, Malaysia, 23–27 May 2016. [Google Scholar]
  29. Sklearn-Onnx. Available online: https://github.com/onnx/sklearn-onnx/ (accessed on 29 August 2022).
  30. Sklearn2pmml. Available online: https://github.com/jpmml/sklearn2pmml (accessed on 29 August 2022).
  31. Redisai-py. Available online: https://github.com/RedisAI/redisai-py (accessed on 29 August 2022).
Figure 1. The research process performed based on the DSR methodology (figure is adapted based on [18]).
Applsci 12 10679 g001
Figure 2. Conceptual view of research artifacts for enabling multi-access routing for moving vehicles based on continuous ML in emulation environments. In the view, rectangles illustrate functionalities, ellipsis describes data stores, and arrows depict data flows.
Applsci 12 10679 g002
Figure 3. Conceptual view of applying continuous ML in a real mining environment (not implemented).
Applsci 12 10679 g003
Figure 4. System view of the emulator. The view has been illustrated as a Unified Modeling Language (UML) deployment diagram.
Applsci 12 10679 g004
Figure 5. Deployment environment view of the system. X-axis represents deployment environments. Y-axis represents functional areas/processing pipeline of a big data system.
Applsci 12 10679 g005
Figure 6. Class diagram illustrating a data viewpoint of the architecture.
Applsci 12 10679 g006
Figure 7. Sequence diagram illustrating model training and deployment.
Applsci 12 10679 g007
Figure 8. ML-based inference for facilitating decision making on multi-access routing.
Applsci 12 10679 g008
Figure 9. Activity diagram for the creation of network and vehicle movement simulation data for emulation purposes.
Applsci 12 10679 g009
Figure 10. Examples of the results from an ad hoc propagation model. On the right-hand side, two dead zones are simulated—one around 175 m and another around 400 m.
Applsci 12 10679 g010
Figure 11. Deployment diagram of an emulation node.
Applsci 12 10679 g011
Figure 12. Deployment diagram of emulated mesh network environment.
Applsci 12 10679 g012
Figure 13. Error (symmetric MAPE) of incremental ML with River as a function of data samples. Measurements of the first 5000 samples are provided for illustrating until SMAPE was <10 %.
Applsci 12 10679 g013
Figure 14. OWD of vehicle 2 in the short emulation experiment (6 min), where decision making was facilitated with a ML-based model. A simple heuristic (RSSI-based) model was used as a reference case.
Applsci 12 10679 g014
Table 1. Offline accuracy/efficiency of different ML algorithms.
AlgorithmMLP RegressorRandomForestRegressorRiver
Training featuresRSSI,
bitrate,
and SNR
RSSI,
bitrate,
and SNR
RSSI and bitrate or
RSSI, bitrate,
and SNR
Algorithm configurationdefaultn_estimators = 100n_models = 10,
seed = random,
algorithm =
AdaptiveRandomForestRegressor
Accuracy metricStratified K-fold (10)Stratified K-fold (10)Symmetric MAPE
Feature importances-RSSI = 0.0386,
bit rate = 0.946,
SNR = 0.015
-
Accuracy0.91± 0.070.935 ± 0.05RSSI, bitrate, and SNR: 6.648%
Table 2. A summary of emulation results when ML-based decision making was compared to the reference (heuristic approach).
Short Test: 6 minLong Test: 1 h
Vehicle 1OWD (ms)Prediction error (%)OWD (ms)Prediction error (%)
RSSI15.40 16.10
ML14.58 14.03
ML improvement (%)5.345.7012.857.52
Vehicle 2
RSSI15.16 15.90
ML13.42 14.04
ML improvement (%)11.536.1111.715.38
Publisher’s Note: MDPI stays neutral with regard to jurisdictional claims in published maps and institutional affiliations.

