
A Review of Deep Learning Applications for Railway Safety
 , , ,
, , ,
Abstract
:1. Introduction
2. Overview of Deep Learning Approaches
2.1. Data Types
2.1.1. Image Data
2.1.2. Time-Series Data
2.2. Tasks
2.2.1. Classification
2.2.2. Object Detection
2.2.3. Segmentation
2.2.4. Feature Extraction
3. Methodology
4. Railway Infra Safety
4.1. Catenary
4.2. Rail Surface
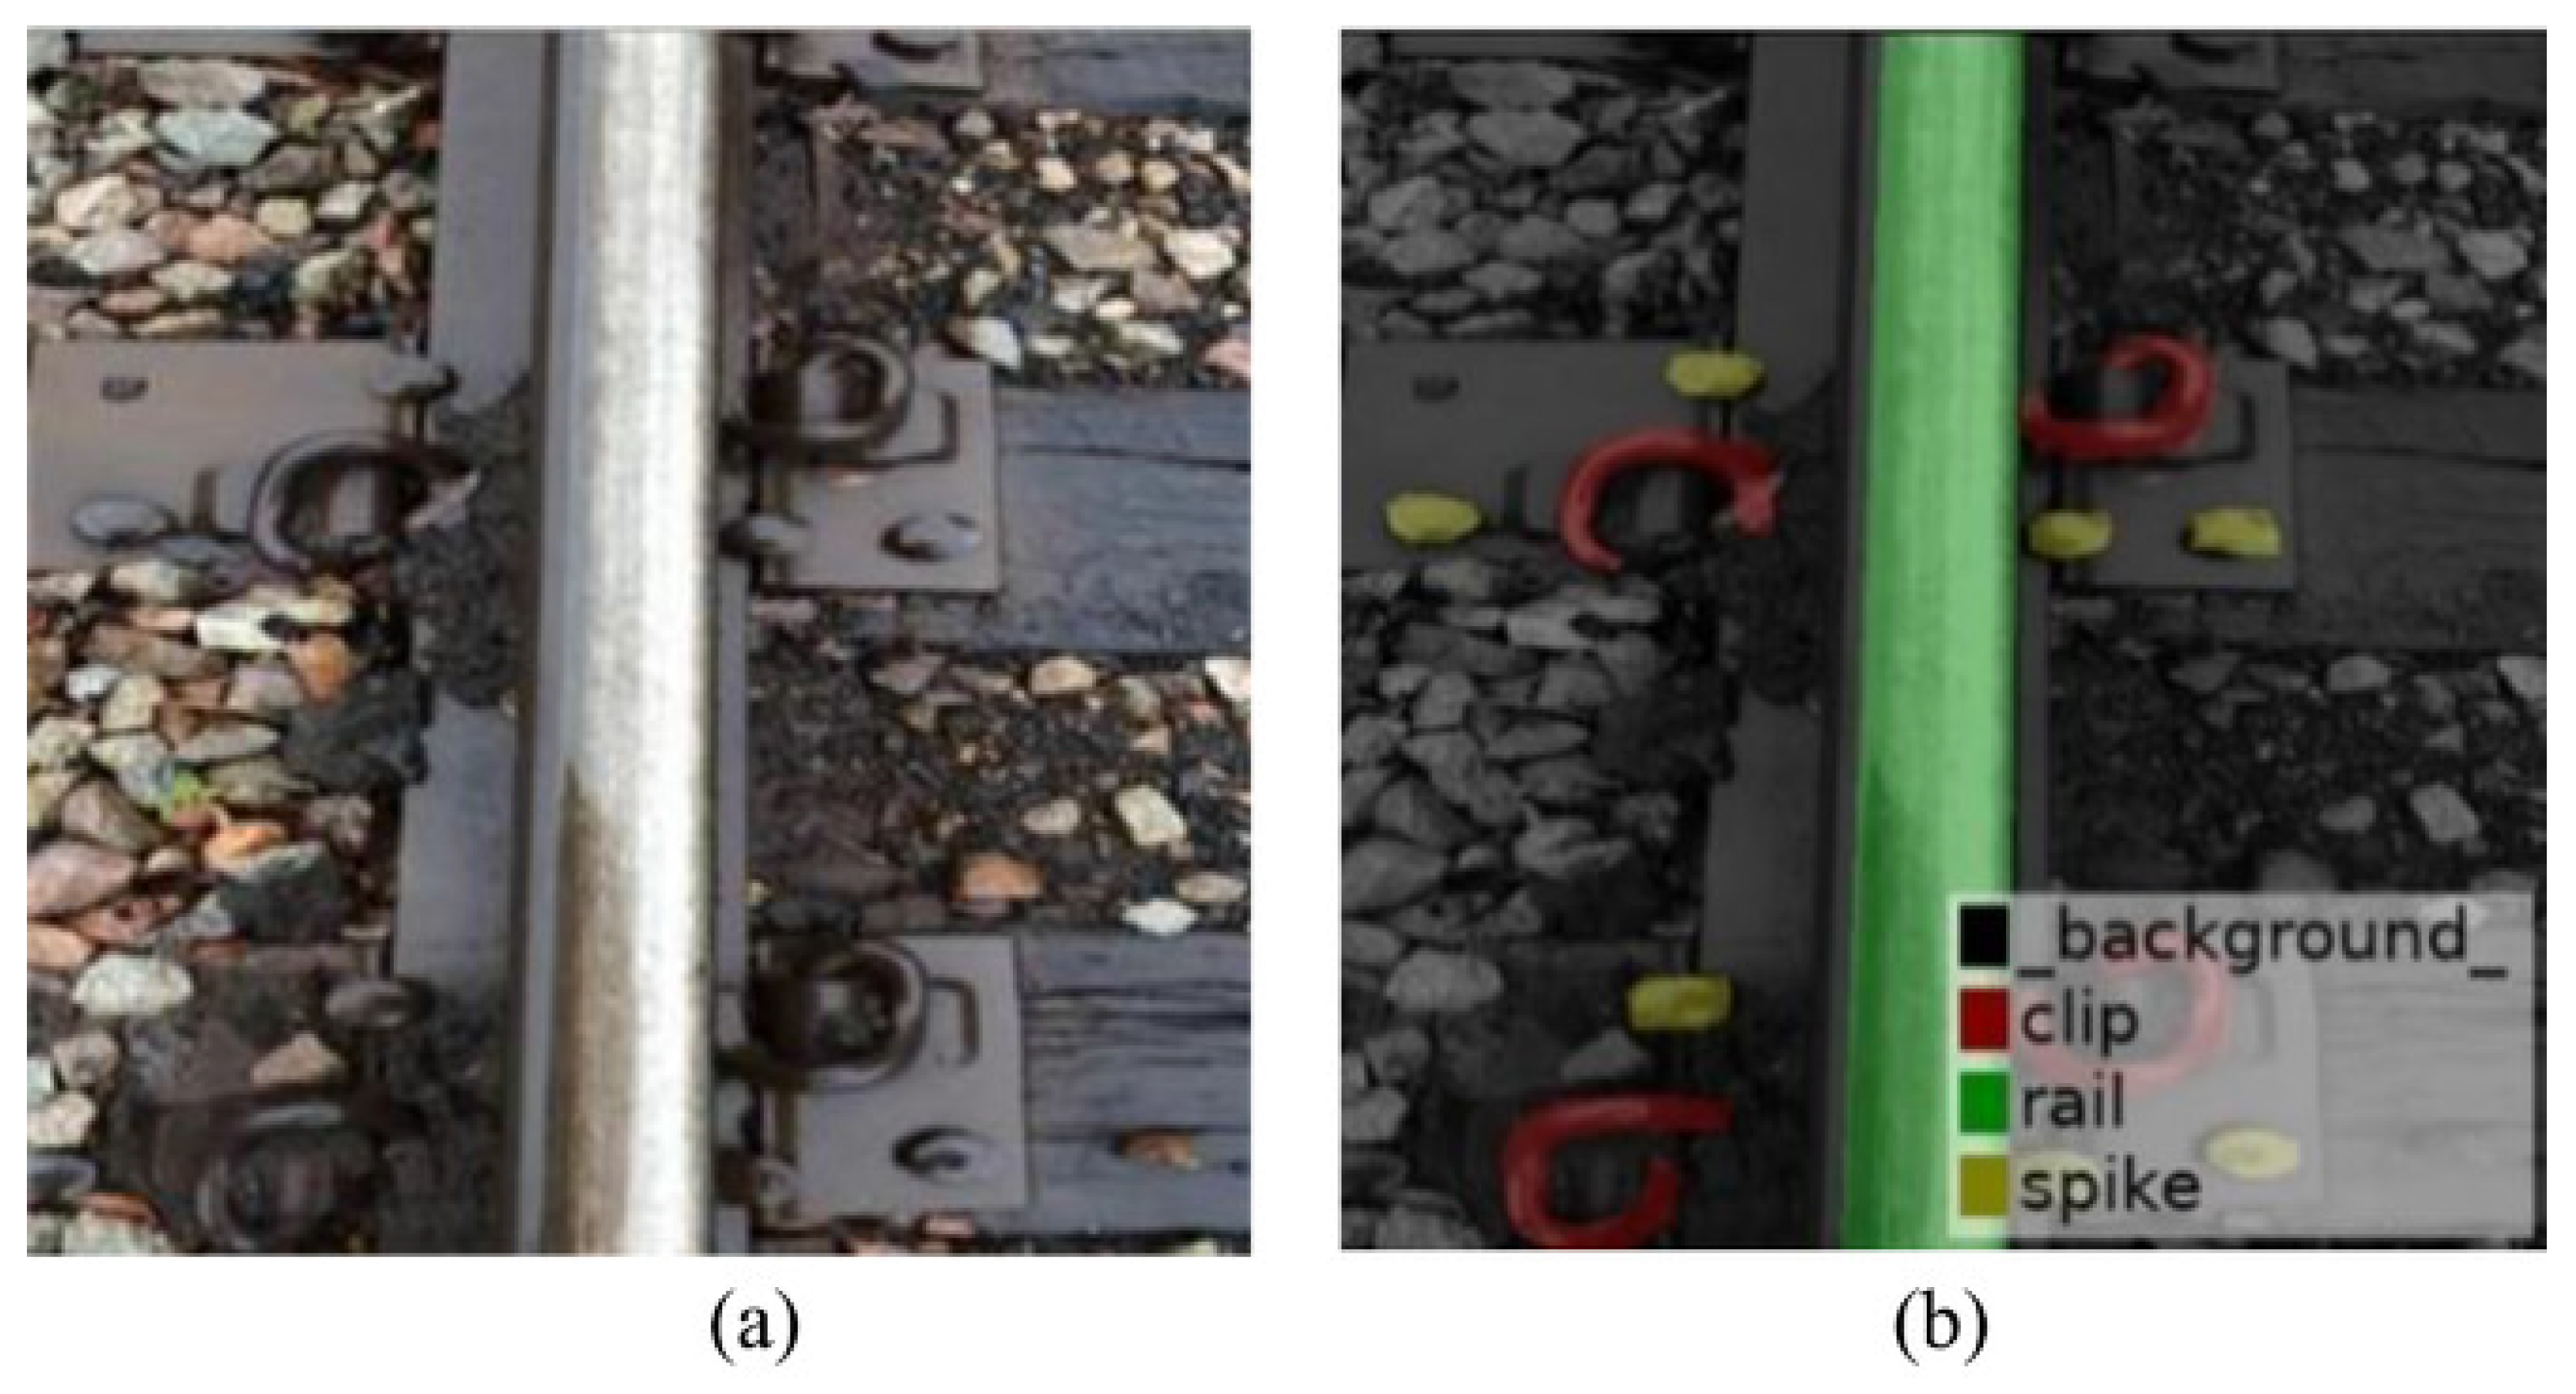
4.3. Rail Components
4.4. Rail Geometry
5. Train Safety
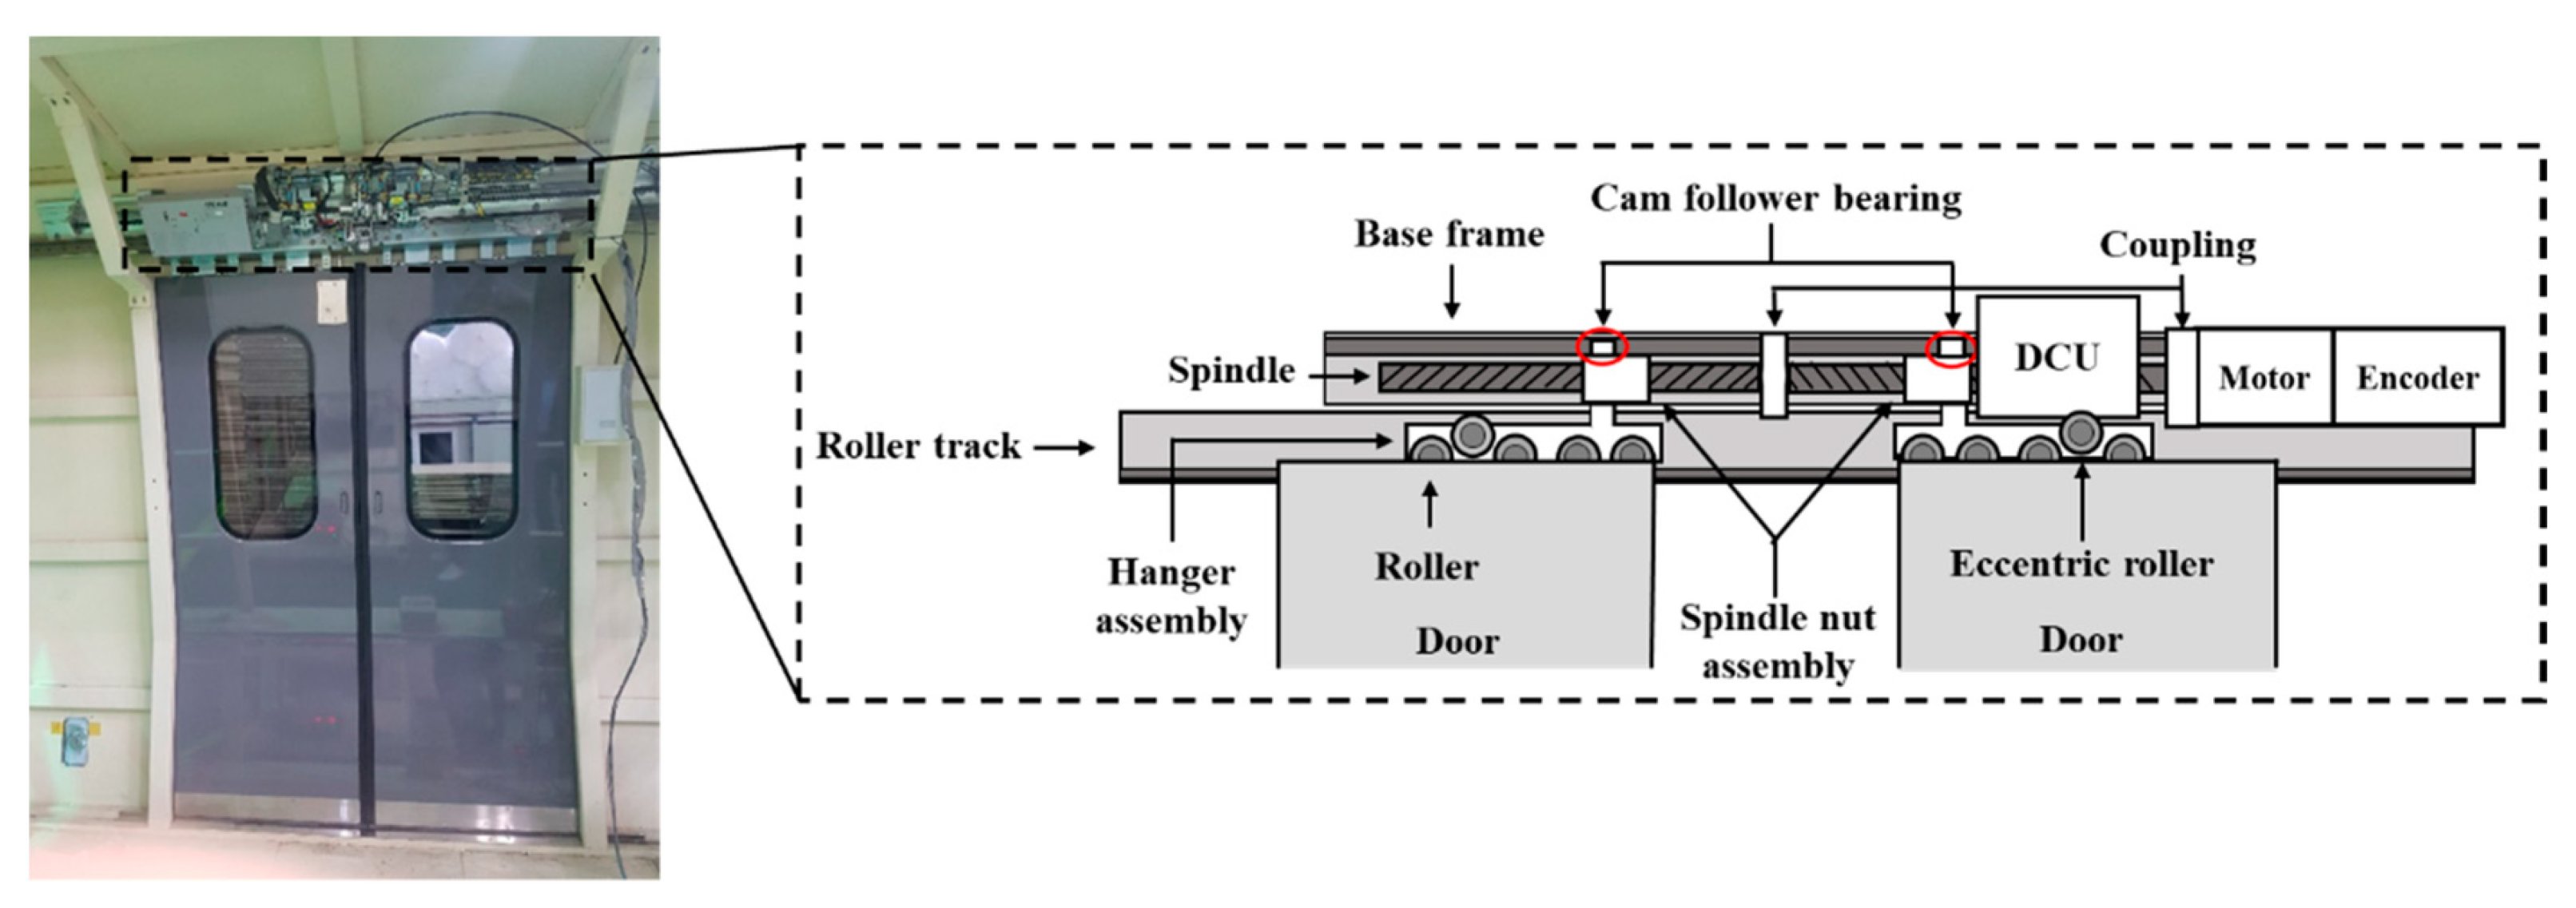
5.1. Train Door
5.2. Wheel
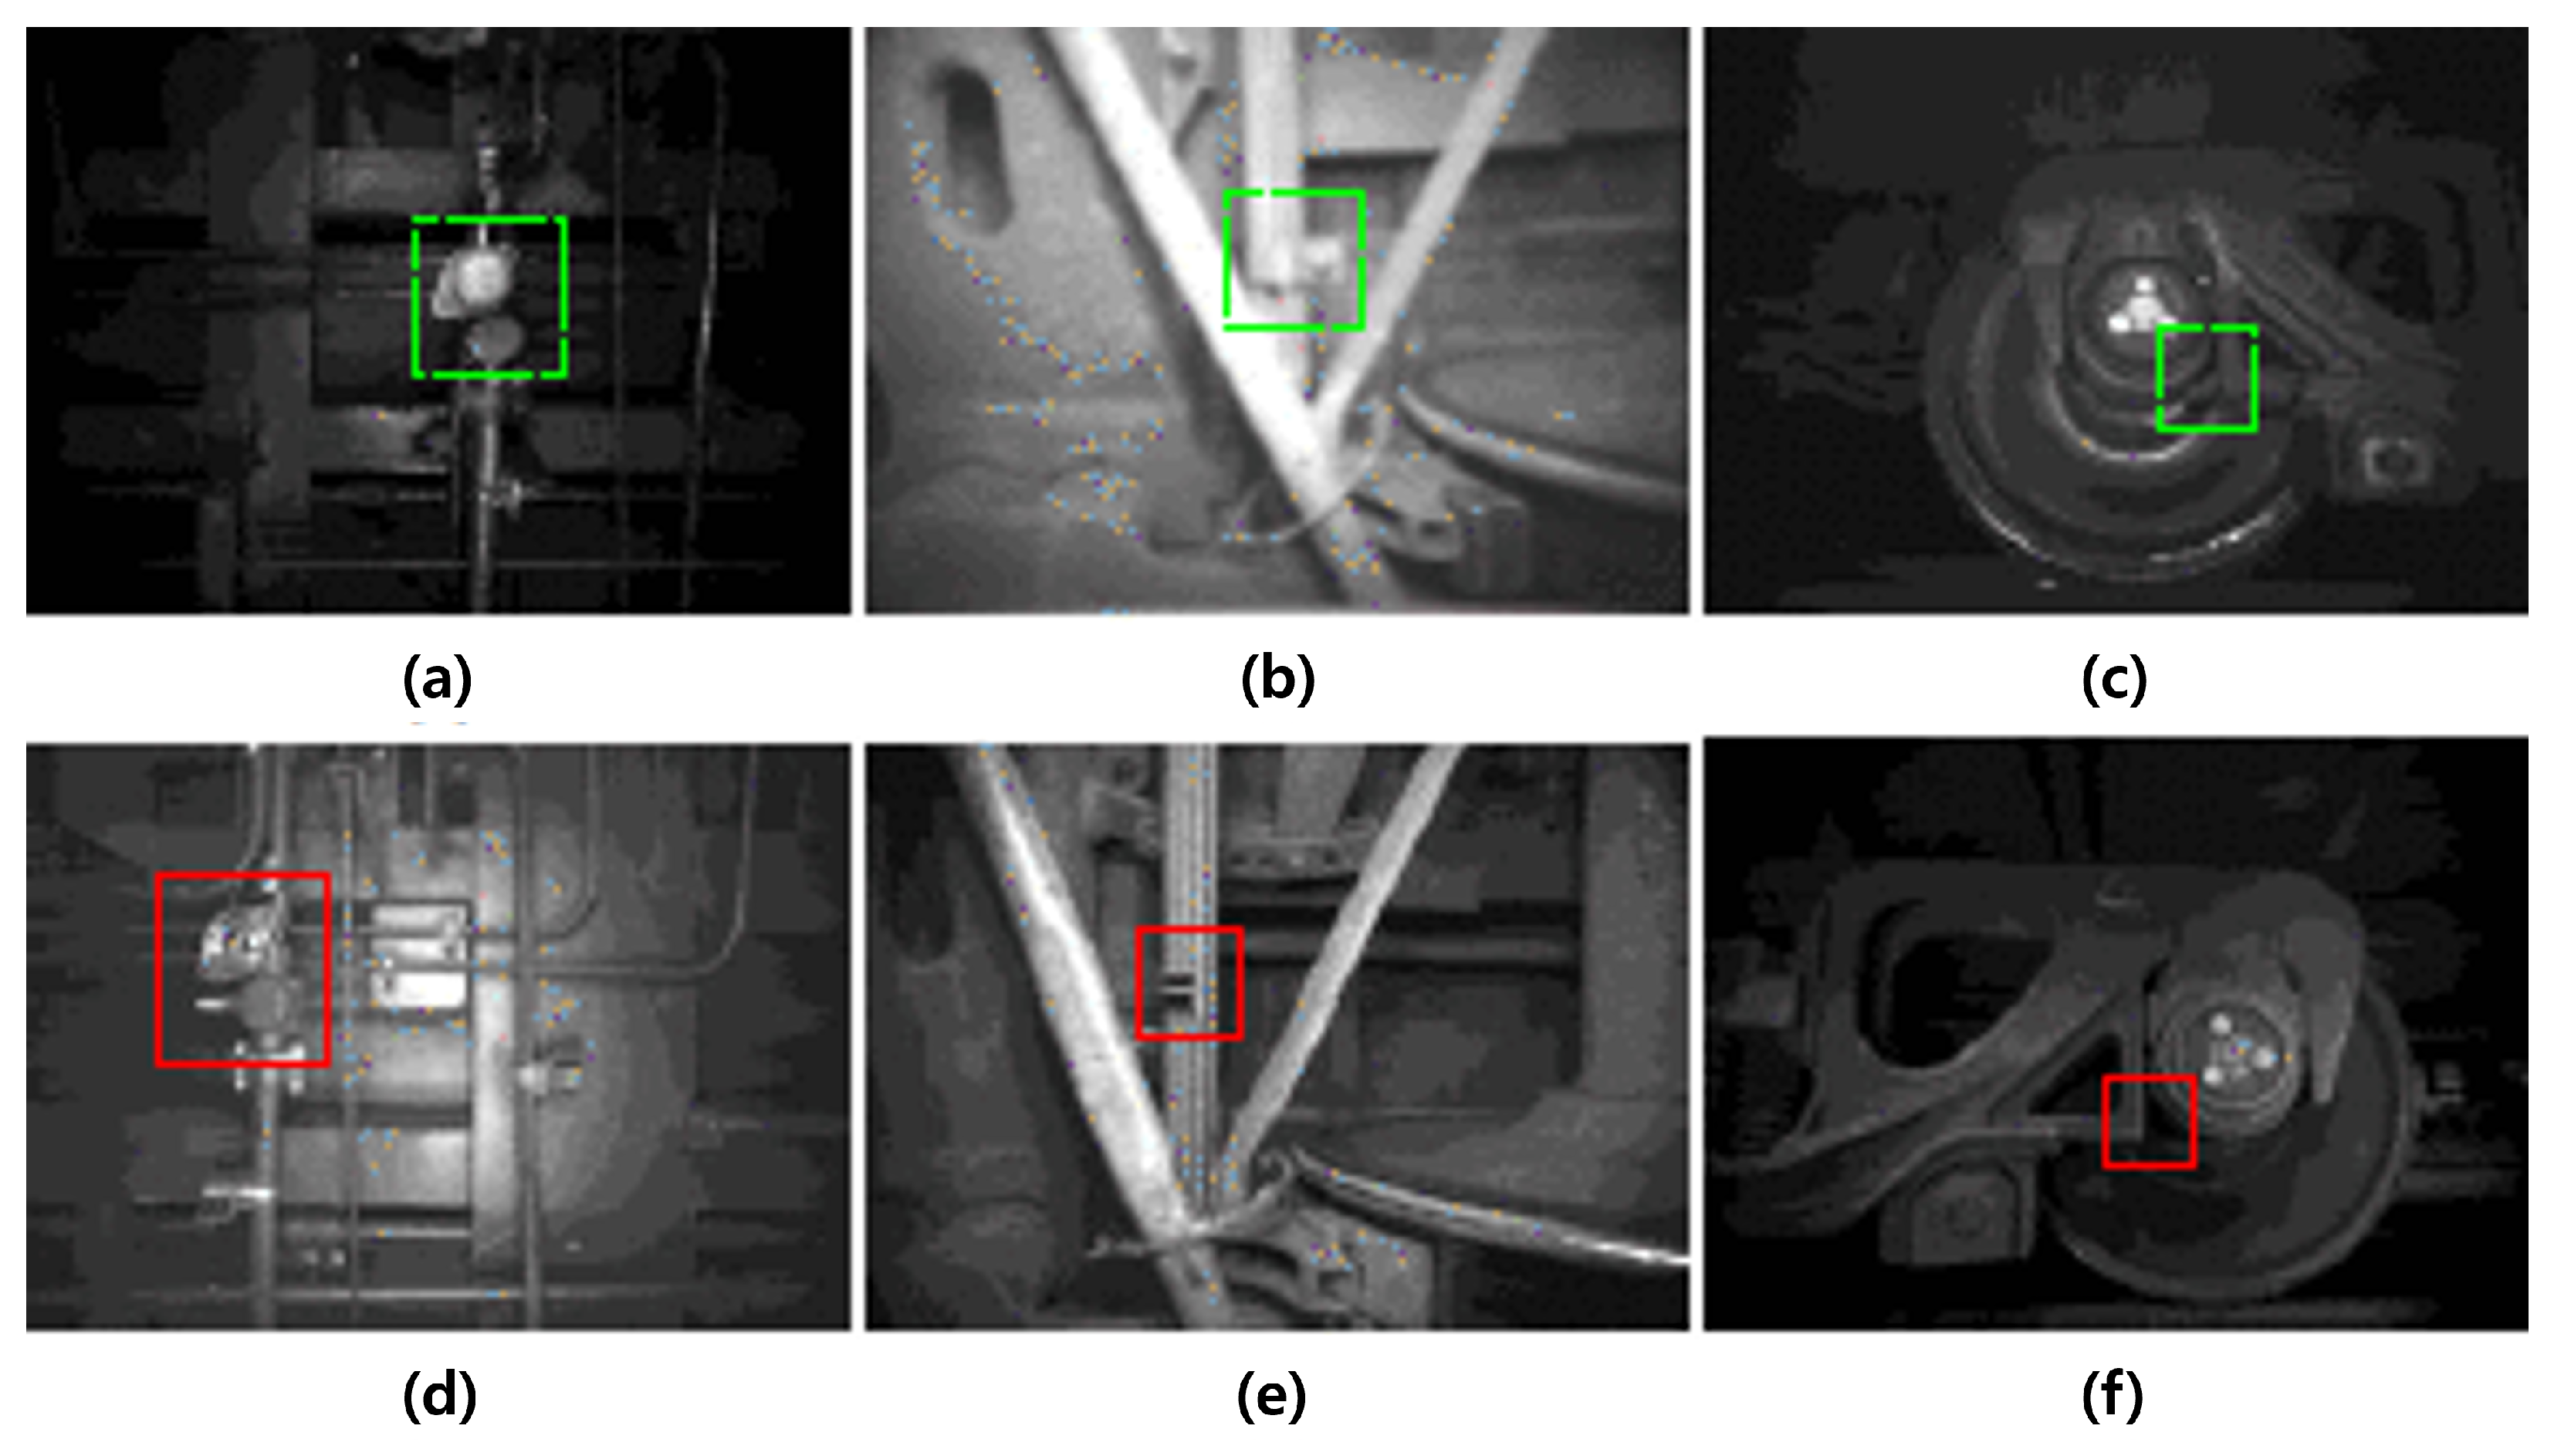
5.3. Suspension
5.4. Bearing
6. Operation Safety
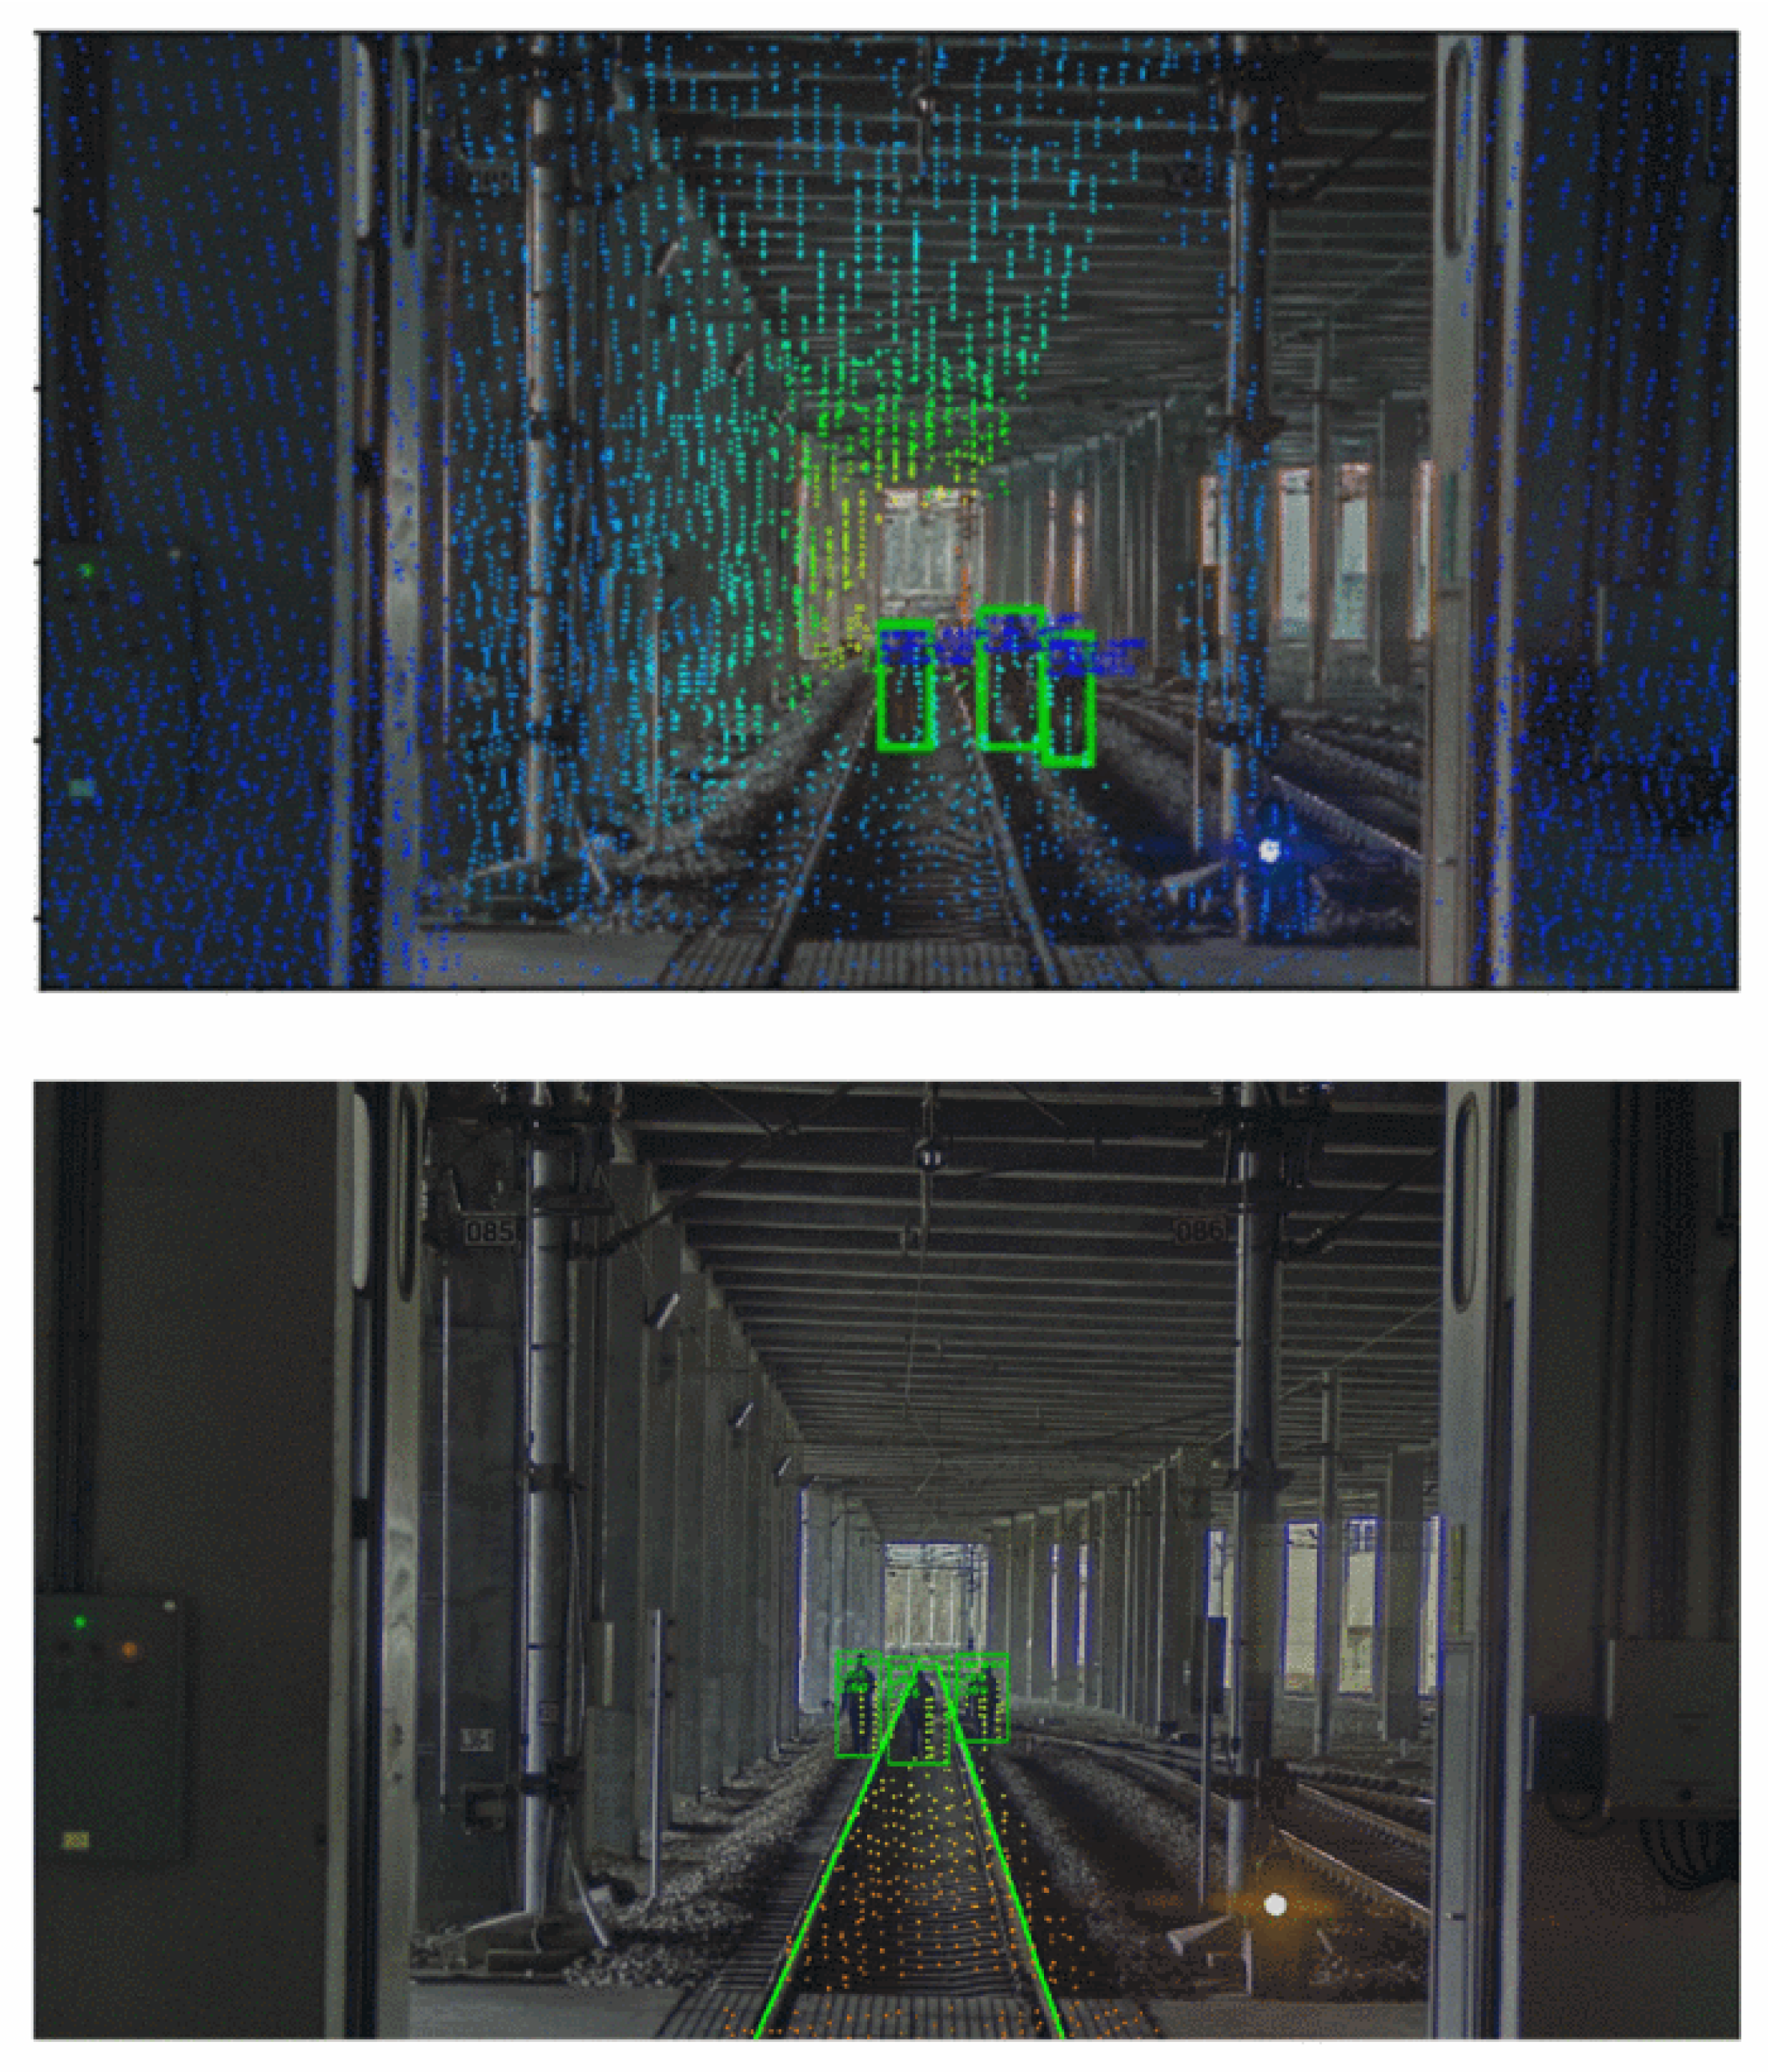
6.1. Railroad Trespassing
6.2. Railway Detection
6.3. Wind Risk
6.4. Train Running Safety
6.5. Managing Accident Reports
7. Station Safety
7.1. Accident Prevention
7.2. Air Quality Control
7.3. Simulation and Scheduling
8. Discussion and Conclusions
8.1. Performance Optimization
8.1.1. Dealing with a Lack of Data
8.1.2. Processing Time
8.1.3. New Data Source
8.2. Generalization
8.2.1. Tasks
8.2.2. Validation with In-Situ Data
Author Contributions
Funding
Institutional Review Board Statement
Informed Consent Statement
Data Availability Statement
Conflicts of Interest
Appendix A

| Ref | Safety Type | Category | Target | Data Type | Source | Training Data | Test Data | Method | Performance |
|---|---|---|---|---|---|---|---|---|---|
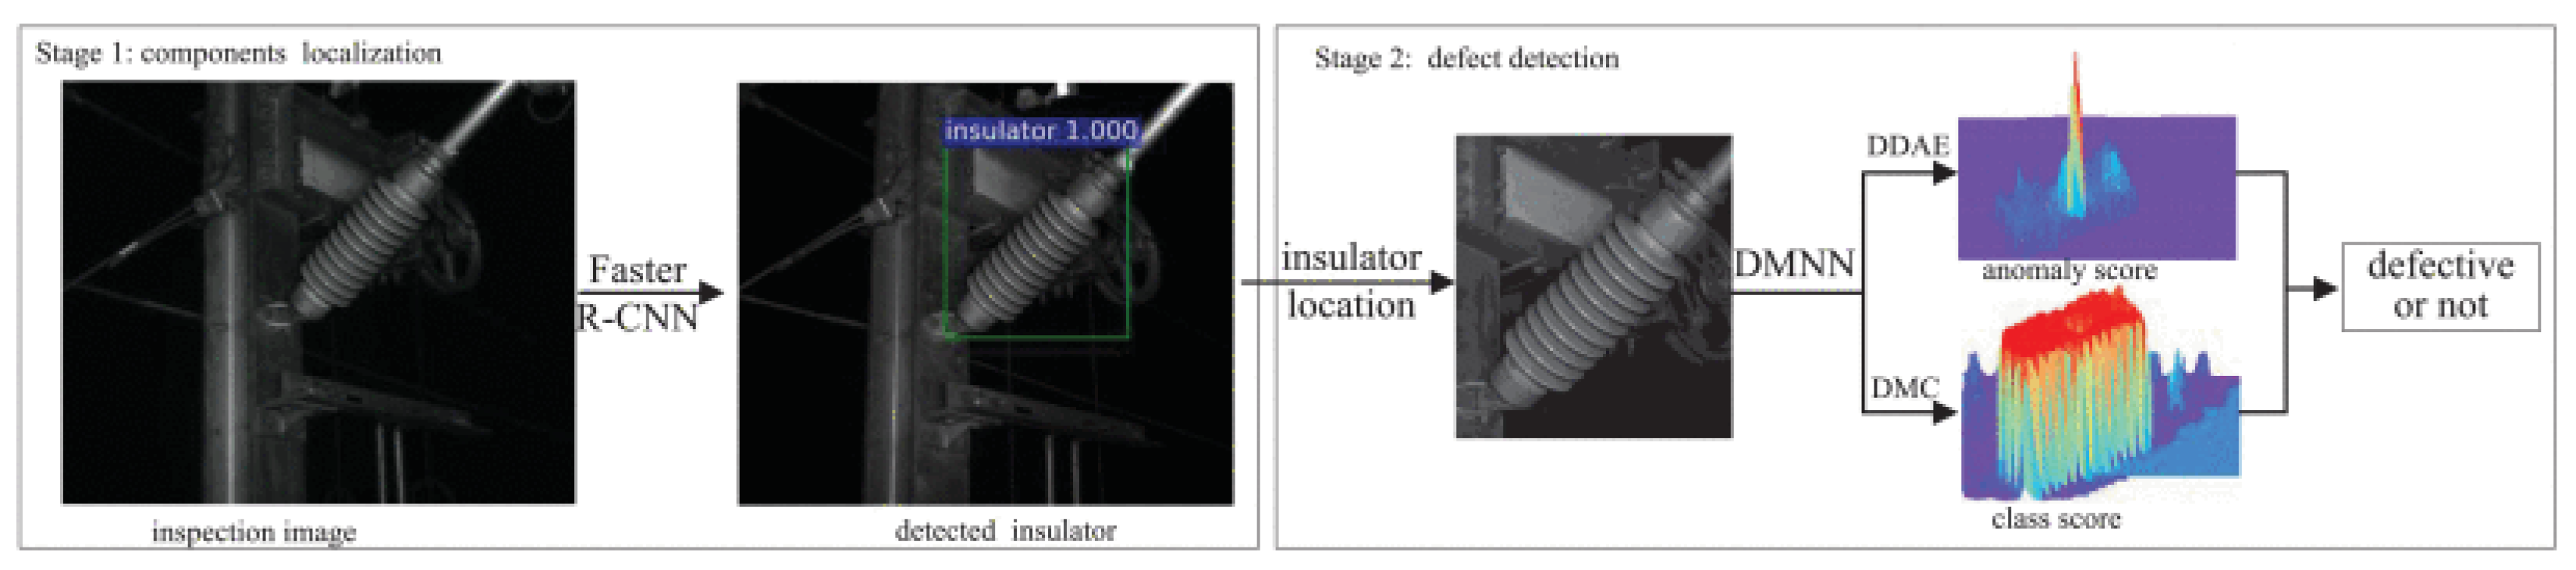
| [37] | Railway Infra | Catenary | Insulator | Image | Custom | 12,000 | 6000 | Faster R-CNN, CNN, AE (Auto-Encoder) | 0.95 (F1-score) |
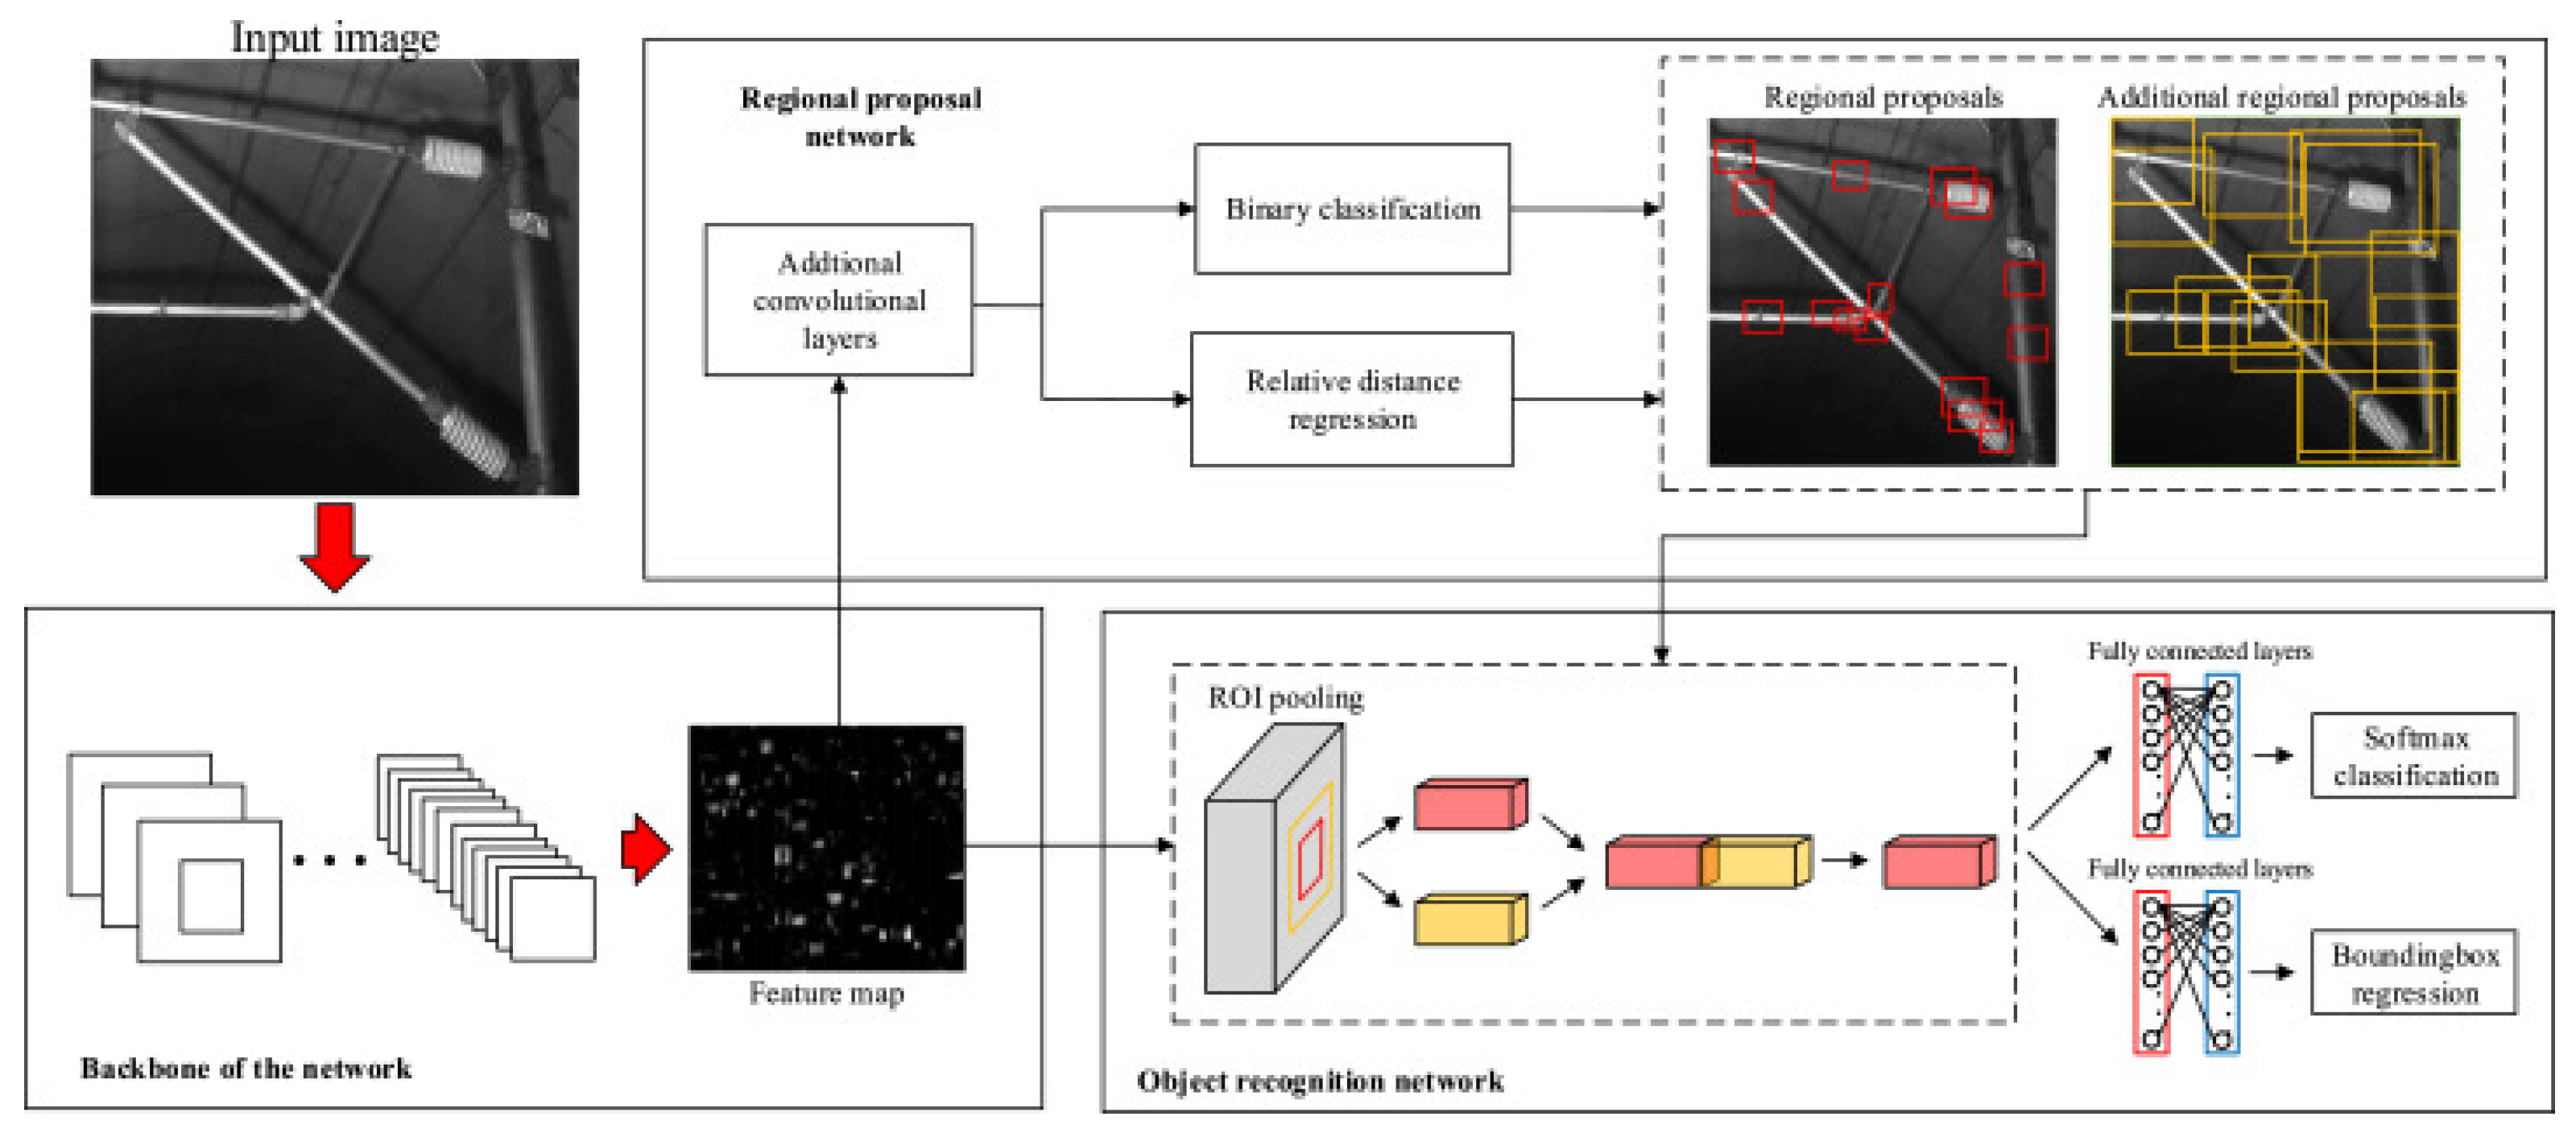
| [38] | Railway Infra | Catenary | Dropper | Image | PASCAL VOC , MSCOCO | 1172 | 293 | Faster R-CNN, FPN (Feature Pyramid Network), ResNet | 0.87 (mAP@0.5), 0.84 (mAP@0.7) |
| [39] | Railway Infra | Catenary | Clevis | Image | PASCAL VOC | 4000 (5075 clevis) | 2000 (2563 clevis) | Faster R-CNN, CNN | 0.76–0.97 (Accuracy) |
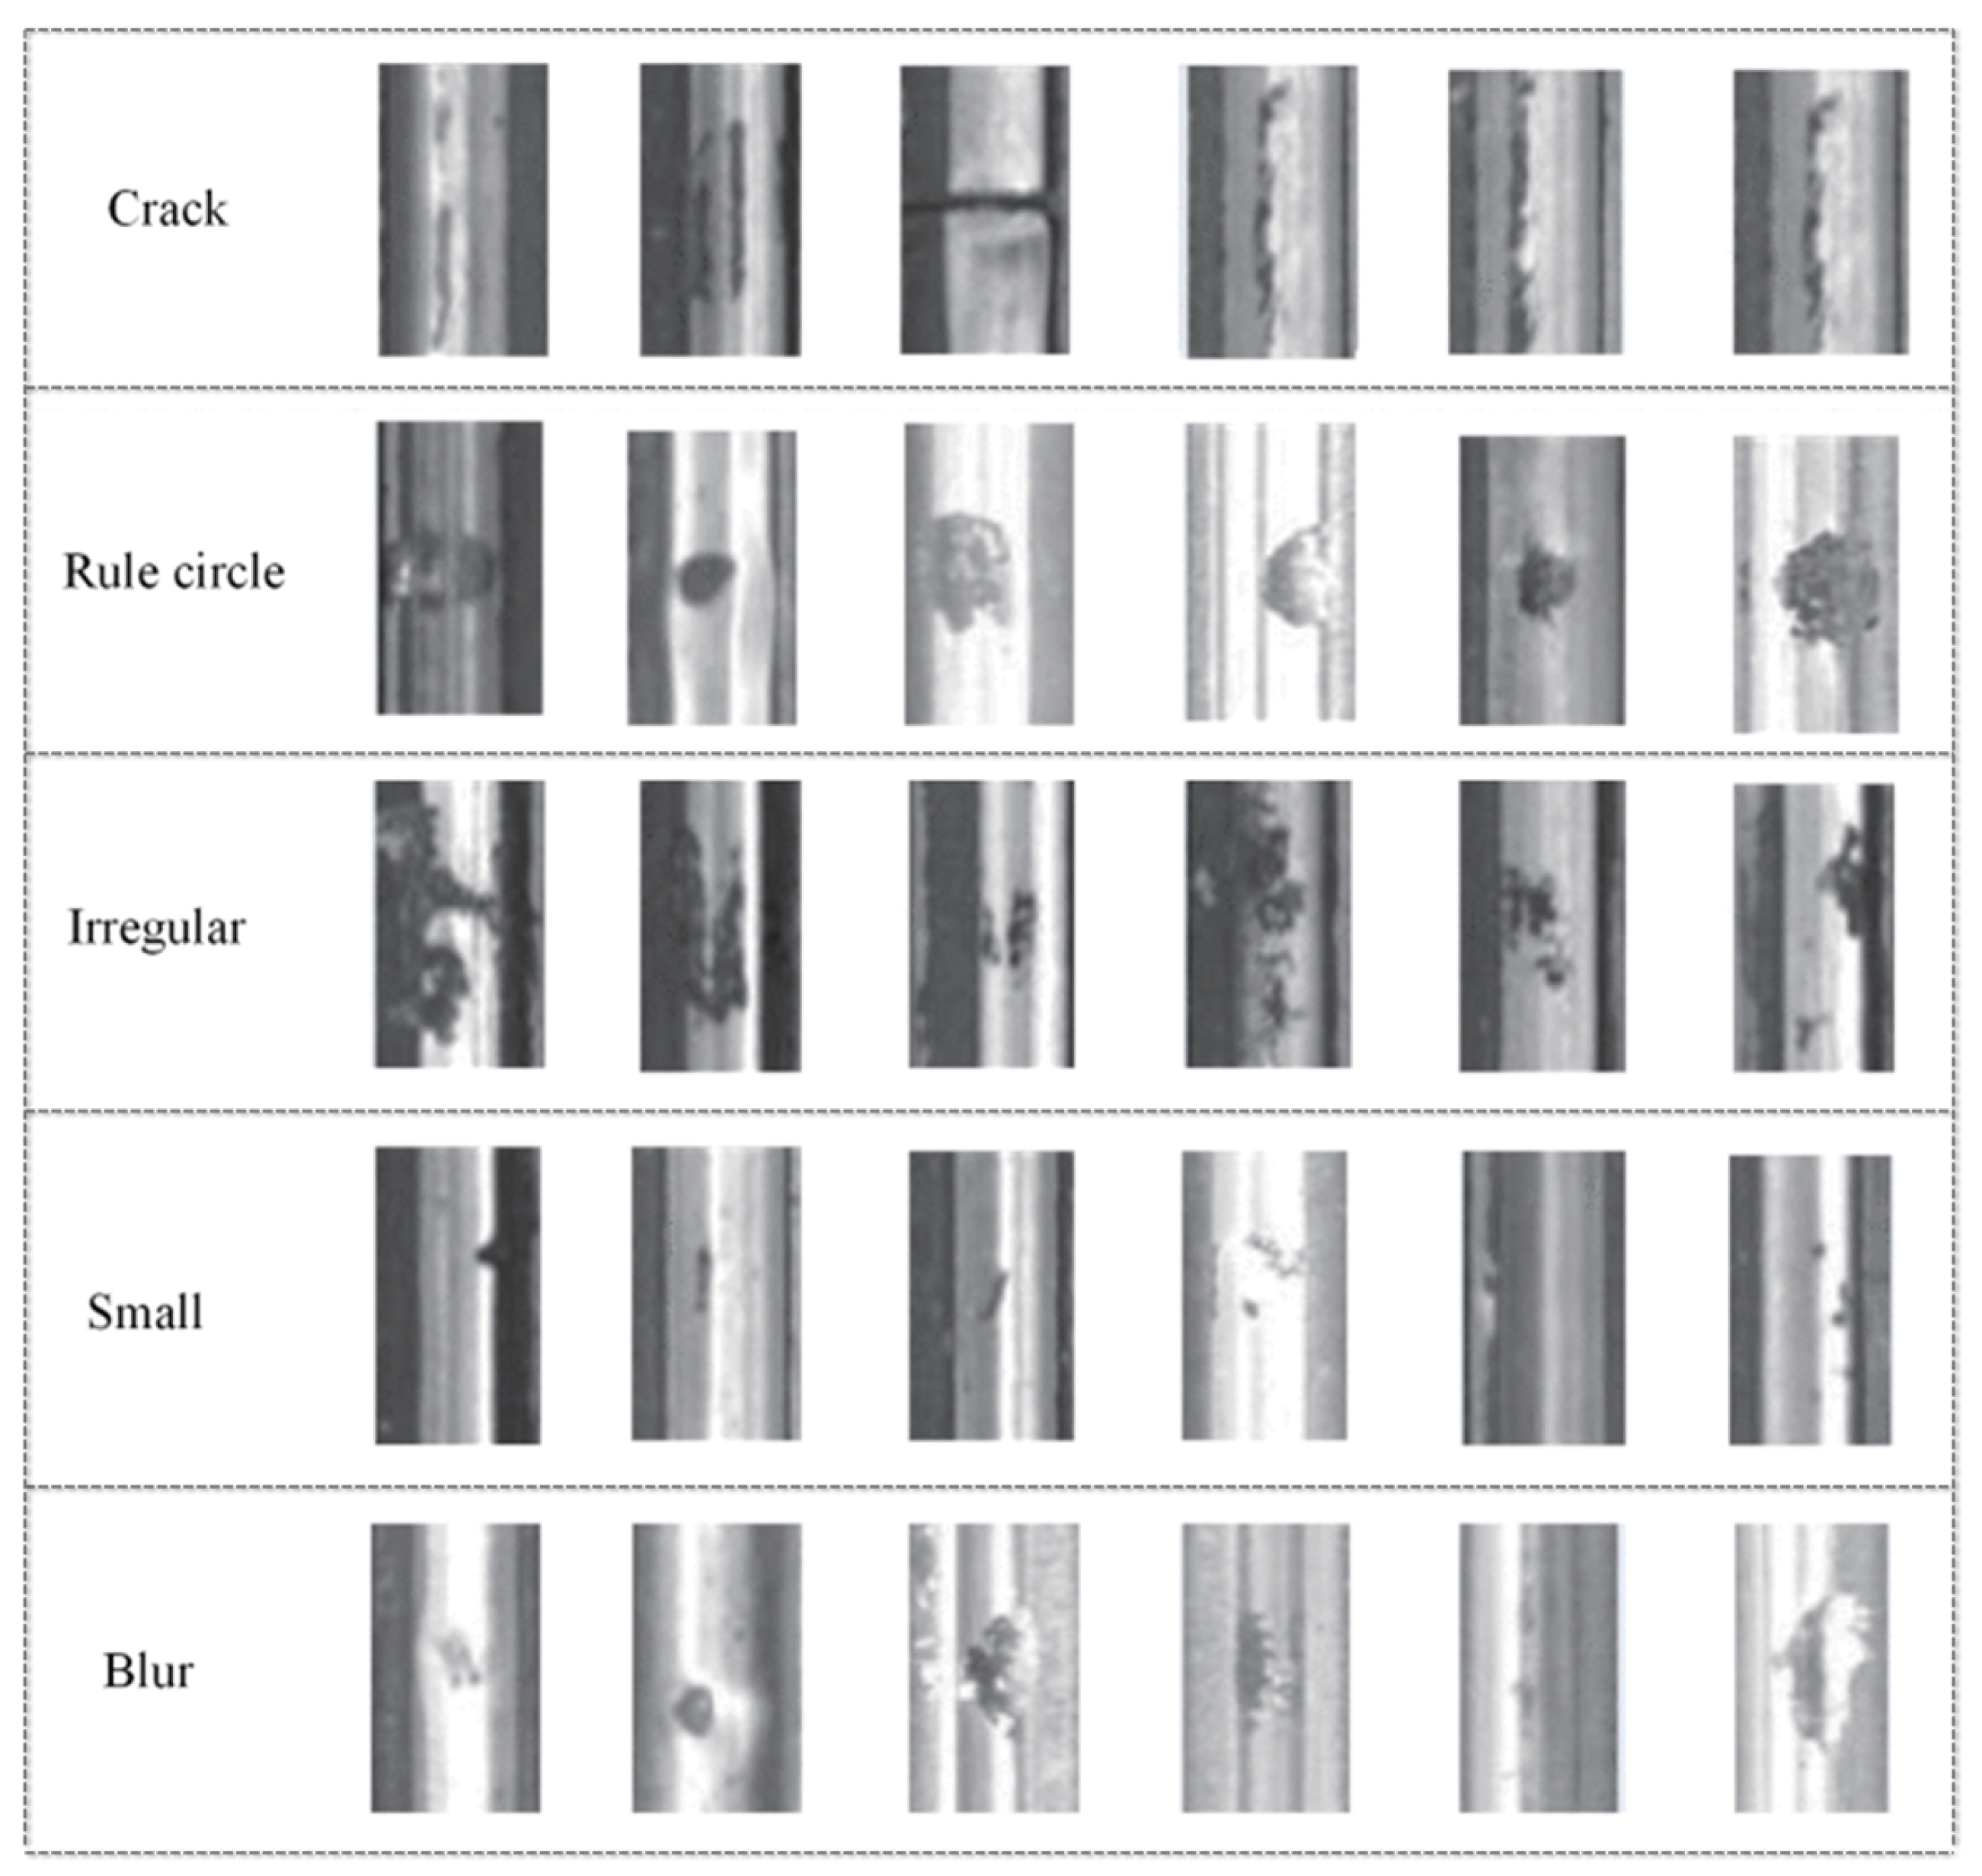
| [40] | Railway Infra | Catenary | Split pin | Image | Custom | 8256 (66,259 split pins) | 2670 (21,472 split pins) | YOLOv3, DeepLab v3+ | 0.99 (Accuracy) |
| [44] | Railway Infra | Catenary | Current-carrying ring | Image | Custom | 3050 | 1500 | Attention, RetinaNet | 0.70 (mAP@0.5) |
| [45] | Railway Infra | Surface | Scouring, Breakage, Corrugation, Headcheck | Video | Custom | Unknown | Unknown | PCA, SVD, RF (Random Forest) | 0.85–0.98 (Accuracy) |
| [47] | Railway Infra | Surface | Defect | Image | PASCAL VOC | 184 | 11 | YOLOv3, ResNet | 0.97–1 (Detection Rate), 0.15 s (Time Cost) |
| [48] | Railway Infra | Surface | Defect | Image | Custom | 142,416 | 9494 | MobileNetV2, YOLOv3 | 0.87 (mAP) |
| [5] | Railway Infra | Surface | Defect | Image | Custom | 1905 | 211 | CNN, VGG19 | 0.92–0.92 (F1-score) |
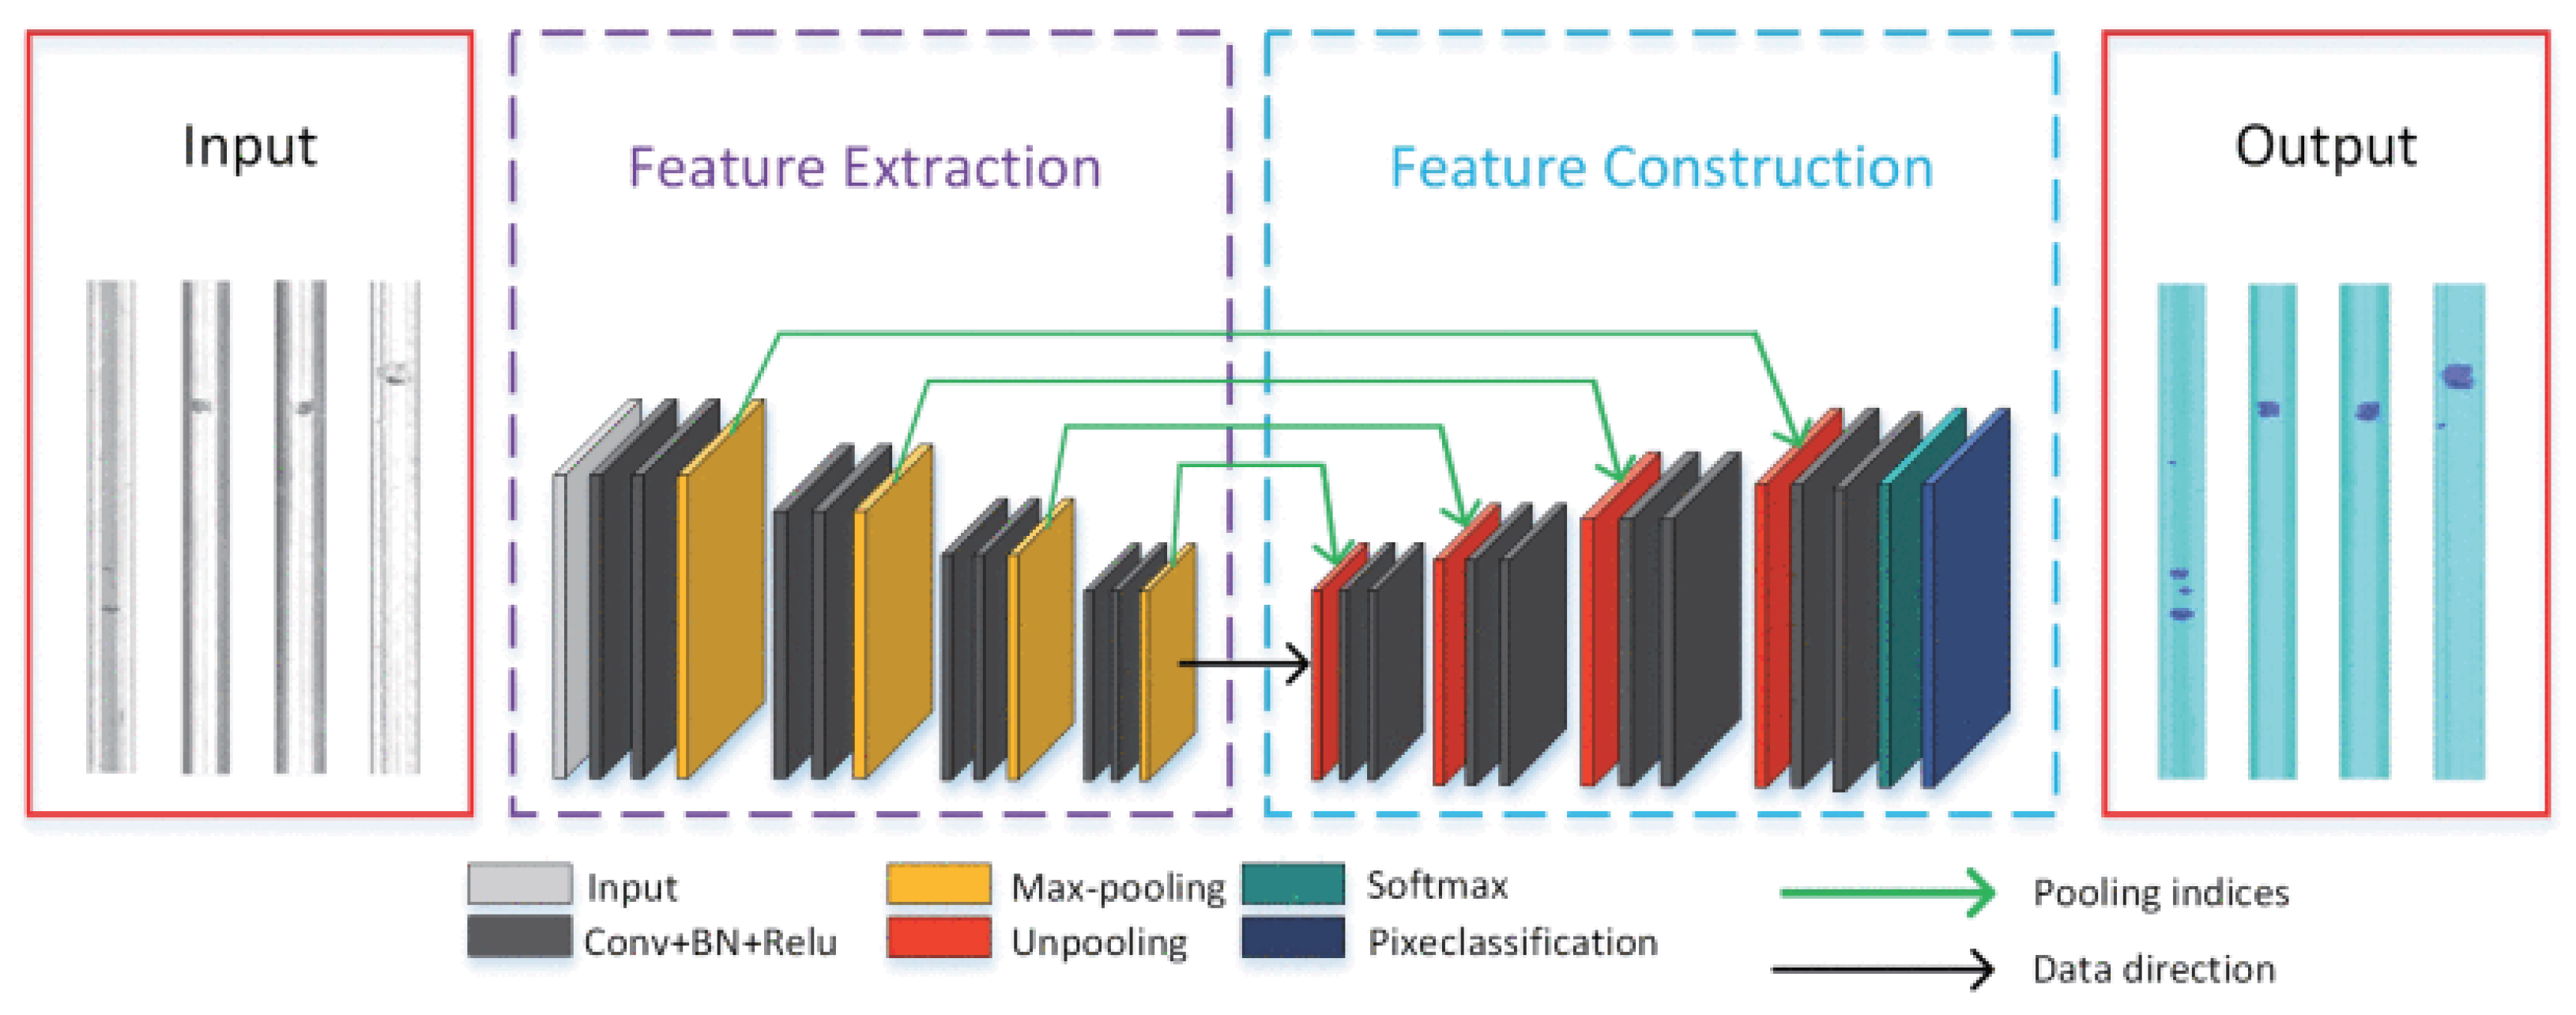
| [50] | Railway Infra | Surface | Defect | Image | Custom | 120 | 7 | SegNet | 1 (Detection Rate), 0.99 (Accuracy) |
| [46] | Railway Infra | Surface | Defect | Image | Custom | 2916 | 324 | CNN | 0.90–0.91 (F1-score), 1.00–2.03 s (time cost) |
| [49] | Railway Infra | Surface | Defect | Image | Custom | 5793 | 1517 | Inception3, CNN | 0.92 (Recall), 0.92 (Precision) |
| [8] | Railway Infra | Surface | Rolling Contact Fatigue | Signal (Laser ultrasonic) | Custom | Unknown | 256 | SVM | 0.99 (Accuracy) |
| [51] | Railway Infra | Surface | Squat | Signal (Acceleration) | Custom | 819 | 204 | CVAE (Convolutional Variational Auto Encoder) | 0.93–0.97 (Accuracy) |
| [9] | Railway Infra | Surface | Crack | Signal (Acoustic emission) | Custom | 360 | 90 | DNN | 0.77 (Accuracy) |
| [52] | Railway Infra | Surface | Wear | Measurements (Load, Yaw angle, Speed, Wheel, Rail profile) | Custom | 182 | 39 | ANN | 0.81–0.93 (Accuracy) |
| [53] | Railway Infra | Surface | Defect | Image | Custom | 540 | 60 | CNN, ResNet | 0.93–0.97 (F-measure) |
| [54] | Railway Infra | Surface | Defect | Image | Custom | 146 | 49 | 1D-CNN, LSTM | 0.93–0.94 (Recall), 0.84–0.92 (Precision), 0.88–0.93 (F1-Score) |
| [56] | Railway Infra | Surface | Dust, Oil | Signal (3D Laser camera) | Custom | 7500 | 2500 | CNN | 0.98 (Accuracy) |
| [57] | Railway Infra | Surface | Degradation | Signal (Acceleration) | Melbourne Tram Network Data | Unknown | Unknown | SVM, RF, ANN | 0.71–0.78 (Adjusted ), (RMSE) |
| [58] | Railway Infra | Components | Spike, Clip, Tie Plate | Image | Custom | 800 | 200 | YOLACT, Res2Net, ResNet | 0.60–0.64 (mAP) |
| [59] | Railway Infra | Components | Fastener, Crosstie, Ballast, Gage | Image | Custom | 650,518 | 162,629 | CNN | 0.95 (Accuracy) |
| [60] | Railway Infra | Components | Settlement, Dipped joint | Signal (Acceleration) | Custom | 1155 | 495 | DNN, CNN, RNN | 0.84–0.99 (Accuracy) |
| [7] | Railway Infra | Components | Joint, Crossing, Turnout | Signal (Acceleration) | Custom | 23 | 41 | CNN, ResNet | 0.99 (Accuracy) |
| [61] | Railway Infra | Components | Joint | Signal (Acceleration) | Custom | 129 | 295 | CNN, ResNet | 0.74–0.91 (F1-score) |
| [62] | Railway Infra | Components | Clamp | Signal (Eddy current) | Custom | 2076 | 890 | SVM, k-NN, RF | 0.97 (Precision), 0.96 (Recall) |
| [63] | Railway Infra | Components | Rail Switch Machine | Signal (Electric current) | Custom | Unknown | 615 | K-means clustering | 0.86 (Silhouette score) |
| [64] | Railway Infra | Components | Rail Slab | Signal (Vibration) | Custom | 1774 | 760 | RF | 0.96 (Accuracy) |
| [65] | Railway Infra | Geometry | Quality | Signal (Vibration) | Custom (Comprehensive Inspection Train) | 5,400,000 | 600,000 | CNN, LSTM | 0.005–0.006 (MAE), 0.007–0.008 (RMSE) |
| [66] | Railway Infra | Geometry | Irregularity | Signal (Acceleration) | Custom (Beijing–Shanghai, Beijing–Guangzhou and Nanjing–Hangzhou HSRs) | 200 km | 100 km | Attention, CNN, GRU | 0.25–0.51 (MAE), 0.33–0.66 (RMSE) |
| [67] | Train | Door | Defect | Signal (Current) | Custom | 440 | 186 | CNN, k-NN | 0.98–0.99 (Accuracy) |
| [68] | Train | Wheel | Defect | Signal (Vertical force) | Custom | 7860 | 2565 | DNN, SVM | 0.81–0.89 (Accuracy) |
| [69] | Train | Wheel | Displacement | Image | Custom | 2301 | 767 | CNN, YOLOv3 | 0.35 (Miss Detection Rate) |
| [70] | Train | Suspension | Coil Spring, Air Spring, Vertical Damper, Lateral Damper, Yaw Damper | Signal (Vibration) | Case Western Reserve University (CWRU) Bearing Data Center | 59,520 | 7440 | Bayesian DL | 0.77–0.99 (AUROC) |
| [71] | Train | Suspension | Anti-yaw Shock Absorber, Air Spring, Transverse Shock Absorber | Signal (Vibration) | Custom | 14000 | 208 | DBN (Deep Belief Network) | 0.23–0.54 (Accuracy) |
| [72] | Train | Bearing | Defect | Signal (Vibration) | Case Western Reserve University (CWRU) Bearing Data Center | 2000 | 2000 | CNN, RF (Random Forest), LeNet-5 | 0.97 (Accuracy) |
| [73] | Train | Bearing | Defect | Signal (Acoustic emission) | Custom | 270 | 180 | DNN | 0.96–1 (Accuracy) |
| [74] | Train | Bearing | Defect | Signal (Vibration) | Custom | 640 | 160 | DBN (Deep Belief Network) | 0.95 (Accuracy) |
| [75] | Train | Other Components | Cut-out cock handle, Dust collector, Fastening bolt, Bogie block key | Image | PASCAL VOC | 8794 | 6493 | Faster R-CNN, CNN | 0.98–1 (Correct Detection Rate) |
| [76] | Train | Other Components | Side Frame Key, Shaft Bolt | Image | PASCAL VOC | 2321 | 354 | CNN | 0.93–1 (Accuracy) |
| [77] | Train | Other Components | Bolt, Pin, Rivet, Chain, Wire | Image | Custom | 307 | 72 | CNN, ResNet | 0.90 (Recall), 0.86 (Precision), 0.88 (F1-score) |
| [78] | Train | Other Components | Bolt, Retaining key | Image | Custom | 3614 | 903 | SSD, CNN | 0.89 (mAP) |
| [79] | Operation | Railroad trespassing | Trespasser | Video | Custom | Unknown | 69 h | Mask R-CNN | Unknown |
| [80] | Operation | Railroad Trespassing | Obstacle | Image (Camera, LiDAR) | Custom | Unknown | Unknown | SSD | 0.05–0.21 (Error Rate) |
| [81] | Operation | Railway Detection | Railway area | Image | Custom (Beijing metro Yanfang line and Shanghai metro line 6) | 4494 | 1123 | CNN | 0.99 (MIoU), 0.99 (Mean Pixel Accuracy) |
| [82] | Operation | Railway Detection | Railway area | Image | Custom | 2500 | 300 | ResNet50 | 0.92 (Accuracy), 0.90 (mIoU), 0.87 (F1-score) |
| [83] | Operation | Wind Risk | Wind Speed | Wind Speed | Custom (Beijing-Shanghai HSR) | 23,792 | 9517 | Attention, LSTM | 0.82 (AUC), 0.95 (F1-score) |
| [88] | Operation | Train Running Safety | Wheel Derail Coefficient, Wheel Rate of Lad Reduction, Wheel Lateral Pressure | Signal (Vibration) | Custom | 9600 | 2400 | DNN, LSTM | 0.42 (RMSE) |
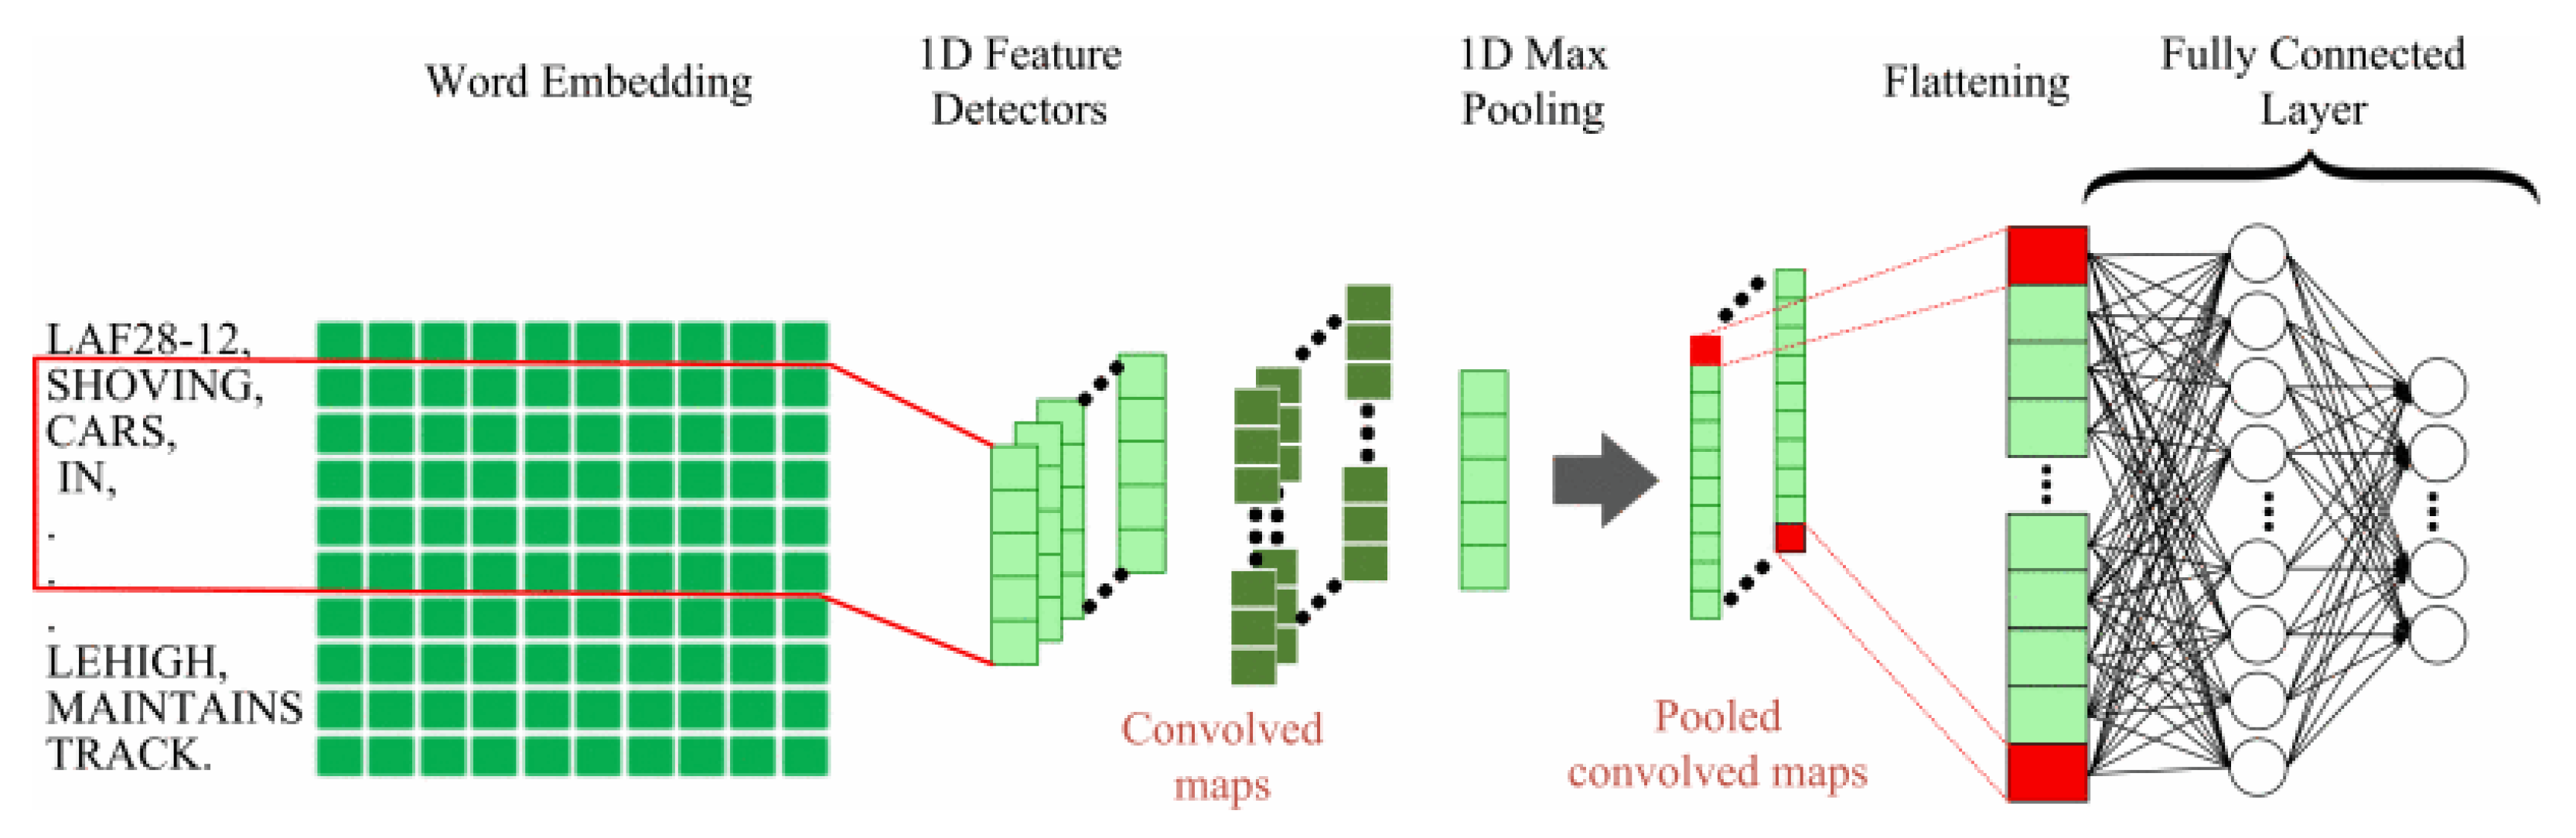
| [89] | Operation | Managing Accident Reports | Accident Narrative | Accident Narrative Documents | Federal Railroad Administration (FRA) reports | None (Pre-trained Model) | 40,164 | CNN, LSTM, GRU | 0.57–0.65 (F1-score) |
| [10] | Station | Accident Prevention | Fall, Slip, Trip | Video | Custom & Le2i Dataset | 10,459 | 1307 | CNN | 0.72–0.82 (Accuracy) |
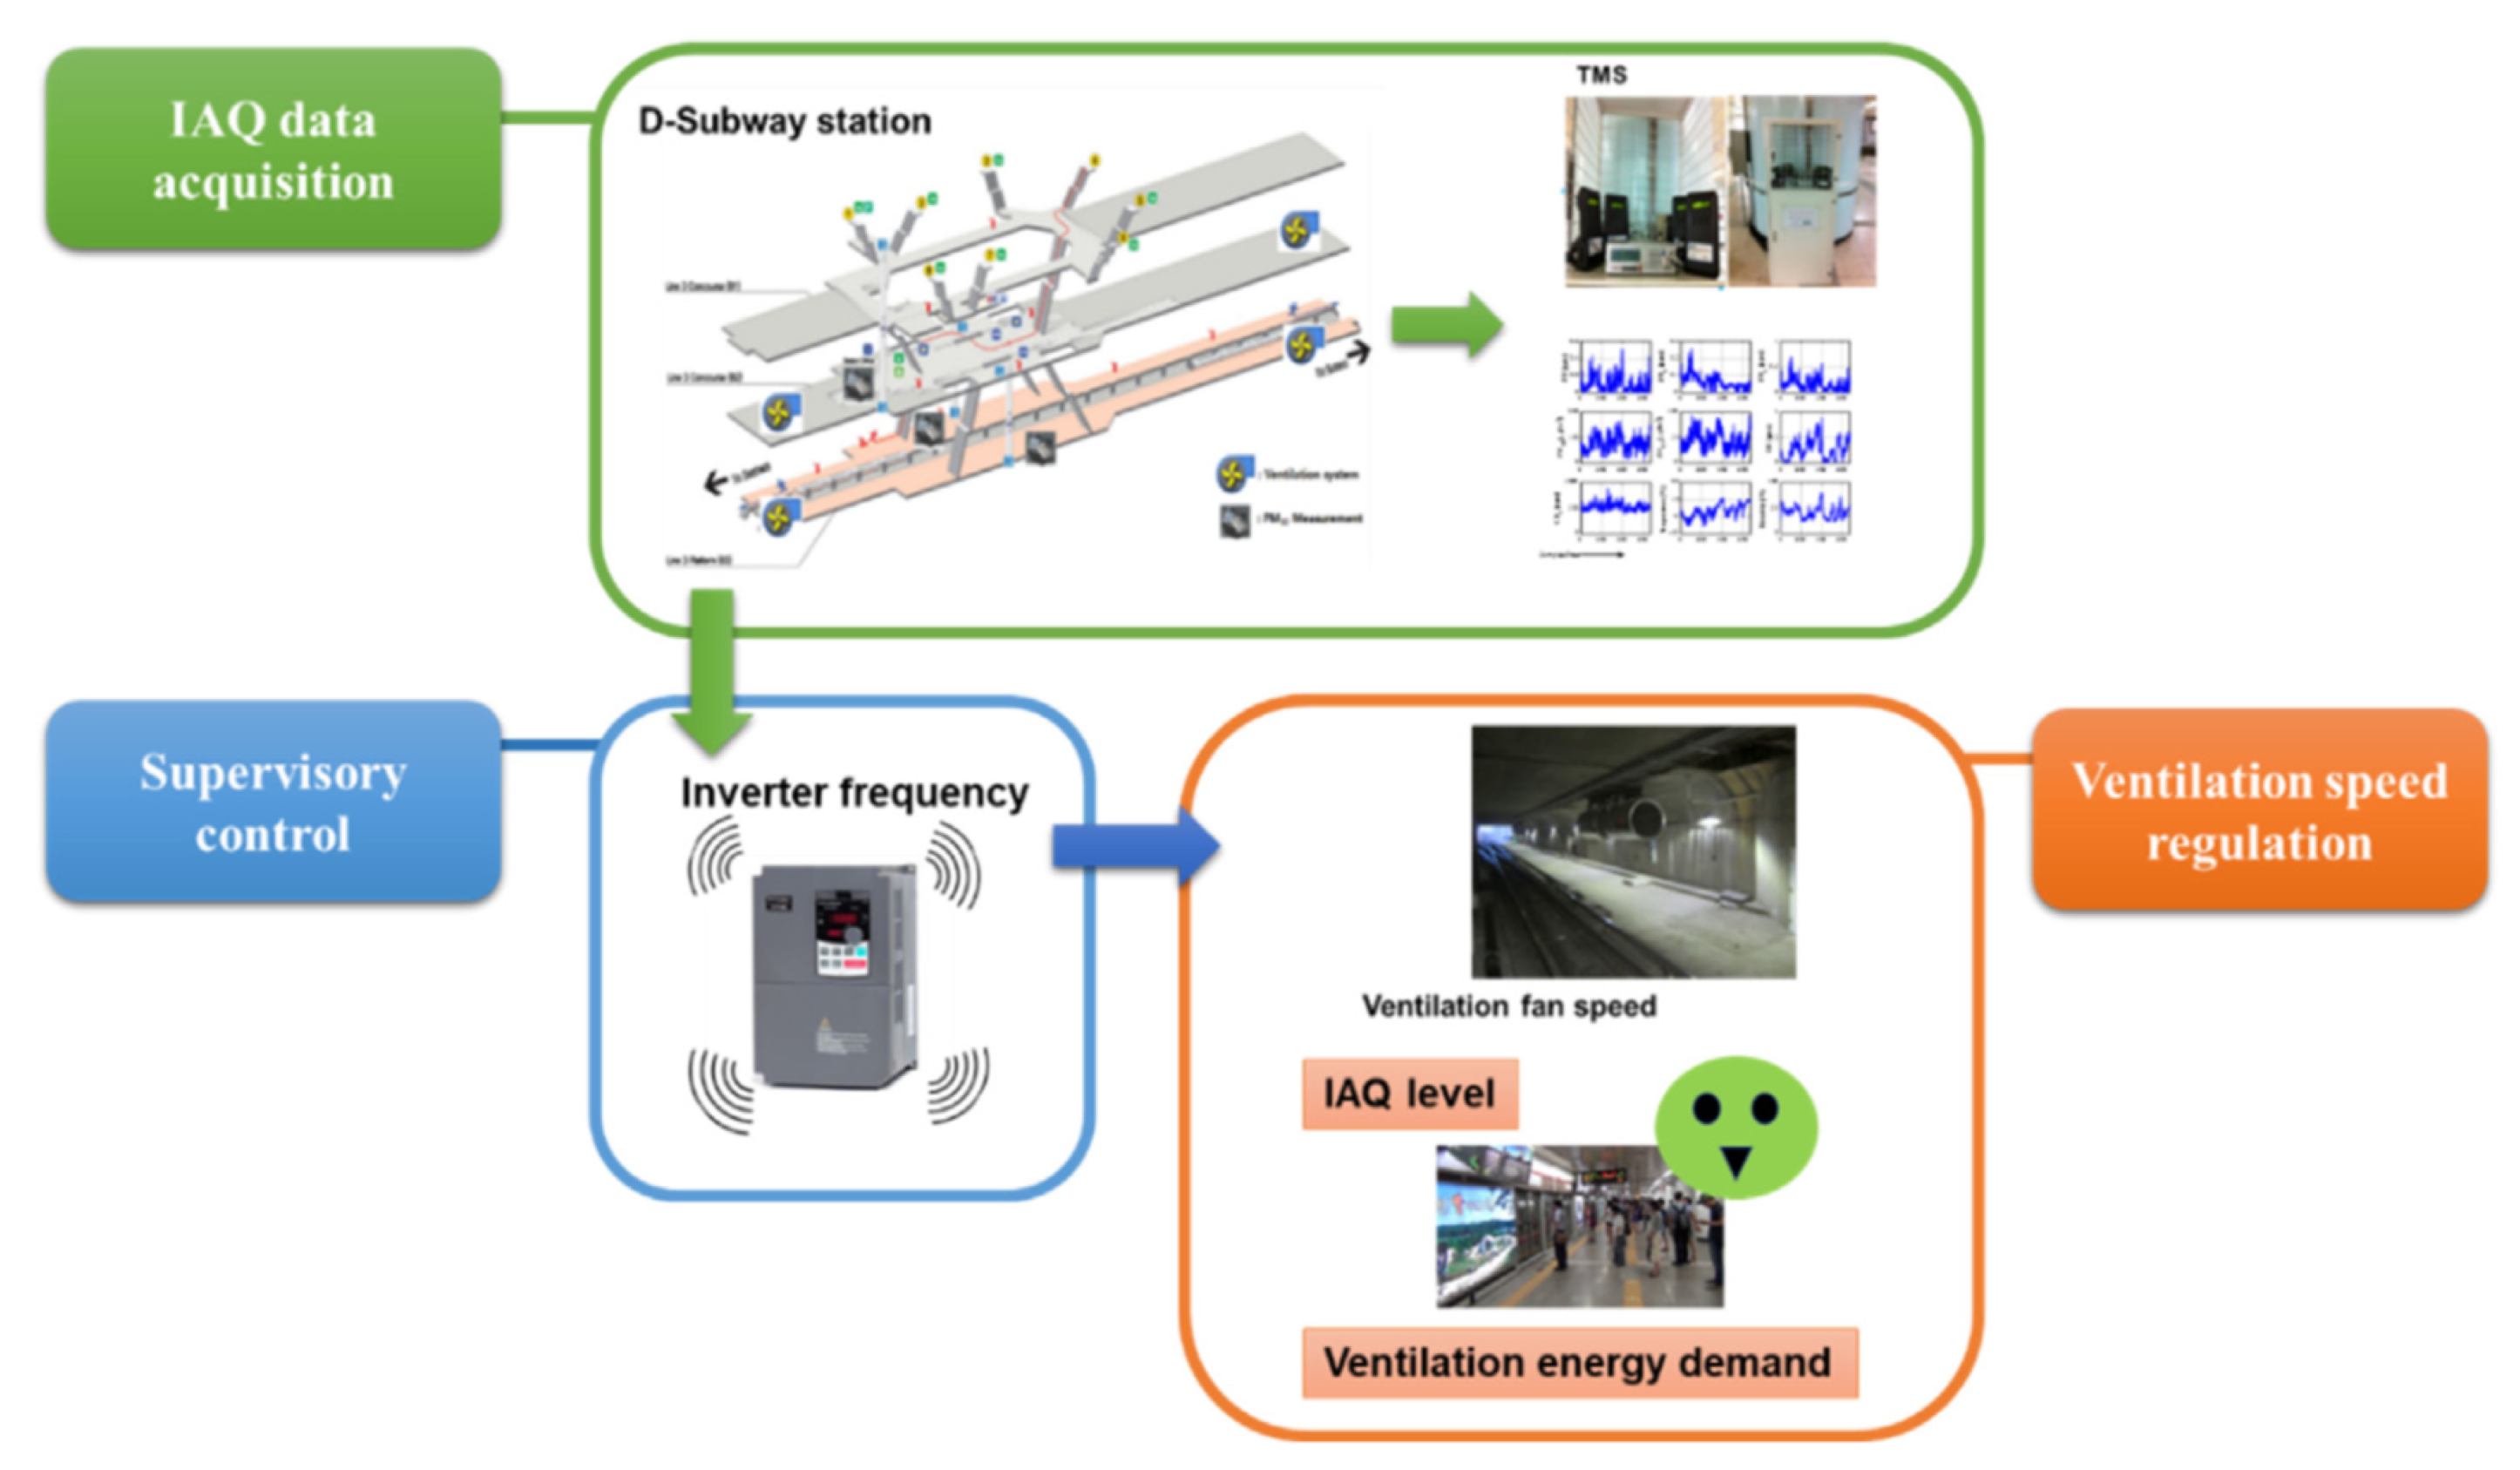
| [90] | Station | Air Quality Control | Air Quality | NO, NO2, NOx, PM10, PM2.5, CO, and CO2, Temperature, and Humidity | Custom | 504 | 168 | MG-RNN (Memory-Gated RNN), AE | 1.74–15.01 (RMSE) |
| [91] | Station | Simulation and Scheduling | Dynamic System | Train Operation Record | Custom | 171,990 | 57,330 | 3D-CNN, LSTM | 0.63–0.87 (RMSE), 0.44–0.51 (MAE) |
| [92] | Station | Simulation and Scheduling | Transportation Flow | Card Records | Custom (Chongqing City Transportation Development & Investment Group) | 4,800,000 | 1,200,000 | LSTM | 5.72 (RMSE), 4.41 (MAE) |
| [93] | Station | Simulation and Scheduling | Delay | Train Operation Record | China Railway Passenger Ticket System | Unknown | Unknown | Attention, CNN | 0.16 (MAE), 0.45 (RMSE) |
| Category | Name | Formula | Description |
|---|---|---|---|
| Classification | Accuracy | Fraction of the total samples that were correctly classified | |
| Recall | Fraction of the number of true positives () over the number of true positives plus the number of false negatives () | ||
| Precision | Fraction of the number of true positives () over the number of true positives plus the number of false positives () | ||
| mAP (mean Average Precision) | Average Precision (): Area under the precision-recall curve above mean Average Precision (): Mean of all the | ||
| F1-score | Harmonic mean of and | ||
| AUROC (Area under ROC) | The entire two-dimensional area underneath the ROC curve from (0,0) to (1,1) | ||
| Silhouette score | : Mean distance between the observation and all other data points in the same cluster : Mean distance between the observation and all other data points of the next nearest cluster | ||
| Regression | Adjusted | Percentage of variance in the target field that is explained by the input. = Sample R-squared N = Total Sample Size p = Number of independent variable | |
| RMSE (Root Mean Squared Error) | : Difference between the predicted and observed values in model : Square root of the | ||
| MAE (Mean Absolute Error) | Mean of absolute difference between model prediction and target value | ||
| Segmentation | mIoU (mean Intersection over Union) | Average between the (Intersection over Union) of the segmented objects over all the images of the test dataset | |
| mPA (mean Pixel Accuracy) | : Total number of pixels both classified and labeled as class j : Total number of pixels labeled as class j |
References
- Nilsson, N.J.; Nilsson, N.J. Artificial Intelligence: A New Synthesis; Morgan Kaufmann: San Francisco, CA, USA, 1998. [Google Scholar]
- McCarthy, J. What Is Artificial Intelligence. 2004. Available online: http://www-formal.stanford.edu/jmc/whatisai.html (accessed on 29 September 2022).
- Boden, M. Artificial intelligence and natural man. Synthese 1980, 43, 433–451. [Google Scholar]
- Akhila, C.; Diamond, C.A.; Posonia, A.M. Convolutional Neural network based Online Rail surface Crack Detection. In Proceedings of the 2021 5th International Conference on Intelligent Computing and Control Systems (ICICCS), Madurai, India, 6–8 May 2021; pp. 1602–1606. [Google Scholar]
- Kim, H.; Lee, S.; Han, S. Railroad Surface Defect Segmentation Using a Modified Fully Convolutional Network. KSII Trans. Internet Inf. Syst. TIIS 2020, 14, 4763–4775. [Google Scholar]
- Tsunashima, H. Condition monitoring of railway tracks from car-body vibration using a machine learning technique. Appl. Sci. 2019, 9, 2734. [Google Scholar] [CrossRef] [Green Version]
- Yang, C.; Sun, Y.; Ladubec, C.; Liu, Y. Developing machine learning-based models for railway inspection. Appl. Sci. 2020, 11, 13. [Google Scholar] [CrossRef]
- Jiang, Y.; Wang, H.; Tian, G.; Yi, Q.; Zhao, J.; Zhen, K. Fast classification for rail defect depths using a hybrid intelligent method. Optik 2019, 180, 455–468. [Google Scholar] [CrossRef]
- Suwansin, W.; Phasukkit, P. Deep learning-based acoustic emission scheme for nondestructive localization of cracks in train rails under a load. Sensors 2021, 21, 272. [Google Scholar] [CrossRef]
- Alawad, H.; Kaewunruen, S.; An, M. A deep learning approach towards railway safety risk assessment. IEEE Access 2020, 8, 102811–102832. [Google Scholar] [CrossRef]
- Tang, R.; De Donato, L.; Besinović, N.; Flammini, F.; Goverde, R.M.; Lin, Z.; Liu, R.; Tang, T.; Vittorini, V.; Wang, Z. A literature review of Artificial Intelligence applications in railway systems. Transp. Res. Part C Emerg. Technol. 2022, 140, 103679. [Google Scholar] [CrossRef]
- Liu, S.; Wang, Q.; Luo, Y. A review of applications of visual inspection technology based on image processing in the railway industry. Transp. Saf. Environ. 2019, 1, 185–204. [Google Scholar] [CrossRef] [Green Version]
- Ghofrani, F.; He, Q.; Goverde, R.M.; Liu, X. Recent applications of big data analytics in railway transportation systems: A survey. Transp. Res. Part C Emerg. Technol. 2018, 90, 226–246. [Google Scholar] [CrossRef]
- Hu, W.; Wang, W.; Ai, C.; Wang, J.; Wang, W.; Meng, X.; Liu, J.; Tao, H.; Qiu, S. Machine vision-based surface crack analysis for transportation infrastructure. Autom. Constr. 2021, 132, 103973. [Google Scholar] [CrossRef]
- Sedghi, M.; Kauppila, O.; Bergquist, B.; Vanhatalo, E.; Kulahci, M. A taxonomy of railway track maintenance planning and scheduling: A review and research trends. Reliab. Eng. Syst. Saf. 2021, 215, 107827. [Google Scholar] [CrossRef]
- Yin, M.; Li, K.; Cheng, X. A review on artificial intelligence in high-speed rail. Transp. Saf. Environ. 2020, 2, 247–259. [Google Scholar] [CrossRef]
- Wen, C.; Huang, P.; Li, Z.; Lessan, J.; Fu, L.; Jiang, C.; Xu, X. Train dispatching management with data-driven approaches: A comprehensive review and appraisal. IEEE Access 2019, 7, 114547–114571. [Google Scholar] [CrossRef]
- Chenariyan Nakhaee, M.; Hiemstra, D.; Stoelinga, M.; Noort, M.v. The recent applications of machine learning in rail track maintenance: A survey. In Proceedings of the International Conference on Reliability, Safety, and Security of Railway Systems, Lille, France, 4–6 June 2019; Springer: Berlin/Heidelberg, Germany, 2019; pp. 91–105. [Google Scholar]
- Simonyan, K.; Zisserman, A. Very deep convolutional networks for large-scale image recognition. arXiv 2014, arXiv:1409.1556. [Google Scholar]
- He, K.; Zhang, X.; Ren, S.; Sun, J. Deep residual learning for image recognition. In Proceedings of the IEEE Conference on Computer Vision and Pattern Recognition, Las Vegas, NV, USA, 26 June–1 July 2016; pp. 770–778. [Google Scholar]
- Huang, G.; Liu, Z.; Van Der Maaten, L.; Weinberger, K.Q. Densely connected convolutional networks. In Proceedings of the IEEE Conference on Computer Vision and Pattern Recognition, Honolulu, HI, USA, 21–26 July 2017; pp. 4700–4708. [Google Scholar]
- Gao, S.H.; Cheng, M.M.; Zhao, K.; Zhang, X.Y.; Yang, M.H.; Torr, P. Res2net: A new multi-scale backbone architecture. IEEE Trans. Pattern Anal. Mach. Intell. 2019, 43, 652–662. [Google Scholar] [CrossRef] [Green Version]
- Szegedy, C.; Liu, W.; Jia, Y.; Sermanet, P.; Reed, S.; Anguelov, D.; Erhan, D.; Vanhoucke, V.; Rabinovich, A. Going deeper with convolutions. In Proceedings of the IEEE Conference on Computer Vision and Pattern Recognition, Boston, MA, USA, 7–12 June 2015; pp. 1–9. [Google Scholar]
- Ren, S.; He, K.; Girshick, R.; Sun, J. Faster R-CNN: Towards real-time object detection with region proposal networks. In Proceedings of the 28th International Conference on Neural Information Processing Systems, Montreal, QC, Canada, 7–12 December 2015; pp. 91–99. [Google Scholar]
- Redmon, J.; Divvala, S.; Girshick, R.; Farhadi, A. You only look once: Unified, real-time object detection. In Proceedings of the IEEE Conference on Computer Vision and Pattern Recognition, Las Vegas, NV, USA, 26 June–1 July 2016; pp. 779–788. [Google Scholar]
- Liu, W.; Anguelov, D.; Erhan, D.; Szegedy, C.; Reed, S.; Fu, C.Y.; Berg, A.C. Ssd: Single shot multibox detector. In Proceedings of the European Conference on Computer Vision, Amsterdam, The Netherlands, 11–14 October 2016; Springer: Berlin/Heidelberg, Germany, 2016; pp. 21–37. [Google Scholar]
- Lin, T.Y.; Goyal, P.; Girshick, R.; He, K.; Dollár, P. Focal loss for dense object detection. In Proceedings of the IEEE International Conference on Computer Vision, Venice, Italy, 22–29 October 2017; pp. 2980–2988. [Google Scholar]
- Bolya, D.; Zhou, C.; Xiao, F.; Lee, Y.J. Yolact: Real-time instance segmentation. In Proceedings of the IEEE/CVF International Conference on Computer Vision, Seoul, Korea, 27 October–2 November 2019; pp. 9157–9166. [Google Scholar]
- Mika, S.; Ratsch, G.; Weston, J.; Scholkopf, B.; Mullers, K.R. Fisher discriminant analysis with kernels. In Proceedings of the Neural Networks for Signal Processing IX: 1999 IEEE Signal Processing Society Workshop (cat. no. 98th8468), Madison, WI, USA, 25 August 1999; pp. 41–48. [Google Scholar]
- Hardoon, D.R.; Szedmak, S.; Shawe-Taylor, J. Canonical correlation analysis: An overview with application to learning methods. Neural Comput. 2004, 16, 2639–2664. [Google Scholar] [CrossRef] [Green Version]
- Golub, G.H.; Van Loan, C.F. Matrix Computations; JHU Press: Baltimore, MD, USA, 2013. [Google Scholar]
- Tenenbaum, J.B.; Silva, V.d.; Langford, J.C. A global geometric framework for nonlinear dimensionality reduction. Science 2000, 290, 2319–2323. [Google Scholar] [CrossRef]
- Roweis, S.T.; Saul, L.K. Nonlinear dimensionality reduction by locally linear embedding. Science 2000, 290, 2323–2326. [Google Scholar] [CrossRef] [Green Version]
- Kramer, M.A. Nonlinear principal component analysis using autoassociative neural networks. AIChE J. 1991, 37, 233–243. [Google Scholar] [CrossRef]
- Fischer, A.; Igel, C. Training restricted Boltzmann machines: An introduction. Pattern Recognit. 2014, 47, 25–39. [Google Scholar] [CrossRef]
- Hinton, G.E. Deep belief networks. Scholarpedia 2009, 4, 5947. [Google Scholar] [CrossRef]
- Kang, G.; Gao, S.; Yu, L.; Zhang, D. Deep architecture for high-speed railway insulator surface defect detection: Denoising autoencoder with multitask learning. IEEE Trans. Instrum. Meas. 2018, 68, 2679–2690. [Google Scholar] [CrossRef]
- Guo, Q.; Liu, L.; Xu, W.; Gong, Y.; Zhang, X.; Jing, W. An improved faster R-CNN for high-speed railway dropper detection. IEEE Access 2020, 8, 105622–105633. [Google Scholar] [CrossRef]
- Han, Y.; Liu, Z.; Lyu, Y.; Liu, K.; Li, C.; Zhang, W. Deep learning-based visual ensemble method for high-speed railway catenary clevis fracture detection. Neurocomputing 2020, 396, 556–568. [Google Scholar] [CrossRef]
- Wang, J.; Luo, L.; Ye, W.; Zhu, S. A defect-detection method of split pins in the catenary fastening devices of high-speed railway based on deep learning. IEEE Trans. Instrum. Meas. 2020, 69, 9517–9525. [Google Scholar] [CrossRef]
- Roy Choudhury, A.; Vanguri, R.; Jambawalikar, S.R.; Kumar, P. Segmentation of brain tumors using DeepLabv3+. In Proceedings of the International MICCAI Brainlesion Workshop, Granada, Spain, 16 September 2018; Springer: Berlin/Heidelberg, Germany, 2018; pp. 154–167. [Google Scholar]
- Kurth, T.; Treichler, S.; Romero, J.; Mudigonda, M.; Luehr, N.; Phillips, E.; Mahesh, A.; Matheson, M.; Deslippe, J.; Fatica, M.; et al. Exascale deep learning for climate analytics. In Proceedings of the SC18: International Conference for High Performance Computing, Networking, Storage and Analysis, Dallas, TX, USA, 11–16 November 2018; pp. 649–660. [Google Scholar]
- Chen, L.C.; Zhu, Y.; Papandreou, G.; Schroff, F.; Adam, H. Encoder-decoder with atrous separable convolution for semantic image segmentation. In Proceedings of the European conference on computer vision (ECCV), Munich, Germany, 8–14 September 2018; pp. 801–818. [Google Scholar]
- Chen, Y.; Song, B.; Zeng, Y.; Du, X.; Guizani, M. Fault diagnosis based on deep learning for current-carrying ring of catenary system in sustainable railway transportation. Appl. Soft Comput. 2021, 100, 106907. [Google Scholar] [CrossRef]
- Santur, Y.; Karaköse, M.; Akin, E. Random forest based diagnosis approach for rail fault inspection in railways. In Proceedings of the 2016 National Conference on Electrical, Electronics and Biomedical Engineering (ELECO), Bursa, Turkey, 1–3 December 2016; pp. 745–750. [Google Scholar]
- Faghih-Roohi, S.; Hajizadeh, S.; Núñez, A.; Babuska, R.; De Schutter, B. Deep convolutional neural networks for detection of rail surface defects. In Proceedings of the 2016 International Joint Conference on Neural Networks (IJCNN), Vancouver, BC, Canada, 24–29 July 2016; pp. 2584–2589. [Google Scholar]
- Yanan, S.; Hui, Z.; Li, L.; Hang, Z. Rail surface defect detection method based on YOLOv3 deep learning networks. In Proceedings of the 2018 Chinese Automation Congress (CAC), Xi’an, China, 30 November–2 December 2018; pp. 1563–1568. [Google Scholar]
- Yuan, H.; Chen, H.; Liu, S.; Lin, J.; Luo, X. A deep convolutional neural network for detection of rail surface defect. In Proceedings of the 2019 IEEE Vehicle Power and Propulsion Conference (VPPC), Hanoi, Vietnam, 14–17 October 2019; pp. 1–4. [Google Scholar]
- Shang, L.; Yang, Q.; Wang, J.; Li, S.; Lei, W. Detection of rail surface defects based on CNN image recognition and classification. In Proceedings of the 2018 20th International Conference on Advanced Communication Technology (ICACT), Chuncheon, Korea, 11–14 February 2018; pp. 45–51. [Google Scholar]
- Liang, Z.; Zhang, H.; Liu, L.; He, Z.; Zheng, K. Defect detection of rail surface with deep convolutional neural networks. In Proceedings of the 2018 13th World Congress on Intelligent Control and Automation (WCICA), Changsha, China, 4–8 July 2018; pp. 1317–1322. [Google Scholar]
- Yuan, Z.; Zhu, S.; Chang, C.; Yuan, X.; Zhang, Q.; Zhai, W. An unsupervised method based on convolutional variational auto-encoder and anomaly detection algorithms for light rail squat localization. Constr. Build. Mater. 2021, 313, 125563. [Google Scholar] [CrossRef]
- Shebani, A.; Iwnicki, S. Prediction of wheel and rail wear under different contact conditions using artificial neural networks. Wear 2018, 406, 173–184. [Google Scholar] [CrossRef] [Green Version]
- Wu, Y.; Qin, Y.; Qian, Y.; Guo, F.; Wang, Z.; Jia, L. Hybrid deep learning architecture for rail surface segmentation and surface defect detection. Comput.-Aided Civ. Infrastruct. Eng. 2022, 37, 227–244. [Google Scholar] [CrossRef]
- Zhang, D.; Song, K.; Wang, Q.; He, Y.; Wen, X.; Yan, Y. Two deep learning networks for rail surface defect inspection of limited samples with line-level label. IEEE Trans. Ind. Inform. 2020, 17, 6731–6741. [Google Scholar] [CrossRef]
- Hajizadeh, S.; Núnez, A.; Tax, D.M. Semi-supervised rail defect detection from imbalanced image data. IFAC-PapersOnLine 2016, 49, 78–83. [Google Scholar] [CrossRef]
- Santur, Y.; Karaköse, M.; Akin, E. A new rail inspection method based on deep learning using laser cameras. In Proceedings of the 2017 International Artificial Intelligence and Data Processing Symposium (IDAP), Malatya, Turkey, 16–17 September 2017; pp. 1–6. [Google Scholar]
- Falamarzi, A.; Moridpour, S.; Nazem, M. Development of a tram track degradation prediction model based on the acceleration data. Struct. Infrastruct. Eng. 2019, 15, 1308–1318. [Google Scholar] [CrossRef]
- Guo, F.; Qian, Y.; Wu, Y.; Leng, Z.; Yu, H. Automatic railroad track components inspection using real-time instance segmentation. Comput.-Aided Civ. Infrastruct. Eng. 2021, 36, 362–377. [Google Scholar] [CrossRef]
- Gibert, X.; Patel, V.M.; Chellappa, R. Deep multitask learning for railway track inspection. IEEE Trans. Intell. Transp. Syst. 2016, 18, 153–164. [Google Scholar] [CrossRef] [Green Version]
- Sresakoolchai, J.; Kaewunruen, S. Detection and severity evaluation of combined rail defects using deep learning. Vibration 2021, 4, 341–356. [Google Scholar] [CrossRef]
- Sun, Y.; Liu, Y.; Yang, C. Railway joint detection using deep convolutional neural networks. In Proceedings of the 2019 IEEE 15th International Conference on Automation Science and Engineering (CASE), Vancouver, BC, Canada, 22–26 August 2019; pp. 235–240. [Google Scholar]
- Chandran, P.; Thierry, F.; Odelius, J.; Famurewa, S.M.; Lind, H.; Rantatalo, M. Supervised Machine Learning Approach for Detecting Missing Clamps in Rail Fastening System from Differential Eddy Current Measurements. Appl. Sci. 2021, 11, 4018. [Google Scholar] [CrossRef]
- Soares, N.; de Aguiar, E.P.; Souza, A.C.; Goliatt, L. Unsupervised machine learning techniques to prevent faults in railroad switch machines. Int. J. Crit. Infrastruct. Prot. 2021, 33, 100423. [Google Scholar] [CrossRef]
- Guo, G.; Cui, X.; Du, B. Random–Forest Machine Learning Approach for High–Speed Railway Track Slab Deformation Identification Using Track-Side Vibration Monitoring. Appl. Sci. 2021, 11, 4756. [Google Scholar] [CrossRef]
- Ma, S.; Gao, L.; Liu, X.; Lin, J. Deep learning for track quality evaluation of high-speed railway based on vehicle-body vibration prediction. IEEE Access 2019, 7, 185099–185107. [Google Scholar] [CrossRef]
- Hao, X.; Yang, J.; Yang, F.; Sun, X.; Hou, Y.; Wang, J. Track geometry estimation from vehicle–body acceleration for high-speed railway using deep learning technique. Veh. Syst. Dyn. 2022, 1–21. [Google Scholar] [CrossRef]
- Ham, S.; Han, S.Y.; Kim, S.; Park, H.J.; Park, K.J.; Choi, J.H. A comparative study of fault diagnosis for train door system: Traditional versus deep learning approaches. Sensors 2019, 19, 5160. [Google Scholar] [CrossRef] [PubMed] [Green Version]
- Krummenacher, G.; Ong, C.S.; Koller, S.; Kobayashi, S.; Buhmann, J.M. Wheel defect detection with machine learning. IEEE Trans. Intell. Transp. Syst. 2017, 19, 1176–1187. [Google Scholar] [CrossRef]
- Shi, D.; Šabanovič, E.; Rizzetto, L.; Skrickij, V.; Oliverio, R.; Kaviani, N.; Ye, Y.; Bureika, G.; Ricci, S.; Hecht, M. Deep learning based virtual point tracking for real-time target-less dynamic displacement measurement in railway applications. Mech. Syst. Signal Process. 2022, 166, 108482. [Google Scholar] [CrossRef]
- Wu, Y.; Jin, W.; Li, Y.; Sun, Z.; Ren, J. Detecting Unexpected Faults of High-Speed Train Bogie Based on Bayesian Deep Learning. IEEE Trans. Veh. Technol. 2020, 70, 158–172. [Google Scholar] [CrossRef]
- Xie, J.; Li, T.; Yang, Y.; Jin, W. Learning features from high speed train vibration signals with deep belief networks. In Proceedings of the 2014 International Joint Conference on Neural Networks (IJCNN), Beijing, China, 6–11 July 2014; pp. 2205–2210. [Google Scholar]
- Xu, G.; Liu, M.; Jiang, Z.; Söffker, D.; Shen, W. Bearing fault diagnosis method based on deep convolutional neural network and random forest ensemble learning. Sensors 2019, 19, 1088. [Google Scholar] [CrossRef] [Green Version]
- He, M.; He, D. Deep learning based approach for bearing fault diagnosis. IEEE Trans. Ind. Appl. 2017, 53, 3057–3065. [Google Scholar] [CrossRef]
- Zou, Y.; Zhang, Y.; Mao, H. Fault diagnosis on the bearing of traction motor in high-speed trains based on deep learning. Alex. Eng. J. 2021, 60, 1209–1219. [Google Scholar] [CrossRef]
- Zhan, Y.; Linb, K.; Zhan, H.; Guo, Y.; Sun, G. A unified framework for fault detection of freight train images under complex environment. In Proceedings of the 2018 25th IEEE International Conference on Image Processing (ICIP), Athens, Greece, 7–10 October 2018; pp. 1348–1352. [Google Scholar]
- Sun, J.; Xiao, Z.; Xie, Y. Automatic multi-fault recognition in TFDS based on convolutional neural network. Neurocomputing 2017, 222, 127–136. [Google Scholar] [CrossRef]
- Xiao, L.; Wu, B.; Hu, Y.; Liu, J. A hierarchical features-based model for freight train defect inspection. IEEE Sens. J. 2019, 20, 2671–2678. [Google Scholar] [CrossRef]
- Ye, T.; Zhang, Z.; Zhang, X.; Chen, Y.; Zhou, F. Fault detection of railway freight cars mechanical components based on multi-feature fusion convolutional neural network. Int. J. Mach. Learn. Cybern. 2021, 12, 1789–1801. [Google Scholar] [CrossRef]
- Zaman, A.; Ren, B.; Liu, X. Artificial intelligence-aided automated detection of railroad trespassing. Transp. Res. Rec. 2019, 2673, 25–37. [Google Scholar] [CrossRef]
- Gao, H.; Huang, Y.; Li, H.; Zhang, Q. Multi-Sensor Fusion Perception System in Train. In Proceedings of the 2021 IEEE 10th Data Driven Control and Learning Systems Conference (DDCLS), Suzhou, China, 14–16 May 2021; pp. 1171–1176. [Google Scholar]
- Wang, Z.; Wu, X.; Yu, G.; Li, M. Efficient rail area detection using convolutional neural network. IEEE Access 2018, 6, 77656–77664. [Google Scholar] [CrossRef]
- Wang, Y.; Wang, L.; Hu, Y.H.; Qiu, J. RailNet: A segmentation network for railroad detection. IEEE Access 2019, 7, 143772–143779. [Google Scholar] [CrossRef]
- Liu, H.; Liu, C.; He, S.; Chen, J. Short-Term Strong Wind Risk Prediction for High-Speed Railway. IEEE Trans. Intell. Transp. Syst. 2021, 22, 4243–4255. [Google Scholar] [CrossRef]
- Arvidsson, T.; Andersson, A.; Karoumi, R. Train running safety on non-ballasted bridges. Int. J. Rail Transp. 2019, 7, 1–22. [Google Scholar] [CrossRef] [Green Version]
- Ding, Y.L.; Sun, P.; Wang, G.X.; Song, Y.S.; Wu, L.Y.; Yue, Q.; Li, A.Q. Early-warning method of train running safety of a high-speed railway bridge based on transverse vibration monitoring. Shock Vib. 2015, 2015, 518689. [Google Scholar] [CrossRef] [Green Version]
- Choi, J.Y.; Kim, J.H.; Chung, J.S.; Lee, S.G. Evaluation of Train Running Safety for Direct Fixation Concrete Track on Light Rapid Transit. J. Korean Soc. Saf. 2017, 32, 41–46. [Google Scholar]
- Jang, S.Y.; Yang, S.C. Assessment of train running safety, ride comfort and track serviceability at transition between floating slab track and conventional concrete track. J. Korean Soc. Railw. 2012, 15, 48–61. [Google Scholar] [CrossRef] [Green Version]
- Lee, H.; Han, S.Y.; Park, K.; Lee, H.; Kwon, T. Real-Time Hybrid Deep Learning-Based Train Running Safety Prediction Framework of Railway Vehicle. Machines 2021, 9, 130. [Google Scholar] [CrossRef]
- Heidarysafa, M.; Kowsari, K.; Barnes, L.; Brown, D. Analysis of railway accidents’ narratives using deep learning. In Proceedings of the 2018 17th IEEE International Conference on Machine Learning and Applications (ICMLA), Orlando, FL, USA, 17–20 December 2018; pp. 1446–1453. [Google Scholar]
- Loy-Benitez, J.; Heo, S.; Yoo, C. Soft sensor validation for monitoring and resilient control of sequential subway indoor air quality through memory-gated recurrent neural networks-based autoencoders. Control Eng. Pract. 2020, 97, 104330. [Google Scholar] [CrossRef]
- Huang, P.; Wen, C.; Fu, L.; Peng, Q.; Tang, Y. A deep learning approach for multi-attribute data: A study of train delay prediction in railway systems. Inf. Sci. 2020, 516, 234–253. [Google Scholar] [CrossRef]
- Tang, Q.; Yang, M.; Yang, Y. ST-LSTM: A deep learning approach combined spatio-temporal features for short-term forecast in rail transit. J. Adv. Transp. 2019, 2019, 8392592. [Google Scholar] [CrossRef] [Green Version]
- Zhang, D.; Peng, Y.; Zhang, Y.; Wu, D.; Wang, H.; Zhang, H. Train Time Delay Prediction for High-Speed Train Dispatching Based on Spatio-Temporal Graph Convolutional Network. IEEE Trans. Intell. Transp. Syst. 2021, 23, 2434–2444. [Google Scholar] [CrossRef]
- Wolf, J.; Richter, R.; Döllner, J. Asset Detection in Railroad Environments using Deep Learning-based Scanline Analysis. In Proceedings of the VISAPP 2021: 16th International Conference on Computer Vision Theory and Applications, Virtual, 8–10 February 2021; pp. 465–470. [Google Scholar]


| Papers | Application Areas | Data Types | |||||
|---|---|---|---|---|---|---|---|
| Ref | Year | Railway Infra | Train | Operation | Station | Image | Others |
| Tang et al. [11] | 2022 | ◯ | △ | △ | △ | ◯ | ◯ |
| Liu et al. [12] | 2019 | ◯ | ◯ | △ | △ | ◯ | ✕ |
| Ghofrani et al. [13] | 2018 | △ | △ | △ | ✕ | ◯ | ◯ |
| Hu et al. [14] | 2021 | △ | ✕ | ✕ | ✕ | ◯ | ✕ |
| Sedghi et al. [15] | 2021 | △ | △ | △ | △ | ✕ | △ |
| Yin et al. [16] | 2020 | △ | ✕ | ✕ | △ | ◯ | △ |
| Wen et al. [17] | 2019 | ✕ | ✕ | ✕ | △ | ◯ | ◯ |
| Chenariyan et al. [18] | 2019 | △ | ✕ | ✕ | ✕ | ◯ | △ |
| This study | 2022 | ◯ | ◯ | ◯ | ◯ | ◯ | ◯ |
Publisher’s Note: MDPI stays neutral with regard to jurisdictional claims in published maps and institutional affiliations. |
© 2022 by the authors. Licensee MDPI, Basel, Switzerland. This article is an open access article distributed under the terms and conditions of the Creative Commons Attribution (CC BY) license (https://creativecommons.org/licenses/by/4.0/).
Share and Cite
Oh, K.; Yoo, M.; Jin, N.; Ko, J.; Seo, J.; Joo, H.; Ko, M. A Review of Deep Learning Applications for Railway Safety. Appl. Sci. 2022, 12, 10572. https://doi.org/10.3390/app122010572
Oh K, Yoo M, Jin N, Ko J, Seo J, Joo H, Ko M. A Review of Deep Learning Applications for Railway Safety. Applied Sciences. 2022; 12(20):10572. https://doi.org/10.3390/app122010572
Chicago/Turabian StyleOh, Kyuetaek, Mintaek Yoo, Nayoung Jin, Jisu Ko, Jeonguk Seo, Hyojin Joo, and Minsam Ko. 2022. "A Review of Deep Learning Applications for Railway Safety" Applied Sciences 12, no. 20: 10572. https://doi.org/10.3390/app122010572