Article

Bridge Node Detection between Communities Based on GNN

School of Cyber Science and Engineering, Sichuan University, Chengdu 610065, China
*
Author to whom correspondence should be addressed.
Appl. Sci. 2022, 12(20), 10337; https://doi.org/10.3390/app122010337
Submission received: 14 August 2022 / Revised: 30 September 2022 / Accepted: 9 October 2022 / Published: 13 October 2022
(This article belongs to the Special Issue Artificial Intelligence in Complex Networks)

Abstract

:
In a complex network, some nodes are relatively concentrated in topological structure, thus forming a relatively independent node group, which we call a community. Usually, there are multiple communities on a network, and these communities are interconnected and exchange information with each other. A node that plays an important role in the process of information exchange between communities is called an inter-community bridge node. Traditional methods of defining and detecting bridge nodes mostly quantify the bridging effect of nodes by collecting local structural information of nodes and defining index operations. However, on the one hand, it is often difficult to capture the deep topological information in complex networks based on a single indicator, resulting in inaccurate evaluation results; on the other hand, for networks without community structure, such methods may rely on community partitioning algorithms, which require significant computing power. In this paper, considering the multi-dimensional attributes and structural characteristics of nodes, a deep learning-based framework named BND is designed to quickly and accurately detect bridge nodes. Considering that the bridging function of nodes between communities is abstract and complex, and may be related to the multi-dimensional information of nodes, we construct an attribute graph on the basis of the original graph according to the features of the five dimensions of the node to meet our needs for extracting bridging-related attributes. In the deep learning model, we overlay graph neural network layers to process the input attribute graph and add fully connected layers to improve the final classification effect of the model. Graph neural network algorithms including GCN, GAT, and GraphSAGE are compatible with our proposed framework. To the best of our knowledge, our work is the first application of graph neural network techniques in the field of bridge node detection. Experiments show that our designed framework can effectively capture network topology information and accurately detect bridge nodes in the network. In the overall model effect evaluation results based on indicators such as Accuracy and F1 score, our proposed graph neural network model is generally better than baseline methods. In the best case, our model has an Accuracy of 0.9050 and an F1 score of 0.8728.

1. Introduction

At present, various complex network structures have been integrated into our life, such as transportation networks, computer networks, citation networks, and so on. Thus, emerging network science has become an important research field. In a complex network, there is a type of node that plays a key role in the information dissemination between local network structures, which is called a bridge or bridge node. In this paper, we use bridge node to refer to such a node. Due to their special topological position in the network, when these bridging nodes are activated, they can effectively promote the information flow between local structures in the network; on the contrary, when immune to them, they can effectively prevent the information flow between local structures. Accurately discovering bridge nodes in the network is an important research topic in network science, and its results have important application value in scenarios such as community immunization [1,2] and drug analysis [3].
So far, researchers have proposed many detection methods for bridge nodes, which are mainly divided into two categories: methods based on community structure and methods that do not consider community structure. The method based on community structure focuses on the detection of bridge nodes as important information transmission media between communities, which is more in line with the definition of “bridge”; the method of bridge node detection that does not depend on community structure focuses on the bridging role of nodes in the global network; this “bridging effect” is more similar to the definition of node “influence”. On the other hand, the method based on community structure is more suitable for some real-world application scenarios. Suppose a large computer cluster network is infected by a virus, and it is necessary to immunize the computers in key locations to prevent the further spread of the virus. If the location of the bridge nodes is determined based on the network community structure, the original network topology will be protected to the greatest extent from damage after the node computer is removed, and most functions of the network will be maintained normally. Therefore, in recent years, more and more bridge node-related work is based on the community structure.
As far as we know, the current community-based algorithms for detecting bridge nodes are based on the local structure information of nodes and perform index calculations to define the bridging role of nodes. The calculation of a single index means that such methods cannot comprehensively consider the multi-dimensional information of nodes to characterize the bridging effect of nodes, thus affecting the accuracy of evaluation results. In addition, community-based structures may rely on community detection algorithms, resulting in the consumption of additional computing resources.
This paper systematically studies bridge nodes in complex networks and proposes a deep learning-based method for detecting bridge nodes between communities. The paper contains the following three main contributions:
  • A deep learning-based framework named BND is proposed to detect bridge nodes, through which we can avoid expensive community detection algorithms;
  • On this basis, we applied graph learning technology and constructed a GNN model, BND-GCN, for bridge node detection on complex networks;
  • We test our model on sex real social networks and compare it with other baseline methods. Experiments show that BND-GCN performs well on bridge node detection tasks, and is generally better than the baselines.
The rest of this paper is organized as follows. In Section 2, we systematically introduce a series of related works on bridge node detection and graph representation learning. Section 3 details our proposed bridge node detection framework, BND. In Section 4, a method for constructing the training dataset is presented. In Section 5, extensive experiments are designed and conducted to verify the effectiveness of the framework. Finally, in Section 6, we summarize our research work.

2. Related Works

Our research is related to the following works.

2.1. Bridge Nodes Detection Methods

Regarding the definition of node bridging, there are many definitions given by researchers due to differences in network types and research ideas. Before conducting research on bridge nodes, it is necessary to establish a standard and universal definition. According to the research of Meghanathan [4], the existing approaches can be roughly divided into two categories: community-unaware approaches and community-aware approaches.

2.1.1. Community-Unaware Approach

The community-unaware approach does not rely on the community partition algorithm, but uses the local or global topology information of nodes to define the bridging of nodes. The research ideas are not limited to the definition and calculation of indicators [3,4,5,6], but also including random walk-based methods [7], heuristic algorithms [8], and so on. Since the general definition of bridging is more based on node neighborhood, network local information is used more in the decision method of bridge nodes.
Hwang et al. [3] first proposed bridging centrality in 2008 to evaluate drug targets. The definition of this indicator combines the calculation of random betweenness centrality and the bridging coefficient.
Through this similar idea of combining global and local indicators, Liu et al. [5] proposed a bridge node quantification indicator named BNC, which combines route-betweenness and the bridgeness-coefficient. For each node, its route-betweenness is the sum of routing weights through that node, and its bridgeness-coefficient is defined as the reciprocal of the sum of distances from that node to all its neighbors and indirect neighbors. Similarly, after the dispersion standardization of the above two indicators, the product is used as the final BNC score for the node.
The community bridge finder algorithm (CBF) proposed by Salathe et al. [7] is a random walk-based bridge node detection algorithm, which attempts to detect bridging nodes between communities without relying on the community structure of the network. The basic idea is that the first node that is not connected back to the current random walk that has already been visited is more likely to belong to a different community. The algorithm selects a random node at the beginning and then follows a random path until a node is found not connected to multiple previously visited nodes during the random walk; then, this node is identified as a potential community bridge. It then randomly selects two of its neighbor nodes, and if neither of them is connected to a previously visited node, then the community bridge is an effective bridge.
Meghanathan et al. [4] summarized the research results of bridge nodes in recent years in detail, and designed a neighbor-based bridge node centrality triplet NBNC to more comprehensively evaluate the bridging of nodes, which has the following form:
( N G i # c o m p , N G i A C R , | N G i | )
where N G i # c o m p is the number of components in the neighborhood graph N G i of node i, | N G i | is the number of nodes in N G i , and N G i A C R is the ratio of the algebraic connectivity of N G i and | N G i | . In this paper, the neighborhood graph of a node i is defined as a graph composed of its neighbor nodes and all edges connecting the neighbor nodes, and a component is defined as a subgraph composed of nodes and edges in the graph and is not connected to the outside world. Obviously, by describing the state of the neighborhood graph after removing nodes, N G i # c o m p intuitively defines the bridging role that nodes play in their neighborhoods. N G i A C R improves algebraic connectivity [9] and describes the bridging of nodes from another aspect. When using NBNC tuples to determine the bridging rank of nodes, the priority of each element is decreasing; that is, when the previous element cannot determine the bridging rank of two nodes, the next-level element index is used.
Although the community-unaware approach eliminates the limitation of the community, it can also be directly applied to the network without community structure, but due to the limitation of the available information, it can only mine the properties related to the bridging effect from the local or global topology information of the nodes. Additionally, the goal of this type of algorithm is to find influential nodes from the perspective of bridging, and we think it is inappropriate to define bridge nodes in the community-unaware way.

2.1.2. Community-Aware Approach

The community-aware approach focuses on detecting nodes that play a bridging role in the process of information exchange between communities, so it must be executed under the premise of divided communities. Due to the different partitioning algorithms, the community structure is further divided into overlapping communities and non-overlapping communities, so there are correspondingly two different types of detection algorithms.
Approach based on overlapping community
Overlapping communities means that there are some shared nodes between two different communities on the same network. This kind of situation is common in the real world (for example, a social network user participates in multiple groups at the same time), and some existing community partitioning algorithms are also able to reveal the existence of overlapping communities. Due to the special topological location of such shared nodes, some researchers started to define the bridging of nodes by using overlapping nodes in overlapping communities [1,2,10].
Nepusz et al. [10] proposed an extended overlapping community detection method and, based on this, they proposed a way to define node bridging. However, in some special cases, this indicator will identify nodes outside the community as bridge nodes. Therefore, the author proposes a method of correcting bridgeness with indicators such as degree centrality, which is called degree-corrected bridgeness.
For networks that have divided overlapping communities, Taghavian et al. [1] proposed a random walk-based sorting algorithm for bridge nodes to enforce network immunity strategies. First, extract overlapping nodes according to the community division results; then perform random walk RWOS from random nodes in the network and set the overlapping nodes visited in this process as immune targets until enough targets are collected.
On the basis of the above results, Kumar et al. [2] conducted another similar work and proposed the overlapping neighborhood-based immune strategy, overlap neighborhood. The basic idea of this strategy is that among the neighboring nodes of overlapping nodes, there is a high probability of nodes with high degree, and immunizing these nodes can effectively control the spread of epidemics. Based on this, the process of the algorithm is as follows. First, use the overlapping community division algorithm to find overlapping nodes; then, find the neighbor nodes of all overlapping node and arrange them in descending order of node degree; then, the immune priority sequence of the network can be obtained.
In general, the method of defining bridge nodes based on overlapping community is simpler and more intuitive, but it relies too much on overlapping community, so that such algorithms can only focus on the overlapping parts of the communities in the network and cannot measure the bridging effect of the vast majority of nodes, which cannot give enough target objects in tasks such as network immunity.
Approach based on non-overlapping community
This type of method is based on non-overlapping community division, focusing on two attributes of nodes, that is, the connection of nodes within the community and the outside world.
Gupta et al. [11] first proposed the Commn centrality index, which considers the in-degree and out-degree of a node in the community. In-degree and out-degree respectively represent the number of edges directly connected to the node in the community and out of the community. For the nodes in the community C, the calculation process of Commn centrality is as follows:
C C ( i ) = ( 1 + μ C ) ( k i i n m a x ( k j i n j C ) R ) + ( 1 μ C ) ( k i o u t m a x ( k j o u t j C ) R ) 2
where R is an arbitrary positive integer and its function is to make the obtained in-degree and out-degree values within the same value range, i.e., [ 0 , R ] . The author proposes R to take the largest in-degree in the community C, i.e., m a x ( k j i n j C ) . μ C is the ratio of outgoing connections to the total number of connections in the community C and can be calculated as:
μ C = i C k i o u t k i s i z e ( C )
Another metric, gateway local rank (GLR) [12], is based on the idea that nodes that have shortest path to core nodes of community can spread information more efficiently. First, a local critical node and a gateway node are defined In each community. The GLR value of node v is calculated as follows:
G L R ( v ) = [ α 1 u Γ k d ( v , u ) + α 2 p Γ G d ( v , u ) ] 1
where Γ k is the set of local cores, Γ G is the set of gateway nodes, and d ( v , u ) is the shortest path between node v and u. Parameters α 1 and α 2 are set to weight the different parts.
In terms of centrality based on community structure, there are some other related works such as community hub-bridge centrality [13], modular centrality [14], etc. Another feasible idea is the method proposed by Magelinski et al. [15], which is based on the modularity of the network about the community, and measures the importance of the node in maintaining the community structure by calculating the change of the corresponding modularity after removing the node.
The algorithms based on non-overlapping community structure focus on the connection between communities, and most of them have the same idea, that is, to comprehensively consider the connection status of nodes inside and outside the community and then make an evaluation. Therefore, some related indicators, such as in-degree, out-degree, community size, etc., are used in the intermediate process of calculating such indicators. As a cost, such methods ignore the topology features of nodes in the global network, and rely on computationally expensive community detection algorithms.

2.2. Graphical Representation Learning
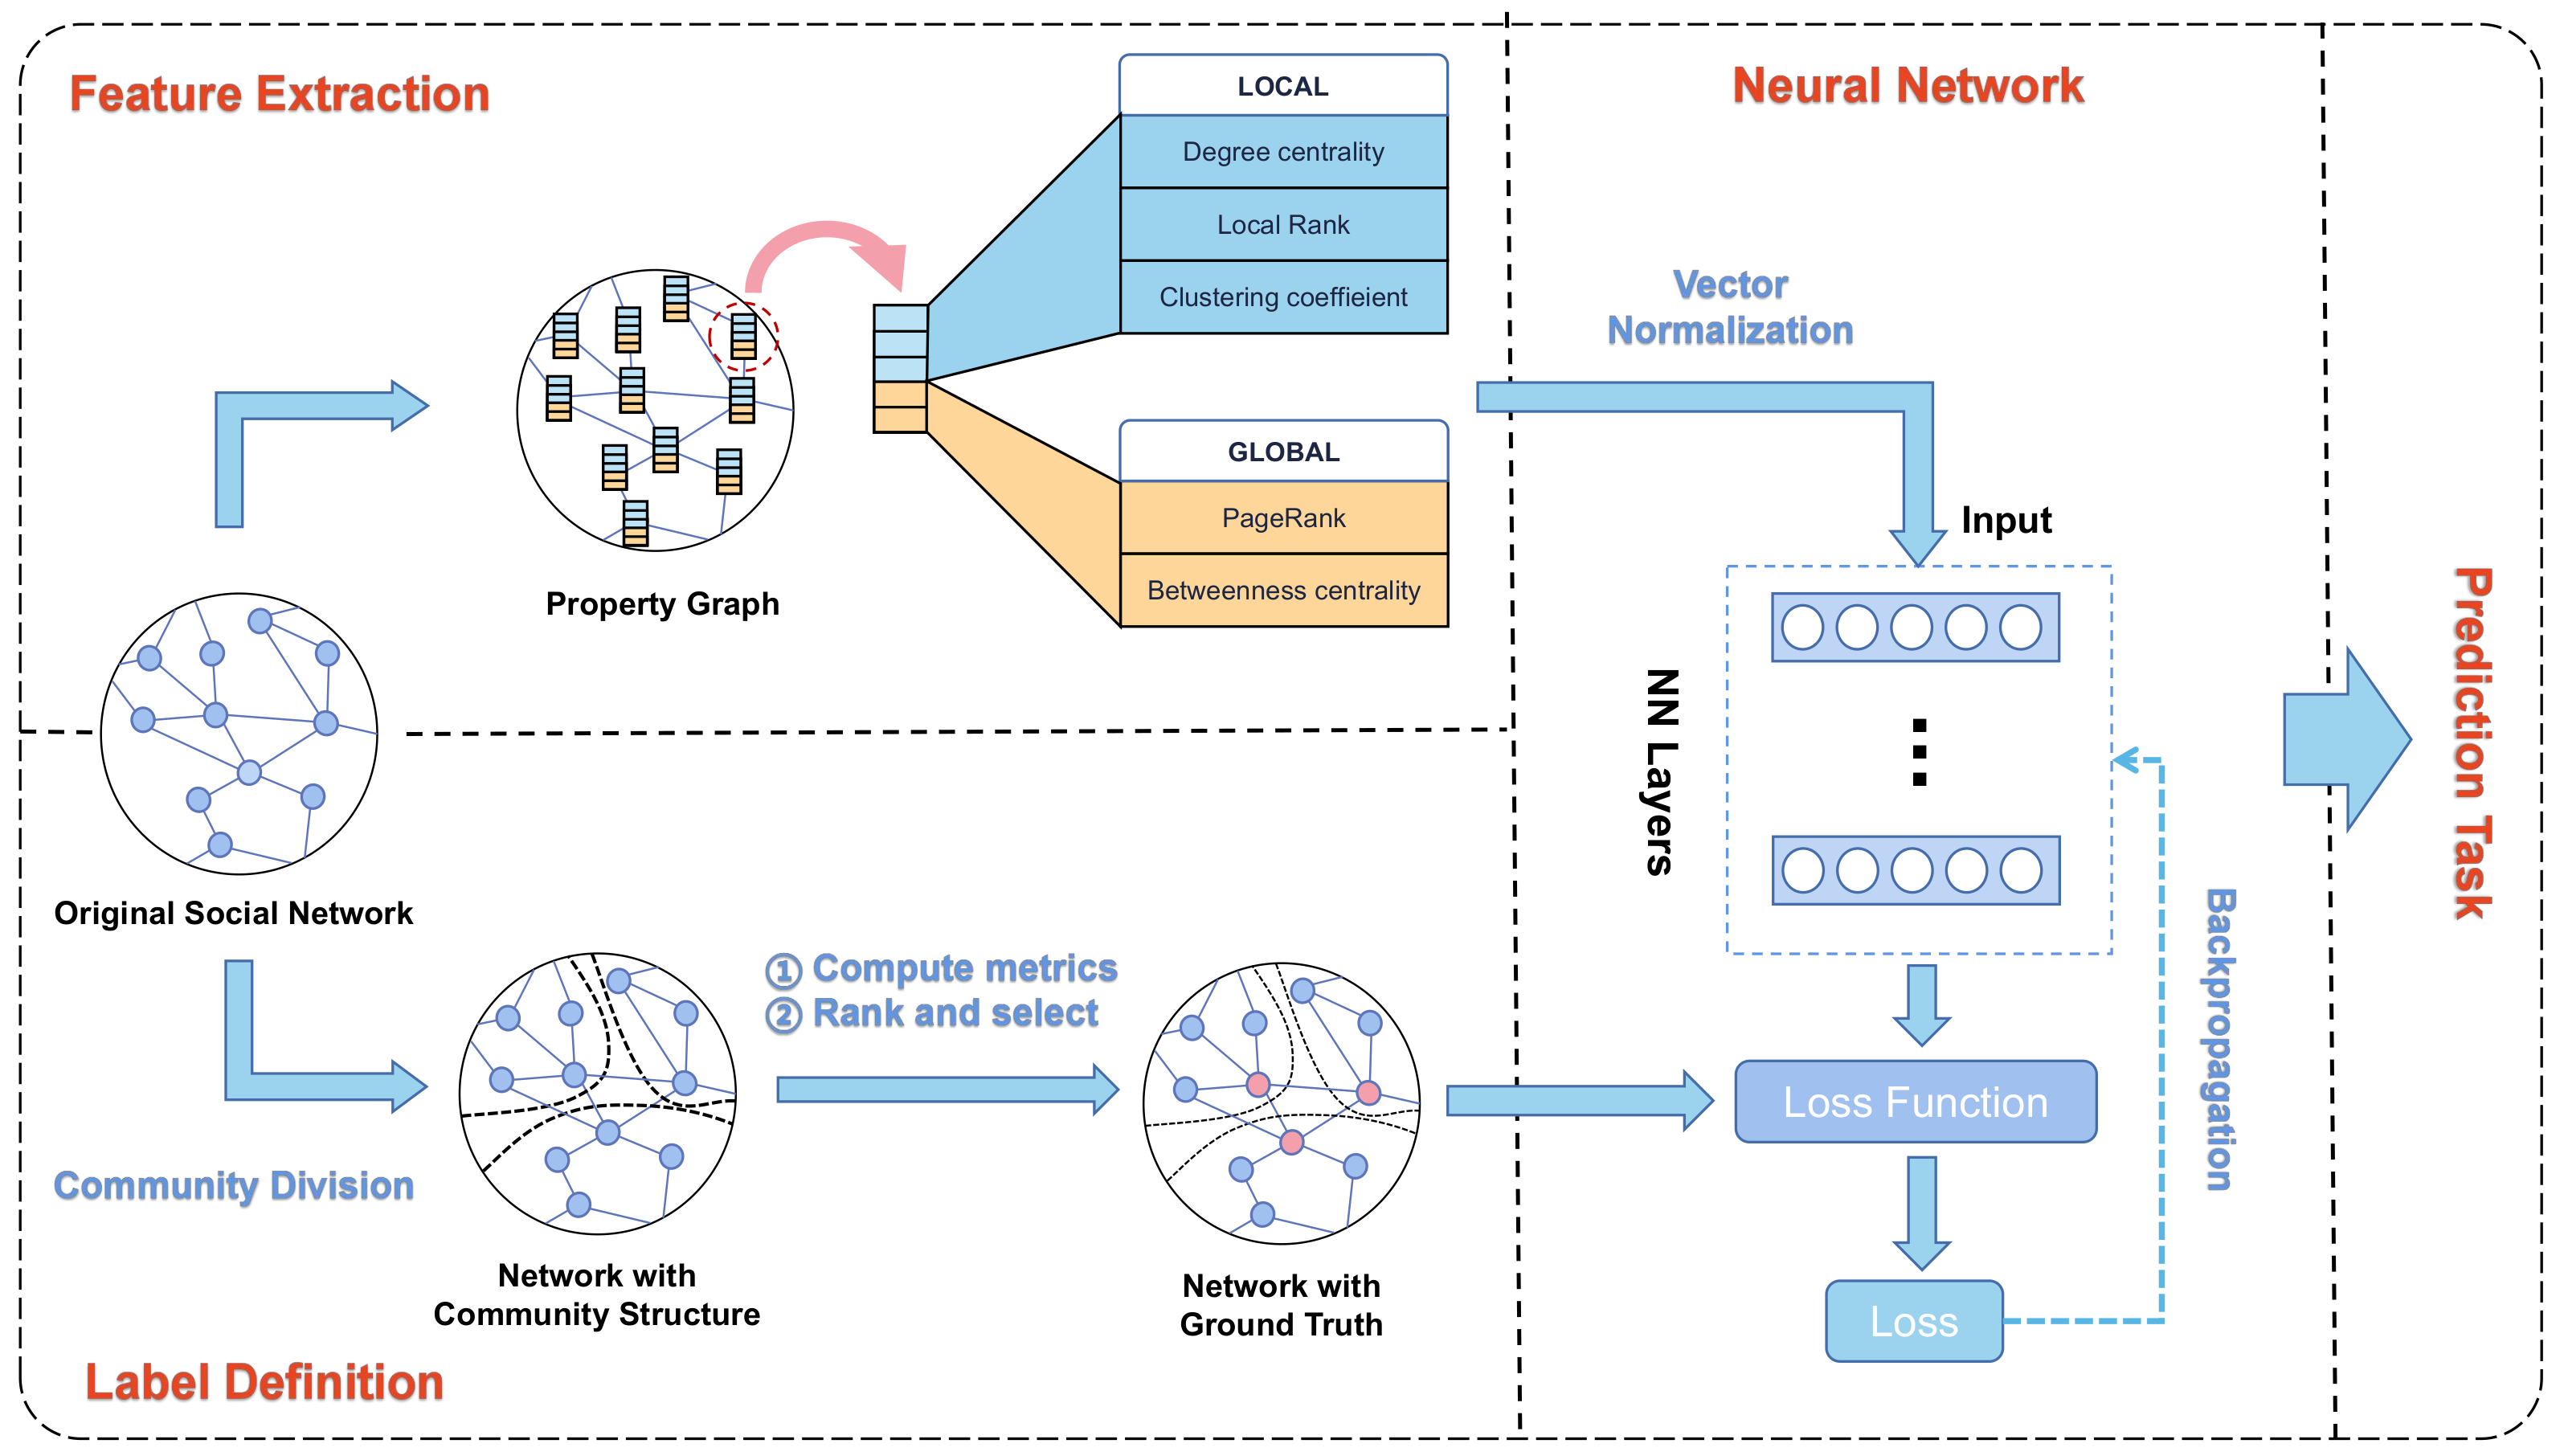
In recent years, due to its powerful performance and wide application range, the research on graph representation learning [16] has received more and more attention, and it has been widely used in social network analysis such as community detection, node classification, link prediction, and behavior analysis. There is significant related work in this field, and researchers divide these into dimensionality reduction-based, random walk-based, graph decomposition-based, and neural network-based methods according to different graph embedding methods. The methods based on dimensionality reduction include PCA [17], LDA [18], MDS [19], etc. Representative works based on random walk include DeepWalk [20] and node2vec [21]. The method based on graph decomposition realizes graph embedding by decomposing the adjacency matrix of the graph; representative works include graph Laplacian eigenmaps [22], GraRep [23], and so on. Recently, inspired by RNNs and CNNs, researchers have begun to generalize these to graphs, resulting in a new class of neural network-based methods. This class of methods integrates semi-supervised information into graph representation learning and has strong performance; representative works include GCN [24], GraphSAGE [25], GAT [26], etc.
Before graph representation learning, there were also many studies applying traditional machine learning methods, such as logistic regression, SVM, etc., to social network analysis. Due to the high degree of fit between the graph data structure of social networks and graph neural networks, some researchers have begun to try to apply graph representation learning to social network influence recognition, such as with Deepinf [27], RCNN [28], and InfGCN [29]. These research works realize the embedding process of the network by extracting the relevant attributes of the node network topology structure; further, graph convolution is used to realize the aggregation of node features and generate a low-dimensional representation of the node. The trained and tuned graph neural network model can finally predict the influential nodes in the network. Experiments show that although transforming the network influence prediction task into a classification problem [28] produces more severe application scenarios, this method is better than some other methods in terms of efficiency and accuracy.

3. Main Framework

In this section, we formally propose the inter-community bridge node detection framework BND to detect bridge nodes between complex network communities. Its basic structure and process are shown in Figure 1. For a target social network that does not define bridge nodes, the framework first uses the Louvain algorithm and three bridge node detection algorithms to define bridge node labels (see Section 3.1 for details); then, it performs feature extraction of nodes (see Section 3.2 for details) to generate the corresponding attribute graph. The neural network model takes the attribute graph as input and outputs the result after propagation through the multi-layer neural network (see Section 3.3 for details); finally, the model output is compared with the ground truth value to calculate the loss.

3.1. Label Definition

In a framework based on graph deep learning, high-quality label data is an important condition to ensure the effect of the model. For network datasets with real labels of bridge nodes, our framework can directly receive these as input; for complex networks without labels, we need to define the bridge nodes in the network ourselves.
In this paper, we combine three bridge-related algorithms—Commn, GLR, and NBNC—to define the bridging role of nodes in complex networks. The three algorithms are proven to be precise and efficient. Commn and GLR are based on community structures and can be combined to detect bridge nodes efficiently. As a community-unaware approach, NBNC is used to correct the contingency of the above two methods.
First, we use the classic Louvain algorithm to divide the community structure of the network. Then, the Commn value of all nodes can be calculated based on community information, as can GLR value and NBNC tuple. Finally, we can obtain three node bridging ranks according to the result, and nodes that obtain high rank in all of the three ranked lists are defined as bridge nodes.

3.2. Feature Extraction

We extract node features from two dimensions, namely local features and global features. The purpose is to ensure that the extracted features can more comprehensively describe the topology information of each dimension of the node. At the same time, considering the need to avoid over-reliance on feature engineering as much as possible, we only selected five types of node topology-related indicators as node features, and most of these indicators are simple and easy to calculate. Among them, local features include degree centrality, LocalRank [30], and clustering coefficient, and global features include PageRank and betweenness centrality. They are detailed in Table 1.
In order to improve the generalization ability and convergence speed of the model, we normalize the selected features. For each feature X:
X n o r m = X m a x ( X )

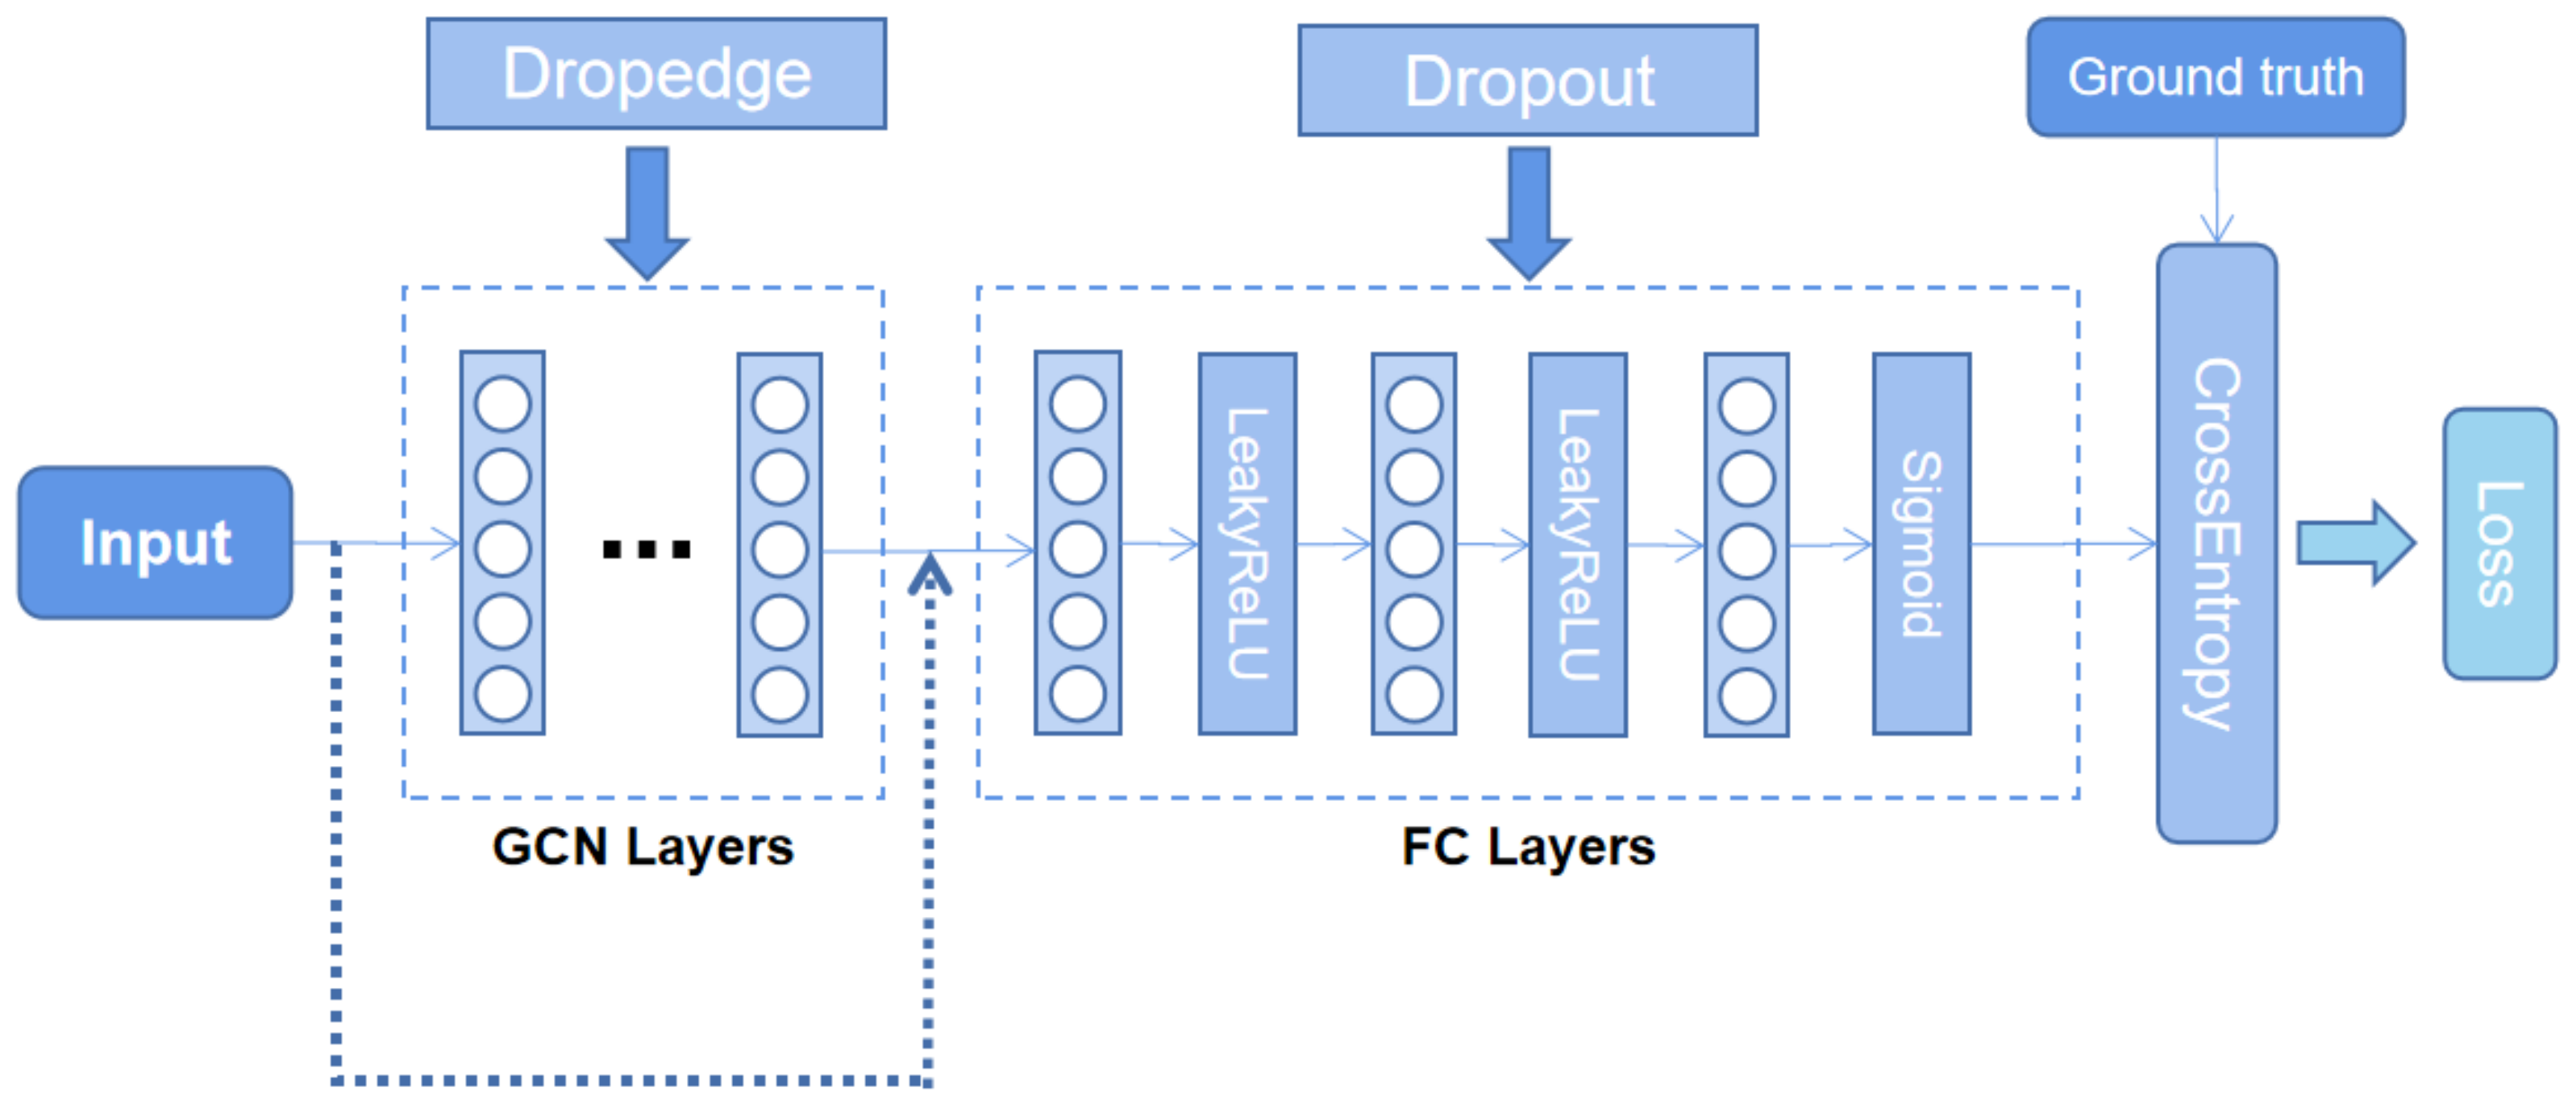
3.3. Graph Neural Network

In order to detect bridge nodes in the network more accurately, the model we build must have the ability to extract the deep topological information from the complex network. Therefore, based on the principle of graph representation learning, we propose a deep neural network model BND-GCN (bridge node detection-GCN) for detecting bridge nodes.
As shown in Figure 2, we first superimpose two GCN layers as the main part of the model; with the graph structures and feature vectors they can learn representation vectors of nodes. Each GCN layer has propagation rules defined as follows:
H i + 1 = σ ( A H i W i + b i )
where H i is the representations of nodes at the ith GCN layer and W i and b i are its trainable parameters. A is the symmetric normalized Laplacian of the network and σ denotes the nonlinear activation function.
After propagation through the multi-layer graph neural network, we can obtain a low-dimensional node representation that aggregates the topological information of the complex network. At the end of the neural network, we add three fully connected layers to process the node representation and give the final output as a classifier. The activation function between fully connected layers is LeakyReLu, and the activation function of the output layer is Sigmoid. Finally, we choose the cross-entropy function as the loss function of the model. According to the classifier output and the known ground-truth labels of the nodes, the loss function can calculate the loss of the model and then adjust the relevant parameters of the neural network layer through backpropagation. In addition, we adopt the dropedge [31] strategy on GCN layers and apply the dropout technique on fully connected layers to prevent the model from overfitting. The skip connection technique is also used in our model.
On the other hand, we also try to replace GCN layers in the model with GraphSAGE and GAT layers. Accordingly, we modified some model parameters to adapt to different network layer structures. Experiments show that the variants of BND-GCN, which we named BND-GraphSAGE and BND-GAT, also have good results on the bridge node detection task.

4. Experiment

In this section, we will elaborate on our experimental framework process and the reasons for designing the experiments in this way. In addition, we also give a detailed description of the parameter settings in the experiment in this section.

4.1. Dataset Construction

We selected six real networks as our dataset sources: (1) collaboration network of Arxiv General Relativity category CA-GrQc [32], (2) collaboration network of Arxiv High Energy Physics Theory category CA-HepTh [32], and (3) a series of snapshots of the peer-to-peer file sharing network of Gnutella, among which three networks, p2p-Gnutella04, p2p-Gnutella08, and p2p-Gnutella25, were selected [32]. Related information about these networks is shown in Table 2.
For the convenience of experiments, we ignored other properties of these networks, treated them as undirected and unweighted networks, and removed self-loops in the network. After obtaining the processed network, we divided each network into a community structure according to the Louvain algorithm, and obtained defined labels as described above. It should be noted that we may encounter two special types of nodes when dealing with the network: isolated nodes with degree 0 and small community nodes (the number of community nodes is less than 3). We directly defined these as non-bridging nodes, because such nodes have little bridging effect.
After ranking nodes with three bridging algorithms, we counted the top 30% of ranked nodes for each rank and took their intersection as the bridge nodes of the network. In contrast, other nodes in the network are non-bridge nodes. We used labels “1” and “0” to identify bridge and non-bridge nodes in the network, respectively. In the machine learning-based classification task, when the proportion of labels of a certain category is too large, it will easily lead to a long tail problem, resulting in poor model performance. Therefore, in order to avoid this problem, we randomly selected some non-bridge nodes and all of the bridge nodes to form the dataset, so that the ratio of the number of bridge nodes and non-bridge nodes was 1:2.
During experiments, we randomly divided the training set and testing set according to the ratio of 7:3 and, at the same time, ensured that the ratio of positive and negative labels in training and testing remained the original 1:2. We built the model to train and test on five network datasets and the obtained test results can measure the effect of the model on bridge node detection. In the experiments, we selected Accuracy, Precision, Recall, and F1 score as the evaluation metrics for our proposed deep learning model.

4.2. Parameter Settings

We used two hyperparameters when building the dataset, Bridge-Percentage—the proportion of nodes we select from the three ranks, and Label-Ratio—the ratio of negative labels to positive labels. In the experiment, we set Bridge-Percentage to 30% and Label-Ratio to 2 by default. Additionally, we conducted experiments to explore the settings of these two hyperparameters; the results are presented in detail in Section 5.
Our BND-GCN model consists of two GCN layers and three fully connected layers, which contain 16, 16, 16, 8, and 2 neurons, respectively. The learning rate in the model is uniformly set to 0.01 and the dropout probability is set to 0.2. The dropedge rate is the percentage of the dropped edges to the total during each round of the training, which we set to 0.1. When it came to BND-GraphSAGE and BND-GAT, we maintained most model parameters including the number of layers and neurons. The number of hidden layer neurons of GAT is set to 8. We use the GCN aggregator [25] in the BND-GraphSAGE model with the following:
h v k σ ( W · M E A N ( { h v k 1 } { h u k 1 , u N ( v ) } ) )
where h v k 1 is the node’s previous layer representation and h N ( v ) k is the aggregated neighborhood vector.
In order to ensure that the model can converge well on networks of different sizes, we set the number of model training rounds to 200.

4.3. Baseline Methods

In this part of the work, we have performed many comparative experiments to verify the advantages of our model. The following baselines are compared to our work.
Logistic regression (LR)
Logistic regression (LR) is a classic machine learning model. We trained an LR model with the features mentioned earlier to predict bridge nodes.
Support vector machine (SVM)
Support vector machine (SVM) is a generalized linear classifier based on supervised learning. We also used support vector machine (SVM) with a linear kernel as the classification model. The model uses the same features as the logistic regression model.
Multilayer perceptron (MLP)
An MLP consists of multiple fully connected layers. We built a five-layer multilayer perceptron as a representative to test its performance.
Inf-GCN
Inf-GCN [29] is a GCN-based method proposed to find influential nodes in complex networks, which performs very well in its area. The author claims that they can reach an F1 score of 90.7 in the best case. We used a Inf-GCN model on the bridge node detection task to compare it with our work.
Variants of BND-GCN
We implemented two variants of BND-GCN, denoted by BND-GAT and BND-GraphSAGE. Related parameters of these models have been introduced in the previous section.

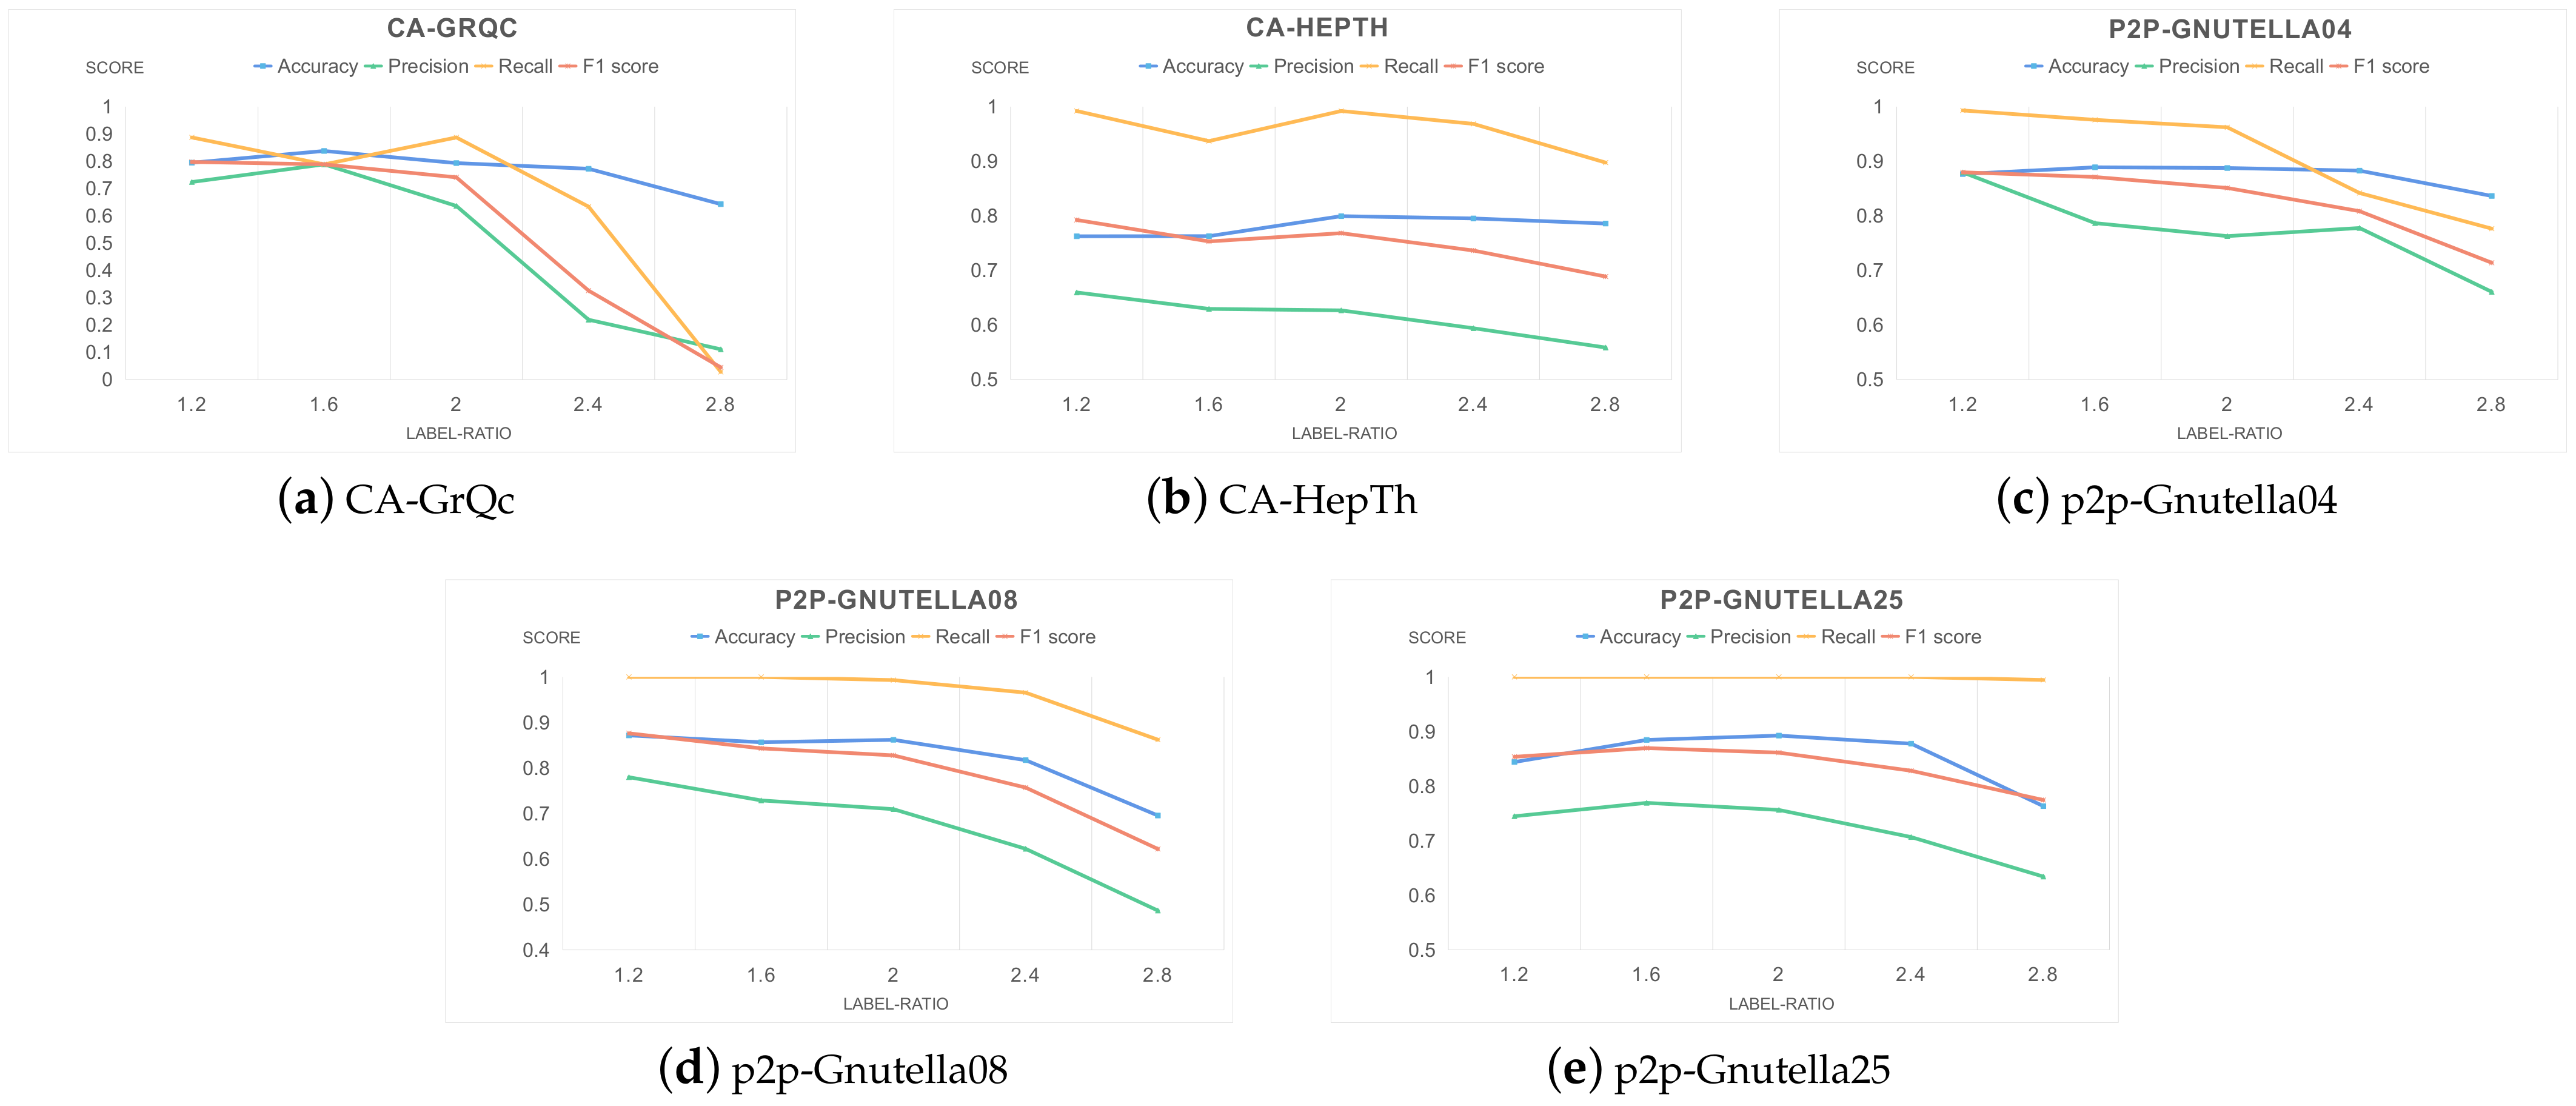
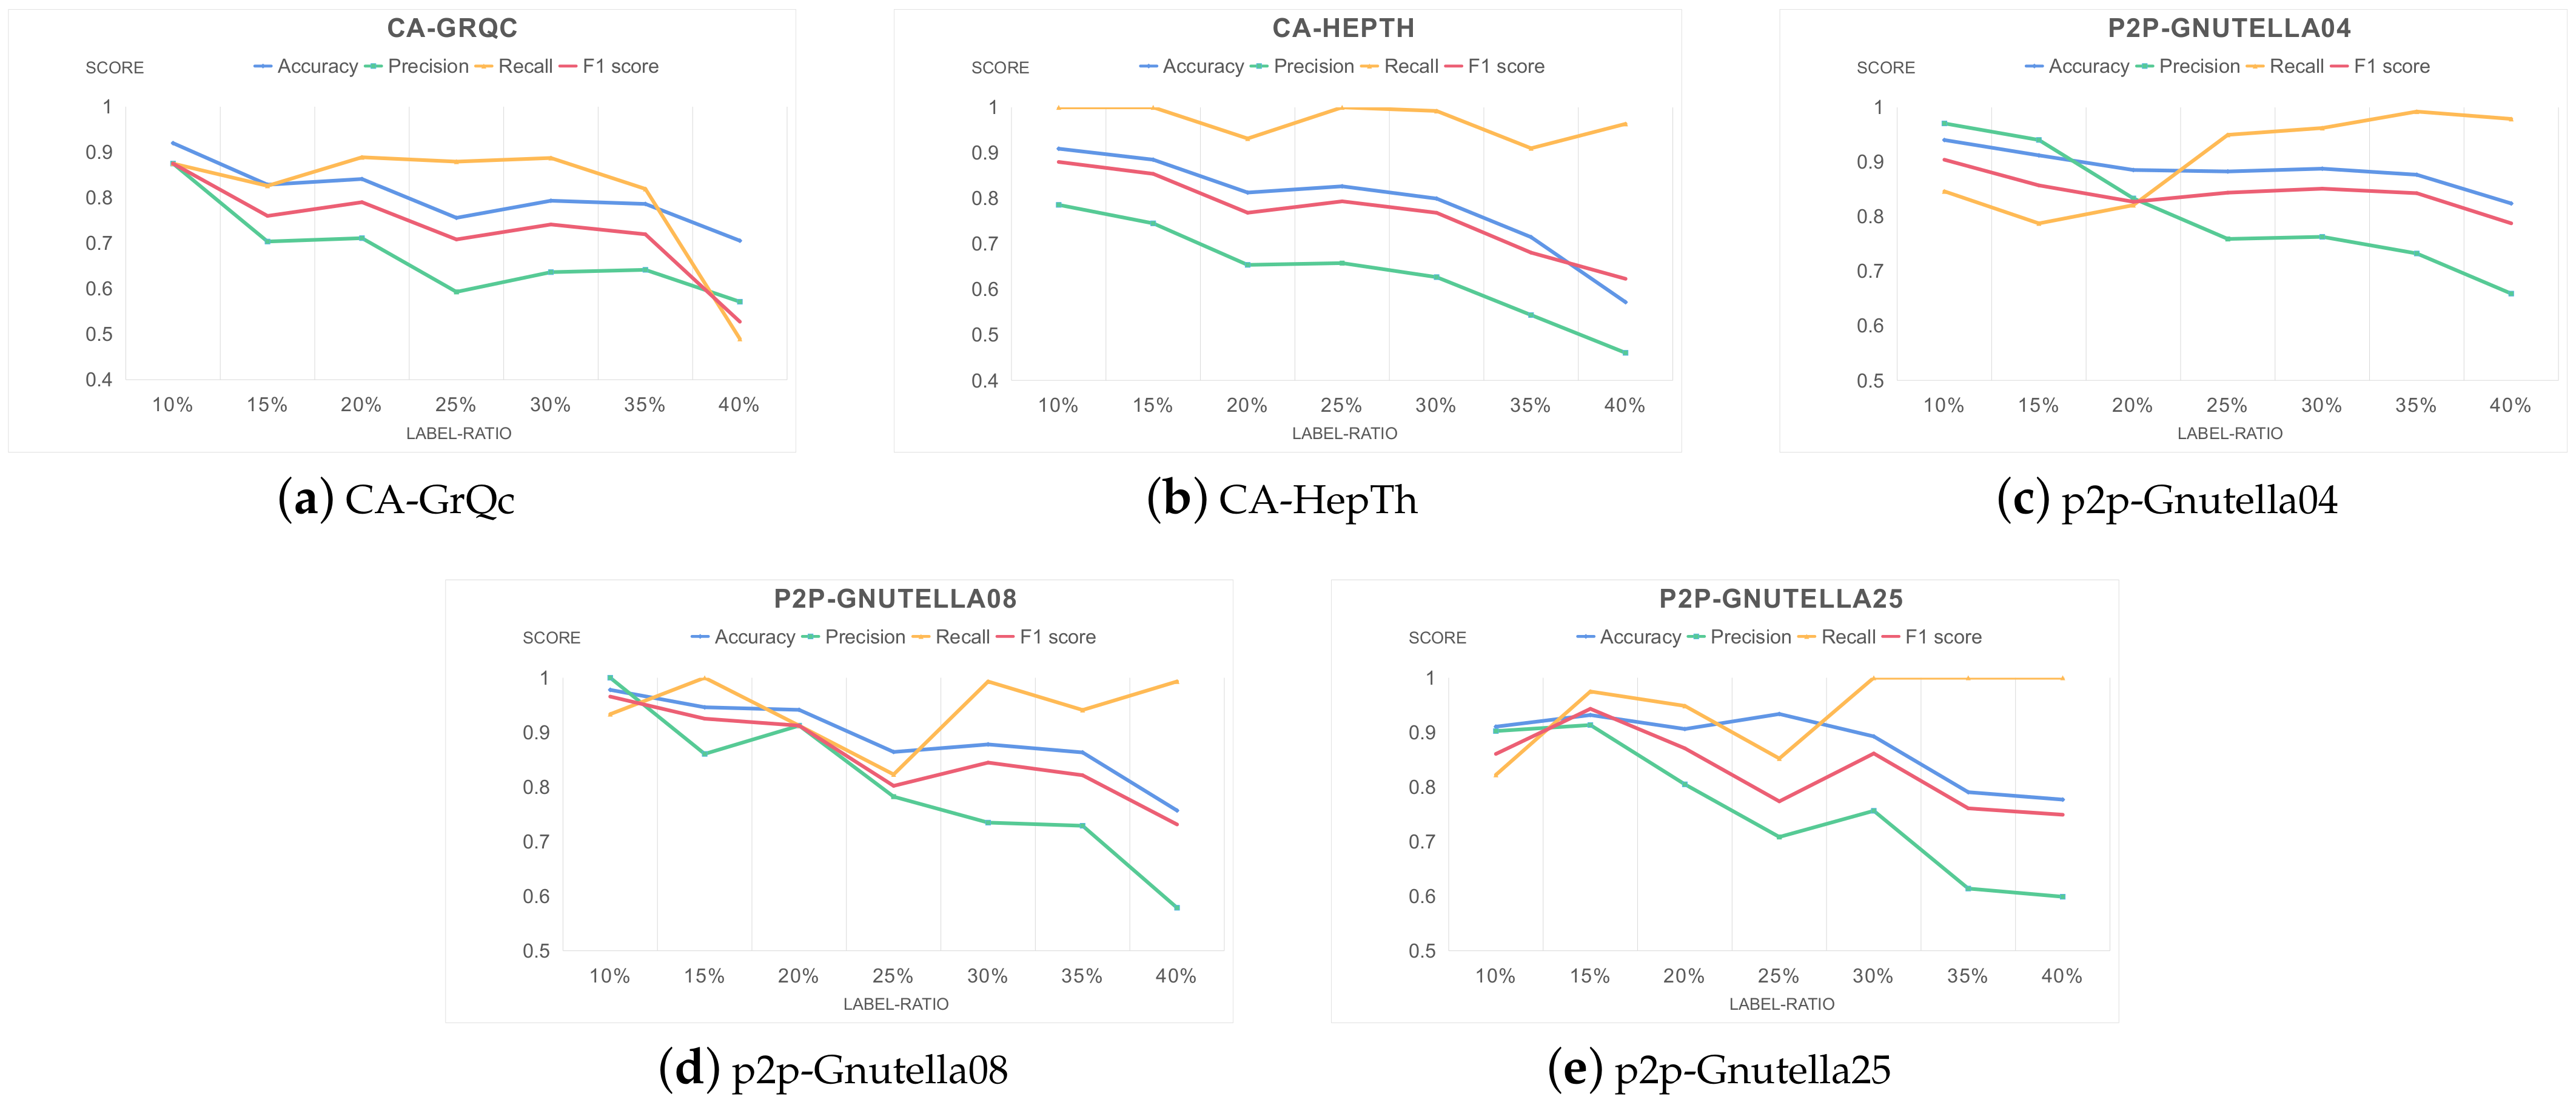
5. Experimental Results and Analyses

5.1. Bridge Node Prediction Experiment

First, we conducted bridge node detection experiments on five real networks. In this part of the experiment, we used selected features to generate the feature vector of the node, and trained and tested the models on this basis. The experiments included our three proposed models—BND-GCN, BND-GraphSAGE, BND-GAT—and four baselines. Table 3 shows the test results of these models on various networks.
For each metric, we bolded the highest score obtained in each network. Experimental results on five networks of different sizes show that our proposed BND-GCN model exhibits outstanding advantages compared with baseline models on the task of identifying bridge nodes between communities with known communities. In addition, the two variants of BND-GCN, BND-GraphSAGE and BND-GAT, also perform well. Compared to traditional methods, GNN-based methods show that the attribute graph constructed by selecting node features can describe the network structure well, so as to achieve a good embedding effect. On the other hand, the BND-GCN model is more robust compared to the baseline method Inf-GCN according to the results. This may be due to improvements we made to the model.

5.2. Hyperparameter Analysis

5.2.1. Label-Ratio

The ratio of negative to positive labels in the dataset, Label-Ratio, will have a certain impact on the effect of the model, because a change of Label-Ratio may lead to too little label data or long tail problems. In order to verify the influence of Label-Ratio on the effect of our proposed model and to help us set the appropriate Label-Ratio parameter value in the experiment, we designed multiple sets of experiments based on the BND-GCN model; the experimental results are shown in Figure 3.
Through the experimental results, we can see that with the increase of Label-Ratio, the overall effect of the model generally tends to decline. This is due to the increase in the number of negative labels, and the long-tail problem becomes more and more significant, resulting in a poorer model classification effect. A relatively balanced Label-Ratio can improve model performance; this may have good guiding significance for us when choosing data to build a training set.

5.2.2. Bridge-Percentage

According to the work in [29], the proportion of bridge nodes in the network also affects the model test results. Therefore, we set different Bridge-Percentage for repeated experiments to change the proportion indirectly. For example, if Bridge-Percentage is set to 10%, the top 10% of nodes by Commn are marked, and we do the same for nodes ranked with NBNC and GLR. Then, the intersections of the three parts are defined as bridge nodes. It is clear that Bridge-Percentage directly determines the proportion of bridge nodes. Therefore, we set different value of Bridge-Percentage to verify the effect of the parameter on the effect of the BND-GCN model. The results are shown in Figure 4.
The experimental results in this part show that as the Bridge-Percentage increases, the number of nodes defined as bridge nodes in the network increases, and the overall effect of the model decreases. Based on the experimental results, we speculate that when the Bridge-Percentage value is smaller, the bridging value of the selected node is more concentrated, and the characteristics of bridge nodes that are different from other nodes are more prominent and easier to capture. This may mean that our model will be more applicable in networks where there are few bridge nodes. When Bridge-Percentage is too small, it will lead to the problem of insufficient labels and data waste. This is another aspect that we should take into account when setting parameters.

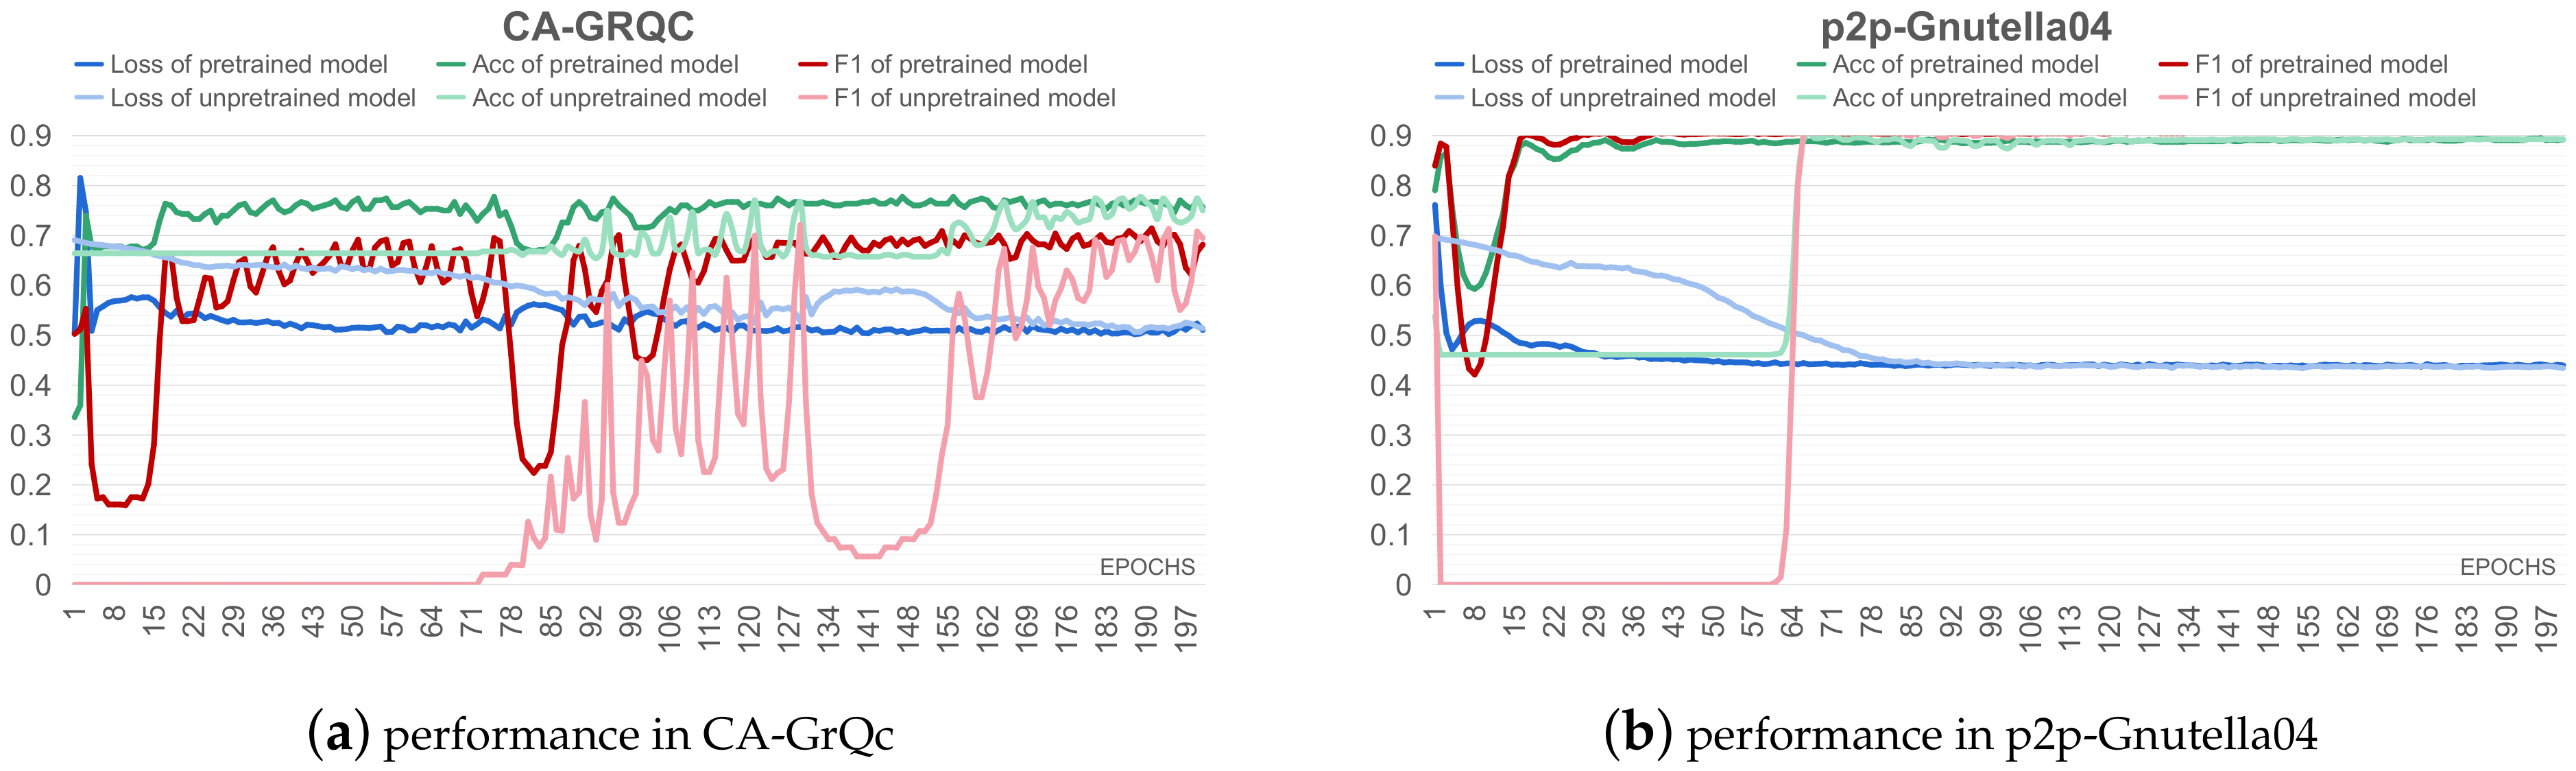
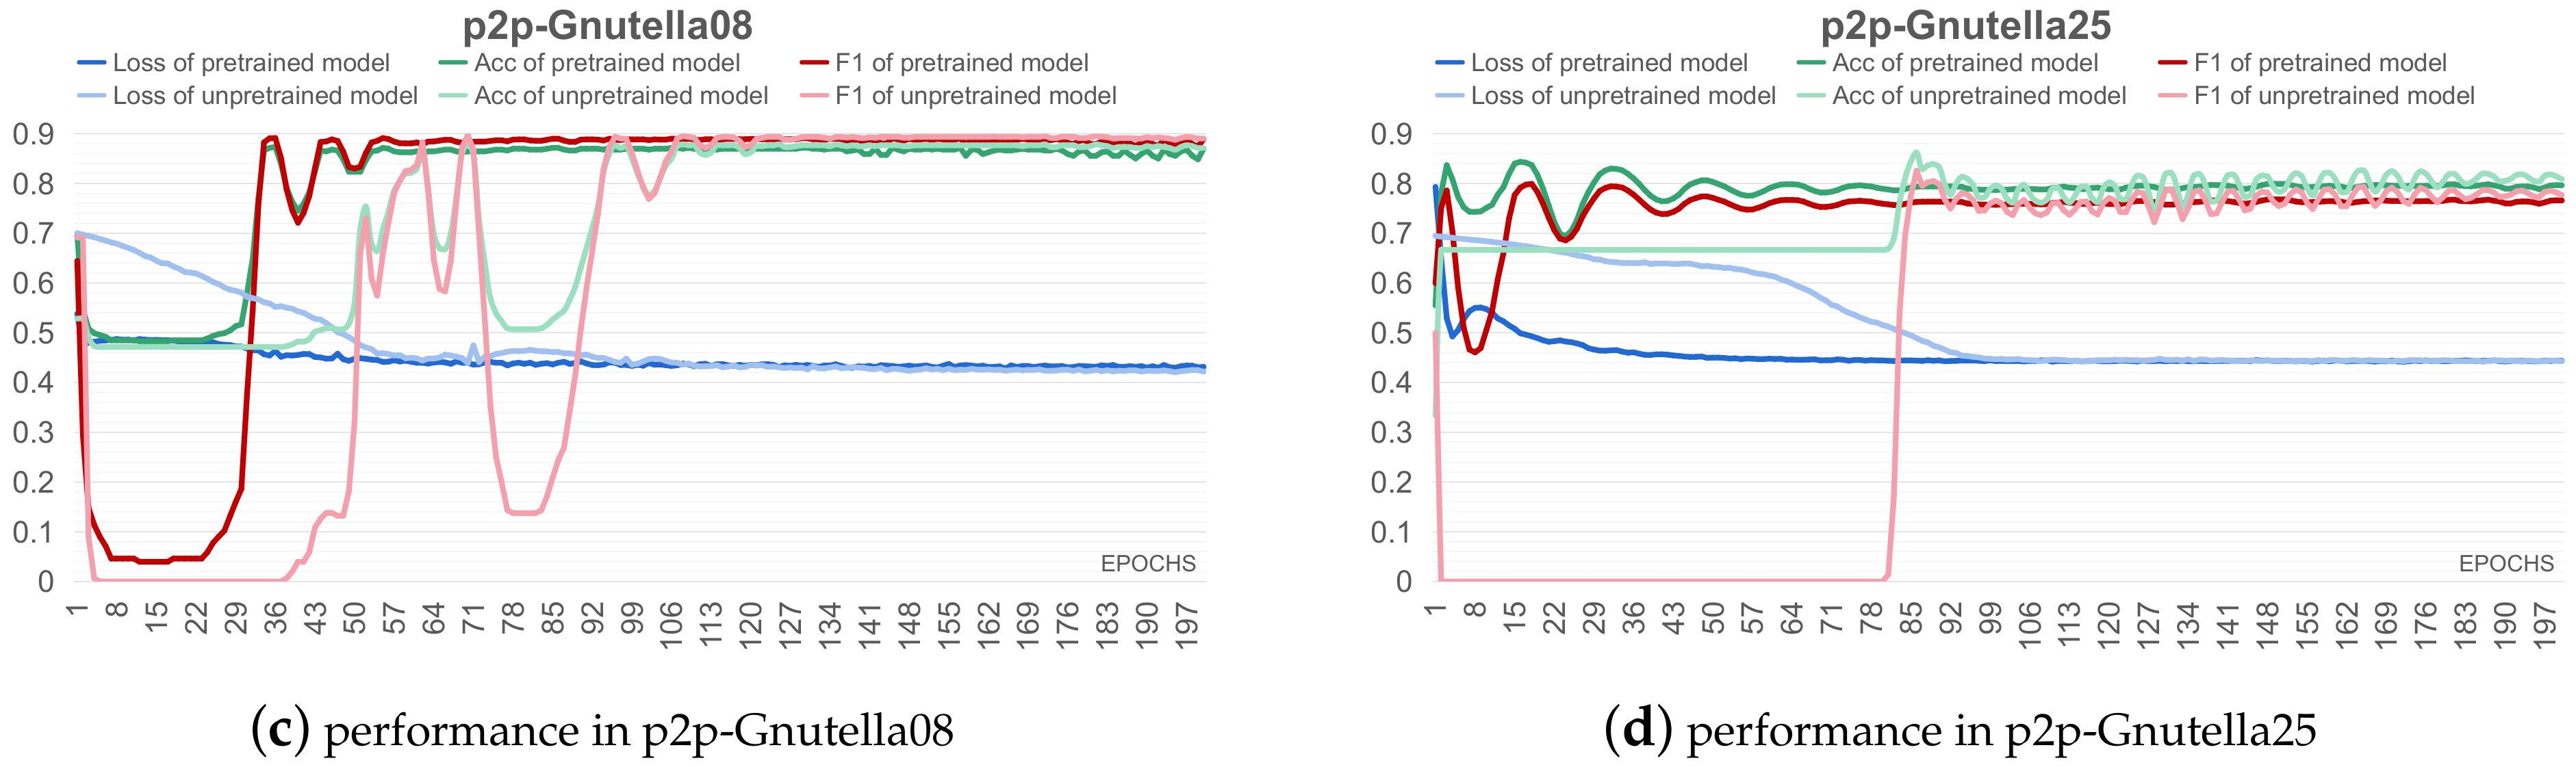
5.3. Pre-Training Experiments

The idea of transfer learning [33] has been widely used in various fields. Using transfer learning, the transfer and application of knowledge between different fields can be realized, helping people solve problems such as insufficient label data. In our scenario, due to the inconsistency of the node embedding vector space between different networks, the node features of another network cannot be directly used in the training process of this network. However, this barrier can be broken down by transfer learning; a similar graph neural network pre-training process has been applied in [29] with remarkable results. Therefore, we conducted similar pre-training experiments to verify whether the bridge node features learned in the network can help the training process in other networks. We trained the BND-GCN model on network CA-HepTh and fine-tuned the model on the other four networks. With the fine-tuned model, we can successfully implement bridge node detection tasks on different networks. Figure 5 shows the changes in Loss, Accuracy, and F1 score of the model during training when using the pre-trained model and the directly trained model.
By comparing the loss curve of the model before and after pre-training, it is obvious that our pre-training process accelerates the convergence rate in the early stage of model training and plays a good role in initializing the model. Through transfer-learning technology, we can transfer the bridge node feature information learned on another network to this network for use. This is very meaningful where there are few label resources available.

6. Conclusions

In this paper, we first propose a new inter-community bridge node detection framework, BND, which transforms the bridge node detection task into a classification problem and uses deep learning techniques to detect bridge nodes in the network, thus overcoming the traditional method’s dependence on the community division algorithm. At the same time, BND makes judgments on bridge nodes after synthesizing network topology information and node characteristics, so it has high accuracy. On this basis, we propose a graph neural network model BND-GCN and two variants, BND-GAT and BND-GraphSAGE, for bridge node detection. Our extensive experiments on five real social networks show that they outperform other deep learning models and some traditional machine learning models in bridge node detection. As far as we know, this is also the first application of graph neural network technology in the field of bridge node detection, and there is no similar application work in this field.
In future work, we will continue to study how to mine community structure information in the graph embedding or node feature stage, improve the accuracy of inter-community bridge node detection, and further improve our framework.

Author Contributions

Conceptualization, P.J.; methodology, H.L.; software, H.L.; validation, Z.H.; formal analysis, H.L.; investigation, Y.L.; resources, P.J.; data curation, Z.H.; writing—original draft preparation, H.L.; writing—review and editing, H.L.; visualization, Z.H.; supervision, A.Z.; project administration, A.Z.; funding acquisition, P.J. All authors have read and agreed to the published version of the manuscript.

Funding

This research was funded by the Key Research and Development Program of Sichuan Province under Grant 2021YFG0156.

Institutional Review Board Statement

Not appliable.

Informed Consent Statement

Not appliable.

Data Availability Statement

Not applicable.

Acknowledgments

The authors would like to thank the Key Research and Development Program of Sichuan Province for its funding and support in this research.

Conflicts of Interest

The authors declare no conflict of interest.

References

  1. Taghavian, F.; Salehi, M.; Teimouri, M. A local immunization strategy for networks with overlapping community structure. Phys. A Stat. Mech. Appl. 2017, 467, 148–156. [Google Scholar] [CrossRef]
  2. Kumar, M.; Singh, A.; Cherifi, H. An efficient immunization strategy using overlapping nodes and its neighborhoods. In Proceedings of the Companion Proceedings of the Web Conference 2018, Lyon, France, 23–27 April 2018; pp. 1269–1275. [Google Scholar]
  3. Hwang, W.C.; Zhang, A.; Ramanathan, M. Identification of information flow-modulating drug targets: A novel bridging paradigm for drug discovery. Clin. Pharmacol. Ther. 2008, 84, 563–572. [Google Scholar] [CrossRef] [PubMed]
  4. Meghanathan, N. Neighborhood-based bridge node centrality tuple for complex network analysis. Appl. Netw. Sci. 2021, 6, 47. [Google Scholar] [CrossRef]
  5. Liu, W.; Pellegrini, M.; Wu, A. Identification of bridging centrality in complex networks. IEEE Access 2019, 7, 93123–93130. [Google Scholar] [CrossRef]
  6. Jiang, L.; Jing, Y.; Hu, S.; Ge, B.; Xiao, W. Identifying node importance in a complex network based on node bridging feature. Appl. Sci. 2018, 8, 1914. [Google Scholar] [CrossRef] [Green Version]
  7. Salathé, M.; Jones, J.H. Dynamics and control of diseases in networks with community structure. PLoS Comput. Biol. 2010, 6, e1000736. [Google Scholar] [CrossRef] [Green Version]
  8. Morone, F.; Makse, H.A. Influence maximization in complex networks through optimal percolation. Nature 2015, 524, 65–68. [Google Scholar] [CrossRef] [Green Version]
  9. Fiedler, M. Algebraic connectivity of graphs. Czechoslov. Math. J. 1973, 23, 298–305. [Google Scholar] [CrossRef]
  10. Nepusz, T.; Petróczi, A.; Négyessy, L.; Bazsó, F. Fuzzy communities and the concept of bridgeness in complex networks. Phys. Rev. E 2008, 77, 016107. [Google Scholar] [CrossRef] [Green Version]
  11. Gupta, N.; Singh, A.; Cherifi, H. Centrality measures for networks with community structure. Phys. A Stat. Mech. Appl. 2016, 452, 46–59. [Google Scholar] [CrossRef]
  12. Salavati, C.; Abdollahpouri, A.; Manbari, Z. Ranking nodes in complex networks based on local structure and improving closeness centrality. Neurocomputing 2019, 336, 36–45. [Google Scholar] [CrossRef]
  13. Ghalmane, Z.; Hassouni, M.E.; Cherifi, H. Immunization of networks with non-overlapping community structure. Soc. Netw. Anal. Min. 2019, 9, 45. [Google Scholar] [CrossRef] [Green Version]
  14. Ghalmane, Z.; El Hassouni, M.; Cherifi, C.; Cherifi, H. Centrality in modular networks. EPJ Data Sci. 2019, 8, 15. [Google Scholar] [CrossRef]
  15. Magelinski, T.; Bartulovic, M.; Carley, K.M. Measuring node contribution to community structure with modularity vitality. IEEE Trans. Netw. Sci. Eng. 2021, 8, 707–723. [Google Scholar] [CrossRef]
  16. Hamilton, W.L. Graph representation learning. Synth. Lect. Artifical Intell. Mach. Learn. 2020, 14, 1–159. [Google Scholar]
  17. Jolliffe, I.T.; Cadima, J. Principal component analysis: A review and recent developments. Philos. Trans. R. Soc. A Math. Phys. Eng. Sci. 2016, 374, 20150202. [Google Scholar] [CrossRef] [Green Version]
  18. Ye, J.; Janardan, R.; Li, Q. Two-dimensional linear discriminant analysis. Adv. Neural Inf. Process. Syst. 2004, 17. [Google Scholar]
  19. Robinson, S.L.; Bennett, R.J. A typology of deviant workplace behaviors: A multidimensional scaling study. Acad. Manag. J. 1995, 38, 555–572. [Google Scholar] [CrossRef]
  20. Perozzi, B.; Al-Rfou, R.; Skiena, S. Deepwalk: Online learning of social representations. In Proceedings of the 20th ACM SIGKDD International Conference on Knowledge Discovery and Data Mining, New York, NY, USA, 24–27 August 2014; pp. 701–710. [Google Scholar]
  21. Grover, A.; Leskovec, J. node2vec: Scalable feature learning for networks. In Proceedings of the 22nd ACM SIGKDD International Conference on Knowledge Discovery and Data Mining, San Francisco, CA, USA, 13–17 August 2016; pp. 855–864. [Google Scholar]
  22. Ahmed, A.; Shervashidze, N.; Narayanamurthy, S.; Josifovski, V.; Smola, A.J. Distributed large-scale natural graph factorization. In Proceedings of the 22nd International Conference on World Wide Web, Rio de Janeiro, Brazil, 13–17 May 2013; pp. 37–48. [Google Scholar]
  23. Cao, S.; Lu, W.; Xu, Q. Grarep: Learning graph representations with global structural information. In Proceedings of the 24th ACM International on Conference on Information and Knowledge Management, Melbourne, Australia, 19–23 October 2015; pp. 891–900. [Google Scholar]
  24. Kipf, T.N.; Welling, M. Semi-supervised classification with graph convolutional networks. arXiv 2016, arXiv:1609.02907. [Google Scholar]
  25. Hamilton, W.; Ying, Z.; Leskovec, J. Inductive representation learning on large graphs. Adv. Neural Inf. Process. Syst. 2017, 30. [Google Scholar]
  26. Veličković, P.; Cucurull, G.; Casanova, A.; Romero, A.; Lio, P.; Bengio, Y. Graph attention networks. arXiv 2017, arXiv:1710.10903. [Google Scholar]
  27. Qiu, J.; Tang, J.; Ma, H.; Dong, Y.; Wang, K.; Tang, J. Deepinf: Social influence prediction with deep learning. In Proceedings of the 24th ACM SIGKDD International Conference on Knowledge Discovery & Data Mining, London, UK, 19–23 August 2018; pp. 2110–2119. [Google Scholar]
  28. Yu, E.Y.; Wang, Y.P.; Fu, Y.; Chen, D.B.; Xie, M. Identifying critical nodes in complex networks via graph convolutional networks. Knowl.-Based Syst. 2020, 198, 105893. [Google Scholar] [CrossRef]
  29. Zhao, G.; Jia, P.; Zhou, A.; Zhang, B. InfGCN: Identifying influential nodes in complex networks with graph convolutional networks. Neurocomputing 2020, 414, 18–26. [Google Scholar] [CrossRef]
  30. Chen, D.; Lü, L.; Shang, M.S.; Zhang, Y.C.; Zhou, T. Identifying influential nodes in complex networks. Phys. A Stat. Mech. Appl. 2012, 391, 1777–1787. [Google Scholar] [CrossRef] [Green Version]
  31. Rong, Y.; Huang, W.; Xu, T.; Huang, J. Dropedge: Towards deep graph convolutional networks on node classification. arXiv 2019, arXiv:1907.10903. [Google Scholar]
  32. Leskovec, J.; Kleinberg, J.; Faloutsos, C. Graph evolution: Densification and shrinking diameters. ACM Trans. Knowl. Discov. Data (TKDD) 2007, 1, 2-es. [Google Scholar] [CrossRef]
  33. Weiss, K.; Khoshgoftaar, T.M.; Wang, D. A survey of transfer learning. J. Big Data 2016, 3, 9. [Google Scholar] [CrossRef]
Figure 1. The structure of bridge nodes detection framework.
Applsci 12 10337 g001
Figure 2. BND-GCN model architecture.
Applsci 12 10337 g002
Figure 3. Effects of different Label-Ratio on five social networks.
Applsci 12 10337 g003
Figure 4. Effects of different Bridge-Percentage on five social networks.
Applsci 12 10337 g004
Figure 5. Comparison of the performance between the pretrained model and unpretrained model.
Applsci 12 10337 g005aApplsci 12 10337 g005b
Table 1. Descriptions of the selected features.
TypeFeatureDescription
LocalDegreeMeasure the number of the neighbors of a node.
LocalRankAggregate the information contained in the fourth-order neighbors of each node.
Clustering coefficientDescribe the degree of interconnection between the neighbors of a node.
GlobalPageRankMeasure the importance of a particular webpage relative to other webpages.
BetweennessMeasure the degree of interaction between the node and other nodes based on the shortest path.
Table 2. Information of the five selected networks.
NetworkNodesEdges
CA-GrQc524214,496
CA-HepTh987725,998
p2p-Gnutella0410,87639,994
p2p-Gnutella08630120,777
p2p-Gnutella2522,68754,705
Table 3. Bridge node detection experimental results.
ModelScoreCA-GrQcCA-HepThp2p-Gnutella04p2p-Gnutella08p2p-Gnutella25
LRAccuracy Precision0.66670.50000.68600.78570.77310.90430.59711.00000.80070.8591
Recall F1 score0.01410.02740.08660.15600.35740.51230.02760.05370.59030.6998
SVMAccuracy Precision0.62300.33330.68870.66670.82930.87770.67280.80000.88320.8013
Recall F1 score0.01410.02700.14170.23380.56700.68890.02760.05330.86410.8315
MLPAccuracy Precision0.77890.76470.59550.46610.72920.59250.76040.83610.76760.6105
Recall F1 score0.54930.63930.92130.61900.86940.70470.35170.49510.97770.7516
Inf-GCNAccuracy Precision0.74180.58890.82850.68020.88320.77230.77420.72380.86830.7199
Recall F1 score0.74650.56840.92130.78260.92100.84010.52410.60800.99070.8339
BND-GraphSAGEAccuracy Precision0.75590.60440.80470.64480.83050.75270.76040.59450.77890.6189
Recall F1 score0.77460.67900.92910.76130.73200.74220.88970.71270.87710.7257
BND-GATAccuracy Precision0.72770.65850.77840.64430.87060.79470.80410.84090.90500.7883
Recall F1 score0.38030.48210.75590.69570.82470.80940.51030.63520.97770.8728
BND-GCNAccuracy Precision0.79340.63640.79950.62690.88770.76290.87790.73470.89250.7563
Recall F1 score0.88730.74120.99210.76830.96220.85110.99310.84461.00000.8613
Publisher’s Note: MDPI stays neutral with regard to jurisdictional claims in published maps and institutional affiliations.

