Article

AI-Based Prediction of Myocardial Infarction Risk as an Element of Preventive Medicine

by
Izabela Rojek
*,
Mirosław Kozielski
,
Janusz Dorożyński
and
Dariusz Mikołajewski
Institute of Computer Science, Kazimierz Wielki University, 85-064 Bydgoszcz, Poland
*
Author to whom correspondence should be addressed.
Appl. Sci. 2022, 12(19), 9596; https://doi.org/10.3390/app12199596
Submission received: 1 August 2022 / Revised: 4 September 2022 / Accepted: 20 September 2022 / Published: 24 September 2022
(This article belongs to the Special Issue Artificial Intelligence in Life Quality Technologies)

Abstract

:

Featured Application

Potential applications of the concepts and solutions presented in this article relate to AI-based preventive medicine systems and second opinion systems.

Abstract

The incidence of myocardial infarction (MI) is growing year on year around the world. It is considered increasingly necessary to detect the risks early, respond through preventive medicines and, only in the most severe cases, control the disease with more effective therapies. The aim of the project was to develop a relatively simple artificial-intelligence tool to assess the likelihood of a heart infarction for preventive medicine purposes. We used binary classification to determine from a wide variety of patient characteristics the likelihood of heart disease and, from a computational point of view, determine what the minimum set of characteristics permits. Factors with the highest positive influence were: cp, restecg and slope, whilst factors with the highest negative influence were sex, exang, oldpeak, ca, and thal. The novelty of the described system lies in the development of the AI for predictive analysis of cardiovascular function, and its future use in a specific patient is the beginning of a new phase in this field of research with a great opportunity to improve pre-clinical care and diagnosis, and accuracy of prediction in preventive medicine.

1. Introduction

Machine learning (ML) is an umbrella term for a wide range of methods and techniques by which artificial intelligence learns to perform tasks from data [1]. The diagnostic methods used so far remain subjective and their accuracy depends on the clinical skills of the medical specialists. ML can be useful as a preliminary triage tool to exclude certain conditions [1]. Despite a halt in the increase in the number of cases, cardiovascular diseases still constitute one of the ten leading causes of death worldwide [2]. This is especially true for the incidence of myocardial infarction (MI) which is increasing each year worldwide. The focus on cardiovascular research reflects the high prevalence of the disease and the mortality associated with them, including the urgent need for prevention, early risk detection, response through preventive medicine and, in the most severe cases, their control through more effective therapies [3,4]. Managing asymptomatic patients with late myocardial infarction remains challenging and those with late onset disease are associated with higher complication rates, particularly in haemodynamically unstable patients. The incidence of late myocardial infarction is regarded as high: ranging from 8.5% to 40%. Surgical intervention remains the standard treatment for mechanical complications [3,4].
More accurate diagnostic and prognostic biomarkers are an ongoing focus of MI research. They make it possible to monitor the treatment of this group of patients more effectively, but also to predict their condition. The main biomarkers are:
  • derived from damaged heart muscle tissues, including cardiac troponin.
  • released from tissues after myocardial infarction as a result of systemic reactions.
  • existing in the blood circulation before the MI event [4].
Despite many studies, we do not fully know how to predict MIs. Endogenous circadian rhythms are known to optimize cardiovascular performance, compliance with predicted behavioural and environmental cycles (including changes in daytime activity), and recovery during sleep, while also being responsible for the morning peak of cardiovascular events, including i.a. strokes and myocardial infarctions [5,6,7].

1.1. Literature Review

A review of the scientific literature revealed 225 publications with the keywords ‘myocardial infarction’ and ‘artificial intelligence’ between 1986 and 2021. The number of publications on the subject is growing rapidly: 176 were published in the last 10 years (78.22 per cent), and 156 in the last five years (69.33 per cent). Thirty (13.33 per cent) of these were reviews, but only two were meta-analyses. There is therefore a lack of cross-sectional papers that allow far-reaching prognostic conclusions to be drawn that are also relevant to individual, specific cases. Advances in hardware and software have led to changes in the diagnosis of myocardial ischemia, particularly in the areas of:
  • rapid assessment of cardiac function.
  • the ability to detect small changes in the myocardium.
  • the combination of anatomical and functional assessments of coronary artery stenosis using a single method which was previously not possible in a non-invasive manner.

1.2. Aim of the Study

The project aimed to develop a relatively simple artificial-intelligence tool to assess the likelihood of a heart infarction for preventive medicine purposes.
Justification for the study lies in the need to address the identified research gaps in scientific, clinical, economic and social. Supporting research with AI accelerates this process. The current research gaps lie in the fact that inference, prediction and decision support systems mainly apply to sick people, whereas in the case of the system described here, it is designed for both healthy people, people in cardiovascular risk groups, and in early stages of the disease. It makes it possible not only to detect as early as possible the risk of the disease itself, rather than its occurrence, but also mitigates this risk by changing modifiable factors, such as diet, lifestyle, and not necessarily medication. This fundamentally changes the focus of the healthcare system from treatment to prevention, which is faster, cheaper and more effective. The novelty of the described system lies in the novel combination of methods and techniques into an intelligent and predictive system that includes both healthy and sick people, is amenable to personalization, prevents disease, and is amenable to scaling and extension to other conditions.

1.3. Main Contributions

The new paradigm of cardiac assessment shifts the focus towards non-invasive imaging, telerehabilitation and preventive medicine, especially when supported by AI (Figure 1 and Figure 2) [8]. The project aimed to develop a relatively simple artificial-intelligence tool to assess the likelihood of a heart infarction. We used binary classification to determine from a wide variety of patient characteristics the likelihood of heart disease and, from a computational point of view, determine what the minimum set of characteristics permits.
The SWOT (strengths, weaknesses, occupations, and threats) analysis showed the importance of the possible strengths of the proposed system (Figure 2). Weaknesses and threats are similar in all eHealth systems and should be addressed before and during the introduction of an innovative digital healthcare system. These can include the need for better computerization, automation and robotization of diagnosis, treatment, rehabilitation and care. This paradigm, similar to Industry 4.0, is often referred to as Clinic 4.0 [9] or Health 4.0 [10]. The concept of preventive medicine itself is not new. A critical review of six key bibliometric databases returned as many as 102,302 publications with the keyword ‘preventive medicine’ and related words published between 1857 and 2022. However, 78,265 (75.50%) were published in the last 10 years and 49,892 (48.77%) in the last five years. Only 267 publications (0.26%) from 2012–2022 were found on the topic of AI applications in preventive medicine. This demonstrates not only the novelty of the topic of AI application in preventive medicine, but also the need for engineers and interdisciplinary teams to step up their efforts so that innovative technical solutions can sufficiently support this rapidly growing branch of medical care.

2. Materials and Methods
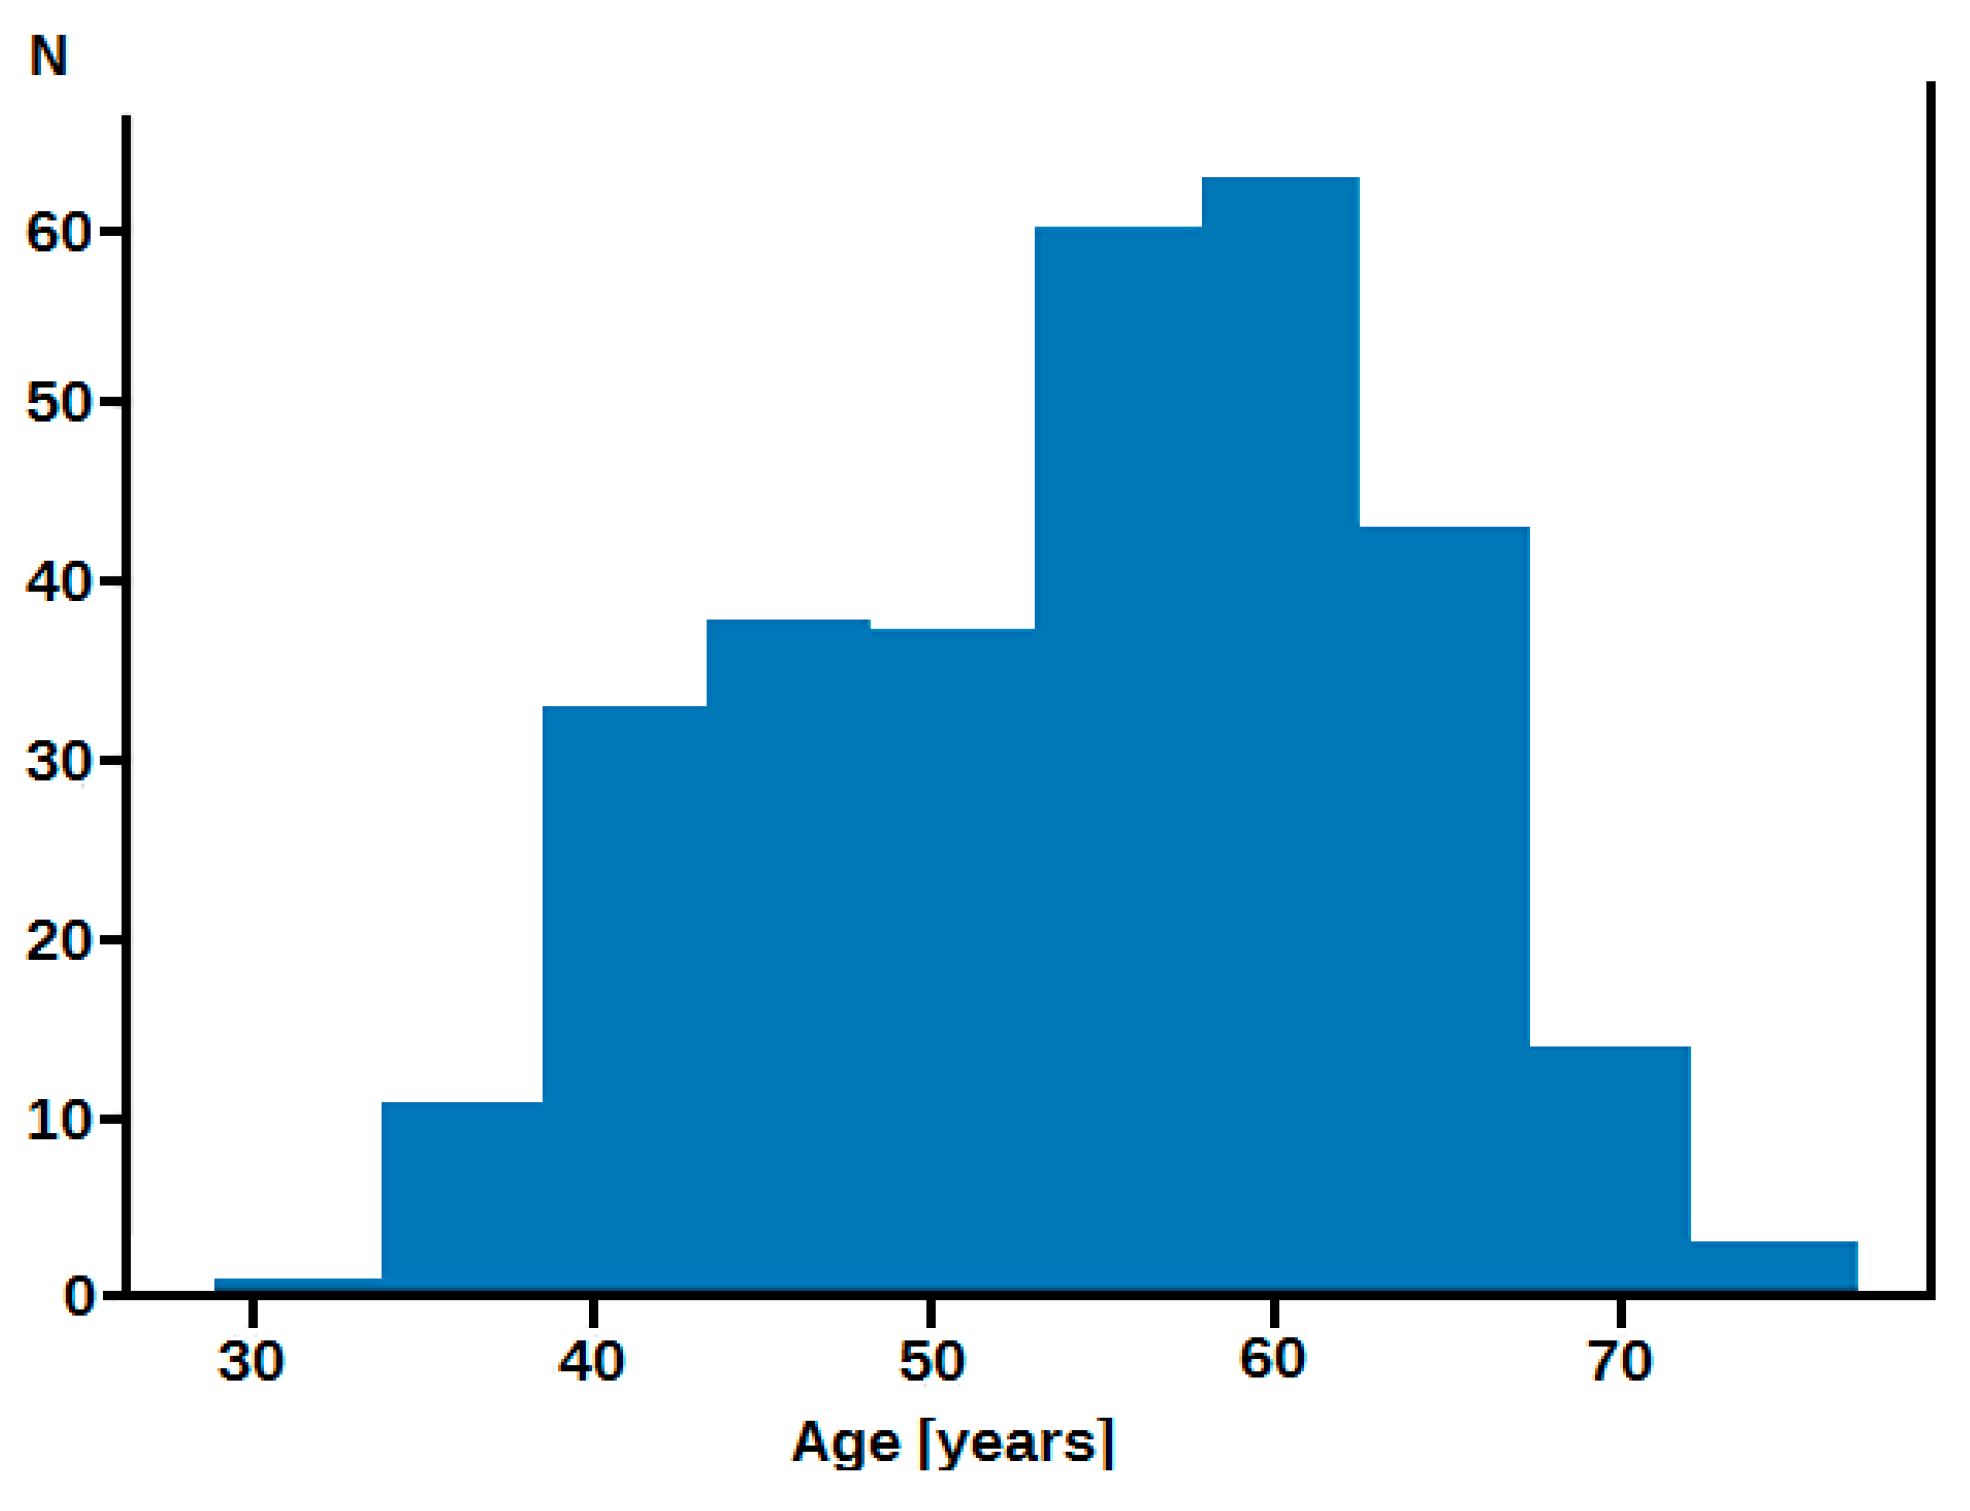
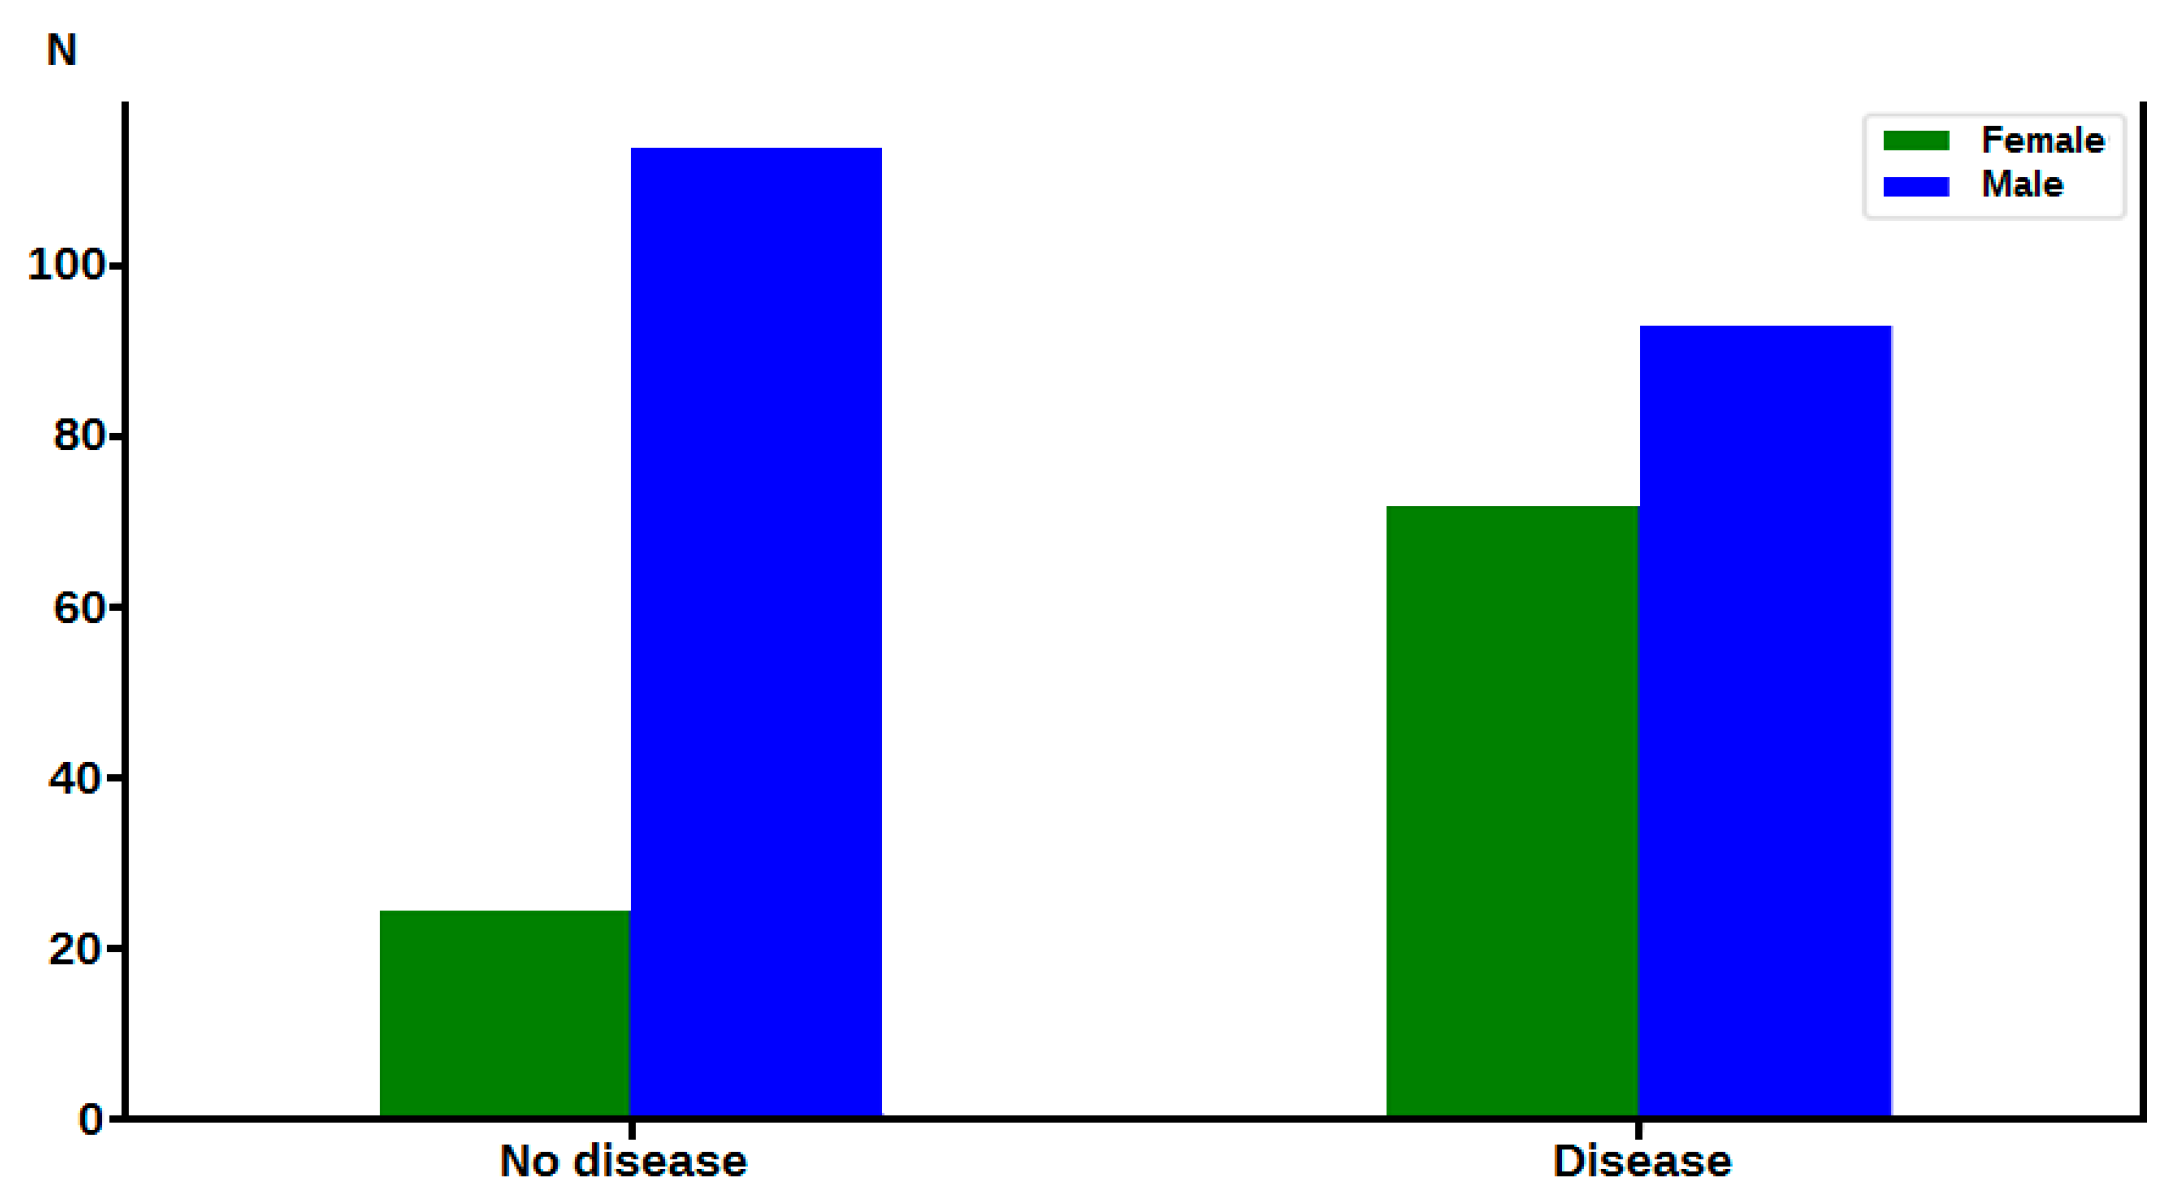
2.1. Material

We used datasets from the open database Kaggle (https://www.kaggle.com/ronitf/heart-disease-uci/, accessed on 1 June 2022). The database contains data on 14 parameters collected from 303 patients studied at 4 European research centres. The characteristics we used to predict MI (or lack thereof) were: are age, sex, chest pain type (cp), resting blood pressure (trestbps), serum cholestoral (chol), fasting blood sugar (fbs), resting electrocardiographic results (restecg), maximum heart rate (thalach), presence of exercise-induced angina (exang), ST depression (oldpeak), slope of the ST peak, number of major coloured vessels (ca), and thalium stress results (thal). The characteristics used to predict our target variable (heart disease or no heart disease) are shown in Table 1.
Age distribution of patients shown in Figure 3.
Analysis showed a normal distribution but skewing to the right. This was checked using the Shapiro-Wilk test.

2.2. Methods

The results of the study, calculations and models were recorded in .xlsx, and .csv formats (Microsoft Corp., Redmond, WA, USA). Statistical analysis was provided using Statistica 13 software (StatSoft Europe, Tulsa, OK, USA). The normality of the distribution of the surveyed and calculated data was checked each time using the Shapiro-Wilk test (p-value set at 0.05). The aforementioned value is assimilated at this level in biomedical publications, making the results in this work comparable with others published in the same area.
The libraries used in the project:
  • Pandas: version 1.2.4 (https://pandas.pydata.org, accessed on 1 June 2022), New BSD License [11].
  • NumPy: 1.20.3 (https://numpy.org, accessed on 1 June 2022), BSD license [12].
  • Matplotlib: version 3.4.2 (https://matplotlib.org, accessed on 1 June 2022), Matplotlib license [13].
  • Scikit-Learn: version 0.24.2, New BSD License, containing tools for predictive data analysis [14].

2.3. Computational Models

General computational problems were formulated in this way: “Given clinical parameters about a patient, can we predict whether or not they have heart disease?”. In the project we used 80% of the data for learning and the remaining 20% for testing.
In the project we compared results of the following algorithms: logistic regression, K-nearest neighbours (KNN), random forest Classifiers, linear support vector classification (LinearSVC). receiver operating characteristic (ROC) curve and confusion matrix.

2.3.1. Logistic Regression

Logistic regression is a mathematical model used to estimate the probability of an event occurring, working with binary data. If an event y occurs, y is given a value of 1, and if an event does not occur, y is given a value of 0. To calculate the probability, logistic regression uses the concept of the odds ratio, defined as the ratio of the chances of an event occurring to its non-occurrence:
O d d s = P ( y = 1 x ) 1 P ( y = 1 x )
Regarding to the Scikit-Learn documentation for logistic regression, there is a number of different hyperparameters which can be tuned.

2.3.2. K-Nearest Neighbours

The K-nearest neighbours (KNN) method is an ML method extended to big data mining. It uses large amounts of training data, and each such data point is characterised by a set of variables and plotted in a multidimensional space. For a new data point, the k nearest neighbours (most similar to it) must be found. By default, k = 5. The KNN, for those k points in the training data that are closest to the test value, calculates the distance between all these categories. The test value belongs to the category for which this distance is smallest.

2.3.3. Random Forest Classifiers

Random forest classifiers are simple to implement, fast to run and effective for many tasks. The key principle is to build multiple simple decision trees during learning and a major choice between them during classification. This has the effect of correcting for over-fitting of the training data, which is undesirable. During the training phase, a random sample with a replacement is repeatedly selected from the training set and the trees are matched to these samples. Each tree is grown without pruning and the number of trees in the ensemble is a selection parameter.
Regarding the Scikit-Learn documentation for random forest classifiers, there is a number of different hyperparameters which can be tuned.

2.3.4. Linear SVC

The linear SVC performs the best possible segregation of a given dataset by selecting the hyperplane with the largest possible margin (distance between each of the nearest points) between the support vectors in the dataset. SVC searches for this hyperplane in the following steps:
  • generates hyperplanes that best segregate the classes.
  • selects the hyperplane with the maximum segregation from both nearest data points.

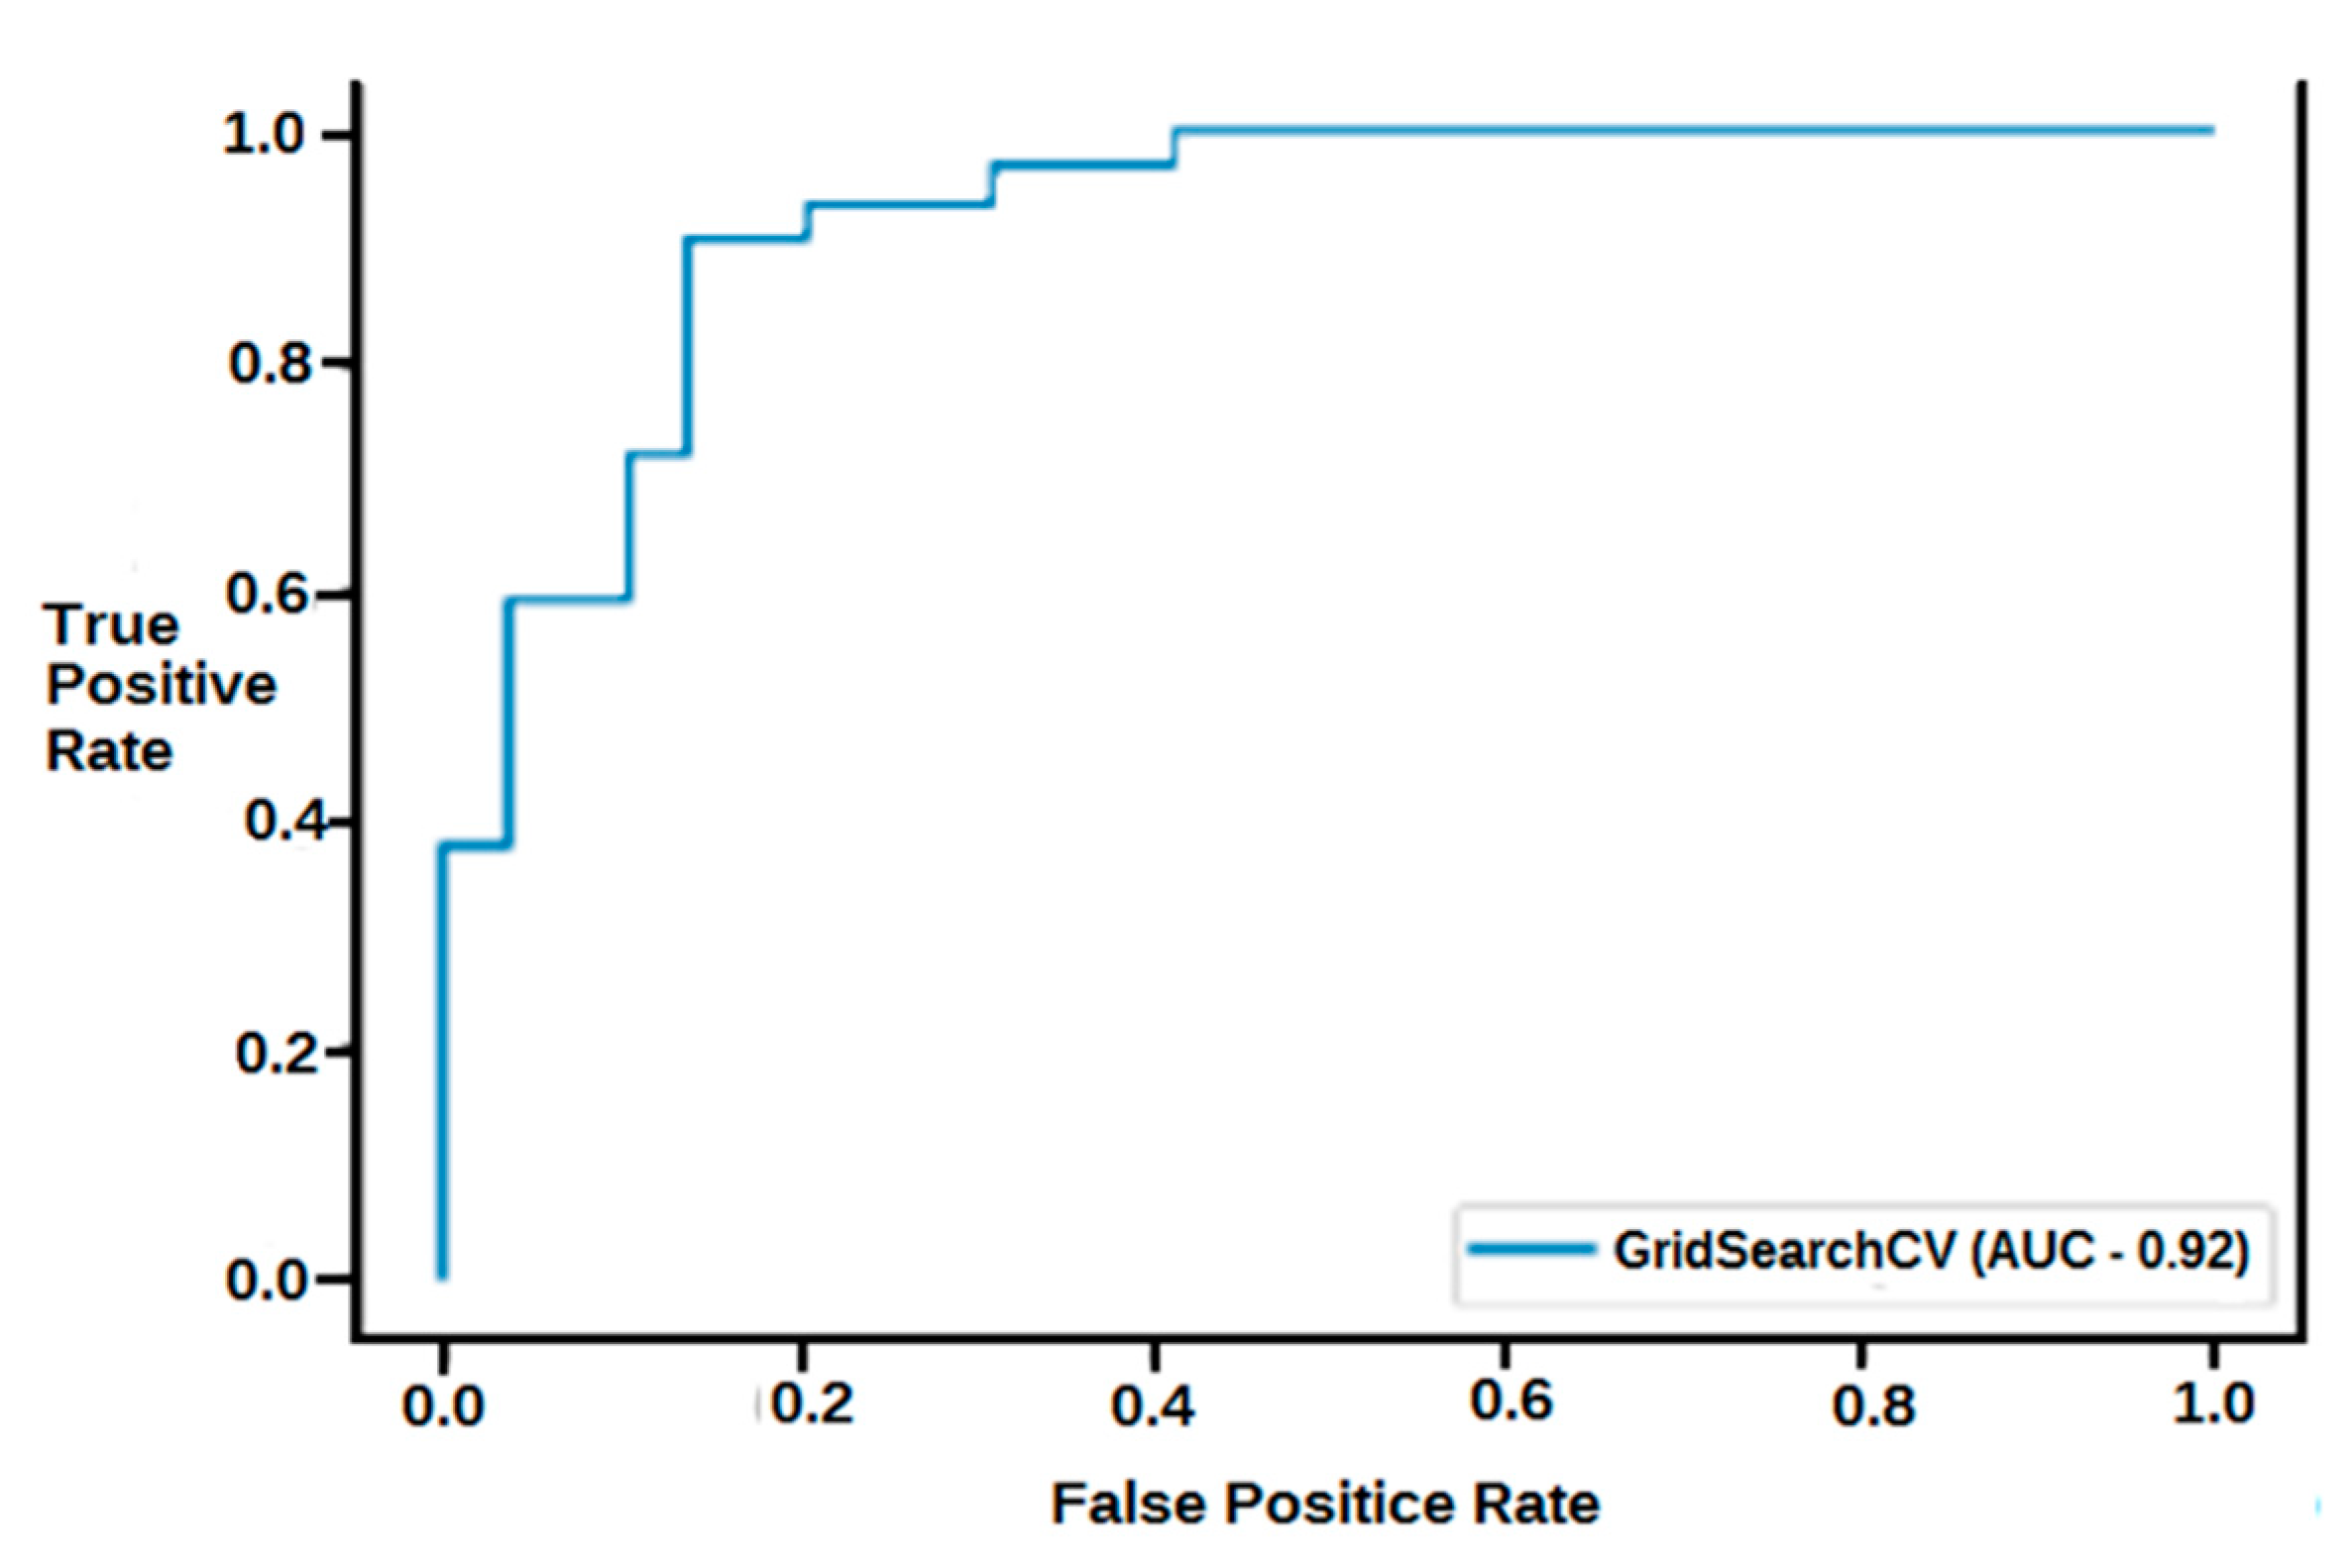
2.3.5. Receiver Operating Characteristic (ROC) Curve

The ROC is a plot of the rate of true positives against the rate of false positives. In the study described:
  • a false positive test occurs when a person has a positive result but does not actually have the disease.
  • a false negative test occurs when a person has a negative result, suggesting that they are healthy, when in fact they have a disease.

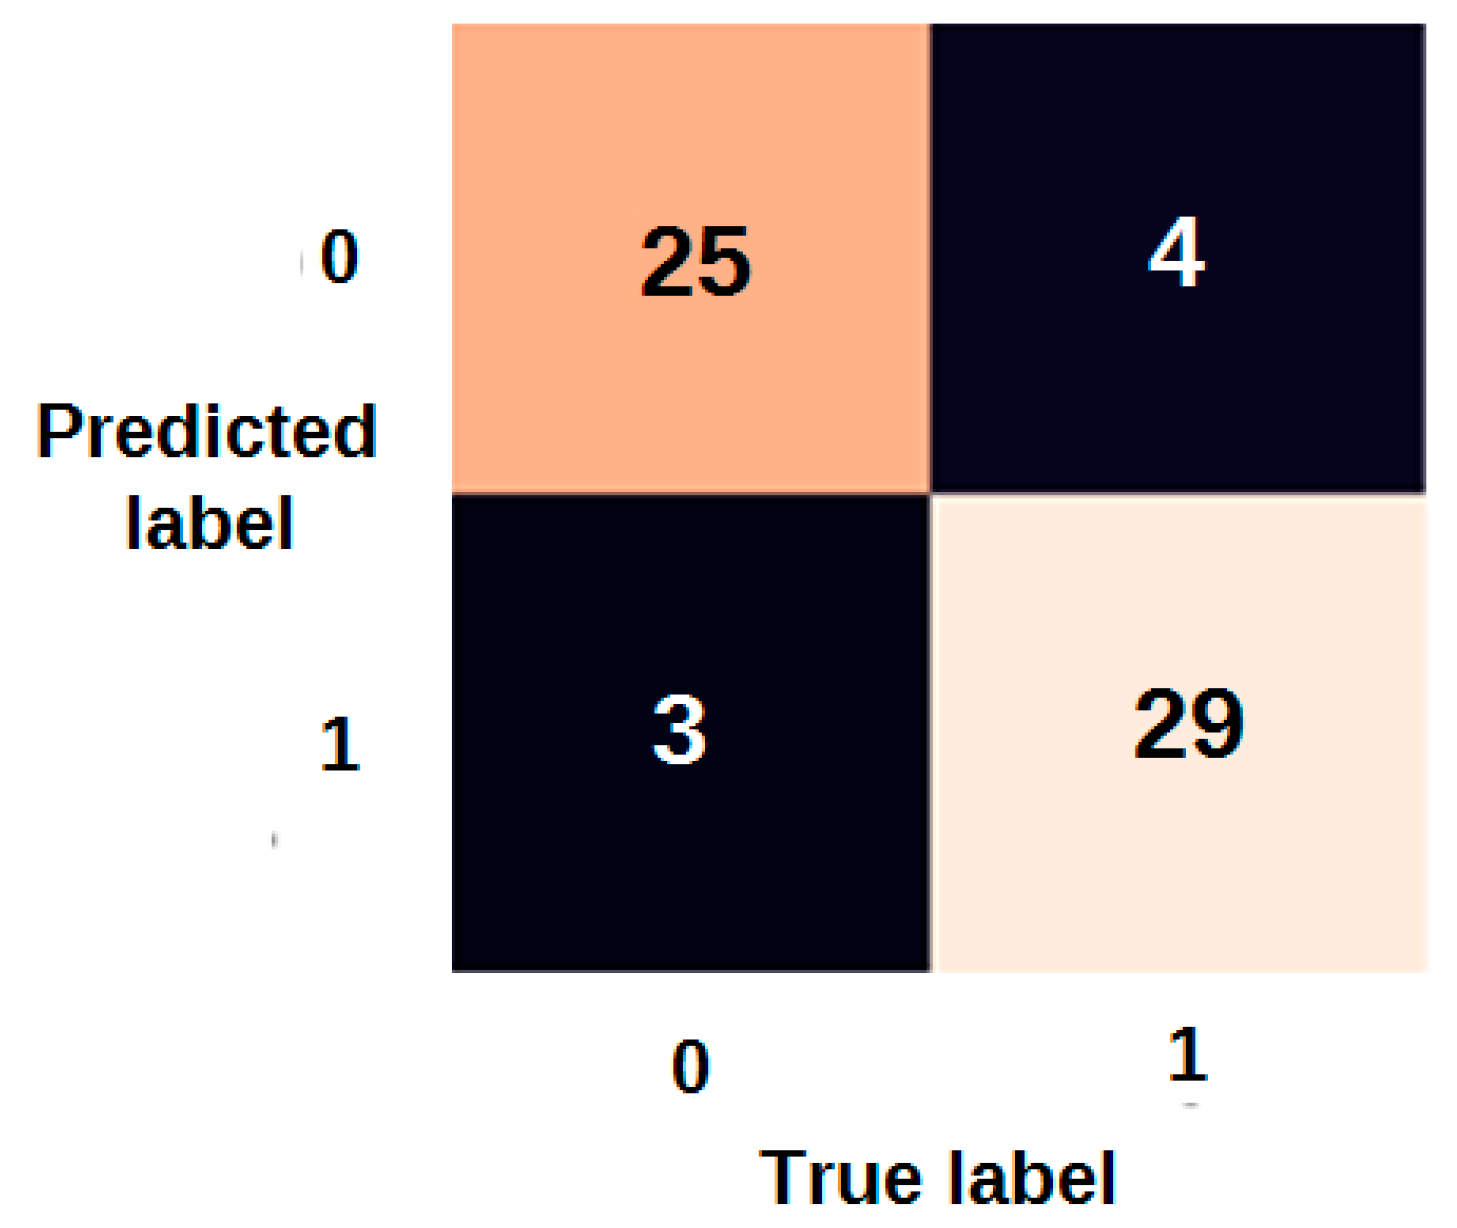
2.3.6. Confusion Matrix

A confusion matrix compares predicted values with true values. It is a visual way of showing where the model has made the right predictions and where it has made the wrong ones.

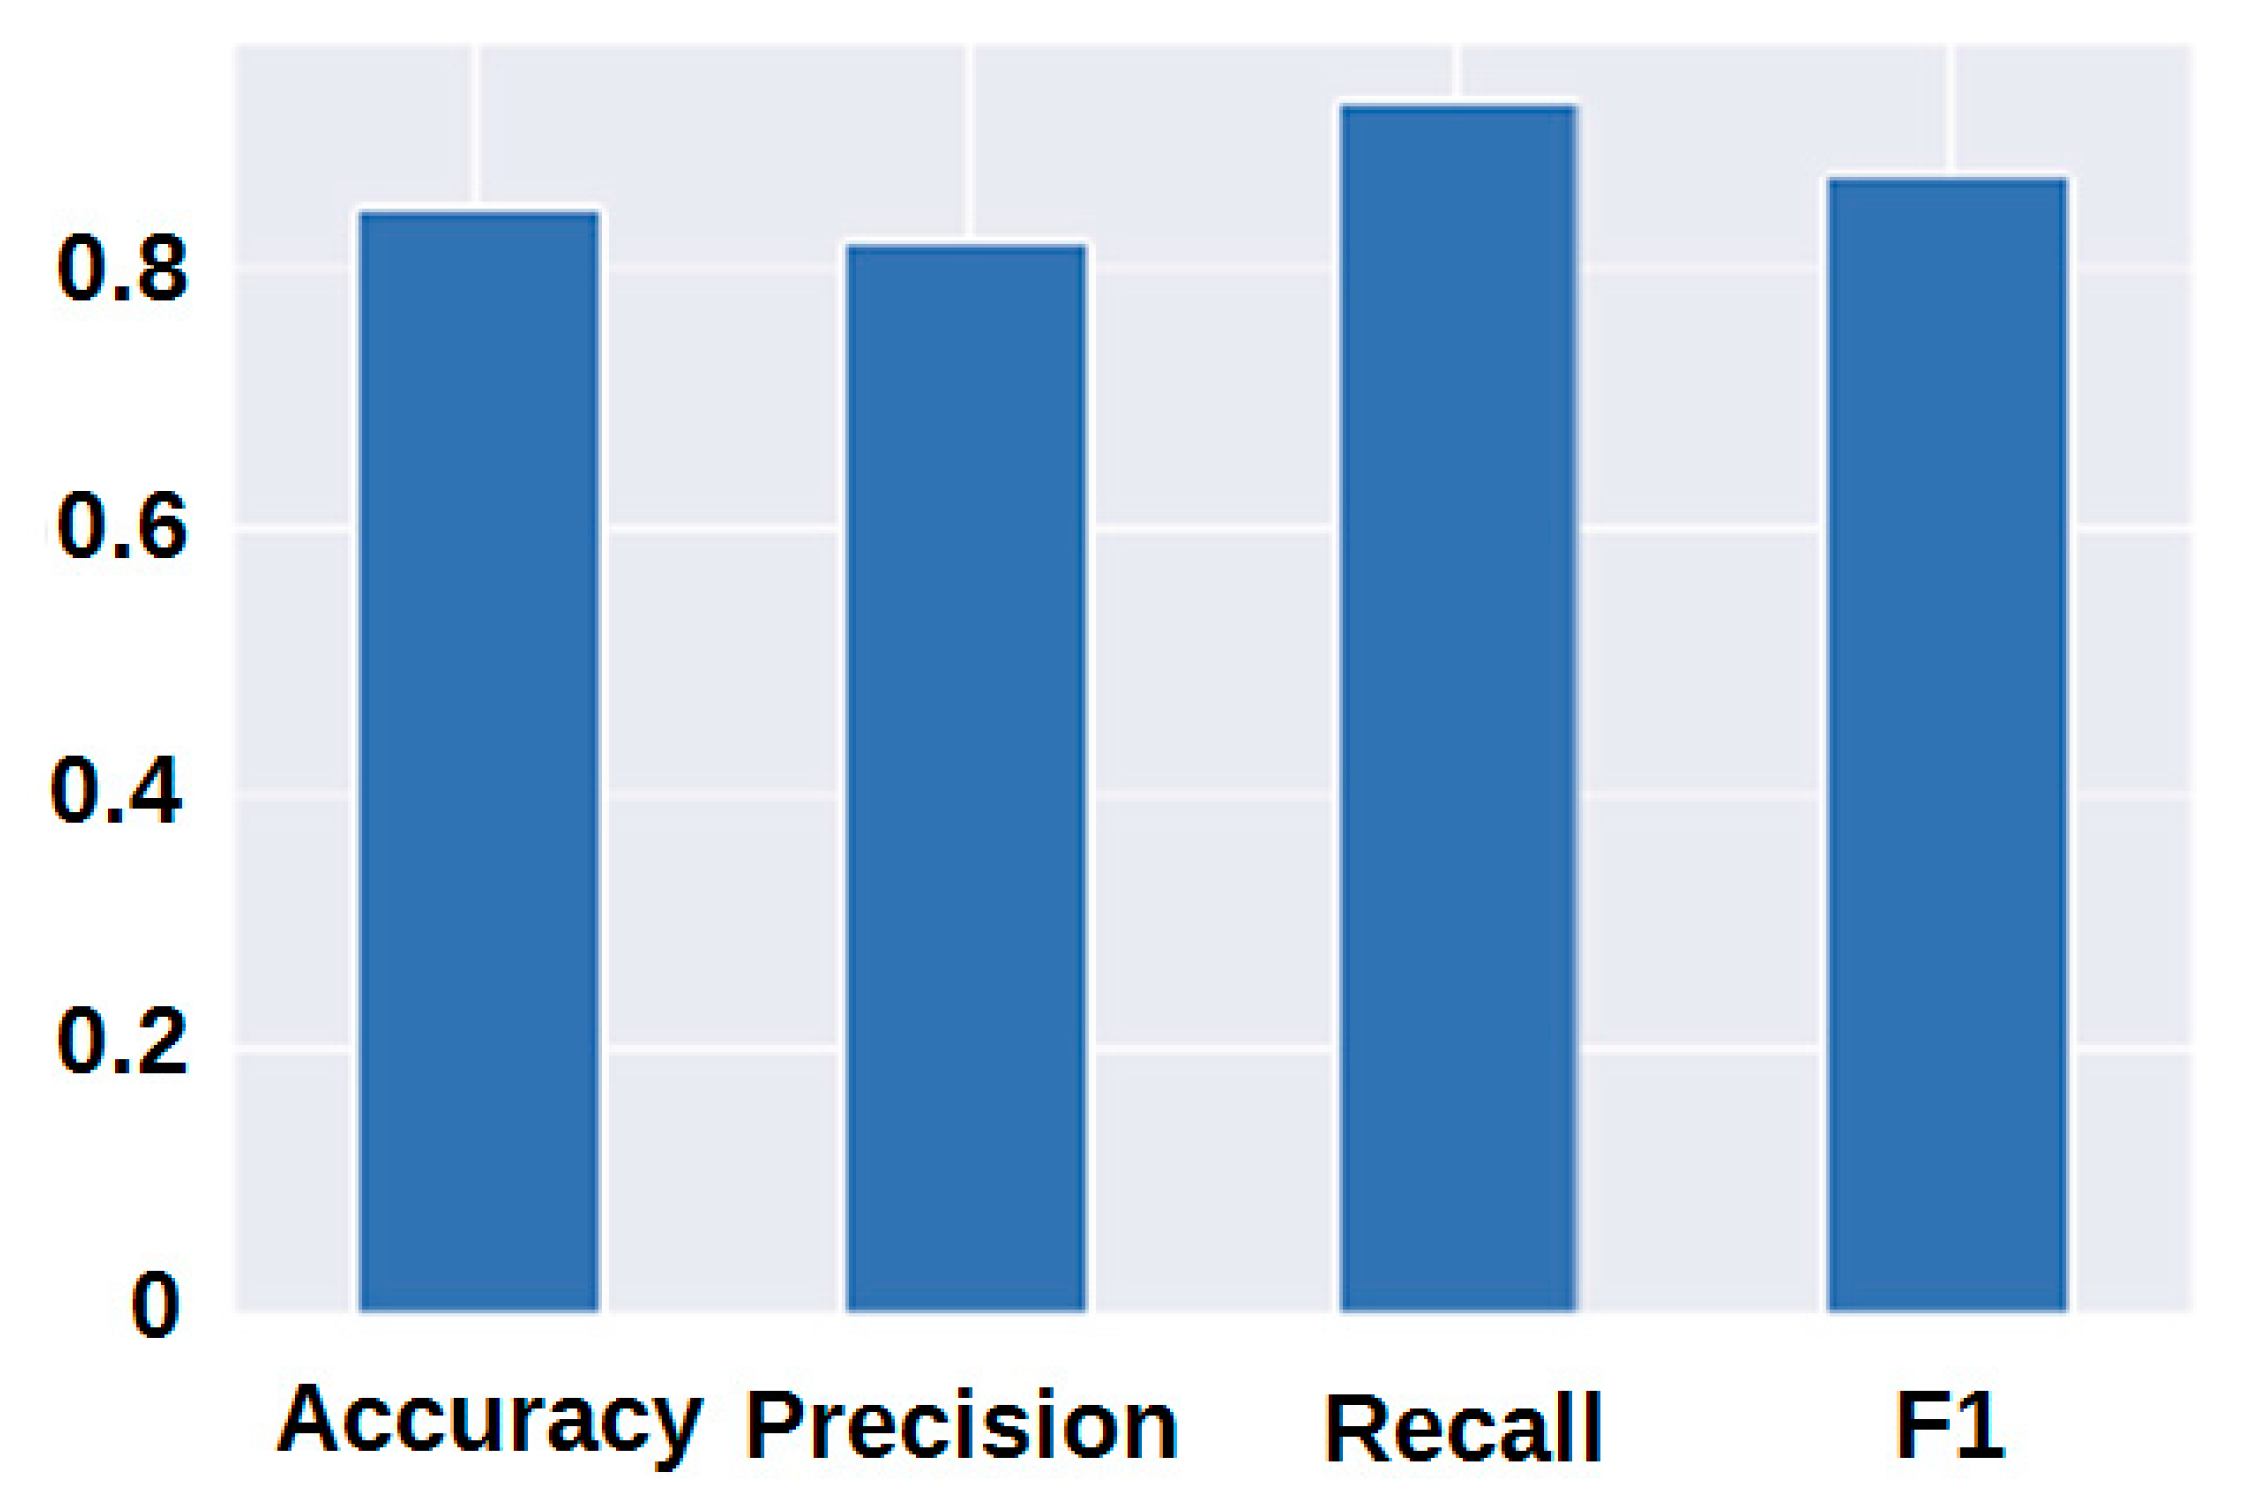
2.3.7. Classification Report

In the classification report we report both the true labels and those predicted by the model, it will also provide information on the accuracy and recall of our model for each class. The following metrics are used at the same time:
  • precision or positive predictive value (PPV): the ratio of true positives in relation to the total number of samples.
  • recall or true positive rate (TPR): the ratio of true positives to the total number of true positives and false negatives.
  • F1 score: combination of precision and recall.
  • Accuracy.

3. Results

The results are presented below according to the methodology outlined in Section 2.3. The main results are shown in Figure 4, Figure 5 and Figure 6. Our results show the risk of MI was higher in men (Figure 4).
The results show that the younger someone is, the higher their maximum heart rate (Figure 5 and Figure 6).
It seems even some medical professionals are confused by the term atypical angina—it’s not related to the heart.
We compared all the independent variables: this gave an idea of which independent variables influenced our target variable. We developed a correlation matrix using the Pearson correlation coefficient, comparing two interval variables (Figure 7).
We observed a moderate positive correlations between “cp” and “target” (0.43), and “thalach” and “target” (0.42) as well as moderate negative correlations between “slope” and “oldpeak” (−0.58), “exang” and “target” (−0.44), and “oldpeak” and “target” (−0.43).

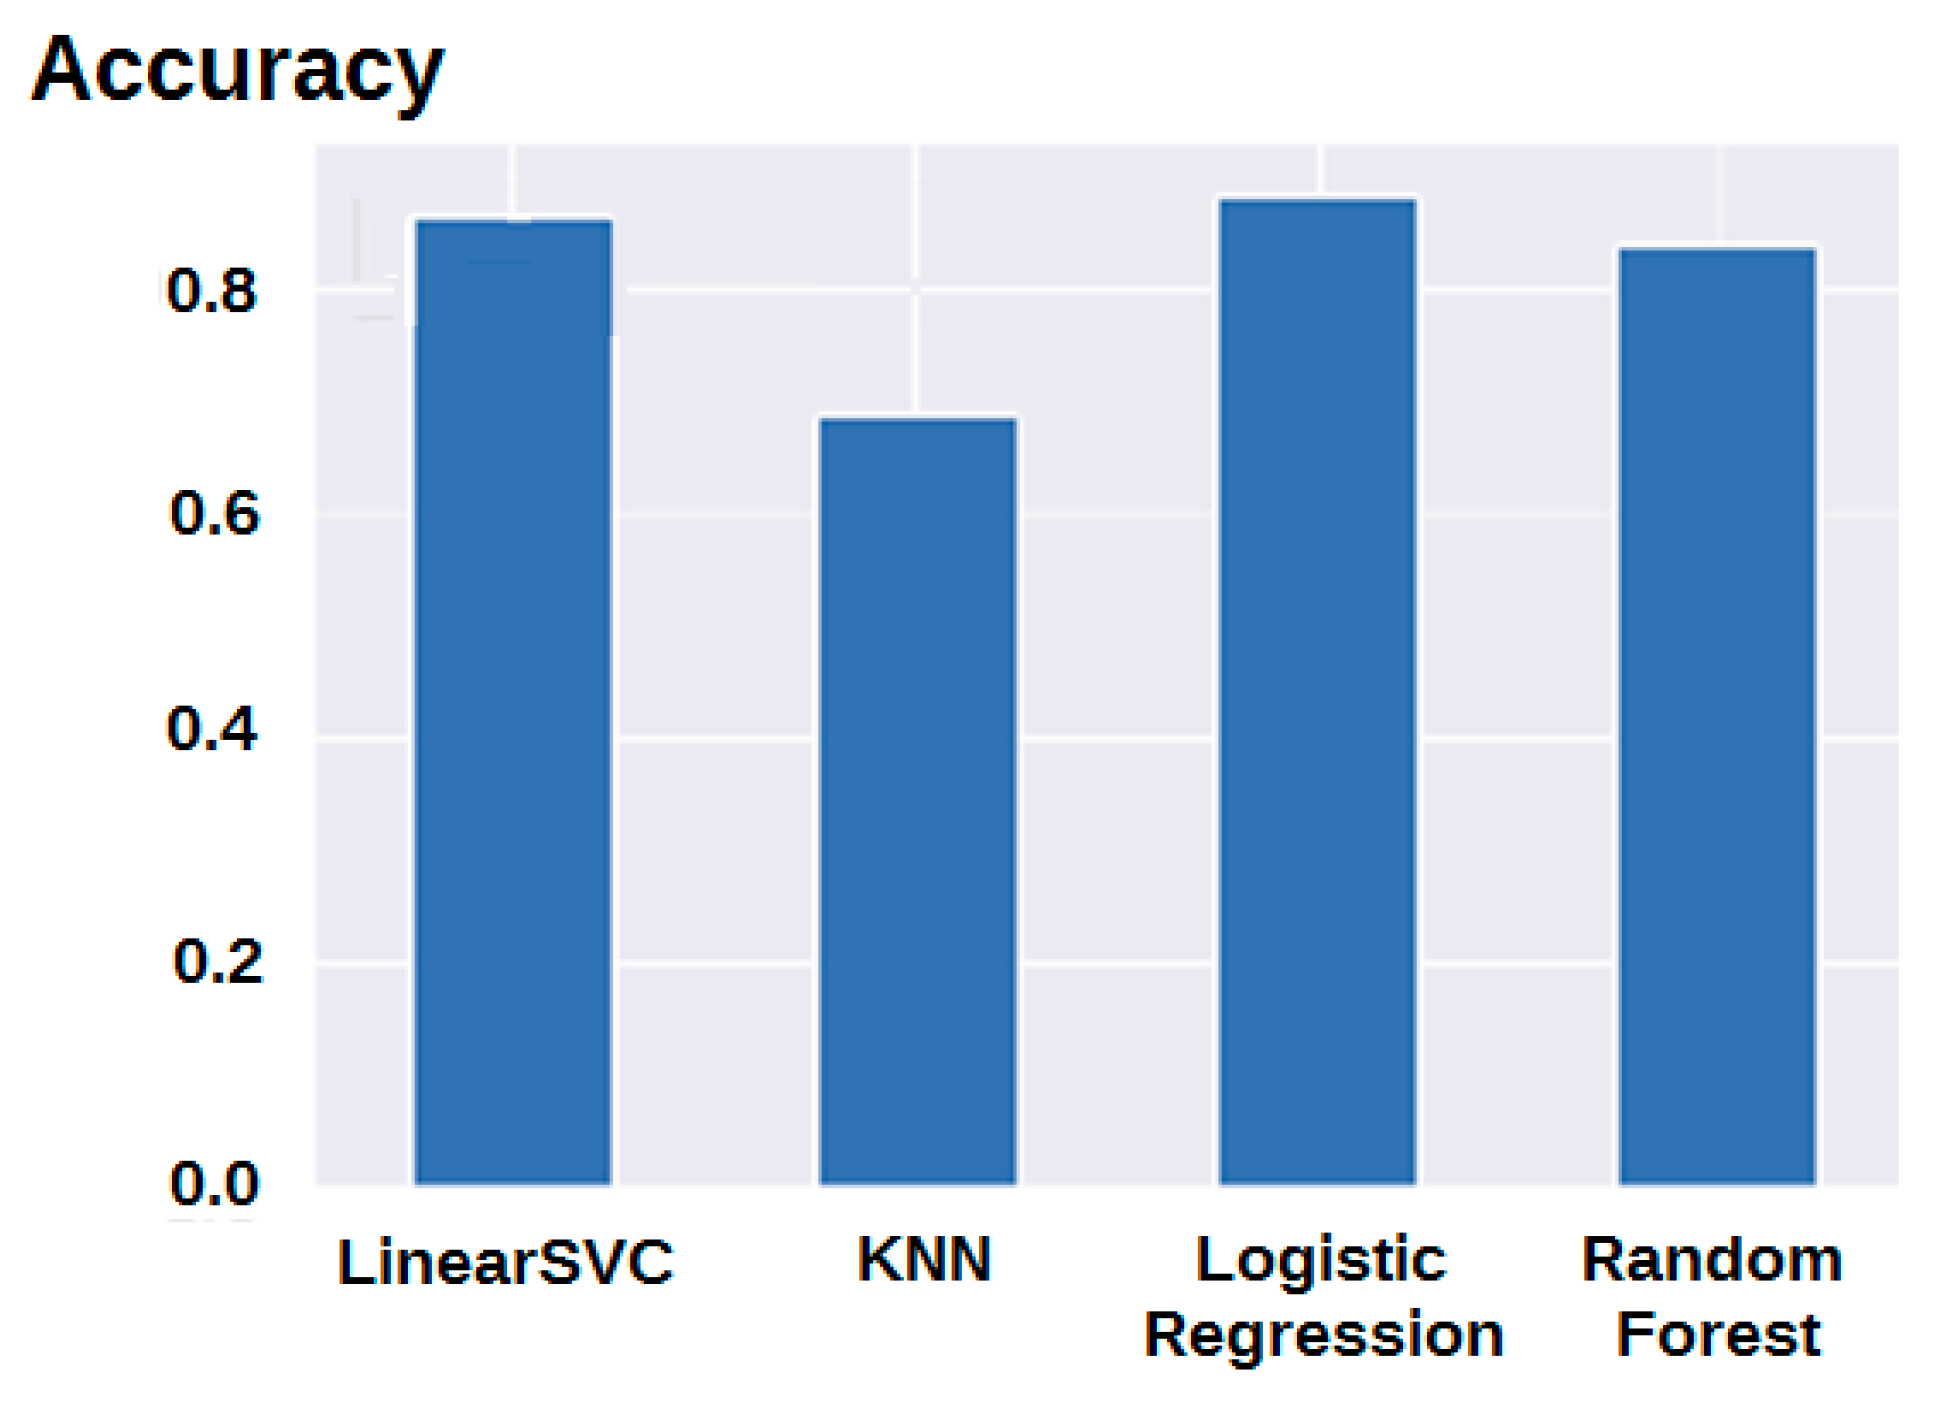
3.1. Modelling Results

To tune the logistic regression model we used the GridSerachCV method. This method tests every single possible combination of hyperparameters and saves the best. During the experiment, we only tuned 2 hyperparameters: “C” and “solver”.
The tuning process returned the following values:
{‘C’: 0.23357214690901212, ‘solver’: ‘liblinear’}
The evaluation of the model, with those parameters, was 0.8852459016393442.
To tune the KNN method, we tried different values of n_neighbours. The train scores exhibited the following values:
1.0,
0.8099173553719008,
0.7727272727272727,
0.743801652892562,
0.7603305785123967,
0.7520661157024794,
0.743801652892562,
0.7231404958677686,
0.71900826446281,
0.6942148760330579,
0.7272727272727273,
0.6983471074380165,
0.6900826446280992,
0.6942148760330579,
0.6859504132231405,
0.6735537190082644,
0.6859504132231405,
0.6652892561983471,
0.6818181818181818,
0.6694214876033058.
The training accuracy score shows how the model fits and generalises to the training data. If, after training, we obtain a model that fits the data well with a large variance then this results in over-fitting and consequently a worse testing accuracy score. This is because the model is skewed to fit the training data and generalises very poorly. The 75.41% score we achieved is good and was sufficient for most predictive applications as it allowed us to identify with high probability those individuals who should be subjected to further, more accurate diagnostics without having to test all individuals. The strategies adopted here can vary further, e.g., if the model is to be further optimised later then the testing accuracy score should not be higher than the training accuracy score, as the model would be too matched to the test dataset. Our approach at this stage focused on two factors: accuracy and low computational cost. Hence looking at the graph, n_neighbours = 11 seemed best (Figure 8). With higher values of n_neighbours the computational costs increased, but the accuracy did not improve.
To tune the random forest classifier model, we used RandomizedSearchCV method. This method searches over a grid of hyperparameters performing n_iter combinations and saves the best. During the experiment only 4 hyperparameters were tuned: “n_estimators”, “max_deph”, “min_simples_split” and “min_simples_leaf”. RandomizedSearchCV tried 20 different combinations of hyperparameters from rf_grid and saved the best ones. The evaluation of the model with these parameters was 0.8688524590163934. The evaluation of the LinearSVC model was 0.8688524590163934. During the experiment we did not make any tuning on this model. All these algorithms were supported by the Scikit-Learn library for classification problems. We compared the results from the different models and logistic regression performed best (Figure 9).
The logistic regression model was very good achieving an AUC = 0.92 (a perfect model would achieve an AUC = 1.0) (Figure 10).
The confusion matrix compares where the model, based on logistic regression, made the right predictions and where it made wrong predictions (Figure 11).
Using the logistic regression model we achieved the following classification report (Table 2).
The cross validation metrics for the classification report are shown in Figure 12.

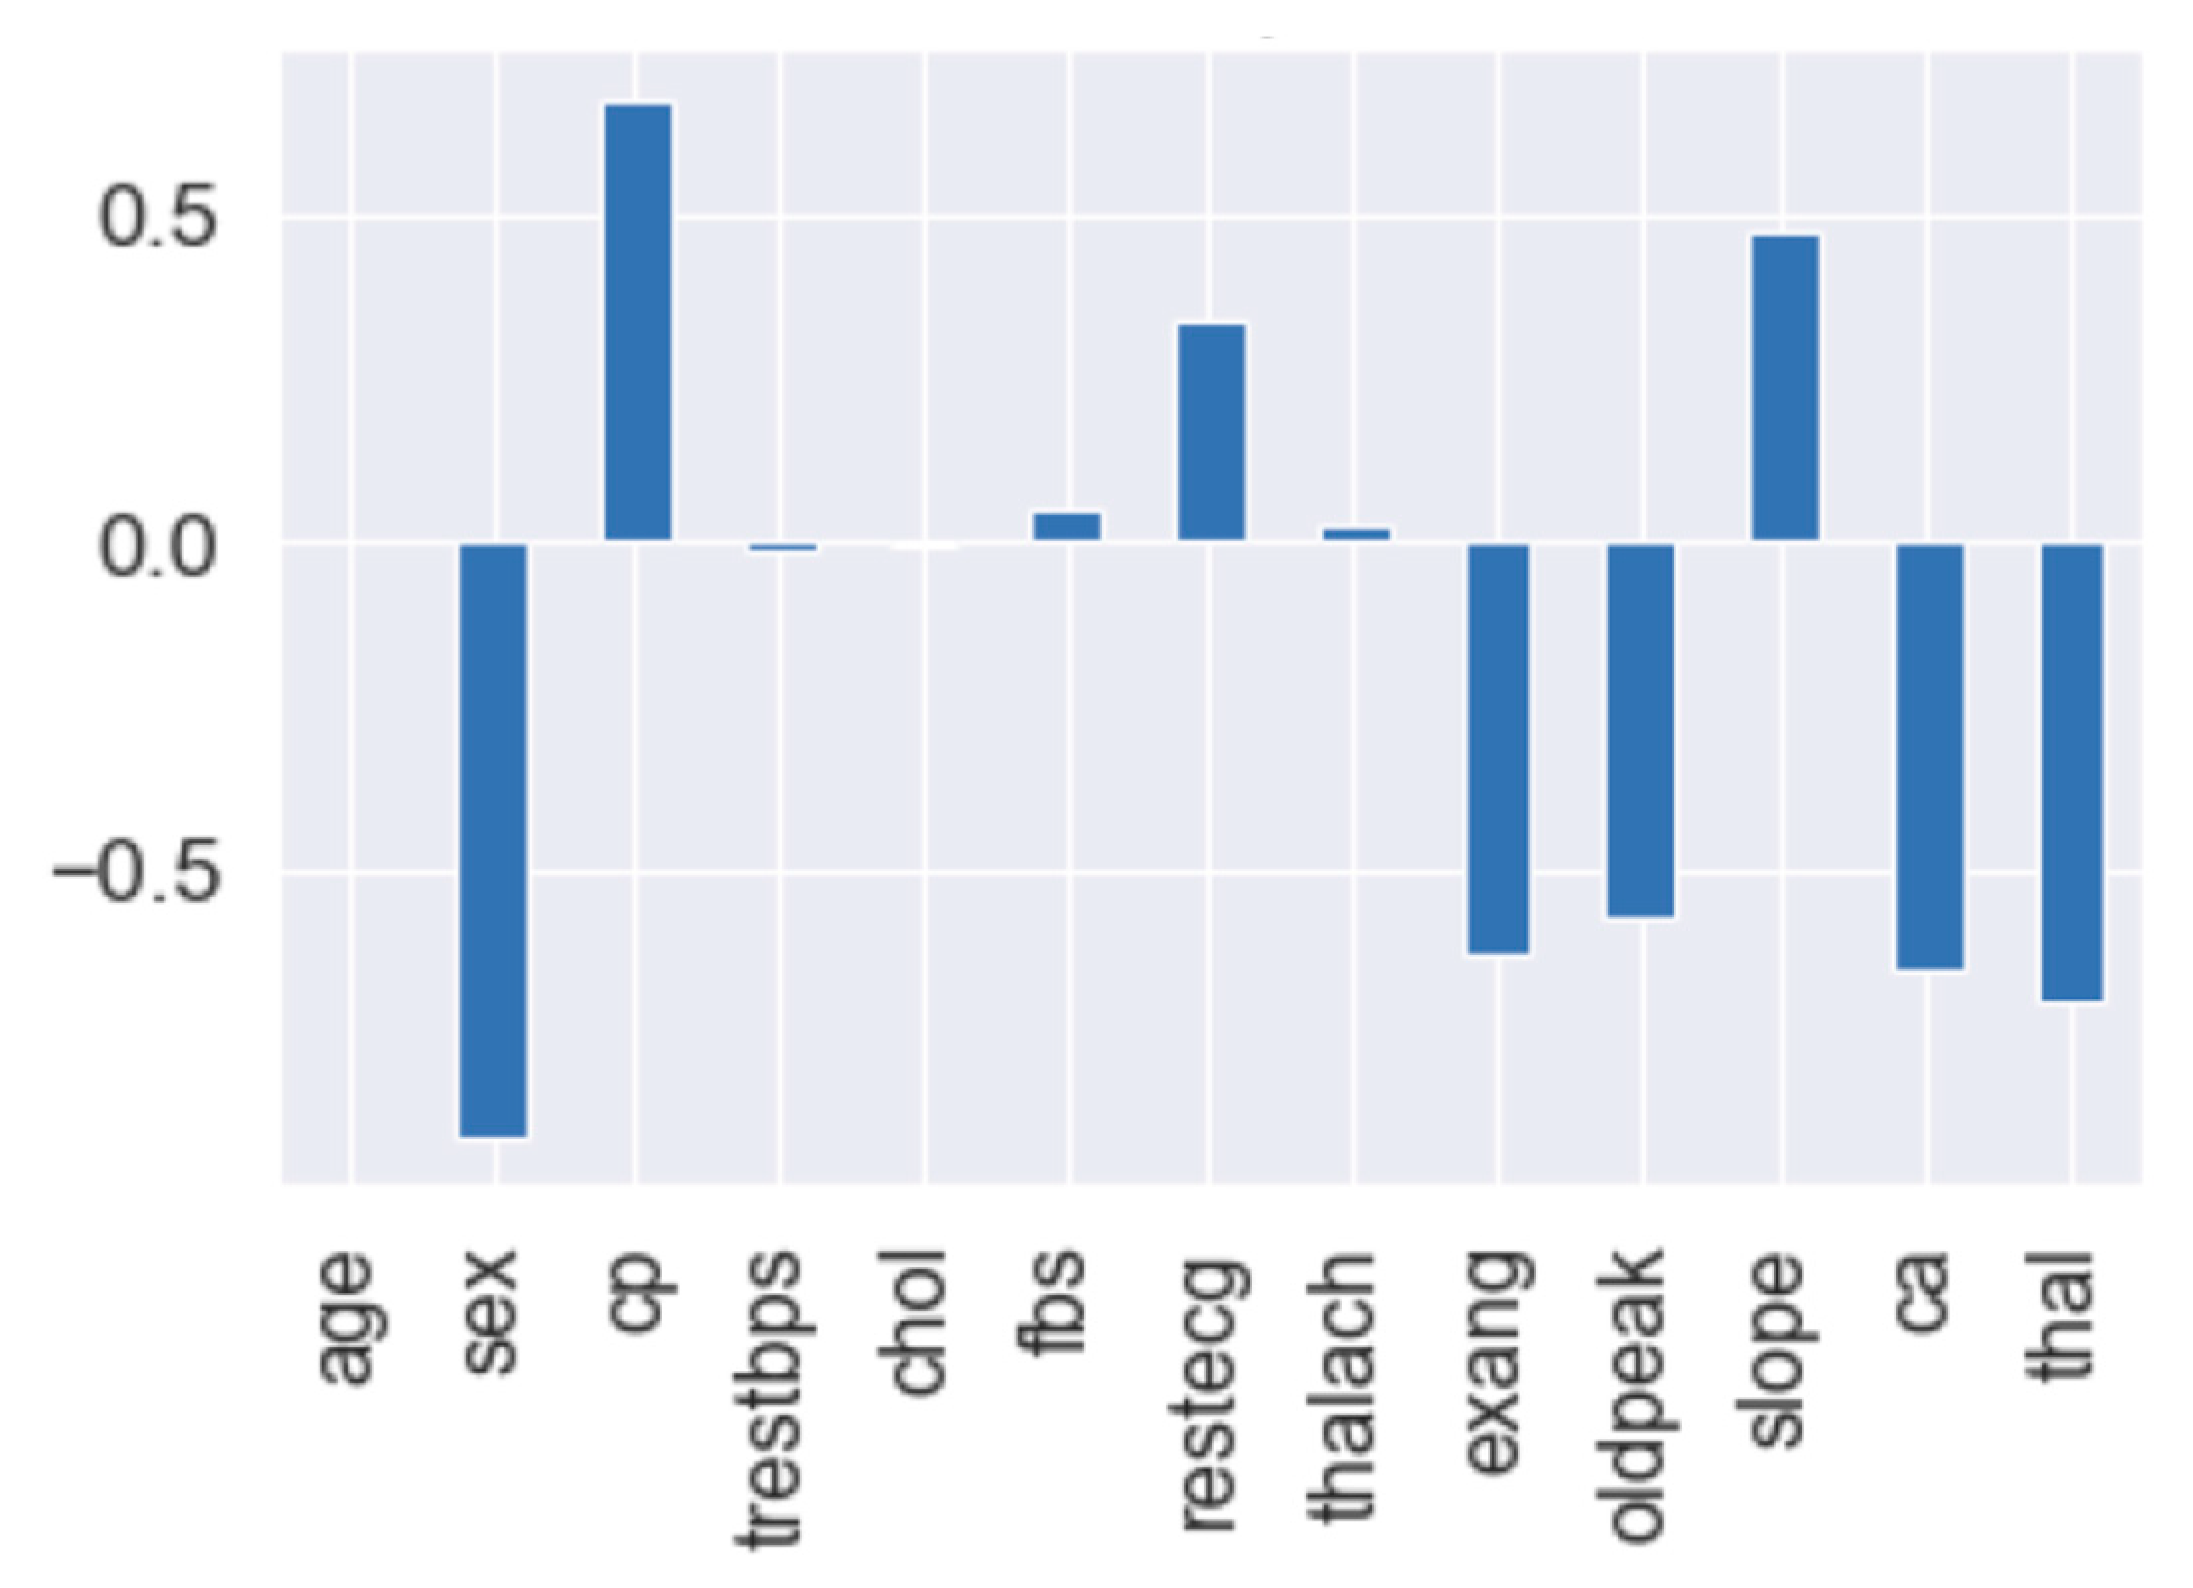
3.2. Feature Importance

For our problem, trying to predict heart disease using a patient’s medical characteristics using the logistic regression algorithm we received the following values for the feature importance:
age: 0.003699223396114675,
sex: −0.9042409779785583,
cp: 0.6747282348693419,
trestbps: −0.011613398123390507,
chol: −0.0017036431858934173,
fbs: 0.0478768694057663,
restecg: 0.33490207838133623,
thalach: 0.024729380915946855,
exang: −0.6312041363430085,
oldpeak: −0.5759099636629296,
slope: 0.47095166489539353,
ca: −0.6516534354909507,
thal: −0.6998421698316164.
The key features are shown in the Figure 13. Surprisingly, the influence of age and cholesterol was negligible small.
The larger the value (bigger bar), the more the feature contributes to the model’s decision. If the value is negative, it means there is a negative correlation. And vice versa for positive values. For example, the sex attribute had a negative value of −0.904, which meat as the value for sex increased, the target value decreased. Factors with the highest positive influence were: cp, restecg and slope; whereas, the factors with the highest negative influence were: sex, exang, oldpeak, ca, and thal.

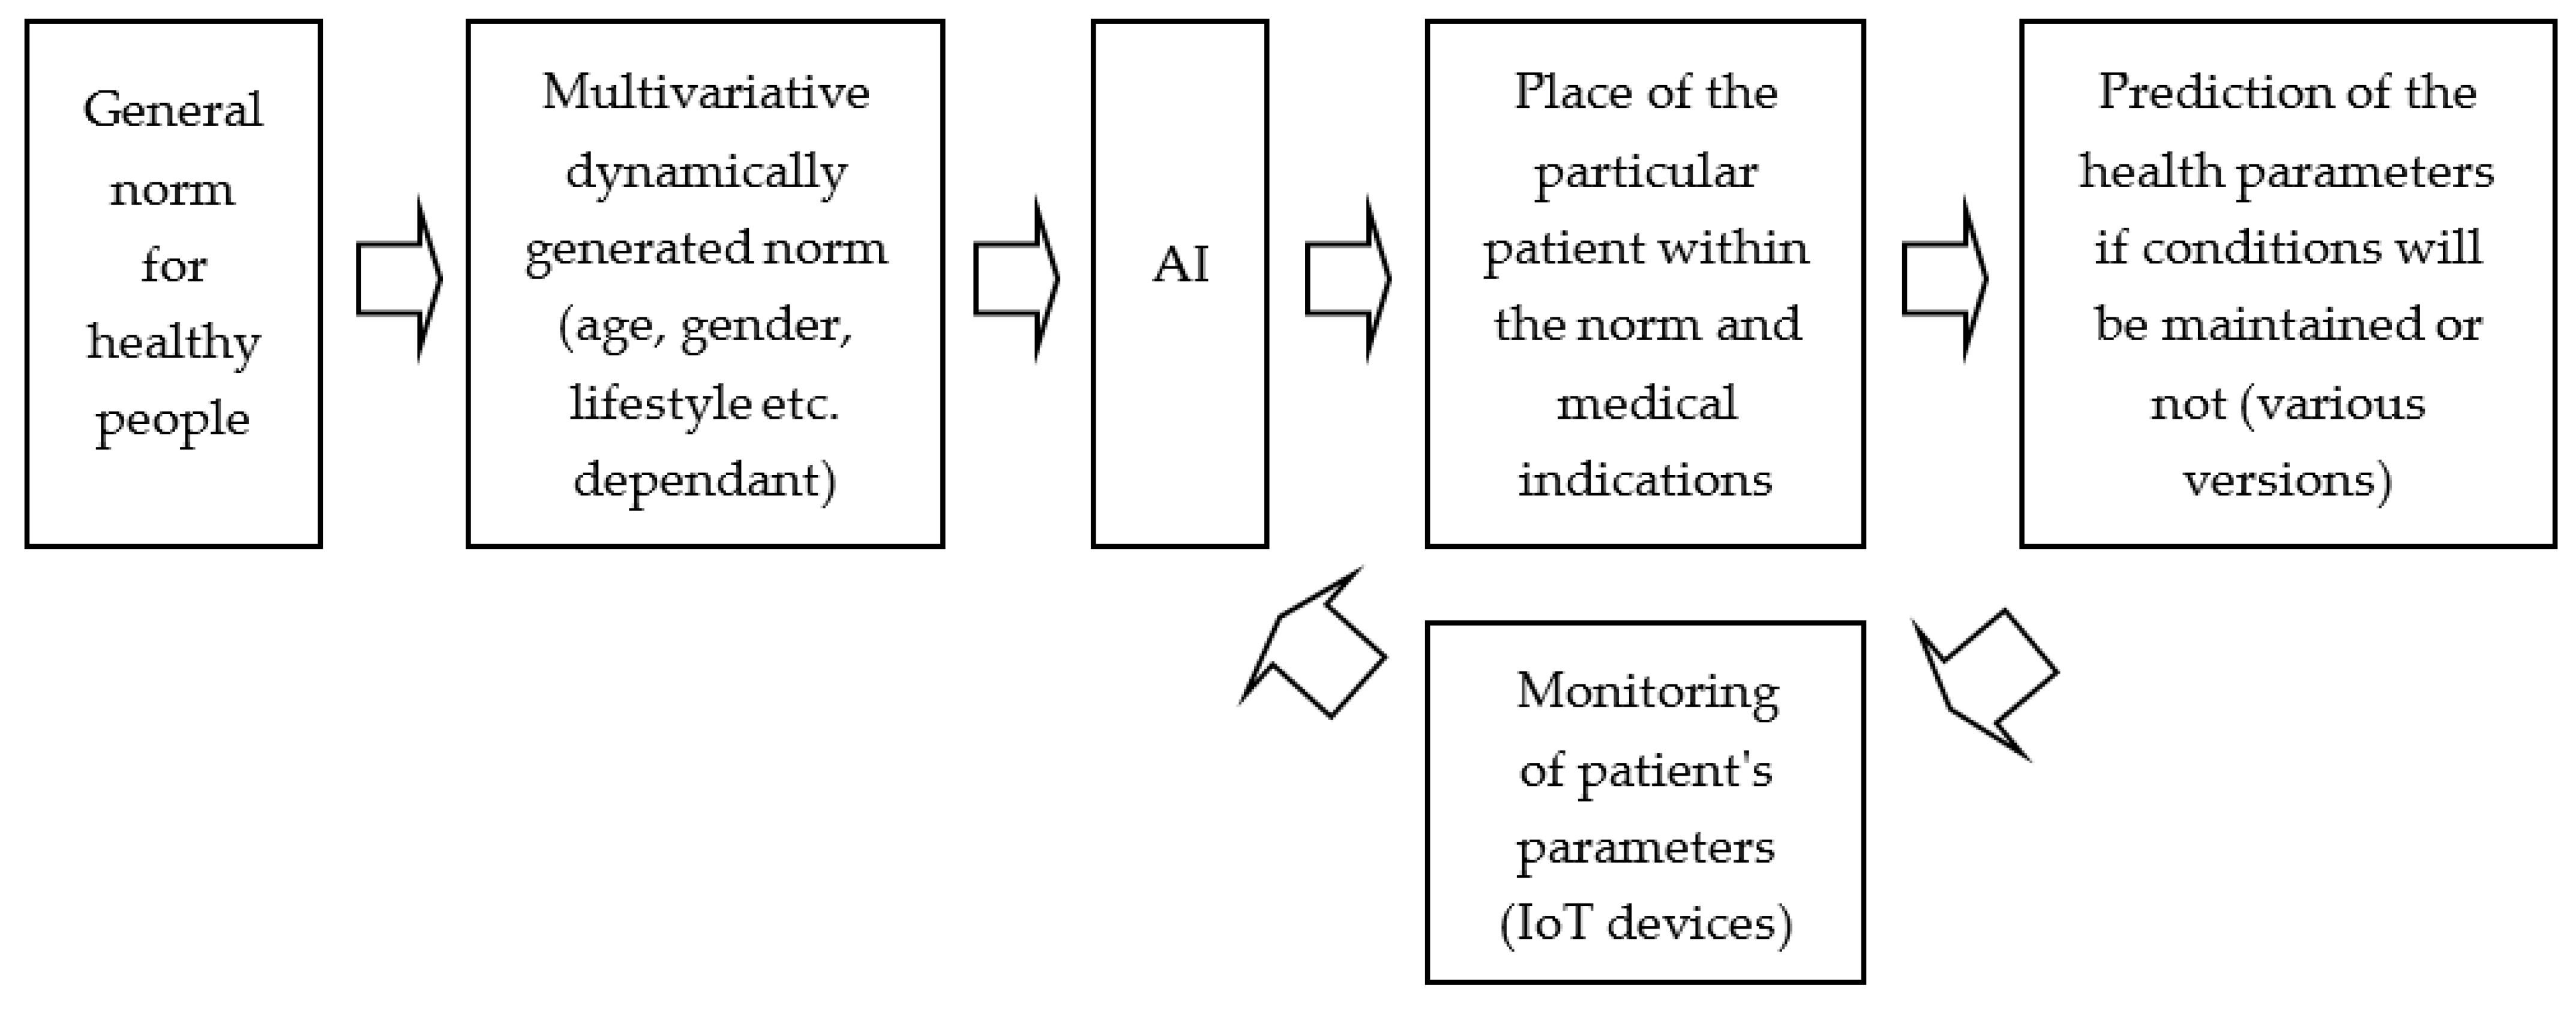
3.3. Predictive Medicine Application

We now know which factors have the greatest impact and can determine the possibility of modifying them in a particular patient (in the case of modifiable factors). In the case of non-modifiable factors, we know which patients fall into high-risk groups, and therefore need to be monitored. This approach increases the efficiency of the care system and the rational use of its resources, allowing us to focus on specific, selected cases.
Comparing the results of successive predictions with a specific patient’s results can be repeated throughout the patient’s life, resulting in more accurate, personalized and predictive results. The accumulation of more data will make it possible to take into account other factors, even local ones (environmental pollution, etc.), that may affect people’s quality of life. The aforementioned approach could be one of the systemic approaches to combat the epidemic of cardiovascular diseases.
There is no doubt that the preventive medicine system needs to be technologically and legally anchored in the healthcare system, above all in terms of the systematicity and scope of the cyclical examinations of healthy and sick people and the automatic accessibility of the data collected in the preventive medicine eHealth systems. It is noteworthy that children as well as the elderly or athletes (as well as all working people) already benefit from a system of periodic examinations.
The proposed artificial intelligent solutions will make better use of the aforementioned opportunities.

4. Discussion

Recent reviews of the application of machine learning to myocardial infarction have attempted to answer at least some the following important issues:
  • identification of knowledge gaps [15]
  • methods for standardizing diagnostic imaging results through reference image exchange between observers and artificial intelligence thus enabling accurate measurements [16].
  • the use of ML to accelerate diagnostic and therapeutic procedures allowing an earlier discharge of the patient from the ward or an early start of rehabilitation [1].
  • the potential to use machine learning methods to create predictive models to improve assessment, including multimarker-based methods in the assessment of complex, multifactorial diseases [17,18].
  • new approaches in cardiac anaesthesia [15].
  • creation and clinical application of hybrid approaches [1].
The prevalence of cardiovascular diseases worldwide, especially in people over 65 years of age, will increase significantly with the ageing of the population, becoming a major socioeconomic problem from the increasing risk of heart attack and stroke, amputation and death. Counteraction is hampered by the fact that, despite its poor prognosis, the above-mentioned group of patients is rarely identified in the early stages of the disease, let alone treated by preventive medicine. This implies the need to search for reliable biomarkers which could contribute to targeted personalized diagnostics, prevention and treatment at very early stages of the disease [17].
Machine learning (ML), increasingly being used to complement conventional statistical modelling (CSM), is rarely compared in different prognosis studies. Therefore, further research is needed that maintains clinical quality standards for prognosis studies [18].
Sixteen years ago, the European EPI-MEDICS project (2001–2004) showed an affordable mobile personal ECG monitor for the early detection of arrhythmia and cardiac ischemia [19]. Despite quick development of these early devices, the number of AI-based studies on MI still remains insufficient. Automation is important in reducing unnecessary hospital admissions: less than 20% of patients screened during emergency hospital admissions have an acute coronary syndrome (ACS) [20]. Advances in diagnostics have already increased the efficiency of care pathways. In two-thirds of patients, acute myocardial infarction can be ruled out on the basis of a sample taken after 1 h [20]. The Troponin-only Manchester Acute Coronary Syndromes (T-MACS) model can be used for ACS prediction using AI [20]. New medical devices enable earlier detection and can analyse large datasets providing pre- and post-operative predictions [21].
ML and deep learning (DL) techniques can lead to more accurate CVD/stroke risk stratification [22]. AI, mainly ANNs, can already extract features with high predictive power from ECGs [23]. Several ECG parameters with prognostic value have already been proposed [24]. Essential application areas for AI in cardiovascular imaging include: patient triage, and clinical decision support [25]. AI can help support the identification of whether destructive changes are developing in healthy myocardium after an ischemic event, which could subsequently develop into fibrous scar tissue. AI can analyse phenomena occurring in ischemic myocardium [26]. For arrhythmias unrelated to atrial fibrillation, therapy is supported, but adequate accuracy and validation of the clinical pathways are required [27]. Artificial intelligence-based cIMT/PA segmentation methods have been developed to monitor the risk of CVD/stroke [28].
Some works have proposed similar ideas but for other diseases: dementia classification using MRI imaging and clinical data [29], and autism spectrum disorder [30]. An important difference is that they looked at neurodegenerative (dementia) or congenital (ASD) conditions, rather than the risk/prediction of the condition in healthy individuals. In this respect, the work on dementia is closer to our conception, but uses a much more complex study (i.e., MRI).

4.1. Limitations of Our Own Study

The processing delay that was observed does not affect the performance of the system in its current development. This was due to the fact that the mobile devices in the system, due to their limited technical capabilities and large number of parameters, were only able to use the pre-learned neural network, while the learning of the network itself took place on the system server or in the cloud (depending on the system configuration).

4.2. Directions for Further Research

The main objectives of further studies should aim to develop and test in clinical practice the current concept of the prevention system and, in particular, remove the processing delay to provide real-time processing. A larger number of subjects would allow for better profiling of patients for their initial more accurate classification into the MI risk groups.
Directions for further research include the area of patient-specific preventive MI medicine consisting of: follow-up visits (e.g., once per month), daily use of accessories such as scales, smart bands, smartphones with appropriate software connected to a central database and clinical AI system [27], use of modifiable risk factors to improve the patient’s health status and MI risk assessment, and inclusion of non-modifiable MI risk factors in AI-based analysis.
Artificial intelligence-based cIMT/PA segmentation methods are being used prototypically to monitor CVD/stroke risk and can be extended to parameters recommended for assessing atherosclerosis in carotid ultrasound [28].
AI techniques provide quicker and more accurate tools for hazard identification, combining the features of extraction and classification which simplifies data analysis, and improves accuracy and robustness. For the aforementioned reasons, AI-based computational diagnostic techniques show great potential in helping healthcare professionals, families and caregivers of patients, and their application in everyday life benefits both patients and at-risk individuals [31].
Opportunities to solve existing problems in medical imaging lie in the wider use of automated data capture, collection and AI-based analysis to predict future patient conditions. This data can be multi-modal, from a variety of sources, downloaded and transmitted in a variety of forms and time intervals, and the synergistic effect allows for a more complete picture in both healthy individuals and patients with various conditions. However, it should be noted that the results from this system will only be a second opinion for the doctor/diagnostician who will be making the specific diagnostic decision—a human being will always be responsible for this.
Improved smart healthcare technology can be beneficial in the short term and will transform healthcare delivery in the long-term too, both for COVID-19 and other diseases (cardiovascular, etc.). Datasets and models sharing, preprint archiving, medical knowledge and experience sharing, e-learning and continuing medical education, medical robotics will grow in importance in the foreseeable future. This will bring an adaptation of personalized prevention, diagnosis, treatment, rehabilitation, and care [32]. Currently, data-driven approaches dominate over model-driven approaches [33,34,35], but it is hoped that hybrid approaches may be dominant in future biomedical reasoning and prediction [36,37,38]. An important method of development may be fuzzy-based models, useful for prediction purposes [39,40]. Even the most complicated sources of the biosignals are possible to use within the proposed system, such as neuroprostheses and brain-computer interfaces [41,42], even for influence of stress assessment [43]. AI models for cardiovascular-related diseases are gradually evolving into a form suitable for wearable and mobile devices [44]. Even the associations between meteorological factors and air pollutants, as well as COVID-19 and the number of acute myocardial infarctions (AMI), should be taken into account when analysing and predicting the data [45,46].

5. Conclusions

The key results obtained in this study show that the prediction of the probability of heart disease is already possible based on a minimal set of characteristics. The parameters cp, restecg and slope had the largest positive effect, while sex, exang, oldpeak, ca, and thal had the largest negative effect. The novelty here is the use of AI for predictive analysis of cardiovascular function and prediction of its future state in a particular patient. This allows for improved pre-clinical care and diagnosis, and predictive accuracy, including preventive medicine.
The current development of AI for predictive analysis of cardiovascular function and prediction of its future state in a specific patient is only in the early stages of research, both in IT and clinical trials. This offers great opportunities to improve the accuracy of diagnosis and the effectiveness of therapy, including preventive medicine. The increased popularity of this type of solution will translate into more data for analysis, inference, prediction and learning, and thus greater efficiency and accuracy of the overall system. It will also allow the refinement of the system’s algorithms and, in some cases, the development of new algorithms that are better tailored to specific disease groups (e.g., diabetes or stroke risk assessment) or populations.

Author Contributions

Conceptualization, I.R., M.K., J.D. and D.M.; methodology, I.R., M.K., J.D. and D.M.; software, M.K. and D.M.; validation, I.R., M.K., J.D. and D.M.; formal analysis, I.R., M.K., J.D. and D.M.; investigation, I.R., M.K., J.D. and D.M.; resources, I.R., M.K., J.D. and D.M.; data curation, M.K.; writing—original draft preparation, I.R., M.K., J.D. and D.M.; writing—review and editing, I.R., M.K., J.D. and D.M.; visualization, I.R., M.K., J.D. and D.M.; supervision, I.R.; project administration, I.R.; funding acquisition, I.R. All authors have read and agreed to the published version of the manuscript.

Funding

This work was supported in part by the grant to maintain research potential of Kazimierz Wielki University (Ministry of Education and Science, grant 2022).

Institutional Review Board Statement

Not applicable.

Informed Consent Statement

Not applicable.

Data Availability Statement

Not applicable.

Acknowledgments

Database creators: 1. Hungarian Institute of Cardiology. Budapest: Andras Janosi, 2. University Hospital, Zurich, Switzerland: William Steinbrunn, 3. University Hospital, Basel, Switzerland: Matthias Pfisterer, 4. V.A. Medical Center, Long Beach and Cleveland Clinic Foundation: Robert Detrano, Donor: David W. Aha (aha ‘@’ ics.uci.edu) (714) 856-8779.

Conflicts of Interest

The authors declare no conflict of interest.

References

  1. Iannattone, P.A.; Zhao, X.; VanHouten, J.; Garg, A.; Huynh, T. Artificial Intelligence for Diagnosis of Acute Coronary Syndromes: A Meta-analysis of Machine Learning Approaches. Can. J. Cardiol. 2020, 36, 577–583. [Google Scholar] [CrossRef] [PubMed]
  2. Wu, Y.; Pan, N.; An, Y.; Xu, M.; Tan, L.; Zhang, L. Diagnostic and Prognostic Biomarkers for Myocardial Infarction. Front. Cardiovasc. Med. 2021, 7, 617277. [Google Scholar] [CrossRef]
  3. Khosravi, F.; Ahmadvand, N.; Bellusci, S.; Sauer, H. The Multifunctional Contribution of FGF Signaling to Cardiac Development, Homeostasis, Disease and Repair. Front. Cell Dev. Biol. 2021, 9, 672935. [Google Scholar] [CrossRef] [PubMed]
  4. Giallauria, F. Editorial to the effect of high-intensity interval training on exercise capacity in post-myocardial infarction patients: A systematic review and meta-analysis. Eur. J. Prev. Cardiol. 2021, 29, 475–484. [Google Scholar] [CrossRef] [PubMed]
  5. Thosar, S.S.; Shea, S.A. Circadian control of human cardiovascular function. Curr. Opin. Pharmacol. 2021, 57, 89–97. [Google Scholar] [CrossRef]
  6. Portaluppi, F.; Tiseo, R.; Smolensky, M.H.; Hermida, R.C.; Ayala, D.E.; Fabbian, F. Circadian rhythms and cardiovascular health. Sleep Med. Rev. 2012, 16, 151–166. [Google Scholar] [CrossRef]
  7. Scheer, F.A.; Hu, K.; Evoniuk, H.; Kelly, E.E.; Malhotra, A.; Hilton, M.F.; Shea, S.A. Impact of the human circadian system, exercise, and their interaction on cardiovascular function. Proc. Natl. Acad. Sci. USA 2010, 107, 20541–20546. [Google Scholar] [CrossRef]
  8. Santos, P. The Role of Cardiovascular Risk Assessme nt in Preventive Medicine: A Perspective from Portugal Primary Health-Care Cardiovascular Risk Assessment. J. Environ. Public Health 2020, 2020, 1639634. [Google Scholar] [CrossRef]
  9. Frenz, W. Handbook Industry 4.0: Law, Technology, Society; Springer: Berlin/Heidelberg, Germany, 2022. [Google Scholar]
  10. Thuemmler, C.; Bai, C. Health 4.0: How Virtualization and Big Data Are Revolutionizing Healthcare; Springer: Berlin/Heidelberg, Germany, 2017. [Google Scholar]
  11. McKinney, W. Pandas: A Foundational Python Library for Data Analysis and Statistics. Available online: https://www.researchgate.net/publication/265194455_pandas_a_Foundational_Python_Library_for_Data_Analysis_and_Statistics (accessed on 2 July 2022).
  12. Harris, C.R.; Millman, K.J.; van der Walt, S.J.; Gommers, R.; Virtanen, P.; Cournapeau, D.; Wieser, E.; Taylor, J.; Berg, S.; Smith, N.J.; et al. Array programming with NumPy. Nature 2020, 585, 357–362. [Google Scholar] [CrossRef] [PubMed]
  13. McGregor, D.M. Mastering Matplotlib; Packt Publishing: Birmingham, UK, 2015. [Google Scholar]
  14. Pedregosa, F.; Varoquaux, G.; Gramfort, A.; Michel, V.; Thirion, B.; Grisel, O.; Blondel, M.; Prettenhofer, P.; Weiss, R.; Dubourg, V.; et al. Scikit-learn: Machine Learning in Python. J. Mach. Learn. Res. 2011, 12, 2825–2830. [Google Scholar]
  15. Spence, J.; Mazer, C.D. The Future Directions of Research in Cardiac Anesthesiology. Adv. Anesth. 2019, 37, 801–813. [Google Scholar] [CrossRef]
  16. Kusunose, K.; Zheng, R.; Yamada, H.; Sata, M. How to standardize the measurement of left ventricular ejection fraction. J. Med. Ultrason. 2021, 49, 35–43. [Google Scholar] [CrossRef]
  17. Saenz-Pipaon, G.; Martinez-Aguilar, E.; Orbe, J.; González Miqueo, A.; Fernandez-Alonso, L.; Paramo, J.A.; Roncal, C. The Role of Circulating Biomarkers in Peripheral Arterial Disease. Int. J. Mol. Sci. 2021, 22, 3601. [Google Scholar] [CrossRef]
  18. Cho, S.M.; Austin, P.C.; Ross, H.J.; Abdel-Qadir, H.; Chicco, D.; Tomlinson, G.; Taheri, C.; Foroutan, F.; Lawler, P.R.; Billia, F.; et al. Machine Learning Compared with Conventional Statistical Models for Predicting Myocardial Infarction Readmission and Mortality: A Systematic Review. Can. J. Cardiol. 2021, 37, 1207–1214. [Google Scholar] [CrossRef]
  19. Rubel, P.; Fayn, J.; Nollo, G.; Assanelli, D.; Li, B.; Restier, L.; Adami, S.; Arod, S.; Atoui, H.; Ohlsson, M.; et al. Toward personal eHealth in cardiology. Results from the EPI-MEDICS telemedicine project. J. Electrocardiol. 2005, 38 (Suppl. S4), 100–106. [Google Scholar] [CrossRef]
  20. Body, R. Acute coronary syndromes diagnosis, version 2.0: Tomorrow’s approach to diagnosing acute coronary syndromes? Turk. J. Emerg. Med. 2018, 18, 94–99. [Google Scholar] [CrossRef]
  21. Kerneis, M.; Nafee, T.; Yee, M.K.; Kazmi, H.A.; Datta, S.; Zeitoun, M.; Afzal, M.K.; Jafarizade, M.; Walia, S.S.; Qamar, I.; et al. Most Promising Therapies in Interventional Cardiology. Curr. Cardiol. Rep. 2019, 21, 26. [Google Scholar] [CrossRef]
  22. Jamthikar, A.; Gupta, D.; Khanna, N.N.; Araki, T.; Saba, L.; Nicolaides, A.; Sharma, A.; Omerzu, T.; Suri, H.S.; Gupta, A.; et al. A Special Report on Changing Trends in Preventive Stroke/Cardiovascular Risk Assessment Via B-Mode Ultrasonography. Curr. Atheroscler. Rep. 2019, 21, 25. [Google Scholar] [CrossRef]
  23. Goto, S.; Goto, S. Application of Neural Networks to 12-Lead Electrocardiography—Current Status and Future Directions. Circ. Rep. 2019, 1, 481–486. [Google Scholar] [CrossRef]
  24. Hayıroğlu, M.İ.; Lakhani, I.; Tse, G.; Çınar, T.; Çinier, G.; Tekkeşin, A.İ. In-Hospital Prognostic Value of Electrocardiographic Parameters Other Than ST-Segment Changes in Acute Myocardial Infarction: Literature Review and Future Perspectives. Heart Lung Circ. 2020, 29, 1603–1612. [Google Scholar] [CrossRef]
  25. Kusunose, K. Radiomics in Echocardiography: Deep Learning and Echocardiographic Analysis. Curr. Cardiol. Rep. 2020, 22, 89. [Google Scholar] [CrossRef]
  26. Willemink, M.J.; Varga-Szemes, A.; Schoepf, U.J.; Codari, M.; Nieman, K.; Fleischmann, D.; Mastrodicasa, D. Emerging methods for the characterization of ischemic heart disease: Ultrafast Doppler angiography, micro-CT, photon-counting CT, novel MRI and PET techniques, and artificial intelligence. Eur. Radiol. Exp. 2021, 5, 12. [Google Scholar] [CrossRef]
  27. Duncker, D.; Ding, W.Y.; Etheridge, S.; Noseworthy, P.A.; Veltmann, C.; Yao, X.; Bunch, T.J.; Gupta, D. Smart Wearables for Cardiac Monitoring-Real-World Use beyond Atrial Fibrillation. Sensors 2021, 21, 2539. [Google Scholar] [CrossRef]
  28. Biswas, M.; Saba, L.; Omerzu, T.; Johri, A.M.; Khanna, N.N.; Viskovic, K.; Mavrogeni, S.; Laird, J.R.; Pareek, G.; Miner, M.; et al. A Review on Joint Carotid Intima-Media Thickness and Plaque Area Measurement in Ultrasound for Cardiovascular/Stroke Risk Monitoring: Artificial Intelligence Framework. J. Digit. Imaging. 2021, 34, 581–604. [Google Scholar] [CrossRef]
  29. Bharati, S.; Podder, P.; Thanh, D.N.H.; Surya Prasath, V.B. Dementia classification using MR imaging and clinical data with voting based machine learning models. Multimed. Tools Appl. 2022, 81, 25971–25992. [Google Scholar] [CrossRef]
  30. Raj, S.; Masood, S. Analysis and Detection of Autism Spectrum Disorder Using Machine Learning Techniques. Procedia Comput. Sci. 2020, 167, 994–1004. [Google Scholar] [CrossRef]
  31. Xie, L.; Li, Z.; Zhou, Y.; He, Y.; Zhu, J. Computational Diagnostic Techniques for Electrocardiogram Signal Analysis. Sensors 2020, 20, 6318. [Google Scholar] [CrossRef]
  32. Nudi, R.; Campagna, M.; Parma, A.; Nudi, A.; Biondi Zoccai, G. Breakthrough healthcare technologies in the COVID-19 era: A unique opportunity for cardiovascular practitioners and patients. Panminerva Med. 2021, 63, 62–74. [Google Scholar] [CrossRef]
  33. Caie, P.D.; Dimitriou, N.; Arandjelović, O. Precision medicine in digital pathology via image analysis and machine learning. Artif. Intell. Deep. Learn. Pathol. 2021, 149–173. [Google Scholar] [CrossRef]
  34. Rojek, I. Neural networks as performance improvement models in intelligent CAPP systems. Control Cybern. 2010, 39, 55–68. [Google Scholar]
  35. Rojek, I.; Jagodziński, M. Hybrid Artificial Intelligence System in Constraint Based Scheduling of Integrated Manufacturing ERP Systems. In Proceedings of the 7th International Conference on Hybrid Artificial Intelligent Systems (HAIS), Salamanca, Spain, 28–30 March 2012; pp. 229–240. [Google Scholar]
  36. Rojek, I.; Mikołajewski, D.; Dostatni, E. Digital twins in product lifecycle for sustainability in manufacturing and maintenance. Appl. Sci. 2021, 11, 31. [Google Scholar] [CrossRef]
  37. Rojek, I.; Mikołajewski, D.; Kotlarz, P.; Macko, M.; Kopowski, J. Intelligent System Supporting Technological Process Planning for Machining and 3D Printing. Bull. Pol. Acad. Sci. Tech. Sci. 2021, 69, e136722. [Google Scholar]
  38. Rojek, I.; Kowal, M.; Stoic, A. Predictive compensation of thermal deformations of ball screws in cnc machines using neural networks. Teh.-Tech. Gaz. 2017, 24, 1697–1703. [Google Scholar] [CrossRef]
  39. Mikołajewski, D.; Prokopowicz, P. Effect of COVID-19 on Selected Characteristics of Life Satisfaction Reflected in a Fuzzy Model. Appl. Sci. 2022, 12, 7376. [Google Scholar] [CrossRef]
  40. Prokopowicz, P.; Mikołajewski, D. Fuzzy Approach to Computational Classification of Burnout—Preliminary Findings. Appl. Sci. 2022, 12, 3767. [Google Scholar] [CrossRef]
  41. Konieczny, M.; Pakosz, P.; Domaszewski, P.; Błaszczyszyn, M.; Kawala-Sterniuk, A. Analysis of Upper Limbs Target-Reaching Movement and Muscle Co-Activation in Patients with First Time Stroke for Rehabilitation Progress Monitoring. Appl. Sci. 2022, 12, 1551. [Google Scholar] [CrossRef]
  42. Podpora, M.; Gardecki, A.; Beniak, R.; Klin, B.; Vicario, J.L.; Kawala-Sterniuk, A. Human Interaction Smart Subsystem—Extending Speech-Based Human-Robot Interaction Systems with an Implementation of External Smart Sensors. Sensors 2020, 20, 2376. [Google Scholar] [CrossRef]
  43. Zolubak, M.; Grochowicz, B.; Pelc, M.; Kawala-Sterniuk, A. Stress analysis recorded in the EEG signal based on mathematical markers. In Proceedings of the 2019 24th International Conference on Methods and Models in Automation and Robotics (MMAR), Międzyzdroje, Poland, 26–29 August 2019; pp. 625–628. [Google Scholar]
  44. Lee, S.; Chu, Y.; Ryu, J.; Park, Y.J.; Yang, S.; Koh, S.B. Artificial Intelligence for Detection of Cardiovascular-Related Diseases from Wearable Devices: A Systematic Review and Meta-Analysis. Yonsei Med. J. 2022, 63, S93–S107. [Google Scholar] [CrossRef]
  45. Kim, A.; Jung, J.; Hong, J.; Yoon, S.J. Time series analysis of meteorological factors and air pollutants and their association with hospital admissions for acute myocardial infarction in Korea. Int. J. Cardiol. 2021, 322, 220–226. [Google Scholar] [CrossRef]
  46. Kim, D.W.; Byeon, K.H.; Kim, J.; Cho, K.D.; Lee, N. The Correlation of Comorbidities on the Mortality in Patients with COVID-19: An Observational Study Based on the Korean National Health Insurance Big Data. J. Korean Med. Sci. 2020, 35, e243. [Google Scholar] [CrossRef]
Figure 1. General idea of AI-based system of preventive medicine (own proposal).
Applsci 12 09596 g001
Figure 2. SWOT analysis for AI-based system of preventive medicine.
Applsci 12 09596 g002
Figure 3. Distribution of patients’ age (N = 303, aged 54.37 ± 9.08).
Applsci 12 09596 g003
Figure 4. Sex and risk of MI.
Applsci 12 09596 g004
Figure 5. Age, blood pressure, and risk of MI.
Applsci 12 09596 g005
Figure 6. Chest pain and risk of MI.
Applsci 12 09596 g006
Figure 7. Correlation matrix.
Applsci 12 09596 g007
Figure 8. Training accuracy scores and testing accuracy scores for the KNN model.
Applsci 12 09596 g008
Figure 9. Models comparison: Logistic regression model exhibited the highest accuracy.
Applsci 12 09596 g009
Figure 10. Receiver operating characteristic curve for the logistic regression model.
Applsci 12 09596 g010
Figure 11. Confusion matrix.
Applsci 12 09596 g011
Figure 12. Cross-Validated metrics.
Applsci 12 09596 g012
Figure 13. Feature importance.
Applsci 12 09596 g013
Table 1. Features of the study group.
No.Feature NameDescription
1.ageAge in years
2.sex1 = male
0 = female
3.cpChest pain type:
  • 0: Typical angina: chest pain related decrease blood supply to the heart
  • 1: atypical angina: chest pain not related to heart
  • 2: non-anginal pain: typically, oesophageal spasms (non-heart related)
  • 3: Asymptomatic: chest pain not showing signs of disease
4.trestbpsResting blood pressure (in mm Hg on admission to the hospital)
  • anything above 130–140 is typically cause for concern
5.cholSerum cholesterol in mg/dl
  • serum = LDL + HDL + 0.2 * triglycerides
  • above 200 is cause for concern
6.fbsFasting blood sugar > 120 mg/dl (1 = true; 0 = false)
  • ‘>126’ mg/dL signals diabetes
7.restecgResting electrocardiographic results
  • 0: Nothing to note
  • 1: ST-T Wave abnormality–can range from mild symptoms to severe problems–signals non-normal heartbeat
  • 2: Possible or definite left ventricular hypertrophy–Enlarged heart’s main pumping chamber
8.thalachMaximum heart rate achieved
9.exangExercise induced angina (1 = yes; 0 = no)
10.oldpeakST depression induced by exercise relative to rest
  • looks at stress of heart during exercise
  • unhealthy heart will stress more
11.slopeThe slope of the peak exercise ST segment
  • 0: Upsloping: better heart rate with exercise (uncommon)
  • 1: Flat sloping: minimal change (typical healthy heart)
  • 2: Down sloping: signs of unhealthy heart
12.caNumber of major vessels (0–3) coloured in fluoroscopy
  • coloured vessel means the doctor can see the blood passing through
  • the more blood movement the better (no clots)
13.thalThallium stress result
  • 1, 3: normal
  • 6: fixed defect: used to be defect but ok now
  • 7: reversable defect: no proper blood movement when exercising
14.targetHave disease or not (1 = yes, 0 = no) (= the predicted attribute)
* in feature no. 4 means multiplication sign
Table 2. Classification Report.
PrecisionRecallF1-ScoreSupport
accuracy 0.8961
macro avg0.890.880.8861
weighted avg0.890.890.8961
Publisher’s Note: MDPI stays neutral with regard to jurisdictional claims in published maps and institutional affiliations.

