Article

Geodetic Upper Crust Deformation Based on Primary GNSS and INSAR Data in the Strymon Basin, Northern Greece—Correlation with Active Faults

1
School of Mineral Resources Engineering, Technical University of Crete, 73100 Chania, Greece
2
Laboratory of Mineralogy and Geology, Department of Natural Resources Development & Agricultural Engineering, Agricultural University of Athens, 11855 Athina, Greece
3
Institute of Geodynamics, National Observatory of Athens, 11810 Athina, Greece
4
Department of Physical and Environmental Geography, School of Geology, Aristotle University of Thessaloniki, 54124 Thessaloniki, Greece
5
School of Rural and Surveying Engineering, Aristotle University of Thessaloniki, 54124 Thessaloniki, Greece
*
Author to whom correspondence should be addressed.
Appl. Sci. 2022, 12(18), 9391; https://doi.org/10.3390/app12189391
Submission received: 4 August 2022 / Revised: 9 September 2022 / Accepted: 15 September 2022 / Published: 19 September 2022

Abstract

:
The Strymon basin (Northern Greece) belongs to the geodynamically active regime of the Aegean and, as expected, it hosts active faults. Nevertheless, the study area exhibits a low instrumentally and historically recorded seismicity. In order to comprehend the crustal deformation, we implemented GNSS- and InSAR-based techniques. Global Navigation Satellite System (GNSS) primary geodetic data recorded by 32 permanent stations over 7 years were analyzed and input in the triangulation methodology so as to calculate a series of deformational parameters. Moreover, a geostatistical methodology indicated the spatial distribution of each parameter, showing strain delimited up to 2750 × 109. These results are in broad agreement with palaeoseismological surveys and active fault mapping. Moreover, InSAR analysis, based on a 6-year data recording, concluded that no horizontal rates have been traced in the E–W direction; if they do exist, they would be below resolution (less than 2 mm/yr). Peak vertical subsidence values of a few mm/yr are traced towards the hanging wall of the Serres fault zone within the Quaternary sediments at the eastern margin of Strymon basin but are attributed mainly to groundwater extraction. However, it is noteworthy that geodetic strain analysis implies: (a) that a couple of areas need further study to trace potentially active faults by palaeoseismological means; (b) the fault trace of the Serres fault zone might be further prolonged 8–10 km eastwards, where Quaternary sediments cover the fault.

1. Introduction

The advance of Global Navigation Satellite System (GNSS) technology is a valuable asset for the study of crustal deformation, providing insights to the strain and velocity fields and, furthermore, to the geodynamic evolution of a region (e.g., [1,2]). Crustal deformation is the result of elastic strain accumulation and, when a threshold is exceeded, almost all of the elastic deformation turns permanent by fault rupturing [3] and, consequently, into earthquake genesis. Mapping and measuring strain rates by combining GNSS and Interferometric SAR provides not only a significant temporal resolution, but, most importantly, a high spatial resolution and coverage, which are essential to fault-specific seismic hazard assessment [4]. The strain rate can be calculated by applying geological (e.g., [5]), seismological (e.g., [6]), and geodetic methods (e.g., [7,8]), or a combination of these [9]. During the last few decades, the latter has mostly been based on the continuous monitoring of a permanent GNSS station network and/or Interferometric Synthetic Aperture Radar (InSAR), providing time series [10] which are well suited to study interseismic strain accumulation (e.g., [11]).
Satellite geodetic analysis is a useful tool for estimating the deformation of the upper crust in a regional scale. Although it covers a relatively short-term period of the seismic cycle (a few years up to a few decades) that maybe inadequate for capturing the full length (which can range from a few hundred up to several thousands of years), it provides a valuable extended snapshot of the present-day deformation field. As a result, it must be emphasized that the estimated short-term geodetic rate may not necessarily reflect the long-term deformation rate, as the latter may not be stable during the seismic cycle [12,13]. Moreover, no conclusion can be drawn about the maturity stage of the fault, and, hence, the time of the next rupture. Nevertheless, satellite geodesy can depict the strain accumulation rate along known faults or along faults which were never mapped before with conventional techniques or provide important strain rate thresholds.
Our study area consists of the Strymon basin in North Greece, which develops in a NW–SE direction from the Greek–Bulgarian border down to the estuary in the Orphanos Gulf (North Aegean Sea). The basin is bounded by active faults controlling the marginal topography, causing subsidence, while low strain rates (30–70 × 10−9/yr) are documented by broad-coverage geodetic studies [7,14,15,16,17]. Low strain rates infer long seismic recurrence intervals; as a result, many faults have not been activated during the historically and instrumentally recorded periods in earthquake catalogues. Moreover, the extracted geological rates are elusive or subtle due to low strain rate per fault, and seismological data are insufficient due to the long recurrence intervals and the incompleteness of the historical earthquake record. Hence, geodetic data are valuable in such a tectonic regime.
The geodetic datasets’ processing is based on the triangulation methodology (its basic principle is based on combinations of three different GNSS stations), while the extracted results are further geostatistically processed, implementing interpolation (kriging) methodology, in order to determine the results’ spatial distribution in a grid pattern.
Taking all the above into account, the scope of this study is to: (i) estimate the upper crust deformation, based on primary geodetic data, (ii) offer a comparison between GNNS and InSAR results, and (iii) correlate geodetically extracted strain with the surrounding active faults and define the potential seismic hazard.

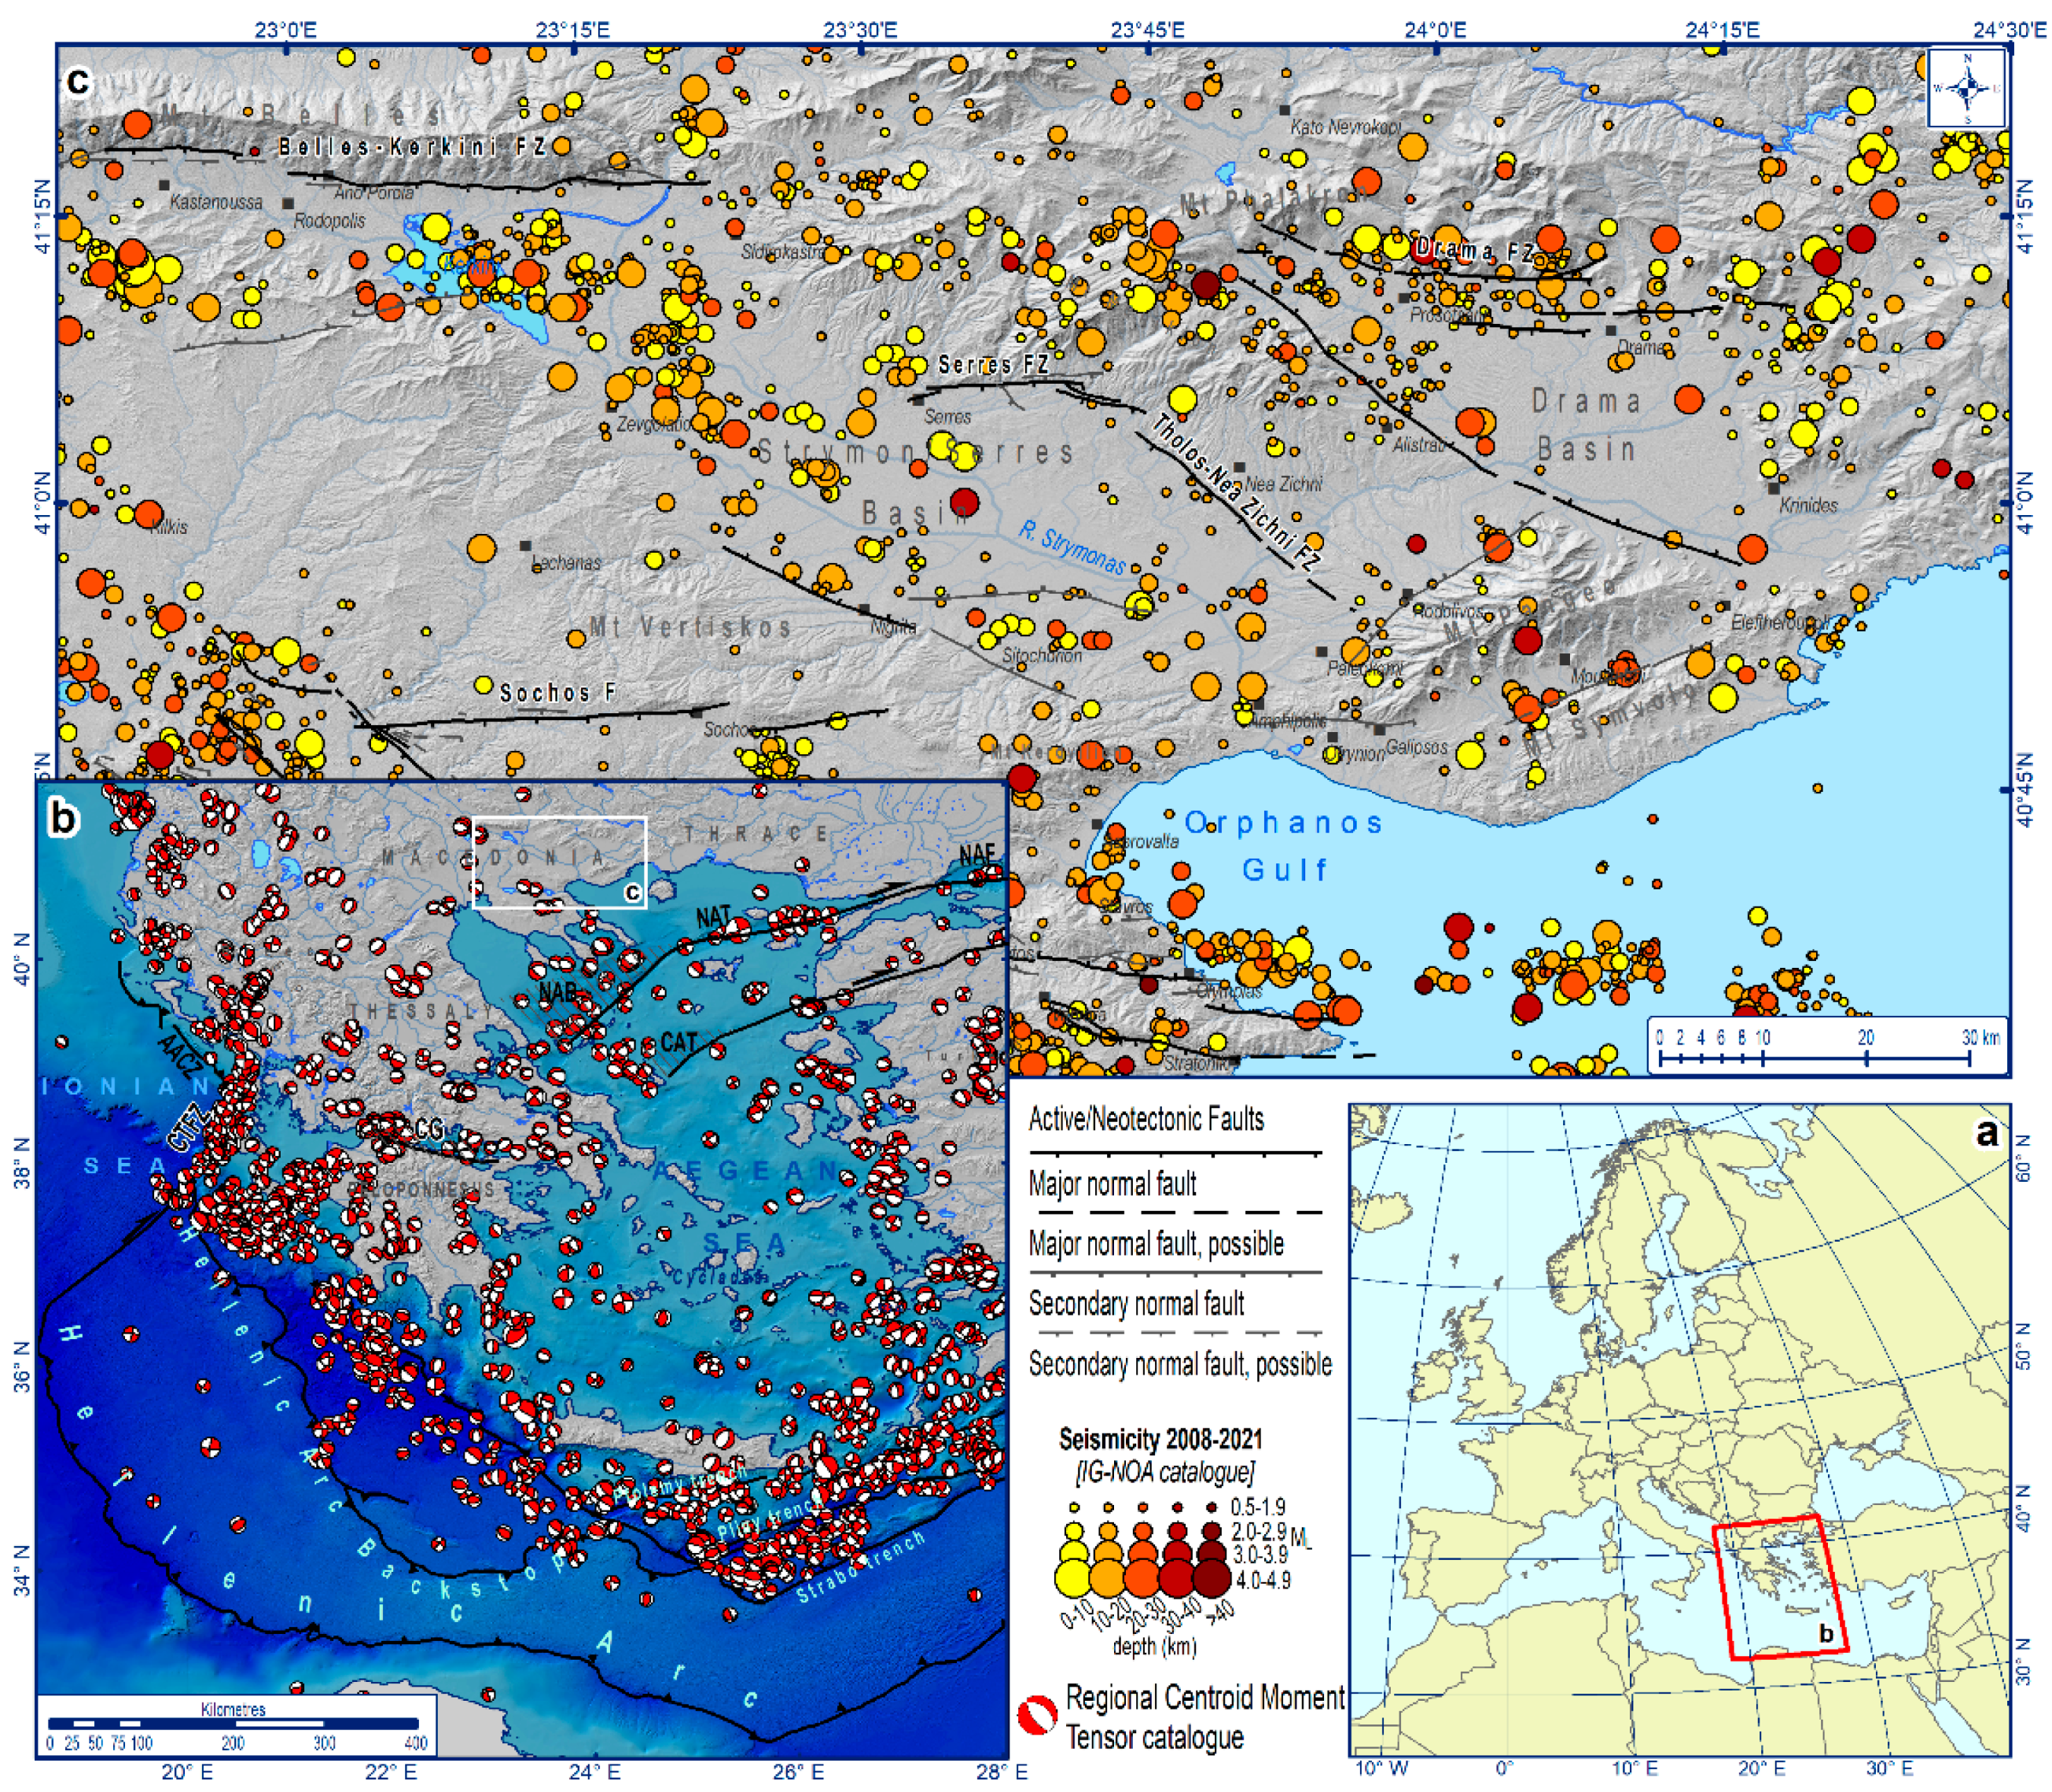
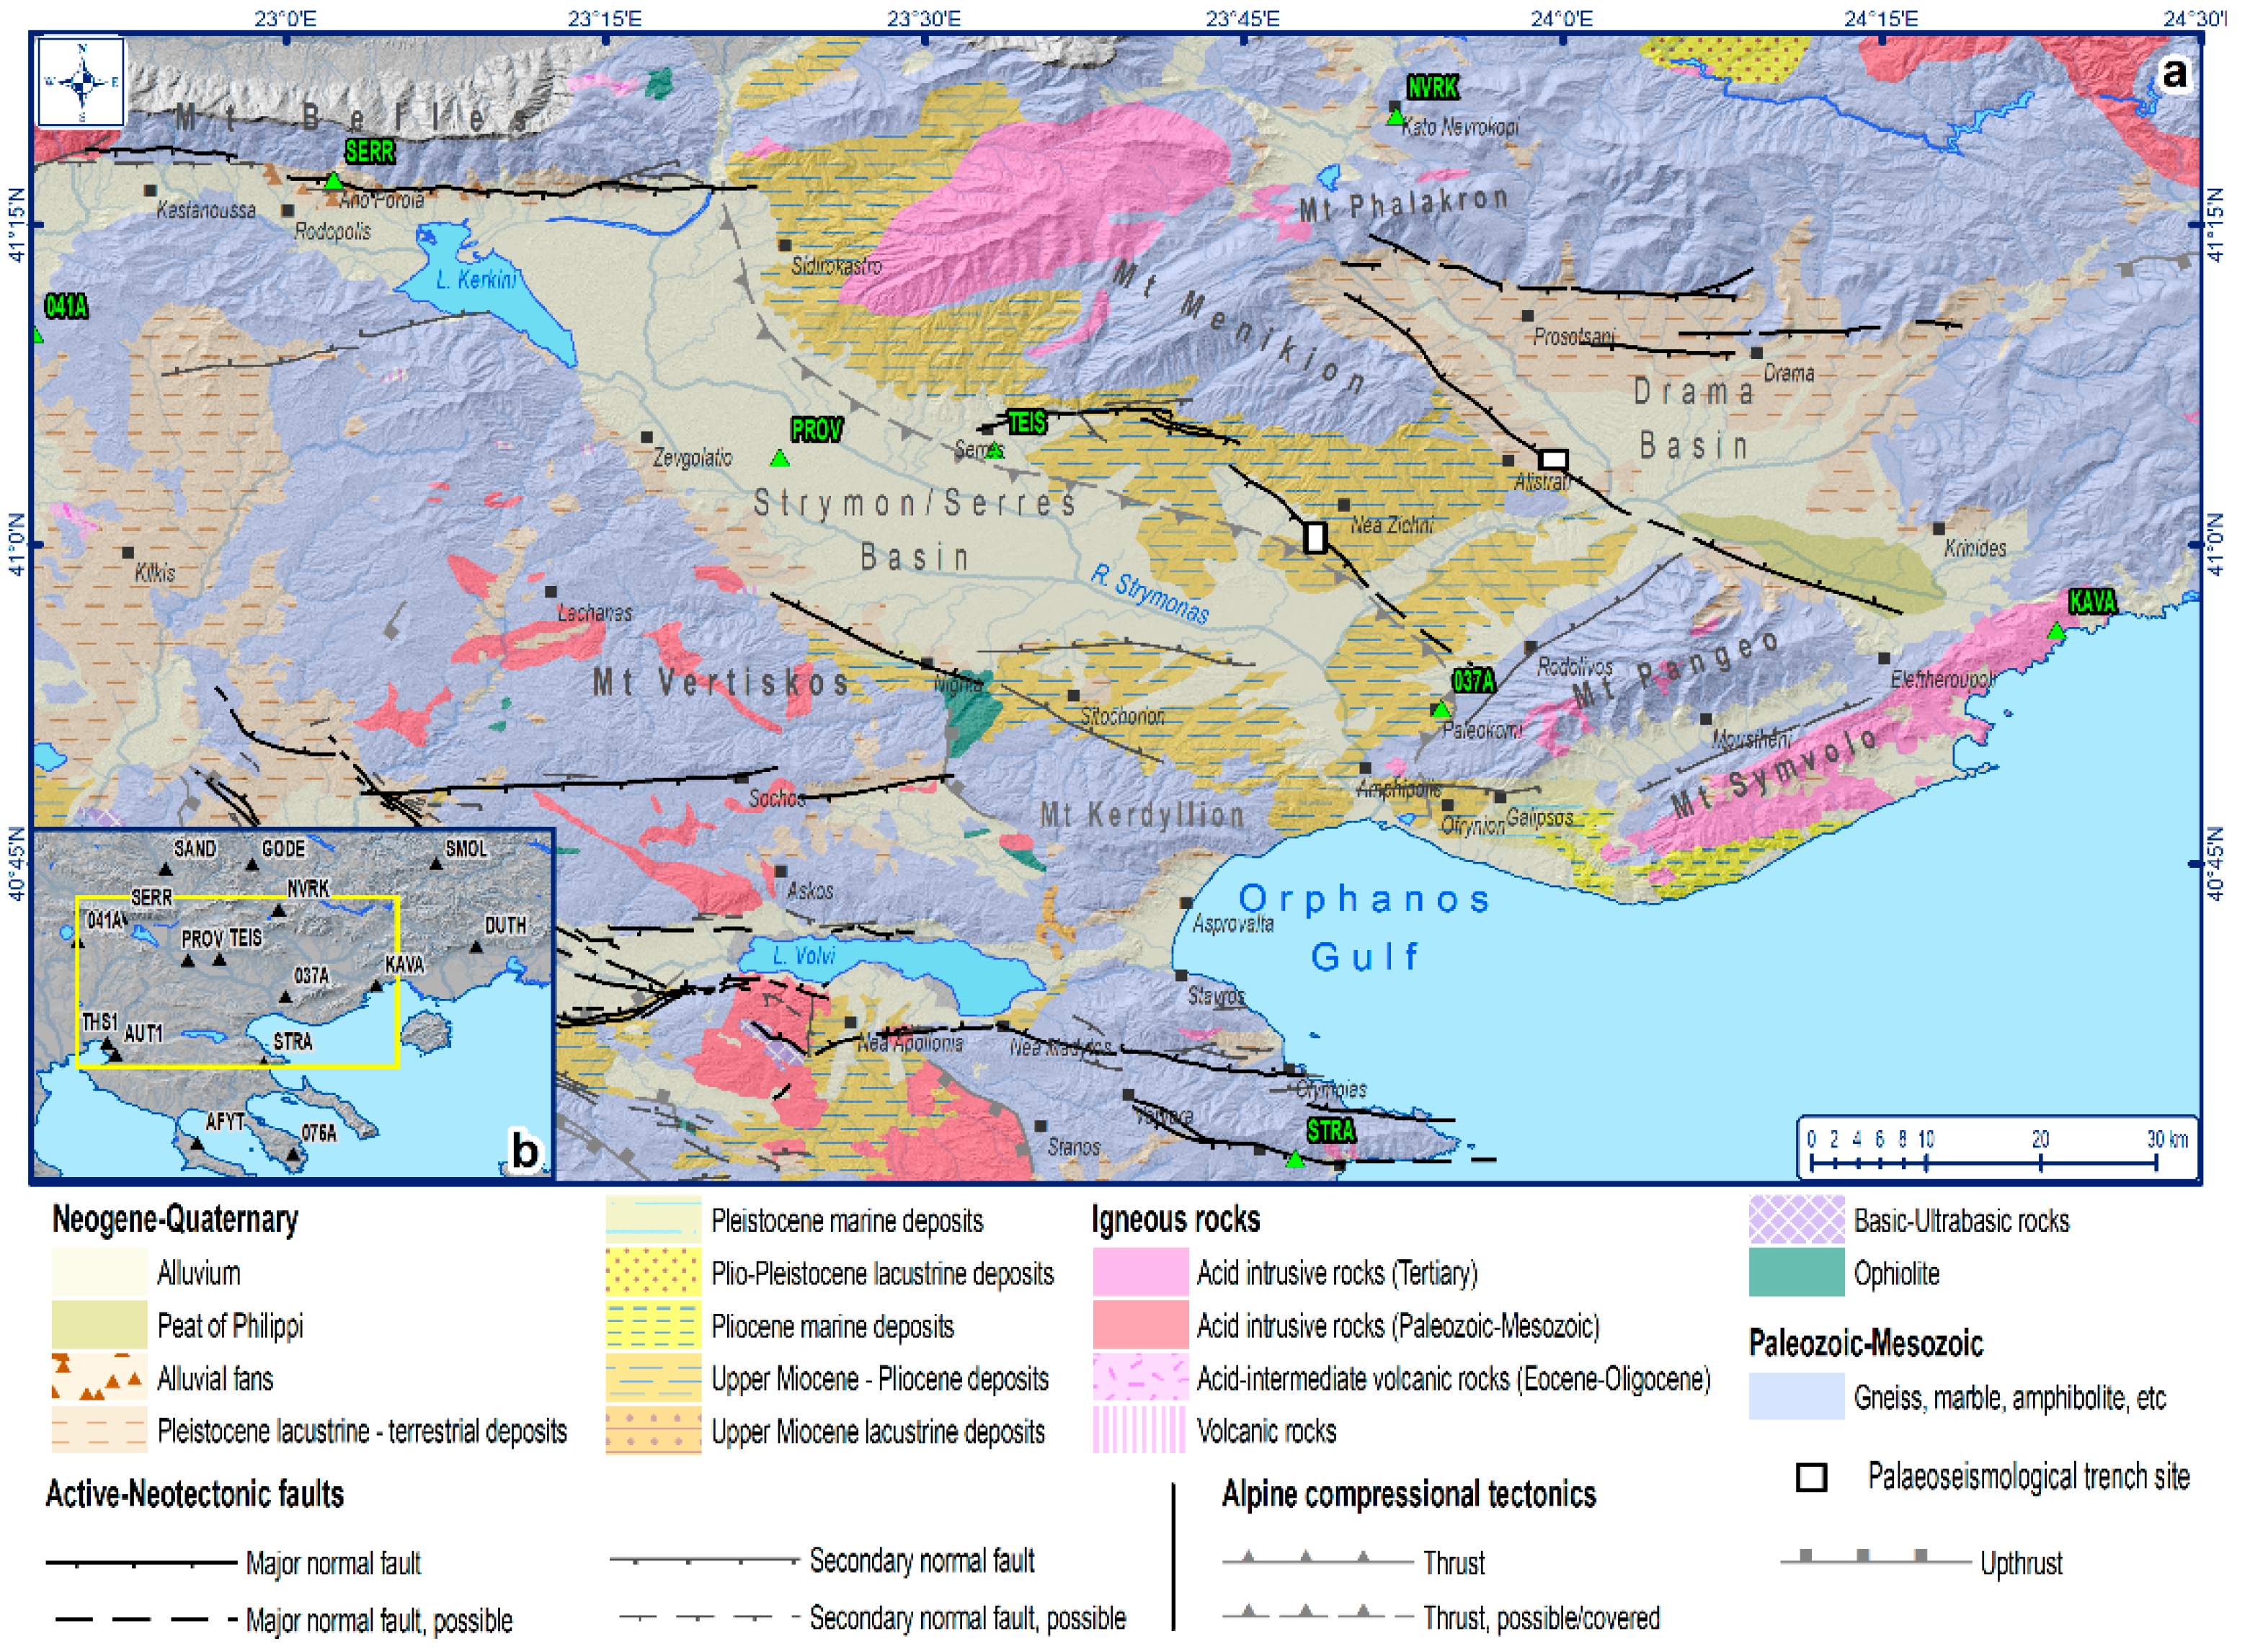
2. Geodynamic Setting and Tectonic Pattern

Our study area, located in Central-Eastern Macedonia (mainland Greece), belongs to the broader extensional regime which prevails after the southward migration and roll-back of the Hellenic Arc since the Early Miocene (e.g., [18,19,20,21,22]). The variously proposed (micro-) plate models for the broader Aegean and Anatolian regions (e.g., [23] and references therein) primarily suggest that Central-Eastern Macedonia lies either on an undivided Eurasian plate overthrusting the African plate and undergoing internal deformation, or on a separated Eurasian plate into smaller micro-plates, such as the stable Eurasian to the north and the Aegean and the Anatolian to the south, all overriding the African plate.
The dominant structure north of the Hellenic Arc is the North Anatolian Fault (NAF) that accommodates 24–30 mm/yr of dextral motion [14,24] and its western prolongation in the Aegean Sea, i.e., the North Aegean Trough (NAT) and, further to the west, the North Aegean Basin (NAB). Whereas NAT is a quasi-pure shear fault zone, the NAB is characterized by transtensional deformation and represents a transitional region, which links pure strike-slip faulting along the NAF and pure extension in central Greece (e.g., [25,26]). This lithospheric-scale transcurrent tectonic structure is believed by many researchers to represent the northern margin of the Aegean–Anatolian microplate(s), along which the latter slides westwards, pushing the former to the SW and affecting the surrounding area, including Macedonia and Thrace (North Greece), by forming a transtensional field. The same stress field is responsible for the formation of large, tectonically controlled basins usually delimited by antithetic normal, dip-slip, tectonically active faults [18,20,27,28,29,30,31,32,33,34,35,36,37]. Although the favorable faulting direction is mostly E–W, i.e., perpendicular to the modern N–S-oriented extensional field (e.g., [38,39,40,41,42,43]), NW–SE-striking active faulting is also evident, possibly reactivating the inherited extensional structures of the earlier Late Miocene to Pliocene, NE–SW-oriented extensional phase [41,44,45]. Palaeoseismic trenching in the Northern Mygdonia Basin, supported by radiometric dating, confirmed that both the NW–SE- and E–W-trending fault zones that bound the northwestern and northern basinal margins, respectively, are both Holocene active [46]. This is the reason why the dominant basins in Central-Eastern Macedonia (Mygdonia, Strymon, and Drama–Phillipi basins) demonstrate margins in both NW–SE and E–W directions, with the latter ones imprinted upon the former ones.
Although this region is characterized by low seismicity, compared to other regions of the Aegean, a strong earthquake has been recorded. In particular, this seismic event occurred in Amphipolis (597 AD, ~M6.8), while no seismic events exceeding Μ5.0 have been documented for the last 120 years [47,48].
Low seismic activity in Central-Eastern Macedonia is in agreement with the low values of the geodetic strain rate. As seen in Figure 1 [16], the strain rate in this area is contrastingly lower than the neighbouring NAT or NAB. The same pattern has been suggested by many other researchers as well [7,8,16,17,49,50,51]. The strain tensor analysis from previous works may show some variances in the main axes’ direction, but they all agree with the relatively much lower values compared to the southern parts of the Aegean [7,8,14,15,16,17,24,51,52,53,54,55,56,57]. In particular, Mouslopoulou et al. [58], who focused on the Strymon basin fault system, suggested significantly higher strain values compared to the previous works, while no strain axes direction was proposed; however, even these values are lower compared to South Aegean region.
Tectonic strain is partitioned among the active faults of the study area; therefore, a holistic approach studying strain should incorporate the active structures. Overall, major fault zones in the study area are striking both E–W (Sochos, Drama, etc.) and NW–SE (e.g., Symvoli–Fotolivos, Tholos–Nea Zichni), which is in agreement with the palaeoseismic results [45]. The most important known fault zones in our study area are:
  • The Symvoli–Fotolivos fault zone
The Symvoli–Fotolivos fault zone (SFFZ) is a NW–SE-striking normal fault zone, dipping to the NE, forming the Drama–Phillipi basin western margin. It is approx. 53 km long and comprises several fault segments. Palaeoseismic trenching, supported with radiometric dating, revealed that: (i) the fault plane dips at 55° towards NE (052°), in agreement with the strike of the fault zone extracted from the surficial geological and geomorphological mapping, and (ii) it is Holocene active, but with low slip-rate (0.14 mm/yr) and, hence, long earthquake recurrence intervals in the order of several thousands of years [45]. No major historically or instrumentally recorded earthquakes can be correlated with this fault, most probably due to its long recurrence interval.
2.
The Tholos–Nea Zichni fault zone
The Tholos–Nea Zichni (TNFZ) is a NW–SE-trending major normal fault zone that dips and downthrows to the northwest (225°), forming the eastern boundary of the Strymon basin [45]. The area bounded by the two fault zones (TNFZ and SFFZ) comprises of Alpine Mesozoic metasediments, which are unconformably overlain by Neogene fluvial and lacustrine deposits.
The TNFZ displays common tectonic geomorphology features such as a relatively linear topographic boundary, inverted wine-glass valleys, and highly incised catchments that result from footwall uplift (e.g., Figure 2).
Moreover, the direction differentiation of the ongoing extension, as well as the fault strike, may indicate that a limited horizontal component may occur. According to recent geodetic studies [58], a sinistral lateral component of motion is proposed. No significant events have been recorded instrumentally near the fault (e.g., all events were below M = 5.0). Only one strong historical event (M~6.8), which occurred in AD 597, has been recorded a couple of tens of km from the fault into its hanging wall, where the maximum subsidence is expected. This event changed the flow of the Strymon River near Amphipoli [70]. Therefore, this fault is one of the few candidates (possibly the most proximal one) that could have hosted this event. Palaeoseismic trenching, supported with radiometric dating, revealed that this is a Holocene active complex fault zone, with its deformation distributed across several synthetic and antithetic planes, and is interpreted as having a low slip-rate fault (0.20 ± 0.1 mm/yr), with recurrence intervals in the order of 2500 ± 1000 yrs [45].
3.
The Belles–Kerkini fault zone
The Belles–Kerkini fault zone is characterized by remarkable morphological features, while the recent tectonic activity is subjected to the dominant NNE–SSW extensional regime of the wider area [29,39,41,71,72,73]; the Belles–Kerkini fault zone is longer than 40 km [74].
According to the initial morphotectonic observations [75,76], the Mt Belles–Kerkini was considered as an E–W-trending horst (Pliocene–Quaternary), delimited by two adjacent grabens, expanding northerly and southerly, respectively. The Quaternary fault activity affected the Pliocene alluvial deposits, lying along the alpine bedrock-composed foothills. In particular, geomorphological features such as well-developed fault-scarp zones, the deposition of new generations of fans upon the older ones close to the fault zone, post-depositional gully erosion, etc., resulted in the conclusion that the western part of Mt Kerkini is more active than the eastern part.
Later on, Mountrakis et al. [41] separated the fault zone into two fault segments, i.e., an 18 km-long segment to the west and a 24 km-long segment to the east. The former, consisting of two subparallel strands, dips to the south in a steep angle, and, westerly, it merges with an ENE–WSW-trending fault, extending up to Doirani Lake. The latter separates the sediments of Strymon basin from the alpine metamorphic rocks (Mt Belles–Kerkini). The authors also observed that the Petritsi fault intersects the NE–SW (to ENE–WSW)-trending faults north of Petritsi village.
4.
The Sochos fault zone
The Sochos fault zone forms a smaller intermontane basin on the Mt Vertiskos crystalline mass [77,78]. Mountrakis et al. [41,79] reassessed its location and length and characterized it as an active structure. It consists of at least two segments, named the Sochos and Mavrouda faults, in a right-stepping geometry [79,80]. Mountrakis et al. [41] assessed that this fault zone was activated on 29 September 1932 (M6.2, according to Papazachos and Papazachou [47]), and its isoseismals were parallel to the fault zone [81].
5.
The Serres fault zone
The Serres fault zone (SFZ) lies along the margin of the corresponding basin, i.e., the Strymon basin, while it consists of discontinuous fault traces of a general E–W direction downthrowing to the south.
The SFS is located along the central–east margin of the Strymon basin, disrupting its general NW–SE trend. The eastern part of the fault zone shows a slight change of direction to the ESE, toward the Tholos–Nea Zichni fault zone. This part is shown on the respective 1:50,000-scale geological map of the Institute of Geology and Mineral Exploration (IGME) [82] as affecting the Quaternary sediments that lie along the foothills of Mt Menikion. The western, E–W-striking part of the fault zone, passing by and through the city of Serres, was later mapped by Tranos [83], Tranos and Mountrakis [84], and Mountrakis et al. [41], who characterized it as active. In fact, the part which passes through the city of Serres is the westmost part of the zone showing an ENE–WSW orientation. Normal dip-slip slicken lines overprinted on older strike-slip ones were found on the main boundary faults separating the crystalline basement of Mt Menikion from the post-alpine sediments of the basin [84].
6.
The Drama fault zone
The Drama fault zone (DFZ) shows common properties with SFZ, as they both trend towards E–W, downthrowing to the south, and are comprised of discontinuous fault traces.
However, a difference between them is that the DFZ bounds entirely the northern part of the Drama basin against the Mt Phalakron. It is characterized as an active normal fault since it bounds Quaternary deposits and the travertine sedimentation and displays dip slip striations on the fault plane [41]. The DFZ might have been activated during the 5 May 1829 catastrophic earthquake in Drama (M7.3, X intensity), whose isoseismals were elongated approx. E–W to WSW–ENE, and thus parallel to the fault zone [81]. A more recent event Μ = 5.5 that occurred on 9 November 1985 in Drama (VII intensity) confirmed again the activity of this zone and exhibited a similar fault parallel-elongated isoseismal pattern [81]. The main active faults and fault zones have been described above and concern either E–W- or NW–SE-trending faults.
7.
The Nigrita fault zone
It forms the western boundary of the Strymon basin and is traced towards the southern part of the basin. It is divided into (i) a NW–SE-trending segment that is aligned to the older Pliocene basin and (ii) a younger WNW–ESE-striking fault. Both structures merge towards the town of Nigrita.
The younger structure is a 20 km-long, WNW–ESE-trending normal fault that dips and downthrows to the NNE, shaping the southwestern boundary of the Strymon basin. It has a weak topographic expression within the Quaternary sediments, implying that it is active but with low slip-rate and long recurrence intervals. It could be an antithetic fault to the Serres fault since the latter displays a more profound imprint on the topography.
Finally, according to Tranos [73], both strike-slip and normal, and sometimes oblique, dip-slip faulting occur in the broader Strymon region, with the former preceding the latter, respectively. In particular, strike-slip faulting is characterized by NW–SE and NE–SW to ENE–WSW striking, while the normal and oblique dip-slip faults exhibit E–W striking, which corresponds to the N–S extension. In conclusion, it should be noted that secondary faults also occur (Figure 3) with poor geological evidence, though with distinctive, although subtle, geomorphological expression.

3. Seismic History of the Study Area

No strong events (Μ > 5) have been instrumentally recorded in the area. However, there is microseismic activity with several events up to M5.0; since 2008, when the Institute of Geodynamics, National Observatory of Athens (IG-NOA)’s catalogue became more accurate and complete, seismic activity has been recorded mostly at depths down to 40 km [48], i.e., within the upper crust. The hypocentral spatial distribution is occasionally concentrated in specific areas, in clusters, highlighting the occurrence of faults. As seen in Figure 1, most of the seismicity is correlated with geomorphological depressions, such as the Strymon and Drama-Philippi basins, and particularly close to or along their margins. Mountainous areas, such as Mt Vertiskos, show gaps in spatial distribution. The maximum earthquake magnitude recorded over the past 13 years did not exceed M4.9.
Regarding the historical seismicity, only one major and destructive earthquake is documented, the ~M6.8, which occurred in AD 597 towards the southern part of the basin near Amphipolis. At this point, the earthquake changed the flow direction of the Strymon River [47]. However, there are no isoseismals from this very old event to help us constrain the locality and trend of the activated fault.
On the contrary, several significant earthquakes have been recorded in the wider area, generated by the NW–SE-, NE–SW-, and E–W-trending faults, confirming the tectonic activity of these fault groups [46]. In particular, the NW–SE-trending faults were probably activated during the Assiros (1902, M6.6) and Ierissos (1932, M7.0) earthquakes [47,86,87,88], while the Krupnik earthquake (1904, M7.9), approx. 60 km north of our study area, in the southwestern part of Bulgaria, is related to NE–SW-trending faulting [56,86]. The Sochos (1932, M6.2) and Volvi (1978, M6.5) seismic occurrences activated E–W-trending faults [47,77,89,90,91,92].

4. Methods

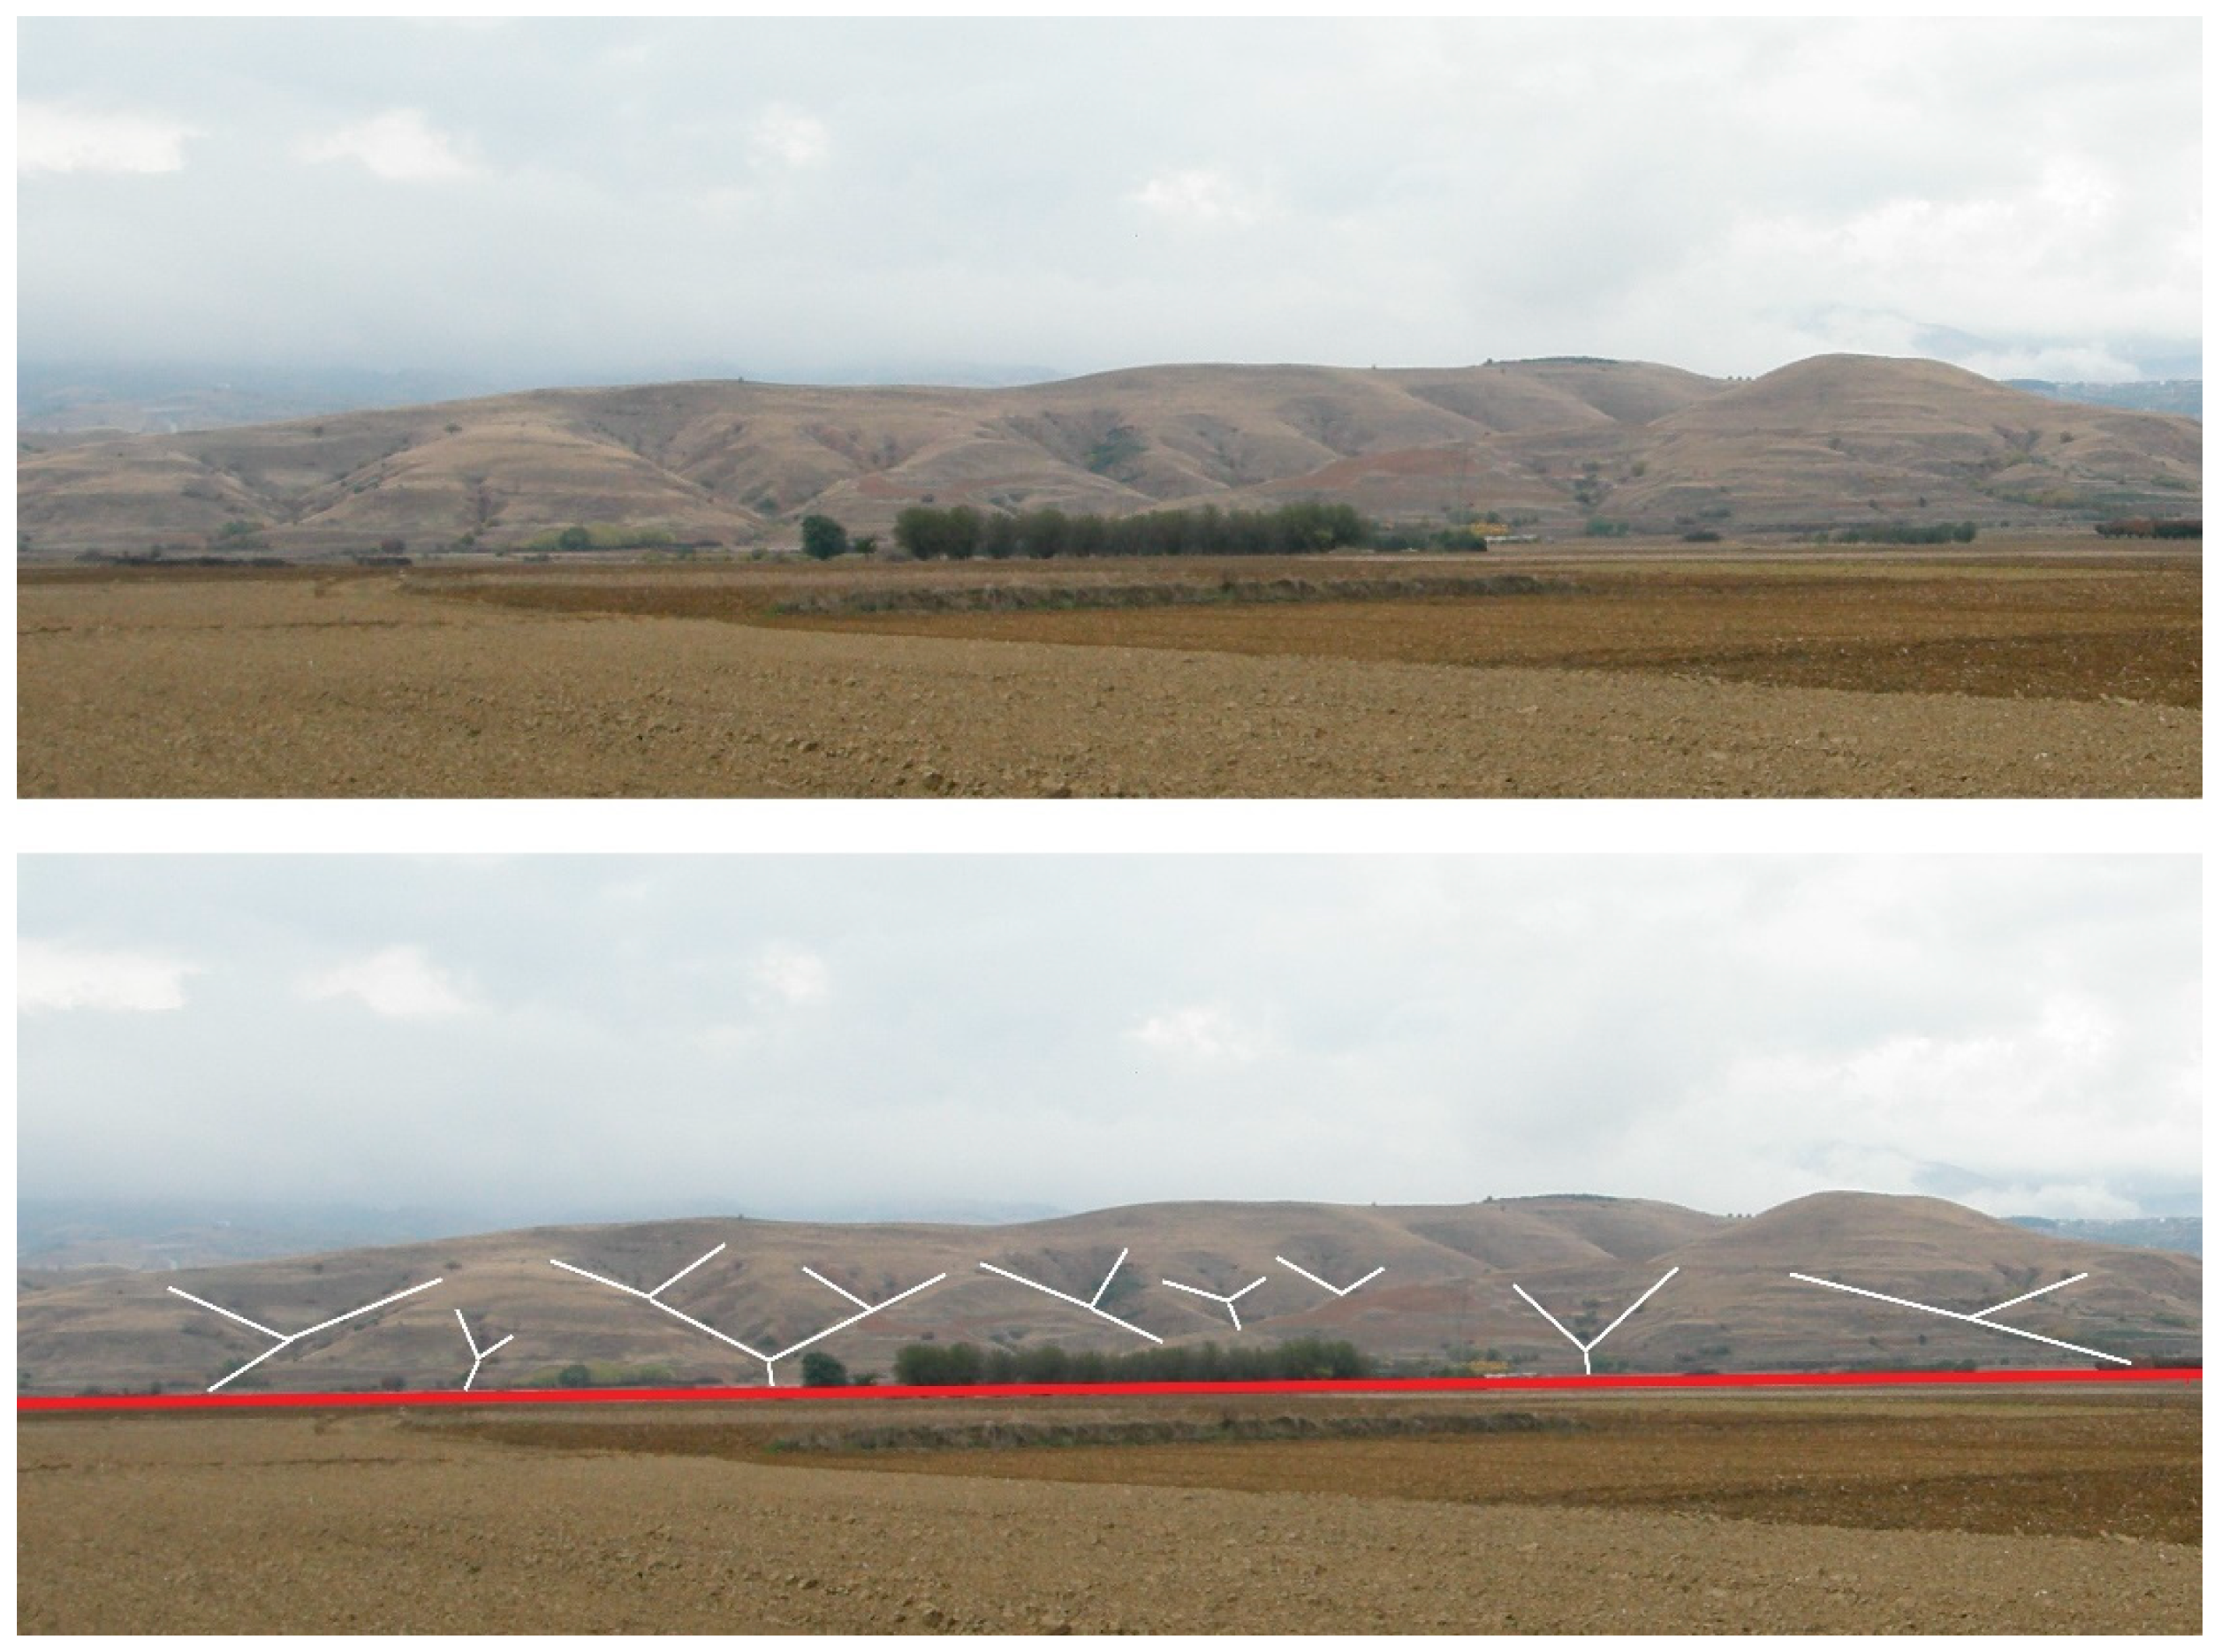
4.1. Primary Geodetic Raw Data Analysis

The extraction of geodetic raw data, collected by permanently installed GNSS stations, is a cutting-edge, instrumental approach for estimating the upper crust strain rate. These primary geodetic raw datasets are partially related to the general, geodetic velocity pattern, calculated throughout the Greek region [93]. Particularly, in the wider Strymon basin, 16 permanent GNSS stations have been installed, recording the aforementioned geodetic datasets; the denser GNSS network within this area is characterized by a uniform distribution. It is mentioned that these stations are distributed within five different permanent networks (HxGN/SmartNet Greece, Hepos, NoaNet, EUREF Permanent Network—EPN and HermesNet; [94,95]), providing additional value and reliability to the recorded data.
Regarding the geodetic velocity calculation, a 7-year (2008–2014) interval was analyzed, while the data recording was performed in a 30 s rate during 24-h operation. In addition, the proposed geodetic velocities reference frame is the European Terrestrial Reference Frame 2000 (ETRF2000), according to which the Eurasian plate is considered fixed. The GAMIT/GLOBK software suite (release 10.5) was implemented [96,97]. Firstly, the raw data were processed for the entire time period in order to estimate daily loosely constrained solutions of sites, while the orbital and Earth Orientation parameters remained fixed to the IGS final and IERS Bulletin A values with weights, respectively. In our strategy, we estimated Zenith Total Delay (ZTD), adjusted every 2 h interval, and the Vienna Mapping Function1 (VMF1) was selected as a mapping function [96]. Concerning the Solid Earth Tides, the IERS2003 conventions were followed, in addition to Ocean Loading, while we applied FES2004 model, as it was considered appropriate to apply Atmospheric Pressure Loading corrections. In the second step, we combined all the individual sessions of the local sub-networks, using a seven-parameter Helmert transformation, with WRMS 2.0, 2.2, 4.8 mm on the east, north, and vertical components, respectively, estimating site coordinates by using the individual daily solution and geodetic velocities produced by the time series analysis with the linear and extended model. The differences between the two models are <1 mm/yr for the data span, exceeding the 2.5 years, while the extended model is described by the following equation:
y t i = α + β t i + k = 1 n c k sin 2 k π t i + d k cos 2 k π t i + k = 1 n g g k H t i T g k + v i
where α and β are the position and velocity of monitoring station, ck and dk describe periodic motions, and the equation
z t i = k = 1 n g g k H t i T g k
is used to describe the discontinuities caused by the earthquakes and equipment changes, with magnitudes g k at epochs T g k and H is the Heaviside step function.
On next step, after the outliers’ removal, we estimated station coordinates and velocities using the Kalman filtering sequential approach. The realization of the frame was estimated by minimizing the deviations between positions and velocities, relative to the current terrestrial frame with 7-parameter Helmert transformation and Post RMS 2 mm and 0.6 mm/yr for the coordinates and velocities, respectively. Table 1 shows the station velocities of the processed permanent GNSS sites relative to ETRF2000.

4.2. Implementation of Triangulation Methodology—Geostatistical Analysis (Interpolation) of Triangulation Methodology Results

The primary geodetic data processing, analyzed above, resulted in the estimation of the east and north velocity component of each GNSS station, as well as in the corresponding errors of these components. The triangulation methodology, implemented widely by various authors [98,99,100,101,102,103], was considered as the most suitable between different methodologies (least square methodology, grid-based methodologies, etc.) in order to process these datasets. The principle of the triangulation methodology is the velocity components’ combination of three GNSS stations, and their errors, leading to the total velocity calculation. In particular, these stations form a triangle, while each of them is considered as a triangle vertex. Then, the triangle is examined before and after the deformation process [57,104,105]. The undeformed triangle is represented by an inscribed inner circle, while the corresponding one is deformed by an ellipse, respectively [104,105]. The inner circle and ellipse axes’ combination lead to the strain parameters’ extraction. It should be noted that the procedure mentioned above is based on mechanics principals (more details about the triangulation methodology are provided in the Supplementary Materials).
As has already been mentioned, the wider Strymon basin area is surrounded by 16 permanent GNSS stations—a fact that leads to a large number of potential stations combinations. However, the total number of triangles that were eventually constructed and considered for the deformation estimation meet the following criteria: (i) the vast majority of triangles are equilateral in order to be affected equally by the deformation pattern of the three combined GNSS stations and (ii) the smallest possible distance between the GNSS stations is considered in order to efficiently observe the crustal deformation related to specific tectonic structures while significant interaction between the combined stations is documented at the same time [103]. Therefore, 216 triangles were constructed, represented by the corresponding triangle centroids. For all these centroids, a series of strain parameters was estimated, including (‘GPS triangular calculator’ software; [106]): (i) Maximum (MaHE) and Minimum (MiHE) Horizontal Extension, (ii) Velocity (V), (iii) Maximum Shear Strain (MaxSS), and (iv) Area Strain (AS).
Beyond the point spatial distribution of these parameters, a geostatistical process was performed in order to determine the grid pattern deformation. The kriging interpolation methodology (linear approach) was considered to be the most reliable geostatistical methodology, as it smoothly distributes the parameter values within the study area while emphasizing the extreme value concentrations as well as the neutral-transition areas, which are vital for the tectonic interpretation, as they are associated with tectonic regime changes.

4.2.1. Maximum (MaHE) and Minimum (MiHE) Horizontal Extension

The parameters of Maximum (MaHE) and Minimum (MiHE) Horizontal Extension are directly related to the identification of active tectonic structures. Particularly, the MaHE parameter indicates the extensional tectonics occurrences (extension in strain terminology), while, on the other hand, the MiHE, which is perpendicular to the MaHE, represents compressional tectonics occurrences (compression in strain terminology). The MaHE and MiHE parameters are interconnected, and, therefore, the three following cases are observed: (i) the coexistence of high MaHE values with low MiHE values, which shows normal dip-slip faulting; the MaHE parameter is perpendicular to the fault or fault zone, (ii) the coexistence of low MaHE values with high MiHE values, which shows reverse dip-slip faulting; the MiHE parameter is perpendicular to the fault or fault zone, and (iii) the coexistence of equal or similar MaHE and MiHE values, which shows strike-slip faulting; both MaHE and MiHE form 45° with the fault or fault zone.
It is noted that the MaHE develops along the major axis of the strain ellipse, as was explained above, while the MiHE develops along the minor axis of the strain ellipse, respectively. The following equations (Equations (3) and (4)) define mathematically the MaHE and MiHE parameters:
MaHE = ( l f l 0 ) / l 0
MiHE = ( l f l 0 ) / l 0
where
l f : the final length along the strain ellipse major axis,
l 0 : the original length along the strain ellipse major axis,
l f : the final length along the strain ellipse minor axis, and
l 0 : the original length along the strain ellipse minor axis.
It is mentioned that l 0 = l 0 in case of circle occurrences.

4.2.2. Velocity (V)

Velocity (V) is associated with the motion of an area, which indicates partially the geotectonic evolution of a larger scale region. Regarding the Aegean region, the highest values are documented in the region (and adjacent regions) of the Eurasia–Nubia subduction zone [7,14,16,107]; therefore, low V values are expected within the study area, as it is not located close to the subduction zone. The V is calculated by implementing the east and north velocity components, which are perpendicular to each other.

4.2.3. Maximum Shear Strain (MaxSS)

The Maximum Shear Strain (MaxSS) is a parameter indicating the extensional tectonic activity, occurred by shearing activity, developing along active faults or fault zones. These shearing effects result in the brittle, crustal deformation [108]. It is noted that shearing, and therefore the MaxSS parameter, is related to two kinematic types: (i) normal dip-slip and (ii) strike-slip. On the contrary, reverse faults or fault zones lack shear, as they are mainly associated with compressional tectonic activity. The following equation (Equation (5)) represents the mathematical expression of MaxSS:
MaxSS = MaHE MiHE

4.2.4. Area Strain (AS)

The Area Strain (AS) is a parameter which decisively contributes to the determination of the crustal deformation type; two major types are identified: (i) dilatation and (ii) compaction. Dilatation receives the positive AS values, while it is directly related to extensional active tectonics; therefore, dilatation is identified within areas, where normal dip-slip or transtensional strike-slip faulting occurs. On the other hand, compaction is represented by the negative AS values, while it is associated with compressional active tectonics; hence, compaction occurrences are observed within areas of reverse dip-slip or transpressional strike-slip faulting. The mathematical equation of the AS parameter is the following (Equation (6)):
AS = MaHE + MiHE

4.3. SAR Data and Interferometric Processing

Imaging geodetic techniques such as Syntheric Aperture Radar (SAR) Interferometry have been proven to be an irreplaceable tool for measuring surface motion in different contexts and environments, including land subsidence [109], slope instabilities [110,111], volcanoes [112], and earthquakes [113,114]. Interferometric SAR (InSAR) has evolved over the past years into an operational technique for monitoring surface motion, allowing wide area coverage (including remote areas) at relatively low cost. Towards this direction, the systematic availability of open and free SAR data from the Copernicus Sentinel-1 mission [115] played an important role, ensuring the applicability of InSAR techniques on a global scale without the requisite for planning or ordering SAR acquisitions for specific sites. However, the requirement for big data processing both in terms of computational power and storage capacity led to the devolvement of cloud-based solutions [116]. Among such solutions, the Geohazards Exploitation Platform (GEP) is an initiative setup by the European Space Agency (ESA), aiming to support further exploitation of satellite Earth Observation (EO) data for geohazards assessment [117]. GEP is a cloud-based environment that provides a set of processing tools and services that allow for the mapping of hazard-prone land surfaces and the monitoring of terrain motion. It aims to support scientists and EO practitioners to better understand geohazards and their impact while introducing innovative concepts, such as the exploitation of the e-collaboration environment. The service has been already applied in scientific and operational frameworks [118,119].
For mapping the ground displacements of the Strymon basin, we utilized the Surface motioN mAPPING (SNAPPING) service on the GEP. SNAPPING enables the Persistent Scatterers Interferometric (PSI) analysis of Sentinel-1 SLC data for measuring average displacements as well as the investigation of their temporal evolution (e.g., displacement time series). The service is implemented to facilitate on-demand processing and the easier monitoring options of a user-defined area of interest.
The SNAPPING medium resolution service is considered sufficient for wide area processing, followed by more detailed investigation when a relevant signal (in our case, fault-related motion) is detected. The wide overview of ground displacements at medium resolution, reducing relevant production costs, is a proper practice that it well demonstrated in relevant research and development activities [120]. Medium resolution refers to the merging of Persistent Scatterers (PS) point measurements within a 100 m radius. However, PS targets exhibiting different phase properties are not affected, thus maintaining local displacement patterns.
In practice, InSAR time series measurements reach an accuracy of 1–2 mm/yr for average displacement rates and 3–5 mm for each displacement estimate in the time series [121]. This should be critically assessed when a region of relatively low interseismic motion is being investigated. However, the abovementioned accuracy level might be affected by the time span of the observation period and the amount of SAR imagery used in the processing. To ensure the robustness of our analysis, we expanded the InSAR observation period from April 2015 to December 2020. A period of approx. 6 years is acceptable for obtaining a millimeter level accuracy. In turns, Sentinel-1A and -1B satellite units were exploited, repeated every 6 days, to better address non-linear temporal signals while minimizing error.
A total number of 164 acquisition dates from ascending track 102 (10 April 2015–27 December 2020) and 159 dates from descending track 7 were considered (4 April 2015–9 December 2020) following a fully unsupervised processing on the GEP platform. An area of about 10,200 km2 (120 × 85 km) was examined. To restrict the analysis over high-quality measurements points, interferometric processing was performed, setting the amplitude dispersion for PS detection to a value of 0.35. We avoided the definition of a local reference area for the PSI processing. This is a preferable solution to minimize potential influence by unknown deformation signal, especially when no relevant information on the stability of the areas is available a priori. Thus, each solution was referenced to the average motion of the entire area (mean velocity is set to zero). The above decision does not affect the relative motion between neighboring points or the observed temporal patterns in the time series; rather, it only affects the absolute velocity of the point measurements. SNAPPING PSI measurements are provided in the satellite Line-of-Sight (LoS) direction. Positive values correspond to uplift or motion towards the satellite, whereas negative ones correspond to subsidence or motion away from the satellite platform. A detailed description of the SNAPPING service and the processing steps involved are described elsewhere [122].
Finally, a decomposition scheme was applied [123] to retrieve vertical and horizontal E–W motion components combining ascending and descending SNAPPING measurements. Initial steps involved the rasterization of point measurements into a common 100 m grid, assigning the median displacement rate value when multiple points are identified within the raster resolution cell.

5. Results

5.1. Calculation of the Geodetically Based Parameters

5.1.1. Maximum (MaHE) and Minimum (MiHE) Horizontal Extension
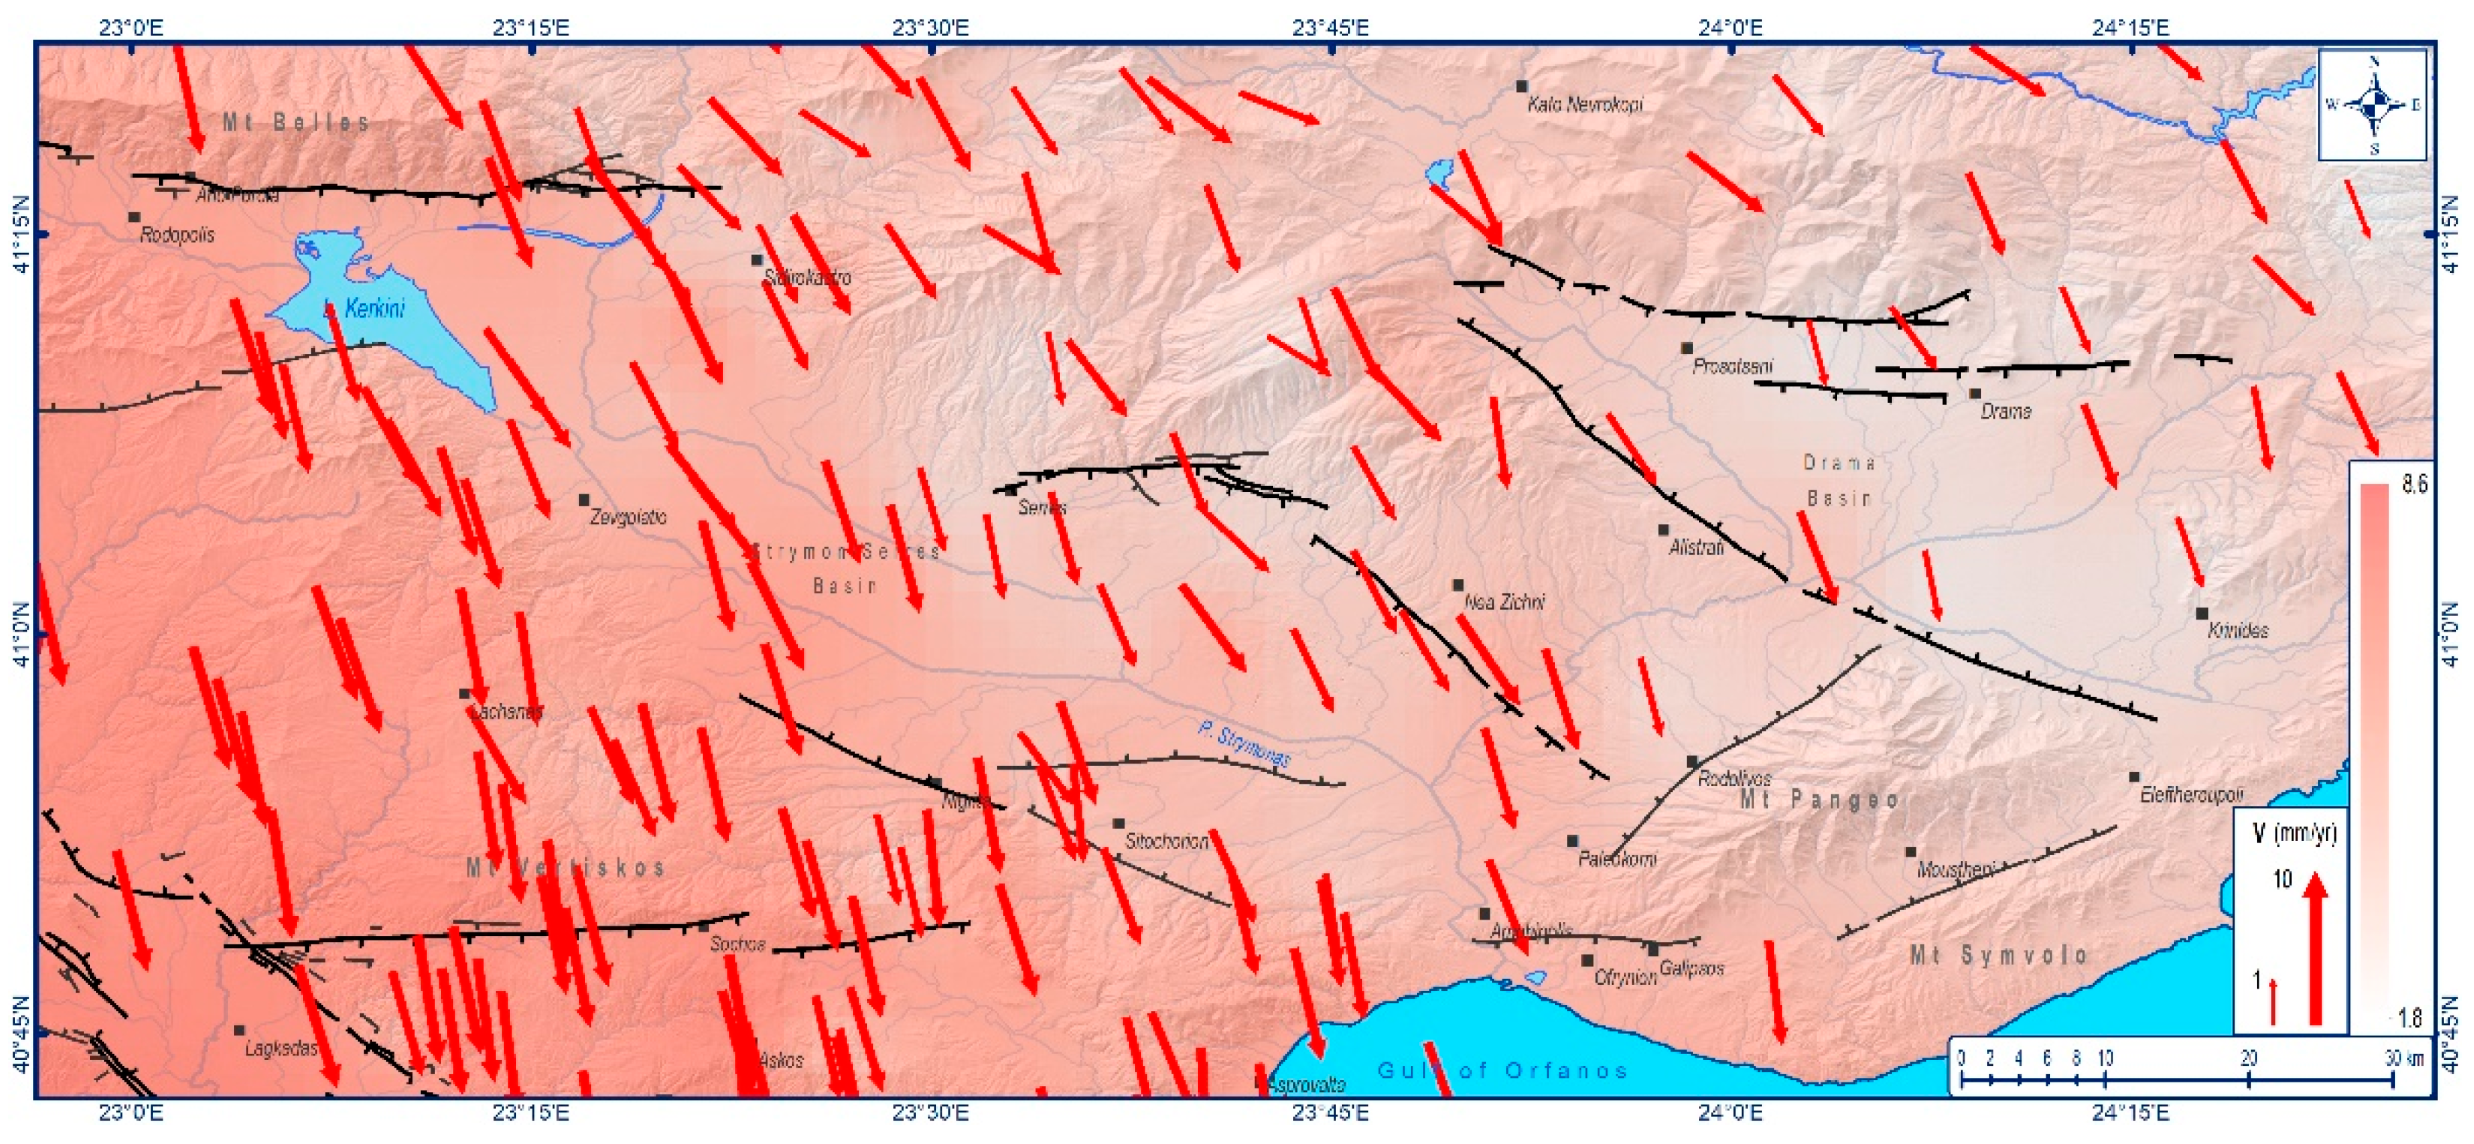
The results of Maximum and Minimum Horizontal Extension parameters (MaHE and MiHE, respectively) are characterized by a wide range of strain field values. In particular, the MaHE values vary between −55 and 2649 × 10−9, while the corresponding MiHE values vary between −631 and 146 × 10−9, respectively (Figure 4b,c). In addition, the exx, exy, eyy (maximum, minimum, and average) values, and the corresponding uncertainties (Table 2) of the 216 triangles, were calculated, which are necessary for the MaHe and MiHE estimation. The values’ distributions reveal that both the MaHE and MiHE absolute maximum values are concentrated along the eastern margin, as well as at the western margin at the northernmost part of the Strymon basin (Figure 4a).
The MaHE and MiHE analysis (Figure 4a) indicates the extension dominance, and therefore normal faulting activity, within the greatest part of study area. Particularly, the greatest value distribution is mainly observed in the central part of the study area; the eastern margin region (Nea Zichni village and Serres city) and the western margin northernmost part (Zevgolatio village, located south of the Kerkini Lake). These areas are characterized by significant MaHE values, while the corresponding MiHE absolute values are extremely low, indicating dip-slip, normal faulting activity; the limited number of MiHE values, which are greater than the corresponding MaHE ones, are due to the noise (misinterpretation of geodetic data processing), while they are also inconsistent with the tectonic setting. On both sides of this area, a gradual decrease in the MaHe and MiHE values is documented, while the value difference decreases between MaHE and MiHE at the same time (MaHE values remain greater than the corresponding MiHE ones), indicating oblique-slip, normal faulting activity (e.g., Drama basin, broader Mt Vertiskos and Sidirokastro village areas, etc.). However, the northwesternmost part of the study area (Mt Belles area) is differentiated from the corresponding neighbor parts, as both MaHE and MiHE values are positive, indicating the dominant, pure extensional regime, expressed by normal faulting. In addition, the MaHE vectors direction (Figure 4a) are almost perpendicular to the faults’ and fault zones’ strike, confirming both the occurrence and the normal faulting properties of these tectonic structures. Moreover, it should be noted that wherever positive MaHE and negative MiHE values are of the same order, such as at Askos, Sidirokastro, south of Nea Zichni, and locally around Drama, shear prevails; the intensity of shear depends on the order of magnitude of the MaHE–MiHE values.
The MaHE and MiHE results were also geostatistically processed, implementing interpolation (kriging) methodology in order to facilitate visualization through spatial distribution. Initially, the MaHE geostatistical analysis (Figure 4b) shows three major high-value locations (1700—2649 × 10−9) located at the eastern margin (two sites) and the northwestern margin (third site). All three locations correlate well with the occurrence of faults and fault zones (e.g., Serres and Tholos–Nea Zichni fault zones), while the medium- and low-value locations (800–1700 × 10−9) indicate fewer deforming faults or fault zones (e.g., Belles–Kerkini fault zone). Regarding the respective MiHE analysis (Figure 4c), the absolute high-value locations (−631–−350 × 10−9) almost correspond to the MaHE ones; however, a significant difference between the magnitude of the MiHE and MaHE values is documented. Moreover, the lack of the high values of MiHE at the northwestern part of the study area confirms the pure, dip-slip, normal faulting regime of this part, while, on the other hand, the significant MiHE high values along the eastern Strymon basin boundary indicates increased shear, related to the oblique-slip normal faulting. Moreover, the similar MaHE and MiHE values at the southern part of the study area, which are approaching the North Aegean Sea, indicate the potential occurrence of strike-slip tectonic structures, probably related to the major tectonically active strike-slip structures located within the North Aegean Trough (NAT).

5.1.2. Velocity (V)

The calculated Velocity (V) values range between 1.8 and 8.6 mm/yr within the broader Strymon basin area (Figure 5); the minimum values are mainly observed at the eastern part (wider Drama basin area), while a gradual increase is documented towards the western part. It is noted that the maximum V values are located at the southwestern most part of the study area. Regarding the V vectors’ direction, a mean value of almost 170° (±10°) has been calculated with very few exceptions, indicating the SSE motion of the area; the highest values to the west show a small deflection of a few degrees toward the N–S direction.
The V results are in accordance with the geodynamic evolution of the broader Aegean region, divided into the North and South Aegean sub-regions. The South Aegean sub-region is characterized by high V values, showing a NE–SW direction, while a gradual increase is documented as the distance from the Hellenic Subduction Zone decreases. On the contrary, the North Aegean sub-region, where our study area belongs, shows lower V values of N–S (up to NNW–SSE) direction, showing a progressive value increase from the northern to the southern part. The V results are consistent with other geodetic investigations conducted in the wider Greek area [7,14,107].

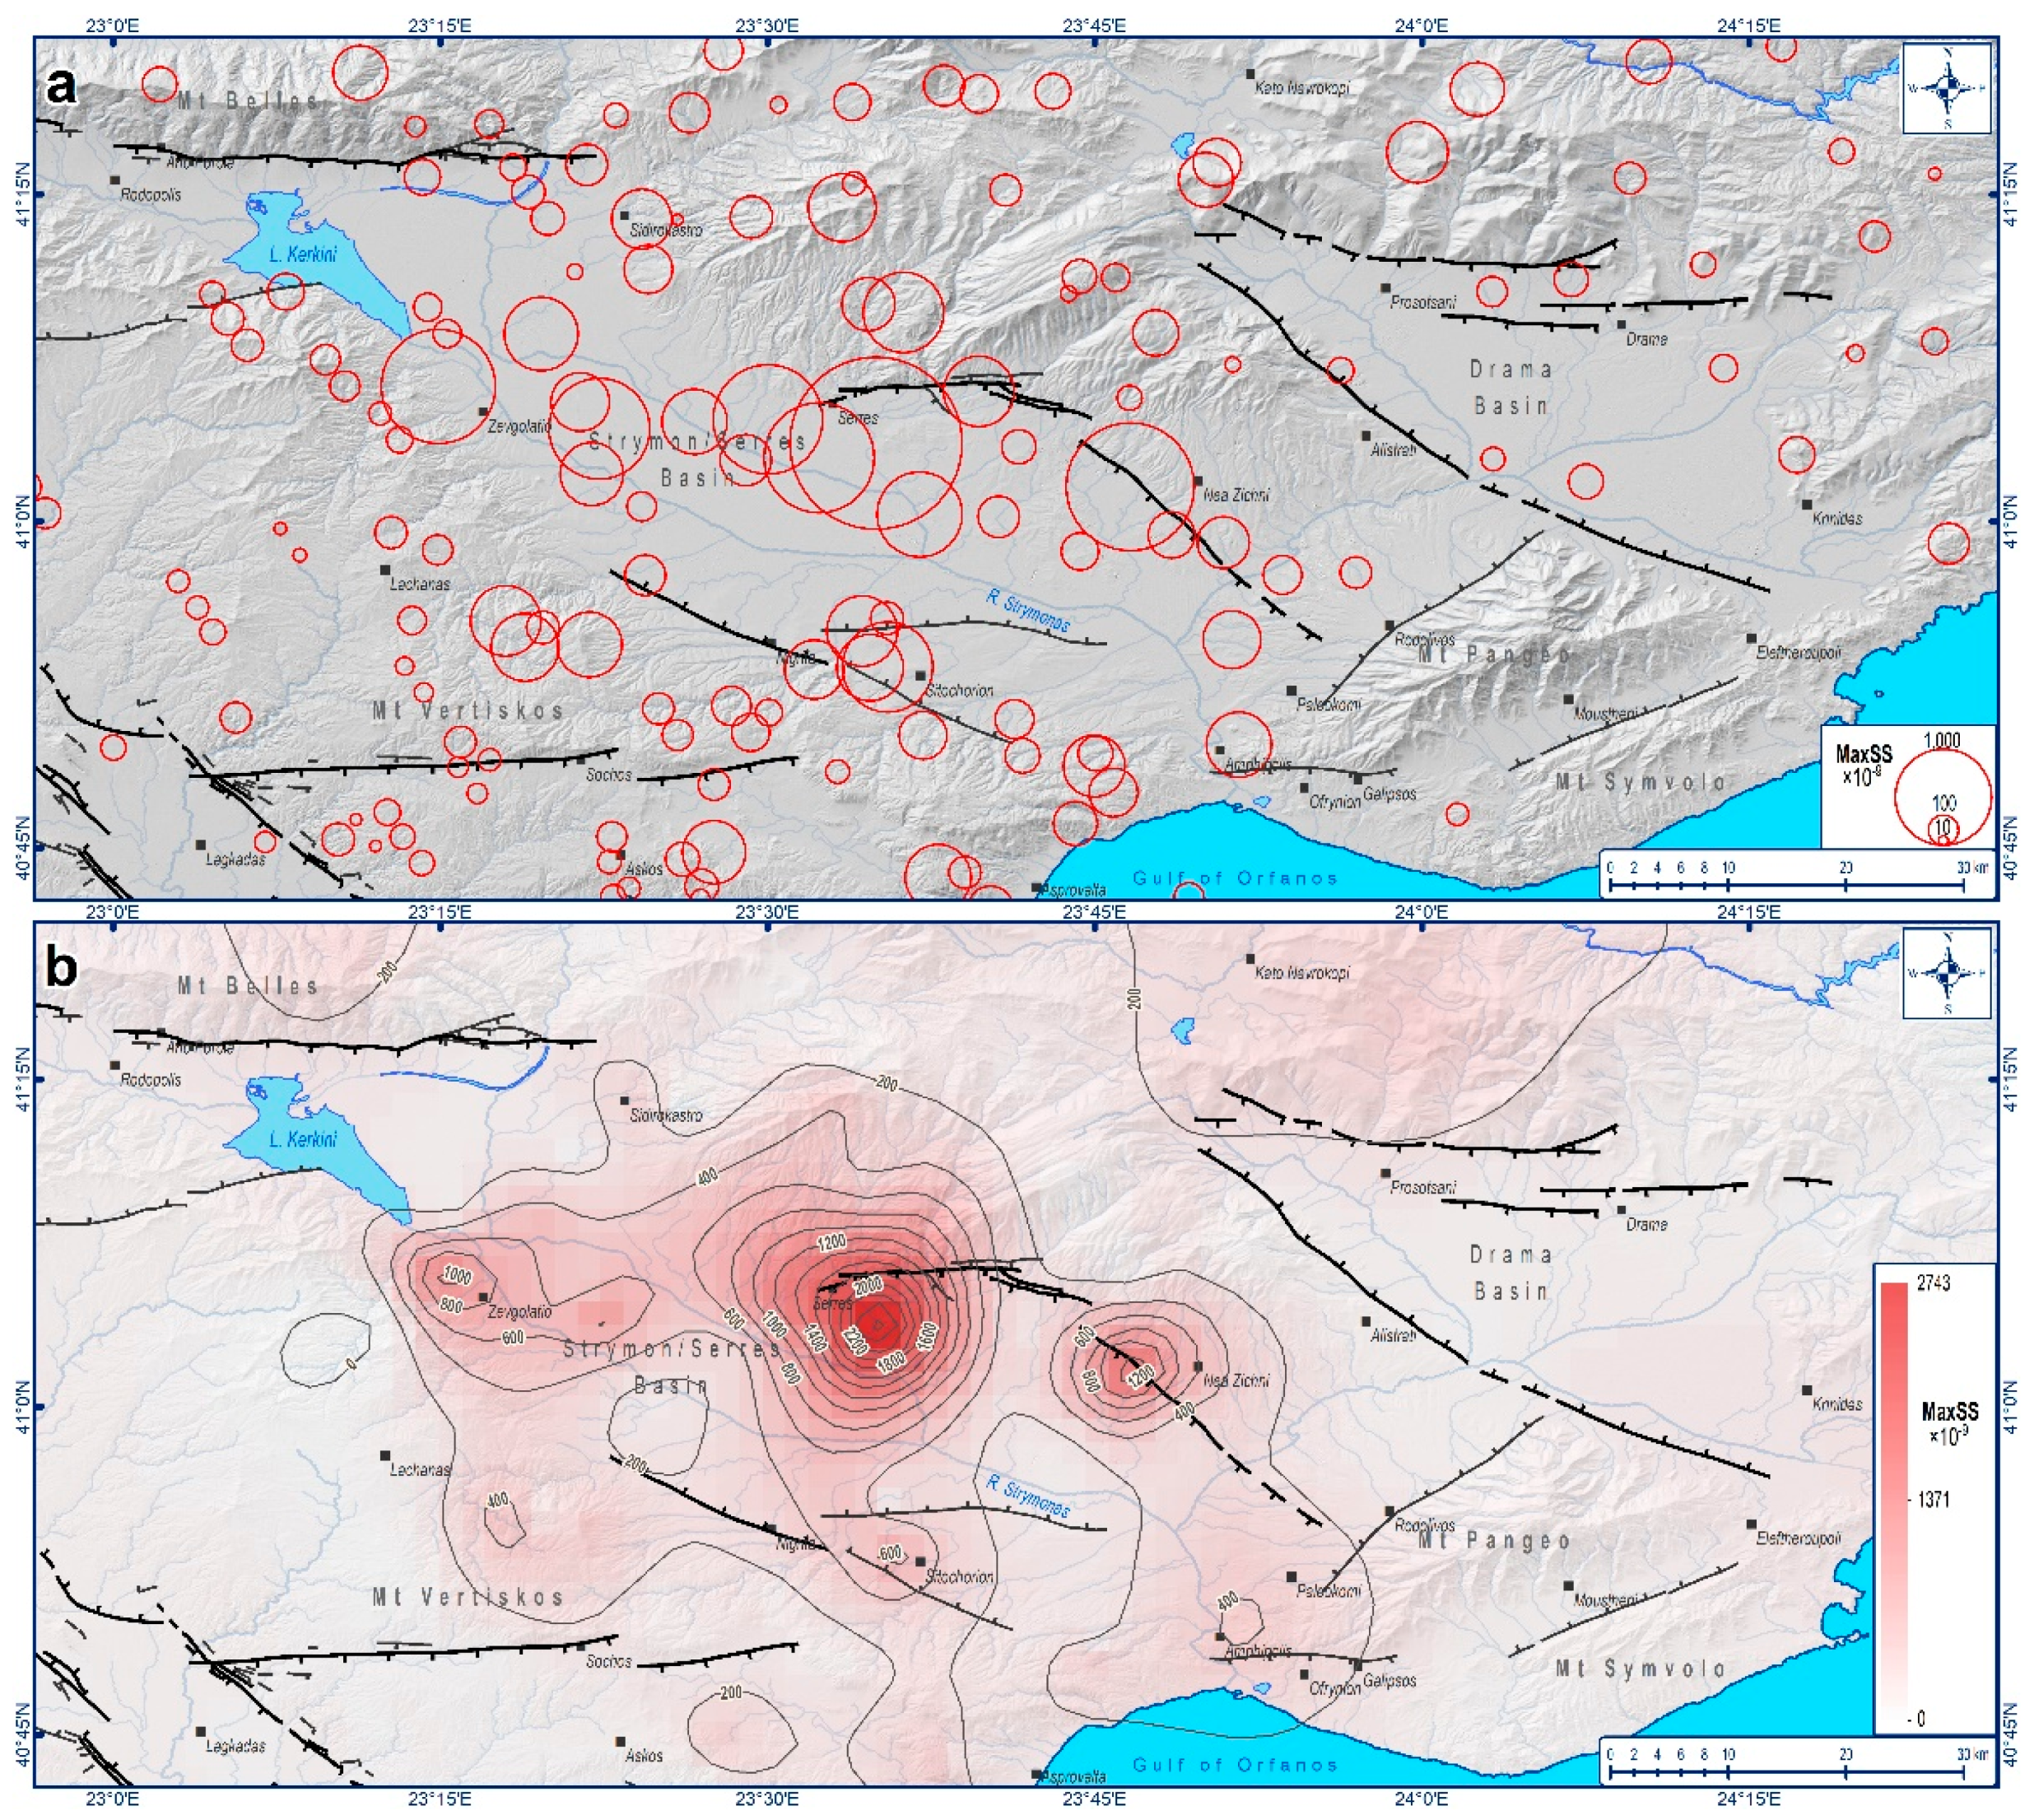
5.1.3. Maximum Shear Strain (MaxSS)

The Maximum Shear Strain (MaxSS) values within the broader Strymon area range between 0.7 and 2743 × 10−9 (Figure 6b). In particular, the maximum MaxSS values are documented along the eastern boundary of the Strymon basin, while similar values are also observed at the northern part of the corresponding western boundary (Figure 6a). In addition, much lower but considerable MaxSS values also occur at the southern part of the western boundary Strymon basin. The geostatistical analysis (Figure 6b) shows a clearer view of the MaxSS distribution, indicating the locations of the higher values along a WNW–ESE-trending imaginary axis crossing the Strymon basin from the southern tip of Lake Kerkini to the west to Nea Zichni to the east. It is noteworthy that extremely low, almost negligible values occur in all of the Drama basin. Therefore, the high shear values indicate the significant active tectonic structures along the Strymon basin boundaries (especially the eastern one).

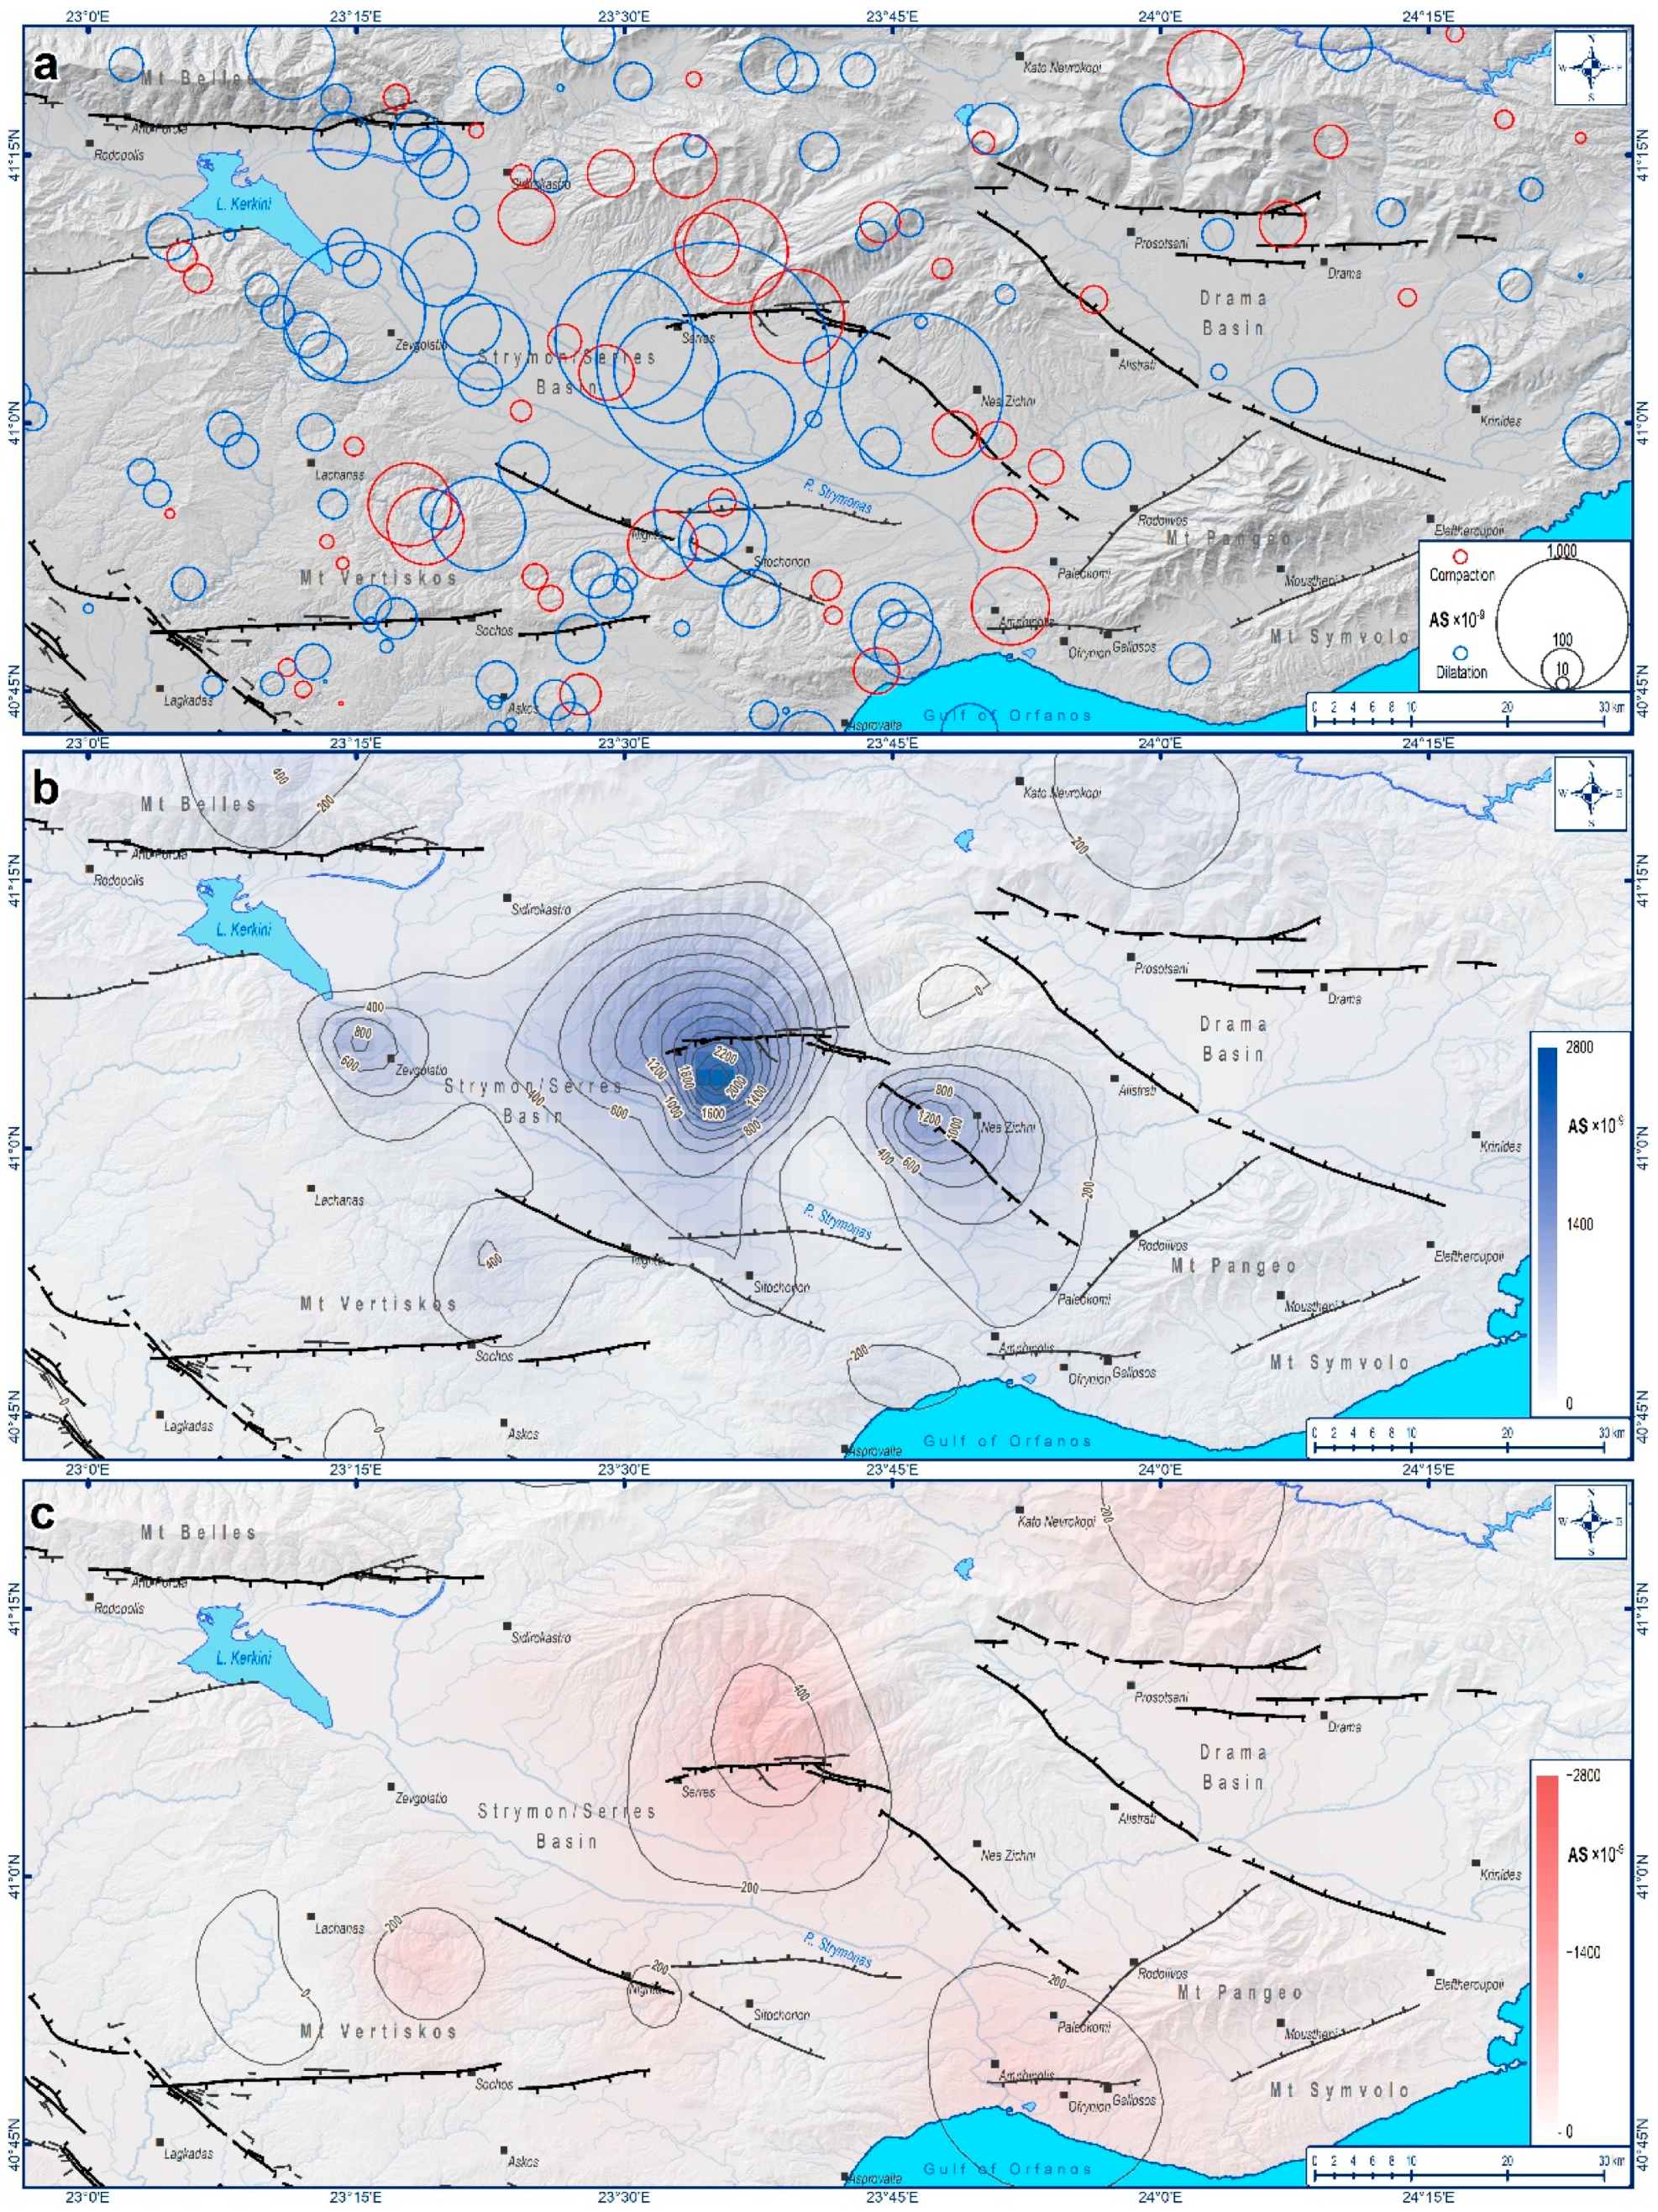
5.1.4. Area Strain (AS)

The Area Strain (AS) parameter is characterized by two different types: (i) dilatation, associated with extensional tectonics, and ii) compaction, related to compressional tectonics. The AS results indicate a clear dilatation dominance over compaction (Figure 7a), with values ranging between −596 × 10−9 (compaction) and 2715 × 10−9 (dilatation), suggesting an almost 4.5 times higher dilatation than compaction (Figure 7b,c).
Although the dilatation type prevails within the study area (Figure 7b), it unevenly coexists in several cases with compaction, implying the involvement of shear. In particular, the maximum values’ concentrations are documented strictly within the Strymon basin region, along the eastern boundary, as well as south of Kerkini Lake (northwestern part of the Strymon basin boundary). Moreover, it is worth mentioning the significant dilatation values observed at the central and eastern part of Mt Belles at the northwestern part of the study area. Regarding the high-value compaction concentrations (Figure 7c), they are mainly observed along the eastern margin of Strymon basin, southwesterly of the western Strymon basin margin within the broader Mt Vertiskos area, near the coastal part of the Orfanos Gulf region and in the north part of the Drama basin (close to Kato Nevrokopi village).
A significant difference between dilatation and compaction values indicates extensional (dilatation > compaction) or compressional (compaction > dilatation) active tectonics occurrences, while similar dilatation and compaction values show shear tectonics activity [57]. For instance, in the broader Kerkini Lake and Mt Belles area, the compaction values are absent or extremely low, indicating that this part of the study area is dominated by extensional active tectonics, manifested by dip-slip, normal faults (or fault zones). Regarding the sensu stricto area of Strymon basin, a clear dilatation (qualitative and quantitative) prevalence over compaction is documented; however, the compaction occurrence is noteworthy, showing that, despite the dilatation dominance, a significant shear component is observed, leading to active oblique-slip, normal faults’ (or fault zones’) occurrence. Finally, the similar dilatation and compaction values at the southern part of the study area (Amphipolis–Paleokomi–Galipsos–Ofrynion area), where the Strymon River discharges into the North Aegean Sea, indicates potentially active strike-slip tectonic structures, extending within the offshore North Aegean region, which are associated with the tectonically and seismologically active strike-slip North Aegean Trough (NAT) fault zones.

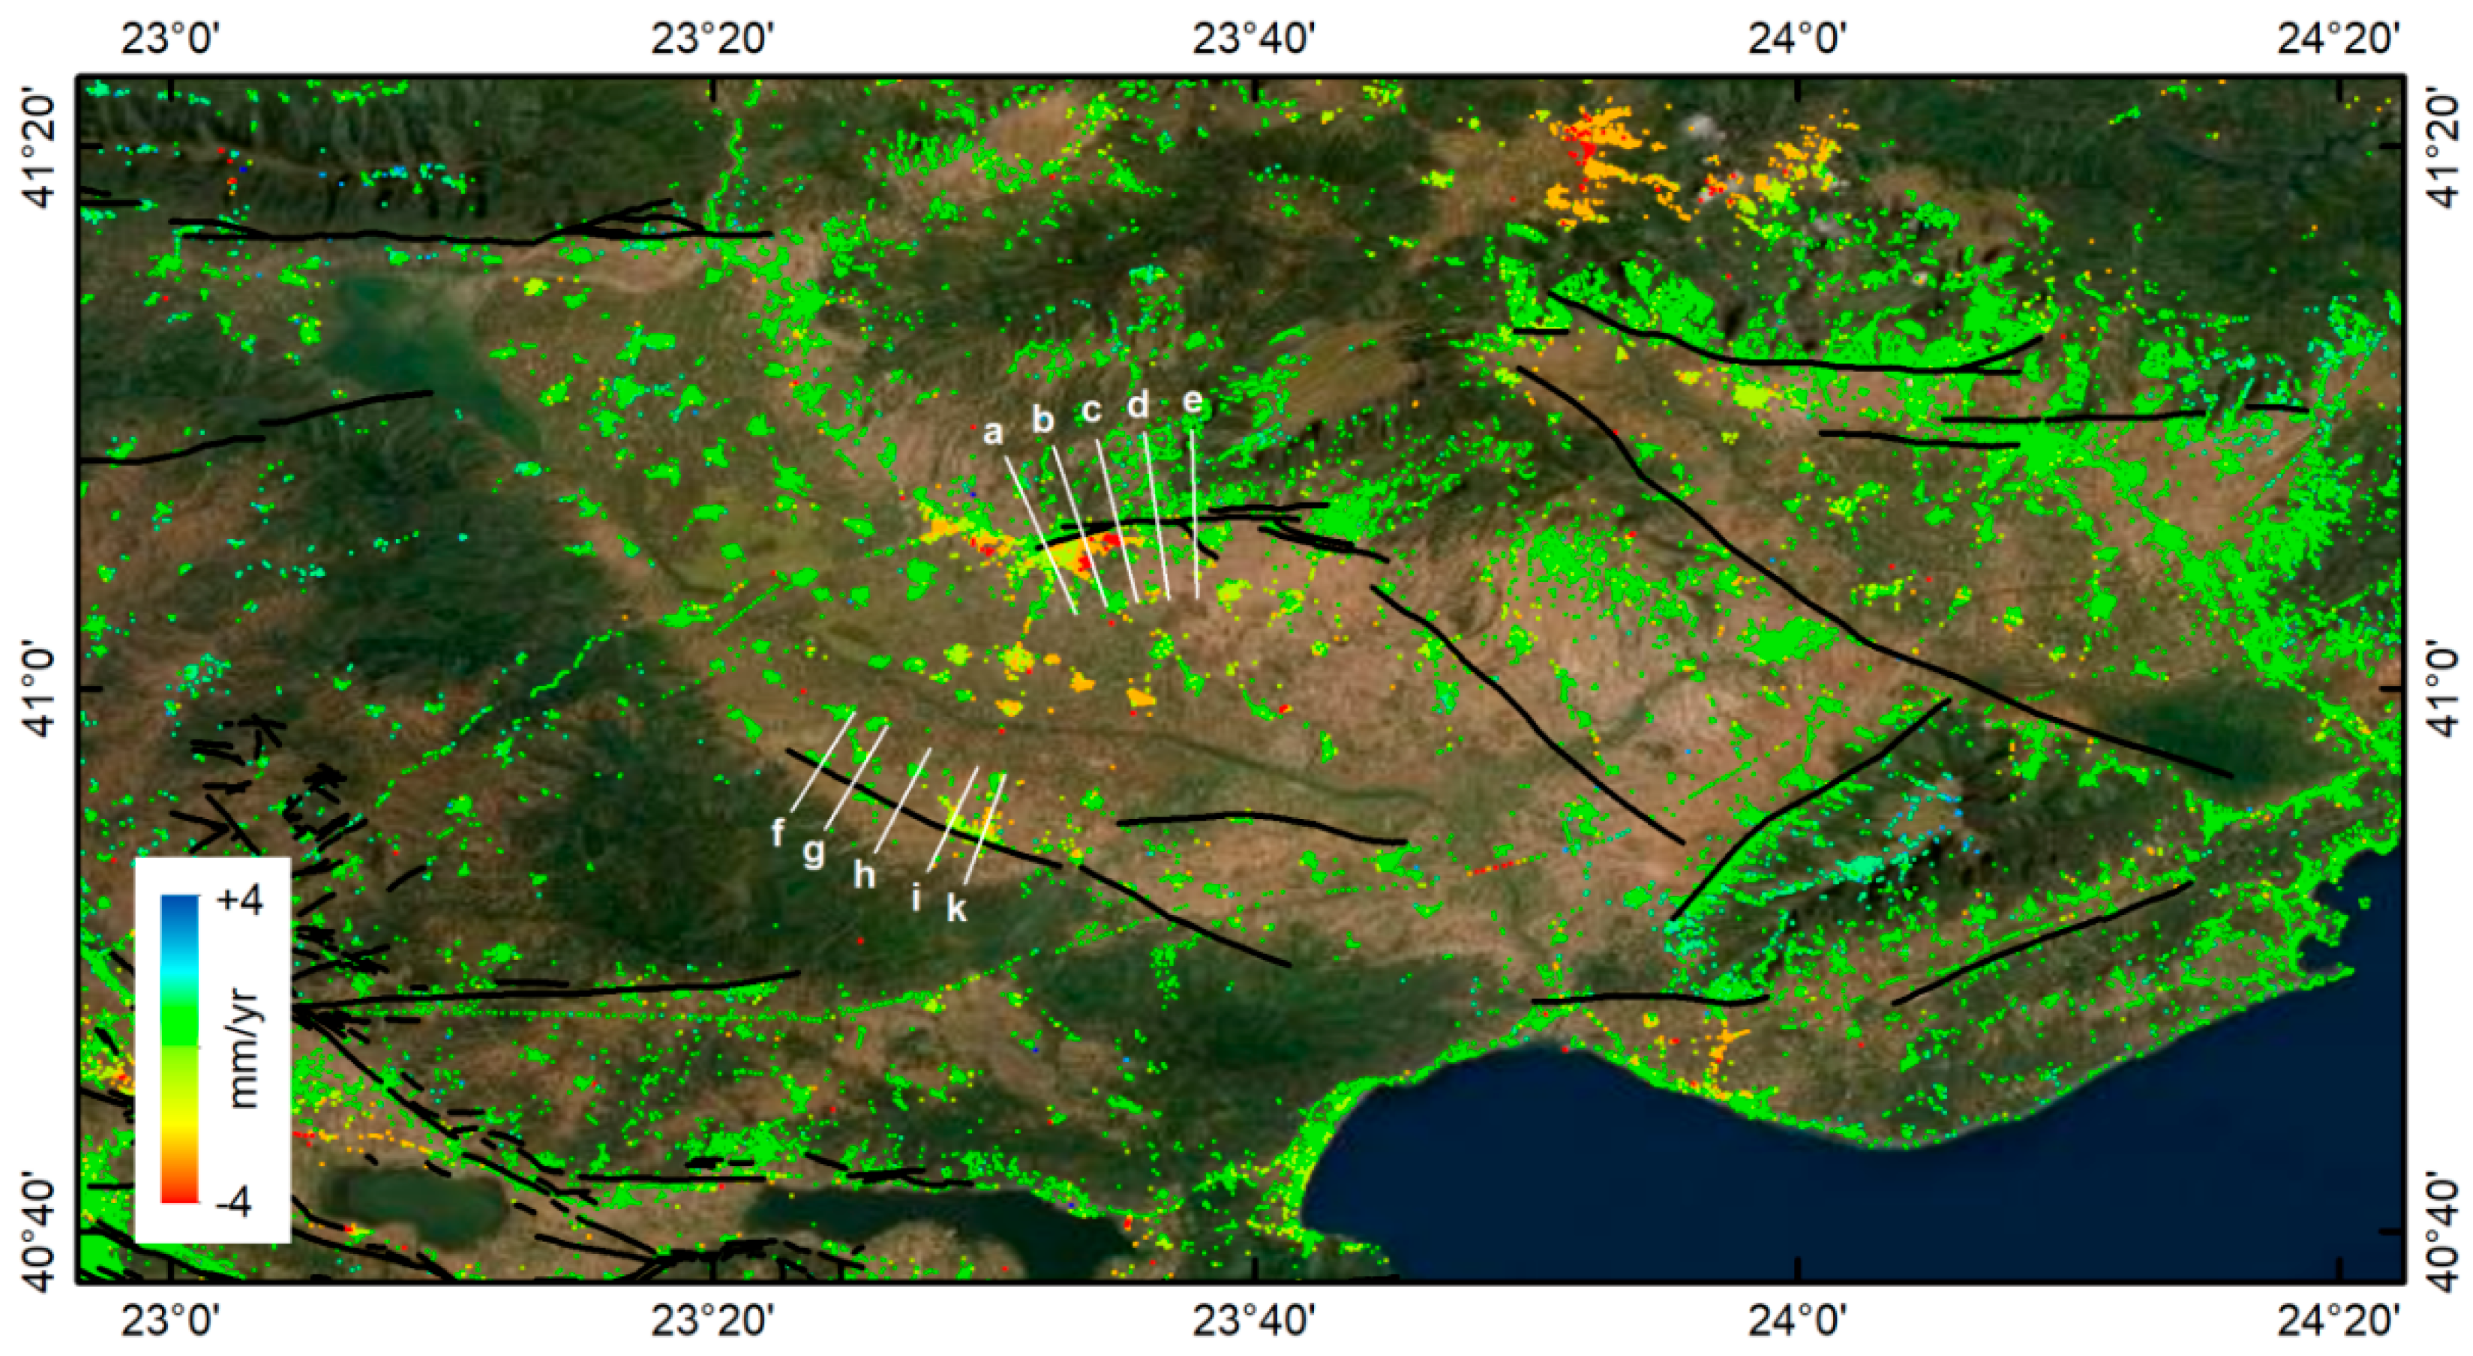
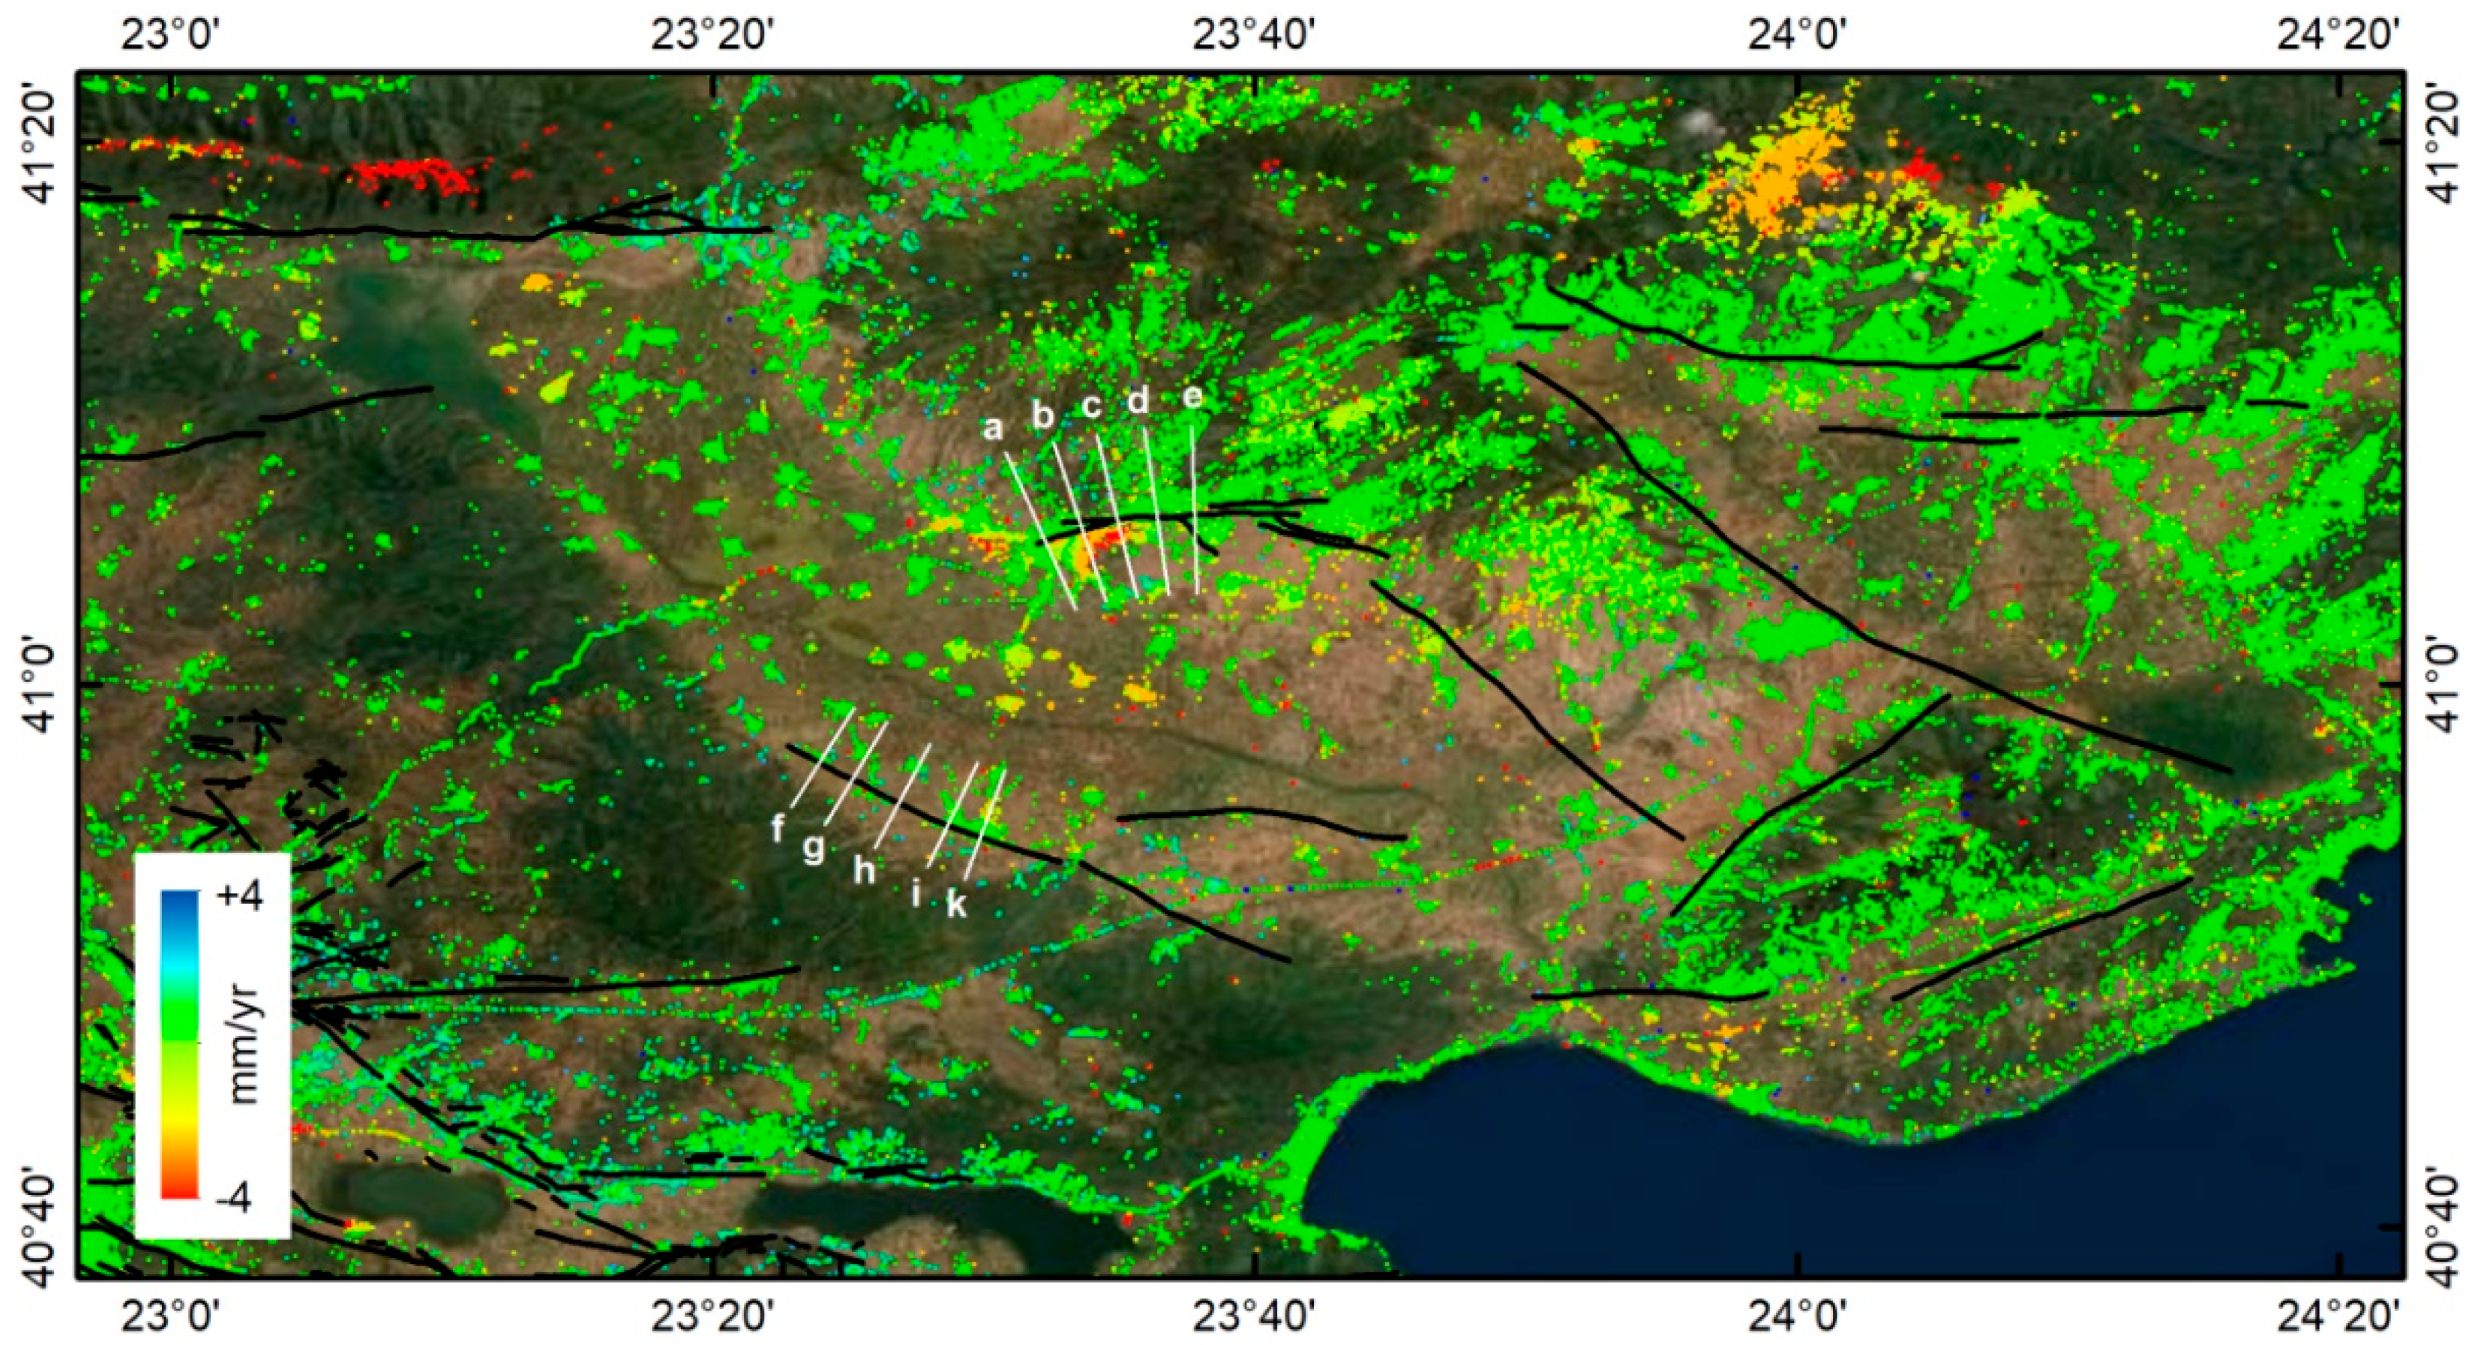
5.2. EO-Based Terrain Motion Measurements

Interferometric PSI processing revealed multi-temporal ground displacements over the entire Strymon basin, including the surrounding mountain ranges (Figure 8 and Figure 9). Following SNAPPING PSI processing, approx. 50 k and 70 k point targets were detected for the ascending and descending tracks, respectively. This can be translated to an average density of 6–8 points per square kilometer, which is acceptable given the processing parameters used (low amplitude dispersion), the significant vegetation cover (i.e., agricultural lands and forested regions), and the medium-resolution PSI service used. PS points are located, as expected for the PSI technique, mainly over buildup areas and non-vegetated natural terrain.
The overall agreement between the independent geodetic techniques (i.e., GNSS and InSAR) for the calculated annual motion rates is clearly shown in Figure S1. Correspondingly, observations from different SAR geometries show consistency in terms of recognized patterns and motion sign, which serves as an inter-verification of results by independent EO datasets. For the majority of point measurements (approx. 95%), displacement rates do not exceed ±2 mm/yr, and are within the uncertainties of the PSI measurements (an order of a couple of millimeters per year; see Supplementary Figures S2 and S3). This signifies for the overall stability of the area or for the presence of rather low motion gradients.
Regions of relatively higher displacement gradients, reaching −16 mm/yr, correspond to local patterns (i.e., subsidence) that are mostly recognized on flat areas within Strymon basin (Figure 8 and Figure 9). The circular to elliptical shape of these local patterns most probably relates to groundwater extraction phenomena. The temporal variability of ground displacements for these areas, as derived by the analysis of the corresponding time series (Figure 10), also highlights the relationship of these temporal deformations to water table variations in underground aquifers [124,125]. Positive motion rates, negligible in terms of magnitude, and corresponding to uplift at the highest parts of the mountains, can be attributed to a residual topo-dependent atmospheric signal that has not been compensated for.
Focusing on more tectonic-related signals, the lack of linear patterns along the fault zones at the boundary of the basin does not allow for the correlation of any InSAR signal to the interseismic long-term slip-rates of these tectonic structures. This is more evident given that the PSI displacement rates do not exceed the obtained uncertainties nearby these fault zones and in the vicinity of regions of high strain accumulation, as indicated by the geodetic GNSS analysis. Further investigation by means of spatial profiles across fault zones clearly shows maximum motion occurring, not at the edge of the mountain ranges, but relatively shifted towards the center of the sedimentary basin (Figure 11). Deviations between measured PSI displacement rates from different viewing geometries should be, at least partially, related to the contribution of horizontal components, especially at the margins of regions showing relatively high subsidence rates.
Hence, apart from the co-interpretation of independent results from different SAR geometries, the investigation of the actual motion components (vertical and E–W) provides valuable insights on the nature of motion and the corresponding deformation sources. It is worth noting that most of the deformation patterns recognized in the different SAR geometries are maintained in the vertical motion component, whereas motion in the E–W direction is practically insignificant, with rates ranging within 1–2 mm/yr (Supplementary Figures S4 and S5).
The absence of a pronounced tectonic-related signal in the InSAR measurements poses no requirement for processing complementary satellite tracks (i.e., different satellite orbits) or PSI reprocessing at a higher spatial resolution. This is also valid since a majority of the surface discontinuities (i.e., basin margins and terrain slopes) are well sampled by the already acquired results.

6. Discussion

The combination of different techniques and methods is crucial for better assessing the tectonic regime of a region, as different aspects are enlightened. Initially, the GNSS data analysis indicates a low strain pattern for the broader Strymon region, except for a few locations, mostly lying at the eastern boundary of the Strymon basin. These data compare well with existing geological data derived from palaeoseismic trenching, which similarly highlight the most significant tectonic activity at the eastern part of the study area. Regarding the InSAR analysis, no horizontal rates (e.g., below resolution) have been traced in the E–W direction, whereas limited vertical motions have been recorded at the eastern margin. Although GNSS, INSAR, and geological data may partially differ, since they cover different time periods, they all indicate that the area is characterized by relatively low extensional deformation that is predominantly localized in the eastern part of Strymon basin.
Spatially detailed information on the vertical motion component by InSAR indicates that relatively higher subsidence rates are limited within the quaternary deposits of the Strymon basin and predominantly towards the immediate hanging wall of the Serres fault zone. These correspond to localized patterns not easily attributed to tectonics, but mostly to groundwater extraction, while their temporal behavior that reflects the seasonal variability of the groundwater table indirectly confirms the above statement (Figure 10).
Regarding the average horizontal motion of the study area, the V results are in accordance with the geodynamic regime of the broader Aegean region. In fact, the northmost Aegean region, where our study area belongs to, shows a slower ca. southward motion compared to the central and southern parts of the Aegean, where the velocity gradually, but also rapidly, increases. The V results show consistency with other geodetic investigations conducted in the wider Aegean region [7,14,107].
After correlating the geodetic strain parameters with the major active tectonic structures, it becomes clear that the highest extension occurs where the E–W-trending Serres fault and the NW–SE-trending Nea Zichni fault are located. Both structures are recognized as normal faults (Serres as a pure normal fault and Nea Zichni as a predominant normal fault with a possible minor strike-slip component). The Serres fault has a clear imprint on the topography, as well as in the hydrographic network. On the other hand, the Nea Zichni fault has also been studied through palaeoseismic trenching, confirming its Holocene activity and showing that deformation is widely distributed in several parallel strands.
To a lesser but certain degree, geodetic analysis marks some tectonic activity at the western Strymon basin’s margin. In particular, moderate values of geodetic parameters are documented in the northwestern part of the study area, south of Kerkini Lake and NW of the village of Zevgolatio. Within this area, a dense concentration of epicenters is also shown in Figure 1, completing the geodetic results. Until now, no active tectonic structures had been identified or mapped in this part of the Strymon basinal margin. Along the same margin, further to the southeast, NE-dipping marginal faults do occur. All evidence and indications suggest the northwestward continuation of the marginal faults up to Lake Kerkini with the missing ‘Zevgolatio fault’. However, one may wonder whether these results and observations belong to an antithetic fault along the opposite side of the basin. The possibility of the occurrence of such a fault along the northeastern margin of the Strymon basin cannot be excluded; on the contrary, it is quite probable that the entire eastern margin of the basin, from Nea Zichni to Sidirokastro and the Belles fault zone, is tectonically controlled.
Therefore, considering the geodetic parameters’ spatial distribution, as well as the local-scale tectonic setting (i.e., the E–W, south-dipping Belles–Kerkini fault zone, located north of Kerkini Lake), it is assumed that a potential, non-identified, antithetic, normal dip-slip fault occurs in this part, forming a graben with the (antithetic) Belles–Kerkini fault zone; however, this significant geodetically derived strain may also correlate with the NW–SE-trending boundary of the Pliocene basin, indicating potential tectonic activity. On the other hand, limited tectonic activity is imprinted in the geodetic results of the western–southwestern part of the study area. Whatever the answer, we are afraid that it cannot be resolved with current data. Future studies might examine further the possible causes of the moderate strain we have measured.
Given that the active faults in our area of interest mostly occupy the basinal margins and sometimes cross the inner parts of the basins, it is almost impossible to detect the full extent of these structures within the basins with simple geological observations. The main reasons for this are three-fold: (i) the sediments that fill the basins can quickly cover any recent fault trace, (ii) the geomorphic markers that faults leave are prone to erosion since the affected formations are recent unconsolidated sediments, and (iii) the agricultural activities that wipe out any fault trace. Fault detection in such conditions requires costly surveys, usually geophysical and/or palaeoseismological ones, which also need some indications to applying them at the proper location. The high deformational values around the Serres fault and their western, basinward extension strongly suggest that the fault trace is further prolongated westwards for approx. 9 km. This is a nice example of how geodetic data can provide key information on active fault lengths. In terms of seismic hazard assessment (SHA), such information is crucial for the earthquake potential of a seismic source. Especially for the deterministic assessment of a seismic hazard (DSHA), earthquake magnitude depends on the fault length and ground motion simulation of a site, which can also be affected by the parameters of the seismic source.
Comparing our strain results with the previous studies’, they show adequate consistency both in the extension values and in the documented direction of extension, which varies between N–S [16,52] and NE–SW [7,8,17,51,126,127]. In addition, our results show common characteristics with the local work of Mouslopoulou et al. [58] despite differences in the input data such as the GNSS stations’ density and networks and the recording interval. To be more specific, we improved the spatial resolution using 16 permanent GNSS stations of five different networks in a smaller area (covering approx. 47,000 km2), in contrast with the 20 permanent GNSS stations of one network scattered within an area that is double the size (approx. 93,000 km2) used by Mouslopoulou et al. [58]. Furthermore, we extended the observation time interval, as our geodetic datasets correspond to a 7-year (84 months) time period, implementing a 30 s-rate (24-h operation) recording, while Mouslopoulou et al. [58] implemented datasets from a 5.5-year (66-month) time period; the solution of each month was based on 48 h of continuous recording. Overall, this study offers a higher spatial resolution in the area surrounding the Strymon basin and a longer but different temporal window.
Despite the consistency, a major difference is spotted at the western boundary of the Strymon basin. According to Mouslopoulou et al. [58], this area accommodates 3.3 mm/yr deformation. Our GNSS, InSAR, and active fault data agree that this part is either inactive or most probably of negligible or low deformation (less than 1 mm/yr), and that strain is mostly accommodated towards the eastern part of the basin. Moreover, Mouslopoulou et al. [58] also referred to the disarray between their geodetic high slip-rate that would require 35–40 m of Holocene displacement with the lack of evidence of recent faulting along the western boundary of the basin. Indeed, such high rates should have exerted a major influence on the stratigraphy, geomorphology, and probably (micro-)seismic activity of the study area. Finally, we believe that, if more active faults were incorporated in their modelling (Sochos, Serres, Nea Zichni, etc.), then the strain would not have localized into one boundary fault, but rather be distributed along several structures.

7. Conclusions

Space geodetic techniques bring to light how much and in which manner the upper crust is deformed, and, consequently, how tectonic processes are occurring at present. The application of this analysis in the broader Strymon basin, which is based on the qualitative and quantitative calculation of specific geodetic strain parameters (MaHE, MiHE, MaxSS, and AS), strongly suggests that the study area is characterized by low predominantly extensional deformation, an outcome that is also supported by the poor seismic activity and the low slip-rate faults. Hence, considering the GNSS results, combined with the InSAR analysis, the following concluding remarks are drawn:
  • A dominant N–S (up to NE–SW) direction of extension is documented by the geodetic parameters, which is responsible for the major E–W (up to NW–SE) fault zones observed throughout the Strymon basin;
  • The eastern margin of Strymon basin includes the most tectonically active structures (e.g., Serres and Tholos–Nea Zichni dip-slip, normal fault zones) of the study area; the Belles–Kerkini dip-slip, normal fault zone, located at the northwestern part, may be considered potentially active. It is noted that the Serres fault zone accommodates the greatest strain within the study area;
  • The southwestern margin of the Strymon basin shows much lower, but not negligible, deformation. This deformation could be associated with the low and scattered seismicity in this area. According to the deformation indices, shear faulting is the expected kinematics;
  • GNSS data indicate some moderate strain rates at the northwest boundary of the Strymon basin (southeast of Lake Kerkini and near Zevgolatio), implying that some are highlighted by both deformational parameters and seismic activity;
  • The strain parameters suggest that the Serres fault zone should be further extended to the west, indicating that its length has been underestimated;
  • The geotectonically related GNSS results (V parameter) highlight the SSE motion of the study area, being consistent with the Aegean microplate motion, which moves towards the Hellenic Subduction Zone;
  • No horizontal rates have been traced by InSAR in the E–W direction along the study area; if they do exist, they would be below resolution (less than 2 mm/yr);
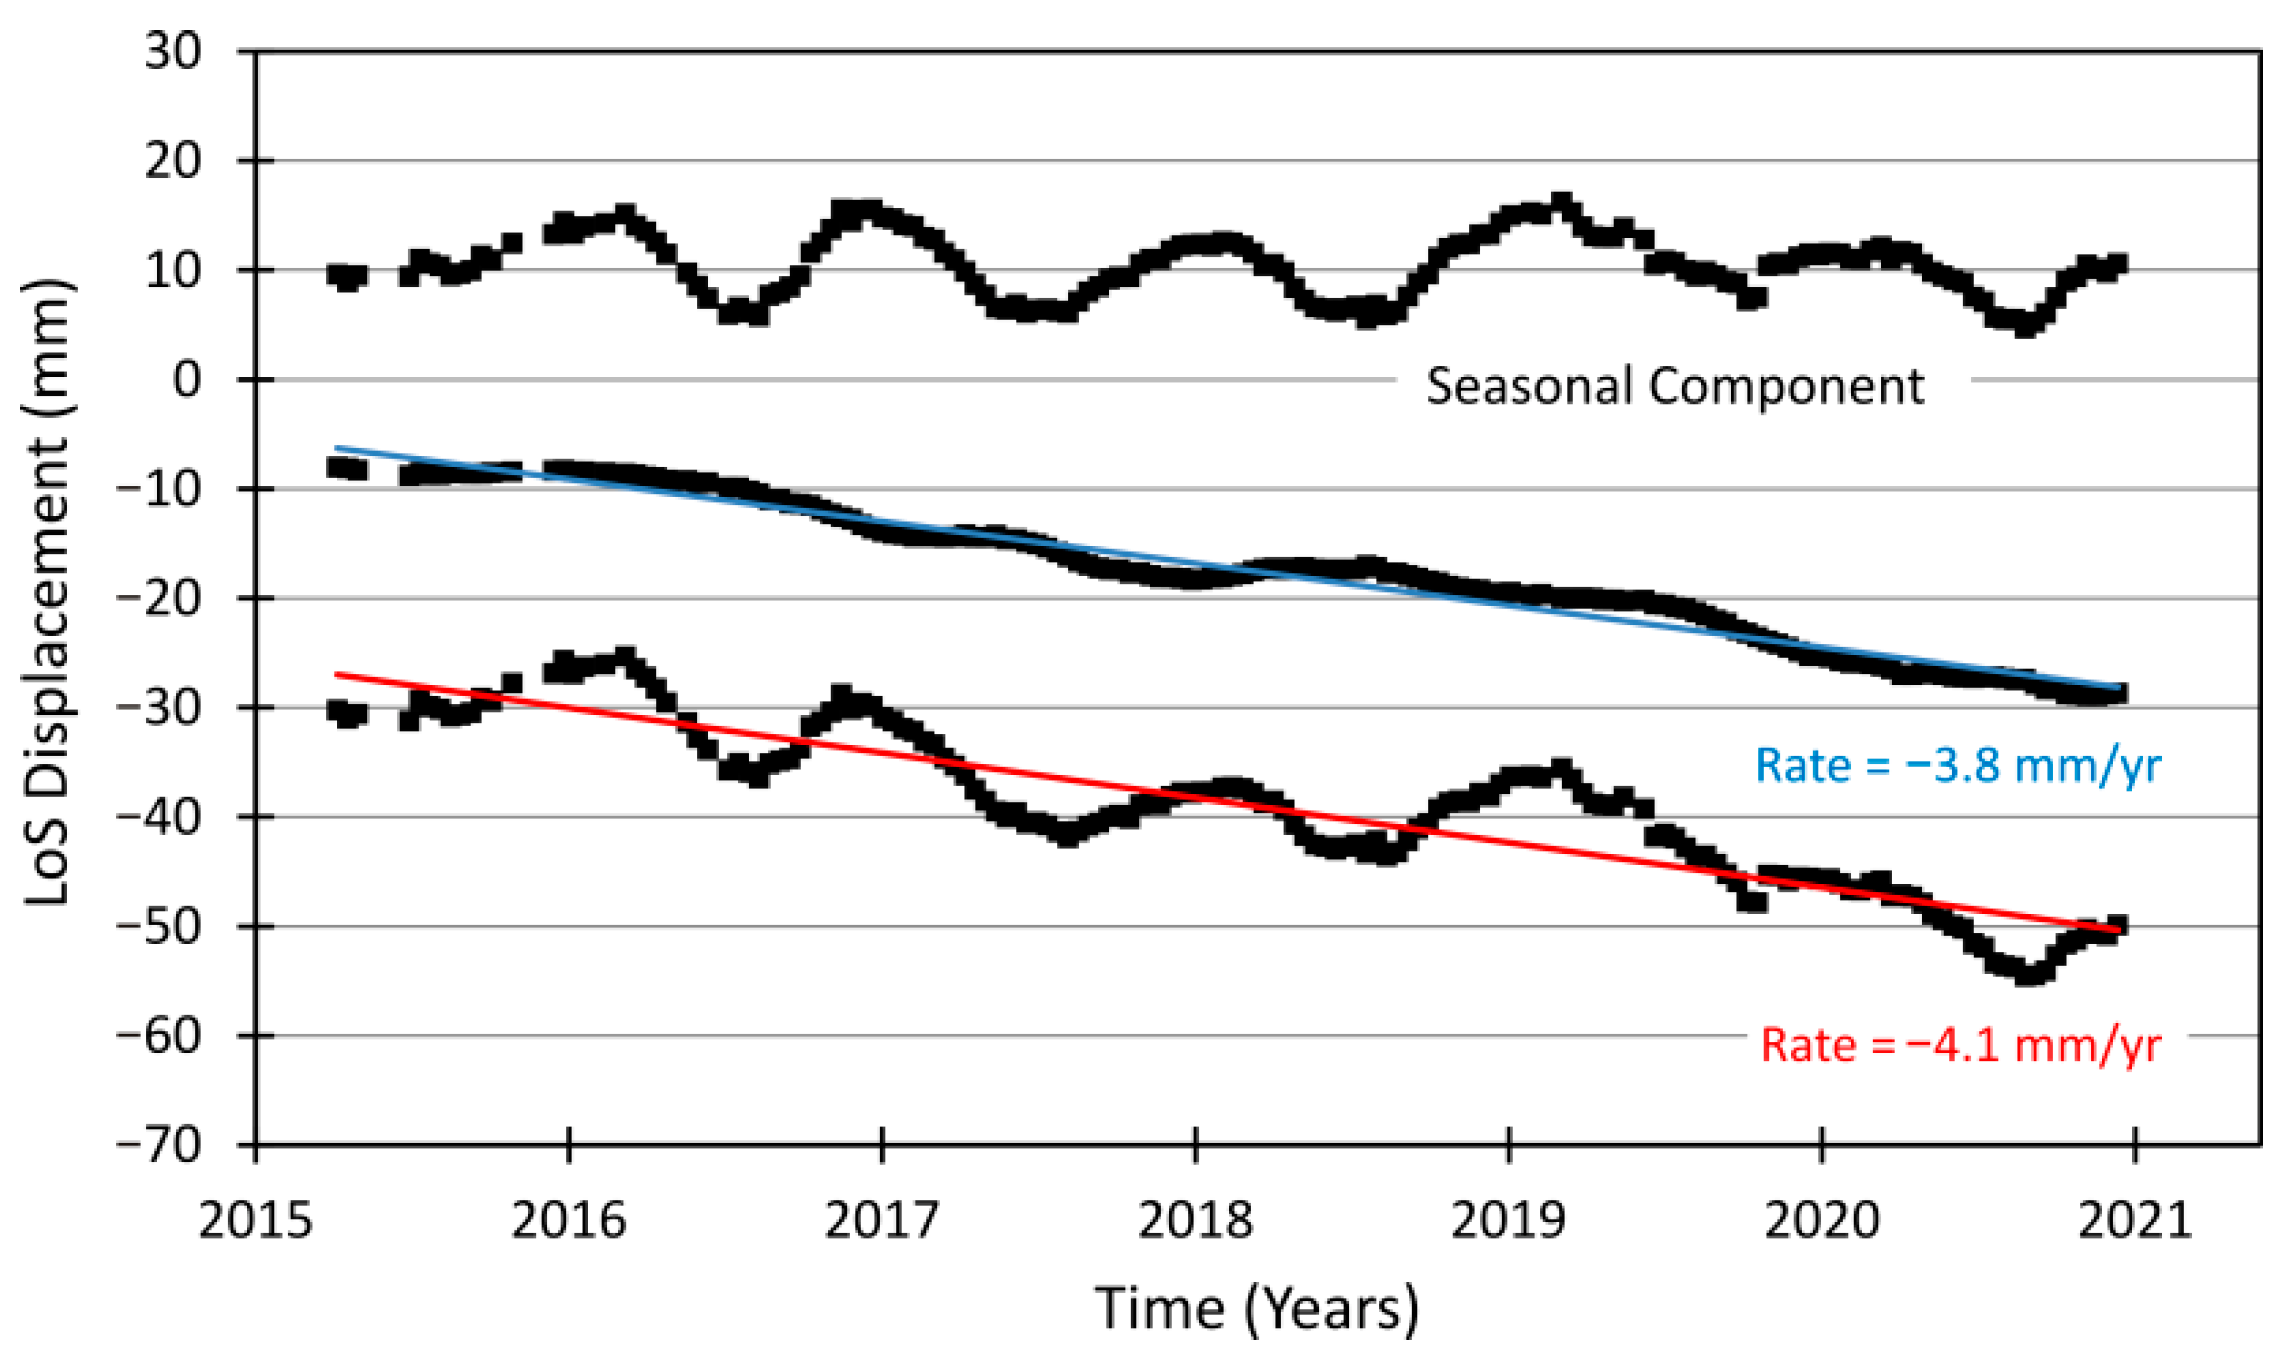
  • Vertical InSAR subsidence of a few mm/yr is traced in the immediate hanging wall of the Serres fault zone, within the Quaternary basin; however, it is mainly attributed to non-tectonic effects such as groundwater extraction;
  • The detection of potential active faults in areas where geodetic strain is recorded, but active faults have not been mapped, or the prolongation of fault traces in areas where local conditions prevent direct observations, highlight the essential role of satellite geodesy and InSAR in the process of seismic hazard assessment, as it may decisively contribute to the determination of fault properties.

Supplementary Materials

The following supporting information can be downloaded at: https://www.mdpi.com/article/10.3390/app12189391/s1, Figure S1: C (vertical component), for GNSS sites located over the InSAR processing extend. The closest PS target to the GNSS sites, within a search radius of 200 m, was considered. The corresponding measurements’ uncertainties for each technique are also shown (error bars).; Figure S2: Uncertainties of PSI displacement rates for Sentinel-1 ascending track 102 (2015–2020); Figure S3: Uncertainties of PSI displacement rates for Sentinel-1 descending track 7 (2015–2020); Figure S4: Vertical displacement rates for the period 2015–2020 at 200 m spatial resolution, as derived by combining ascending and descending PSI measurements. Positive values correspond to uplift, whereas negative values to subsidence; Figure S5: E–W displacement rates for the period 2015–2020 at 200 m spatial resolution, as derived by combining ascending and descending PSI measurements. Positive values correspond to motion towards East, whereas negative ones correspond to westward motion.

Author Contributions

Conceptualization, I.L. and I.P.; methodology, I.L. and C.P.; software, I.L. and M.F.; validation, I.L., M.F. and C.P.; formal analysis, I.L., I.P. and S.S.; investigation, I.L., I.P. and S.S.; resources, I.L., I.P., S.S., M.F. and C.P.; data curation, I.L., S.S. and M.F.; writing—original draft preparation, I.L. and S.S.; writing—review and editing, I.L., I.P., S.S., M.F. and C.P.; visualization, S.S. and M.F.; supervision, I.P. and C.P.; project administration, I.L. and I.P. All authors have read and agreed to the published version of the manuscript.

Funding

This research received no external funding.

Institutional Review Board Statement

Not applicable.

Informed Consent Statement

Not applicable.

Data Availability Statement

Not applicable.

Acknowledgments

The authors would like to thank NOANET (www.gein.noa.gr (accessed on 23 March 2018)), the HxGN/SmartNet (www.metricanet.gr (accessed on 19 August 2017)), the HermesNet of AUTh (users.auth.gr/cpik (accessed on 10 April 2016)) and HEPOS (www.hepos.gr (accessed on 20 May 2017)) for providing the geodetic data.

Conflicts of Interest

The authors declare no conflict of interest.

References

  1. Billiris, H.; Paradissis, D.; Veis, G.; England, P.; Featherstone, W.; Parsons, B.; Cross, P.; Rands, P.; Rayson, M.; Sellers, P.; et al. Geodetic Determination of Tectonic Deformation in Central Greece from 1900 to 1988. Nature 1991, 350, 124–129. [Google Scholar] [CrossRef]
  2. Rossikopoulos, D.; Fotiou, A.; Livieratos, E.; Baldi, P. A Rigorous Analysis of GPS Data to Detect Crustal Deformations. Application in the Area of the Ionian Sea. Tectonophysics 1998, 294, 271–280. [Google Scholar] [CrossRef]
  3. Wilkinson, M.W.; McCaffrey, K.J.W.; Jones, R.R.; Roberts, G.P.; Holdsworth, R.E.; Gregory, L.C.; Walters, R.J.; Wedmore, L.; Goodall, H.; Iezzi, F. Near-Field Fault Slip of the 2016 Vettore Mw 6.6 Earthquake (Central Italy) Measured Using Low-Cost GNSS. Sci. Rep. 2017, 7, 4612. [Google Scholar] [CrossRef] [PubMed]
  4. Papanikolaou, I.D.; van Balen, R.; Silva, P.G.; Reicherter, K. Geomorphology of Active Faulting and Seismic Hazard Assessment: New Tools and Future Challenges. Geomorphology 2015, 237, 1–13. [Google Scholar] [CrossRef]
  5. Faure Walker, J.P.; Roberts, G.P.; Cowie, P.A.; Papanikolaou, I.D.; Sammonds, P.R.; Michetti, A.M.; Phillips, R.J. Horizontal Strain-Rates and Throw-Rates across Breached Relay Zones, Central Italy: Implications for the Preservation of Throw Deficits at Points of Normal Fault Linkage. J. Struct. Geol. 2009, 31, 1145–1160. [Google Scholar] [CrossRef]
  6. Holt, W.E.; Li, M.; Haines, A.J. Earthquake Strain Rates and Instantaneous Relative Motions within Central and Eastern Asia. Geophys. J. Int. 1995, 122, 569–593. [Google Scholar] [CrossRef]
  7. Hollenstein, C.; Müller, M.D.; Geiger, A.; Kahle, H.G. Crustal Motion and Deformation in Greece from a Decade of GPS Measurements, 1993–2003. Tectonophysics 2008, 449, 17–40. [Google Scholar] [CrossRef]
  8. Chousianitis, K.; Ganas, A.; Evangelidis, C.P. Strain and Rotation Rate Patterns of Mainland Greece from Continuous GPS Data and Comparison between Seismic and Geodetic Moment Release. J. Geophys. Res. Solid Earth 2015, 120, 3909–3931. [Google Scholar] [CrossRef]
  9. Iezzi, F.; Roberts, G.; Faure Walker, J.; Papanikolaou, I.; Ganas, A.; Deligiannakis, G.; Beck, J.; Wolfers, S.; Gheorghiu, D. Temporal and Spatial Earthquake Clustering Revealed through Comparison of Millennial Strain-Rates from 36Cl Cosmogenic Exposure Dating and Decadal GPS Strain-Rate. Sci. Rep. 2021, 11, 23320. [Google Scholar] [CrossRef]
  10. Crosetto, M.; Solari, L.; Mróz, M.; Balasis-Levinsen, J.; Casagli, N.; Frei, M.; Oyen, A.; Moldestad, D.A.; Bateson, L.; Guerrieri, L.; et al. The Evolution of Wide-Area DInSAR: From Regional and National Services to the European Ground Motion Service. Remote Sens. 2020, 12, 2043. [Google Scholar] [CrossRef]
  11. Wright, T.; Parsons, B.; Fielding, E. Measurement of Interseismic Strain Accumulation across the North Anatolian Fault by Satellite Radar Interferometry. Geophys. Res. Lett. 2001, 28, 2117–2120. [Google Scholar] [CrossRef]
  12. Burchfiel, B.C. New Technology; New Geological Challenges. GSA Today 2004, 14, 4–10. [Google Scholar] [CrossRef]
  13. Papanikolaou, I.D.; Roberts, G.P.; Michetti, A.M. Fault Scarps and Deformation Rates in Lazio–Abruzzo, Central Italy: Comparison between Geological Fault Slip-Rate and GPS Data. Tectonophysics 2005, 408, 147–176. [Google Scholar] [CrossRef]
  14. McClusky, S.; Balassanian, S.; Barka, A.; Demir, C.; Ergintav, S.; Georgiev, I.; Gurkan, O.; Hamburger, M.; Hurst, K.; Kahle, H.; et al. Global Positioning System Constraints on Plate Kinematics and Dynamics in the Eastern Mediterranean and Caucasus. J. Geophys. Res. 2000, 105, 5695. [Google Scholar] [CrossRef]
  15. Vernant, P.; Fadil, A.; Mourabit, T.; Ouazar, D.; Koulali, A.; Davila, J.M.; Garate, J.; McClusky, S.; Reilinger, R. Geodetic Constraints on Active Tectonics of the Western Mediterranean: Implications for the Kinematics and Dynamics of the Nubia-Eurasia Plate Boundary Zone. J. Geodyn. 2010, 49, 123–129. [Google Scholar] [CrossRef]
  16. Müller, M.D.; Geiger, A.; Kahle, H.G.; Veis, G.; Billiris, H.; Paradissis, D.; Felekis, S. Velocity and Deformation Fields in the North Aegean Domain, Greece, and Implications for Fault Kinematics, Derived from GPS Data 1993-2009. Tectonophysics 2013, 597–598, 34–49. [Google Scholar] [CrossRef]
  17. D’Agostino, N.; Métois, M.; Koci, R.; Duni, L.; Kuka, N.; Ganas, A.; Georgiev, I.; Jouanne, F.; Kaludjerovic, N.; Kandić, R. Active Crustal Deformation and Rotations in the Southwestern Balkans from Continuous GPS Measurements. Earth Planet. Sci. Lett. 2020, 539, 116246. [Google Scholar] [CrossRef]
  18. Le Pichon, X.; Angelier, J. The Hellenic Arc and Trench System: A Key to the Neotectonic Evolution of the Eastern Mediterranean Area. Tectonophysics 1979, 60, 1–42. [Google Scholar] [CrossRef]
  19. Kokkalas, S.; Xypolias, P.; Koukouvelas, I.; Doutsos, T. Postcollisional Contractional and Extensional Deformation in the Aegean Region. Spec. Pap. Geol. Soc. Am. 2006, 409, 97–123. [Google Scholar] [CrossRef]
  20. Jolivet, L.; Faccenna, C.; Huet, B.; Labrousse, L.; le Pourhiet, L.; Lacombe, O.; Lecomte, E.; Burov, E.; Denèle, Y.; Brun, J.P.; et al. Aegean Tectonics: Strain Localisation, Slab Tearing and Trench Retreat. Tectonophysics 2013, 597–598, 1–33. [Google Scholar] [CrossRef] [Green Version]
  21. Jolivet, L.; Menant, A.; Clerc, C.; Sternai, P.; Bellahsen, N.; Leroy, S.; Pik, R.; Stab, M.; Faccenna, C.; Gorini, C. Extensional Crustal Tectonics and Crust-Mantle Coupling, a View from the Geological Record. Earth-Sci. Rev. 2018, 185, 1187–1209. [Google Scholar] [CrossRef]
  22. Schmid, S.M.; Fügenschuh, B.; Kounov, A.; Maţenco, L.; Nievergelt, P.; Oberhänsli, R.; Pleuger, J.; Schefer, S.; Schuster, R.; Tomljenović, B.; et al. Tectonic Units of the Alpine Collision Zone between Eastern Alps and Western Turkey. Gondwana Res. 2020, 78, 308–374. [Google Scholar] [CrossRef]
  23. Nyst, M.; Thatcher, W. New Constraints on the Active Tectonic Deformation of the Aegean. J. Geophys. Res. B Solid Earth 2004, 109, 1–23. [Google Scholar] [CrossRef]
  24. Reilinger, R.; McClusky, S.; Paradissis, D.; Ergintav, S.; Vernant, P. Geodetic Constraints on the Tectonic Evolution of the Aegean Region and Strain Accumulation along the Hellenic Subduction Zone. Tectonophysics 2010, 488, 22–30. [Google Scholar] [CrossRef]
  25. McNeill, L.C.; Mille, A.; Minshull, T.A.; Bull, J.M.; Kenyon, N.H.; Ivanov, M. Extension of the North Anatolian Fault into the North Aegean Trough: Evidence for Transtension, Strain Partitioning, and Analogues for Sea of Marmara Basin Models. Tectonics 2004, 23, TC2016. [Google Scholar] [CrossRef]
  26. Papanikolaou, D.; Alexandri, M.; Nomikou, P. Active Faulting in the North Aegean Basin. In Postcollisional Tectonics and Magmatism in the Mediterranean Region and Asia; Dilek, Y., Pavlides, S., Eds.; Geological Society of America: Boulder, CO, USA, 2006; Volume 409, pp. 189–209. [Google Scholar] [CrossRef]
  27. Dewey, J.F.; Sengör, A.M.C. Aegean and Surrounding Regions. Complex Multiplate and Continuum Tectonics in a Convergent Zone. Geol. Soc. Am. Bull. 1979, 90, 84–92. [Google Scholar] [CrossRef]
  28. Robertson, A.; Dixon, J. Introduction: Aspects of the Geological Evolution of the Eastern Mediterranean. Geol. Soc. Lond. Spec. Publ. 1984, 17, 1–74. [Google Scholar] [CrossRef]
  29. Mercier, J.L.; Sorel, D.; Vergely, P.; Simeakis, K. Extensional Tectonic Regimes in the Aegean Basins during the Cenozoic. Basin Res. 1989, 2, 49–71. [Google Scholar] [CrossRef]
  30. Mascle, J.; Martin, L. Shallow Structure and Recent Evolution of the Aegean Sea: A Synthesis Based on Continuous Reflection Profiles. Mar. Geol. 1990, 94, 271–299. [Google Scholar] [CrossRef]
  31. Koukouvelas, I.; Aydin, A. Fault Structure and Related Basins of the North Aegean Sea and Its Surroundings. Tectonics 2002, 21, 10-1–10-17. [Google Scholar] [CrossRef]
  32. Papanikolaou, D.J.; Royden, L.H. Disruption of the Hellenic Arc: Late Miocene Extensional Detachment Faults and Steep Pliocene-Quaternary Normal Faults—Or What Happened at Corinth? Tectonics 2007, 26, TC5003. [Google Scholar] [CrossRef]
  33. Jolivet, L.; Brun, J.P. Cenozoic Geodynamic Evolution of the Aegean. Int. J. Earth Sci. 2010, 99, 109–138. [Google Scholar] [CrossRef]
  34. Sternai, P.; Jolivet, L.; Menant, A.; Gerya, T. Driving the Upper Plate Surface Deformation by Slab Rollback and Mantle Flow. Earth Planet. Sci. Lett. 2014, 405, 110–118. [Google Scholar] [CrossRef]
  35. Sboras, S.; Chatzipetros, A.; Pavlides, S.B. North Aegean Active Fault Pattern and the 24 May 2014, Mw 6.9 Earthquake. In Active Global Seismology: Neotectonics and Earthquake Potential of the Eastern Mediterranean Region; American Geophysical Union (AGU); John Wiley & Sons, Inc.: Hoboken, NJ, USA, 2017; pp. 239–272. [Google Scholar]
  36. Bocchini, G.M.; Brüstle, A.; Becker, D.; Meier, T.; van Keken, P.E.; Ruscic, M.; Papadopoulos, G.A.; Rische, M.; Friederich, W. Tearing, Segmentation, and Backstepping of Subduction in the Aegean: New Insights from Seismicity. Tectonophysics 2018, 734–735, 96–118. [Google Scholar] [CrossRef]
  37. Brun, J.P.; Sokoutis, D. Core Complex Segmentation in North Aegean, A Dynamic View. Tectonics 2018, 37, 1797–1830. [Google Scholar] [CrossRef]
  38. Lybéris, N. Tectonic Evolution of the North Aegean Trough. Geol. Soc. Lond. Spec. Publ. 1984, 17, 709–725. [Google Scholar] [CrossRef]
  39. Pavlides, S.; Kilias, A. Neotectonic and Active Faults along the Serbomacedonian Zone (SE Chalkidiki, Northern Greece). Ann. Tecton. 1987, 1, 97–104. [Google Scholar]
  40. Pavlides, S. Active Faulting in Northern Greece: Implications on Engineering Geology. In Proceedings of the International Symposium on Engineering Geology and the Environment, Athens, Greece, 23–27 June 1997; pp. 315–320. [Google Scholar]
  41. Mountrakis, D.; Tranos, M.; Papazachos, C.; Thomaidou, E.; Karagianni, E.; Vamvakaris, D. Neotectonic and Seismological Data Concerning Major Active Faults, and the Stress Regimes of Northern Greece. Geol. Soc. Spec. Publ. 2006, 260, 649–670. [Google Scholar] [CrossRef]
  42. Sboras, S. The Greek Database of Seismogenic Sources: Seismotectonic Implications for North Greece. Ph.D. Thesis, University of Ferrara, Ferrara, Italy, 2011. [Google Scholar]
  43. Caputo, R.; Chatzipetros, A.; Pavlides, S.; Sboras, S. The Greek Database of Seismogenic Sources (GreDaSS): State-of-the-Art for Northern Greece. Ann. Geophys. 2012, 55, 859–894. [Google Scholar] [CrossRef]
  44. Dinter, D.A.; Royden, L. Late Cenozoic Extension in Northeastern Greece: Strymon Valley Detachment System and Rhodope Metamorphic Core Complex. Geology 1993, 21, 45–48. [Google Scholar] [CrossRef]
  45. Papanikolaou, I.; Deligiannakis, G.; Hengesh, J.; Dafnis, P.; Panagopoulos, A.; Lymperis, E. Paleoseismic Trenching and Evaluation of the Symvoli-Fotolivos and Tholos-Nea Zichni Fault Zones in Northern Greece. In Proceedings of the 9th International INQUA Meeting on Paleoseismology, Active Tectonics and Archeoseismology (PATA), Possidi, Greece, 25–27 June 2018; pp. 205–208. [Google Scholar]
  46. Papanikolaou, I.; Dafnis, P.; Deligiannakis, G.; Hengesh, J.; Panagopoulos, A. Active Faults, Paleoseismological Trenching and Seismic Hazard Assessment in the Northern Mygdonia Basin, Northern Greece: The Assiros-Krithia Fault and the Drimos Fault Zone. Quat. Int. 2022. [Google Scholar] [CrossRef]
  47. Papazachos, B.; Papazachou, C. The Earthquakes of Greece, 3rd ed.; Ziti Publications: Thessaloniki, Greece, 2003. [Google Scholar]
  48. Available online: http://www.Gein.Noa.Gr/En/ (accessed on 24 March 2018).
  49. El-Fiky, G.S. Crustal Strains in the Eastern Mediterranean and Middle East as Derived from GPS Observations. Bull. Earthq. Res. Inst. Univ. Tokyo 2000, 75, 105–125. [Google Scholar]
  50. Jenny, S.; Goes, S.; Giardini, D.; Kahle, H.G. Earthquake Recurrence Parameters from Seismic and Geodetic Strain Rates in the Eastern Mediterranean. Geophys. J. Int. 2004, 157, 1331–1347. [Google Scholar] [CrossRef]
  51. Pérouse, E.; Chamot-Rooke, N.; Rabaute, A.; Briole, P.; Jouanne, F.; Georgiev, I.; Dimitrov, D. Bridging Onshore and Offshore Present-Day Kinematics of Central and Eastern Mediterranean: Implications for Crustal Dynamics and Mantle Flow. Geochem. Geophys. Geosyst. 2012, 13. [Google Scholar] [CrossRef]
  52. Martinod, J.; Hatzfeld, D.; Savvaidis, P.; Katsambalos, K. Rapid N-S Extension in the Mygdonian Graben (Northern Greece) Deduced from Repeated Geodetic Surveys. Geophys. Res. Lett. 1997, 24, 3293–3296. [Google Scholar] [CrossRef]
  53. Avallone, A.; Briole, P.; Agatza-Balodimou, A.M.; Billiris, H.; Charade, O.; Mitsakaki, C.; Nercessian, A.; Papazissi, K.; Paradissis, D.; Veis, G. Analysis of Eleven Years of Deformation Measured by GPS in the Corinth Rift Laboratory Area. Comptes Rendus Geosci. 2004, 336, 301–311. [Google Scholar] [CrossRef]
  54. Flerit, F.; Armijo, R.; King, G.; Meyer, B. The Mechanical Interaction between the Propagating North Anatolian Fault and the Back-Arc Extension in the Aegean. Earth Planet. Sci. Lett. 2004, 224, 347–362. [Google Scholar] [CrossRef]
  55. Bernard, P.; Lyon-Caen, H.; Briole, P.; Deschamps, A.; Boudin, F.; Makropoulos, K.; Papadimitriou, P.; Lemeille, F.; Patau, G.; Billiris, H.; et al. Seismicity, Deformation and Seismic Hazard in the Western Rift of Corinth: New Insights from the Corinth Rift Laboratory (CRL). Tectonophysics 2006, 426, 7–30. [Google Scholar] [CrossRef]
  56. Nocquet, J.M. Present-Day Kinematics of the Mediterranean: A Comprehensive Overview of GPS Results. Tectonophysics 2012, 579, 220–242. [Google Scholar] [CrossRef]
  57. Lazos, I.; Sboras, S.; Pikridas, C.; Pavlides, S.; Chatzipetros, A. Geodetic Analysis of the Tectonic Crustal Deformation Pattern in the North Aegean Sea, Greece. Mediterr. Geosci. Rev. 2021, 3, 79–94. [Google Scholar] [CrossRef]
  58. Mouslopoulou, V.; Saltogianni, V.; Gianniou, M.; Stiros, S. Geodetic Evidence for Tectonic Activity on the Strymon Fault System, Northeast Greece. Tectonophysics 2014, 633, 246–255. [Google Scholar] [CrossRef] [Green Version]
  59. Barka, A.A.; Kadinsky-Cade, K. Strike-Slip Fault Geometry in Turkey and Its Influence on Earthquake Activity. Tectonics 1988, 7, 663–684. [Google Scholar] [CrossRef]
  60. Pavlides, S.; Mountrakis, D.; Kilias, A.; Tranos, M. The Role of Strike-Slip Movements in the Extensional Area of Northern Aegean (Greece). A Case of Transtensional Tectonics. Ann. Tecton. 1990, 4, 196–211. [Google Scholar]
  61. Lallemant, S.; Truffert, C.; Jolivet, L.; Henry, P.; Chamot-Rooke, N.; de Voogd, B. Spatial Transition from Compression to Extension in the Western Mediterranean Ridge Accretionary Complex. Tectonophysics 1994, 234, 33–52. [Google Scholar] [CrossRef]
  62. Poulos, S.E.; Lykousis, V.; Collins, M.B.; Rohling, E.J.; Pattiaratchi, C.B. Sedimentation Processes in a Tectonically Active Environment: The Kerkyra-Kefalonia Submarine Valley System (NE Ionian Sea). Mar. Geol. 1999, 160, 25–44. [Google Scholar] [CrossRef]
  63. Le Pichon, X.; Lallemant, S.J.; Chamot-Rooke, N.; Lemeur, D.; Pascal, G. The Mediterranean Ridge Backstop and the Hellenic Nappes. Mar. Geol. 2002, 186, 111–125. [Google Scholar] [CrossRef]
  64. Şengör, A.M.C.; Tüysüz, O.; İmren, C.; Sakınç, M.; Eyidoğan, H.; Görür, N.; le Pichon, X.; Rangin, C. The North Anatolian Fault: A New Look. Annu. Rev. Earth Planet. Sci. 2005, 33, 37–112. [Google Scholar] [CrossRef]
  65. Papanikolaou, D.; Nomikou, P.; Papanikolaou, I.; Lampridou, D.; Rousakis, G.; Alexandri, M. Active Tectonics and Seismic Hazard in Skyros Basin, North Aegean Sea, Greece. Mar. Geol. 2019, 407, 94–110. [Google Scholar] [CrossRef]
  66. Rabaute, A.; Chamot-Rooke, N. Quantitative Mapping of Active Mud Volcanism at the Western Mediterranean Ridge-Backstop Contact. Mar. Geophys. Res. 2007, 28, 271–295. [Google Scholar] [CrossRef]
  67. Özbakir, A.D.; Şengör, A.M.C.; Wortel, M.J.R.; Govers, R. The Pliny–Strabo Trench Region: A Large Shear Zone Resulting from Slab Tearing. Earth Planet. Sci. Lett. 2013, 375, 188–195. [Google Scholar] [CrossRef]
  68. Sakellariou, D.; Rousakis, G.; Vougioukalakis, G.; Ioakim, C.; Panagiotopoulos, I.; Morfis, I.; Zimianitis, E.; Athanasoulis, K.; Tsampouraki-Kraounaki, K.; Mpardis, D.; et al. Deformation Pattern in the Western North Aegean Trough: Preliminary Results. Bull. Geol. Soc. Greece 2016, 50, 124–133. [Google Scholar] [CrossRef]
  69. Pondrelli, S. European-Mediterranean Regional Centroid-Moment Tensors Catalog (RCMT) [Data Set]; Istituto Nazionale di Geofisica e Vulcanologia (INGV): Roma, Italy, 2002. [Google Scholar] [CrossRef]
  70. Papazachos, B.C.; Papazachou, C.B. The Earthquakes of Greece; Ziti Editions: Thessaloniki, Greece, 1997. [Google Scholar]
  71. Burchfiel, C.B.; Nakov, R.; Tzankov, T.; Royden, L.H. Cenozoic Extension in Bulgaria and Northern Greece: The Northern Part of the Aegean Extensional Regime. Geol. Soc. Spec. Publ. 2000, 173, 325–352. [Google Scholar] [CrossRef]
  72. Tranos, M.D.; Kachev, V.N.; Mountrakis, D.M. Transtensional Origin of the NE–SW Simitli Basin along the Strouma (Strymon) Lineament, SW Bulgaria. J. Geol. Soc. Lond. 2008, 165, 499–510. [Google Scholar] [CrossRef]
  73. Tranos, M. Strymon and Strymonikos Gulf Basins (Northern Greece): Implications on Their Formation and Evolution from Faulting. J. Geodyn. 2011, 51, 285–305. [Google Scholar] [CrossRef]
  74. Pavlides, S.; Caputo, R. Magnitude versus Faults’ Surface Parameters: Quantitative Relationships from the Aegean Region. Tectonophysics 2004, 380, 159–188. [Google Scholar] [CrossRef]
  75. Psilovikos, A. Geomorphological and Structural Modification of the Serbomacedonian Massif during the Neotectonic Stage. Tectonophysics 1984, 110, 27–45. [Google Scholar] [CrossRef]
  76. Psilovikos, A.; Papaphilippou, E. Pediments, Alluvial Fans and Neotectonic Movements of the Mt Kerkini/Belassitsa. Geol. Rhodopica 1990, 2, 95–103. [Google Scholar]
  77. Maravelakis, M. Study on the Earthquakes of Chalkidiki; Theodoridou C. Editions: Thessaloniki, Greece, 1936; Volume 7. [Google Scholar]
  78. Kockel, F.; Mollat, H. Geological Map of the Chalkidiki Peninsula and Adjacent Areas (Greece), Scale 1: 100000; Bundesanstalt für Geowissenschaften und Rohstoffe: Hannover, Germany, 1977. [Google Scholar]
  79. Mountrakis, D.; Kilias, A.; Pavlides, S.; Sotiriadis, L.; Psilovikos, A.; Astaras, T.; Vavliakis, E.; Koufos, G.; Dimopoulos, G.; Soulios, G.; et al. Neotectonic Map of Greece, Langadhas Sheet, 1:100000; Earthquake Planning and Protection Organisation and European Center on Prevention and Forecasting of Earthquakes: Thessaloniki, Greece, 1996. [Google Scholar]
  80. Goldsworthy, M.; Jackson, J.; Haines, J. The Continuity of Active Fault Systems in Greece. Geophys. J. Int. 2002, 148, 596–618. [Google Scholar] [CrossRef]
  81. Papazachos, B.C.; Papaioannou, C.A.; Papazachos, C.B.; Savaidis, A.S. Atlas of Isoseismal Maps for Strong Shallow Earthquakes in Greece and Surrounding Area (426 BC–1995); Ziti Publications: Thessaloniki, Greece, 1997. [Google Scholar]
  82. IGME—Institute of Geology and Mineral Exploration Geological Map of Greece. 1:50,000 Scale Map Series, “Serres” Sheet; IGME: Athens, Greece, 1985. [Google Scholar]
  83. Tranos, M. Contribution to the Study of the Neotectonic Deformation in the Region of Central Macedonia and North Aegean; University of Thessaloniki: Thessaloniki, Greece, 1998. [Google Scholar]
  84. Tranos, M.; Mountrakis, D. The Serres Fault Zone (SZF): An Active Fault Zone in Eastern Macedonia (Northern Greece). In Proceedings of the 5th International Symposium on Eastern Mediterranean Geology, Thessaloniki, Greece, 14–20 April 2004; pp. 892–895. [Google Scholar]
  85. IGME—Institute of Geology and Mineral Exploration Geological Map of Greece. 1:500,000 Scale; IGME: Athens, Greece, 1983. [Google Scholar]
  86. Meyer, B.; Armijo, R.; Dimitrov, D. Active Faulting in SW Bulgaria: Possible Surface Rupture of the 1904 Struma Earthquakes. Geophys. J. Int. 2002, 148, 246–255. [Google Scholar] [CrossRef]
  87. Pavlides, S.; Tranos, M. Structural Characteristics of Two Strong Earthquakes in the North Aegean: Ierissos (1932) and Agios Efstratios (1968). J. Struct. Geol. 1991, 13, 205–214. [Google Scholar] [CrossRef]
  88. Chatzipetros, A.; Kokkalas, S.; Pavlides, S.; Koukouvelas, I. Palaeoseismic Data and Their Implication for Active Deformation in Greece. J. Geodyn. 2005, 40, 170–188. [Google Scholar] [CrossRef]
  89. Papazachos, B.; Mountrakis, D.; Psilovikos, A.; Leventakis, G. Surface Fault Traces and Fault Plane Solutions of the May–June 1978 Major Shocks in the Thessaloniki Area, Greece. Tectonophysics 1979, 53, 171–183. [Google Scholar] [CrossRef]
  90. Soufleris, C.; Jackson, J.A.; King, G.C.P.; Spencer, C.A.; Scholz, C.H. The 1978 Earthquake Sequence near Thessaloniki (Northern Greece). Geophys. J. Int. 1982, 68, 429–458. [Google Scholar] [CrossRef]
  91. Voidomatis, P.S.; Pavlides, S.B.; Papadopoulos, G.A. Active Deformation and Seismic Potential in the Serbomacedonian Zone, Northern Greece. Tectonophysics 1990, 179, 1–9. [Google Scholar] [CrossRef]
  92. Tranos, M.; Papadimitriou, E.; Kilias, A. Thessaloniki–Gerakarou Fault Zone (TGFZ): The Western Extension of the 1978 Thessaloniki Earthquake Fault (Northern Greece) and Seismic Hazard Assessment. J. Struct. Geol. 2003, 25, 2109–2123. [Google Scholar] [CrossRef]
  93. Bitharis, S.; Fotiou, A.; Pikridas, C.; Rossikopoulos, D. A New Velocity Field of Greece Based on Seven Years (2008–2014) Continuously Operating GPS Station Data. In Earth and Environmental Sciences for Future Generations; Springer: Cham, Switzerland, 2016; pp. 321–329. [Google Scholar]
  94. Fotiou, A.; Rossikopoulos, D.; Katsougiannopoulos, S.; Tsioukas, V.; Pikridas, C.; Spatalas, S. The Hermes GNSS NtripCaster of AUTh. Bull. Geod. Geophys. 2009, 69, 35–43. [Google Scholar]
  95. Fotiou, A.; Pikridas, C. GPS and Geodetic Applications, 2nd ed.; Ziti Publications: Thessaloniki, Greece, 2012; ISBN 978-960-456-346-3. [Google Scholar]
  96. Boehm, J.; Werl, B.; Schuh, H. Troposphere Mapping Functions for GPS and Very Long Baseline Interferometry from European Centre for Medium-Range Weather Forecasts Operational Analysis Data. J. Geophys. Res. Solid Earth 2006, 111, B02406. [Google Scholar] [CrossRef]
  97. Herring, T.A.; King, R.W.; Floyd, M.A.; Mcclusky, S.C.; GAMIT Reference Manual. GPS Analysis at MIT. 2015. Available online: http://geoweb.mit.edu/gg/docs.php (accessed on 25 February 2016).
  98. Hashimoto, M.; Jackson, D.D. Plate Tectonics and Crustal Deformation around the Japanese Islands. J. Geophys. Res. 1993, 98, 16149. [Google Scholar] [CrossRef]
  99. Shen, Z.K.; Jackson, D.D.; Ge, B.X. Crustal Deformation across and beyond the Los Angeles Basin from Geodetic Measurements. J. Geophys. Res. B Solid Earth 1996, 101, 27957–27980. [Google Scholar] [CrossRef]
  100. Prawirodirdjo, L.; Bock, Y.; Genrich, J.F.; Puntodewo, S.S.O.; Rais, J.; Subarya, C.; Sutisna, S. One Century of Tectonic Deformation along the Sumatran Fault from Triangulation and Global Positioning System Surveys. J. Geophys. Res. Solid Earth 2000, 105, 28343–28361. [Google Scholar] [CrossRef]
  101. Sagiya, T.; Nishimura, T.; Iio, Y.; Tada, T. Crustal Deformation around the Northern and Central Itoigawa-Shizuoka Tectonic Line. Earth Planets Space 2002, 54, 1059–1063. [Google Scholar] [CrossRef]
  102. Yuan, X.; Fu, J.; Sun, H.; Toth, C. The Application of GPS Precise Point Positioning Technology in Aerial Triangulation. ISPRS J. Photogramm. Remote Sens. 2009, 64, 541–550. [Google Scholar] [CrossRef]
  103. Lazos, I.; Pikridas, C.; Chatzipetros, A.; Pavlides, S. Determination of Local Active Tectonics Regime in Central and Northern Greece, Using Primary Geodetic Data. Appl. Geomat. 2020, 13, 3–17. [Google Scholar] [CrossRef]
  104. Lazos, I.; Stergiou, C.L.; Chatzipetros, A.; Pikridas, C.; Bitharis, S.; Melfos, V. Active Tectonics (Extensional Regime and Rotations) and Tertiary Mineralization Occurrences within Central Macedonia, Greece. In Proceedings of the 9th International INQUA Meeting on Paleoseismology, Active Tectonics and Archeoseismology (PATA), Possidi, Greece, 25–27 June 2018; pp. 145–148. [Google Scholar]
  105. Lazos, I.; Sboras, S.; Chousianitis, K.; Kondopoulou, D.; Pikridas, C.; Bitharis, S.; Pavlides, S. Temporal Evolution of Crustal Rotation in the Aegean Region Based on Primary Geodetically-Derived Results and Palaeomagnetism. Acta Geod. Geophys. 2022, 57, 317–334. [Google Scholar] [CrossRef]
  106. Available online: http://www.unavco.org (accessed on 30 January 2016).
  107. Reilinger, R.; McClusky, S.; Vernant, P.; Lawrence, S.; Ergintav, S.; Cakmak, R.; Ozener, H.; Kadirov, F.; Guliev, I.; Stepanyan, R.; et al. GPS Constraints on Continental Deformation in the Africa-Arabia-Eurasia Continental Collision Zone and Implications for the Dynamics of Plate Interactions. J. Geophys. Res. Solid Earth 2006, 111, B05411. [Google Scholar] [CrossRef]
  108. Hackl, M.; Malservisi, R.; Wdowinski, S. Strain Rate Patterns from Dense GPS Networks. Nat. Hazards Earth Syst. Sci. 2009, 9, 1177–1187. [Google Scholar] [CrossRef]
  109. Blasco, J.M.D.; Foumelis, M.; Stewart, C.; Hooper, A. Measuring Urban Subsidence in the Rome Metropolitan Area (Italy) with Sentinel-1 SNAP-StaMPS Persistent Scatterer Interferometry. Remote Sens. 2019, 11, 129. [Google Scholar] [CrossRef]
  110. Aslan, G.; Foumelis, M.; Raucoules, D.; de Michele, M.; Bernardie, S.; Cakir, Z. Landslide Mapping and Monitoring Using Persistent Scatterer Interferometry (PSI) Technique in the French Alps. Remote Sens. 2020, 12, 1305. [Google Scholar] [CrossRef]
  111. Vassilakis, E.; Foumelis, M.; Erkeki, A.; Kotsi, E.; Lekkas, E. Post-Event Surface Deformation of Amyntaio Slide (Greece) by Complementary Analysis of Remotely Piloted Airborne System Imagery and SAR Interferometry. Appl. Geomat. 2021, 13, 65–75. [Google Scholar] [CrossRef]
  112. Lemoine, A.; Briole, P.; Bertil, D.; Roullé, A.; Foumelis, M.; Thinon, I.; Raucoules, D.; de Michele, M.; Valty, P.; Colomer, R.H. The 2018–2019 Seismo-Volcanic Crisis East of Mayotte, Comoros Islands: Seismicity and Ground Deformation Markers of an Exceptional Submarine Eruption. Geophys. J. Int. 2020, 223, 22–44. [Google Scholar] [CrossRef]
  113. Karakostas, V.; Papazachos, C.; Papadimitriou, E.; Foumelis, M.; Kiratzi, A.; Pikridas, C.; Kostoglou, A.; Kkallas, C.; Chatzis, N.; Bitharis, S.; et al. The March 2021 Tyrnavos, Central Greece, Doublet (Μw6.3 and Mw6.0): Aftershock Relocation, Faulting Details, Coseismic Slip and Deformation. Bull. Geol. Soc. Greece 2021, 58, 131–178. [Google Scholar] [CrossRef]
  114. Vassilakis, E.; Kaviris, G.; Kapetanidis, V.; Papageorgiou, E.; Foumelis, M.; Konsolaki, A.; Petrakis, S.; Evangelidis, C.P.; Alexopoulos, J.; Karastathis, V.; et al. The 27 September 2021 Earthquake in Central Crete (Greece)—Detailed Analysis of the Earthquake Sequence and Indications for Contemporary Arc-Parallel Extension to the Hellenic Arc. Appl. Sci. 2022, 12, 2815. [Google Scholar] [CrossRef]
  115. Available online: https://Sentinels.Copernicus.Eu (accessed on 25 May 2022).
  116. Lle Cozannet, G.; Kervyn, M.; Russo, S.; Ifejika Speranza, C.; Ferrier, P.; Foumelis, M.; Lopez, T.; Modaressi, H. Space-Based Earth Observations for Disaster Risk Management. Surv. Geophys. 2020, 41, 1209–1235. [Google Scholar] [CrossRef] [Green Version]
  117. Foumelis, M.; Papadopoulou, T.; Bally, P.; Pacini, F.; Provost, F.; Patruno, J. Monitoring Geohazards Using On-Demand and Systematic Services on Esa’s Geohazards Exploitation Platform. In Proceedings of the IEEE International Geoscience and Remote Sensing Symposium (IGARSS), Yokohama, Japan, 28 July–2 August 2019; Institute of Electrical and Electronics Engineers Inc.: Piscataway, NJ, USA, 2019; pp. 5457–5460. [Google Scholar]
  118. Amodio, A.; Samarelli, S.; Massimi, V.; Lorenzo-Alonso, A.; Gonzalez, A.U.; Foumelis, M.; Provost, F.; Bally, P.; Nutricato, R.; Oscar Nitti, D. EO4SD-DRR Earth Observation to Support the Reconstruction and Rehabilitation in the Aftermaths of Tsunami and Earthquake. In Proceedings of the IEEE International Geoscience and Remote Sensing Symposium (IGARSS), Brussels, Belgium, 11–16 July 2021; Institute of Electrical and Electronics Engineers (IEEE): Piscataway, NJ, USA, 2021; pp. 1978–1981. [Google Scholar]
  119. Foumelis, M.; Papazachos, C.; Papadimitriou, E.; Karakostas, V.; Ampatzidis, D.; Moschopoulos, G.; Kostoglou, A.; Ilieva, M.; Minos-Minopoulos, D.; Mouratidis, A.; et al. On Rapid Multidisciplinary Response Aspects for Samos 2020 M7.0 Earthquake. Acta Geophys. 2021, 69, 1025–1048. [Google Scholar] [CrossRef]
  120. Foumelis, M.; Lorenzo-Alonso, A.; Eisenberg, R.; González, Á.U.; Aubrecht, C.; Bally, P.; Kolomaznik, J.; Massimi, V.; Rubinyi, S.; Gonzalez, F.C.; et al. EO4SD Disaster Risk Reduction Terrain Motion Products in Support of the City Resilience Program. In Proceedings of the IEEE International Geoscience and Remote Sensing Symposium (IGARSS), Brussels, Belgium, 11–16 July 2021; Institute of Electrical and Electronics Engineers Inc.: Piscataway, NJ, USA, 2021; pp. 3289–3292. [Google Scholar]
  121. Manunta, M.; de Luca, C.; Zinno, I.; Casu, F.; Manzo, M.; Bonano, M.; Fusco, A.; Pepe, A.; Onorato, G.; Berardino, P.; et al. The Parallel SBAS Approach for Sentinel-1 Interferometric Wide Swath Deformation Time-Series Generation: Algorithm Description and Products Quality Assessment. IEEE Trans. Geosci. Remote Sens. 2019, 57, 6229–6281. [Google Scholar] [CrossRef]
  122. Foumelis, M.; Blasco, J.M.D.; Brito, F.; Pacini, F.; Pishehvar, P. Snapping for Sentinel-1 Mission on Geohazards Exploitation Platform: An Online Medium Resolution Surface Motion Mapping Service. In Proceedings of the IEEE International Geoscience and Remote Sensing Symposium (IGARSS), Brussels, Belgium, 11–16 July 2021; Institute of Electrical and Electronics Engineers (IEEE): Piscataway, NJ, USA, 2021; pp. 3991–3994. [Google Scholar]
  123. Samieie-Esfahany, S.; Hanssen, R.F.; van Thienen-Visser, K.; Muntendam-Bos, A. On the Effect of Horizontal Deformation on InSAR Subsidence Estimates. In Proceedings of the 2009 Workshop on Fringe, Frascati, Italy, 30 November–4 December 2009. [Google Scholar]
  124. Foumelis, M.; Papageorgiou, E.; Stamatopoulos, C. Episodic Ground Deformation Signals in Thessaly Plain (Greece) Revealed by Data Mining of SAR Interferometry Time Series. Int. J. Remote Sens. 2016, 37, 3696–3711. [Google Scholar] [CrossRef]
  125. Burnol, A.; Foumelis, M.; Gourdier, S.; Deparis, J.; Raucoules, D. Monitoring of Expansive Clays over Drought-Rewetting Cycles Using Satellite Remote Sensing. Atmosphere 2021, 12, 1262. [Google Scholar] [CrossRef]
  126. Kahle, H.G.; Cocard, M.; Peter, Y.; Geiger, A.; Reilinger, R.; Barka, A.; Veis, G. GPS-Derived Strain Rate Field within the Boundary Zones of the Eurasian, African, and Arabian Plates. J. Geophys. Res. Solid Earth 2000, 105, 23353–23370. [Google Scholar] [CrossRef]
  127. Kreemer, C.; Blewitt, G.; Klein, E.C. A Geodetic Plate Motion and Global Strain Rate Model. Geochem. Geophys. Geosyst. 2014, 15, 3849–3889. [Google Scholar] [CrossRef]
Figure 1. (a) Map showing the location of inset map (b). (b) Map of the principal tectonic structures in the broader Aegean region (after [20,25,26,59,60,61,62,63,64,65,66,67,68]). The North Aegean Basin (NAB) and the North Aegean Trough (NAT) comprise the northern strand of the North Anatolian Fault (NAF), while the Central Aegean Trough represents the corresponding southern strand. The Corinth Gulf (CG) is the most extensionally growing region in the Aegean. In the Ionian Sea, the Apulian–Aegean Collision Zone (AACZ) is shown to the north and the Hellenic Arc to the south, separated and displaced by the right-lateral Cephalonia Transfer Fault Zone (CTFZ) in the middle. Hatched areas represent extension. Moment tensor solutions since 1997 from the RCMT catalogue [69] are also shown. The white rectangle indicates the location of the inset map (c). (c) Hillshade map showing the active/Neotectonic faults of the study area (F = Fault, FZ = Fault Zone). Recent earthquake spatial distribution (ML ≥ 0.5) since 2008 by the Institute of Geodynamics, National Observatory of Athens (IG-NOA), is also shown.
Applsci 12 09391 g001
Figure 2. Typical wine-glass valleys, related to the Tholos–Nea Zichni (TNFZ) fault zone, located at the eastern boundary of the Strymon Basin. The red solid line indicates the linear fault trace. White lines show the incised wine-glass valleys indicating footwall uplift. Overall, the fault trace separates uplift from subsidence, controlling the present-day sedimentation processes, and also demonstrating that the fault is active.
Applsci 12 09391 g002
Figure 3. (a) Geological map of the broader Strymon region, showing the alpine and post-alpine formations and the alpine compressional tectonics [85], as well as the active-neotectonic faults as shown in Figure 1; (b) 16 permanent GNSS stations (black triangles), monitoring the broader Strymon region.
Applsci 12 09391 g003
Figure 4. Maximum (MaHE) and Minimum (MiHE) Horizontal Extension in the broader Strymon area: (a) MaHE (blue arrows) and MiHE (red arrows) parameters vectors; (b) MaHE values grid, based on the interpolation (kriging) geostatistical methodology; (c) MiHE values grid, based on the interpolation (kriging) geostatistical methodology.
Applsci 12 09391 g004
Figure 5. Velocity (V) parameter analysis, consisting of vectors and grid pattern, based on the interpolation (kriging) geostatistical methodology.
Applsci 12 09391 g005
Figure 6. Maximum Shear Strain (MaxSS) in the broader Strymon area: (a) MaxSS values (red circles) of the total examination points; (b) MaxSS values grid, based on the interpolation (kriging) geostatistical analysis.
Applsci 12 09391 g006
Figure 7. Area Strain (AS) in the broader Strymon area: (a) calculated dilatation (blue circles) and compaction (red circles) values; (b) dilatation values grid, based on the interpolation (kriging) geostatistical methodology; (c) compaction values grid, based on the interpolation (kriging) geostatistical methodology.
Applsci 12 09391 g007
Figure 8. Average LoS displacement rates for the period 2015–2020, derived by SNAPPING service on GEP using Sentinel-1 data from ascending track 102. White lines (a–e and f–k) correspond to spatial profiles shown in Figure 8. Please note that, for the selected color scale, rates higher than ±4 mm/yr appear saturated to allow for the proper visualization of spatial variability of motion.
Applsci 12 09391 g008
Figure 9. Average LoS displacement rates for the period 2015–2020, derived by SNAPPING service on GEP using Sentinel-1 data from descending track 7. White lines (a–e and f–k) correspond to spatial profiles shown in Figure 8. Please note that, for the selected color scale, rates higher than ±4 mm/yr appear saturated to allow for the proper visualization of spatial variability of motion.
Applsci 12 09391 g009
Figure 10. PSI displacement time series for ascending track 102 at the location of high subsidence rates within the basin. The calculated trend (low pass filtering) has been subtracted from observed LoS displacements to obtain the seasonal component. The annual seasonality and linear trend are consistent to water table variations in underground aquifers. Time series has been arbitrarily shifted for visualization purposes.
Applsci 12 09391 g010
Figure 11. Spatial profiles (ae and fk) showing LoS displacement rates across major fault zones from both ascending and descending satellite tracks (see Figure 6 and Figure 7). For the calculations, average motion grids of 100 m spacing were used. Bars indicate the variability of motion within a buffer of 1–2 km, whereas dots the average calculated rates along the profiles.
Applsci 12 09391 g011
Table 1. East, north, and up velocity components of each GNSS station.
StationLongitudeLatitudeVE (m/yr)VN (m/yr)VU (m/yr)σVE (m/yr)σVN (m/yr)σVU (m/yr)
SMOL24.7058741.577500.0014−0.0029−0.00050.00170.00140.0034
DUTH24.9168041.14021−0.0004−0.0033−0.00040.00220.00220.0034
041A22.8024041.165150.0013−0.0076−0.00420.00300.00200.0039
THS122.9593640.627470.0007−0.0077−0.00010.00210.00170.0044
AUT123.0037240.566820.0010−0.0078−0.00190.00150.00190.0040
AFYT23.4353240.097130.0005−0.0085−0.00090.00180.00190.0050
SERR23.0374541.285910.0009−0.00560.00110.00180.00190.0068
PROV23.3869841.068440.0009−0.0059−0.00220.00180.00130.0036
STRA23.7907740.520220.0007−0.00790.00070.00210.00240.0039
076A23.9442740.038950.0011−0.00670.00200.00100.00600.0101
SAND23.2678241.55056−0.0001−0.00360.00010.00090.00080.0028
TEIS23.5552941.074320.0009−0.0060−0.00220.00170.00130.0036
037A23.9048640.87183−0.0004−0.0047−0.00350.00360.00500.0085
GODE23.7292841.575870.00410.00050.00520.00290.00200.0070
NVRK23.8697341.33574−0.0037−0.00210.00080.00980.00600.0098
KAVA24.3873140.93380−0.0002−0.00490.00060.00160.00220.0045
Table 2. The exx, exy, eyy (maximum, minimum, and average) values and the corresponding uncertainties of the 216 triangles.
exx (×10−9)exy (×10−9)eyy (×10−9)σexx (×10−9)σexy (×10−9)σeyy (×10−9)
Maximum481.9268423.27293141.8433159.7090160.0949294.2601
Minimum−405.7700−4307294−515.53020.62340.77090.6422
Average−5.499715.666874.257015.500512.122215.4766
Publisher’s Note: MDPI stays neutral with regard to jurisdictional claims in published maps and institutional affiliations.

