Review

A Technical Survey on Delay Defects in Nanoscale Digital VLSI Circuits

by
Prathiba Muthukrishnan
and
Sivanantham Sathasivam
*,†
School of Electronics Engineering, Vellore Institute of Technology, Vellore 632014, Tamil Nadu, India
*
Author to whom correspondence should be addressed.
These authors contributed equally to this work.
Appl. Sci. 2022, 12(18), 9103; https://doi.org/10.3390/app12189103
Submission received: 5 August 2022 / Revised: 5 September 2022 / Accepted: 7 September 2022 / Published: 10 September 2022
(This article belongs to the Special Issue Advanced Research in Electronics: The Perspective of Women)

Abstract

:
As technology scales down, digital VLSI circuits are prone to many manufacturing defects. These defects may result in functional and delay-related circuit failures. The number of test escapes grows when technology is downscaled. Small delay defects (SDDs) and hidden delay defects (HDDs) are of critical importance in industries today since they are the source of most test escapes and reliability problems. Improving test quality and creating new test methods, algorithms, and test designs requires a comprehensive study of these delay defects. This article reviews the effect and impact of SDD and HDD in logic circuits. It also analyzes the relevant fault models, automatic test pattern generation (ATPG) methods, faster-than-at-speed testing (FAST), cell-aware (CA) based delay tests, test quality metrics, diagnosis of SDDs and HDDs, and commercially available Electronic Design Automation (EDA) tools. Based on the analysis, the benefits and drawbacks of several accessible approaches are addressed.

Graphical Abstract

1. Introduction

The downscaling of technology increases integrated circuit density, as predicted by Moore [1]. The fabrication process has become increasingly challenging and complex with the evolution of deep submicron technology. The complex fabrication process can make semiconductor chips more prone to defects, affecting the chip’s functionality and timing of operation. When the technology becomes smaller and smaller, and with the advancement of the fabrication process, the defects can cause undesirable delays in the circuit rather than catastrophic failure.
Interconnects play a vital role in distributing clocks and propagating data signals. The interconnect delays are significant compared to the gate delays with decreased feature size. Tight interconnect pitches, and the narrowing of wires can cause capacitive coupling between the interconnects [2]. The capacitive coupling can affect the delay of the switching signal and is referred to as crosstalk [3]. Moreover, smaller technology nodes are more susceptible to process variations, affecting the oxide thickness, coupling capacitance, interconnect length, etc. This makes the signal propagation delay even more unpredictable.
Any physical defects that affect the signal propagation delay and produce an erroneous output at a particular operating frequency are called delay defects. Defects can be random or systematic. Random defects are due to the airborne particles and chemicals used during the fabrication of chips [4]. These defects are a significant cause of reliability problems, as they can cause resistive openings or shorts in the circuits. Strong resistive openings cause large delay defects or functional defects, and weak resistive openings cause SDDs in the chip [5]. The weak resistive openings in the vias and interconnects are prone to electromigration and cause reliability problems in the chip [6,7]. These reliability problems manifest as small delays and grow into large delays and can affect the at-speed operation of the chip [8]. The reliability defects in the semiconductor chips used for safety-critical applications like automotive, avionics, medical, etc., can be life-threatening. Hence, in-field testing of these defects is also essential.
On the other hand, systematic defects are due to process variations or crosstalk and can manifest as small delays. This is specific to a particular process technology. The major challenge in detecting SDDs and HDDs is testing them in the presence of process variations and crosstalk. It is difficult to differentiate the delay due to defects (resistive opens/shorts due to airborne particles in wafers) from the delay due to process variations or crosstalk. Also, traditional delay testing methods detect large delay defects, which will be discussed in detail in later sections. But most test escapes happen for SDDs and HDDs. Hence, there is a need to detect these defects.
Although SDD and HDD detection is an active research field, they are hardly mentioned in a comprehensive way previously. This review article put together the different SDD and HDD detection methods and their challenges. There are four main objectives of the survey. The first objective is to elaborate on the current methods of modelling the delay defects as faults, generating patterns, the primary difference between SDDs and HDDs, and their pros and cons. The second is to survey and analyze the existing test pattern generation methods in the literature for SDDs and HDDs, the industrial practices for detecting these defects, and the low-cost alternatives. The third is to study the available test quality assessment methods and the support provided by the industrial EDA tools for testing delay defects. Finally, we identify prospective research directions that will help to guide future studies.

2. Fault Models for Delay Defects

Generally, the industries use two popular delay fault models for detecting delay defects. These include the transition delay fault (TDF) model [9] and path delay fault (PDF) model [10,11]. A single vector pattern is generated for the stuck-at fault model, which is used for logical testing. But for the TDF and PDF models, two vector patterns are generated to test the delay faults. The first vector sets the initial transition value, and the second vector sets the final transition value and propagates the fault effect to the output. The TDF model assumes that the large delay defect is localized at a single node, such that any transition passing through this node will be detected regardless of the slack in the sensitized path. The TDF model considers two types of faults per node: slow to rise and slow to fall, for generating the test patterns. The defects that cause a small delay in signal propagation can escape the traditional TDF model-based testing. Figure 1a shows the pattern generation for the fault site at node A based on the TDF model. Here, the fault effect can be propagated from faulty node A to output C or D. Based on the assumption of the TDF model such that the delay is significant enough to fail the circuit when it is propagated through any path. The TDF pattern propagates the fault effect from faulty node A to output C, which is the shortest path, leaving the SDDs undetected. Scan based TDF 2 vector patterns is generated either through launch-off-capture (LOC) [12] or launch-off-shift (LOS) [13] mode. The advantage of LOC over LOS is discussed briefly in Section 2.1. Another well-known fault model is the PDF model. This model assumes that the delay defect is distributed across a path. The PDF model considers two types of faults per path: slow to rise and slow to fall for generating the test pattern. When an SDD occurs along a path, and if the cumulative delay of the path exceeds the clock period, the SDD gets detected. Figure 1b illustrates the PDF-based pattern generation. Here the slow to rise transition through path A to D is tested, detecting small delays that accumulate along the path. But for larger designs, the number of paths grows exponentially with the size of the design, and test pattern generation for all these paths will be time-consuming. But in the TDF model, the number of fault sites is proportional to the number of nodes in the design. Even though the TDF model fails to detect certain SDDs and HDDs, it is still widely used, with some changes to detect these defects. Since this model is widely adopted, it is essential to explore the various available pattern generation schemes and choose the appropriate one based on the requirement, which is discussed in the Section 2.1.

2.1. Advantage of LOC over LOS

The major difference between LOC and LOS lies in the launch of transition. In LOC, the transition is launched at the at-speed functional launch clock cycle, but in LOS, the transition is launched at the last shift cycle. The LOS scheme is difficult to implement for high operating frequency because of the complexity of generating a high-speed switching scan enable (SE) signal. Figure 2a illustrates the waveform of the LOC scheme for pattern generation. Here the SE signal is de-asserted before the launch clock edge. Hence avoiding the need for high-speed switching SE signal. Figure 2b illustrates the waveform for the LOS scheme. Here the clock for launching the transition is in shift mode, and the SE signal has to be switched between the launch and capture clock cycle, which demands a high-speed SE signal.
Figure 3 and Figure 4 shows the result comparison of LOS and LOC based test pattern generation scheme for delay faults that evolved over time [14]. Figure 3 compares the test coverage of both the schemes produced by the commercial ATPG tool. It can be inferred that the LOC scheme has evolved over time and provides better test coverage. Figure 4 represents the pattern count for both the schemes generated by the commercial ATPG tool over the years. By comparing both Figure 3 and Figure 4. It can be inferred that the test coverage of LOC has been improving at the expense of pattern count. As compared to 2006, the test coverage of LOC has improved and is very close to that of LOS in 2012. But the pattern count is more. In 2019 noticeable test coverage increase is found in the case of LOC than in LOS, but still, the pattern count is higher. This is the case when the test coverage of LOC is more than the LOS. But in [14], it is reported that the pattern count will be almost equal for the same test coverage in the year 2019. This shows that the LOC scheme has been evolving in commercial tools in terms of test coverage. But in the case of run time, the LOS scheme remains better. Still, the LOC scheme-based pattern generation can be adopted, especially for low-cost testers.

3. Small Delay Defects vs. Hidden Delay Defects

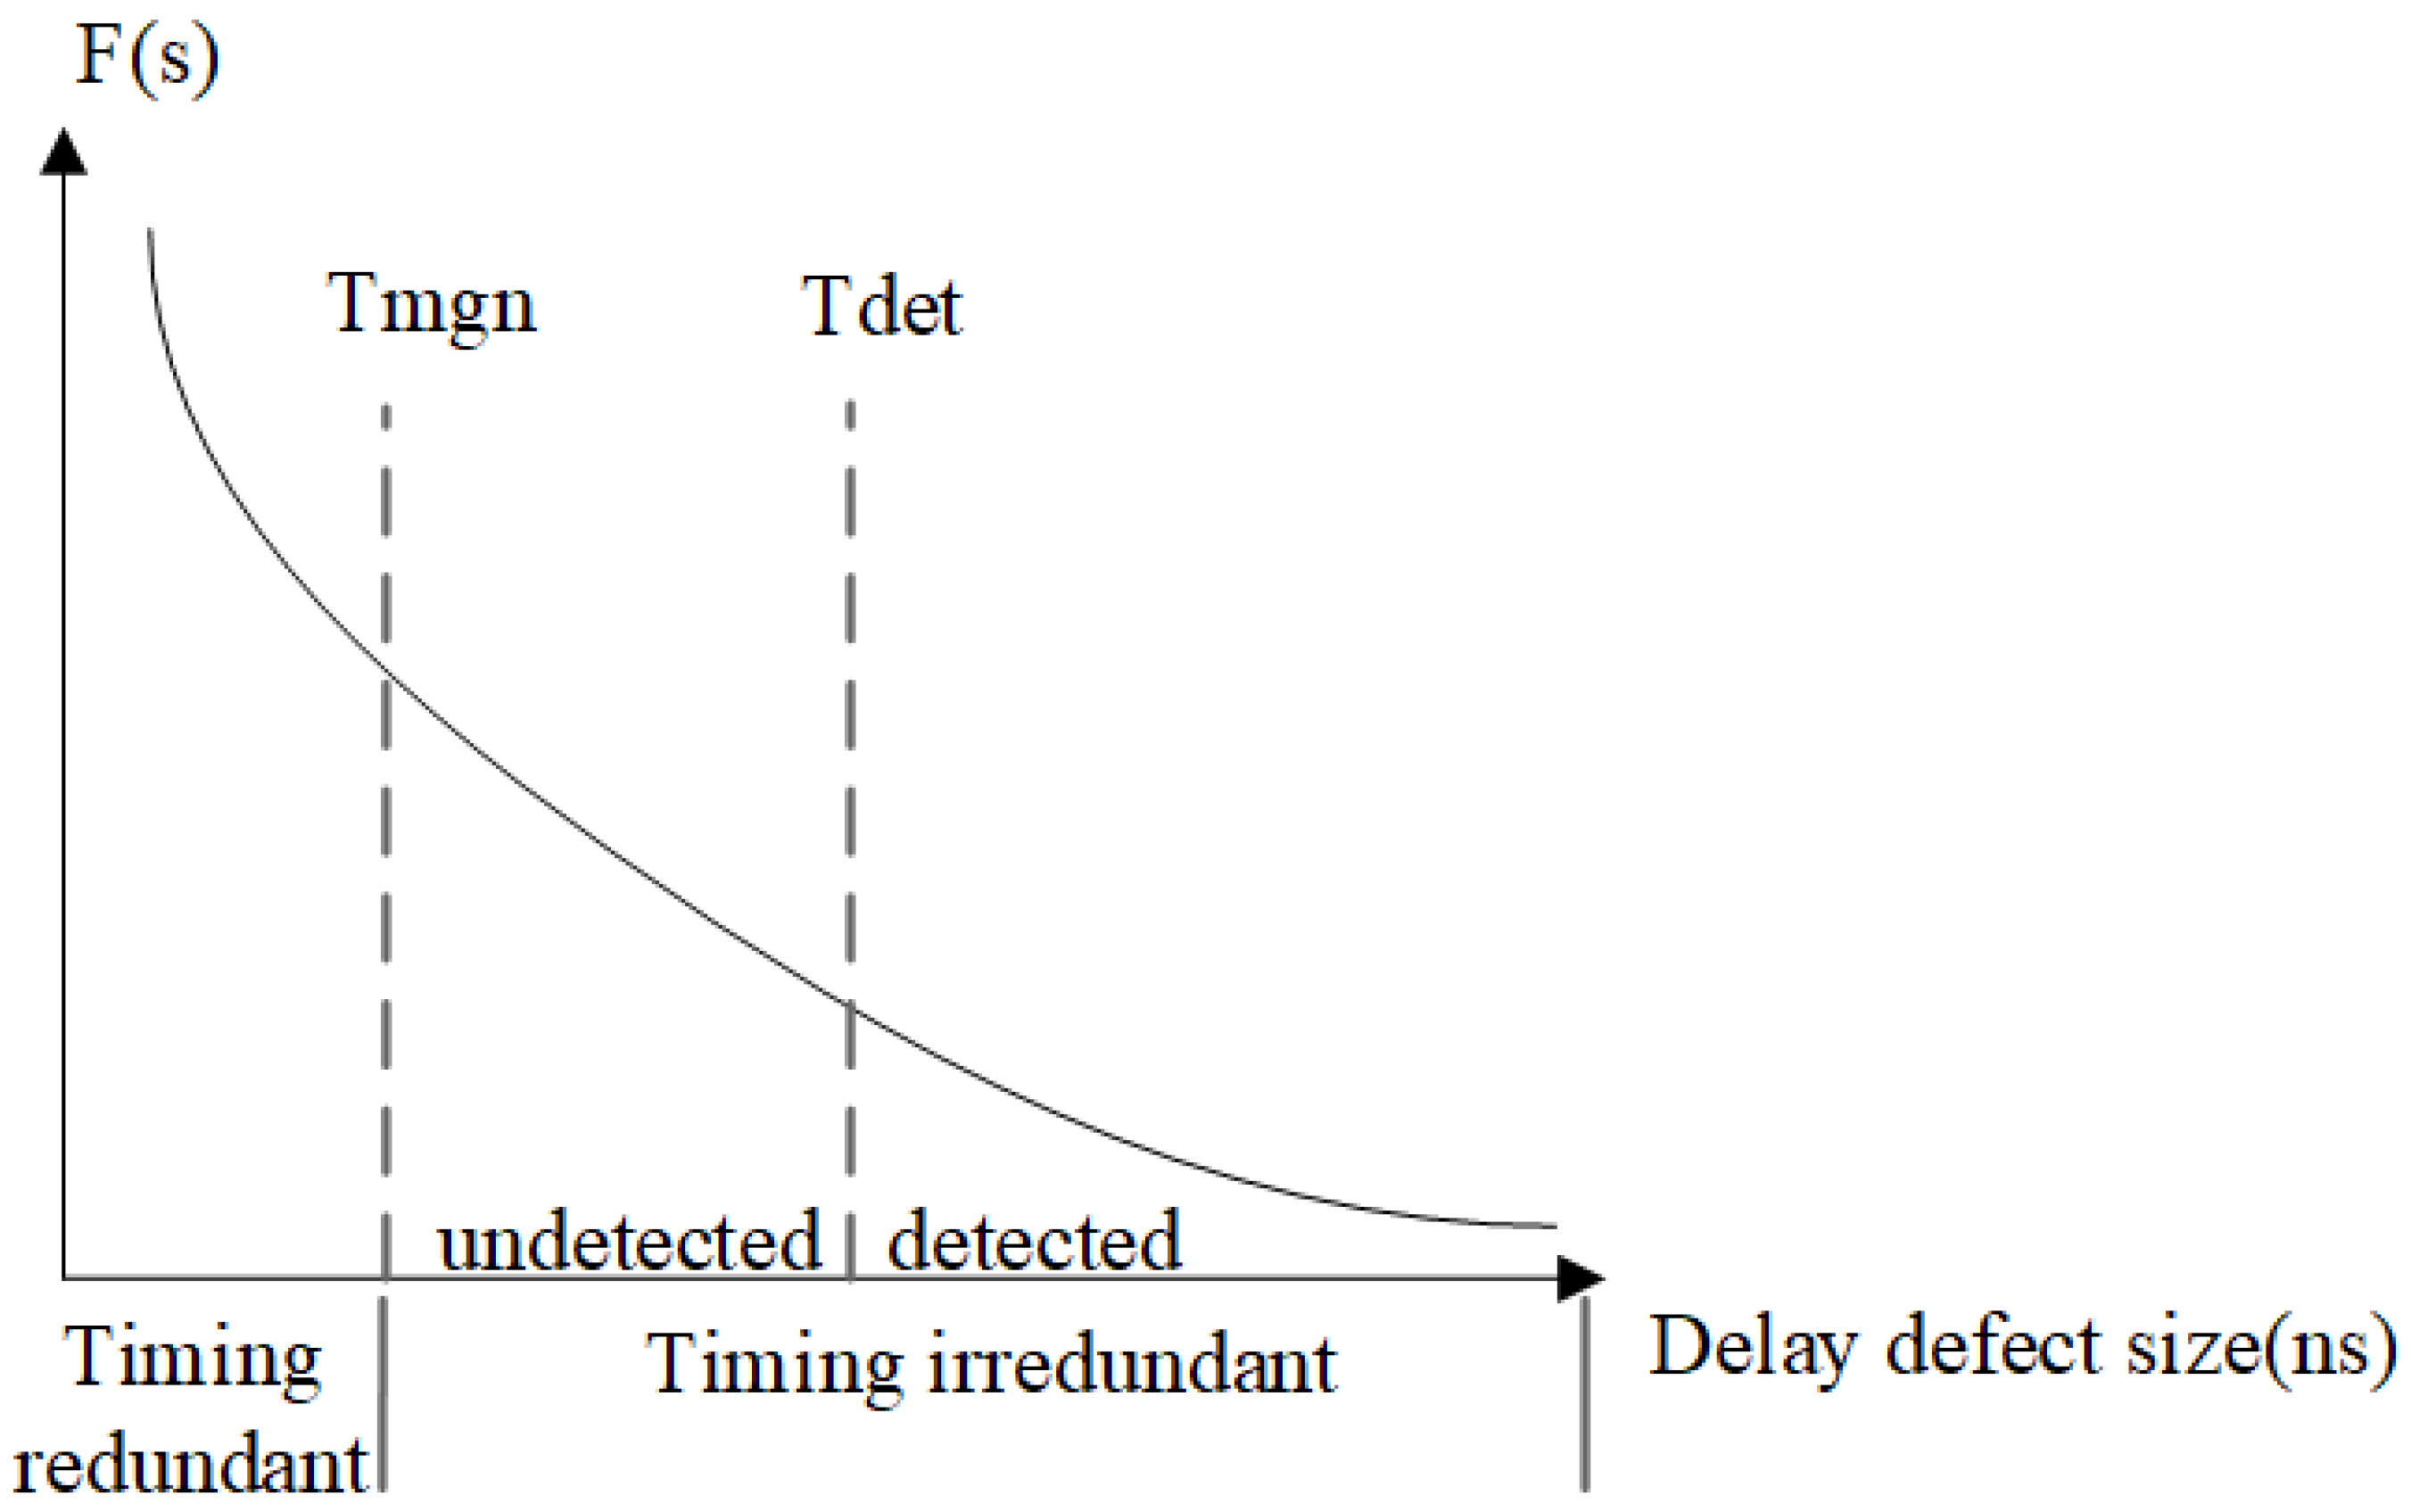
3.1. Small Delay Defects

A small delay defect [15,16] is a type of delay defect that makes the chip fail during at-speed operation. The total path delay may go beyond the clock period when the small delays get propagated through the long paths. These delay defects will be huge enough to fail the circuit during the at-speed operation, but it will escape the traditional TDF model-based tests. The TDF model assumes that only large delay defects are localized in a single node, so whatever transition passes through this node will get delayed past the clock period. Hence, the TDF-based ATPG tool will try to propagate the fault effect through the easiest and shortest path possible to reduce the run time, as shown in Figure 5a. Here Path 1 and Path 2 are short paths through which the fault can be propagated, but the longest path is the third path mentioned as the Longest path in Figure 5a. If the TDF ATPG tool tries to propagate the fault effect through Path 1 or Path 2, then this will leave the small delay fault undetected. But this delay can cause the circuit to fail during at-speed functional operation.

3.2. Hidden Delay Defects

An HDD is a special type of SDD that does not fail the circuit during at-speed operations. These defects exist only in the shorter path. Even though the TDF model-based test generation propagates the fault effect through the short paths, the impact of fault is not visible at the particular at-speed operating frequency. This is clearly illustrated in Figure 5b. Here we assume that the longest path and the path sensitized by the pattern are the same. But the small delay effect is not visible during the at-speed clock period. These delay defects may grow due to aging effects and may cause early life failure and reliability issues [17].

4. Effect of Process, Voltage and Temperature (PVT) in SDD and HDD Testing

The first major challenge in detecting SDDs and HDDs is testing them in the presence of delay variation due to PVT. It is difficult to differentiate whether the delay is due to the defect or it is due to the process variations, crosstalk, etc. The chip must not be declared defective if the delay is due to process variation. Various works are available in the literature addressing this issue. In [18], the delay due to SDD is differentiated from the delay due to process variation by comparing the delay difference between the inter-correlated paths. If the delay of one path changes and that of the correlated path does not change, it can be concluded that the delay is due to the small delay fault. The inter-path correlation is estimated using process variations, spatial correlation, and structural correlation. But the disadvantage of this method is that it focuses mainly on critical paths. The studies in [19,20] are commonly referenced for the characterization of detectable delay defects as one with a probability of detection of at least 50% in the presence of process variability. Here the path delay is regarded as a gaussian distribution with a mean μ and variance σ . It is mentioned that the delay defect in the presence of process variation is detectable if the added delay due to the defect is beyond the 3 σ of the fault-free path delay distribution. This concludes the smallest delay defect size that can be detected in the presence of process variation. In [21], the effect of crosstalk and process variation is studied to detect SDDs and HDDs in the presence of these effects. The crosstalk analysis using HSPICE shows that the transition speeds up in the presence of crosstalk when the neighbouring paths have a transition in the same direction and slows down when the transition is in the opposite direction. The process variation effects are studied by using Monte Carlo simulation and modeling. Here the path delay is considered as a gaussian delay distribution. These effects are considered for pattern selection for SDD testing, which is discussed in detail in the Section 6.2. Still, this is more time-consuming and complex because of the Monte Carlo simulation for different process variations and the extraction of coupling capacitance from the layout. Also, the effect of temperature must be considered during the SDD detection because the increase in temperature increases the propagation delay in MOSFET circuit and decreases in FinFET circuits [22]. Hence during the pattern generation, this effect must be addressed. Moreover, the supply voltage variations at the power supply node can be caused due to the excessive switching activity caused by the patterns. This, in turn, affects the delay in the paths of the circuit. Hence this effect of the patterns must also be considered [23]. Addressing all the above metioned problems during the testing of SDDs and HDDs is essential as this affects the testing accuracy.

5. Long Path Selection

The next major challenge for detecting SDDs is propagating the fault effect through long paths. So it is necessary to select the long paths accurately as it positively affects the pattern quality. Also, the number of long paths must be lower to reduce the number of patterns and the run time without compromising the test coverage. The long paths are difficult to find because of the process variation, crosstalk, power supply noises, etc. All these effects have to be considered to determine the accurate long paths. Generally, the TA ATPG of commercial tools takes the standard delay format (SDF) files or results from static timing analysis (STA) tools like pin slack information to propagate the fault effect through the long paths. Hence, the process variations and crosstalk information are not taken into consideration directly by the tool, thus leading to many SDD test escapes. The STA finds the delay of the circuit by considering the values of the factors that cause delay variation at a particular process corner, say best, worst or nominal. This worst-case corner overestimates the circuit delay. But in the actual scenario, the factors that cause delay variation are not restricted to a particular process corner value. So, statistical static timing analysis (SSTA) [24] is used to consider the effects of process variation. In SSTA, the gate and interconnect delays, the arrival time, required time, and slack are all considered as a probability distribution rather than a fixed value based on the corner case as in STA. Here, each gate and interconnect’s probability density function (pdf) is used to calculate the path delay pdf. Various SSTA-based long path selection methods are available in the literature [24,25]. For efficient statistical analysis, the SSTA method is classified into two types: path-based [26] and block-based method [27]. In [24], a test quality metric based on the slack of path (considering different process parameters) found through statistical timing analysis and branch and bound algorithm is used to guide the long path selection. But the SSTA does not give information about the pattern-dependent effects like crosstalk, IR drop, etc. Considering these effects is crucial while selecting the long path to increase the SDD or HDD testing accuracy. In [21], the statistical timing analysis considering the pattern-dependent effects is proposed for long path selection and pattern grading.

6. Test Pattern Generations for Delay Faults

6.1. ATPG for SDD

The TDF model-based ATPG is the most convenient method for detecting delay defects. It has several advantages in reducing pattern count and the run time for pattern generation. Also, the stuck-at fault based CAD tool can be reused with minor changes to generate the TDF ATPG. In [15], the path delay distribution for the TDF model-based patterns of the ISCAS’89 benchmark circuit proves that it detects faults mostly through shorter paths. Because of this, the SDDs escape the test. Modifying the TDF-based pattern generation will help detect the SDDs.
The timing-aware (TA) TDF-based ATPG is very helpful in detecting the SDDs by propagating the fault effect through the longest path [28]. But the TA mode of pattern generation increases the run time, and the pattern count is higher than the traditional TDF patterns.
An alternative way of detecting SDDs is the timing-unaware N-detect TDF-based ATPG [29,30]. The N-detect TDF-based ATPG sensitizes a particular fault effect through N different paths. This increases the probability of detection of SDDs, as it sensitizes the fault effect through more than one path at the expense of pattern count. But still, it is proved to be more efficient than TA ATPG in terms of CPU run time, and SDD coverage [21] as shown in Figure 6. As the N-detect ATPG pattern generation suffers the disadvantage of high pattern count, some pattern selection and evaluation methods are suggested in the literature to mitigate these effects, which are discussed in the Section 6.2.

6.2. Pattern Grading and Evaluation

Various pattern selection, grading, and reordering techniques are available in the literature for SDD and HDD detection. The timing-unaware N-detect ATPG [29] is found to be better than TA ATPG in terms of run time and ability to sensitize multiple long paths. But it suffers from the significant disadvantage of pattern count. The N-detect pattern set is considered as a base pattern repository, and the pattern count is reduced through pattern grading, and evaluation [21,31,32].
In [31], output deviation is the factor used to guide the pattern selection for detecting SDDs. The delay defect and signal transition probabilities are used to calculate the pattern’s output deviations. The delay defect probability is calculated using the pdf of the delay distribution of each gate. The output deviation at the observation point is compared with a threshold value, and the corresponding pattern is stored in a list if it satisfies the threshold condition. When the pattern occurs many times in the list, it is considered to be an effective pattern. This metric has a high correlation with the path length. Hence, it acts as a promising metric to guarantee that the pattern propagates the fault effect through the long paths. The layout information is also added in the calculation of output deviation in [33] to improve the accuracy. Compared to the commercial TA ATPG tool, the output deviation-based method has produced the best and reduced pattern set that sensitizes more long paths. But the problem here is that the value of the output deviation metric will remain the same for different paths for large circuits, for example, when there are more than twenty gates in the paths. As the value saturates, especially for larger designs, this metric cannot be used to differentiate between long and intermediate paths, leading to a loss of accuracy. To make the fault coverage and pattern count comparable to TA ATPG, several other hybrid techniques that use the N-detect pattern repository for pattern grading and selection are proposed in the literature [34,35,36].
A weight assignment to the patterns is performed based on its ability to detect the SDDs. The ability of the patterns to sensitize the fault effect through the longer path is used as a criterion for assigning weights to the pattern in [21,36]. Higher weights are assigned to such patterns. In [21], the process variation (PV) and crosstalk information are included in the path delay calculation, which increases the accuracy of pattern selection for SDD detection. Here the path length is regarded as a random variable as it considers the effect of PV and crosstalk, and the pdf of the path is used for path delay evaluation and weight assignment to patterns, as shown in Figure 7. Here, weights are assigned to different paths sensitized by the same pattern as per the threshold Lth value. The overall weight calculation of the pattern is given by Equation (1), where W p a t h j is the weight of the path j sensitized by the p a t t e r n i , as shown in Figure 7. W p a t t e r n i is the weight of the p a t t e r n i . N i is the total number of paths sensitized by the p a t t e r n i . There is no saturation problem like the delay defect probability matrix (DDPM) of the output deviation method. Even though these methods reduce the pattern count for SDD detection through pattern selection, the selected pattern alone cannot achieve the maximum TDF coverage. The top-off patterns are also required to achieve the maximum TDF coverage. But the selected and the top-off pattern together exceeds the 1-detect TDF pattern count. This disadvantage does not allow us to extract the complete essence of the proposed pattern selection methods. This is because the 1-detect TDF-based pattern generation produces the maximum fault coverage for the circuit under test. The fault coverage remains the same, but the number of patterns increases drastically by the pattern selection and evaluation + top-off pattern-based method to increase the SDD coverage. When the pattern count increases, it also increases the test application time. This affects the time to market demand. In addition, the limited memory storage of the ATE must also be considered. Hence, keeping the pattern count comparable to the 1-detect TDF pattern set is necessary. Therefore, an optimized pattern set with a pattern count equivalent to 1-detect TDF patterns is generated using a pattern evaluation, and selection technique [37]. The pattern selection is made using an algorithm that minimizes the target function using the gradient descent method. The weight calculation for pattern evaluation is given by the formula shown in Equation (2).
W p a t t e r n i = j = 1 N i W p a t h j
W p a t t e r n i = α j = 1 N f i W f s d d j N f s d d + β j = 1 N f i W p a t h i W f t d f j N f t d f
Here W f s d d j = 1 and W f t d f j = 0 is the weight assigned, if the pattern detects the fault j as SDD. And vice versa for the pattern that detects TDF. N f i is the number of faults detected by a p a t t e r n i . N f s d d and N f t d f are the total numbers of SDDs and TDFs, respectively, that are detected by the whole pattern repository. The parameter α and β decides the importance of SDD and TDF respectively, in pattern weight calculation and ranges between [0,1]. These values are selected based on the ability to minimize the target function. These pattern grading and evaluation techniques produce reduced pattern sets for SDD detection with high test coverage. But still, many SDDs that fail the circuit during at-speed operation escape the N-detect TDF pattern set. This is because the N-detect cannot guarantee that all the faults are detected along the longest possible path. In such cases, FAST can help detect these small delays due to the defects. In the next section, we will discuss FAST-based testing and its advantages.

6.3. Faster-than-at-Speed-Based ATPG for SDD and HDD

The small delays due to the defect can exist on short paths and will escape the at-speed testing. This delay will not fail the circuit during at-speed functional operation but can grow over time due to aging effects, causing reliability problems. Various methods are suggested in the literature to ensure IC reliability. Burn-in [38] is one such method, where the IC is subjected to increased temperature than the nominal conditions. This method is expensive, time-consuming, and may sometimes damage the chip. So, a cost-effective method for detecting the reliability defects was proposed, say FAST [23,39]. Testing the chips at a test frequency higher than the functional at-speed frequency is called FAST. Despite the advantage of N-detect TDF ATPG and the pattern selection methods for generating a reduced pattern set, the LOC and LOS-based methods cannot produce certain functional test patterns that can propagate the fault effect through the longest path possible. Thus, leading to test escapes of SDDs. For such cases, the FAST method is suggested.
The selection of the proper FAST clock and pattern combination is a major challenge in this type of testing. Various methods generate optimized test patterns and select the appropriate FAST clock for capturing the small delay faults. They include (i) testing the small delays due to the faults at predefined frequencies; and (ii) based on the delay location caused by the fault, the FAST frequencies are selected. The methods available in the literature are discussed here.
In [23], the transition delay-based patterns having almost the same pattern delay (maximum path delay for each pattern) distribution are grouped, and a suitable predefined FAST clock frequency is selected for the particular group. Still, there will be a lot of SDD test escapes as the path delay of specific patterns in the group can be smaller than that particular group’s FAST test clock period. In [40] the transition pattern set is copied repeatedly for each clock frequency, and the endpoints that do not meet the required path delay and have hazards in the output are masked. But this increases the number of pattern counts, and more FAST clocks are required to have a better SDD coverage. Single path sensitization PDF model is proposed in [41] to reduce the masking of paths with path delay lengths longer than test clock frequency during FAST. This increases the number of patterns because of single path sensitization and also, sometimes it may lead to undertesting. Using a predefined set of frequencies will not guarantee the detection of all SDDs and HDDs as it may miss specific delay effects that can only be detected at a particular clock period. In [42] a hybrid approach is used to detect the small delay faults that occur in shorter paths using predefined and optimal frequencies. The fault effect will be visible only at a particular observation time. The optimal frequencies are selected based on this observation time. Especially for in-field testing, the resources will be limited, so the number of different clock frequencies should not be more. Thus, a hypergraph algorithm is used to produce a set of optimized frequencies through fault simulation with a fixed fault size to detect the SDD. But the problem is that in real scenarios, defects cannot be of fixed size, and simulating all the fault sizes and finding the observation time based on the delay location is difficult and time-consuming, especially for larger industrial designs. Another method of W e S P e r factor guides FAST clock test generation in [43]. Here the method uses a predefined frequency and pattern set and tries to generate the most optimized test option (FAST clock, test pattern, masking vector) by selecting the test option that maximizes the W e S P e r factor. The flexibility of the metric lies in the fact that it can penalize the over testing (testing sizes of faults that will not fail the at-speed operation) and generate a more optimized pattern. This method is more suitable for detecting the faults that cannot be propagated by the pattern to the output through the longest path and needs the FAST test only for detecting the SDDs. Further research directions in optimizing the FAST-based testing in terms of pattern and frequency selection can be explored by the researchers. The general flowchart for applying the FAST-based test for detecting SDDs and HDDs is illustrated in the Figure 8.

7. Challenges of FAST

7.1. X-Handling

During FAST, many unknown values will be present in the longer paths because the gates in the long path may not have finished their computation within that smaller clock period. Handling these X values before generating the signature for the built-in self-test (BIST) is very important. Because during the signature generation using MISR (Multiple Input Signature Registers), if the X values enter into MISR, it may generate some invalid signatures, leading to loss of test coverage. The major challenge in X handling during the FAST is that we cannot predict the distribution of X values in the long paths. This is because the distributions change with different test clock frequencies and patterns [44]. Various X handling techniques are available in the literature. The X masking technique [45] is one such thing in which the X values are masked before they enter into the compactor. The next type is the X tolerant compaction [46]. This method tolerates the X values to some extent. Another important type is X canceling, which filters out the unknown values after compaction and extracts only useful information from the signature. These techniques cannot be used as such for the FAST-based X handling because of the variable X distribution.
A few works are available for X handling during FAST in the literature. In [47], a multiplexer-based method is used for the FAST-based X handling. But the disadvantage here is the considerable number of control signals and the neglect of many test responses because of multiplexer selection. As the X distributions in the long paths differ for different test clocks, the X canceling-based method is chosen for BIST-based FAST [48]. Here, the bits that have information, say D bits, are of focus. Suppose the compacted response from the scan slice does not contain any information bits. In that case, the intermediate signatures must be stored for further analysis, which consumes memory space. A greedy heuristic algorithm is used for the D-bit analysis and intermediate memory storage minimization. With this method, for larger MISR, the fault coverage increases, but with the drawback of the considerable overhead of memory storage. In [49], a hybrid stochastic compaction method is introduced where X masking is used first, and X canceling MISR is used next for handling the X values that come from the previous X masking step. The space compaction uses the probabilistic model for control-signal generation. The hybrid stochastic compaction uses a deterministic model too. The fault is masked for certain critical patterns due to compaction. Separate control signals are provided for this in a deterministic mode. This improves both fault-masking and X reduction ratios. But the hardware overhead is a disadvantage. Massive hardware is required to enhance the X reduction ratio and masking slightly. These works give the direction for researchers to further enhance the X handling for FAST by hybrid X handling approaches.

7.2. On-Chip Clock Generation for FAST

FAST is essential for HDD and SDD detection. But in the case of automatic test equipment (ATE), the test clocks of higher frequency may be subject to change because of probe resistance, tester skew, etc. [50], thus affecting the accuracy of the clock frequency. The delay between the launch and the capture clock edge is the clock cycle period that is used for at-speed testing. The shift clock cycle can be a slow-speed clock and does not affect the testing performance. This is because the shift mode only initializes the flipflop values. The transition is launched and propagated from the source scan cell by pulsing the launch clock and captured at the destination scan cell by pulsing the capture clock. If the circuit works fine, the transition will reach the destination flip flop in time, and the correct value will be captured. Hence it is enough for the launch and capture cycle alone to be in operating frequency to validate the delay test. Moreover, if the shift clock frequency is high, it will lead to unnecessary yield loss. This is because, during shift operation, all the scan cells are configured in shift mode and will toggle together. The combinational logic also toggles along with them. This leads to IR drop, and the circuit may malfunction during shift mode, and correct values may not be shifted properly. Hence slow speed clock is used for shifting operation. Providing a high-precision launch and capture clock for at-speed testing from the tester equipment requires a high cost. This disadvantage can be eliminated by using on-chip clocks. The PLL-based on-chip clock generation generates a higher clock frequency, which can be used for FAST testing [51,52]. But this isn’t easy to implement because the PLL has to be reset before applying each pattern, and this slows down the testing and is unsuitable for large industrial designs. Also, it generates only specific multiples of the PLL output frequency. In [53], the pulse programmable selection generator and multiplexer are used to create the desired launch and capture cycle. But the disadvantage here is the huge overhead area. The launch and capture clock generation (LCCG) method is proposed to overcome the difficulties faced in PLL. This architecture consists of a delay control stage that can be embedded anywhere in the scan chains [54]. The required frequencies are obtained by sending the control information with the test patterns. Also, the delay control stage consists of two different delay units such that one delay unit has more delay than the other, and a reference signal is taken as an input. The difference in the delay between the two delay units is used to generate the required launch and capture clock. This supports LOC and LOS-based test applications and produces the needed frequencies for the FAST test, unlike the PLL-based [51] clock generation. But the problem here is that the delay control stage may be subjected to PV or have SDDs, causing frequency inaccuracies. The oscillator controller, along with the LCCG circuits, is used to address this issue [55]. Here, the generated clock from the enhanced LCCG circuit is measured for accuracy before it is used for testing applications by the oscillator circuit. Though the error percentage for generating the expected clock signal in the presence of process variations is lower than in the LCCG technique, a more accurate clock generation is required to reduce the maximum percentage error, which could be a future research direction.

On-Chip Clock Generation for Asynchronous Circuit

The need to handle massive data as the internet grows necessitates power-efficient processors. The asynchronous design is preferred for not wasting much power on switching activity and handling clock tree power. An asynchronous or self-timed processor called AnARM was developed for this purpose. These asynchronous circuits must also meet the timing constraint in order to function properly. Because of the diverse design style of the asynchronous circuits, it is difficult to test the circuit. Hence there is a need to find the test mechanism for these structures. In [56] the design of the proposed self-timed AnARM processor itself is exploited for producing FAST and at-speed clocks to detect SDDs and HDDs. The proposed structure’s configuration delay line (CDL) unit is used for clock pulse generation. The CDL unit delays the pulse between the source and a destination register. Hence, the appropriate launch and capture cycle for FAST can be generated by configuring the CDL unit properly [43].

7.3. IR Drop Effect

Another major challenge during the FAST is IR drop effects due to high switching activity. The high switching activity leads to a voltage drop, affecting the path delay. To address the issue, a novel work has been proposed in [23]. The method analyses the effect of IR drop on the path delay of each pattern applied at the particular FAST frequency. Based on the observation, the effective pattern and frequency are selected for testing the SDDs. If the IR drop effect is not addressed, the good chip will be falsely identified as defective. This is because the increased path delay is due to the IR drop effect and not due to the SDD effect. The switching cycle average power (SCAP) is the metric that is used to evaluate the effectiveness of pattern and frequency by considering the IR drop effect. Figure 9 shows the IR drop-based impact on the delay of paths due to the application of fast clocks [23]. Here, the worst delay of patterns due to IR drop effects is obtained by adding the worst performance degradation-based delay due to IR drop to the maximum path sensitization delay of a pattern. It shows that the delay of the paths increases due to FAST clocks. This IR drop effect may cause false alarms; that is, it can classify good chips as bad. Hence, the FAST clocks must be selected in such a way to avoid false alarms. The impact of IR drop is a significant issue and must be addressed during the FAST-based pattern generation.

8. Cell-Aware Based SDD Testing

The traditional fault models like stuck-at, bridging [57], and transition model [9] consider faults only at the ports of the cells. But in most realistic scenarios, the defects that exist inside the cell cause test escapes. Opens, shorts, or bridges that occur in the interconnects or transistors within the cell are the intra-cell defects [9,58,59]. Standard fault models can detect many defects inside the cell. But still, to detect certain specific intra-cell defects, unique test patterns are needed that are not detected by standard fault models. The most commonly considered faults models for intra-cell defects are transistor stuck open [60], cross wire open [61], resistive open [62] and resistive shorts [63], which depend on SPICE simulation on a transistor level fault model without using parasitic information. When the size of the circuit grows (millions of transistors), the test pattern generation at the transistor level is inefficient. This motivates the researchers to develop a novel fault model based on cell layouts that can be generated totally automatically and enables the ATPG tool to develop a set of input patterns that identify all cell-internal defects. For this purpose a new method called CA-based testing was introduced [64]. The SPICE transistor-level netlist and the RC (Resistance, Capacitance) parasitics information from the layout are used to identify the possible defect location. The resistance location in the SPICE netlist denotes the possibility of an open or short defect, and the capacitance location indicates the possibility of a bridge defect. In [65] the CA-based testing is proved to be more efficient in testing the cell’s internal faults with reduced test cost (reduced test patterns, runtime) than gate exhaustive [66] and N-detect testing [67].
The importance of 2-time frame CA test patterns to test intra-cell delay defects is discussed in [68]. The 2-time frame fault represents the intra-cell defect, which causes a delay in the transition of the signal. To target these faults, the patterns are generated. The 2-time frame CA-based delay test performed on an AMD 32 nm notebook processor proves that most chips that fails the test are defective, as shown in [69]. This test can detect both large and small delay defects. Hence, the classification of delay defects based on their size is essential to extract the essence of the test. In [70], the CA-based small delay fault is identified by considering the amount of voltage deviation from the supply voltage due to the fault effect in the cell output at a particular strobe time. The fault is considered to be a small delay fault when the voltage level at the cell’s output is less than 50% of the supply voltage. But the measurement of voltage deviation is not an accurate way to categorize the delay fault size. Also, the fault consideration is based on the per cell of the standard cell library and does not consider all the cell instances. Different cell instances in a design have different output capacitive loads, which in turn have different timing impacts on the slack of the instance. Based on this observation in [70], the classification of small and large delay faults can be more accurate when the timing impact is considered on a cell instance basis. The problem is dealt with in [71] to improve the accuracy of classifying the small and large delay faults. Instead of considering the output voltage deviation at the cell’s output, the excess delay due to the fault for each cell instance slack is considered for delay fault classification. This method [71] reduces the number of small delay faults to be detected as compared to the method in [70]. The decrease in the number of faults is due to the accuracy of the method used. Due to the unavailability of the timing-aware CA ATPG tool in Tessent at that time, the CA small delay fault patterns are generated without considering the timing information in [71]. Still, the number of patterns and run time are reduced by a significant amount. To explore the effect of timing slack and instance-based fault model for SDD testing, the TetraMAX slack-based ATPG is used in [72]. It is shown that the pattern count, run time, and defect coverage are better than in [71]. Figure 10 shows the SDD based CA test generation flow. The defects are modelled by the user-defined fault model (UDFM), and the timing information in the form of SDF is used for pattern generation. The output patterns are stored in a file in Standard Test Interface Language (STIL) format.

9. Diagnosis of SDD and HDD

Diagnosis is the process of narrowing down the probable sites of defects in a logic circuit that fails a test [73]. The failure information obtained from the delay test can be used to find the defect location that causes the delay. The principal aim of a diagnostic algorithm is to improve its diagnostic resolution, i.e., to identify the possible defect location that causes the failure, with high accuracy. If the defect locations identified by the diagnostic algorithm contain more candidates, it takes a long time to locate the exact delay defect location under the microscope in the industry. This affects the time to market demand. Hence, a diagnostic algorithm with better resolution is required to detect the delay defect location and the bounds of the delay defect size. Initially, the diagnosis is performed without any timing information. The need for SDD and HDD diagnosis increases as the technology node shrinks, hence the timing information of the circuits is necessary to improve diagnosis accuracy and reduce the number of fault candidates.
The use of timing information in the diagnosis yields a better resolution than those with non-timing aware diagnosis [74,75,76]. The SDD diagnosis [75] is performed by using timed seven valued simulations and injecting delay size of minimum detectable delay value found from the statistical delay quality model (SDQM) [16]. But the delay distribution for the particular technology node is not always available. Moreover, since the STA is used for diagnosis guidance, the results obtained will not correlate accurately with the real chips because of the process variations.
Generating patterns for improving the diagnostic resolution is another method for enhancing the SDD diagnosis [77]. This method will generate additional patterns to target each candidate separately and observe the output response. But at the production site, it is difficult to implement such pattern generation, especially for large industrial circuits.
The next major problem is the test response compaction, which is done to reduce the storage in the tester’s memory [78]. The diagnosis of compacted response is a challenging task, especially for SDD and HDD. A six-valued fault-free simulation is compared with the faulty compressed signature to backtrace through the circuit to find the SDD candidate list [79]. From the generated SDD candidate list, a fault of a particular size is injected and timing simulated to obtain the response. The response is then compared with the failed response from the failure log information. The fault that provides the most comparable result is finalized as the defect location. A Graphical Processing Unit (GPU) accelerated timing simulator is used for timing simulation to cope with the long run time [80]. But the major problem is that the inject and validate timing simulation is done for the nominal delay values. This may not match the real defects that occur in chips because of the process variation. The variation aware method addresses this issue to predict the SDD candidate that fails the test accurately [80]. But if the pattern used has a low diagnostic resolution, it affects the diagnosis performance. In [81], the first diagnosis of HDDs is reported. It is done similarly to that of [79]. But the uncompressed response is used for diagnosis rather than the compressed response, as in [79]. Since FAST is used for HDD detection, the diagnosis is performed at different capture times. The diagnosis of SDDs and HDDs has only become a field of research in the past decade. It can be eye-opening to researchers looking to improve the diagnostic resolution further.

10. Test Quality Metrics for SDDs and HDDs

The TDF coverage does not determine the SDD detection quality, as it does not give any information about the size of the fault. Many new ATPG enhancement algorithms (pattern grading, evaluations) and FAST are used to increase the coverage of the SDDs and HDDs. Hence, it is necessary to find a proper quality metric for evaluating the quality of SDD and HDD testing. This section will discuss the important quality metrics from the existing literature and their advantages and disadvantages. There are two SDD quality metrics: (i) the non-statistical SDD metric and (ii) the statistical SDD metric. The latter considers the probability distribution of delay defects for the particular fabrication process to evaluate the SDD coverage, while the former does not. The probability distribution gives information about the distribution of different defect sizes in the specific technology node.

10.1. Delay Test Coverage Metric ( D T C )

D T C [28] measures the pattern set efficiency in detecting the SDDs. It depends on the ability of the test pattern to propagate the transition fault through the longest path. It is a non-statistical quality metric. It assumes that all defect sizes are equiprobably distributed [82]. This is not the actual scenario, as different defect sizes can occur at different probabilities, which is validated in previous research studies [83]. Also, it does not include the test clock, system clock, and slack information. So this metric can validate the SDD testing quality only when the system clock and the test clock are the same. Hence, this is not an accurate metric for SDD testing. Also, it does not validate the SDD or HDD testing quality for the FAST method because of the lack of test and system clock information. D T C is given by Equation (3).
D T C = 1 N i = 1 N P D L A P D L T × 100 %
where P D L T is the path delay of the longest functional path through the fault site, and P D L A is the path delay of the longest activated path through the fault site by the pattern. N is the total number of faults.
Figure 11 clearly illustrates that the D T C percentage is the same for different test clock periods for each benchmark circuit and hence cannot validate the SDD or HDD testing.

10.2. Quadratic Small Delay Defect Coverage ( S D D C q )

This non-statistical quality metric estimates the SDD coverage by taking into account the test clock period ( T t e s t ) and the system clock period ( T s y s ) information. The S D D C q value differs for different delay defect sizes. Hence, it is more suitable to find SDD coverage when the delay defect distribution is not available [82]. The major disadvantage of this method is that it may produce some irrelevant results (greater than 100 percent) when the test clock is not the same as the at-speed clock [84]. This is clearly visible in Figure 12, which makes it difficult to predict the coverage of SDDs. Also, there are no discussions about validating FAST for detecting SDDs and HDDs through this quality metric. The S D D C q formula is mentioned in Equation (4).
S D D C q = 1 N i = 1 N ( P D L A + T s y s T t e s t ) 2 ( P D L T ) 2 × 100

10.3. Statistical Delay Quality Level (SDQL)

The S D Q L is calculated using the delay defect distribution of the particular technology node. This value gives information about the probability of the test escapes of SDDs [16]. Two slacks are selected, say T m g n and T d e t , for the metric calculation. T m g n is the tested path slack with respect to the test clock. T d e t is the longest functional path slack with respect to the system clock. These slacks divide the delay defect distribution into three regions, as shown in Figure 13. The area under the curve between the two slack values gives the metric value. This means that the detectable defects of sizes within the range of two slack values escape the SDD test. The value must be as small as possible, i.e., it denotes the fewer test escapes. The Equation (5) calculates the S D Q L value. The first disadvantage of the metric is that, the delay defect distribution of the required process is not always available for the particular technology and process. The second is the lack of normalization. This is because the metric value increases when the number of fault sites increases, even though the test escapes are less. Hence, this metric cannot be used to compare two designs that have a different number of fault sites [82]. The third disadvantage arises while testing different designs with different test clock frequencies. When the test clock frequency is low, the timing margin increases, and the ability to tolerate the SDDs also increases. Hence, the S D Q L value will be low. But in actual cases, the SDD test escapes are masked by a high timing margin. Hence, this metric is not accurate for validating the SDD coverage. In FAST, sometimes the T d e t is less than the T m g n . The metric calculation in such a case is not evident.
S D Q L = i = 1 N T m g n T d e t F ( s ) d s

10.4. Small Delay Defect Coverage ( S D D C )

S D D C is another quality metric for evaluating SDD coverage. The metric is calculated as a ratio of the likelihood of a defect detected to the likelihood of a defect being timing irredundant (defects of sizes that fail the circuit during at-speed operation) [82] as given by the Equation (6). This metric helps to compare the test quality of different designs and the same design operating at different frequencies. During FAST, the metric value of a fault site will be greater than 1 in some instances. It means over testing is happening. In this situation, the value is split into three parts: S D D C t , S D D C d p m , and S D D C e f r . The first component is the metric value for individual fault and when it is larger than 1, the second component is given a value of 1, and the third component is computed by ( S D D C t S D D C d p m ), which produces the over testing percentage. As a result, this measure outperforms existing metrics for calculating SDD and HDD coverage. The main drawback is that the S D D C d p m value is utilized for the over tested fault during FAST when adding all the individual values of the fault locations, as illustrated in Equation (6). Here, the over tested fault receives a perfect score of one. So, the test pattern generated can over test the circuit, i.e., good chips will fail the test. The next disadvantage is that the metric needs delay defect distribution for computation (which may not be available for all the technology and processes). Like all other metrics discussed previously, this metric is not affected by any delay variation caused by PVT fluctuations. We can infer from the observation made in [85] that the metric is sensitive to the PVT variations only at slow clock speeds. In that case, the test pattern generated cannot differentiate whether the small delays are due to PVT variations or defects in the chip. Hence, this metric cannot exactly validate the SDD coverage at different PVT points.
S D D C = 1 N i = 1 N T d e t F ( s ) d s T m g n F ( s ) d s × 100 %

10.5. Weighted Slack Percentage ( W e S P e r )

To overcome the disadvantages of the previously mentioned metrics, the W e S P e r metric is introduced [84]. It is calculated by the ratio of slacks as given in Equation (8). The total W e S P e r factor is calculated using Equation (7). The test pattern that maximizes this factor effectively detects SDD or HDD. The best test path is the longest path through the fault site in all other metrics. But here, the best-activated path is the one that maximizes the factor. The factor uses a new term called the confidence level ( C L ) multiplier. The C L multiplier equation acts as a weighting factor to denote whether the factor chosen is good or bad for the test. The equation must penalize the undesirable aspects of the test and reward the desirable aspects of the test. The factors that affect the SDD testing include patterns that create hazards in the endpoints, over testing the design during FAST, etc. In [43], the use of this factor for FAST is discussed. This metric is the aptest metric for FAST. Over testing must be penalized when the test detects defects of a size less than the smallest possible defect size that fails the circuit during at-speed operation. The below mentioned equation gives the C L factor to penalize over testing. Also, this metric is sensitive to the delay variations due to the PVT, as mentioned in [85]. When the exact delay defect distribution is available for the particular process and technology, the C L multiplier can penalize the pattern that detects the defect sizes that are not important. But the major demerit of the metric is that the C L equations for other factors that affect SDD testing are not mentioned. It has to be found by the test engineers, and experiments must be performed based on the requirements.
W e S P e r = 1 N i = 1 N f i × 100 %
f i = T s y s P D L T i T t e s t P D B A i C L f o r T t e s t > P D B A i
C L = 1 if T s y s P D L T i T t e s t P D B A i < 1 T s y s P D L T i T t e s t P D B A i if T s y s P D L T i T t e s t P D B A i > 1
In Figure 14, it is clearly illustrated that the S D D C d p m values are higher than the W e S P e r factor, which shows that during FAST, the S D D C d p m metric assigns a perfect grade for over testing patterns and test clock, which is a pessimism. But W e S P e r addresses this issue and can be used as a quality metric when reliability defects are of no interest for detection. Figure 15 shows that the W e S P e r value increases when the test detects the SDD similar to the ideal test model, i.e., when the test detects the exact SDD size. The graph plot shows that the value is higher during the at-speed test. The flow diagram for W e S P e r based pattern generation is shown in Figure 16.

11. Commercially Available EDA Tools

Various EDA tools that support delay testing are available. These industrial tools are discussed in this section.

11.1. Mentor Graphics

Tessent product suite provides the test solutions for testing complex ICs [86]. It offers support for at-speed testing and performs delay testing through TDF ATPG, PDF ATPG, TA ATPG, multiple-detect ATPG, and CA ATPG. The transition delay fault ATPG supports LOC and LOS-based pattern generation. The PDF ATPG detects the faults by either robust, non-robust, or hazard-free tests. TA ATPG uses SDF [87] information to generate the patterns for detecting SDDs by propagating the fault effect through long paths. However, the run time is eight times more than the traditional TDF ATPG. Also, the test coverage of TA ATPG may sometimes be less than the conventional TDF ATPG as it tries to propagate the fault through the longest possible path. Besides, the TA ATPG does not support skewed load-based pattern generation.
The CA-based and TA-based CA test pattern generation detect internal cell defects requiring a bridge and open defect location extraction. For this purpose, the Tessent diagnostic tool uses LEF and DEF files to generate the Tessent Layout database (LDB). The Tessent fault extraction tool extracts the bridge defect’s location from the LDB. Later, these defects are defined as fault models and written in UDFM format. The UDFM is used to describe the custom fault models [86]. The custom fault models represent the defects that standard fault models cannot model. The ATPG tool uses SDF and UDFM file information to propagate the fault effect through long paths.
The tool also supports the on-chip clock control (OCC) circuitry insertion. The OCC supplies appropriate clock signals to the design under test based on the control signal. The test clocks (shift, launch, capture) generated from the OCC can be used by the Tessent ATPG tool for at-speed testing and FAST.

11.2. Synopsys

Synopsys offered a test solution through the TestMAX product [88]. It supports delay fault testing through TDF ATPG, PDF ATPG, slack-based transition fault ATPG, N-detect ATPG, and CA ATPG. The IC Compiler II [89] is a place and route tool through which we can extract the timing information in the SDF format. The StarRC [90] extracts the parasitic information after the placement and routing. The PrimeTime [91] is an STA tool that uses the timing and parasitics information to generate the pin slack and critical paths. The slack-based TDF ATPG [88] uses pin slack information to propagate the effect of the fault through the longest possible path. But the disadvantage here is that the tool will first try to propagate the fault through the longest path possible. If the longest path is untestable, it does not guarantee to propagate the fault through the second-longest path. It will propagate through any available testable path. Hence, this does not guarantee the detection of all the SDDs through TA mode.
The TestMAX CTMGen [88] utility creates the cell test model (CTM) for CA testing by using the simulation results of fault-free and faulty transistor netlist obtained from HSPICE [92]. The CA ATPG uses the CTM to generate the test patterns. Moreover, the Design for Testability (DFT) compiler supports the insertion of OCC circuitry. The OCC is compatible with the TestMAX and can be used for selecting appropriate capture and launch clocks for at-speed testing or FAST.

11.3. Cadence

Modus DFT software solutions offer a wide range of benefits in delay testing. It also uses the SDF-based timing information to detect the SDDs. Cadence also supports the CA based testing [93]. The layout is generated by using Virtuoso [94]. The Quantus can perform the parasitic extraction. Modus is used for defect location identification and characterization. The analog simulation for the defect inserted netlist is generated from analog simulator Spectre. Using the netlist and delay defect matrix generated, the modus tools translate cell-based ATPG to chip-level ATPG. Along with delay information, the SDD detections can be performed [95].

12. Conclusions and Future Directions

The brief survey of a set of research papers has pronounced the importance of testing SDDs and HDDs. The primary motivation for most of the research papers is the growing need for the industry to produce high-quality chips. Small and hidden delay testing, CA delay testing, and diagnosis of defects are growing research fields to reduce the DPPM. To avoid the functional failures and returns from the infield usage of chips, focusing on structural testing and enhancing it, by all means, is very much necessary. Moreover, developing test quality evaluation metrics and diagnosis algorithms for SDDs and HDDs is still an ongoing research field. Hence, the focus on this research direction can contribute to the VLSI testing industry for further progress. However, many effective techniques have evolved to detect most of the defects in the chip. But still, there are a lot of test escapes that happen. This survey will be a great insight for the researchers in the field of VLSI testing by giving a brief overview of the existing works and the progress to be explored in the future.
By analyzing various methodologies that exist in the literature and techniques already employed in commercial EDA tools, the researchers can focus on addressing the following key issues:
1.
Addressing the challenges of FAST-based method like X handling, On-chip clock generation, and IR drop to develop a more cost-effective solution, especially for BIST, to catch reliability defects.
2.
Developing a more accurate test quality metric for SDD and HDD testing by considering several other parameters like clock skew, latency, uncertainty, etc., can be a future research direction.
3.
The effect of process variations and IR drop can be included as a parameter in the calculation of test quality metric to precisely evaluate the test quality.
4.
The CA based testing for targeting the SDD and HDD in order to furthur reduce the DPPM can be explored by the researchers.
5.
Developing more efficient diagnostic algorithms to improve diagnostic resolution can be a prospective research direction.
6.
The complex manufacturing process, the multi-fin structure, and the small feature size make the FinFETs more prone to defects. If a single fin has a defect, then the high leakage current causes small delays in the circuit without actually failing the circuit [96]. Moreover, the reliability risk during in-field operations is due to the temperature increase. This finding could give researchers a new way to look at how to address these challenges in FinFETs and develop better CA-based fault modelling to reduce the DPPM.

Author Contributions

Conceptualization, P.M.; methodology, P.M. and S.S.; formal analysis, P.M. and S.S.; data curation, P.M.; writing—original draft preparation, P.M.; writing—review and editing, P.M. and S.S.; supervision, S.S. All authors have read and agreed to the published version of the manuscript.

Funding

The first authour receives financial assistance from the University Grants Commission, New Delhi, India, in the form of Junior Research Fellowship. The article processing fee is funded by Vellore Institute of Technology, Vellore, and EDA tools are sponsored by Seimens EDA India.

Institutional Review Board Statement

Not applicable.

Informed Consent Statement

Not applicable.

Data Availability Statement

All the data presented in this manuscript were derived from the indicated articles, which are published in the literature and listed in the Reference section.

Acknowledgments

The authors would like to acknowledge Vellore Institute of Technology, Vellore, Tamil Nadu, India, for providing all the necessary facilities for the research and Siemens India for providing necessary EDA tool support for the research.

Conflicts of Interest

The authors declare no conflict of interest.

References

  1. Moore, G.E. Cramming more components onto integrated circuits, Reprinted from Electronics, volume 38, number 8, April 19, 1965, pp.114 ff. IEEE Solid State Circuits Soc. Newsl. 2006, 11, 33–35. [Google Scholar] [CrossRef]
  2. Brain, R. Interconnect scaling: Challenges and opportunities. In Proceedings of the 2016 IEEE International Electron Devices Meeting (IEDM), San Francisco, CA, USA, 3–7 December 2016; pp. 9.3.1–9.3.4. [Google Scholar] [CrossRef]
  3. Piplani, S.; Visweswaran, G.S.; Kumar, A. Impact of crosstalk and process variation on capture power reduction for at-speed test. In Proceedings of the 2016 IEEE 34th VLSI Test Symposium (VTS), Las Vegas, NV, USA, 25–27 April 2016; pp. 1–6. [Google Scholar] [CrossRef]
  4. Faisal, W.; Knotter, D.M.; Mud, A.; Kupera, F.G. Impact of particles in ultra pure water on random yield loss in IC production. Microelectron. Eng. 2009, 86, 140–144. [Google Scholar] [CrossRef]
  5. Montanes, R.; de Gyvez, J.; Volf, P. Resistance characterization for weak open defects. IEEE Des. Test Comput. 2002, 19, 18–26. [Google Scholar] [CrossRef]
  6. Zisser, W.H.; Ceric, H.; Weinbub, J.; Selberherr, S. Electromigration induced resistance increase in open TSVs. In Proceedings of the 2014 International Conference on Simulation of Semiconductor Processes and Devices (SISPAD), Yokohama, Japan, 23 October 2014; pp. 249–252. [Google Scholar] [CrossRef]
  7. Ghaida, R.S.; Zarkesh-Ha, P. A Layout Sensitivity Model for Estimating Electromigration-Vulnerable Narrow Interconnects. J. Electron. Test. 2009, 25, 67–77. [Google Scholar] [CrossRef]
  8. Villacorta, H.; Champac, V.; Gomez, R.; Hawkins, C.; Segura, J. Reliability Analysis of Small-Delay Defects Due to Via Narrowing in Signal Paths. IEEE Des. Test 2013, 30, 70–79. [Google Scholar] [CrossRef]
  9. Waicukauski, J.A.; Lindbloom, E.; Rosen, B.K.; Iyengar, V.S. Transition Fault Simulation. IEEE Des. Test Comput. 1987, 4, 32–38. [Google Scholar] [CrossRef]
  10. Pomeranz, I. A Metric for Identifying Detectable Path Delay Faults. IEEE Trans. Comput. Aided Des. Integr. Circuits Syst. 2012, 31, 1734–1742. [Google Scholar] [CrossRef]
  11. Majhi, A.; Agrawal, V. Delay fault models and coverage. In Proceedings of the Eleventh International Conference on VLSI Design, Chennai, India, 4–7 January 1998; pp. 364–369. [Google Scholar] [CrossRef]
  12. Savir, J.; Patil, S. On broad-side delay test. IEEE Trans. Very Large Scale Integr. VLSI Syst. 1994, 2, 368–372. [Google Scholar] [CrossRef]
  13. Savir, J.; Patil, S. Scan-based transition test. IEEE Trans. Comput. Aided Des. Integr. Circuits Syst. 1993, 12, 1232–1241. [Google Scholar] [CrossRef]
  14. Pandey, K. A Critical Engineering Dissection of LOS and LOC At-speed Test Approaches. In Proceedings of the 2020 IEEE International Test Conference India, Bangalore, India, 12–14 July 2020; pp. 1–7. [Google Scholar] [CrossRef]
  15. Ahmed, N.; Tehranipoor, M.; Jayaram, V. Timing-based delay test for screening small delay defects. In Proceedings of the 2006 43rd ACM/IEEE Design Automation Conference, San Francisco, CA, USA, 24–28 July 2006; pp. 320–325. [Google Scholar] [CrossRef]
  16. Sato, Y.; Hamada, S.; Maeda, T.; Takatori, A.; Nozuyama, Y.; Kajihara, S. Invisible delay quality-SDQM model lights up what could not be seen. In Proceedings of the IEEE International Conference on Test, Austin, TX, USA, 8 November 2005; pp. 9–1210. [Google Scholar] [CrossRef]
  17. Qian, X.; Singh, A.D. Distinguishing Resistive Small Delay Defects from Random Parameter Variations. In Proceedings of the 2010 19th IEEE Asian Test Symposium, Shanghai, China, 1–4 December 2010; pp. 325–330. [Google Scholar] [CrossRef]
  18. Galarza-Medina, F.J.; García-Gervacio, J.L.; Champac, V.; Orailoglu, A. Small-delay defects detection under process variation using Inter-Path Correlation. In Proceedings of the 2012 IEEE 30th VLSI Test Symposium (VTS), Maui, HI, USA, 23–25 April 2012; pp. 127–132. [Google Scholar] [CrossRef]
  19. Tayade, R.; Sundereswaran, S.; Abraham, J. Small-Delay Defect Detection in the Presence of Process Variations. In Proceedings of the 8th International Symposium on Quality Electronic Design (ISQED’07), Washington, DC, USA, 26–28 March 2007; pp. 711–716. [Google Scholar] [CrossRef]
  20. Tayade, R.; Abraham, J. Small-delay defect detection in the presence of process variations. Microelectron. J. 2008, 39, 1093–1100, European Nano Systems (ENS) 2006. [Google Scholar] [CrossRef]
  21. Peng, K.; Yilmaz, M.; Chakrabarty, K.; Tehranipoor, M. Crosstalk- and Process Variations-Aware High-Quality Tests for Small-Delay Defects. IEEE Trans. Very Large Scale Integr. VLSI Syst. 2013, 21, 1129–1142. [Google Scholar] [CrossRef]
  22. Soleimani, S.; Afzali-Kusha, A.; Forouzandeh, B. Temperature dependence of propagation delay characteristic in FinFET circuits. In Proceedings of the 2008 International Conference on Microelectronics, Sharjah, United Arab Emirates, 14–17 December 2008; pp. 276–279. [Google Scholar] [CrossRef]
  23. Ahmed, N.; Tehranipoor, M. A Faster-Than-at-Speed Transition-Delay Test Method Considering IR-Drop Effects. IEEE Trans. Comput. Aided Des. Integr. Circuits Syst. 2009, 28, 1573–1582. [Google Scholar] [CrossRef]
  24. Zolotov, V.; Xiong, J.; Fatemi, H.; Visweswariah, C. Statistical Path Selection for At-Speed Test. IEEE Trans. Comput. Aided Des. Integr. Circuits Syst. 2010, 29, 749–759. [Google Scholar] [CrossRef]
  25. Liou, J.J.; Krstic, A.; Wang, L.C.; Cheng, K.T. False-path-aware statistical timing analysis and efficient path selection for delay testing and timing validation. In Proceedings of the 2002 Design Automation Conference (IEEE Cat. No.02CH37324), New Orleans, LA, USA, 10–14 June 2002; pp. 566–569. [Google Scholar] [CrossRef]
  26. Amin, C.; Menezes, N.; Killpack, K.; Dartu, F.; Choudhury, U.; Hakim, N.; Ismail, Y. Statistical static timing analysis: How simple can we get? In Proceedings of the 42nd Design Automation Conference, Anaheim, CA, USA, 13–17 June 2005; pp. 652–657. [Google Scholar] [CrossRef]
  27. Visweswariah, C.; Ravindran, K.; Kalafala, K.; Walker, S.; Narayan, S.; Beece, D.; Piaget, J.; Venkateswaran, N.; Hemmett, J. First-Order Incremental Block-Based Statistical Timing Analysis. IEEE Trans. Comput. Aided Des. Integr. Circuits Syst. 2006, 25, 2170–2180. [Google Scholar] [CrossRef]
  28. Lin, X.; Tsai, K.h.; Wang, C.; Kassab, M.; Rajski, J.; Kobayashi, T.; Klingenberg, R.; Sato, Y.; Hamada, S.; Aikyo, T. Timing-Aware ATPG for High Quality At-speed Testing of Small Delay Defects. In Proceedings of the 2006 15th Asian Test Symposium, Fukuoka, Japan, 20–23 November 2006; pp. 139–146. [Google Scholar] [CrossRef]
  29. Amyeen, M.; Venkataraman, S.; Ojha, A.; Lee, S. Evaluation of the quality of N-detect scan ATPG patterns on a processor. In Proceedings of the 2004 International Conferce on Test, Charlotte, NC, USA, 26–28 October 2004; pp. 669–678. [Google Scholar] [CrossRef]
  30. Pomeranz, I.; Reddy, S.M. On n-detection test sets and variable n-detection test sets for transition faults. IEEE Trans. Comput. Aided Des. Integr. Circuits Syst. 2000, 19, 372–383. [Google Scholar] [CrossRef]
  31. Yilmaz, K.C.M.; Tehranipoor, M. Test-Pattern Grading and Pattern Selection for Small-Delay Defects. In Proceedings of the 26th IEEE VLSI Test Symposium, San Diego, CA, USA, 27 April–1 May 2008. [Google Scholar] [CrossRef]
  32. Chang, C.Y.; Liao, K.Y.; Hsu, S.C.; Li, J.M.; Rau, J.C. Compact Test Pattern Selection for Small Delay Defect. IEEE Trans. Comput. Aided Des. Integr. Circuits Syst. 2013, 32, 971–975. [Google Scholar] [CrossRef]
  33. Yilmaz, M.; Chakrabarty, K.; Tehranipoor, M. Interconnect-Aware and Layout-Oriented Test-Pattern Selection for Small-Delay Defects. In Proceedings of the 2008 IEEE International Test Conference, Santa Clara, CA, USA, 28–30 October 2008; pp. 1–10. [Google Scholar] [CrossRef]
  34. Peng, K.; Thibodeau, J.; Yilmaz, M.; Chakrabarty, K.; Tehranipoor, M. A novel hybrid method for SDD pattern grading and selection. In Proceedings of the 2010 28th VLSI Test Symposium (VTS), Santa Cruz, CA, USA, 19–22 April 2010; pp. 45–50. [Google Scholar] [CrossRef]
  35. Peng, K.; Yilmaz, M.; Tehranipoor, M.; Chakrabarty, K. High-quality pattern selection for screening small-delay defects considering process variations and crosstalk. In Proceedings of the 2010 Design, Automation Test in Europe Conference Exhibition (DATE 2010), Dresden, Germany, 8–12 March 2010; pp. 1426–1431. [Google Scholar] [CrossRef]
  36. Peng, K.; Yilmaz, M.; Chakrabarty, K.; Tehranipoor, M. A Noise-Aware Hybrid Method for SDD Pattern Grading and Selection. In Proceedings of the 2010 19th IEEE Asian Test Symposium, Shanghai, China, 1–4 December 2010; pp. 331–336. [Google Scholar] [CrossRef]
  37. Bao, F.; Peng, K.; Tehranipoor, M.; Chakrabarty, K. Generation of Effective 1-Detect TDF Patterns for Detecting Small-Delay Defects. IEEE Trans. Comput. Aided Des. Integr. Circuits Syst. 2013, 32, 1583–1594. [Google Scholar] [CrossRef]
  38. Foster, R. Why Consider Screening, Burn-In, and 100-Percent Testing for Commercial Devices? IEEE Trans. Manuf. Technol. 1976, 5, 52–58. [Google Scholar] [CrossRef]
  39. Yoneda, T.; Hori, K.; Inoue, M.; Fujiwara, H. Faster-than-at-speed test for increased test quality and in-field reliability. In Proceedings of the 2011 IEEE International Test Conference, Anaheim, CA, USA, 20–22 September 2011; pp. 1–9. [Google Scholar] [CrossRef]
  40. Kruseman, B.; Majhi, A.; Gronthoud, G.; Eichenberger, S. On hazard-free patterns for fine-delay fault testing. In Proceedings of the 2004 International Conferce on Test, Charlotte, NC, USA, 26–28 October 2004; pp. 213–222. [Google Scholar] [CrossRef]
  41. Fu, X.; Li, H.; Li, X. Testable Path Selection and Grouping for Faster Than At-Speed Testing. IEEE Trans. Very Large Scale Integr. VLSI Syst. 2012, 20, 236–247. [Google Scholar] [CrossRef]
  42. Kampmann, M.; Kochte, M.A.; Schneider, E.; Indlekofer, T.; Hellebrand, S.; Wunderlich, H.J. Optimized Selection of Frequencies for Faster-Than-at-Speed Test. In Proceedings of the 2015 IEEE 24th Asian Test Symposium (ATS), Mumbai, India, 22–25 November 2015; pp. 109–114. [Google Scholar] [CrossRef]
  43. Hasib, O.T.; Savaria, Y.; Thibeault, C. Optimization of Small-Delay Defects Test Quality by Clock Speed Selection and Proper Masking Based on the Weighted Slack Percentage. IEEE Trans. Very Large Scale Integr. VLSI Syst. 2020, 28, 764–776. [Google Scholar] [CrossRef]
  44. Kampmann, M.; Hellebrand, S. X Marks the Spot: Scan-Flip-Flop Clustering for Faster-than-at-Speed Test. In Proceedings of the 2016 IEEE 25th Asian Test Symposium (ATS), Hiroshima, Japan, 21–24 November 2016; pp. 1–6. [Google Scholar] [CrossRef]
  45. Naruse, M.; Porneranz, I.; Reddy, S.; Kundu, S. On-chip compression of output responses with unknown values using lfsr reseeding. In Proceedings of the International Test Conference, Charlotte, NC, USA, 30 September–2 October 2003; Volume 1, pp. 1060–1068. [Google Scholar] [CrossRef]
  46. Mitra, S.; Mitzenmacher, M.; Lumetta, S.; Patil, N. X-tolerant test response compaction. IEEE Des. Test Comput. 2005, 22, 566–574. [Google Scholar] [CrossRef]
  47. Singh, A.; Han, C.; Qian, X. An output compression scheme for handling X-states from over-clocked delay tests. In Proceedings of the 2010 28th VLSI Test Symposium (VTS), Santa Cruz, CA, USA, 19–22 April 2010; pp. 57–62. [Google Scholar] [CrossRef]
  48. Kampmann, M.; Kochte, M.A.; Liu, C.; Schneider, E.; Hellebrand, S.; Wunderlich, H.J. Built-In Test for Hidden Delay Faults. IEEE Trans. Comput. Aided Des. Integr. Circuits Syst. 2019, 38, 1956–1968. [Google Scholar] [CrossRef]
  49. Urf Maaz, M.; Sprenger, A.; Hellebrand, S. A Hybrid Space Compactor for Adaptive X-Handling. In Proceedings of the 2019 IEEE International Test Conference (ITC), Washington, DC, USA, 9–15 November 2019; pp. 1–8. [Google Scholar] [CrossRef]
  50. Tayade, R.; Abraham, J.A. On-chip Programmable Capture for Accurate Path Delay Test and Characterization. In Proceedings of the 2008 IEEE International Test Conference, Santa Clara, CA, USA, 28–30 October 2008; pp. 1–10. [Google Scholar] [CrossRef]
  51. McLaurin, T.; Frederick, F. The testability features of the MCF5407 containing the 4th generation ColdFire(R) microprocessor core. In Proceedings of the International Test Conference 2000 (IEEE Cat. No.00CH37159), Atlantic City, NJ, USA, 3–5 October 2000; pp. 151–159. [Google Scholar] [CrossRef]
  52. Lin, X.; Press, R.; Rajski, J.; Reuter, P.; Rinderknecht, T.; Swanson, B.; Tamarapalli, N. High-frequency, at-speed scan testing. IEEE Des. Test Comput. 2003, 20, 17–25. [Google Scholar] [CrossRef]
  53. Jun, H.S.; Chung, S.; Kim, H. Programmable In-Situ Delay Fault Test Clock Generator. U.S. Patent No. 20060242474, 26 October 2006. [Google Scholar]
  54. Pei, S.; Li, H.; Li, X. An on-chip clock generation scheme for faster-than-at-speed delay testing. In Proceedings of the 2010 Design, Automation Test in Europe Conference Exhibition (DATE 2010), Dresden, Germany, 8–12 March 2010; pp. 1353–1356. [Google Scholar] [CrossRef]
  55. Pei, S.; Geng, Y.; Li, H.; Liu, J.; Jin, S. Enhanced LCCG: A novel test clock generation scheme for faster-than-at-speed delay testing. In Proceedings of the 20th Asia and South Pacific Design Automation Conference, Chiba, Japan, 19–22 January 2015; pp. 514–519. [Google Scholar] [CrossRef]
  56. Hasib, O.A.T.; Crépeau, D.; Awad, T.; Dulipovici, A.; Savaria, Y.; Thibeault, C. Exploiting built-in delay lines for applying launch-on-capture at-speed testing on self-timed circuits. In Proceedings of the 2018 IEEE 36th VLSI Test Symposium (VTS), San Francisco, CA, USA, 22–25 April 2018; pp. 1–6. [Google Scholar] [CrossRef]
  57. Mei, K. Bridging and Stuck-At Faults. IEEE Trans. Comput. 1974, C-23, 720–727. [Google Scholar] [CrossRef]
  58. Chess, B.; Freitas, A.; Ferguson, F.; Larrabee, T. Testing CMOS logic gates for: Realistic shorts. In Proceedings of the International Test Conference, Washington, DC, USA, 2 October–6 October 1994; pp. 395–402. [Google Scholar] [CrossRef]
  59. Vierhaus, H.; Meyer, W.; Glaser, U. CMOS bridges and resistive transistor faults: IDDQ versus delay effects. In Proceedings of the IEEE International Test Conference–(ITC), Baltimore, MD, USA, 17–21 October 1993; pp. 83–91. [Google Scholar] [CrossRef]
  60. Wadsack, R.L. Fault modeling and logic simulation of CMOS and MOS integrated circuits. Bell Syst. Tech. J. 1978, 57, 1449–1474. [Google Scholar] [CrossRef]
  61. Han, C.; Singh, A.D. Testing cross wire opens within complex gates. In Proceedings of the 2015 IEEE 33rd VLSI Test Symposium (VTS), Napa, CA, USA, 4 June 2015; pp. 1–6. [Google Scholar] [CrossRef]
  62. Arai, M.; Suto, A.; Iwasaki, K.; Nakano, K.; Shintani, M.; Hatayama, K.; Aikyo, T. Small Delay Fault Model for Intra-Gate Resistive Open Defects. In Proceedings of the 2009 27th IEEE VLSI Test Symposium, Santa Cruz, CA, USA, 3–7 May 2009; pp. 27–32. [Google Scholar] [CrossRef]
  63. Hao, H.; McCluskey, E. “Resistive Shorts” within CMOS Gates. In Proceedings of the 1991 International Test Conference, Nashville, TN, USA, 26–30 October 1991; p. 292. [Google Scholar] [CrossRef]
  64. Hapke, F.; Krenz-Baath, R.; Glowatz, A.; Schloeffel, J.; Hashempour, H.; Eichenberger, S.; Hora, C.; Adolfsson, D. Defect-oriented cell-aware ATPG and fault simulation for industrial cell libraries and designs. In Proceedings of the 2009 International Test Conference, Austin, TX, USA, 1–6 November 2009; pp. 1–10. [Google Scholar] [CrossRef]
  65. Hapke, F.; Schloeffel, J.; Redemund, W.; Glowatz, A.; Rajski, J.; Reese, M.; Rearick, J.; Rivers, J. Cell-aware analysis for small-delay effects and production test results from different fault models. In Proceedings of the 2011 IEEE International Test Conference, Anaheim, CA, USA, 20–22 September 2011; pp. 1–8. [Google Scholar]
  66. Cho, K.Y.; Mitra, S.; McCluskey, E. Gate exhaustive testing. In Proceedings of the IEEE International Conference on Test, Austin, TX, USA, 8 November 2005; pp. 7–777. [Google Scholar] [CrossRef]
  67. Pomeranz, I.; Reddy, S. On n-detection test sets and variable n-detection test sets for transition faults. In Proceedings of the 17th IEEE VLSI Test Symposium (Cat. No.PR00146), San Diego, CA, USA, 26–30 April 1999; pp. 173–180. [Google Scholar] [CrossRef]
  68. Huang, Y.H.; Lu, C.H.; Wu, T.W.; Nien, Y.T.; Chen, Y.Y.; Wu, M.; Lee, J.N.; Chao, M.C.T. Methodology of generating dual-cell-aware tests. In Proceedings of the 2017 IEEE 35th VLSI Test Symposium (VTS), Las Vegas, NV, USA, 9–12 April 2017; pp. 1–6. [Google Scholar] [CrossRef]
  69. Hapke, F.; Redemund, W.; Glowatz, A.; Rajski, J.; Reese, M.; Hustava, M.; Keim, M.; Schloeffel, J.; Fast, A. Cell-Aware Test. IEEE Trans. Comput. Aided Des. Integr. Circuits Syst. 2014, 33, 1396–1409. [Google Scholar] [CrossRef]
  70. Howell, W.; Hapke, F.; Brazil, E.; Venkataraman, S.; Datta, R.; Glowatz, A.; Redemund, W.; Schmerberg, J.; Fast, A.; Rajski, J. DPPM Reduction Methods and New Defect Oriented Test Methods Applied to Advanced FinFET Technologies. In Proceedings of the 2018 IEEE International Test Conference (ITC), Phoenix, AZ, USA, 29 October–1 November 2018; pp. 1–10. [Google Scholar] [CrossRef]
  71. Nien, Y.T.; Wu, K.C.; Lee, D.Z.; Chen, Y.Y.; Chen, P.L.; Chern, M.; Lee, J.N.; Kao, S.Y.; Chao, M.C.T. Methodology of Generating Timing-Slack-Based Cell-Aware Tests. In Proceedings of the 2019 IEEE International Test Conference (ITC), Washington, DC, USA, 9–15 November 2019; pp. 1–10. [Google Scholar] [CrossRef]
  72. Nien, Y.T.; Wu, K.C.; Lee, D.Z.; Chen, Y.Y.; Chen, P.L.; Chern, M.; Lee, J.N.; Kao, S.Y.; Chao, M.C.T. Methodology of Generating Timing-Slack-Based Cell-Aware Tests. IEEE Trans. Comput. Aided Des. Integr. Circuits Syst. 2021, 1. [Google Scholar] [CrossRef]
  73. Venkataraman, S.; Drummonds, S. POIROT: A logic fault diagnosis tool and its applications. In Proceedings of the International Test Conference 2000 (IEEE Cat. No.00CH37159), Atlantic City, NJ, USA, 3–5 October 2000; pp. 253–262. [Google Scholar] [CrossRef]
  74. Wang, Z.; Marek-Sadowska, M.; Tsai, K.H.; Rajski, J. Delay-fault diagnosis using timing information. IEEE Trans. Comput. Aided Des. Integr. Circuits Syst. 2005, 24, 1315–1325. [Google Scholar] [CrossRef]
  75. Aikyo, T.; Takahashi, H.; Higami, Y.; Ootsu, J.; Ono, K.; Takamatsu, Y. Timing-Aware Diagnosis for Small Delay Defects. In Proceedings of the 22nd IEEE International Symposium on Defect and Fault-Tolerance in VLSI Systems (DFT 2007), Rome, Italy, 26–28 September 2007; pp. 223–234. [Google Scholar] [CrossRef]
  76. Mehta, V.J.; Marek-Sadowska, M.; Tsai, K.H.; Rajski, J. Timing-Aware Multiple-Delay-Fault Diagnosis. IEEE Trans. Comput. Aided Des. Integr. Circuits Syst. 2009, 28, 245–258. [Google Scholar] [CrossRef]
  77. Guo, R.; Cheng, W.T.; Kobayashi, T.; Tsai, K.H. Diagnostic test generation for small delay defect diagnosis. In Proceedings of the 2010 International Symposium on VLSI Design, Automation and Test, Hsin Chu, Taiwan, 26–29 April 2010; pp. 224–227. [Google Scholar] [CrossRef]
  78. Li, X.; Lee, K.J.; Touba, N.A. Chapter 6–Test Compression. In VLSI Test Principles and Architectures; Wang, L.T., Wu, C.W., Wen, X., Eds.; Morgan Kaufmann: San Francisco, CA, USA, 2006; pp. 341–396. [Google Scholar] [CrossRef]
  79. Holst, S.; Schneider, E.; Kochte, M.A.; Wen, X.; Wunderlich, H.J. Variation-Aware Small Delay Fault Diagnosis on Compressed Test Responses. In Proceedings of the 2019 IEEE International Test Conference (ITC), Washington, DC, USA, 9–15 November 2019; pp. 1–10. [Google Scholar] [CrossRef]
  80. Schneider, E.; Kochte, M.A.; Holst, S.; Wen, X.; Wunderlich, H.J. GPU-Accelerated Simulation of Small Delay Faults. IEEE Trans. Comput. Aided Des. Integr. Circuits Syst. 2017, 36, 829–841. [Google Scholar] [CrossRef]
  81. Holst, S.; Kampmann, M.; Sprenger, A.; Reimer, J.D.; Hellebrand, S.; Wunderlich, H.J.; Wen, X. Logic Fault Diagnosis of Hidden Delay Defects. In Proceedings of the 2020 IEEE International Test Conference (ITC), Washington, DC, USA, 1–6 November 2020; pp. 1–10. [Google Scholar] [CrossRef]
  82. Devta-Prasanna, N.; Goel, S.K.; Gunda, A.; Ward, M.; Krishnamurthy, P. Accurate measurement of small delay defect coverage of test patterns. In Proceedings of the 2009 International Test Conference, Austin, TX, USA, 1–6 November 2009; pp. 1–10. [Google Scholar] [CrossRef]
  83. Nigh, P.; Gattiker, A. Test method evaluation experiments and data. In Proceedings of the International Test Conference 2000 (IEEE Cat. No.00CH37159), Atlantic City, NJ, USA, 3–5 October 2000; pp. 454–463. [Google Scholar] [CrossRef]
  84. Hasib, O.A.T.; Savaria, Y.; Thibeault, C. WeSPer: A flexible small delay defect quality metric. In Proceedings of the 2016 IEEE 34th VLSI Test Symposium (VTS), Las Vegas, NV, USA, 25–27 April 2016; pp. 1–6. [Google Scholar] [CrossRef]
  85. Hasib, O.A.-T.; Savaria, Y.; Thibeault, C. Multi-PVT-Point Analysis and Comparison of Recent Small-Delay Defect Quality Metrics. J. Electron. Test. Theory Appl. JETTA 2019, 35, 823–838. [Google Scholar] [CrossRef]
  86. Tessent® Scan and ATPG User’s Manual v2021.1; Mentorgraphics Corporation: Wilsonville, OR, USA, 2021.
  87. IEEE Std 1497-2001; IEEE Standard for Standard Delay Format (SDF) for the Electronic Design Process. IEEE: Piscataway, NJ, USA, 2001; pp. 1–80. [CrossRef]
  88. TestMAX ATPG and TestMAX Diagnosis User Guide Version T-2022.03; Synopsys: Mountain View, CA, USA, 2022.
  89. IC Compiler II Industry Leading Place and Route System Datasheet. 2019. Available online: https://www.synopsys.com/content/dam/synopsys/implementation&signoff/datasheets/ic-compiler-ii-ds.pdf (accessed on 2 June 2022).
  90. StarRC Parasitic Extraction Datasheet. 2015. Available online: https://www.synopsys.com/content/dam/synopsys/implementation&signoff/datasheets/starrc-ds.pdf (accessed on 2 June 2022).
  91. Prime Time Static Timing Analysis. Available online: https://www.synopsys.com/content/dam/synopsys/implementation&signoff/datasheets/primetime-ds.pdf (accessed on 2 June 2022).
  92. HSPICE User Guide. Available online: https://www.synopsys.com/content/dam/synopsys/verification/datasheets/hspice-ds.pdf (accessed on 2 June 2022).
  93. Cadence Modus DFT Software Solution. Available online: https://www.cadence.com/en_US/home/tools/digital-design-and-signoff/test/modus-test.html (accessed on 2 June 2022).
  94. Virtuoso Layout Suite L Datasheet. 2015. Available online: https://www.cadence.com/content/dam/cadence-www/global/en_US/documents/tools/custom-ic-analog-rf-design/virtuoso-vlsl-ds.pdf (accessed on 2 June 2022).
  95. Gao, Z.; Malagi, S.; Marinissen, E.J.; Swenton, J.; Huisken, J.; Goossens, K. Defect-Location Identification for Cell-Aware Test. In Proceedings of the 2019 IEEE Latin American Test Symposium (LATS), Santiago, Chile, 11–13 March 2019; pp. 1–6. [Google Scholar] [CrossRef]
  96. Forero, F.; Villacorta, H.; Renovell, M.; Champac, V. Modeling and Detectability of Full Open Gate Defects in FinFET Technology. IEEE Trans. Very Large Scale Integr. VLSI Syst. 2019, 27, 2180–2190. [Google Scholar] [CrossRef]
Figure 1. (a) TDF based pattern generation to propagate the fault at node A; (b) PDF based pattern generation for the path A to D.
Applsci 12 09103 g001
Figure 2. (a) Waveform for LOC based scheme for pattern generation; (b) Waveform for LOS based scheme for pattern generation.
Applsci 12 09103 g002
Figure 3. Result comparison of LOC and LOS based test coverage (commercial ATPG tool) with the evolution of years [14].
Applsci 12 09103 g003
Figure 4. Comparison of LOS and LOC based pattern count (commercial ATPG tool) with the evolution of years [14].
Applsci 12 09103 g004
Figure 5. (a) Delay of each path of the circuit through fault site X and the observation time T1 and T2 for detecting the small delay; (b) Delay of the path through the fault site X and the observation time T1 to detect the hidden delay.
Applsci 12 09103 g005
Figure 6. Comparison of normalized values of SDDs detected, pattern count, CPU runtime of various N-detect and TA pattern (Usb_function benchmark) [21].
Applsci 12 09103 g006
Figure 7. Example of path weight assignment [21] for the pdf of different path delay.
Applsci 12 09103 g007
Figure 8. Generalized flow chart for FAST application in actual design flow.
Applsci 12 09103 g008
Figure 9. Comparison of maximum path delay of a pattern in each test group for at-speed test, FAST with IR drop effect [23].
Applsci 12 09103 g009
Figure 10. ATPG generation flow through CA test for small delay faults.
Applsci 12 09103 g010
Figure 11. D T C percentage for different bechmark circuits tested at Slow, Fast and At-speed test clock period [84].
Applsci 12 09103 g011
Figure 12. Comparison of different test quality metric at Slow (S), At-speed (A), Fast (F) test clock [84].
Applsci 12 09103 g012
Figure 13. Delay defect distribution [82].
Applsci 12 09103 g013
Figure 14. Comparison of S D D C d p m and W e S P e r for FAST [84].
Applsci 12 09103 g014
Figure 15. Comparison of W e S P e r percentage for Slow, At-speed and Fast test clocks for three different benchmark circuits [84].
Applsci 12 09103 g015
Figure 16. Flow diagram for W e S P e r based pattern generation for SDDs and HDDs [43].
Applsci 12 09103 g016
Publisher’s Note: MDPI stays neutral with regard to jurisdictional claims in published maps and institutional affiliations.

