Article

Intelligent Deep-Q-Network-Based Energy Management for an Isolated Microgrid

1
Department of Aeronautics and Astronautics, College of Engineering, National Cheng Kung University, Tainan 701, Taiwan
2
Department of Automation Engineering, College of Engineering, National Formosa University, Yunlin 632, Taiwan
3
Institute of Civil Aviation, National Cheng Kung University, Tainan 701, Taiwan
*
Author to whom correspondence should be addressed.
Appl. Sci. 2022, 12(17), 8721; https://doi.org/10.3390/app12178721
Submission received: 30 July 2022 / Revised: 26 August 2022 / Accepted: 27 August 2022 / Published: 31 August 2022
(This article belongs to the Topic Artificial Intelligence and Sustainable Energy Systems)

Abstract

:
The development of hybrid renewable energy systems (HRESs) can be the most feasible solution for a stable, environment-friendly, and cost-effective power generation, especially in rural and island territories. In this studied HRES, solar and wind energy are used as the major resources. Moreover, the electrolyzed hydrogen is utilized to store energy for the operation of a fuel cell. In case of insufficiency, battery and fuel cell are storage systems that supply energy, while a diesel generator adds a backup system to meet the load demand under bad weather conditions. An isolated HRES energy management system (EMS) based on a Deep Q Network (DQN) is introduced to ensure the reliable and efficient operation of the system. A DQN can deal with the problem of continuous state spaces and manage the dynamic behavior of hybrid systems without exact mathematical models. Following the power consumption data from Basco island of the Philippines, HOMER software is used to calculate the capacity of each component in the proposed power plant. In MATLAB/Simulink, the plant and its DQN-based EMS are simulated. Under different load profile scenarios, the proposed method is compared to the convectional dispatch (CD) control for a validation. Based on the outstanding performances with fewer fuel consumption, DQN is a very powerful and potential method for energy management.

1. Introduction

The worldwide increase in energy demand leads to the consideration of using renewable energy types such as solar, wind, tidal, and geothermal. Currently, fossil fuels are still the major reliable power sources especially for rural and island electrification. On the other hand, fossil fuel price is constantly increasing, and fossil fuels are responsible for global environmental pollution. Consequently, many countries have recently opted for the long-term sustainable development of renewable energy. By 2025, the Ministry of Economic Affairs (Taiwan) aims at increasing the share of renewable energy to 20% within the total power generation, as well as phasing out nuclear energy. Several developing countries such as Philippines, Thailand, and Vietnam have changed their power development plan based on green energy. We consider them some of the most typical countries for the deployment of renewable energy power plants [1].
The recent development of solar and wind energy has recently been considered because of the available amount of solar radiation and wind distribution. These energy types are environment-friendly and cost effective, but unpredictable and uncontrollable as well due to the significant dependence on weather conditions. In order to improve the operational ability and efficiency of these power systems, the concept of a hybrid renewable energy system (HRES) was created [2]. In terms of power generation for rural and island areas, HRES is more cost effective than a grid extension. Depending on the distance from a power station, a grid extension can range from 10,000 to 50,000 USD per kilometer [3].
In a HRES, the combination for sustainable and reliable power supply of renewable energy resources, energy storage systems (ESSs), and diesel generators (DGs) can create economic, technical, environmental, and social benefits to investors. The role of ESSs is to store the excess energy from renewable energy sources. DGs can be operated when both renewable energy resources and ESSs are out of power. The configuration and topology of a hybrid HRES system can vary in several ways. The most generic classification includes on-grid and off-grid systems. According to the bus interconnection or the physical link between all components, the system can be classified as DC, AC, or hybrid DC/AC [4]. To ensure a high level of system reliability and operational efficiency, energy management algorithms are needed to manage the power flow inside the system. In particular, this algorithm has to allow for the variation of load demand and the system complexity.
Energy management system (EMS) is one of the most important components of the HRES. The main function of EMS is to balance power between the system components reducing the amount of fossil fuel used for power generation. The EMS control can be classical and intelligent [4,5]. Classical EMS is based on linear, nonlinear, or dynamic programming [6]. We can also find rule-based and flowchart methods [7]. More latest classical EMS controllers are based on proportional-integral controller [8], sliding mode controller [9], and H-infinity controller [10]. Classical EMS, which may require complicated mathematical models with various system variables, has low computational complexity. Compared to classic EMS, the intelligent one seems to be more robust and more efficient. Examples include the fuzzy logic (FL) [11], the artificial neural network controller (ANN), the Neural-Fuzzy controller (ANFIS) [12], and a model predictive controller (MPC). In addition, evolutionary algorithms-based EMS methods have been also developed, such as the Particle Swarm Optimization (PSO), the Genetic Algorithm [13], and the Modified Bat Algorithm (MBA) [14]. Recently, machine learning has been applied for EMS such as support vector machine (SVM) [15]. Among these intelligent EMS methods fuzzy logic, neural network, and ANFIS are definitely popular.
Different from classical EMS, based on the intelligent EMS, simple mathematical models are required to manage hybrid system dynamic behaviors. However, the current forms of these methods are still not able to guarantee better performance of optimal control [15]. Over time, a lot of hybrid studies have been conducted to enhance the global optimal solutions and the convergence speed. The major purpose is to find the action that optimizes the value of an objective function. In [16], a method, named as PF3SACO, was developed to improve the optimization ability and convergence speed, in which PSO and fuzzy are used to adjust system parameters. In [17], to adapt to complex scenes, the author proposed a robust tracking method based on a feature weight pool that has multiple weights for different features. In [18], a variable neighborhood search and non-dominated sorting genetic algorithm II (VNS-NSGA-II) were applied to optimally solve the routing problem with multiple time windows. In [19], a principal component analysis (PCA), a local binary pattern (LBP), and a gray wolf algorithm were combined to optimize the parameters of kernel extreme learning machine (KELM) for image classification. It can be confirmed that these hybrid methods are powerful in solving a complex optimal problem, especially since they can be used to optimize the parameters of machine-learning-based approaches. However, they would heavily depend on complex mathematical models and computational complexity.
More studies on agent-based machine learning methods for hybrid EMS have been conducted recently, such as deep learning (DL) and deep reinforcement learning (DRL) [20,21]. Instead of using a complex mathematical control model, these agent-based approaches can manage the system by learning the control policy from the environmental-interacting historical data, leading to a potential solution to energy management problems. Following the concepts of RL and DRL, the control purpose is to obtain the maximum rewards by continuously interacting with the system environment. Based on exploration-exploitation strategies, such as -greedy or softmax, the action with highest reward is taken [22]. Q-learning is a popular model-free RL algorithm. However, RL-based methods can only handle discrete control problems which may be hard to implement in practical applications. DRL-based methods combine RL with deep learning to handle continuous control problems with large state-action pair. DRL has successfully been implemented to play Go games and Atari [23]. It should be a powerful method to handle the problems of complex optimal control with large state spaces by using a deep neural network. It can also be applied in robotics [23], control of building HVAC [24], and hybrid electric cars [25].
Up to now, studies about the application of RL and DRL for energy management of a stand-alone microgrid are not common. A self-learning single neural network was proposed by Huang and Liu (2013) for EMS residential applications [26]. A two-step ahead Q-learning method was defined by Kuznetsova (2013) for scheduling the operation of the battery in a wind system. In [27], a three-step ahead Q-learning method was used to schedule battery operation a solar energy system. A Q-learning-based multi-agent for a solar system was developed in [28] to reduce the amount of energy consumption. Based on an autonomous multi-agent system in [29], it can manage RE buying and selling optically. In [30], authors proposed a multi-agent system to monitor energy generation and consumption. A Q-learning single agent system was applied to manage a solar energy system by Kofinas (2016) [31]. In [32], a Q-learning algorithm and a fuzzy reward function were introduced to improve system performance. It intends to learn about the power flow between the components of the solar system more efficiently, which includes a photovoltaic (PV), a battery, load demand, and a desalination unit (for water supply). Later, Kofinas (2018) [33] proposed a cooperative fuzzy Q-learning-based multi-agent system for the energy management of a stand-alone microgrid. The latter system included a PV, a fuel cell, a diesel generator, an electrolyzer, a hydrogen tank, battery, and a desalination plant. Each component was represented by an agent. Each agent acted as an individual learner and interacted with other agents. The simulation results from MATLAB/Simulink indicated that the controller could continuously maintain state and action space. The learning of each agent took place through exploration/exploitation with fast convergence towards a policy and with good performance. In [33], the author used fuzzy logic as the function approximation for determining the Q-values. Similar to the above approach, deep Q-learning (DQN) applies a neural network to calculate the Q-values in order to increase the learning capacity of agents. In [25], deep Q-learning was applied for the energy management of a hybrid electric vehicle. The DRL-based controller acted autonomously to learn an optimal policy without using any prediction or predefined rule.
The main goal of this study is to propose a DQN algorithm for the energy management of an isolated HRES and to present a case study about an HRES conducted at Basco island of the Philippines. It is the extended study of our previous work, which developed a DRL-based controller to track the maximum power point for PV systems under various weather and partial shading conditions [34]. DL and DRL are widely used in robotics and autonomous; however, only a few studies are about DRL application in an HRES for energy management. Thus, the advantage and novelty of this study is the application of DQN-based EMS for rural and island areas, in which the system includes battery, DG, and hydrogen system, as well as a case study with practical load demand data. The adopted power system in this study consists of a PV system, a wind turbine (WT), a battery, a DG, a fuel cell, an electrolyzer, and a hydrogen tank. Based on weather data and load demand at the applied site, we used HOMER software for determining the structure of the HRES.
The major contributions of this paper are described below:
  • The implementation and simulation of a DQN-based EMS conducted based on Reinforcement Learning Toolbox of MATLAB/Simulink R2021a developed by MathWorks®.
  • Defining a suitable design of the reward functions and neural networks to ensure the convergence during training process, and the trained EMS is able to respond precisely under all different weather conditions and load demand.
  • Verifying the efficiency and stability of the proposed EMS system on an isolated HRES, which is designed based on HOMER software with practical data from Basco island.
  • Conducting a performance comparison between the proposed method and the pre-determined-rule conventional dispatch (CD) control for validation.
The rest of the paper is organized as follows. The mathematical models of the system components are introduced in Section 2. The DQN algorithm and the CD control are introduced in Section 3. The performance of EMS controller based on DQN is simulated in Section 4. The final section describes the conclusion and future work directions.

2. Mathematical Models of the System Components

This section describes the mathematical models of the system components, which are used to calculate their power generation and consumption. In this HRES, solar and wind energy are the primary energy resources. Short-term energy storage technologies have the ability to store and discharge energy for minutes or hours after being charged. In contrast, long-term energy storage can extend the storage time between charging and discharging to weeks or seasons [35]. In HRES, FCs can be used as a long-term energy storage option [4]. However, the slow dynamics of fuel cells and their degradation due to frequent start up and shut down cycles are a major disadvantage. Hence, batteries are also needed to create a hybrid system in which they take care of the power deficit and act as a short-term energy storage medium [36]. Batteries can provide or absorb large power gradients in short time. However, due to their short lifetime, high self-discharge rate, sensitivity to environment conditions, and limited storage capacity, batteries are not suitable for long-term solution.

2.1. PV System

A PV system is composed of one or more solar panels integrated with inverter or other electrical and mechanical hardware, using energy from the Sun to generate electricity. The output power of the PV system is strongly affected by the amount of solar radiation and the ambient temperature. The expression for the PV-generated power is as follows [22]:
P P V = V p v I p v = I p v { q A k T l n ( I p h I p v + I p v o I p v o ) I p v R s }
where k is the Boltzmann constant, A is the non-ideality factor, q is the electron charge, T is temperature, q is the light-generated current, I p v o is the dark saturation current, and R s is the series resistance.

2.2. Wind Turbine System

During wind power generation, the blow of the wind generates kinetic energy, which drives the blades allowing the turbine to rotate. The mechanical energy then gets converted into electricity by the generator. The wind turbine system is significantly influenced by the wind speed. The generated power of the WT system is obtained from the manufacturers as follows [3]:
P W T = { 0 i f   V < V i n   o r   V > V o u t P r ( V V i n V r V i n ) 3 i f   V i n V < V r P r i f   V r V V o u t
where P W T denotes the output power at a particular value of wind speed. P r represents the rated capacity. V i n , V r , V o u t stand for the cut-in, rated, and cut-out speeds, respectively.

2.3. Battery Storage System

Among various kinds of battery storage systems such as lithium-ion battery or nickel-zinc battery, we chose lead-acid batteries for their low cost (300–600 USD per kWh). Lead-acid batteries have a good cycle efficiency of up to 90% and a low self-discharge rate of less than 0.3% [37]. They are designed to withstand more deep discharge cycles, which make them suitable for an HRES.
One of the most important parameters of the battery system is the SOC, which expresses the level of charge relative to its capacity. The excess power is used to charge the battery, while a power deficiency towards the load demand discharges the battery. The battery SOC can be defined as follows [38]:
S O C t + 1 = S O C t ± P B a t η B a t P n , B a t × 100
where S O C t + 1 and S O C t contain the battery SOC at the next time step and the current step, respectively. P B a t stands for the battery power charging or discharging (kWh), while P n , B a t denotes the battery rated capacity, and η B a t denotes the round-trip efficiency.
When the battery is turned on during the operation, the charging and discharging rates of the battery are defined based on the amount of power required at the current time step, always satisfying:
P B a t , d i s c h a r g e P B a t P B a t ,   c h a r g e
where P B a t , d i s c h a r g e with negative sign indicates the discharge rate of battery, and P B a t ,   c h a r g e with positive sign shows the charge rate of battery.
At any time-step, the value of SOC must satisfy:
S O C m i n S O C S O C m a x

2.4. Diesel Generator

In the HRES system, a diesel generator is used as the back-up system when the load demand cannot be met by other components. The diesel generator ensures the availability, reliability, and quality of the power system all the time. We chose the model of the DG system according to its fuel consumption. In [39], an approximate linear model is presented where the hourly fuel consumption is calculated from the rated capacity of the DG and its operating power.
F u e l t = α D G P D G , t + β D G P r , t
where F u e l t expresses the fuel consumption ( l ) . P D G , t denotes the operating power, while P r , t denotes the rated power of the DG system ( kW ) . The coefficients of the fuel consumption are α D G = 0.246 and β D G = 0.08145 . They were used similarly in several studies [40,41].

2.5. Fuel Cell

A fuel cell (FC) uses the chemical energy of hydrogen or another fuel to produce electricity. There are various types of FCs available in the market. The so-called proton exchange membrane fuel cell (PEMFC) is the most frequently used. The advantages of PEMFC include high-power density, low operating temperature, small size, and good performance at start up and shut down. For this reason, PEMFC was chosen for this project. The hourly hydrogen consumption can be expressed as follows [9]:
q H 2 , c o n = P F C E l o w , H 2 η t h e r m U f η F C
where P F C denotes the output power supplied by the FC, E l o w , H 2 = 33.35   kWh / kg assumes the lower heating value of the hydrogen, ηtherm = 0.98 is the thermodynamic efficiency at 289 K, while U f is the fuel utilization coefficient, namely, the ratio between the mass of fuel entering the FC and the mass of fuel reacting in the FC. Finally, η F C denotes the FC efficiency.

2.6. Electrolyzer

To supply the hydrogen fuel for the operation of the FC, an electrolyzer is used. It generates hydrogen from water via electrolysis. The chemical reaction in an electrolyzer is the reverse of that in an FC. The power absorbed by the electrolyzer and the generated hydrogen mass are related by the expression below [9]:
P E L = B q H 2 ,   n o m + A q H 2 ,   g e n
where P E L denotes the power consumed by the electrolyzer system, q H 2 ,   n o m denotes the nominal hydrogen mass flow generated by the electrolyzer, while q H 2 ,   g e n symbolizes the actual generated hydrogen mass flow ( kg / h ) . A and B are the consumption coefficients of the electrolyzer power curve where A = 10 kW / kg and B = 40 kW / kg were used in this paper.

2.7. Hydrogen Tank

In the HRES, a hydrogen tank is used as the container of hydrogen that is generated by the electrolyzer and is consumed by the FC system. Hydrogen can be stored as either liquid or pressurized gas. There are three methods to store the hydrogen: compressed high-pressure gas, hydrogen-absorbing materials, and liquid storage, among which, the first one is the most common. The hydrogen level in a hydrogen tank can be determined by the following expression [9]:
L H 2 ( t + 1 ) = L H 2 ( t ) + q H 2 ,   g e n q H 2 , c o n C A P H 2
where L H 2 ( t + 1 ) and L H 2 ( t ) stand for the level of the hydrogen at the next and the current time-steps, respectively, and C A P H 2 denotes the capacity of the hydrogen tank ( kg ) .

2.8. Power Balance

Power balance is the state of equality between the produced energy and the load demand. More exactly, at each time step, the total possible power generation should never fall short of the power consumption. The weather data collection for feasibility extended over one year to facilitate system analysis and to allow for scheduling the operation of the whole system. The power balance equation is expressed as follows:
P P V + P W T + P B a t + P D G + P F C + P E L = P L o a d

3. Energy Management of an HRES Based on Deep Q-Network

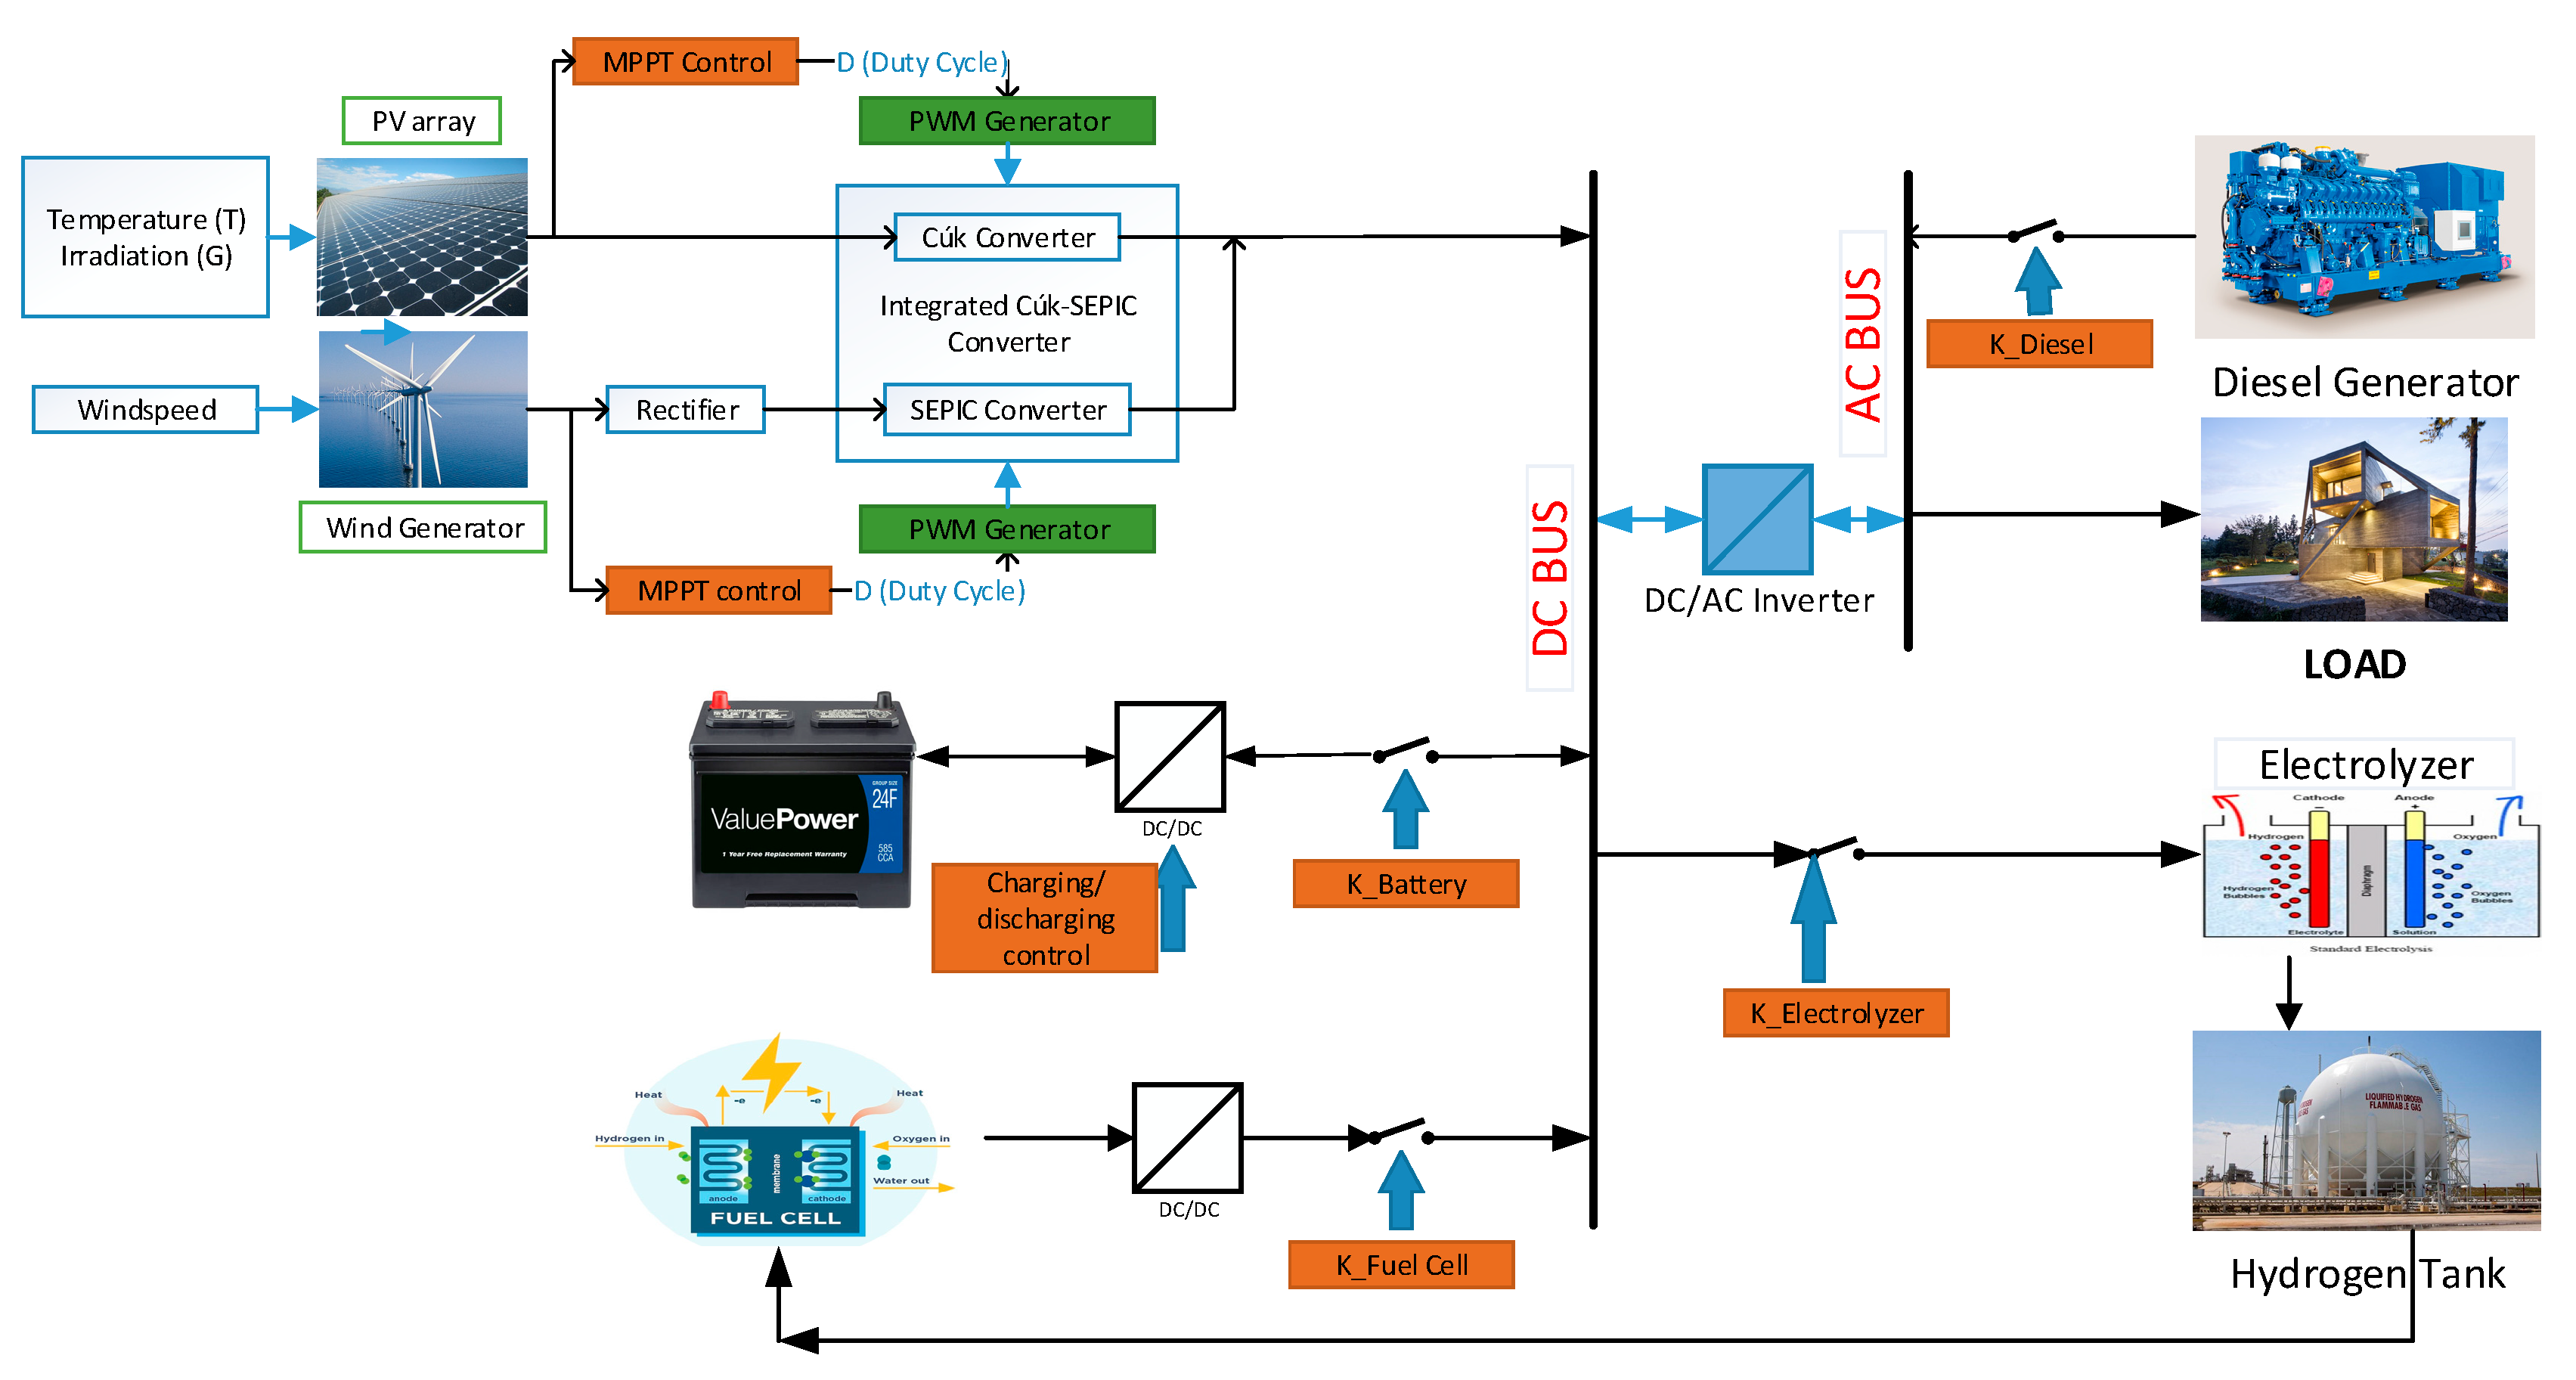
3.1. Introduction of the Proposed HRES

EMS is one of the most important parts to ensure the system is in reliable and efficient operation. The main function of the EMS is to balance the power flow between the system components, and simultaneously reduce the amount of fossil fuel and cost of energy production. A proposed DC/AC-bus system for power generation is presented in Figure 1. Excess energy from PV and WT will be stored in the battery and hydrogen system by controlling the K_Battery and K_Electrolyzer switches. In case PV and WT cannot fulfill the load demand, based on the available energy levels of system components, EMS will discharge battery or turn on FC and DG by K_Fuel-Cell and K_Diesel switches, respectively.
The proposed EMS control schema is presented in Figure 2. It is a learning-based approach, so no explicit mathematical model of the system is needed. A Markov Decision Process (MDP) of the EMS is needed for the implementation of the DQN algorithm. Based on the MDP model, the objective is to find the optimal policy for dispatch control of the system components to ensure a stable operation of the power system with the lowest cost of energy. An MDP model of the EMS is firstly defined in Section 3.2, including states (S), actions (A), transition probabilities (P), and rewards (R). It is considered as a tuple S, A, P, R. In which, “S” is a finite set of states which describes the all the operating point of the system. “A” is the control action. “P” is the probability of moving from one state to another one. “R” is an immediate return given to an agent when he or she performs specific action or task. Good action will receive positive reward while bad action will get punished.
A description of the DQN algorithm for EMS control is shown in the following part. In the DQN approach, a deep neural network is designed to approximate the action-value function and the DQN algorithm is adopted to train the neural network. It takes the state of the HRES as inputs, and outputs are the signals for dispatch control of the system components. The combination of the states of K_Battery, K_Electrolyzer, K_Fuel-Cell, and K_Diesel basically determines the system modes of operations. Finally, in Section 3.4, a conventional-based EMS is also applied for the validation of the proposed method.

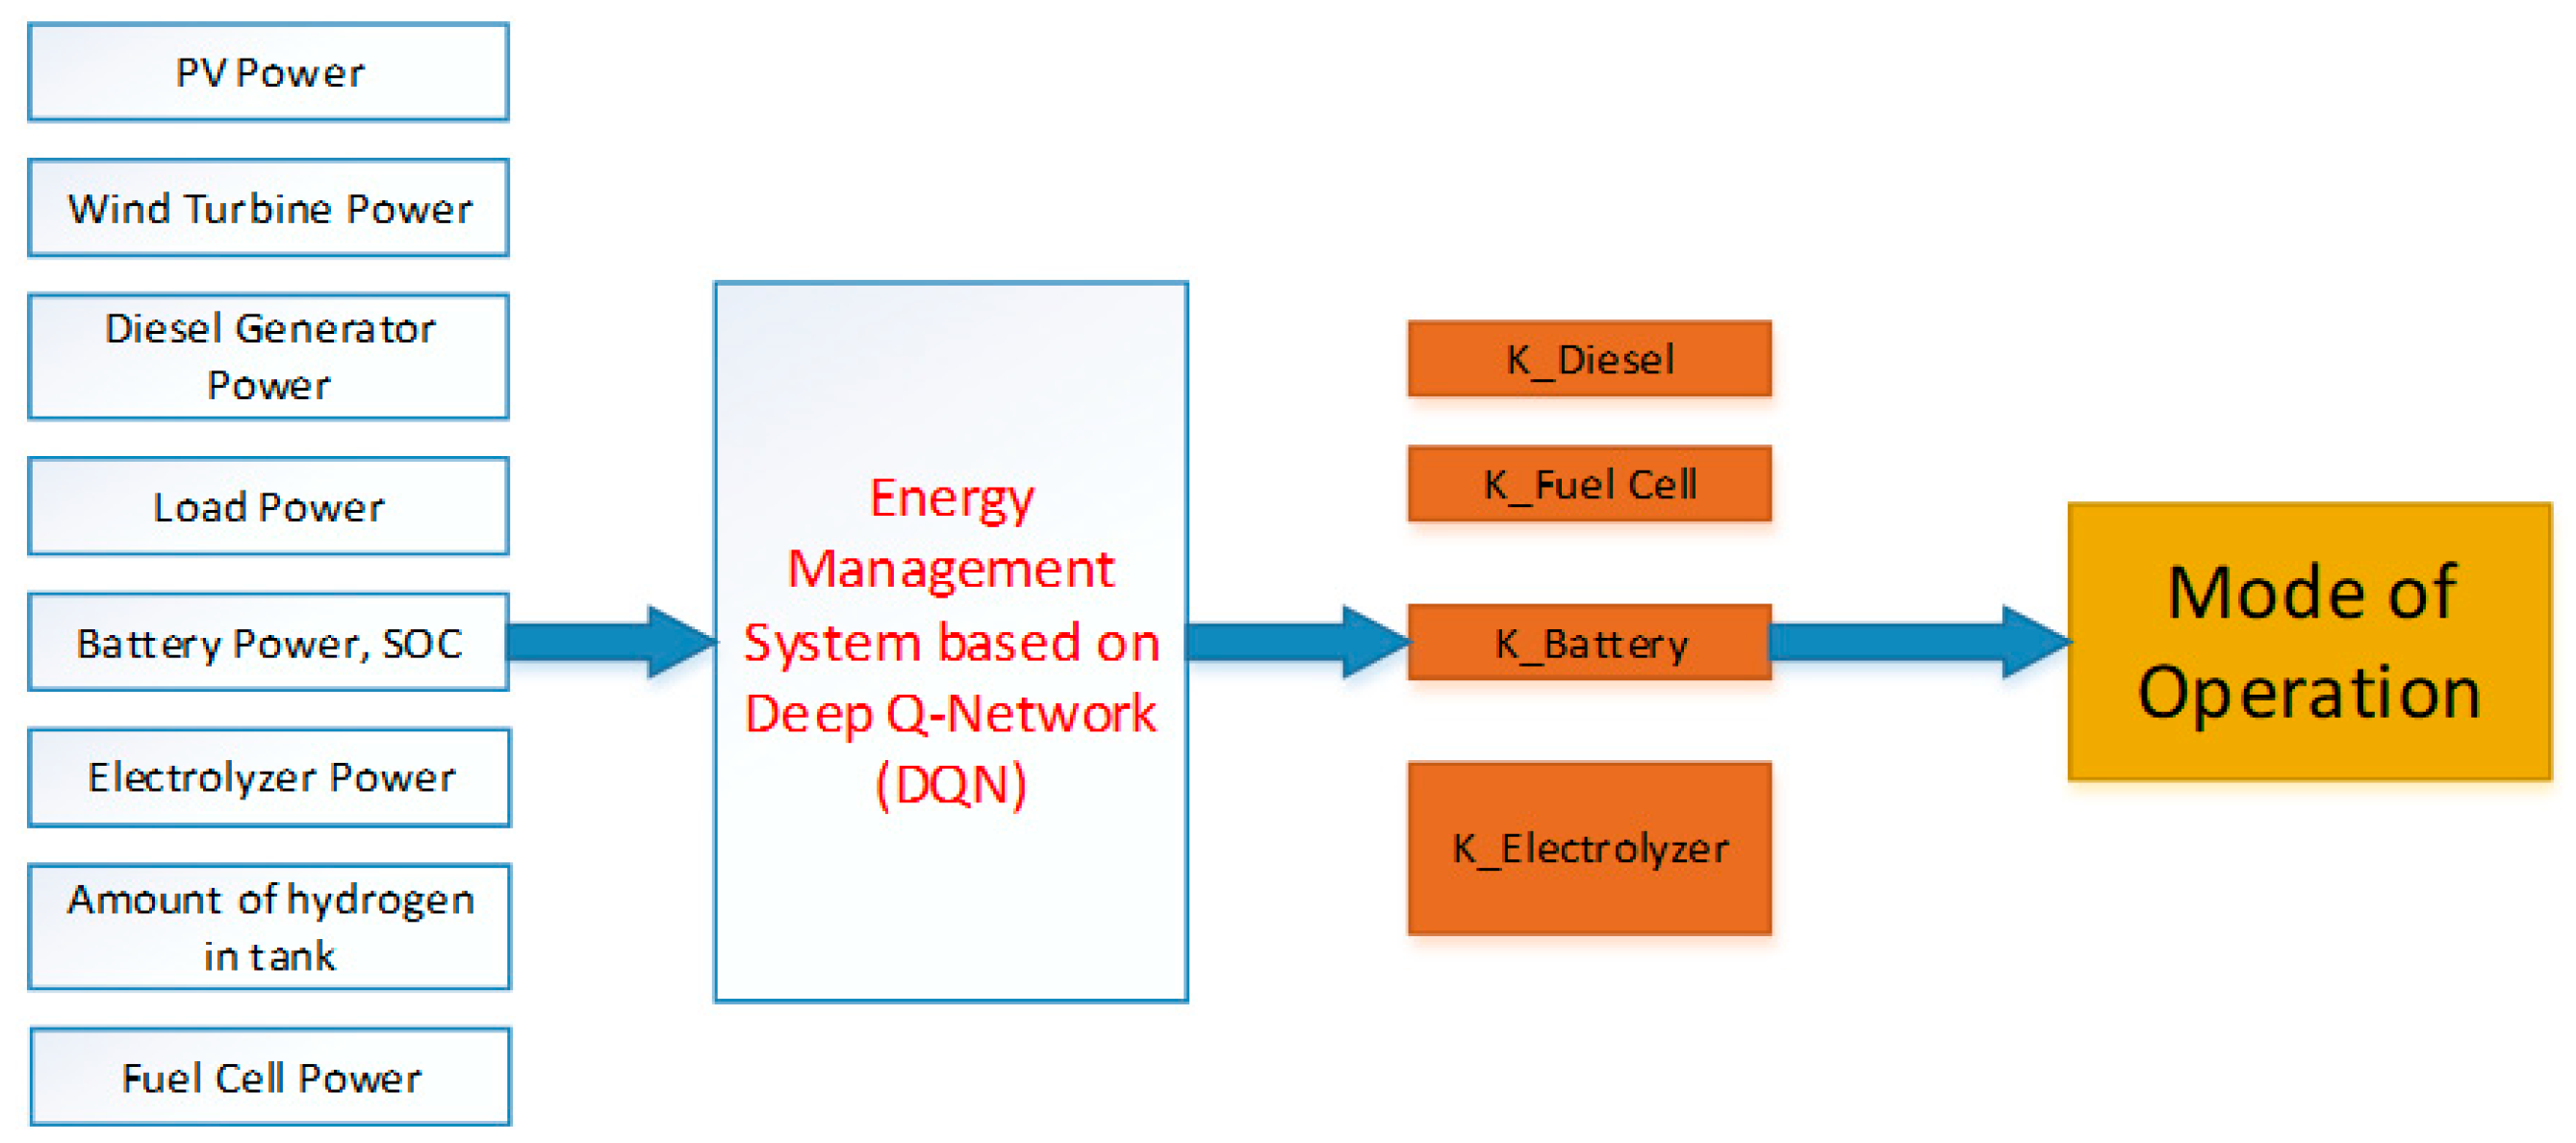
3.2. Markov Decision Process Model for the EMS

3.2.1. States and State Variables

During the operation of the HRES, the EMS controller receives a current state, it takes action, and moves to the next state based on its knowledge. The state information provides the basis for power flow control among all system components. The elements of our proposed HRES include PV, WT, DG, battery, and hydrogen system. The state variables are defined as combinations of the powers of load, PV, WT, DG, battery, fuel cell, and electrolyzer, as well as the state of charge, and the percentage of hydrogen in the tank ( L H 2 ):
S = { P L o a d , P P V , P W T , P D G , P B a t , P F C , P E L , S O C , L H 2 }

3.2.2. Actions and Action Variables

Given the state at the current time step s t , the EMS controller chooses an action and moves to next state by opening or dispatching the operation of following elements: DG, fuel cell, electrolyzer, and battery system. The action set A is formed by 4-component control signals:
A = { σ B a t t e r y × σ D G × σ F C × σ E L }
The control actions of the battery system are discharging (−1), stopping (0), and charging (1), that is:
σ B a t t e r y = { 1 , 0 , 1 }
The control action variable of the diesel generator is in Equation (14), including stop, operating 25%, 50%, 75%, and full capacity, that is:
σ D G = { 0 , 0.25 , 0.5 , 0.75 , 1 }
The control action variables of FC and electrolyzer are defined as σ F C and σ E L , respectively, including ON (0) and OFF (1), that is:
σ F C = { 0 , 1 }
σ E L = { 0 , 1 }

3.2.3. Transition Probability

Transition probability defines the probability that the agent moves from one state to another state. Given an action a t , where t denotes the current time step, the transition probability from a current state s t to the next state s t + 1 = s is denoted by P s s a , that is [42]:
P s s a = P [ S t + 1 = s | S t = s , A t = a ]
In model-based energy management approaches, the transition probabilities P s s a are estimated by Monte Carlo simulation based on the prior probability distribution, or they are predicted by a short-term prediction model. However, in a model-free approach such as the DQN algorithm, they are estimated through learning from data.

3.2.4. Rewards

Reward function is used to calculate the reward from environment in response to a given state and action. It describes how the agent ought to behave. A good reward function can accelerate convergence during the training process. It can also affect the controller performance. For a simple approach, our designed reward function is the consumption of the reward from each system component as follows:
r t ( s t , a t ) = r t , B a t + r t , F C + r t , E L + r t , D G
where r t , B a t , r t , F C , r t , E L , and r t , D G are the rewards from the subsystems: battery, fuel cell, electrolyzer, and diesel generator.
The component rewards are essentially defined as follows:
r t , B a t = { P B a t P d i s c h a r g e , m a x i f   ( P P V + P W T + P D G P L o a d η i n v e r t e r ) 0 P B a t P d i s c h a r g e , m a x o t h e r w i s e
r t , F C = { 2 P F C P F C , m a x i f   ( P P V + P W T P B a t P L o a d η i n v e r t e r ) 0   a n d   S O C 0.5 P F C P F C , m a x i f   ( P P V + P W T P B a t P L o a d η i n v e r t e r ) 0 P F C P F C , m a x o t h e r w i s e
r t , E L = { 2 P E L P E L , m a x i f   ( P P V + P W T + P D G P B a t P L o a d η i n v e r t e r ) 0   a n d   S O C 0.9 P E L P E L , m a x i f   ( P P V + P W T + P D G P B a t P L o a d η i n v e r t e r ) 0 P E L P E L , m a x o t h e r w i s e
r t , D G = F u e l t F u e l m a x
where η i n v e r t e r is the inverter efficiency, F u e l t is the fuel consumption of the diesel generator based on the actual operating power at time step t, and F u e l m a x is the fuel consumption at the maximum capacity.
As shown in Equations (19)–(22), the component reward functions are defined based on the result of the power balance function. For example, the battery will get negative reward when the sum of PV, WT, and DG powers is smaller than 0. Thus, the agent will learn to avoid choosing the negative-reward actions. The reward functions of FC and EL are similar to that of battery. For DG reward function, more fuel consumption means more negative rewards. Thus, it helps the agent to stop the operation time of the DG as much as possible.
In addition, the agent receives a big penalty if these parameters are out of their boundaries as shown below:
S O C m i n S O C S O C m a x
P B a t , d i s c h a r g e P B a t P B a t , c h a r g e
L H 2 , m i n L H 2 L H 2 , m a x
0 P F C P F C , m a x
0 P E L P E L , m a x

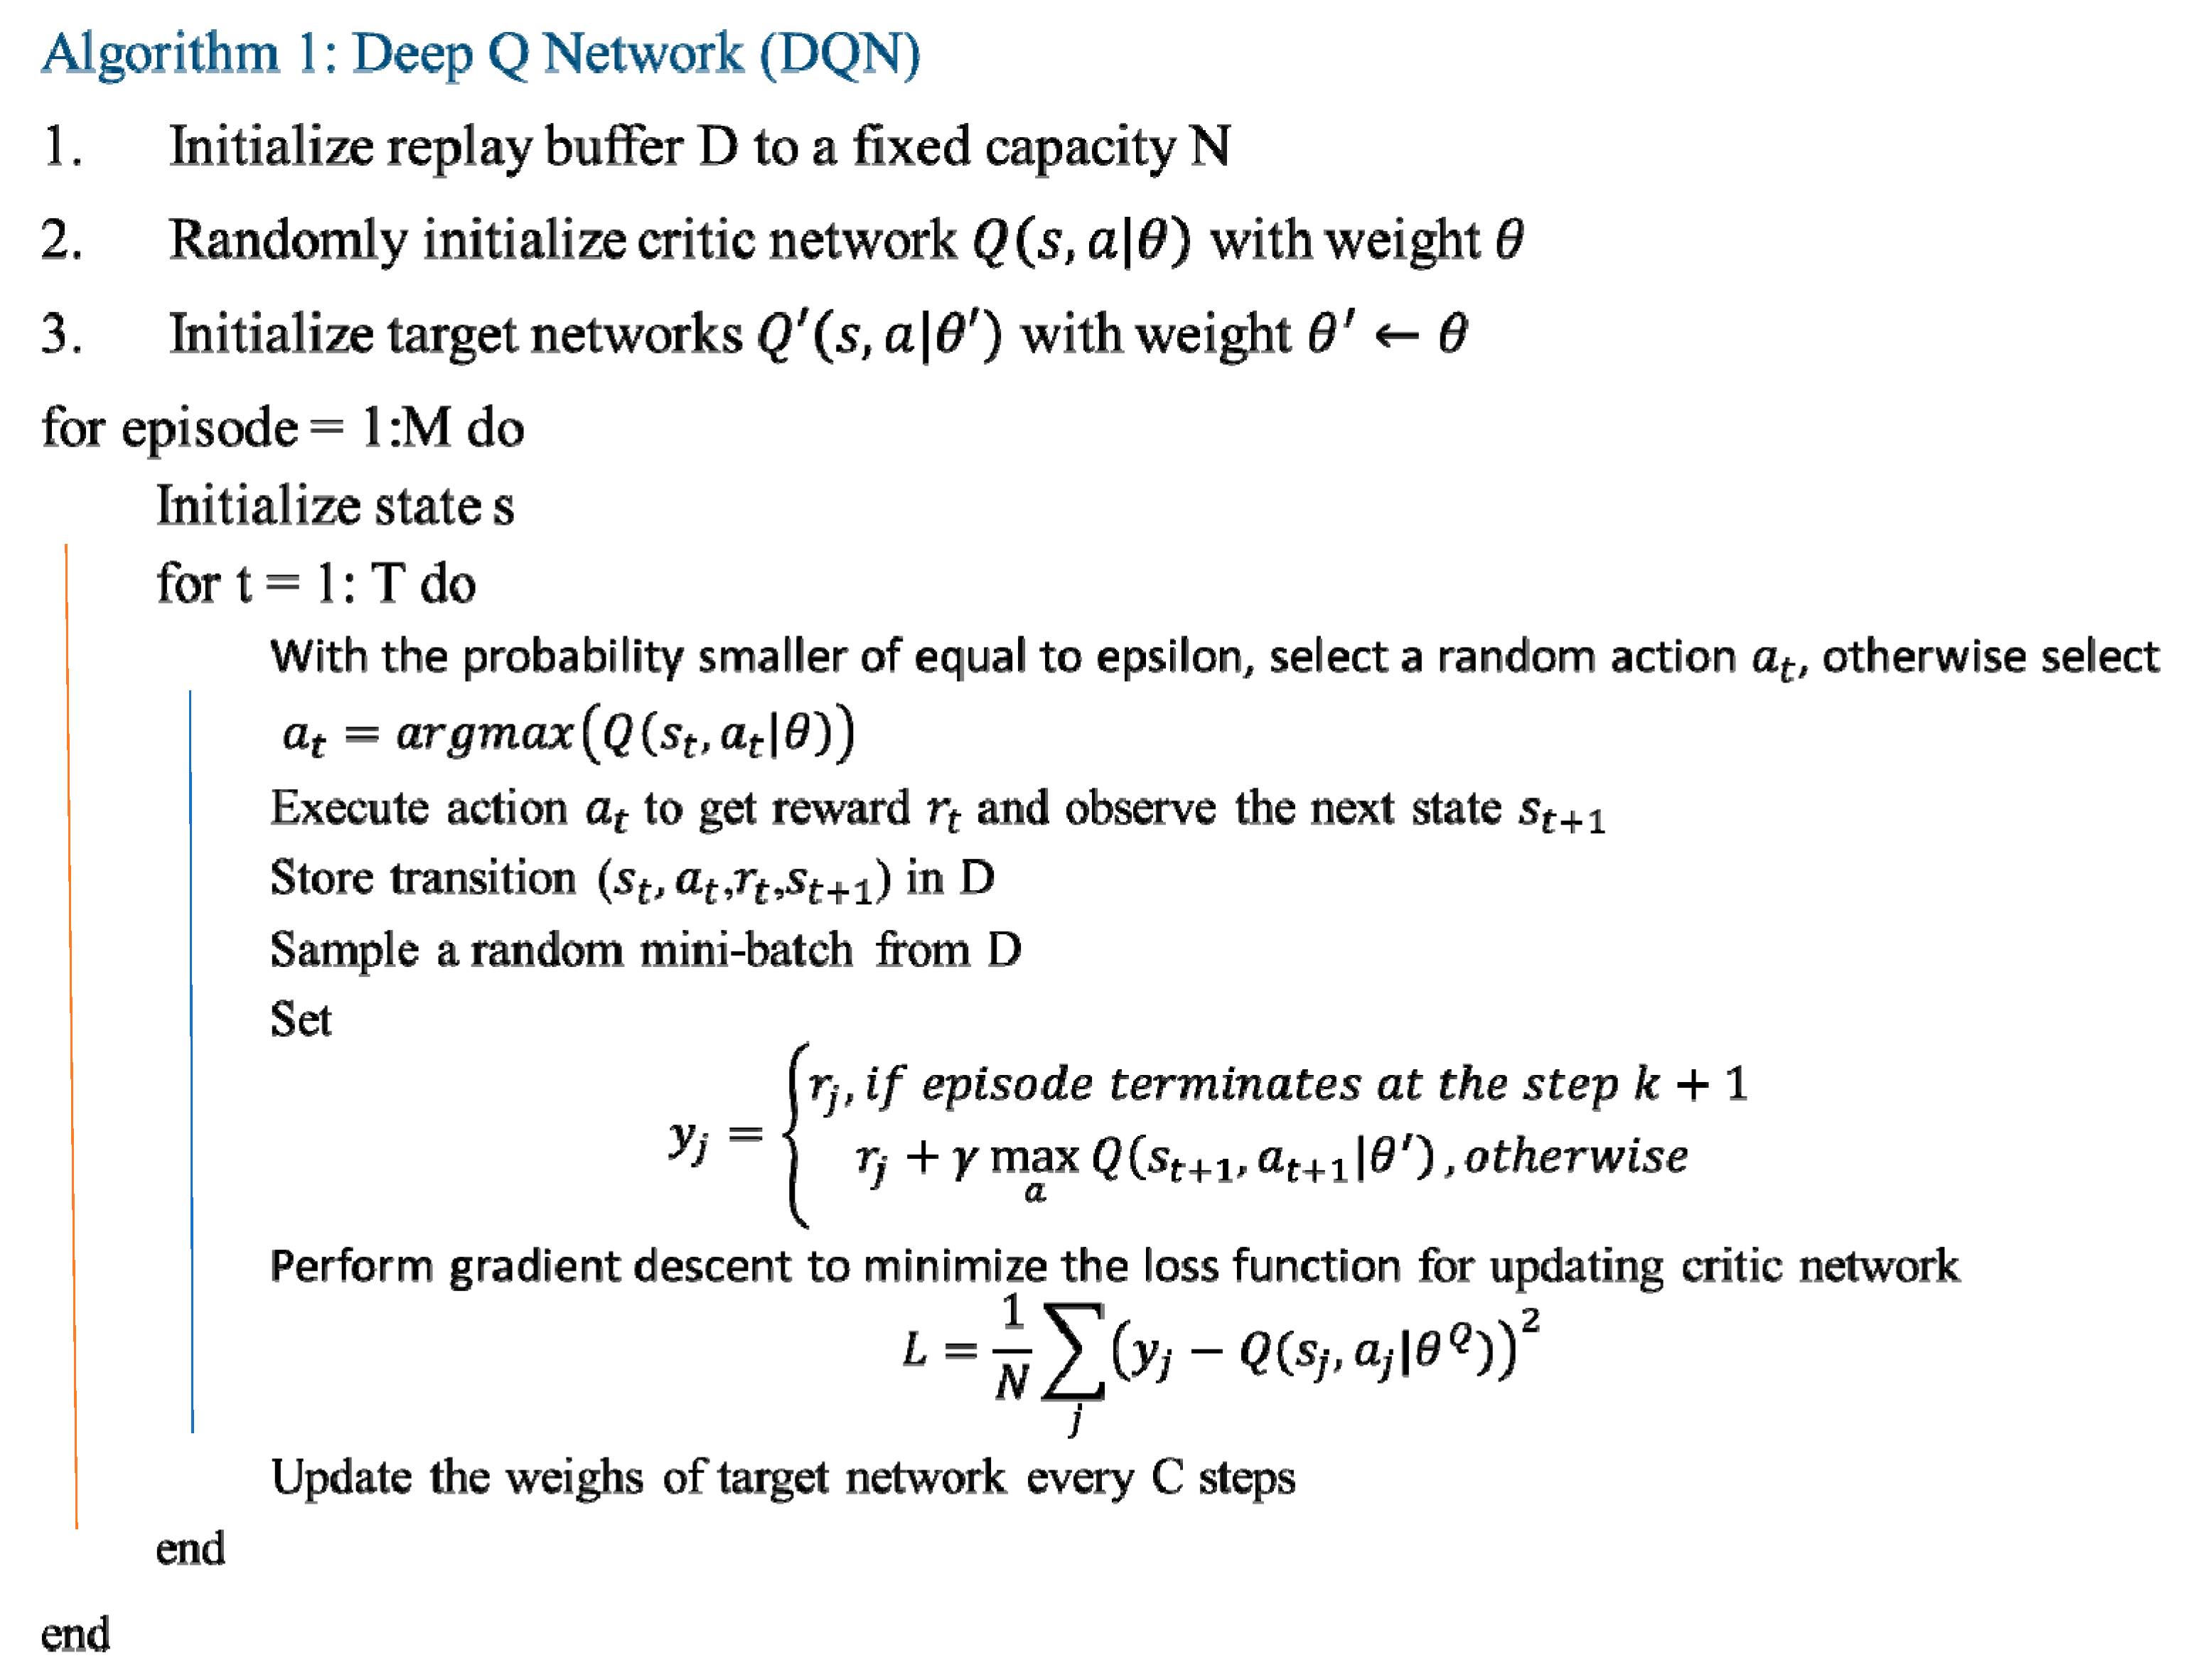
3.3. Methodology of the DQN-Based EMS

In this part, the DQN algorithm is described. Its objective is to find an optimal policy that maximizes the expected total rewards from a starting state. Figure 3 shows a graph of DQN-based EMS. The optimal policy is formulated as [42]:
V π * ( s ) = m a x E π [ t = 0 T γ t r t + 1 | s 0 = s ]
where π * Π is the optimal policy in response to a given state and action. It is a strategy which is applied by the agent to decide the next action based on the current state. 0 < γ < 1 is the discount factor used to define the importance of future reward. E π denotes the expected value of reward according to the policy the agent follows.
In the DQN formulation, the optimal policy is represented by the optimal action-value function:
V π * ( s ) = m a x Q π * ( s , a )
where V π * ( s ) is the optimal state-value function of an MDP. It is the expected return starting from state “s” following optimal π * ; Q π * ( s , a ) is the optimal action-value function. It is the expected return starting from state “s”, following optimal policy π * , taking action “a”. It focuses on the particular action at the particular state.
It is expressed as follows [42]:
Q π * ( s , a ) = E π * [ k = 1 γ k 1 r t + k | s t = s , a t = a ] = E π * [ r t + γ m a x Q π * ( s t + 1 , a t + 1 ) | s t = s , a t = a ]
Following the optimal action-value function, the optimal policy can be determined by [42]:
π * ( s ) = a r g m a x Q π * ( s , a )
In the DQN algorithm as shown in Figure 4, a deep neural network is used to calculate Q π * ( s , a ) . It is expressed as Q ( s , a | θ ) network, where θ is the weight vector of the neural networks. As shown in the pseudo code in Figure 4, two separate Q-networks are used. Q ( s , a | θ ) represents the prediction network, while Q ( s , a | θ ) represents the target network [42]. To train the Q-network, a gradient descent is applied to minimize the loss function of the target and prediction networks. In every time step of the training process, the prediction Q network is updated by back-propagation method. In contrast, the target network is frozen. After a period of C time steps (C steps in the algorithm), its weights are updated by simply copying the weights from the current prediction Q network. Freezing the target Q network for a period of time helps stabilize the training process. In general, the Deep Q Network must be trained through the process in Figure 4 to ensure that EMS controller always chooses the best action. Then, EMS uses its trained Deep Q Network to calculate the Q value based on the current state information, and the next action is chosen following that Q value.

3.4. Methodology of the Conventional Dispatch-Based EMS

The EMS controller chooses the operational mode of an HRES according to the power difference between generation and consumption and the available power in the energy storage system. It aims to satisfy the power demand all the time with the lowest fuel consumption. Following the work in [14], an convectional dispatch EMS method is applied in this study. It is used to compare with DQN-based method in term of system performance efficiency. The control actions of CD method are the same as DQN, including switching on/off the diesel generator, the fuel cell, and the electrolyzer, as well as charging/stopping/discharging the battery. The flow chart of the considered method is shown in Figure 5 and Figure 6. This controller chooses the operational mode according to the power difference between generation and consumption and the available power in the energy storage system. It aims to satisfy the power demand all the time with the lowest fuel consumption.

4. Results and Discussion

4.1. Site Description

Based on the weather and load data collected from this area, an optimal configuration of HRES is calculated by HOMER software [43]. Then, its simulation model is defined in MATLAB/Simulink for the implementation of our DQN-based EMS. In this part, the introduction of Basco Island is presented. This island is about 190 km away from Taiwan and is located in the northern region of the Philippines, where the major economic sectors are farming and fishing. On the island, the current source for power generation are diesel generators and fossil fuels, which require high operational costs due to the constantly increasing fuel prices and logistic costs. The location of Basco Island is excellent for marine resource management and tourism. As the government supports developing a sustainable economy, the local governors took the opportunity to invest in a more environment-friendly power system for the local community. Thus, research plays an important role in the economic development plan in this area. It ensures the continuous power supply with low cost of energy and environmental friendliness.
Figure 7 shows the diagram of our presented HRES in HOMER software (left), as well as the load profile through the year at Basco station (right) presented in HOMER software. A daily power consumption with an average demand of 700 kW every hour is shown in Figure 8. The weather data used for system simulation were taken from the database of the National Renewable Energy Lab (NREL), which can be generated by HOMER software. The average year around solar radiation is 4.44 kWh/m2/day, while that of the wind speed is 7.22 m/s. Following the data, the energy system should supply 18 MWh a day with a peak power of 1.4 MW.
Following the analysis in HOMER software, the optimal configuration of HRES in this case study is obtained [43]. It is reliable, environmentally friendly, and cost-effective. The proposed design includes a 5483 kW PV system, 236 pieces of 10 kW wind turbines, a 20,948 kWh battery system (48 V DC, 4 modules, 5237 strings), a 750 kW diesel generator, a 500 kW Fuel Cell system, a 3000 kW electrolyzer, a 500 kg hydrogen tank, and a 1575 kW converter. The Net Present Cost (NPC) of the system means the present value of the costs of investment and operation of a system over its lifetime. In this study, it was about 72.5 million USD. The Cost of Energy (COE), as the average cost per kWh of useful electrical energy produced by the system, was about 0.696 USD/kW. Furthermore, it can be concluded that the combination of the FC and the battery as the storage system is the best option for the design of HRES with lowest cost of energy. In this kind of system, FC is for a long term, while the battery is for short-term usage. Following the load demand at the applied area, the system is practical and cost-effective.

4.2. Implementation of DQN-Based EMS in MATLAB/Simulink

We carried out the simulation of the designed HRES in the Reinforcement Learning Toolbox of the MATLAB/Simulink environment. The time interval between two time-steps was one hour. There was a total of 5000 episodes during the training process where each episode ran for a randomly selected 48-h period. At the beginning of each episode, random initial conditions were generated including the initial state of charge and the initial amount of hydrogen in the tank.
Based on the experiences from previous publication [34] as well as trial-and-error during the training process, the structure of the network and its training parameters were determined. This is a usable reference in this area because there are not many publications that discuss details of the implementation of DRL for an HRES. In this study, the structure of the critic network applied for the DQN method is depicted in Figure 8, while the initial setting parameters for the simulation are displayed in Table 1. The amount that the network weights are updated during training is referred to as the step size or the learning rate ( α ). A large learning rate helps the agent to learn faster, and it could obtain the local optimal solution. On the other hand, a smaller learning rate may allow the agent to learn a global solution but may take significantly longer to train. In this study, the learning rate of the critic network is set to 0.001. It would mean that weights in the Q network are updated 0.1% of the estimated weight error each updating time. The action space of DQN comprises the combination of the actions of the four system components: battery, fuel cell, electrolyzer, and diesel generator.
The discount factor (γ) affects how much weight it gives to future rewards in the value function. γ = 0 means that the agent will be completely myopic and only studies actions that produce an immediate reward. γ = 1 means that the agent will assess each of its actions based on the sum total of all of its future rewards. Exploration rate (ε) is the probability that our agent will explore the environment rather than exploit it. It is set to 1 at the beginning and reduced gradually over the training time. This ensures that the agent has enough time to explore and learn all about the environment.

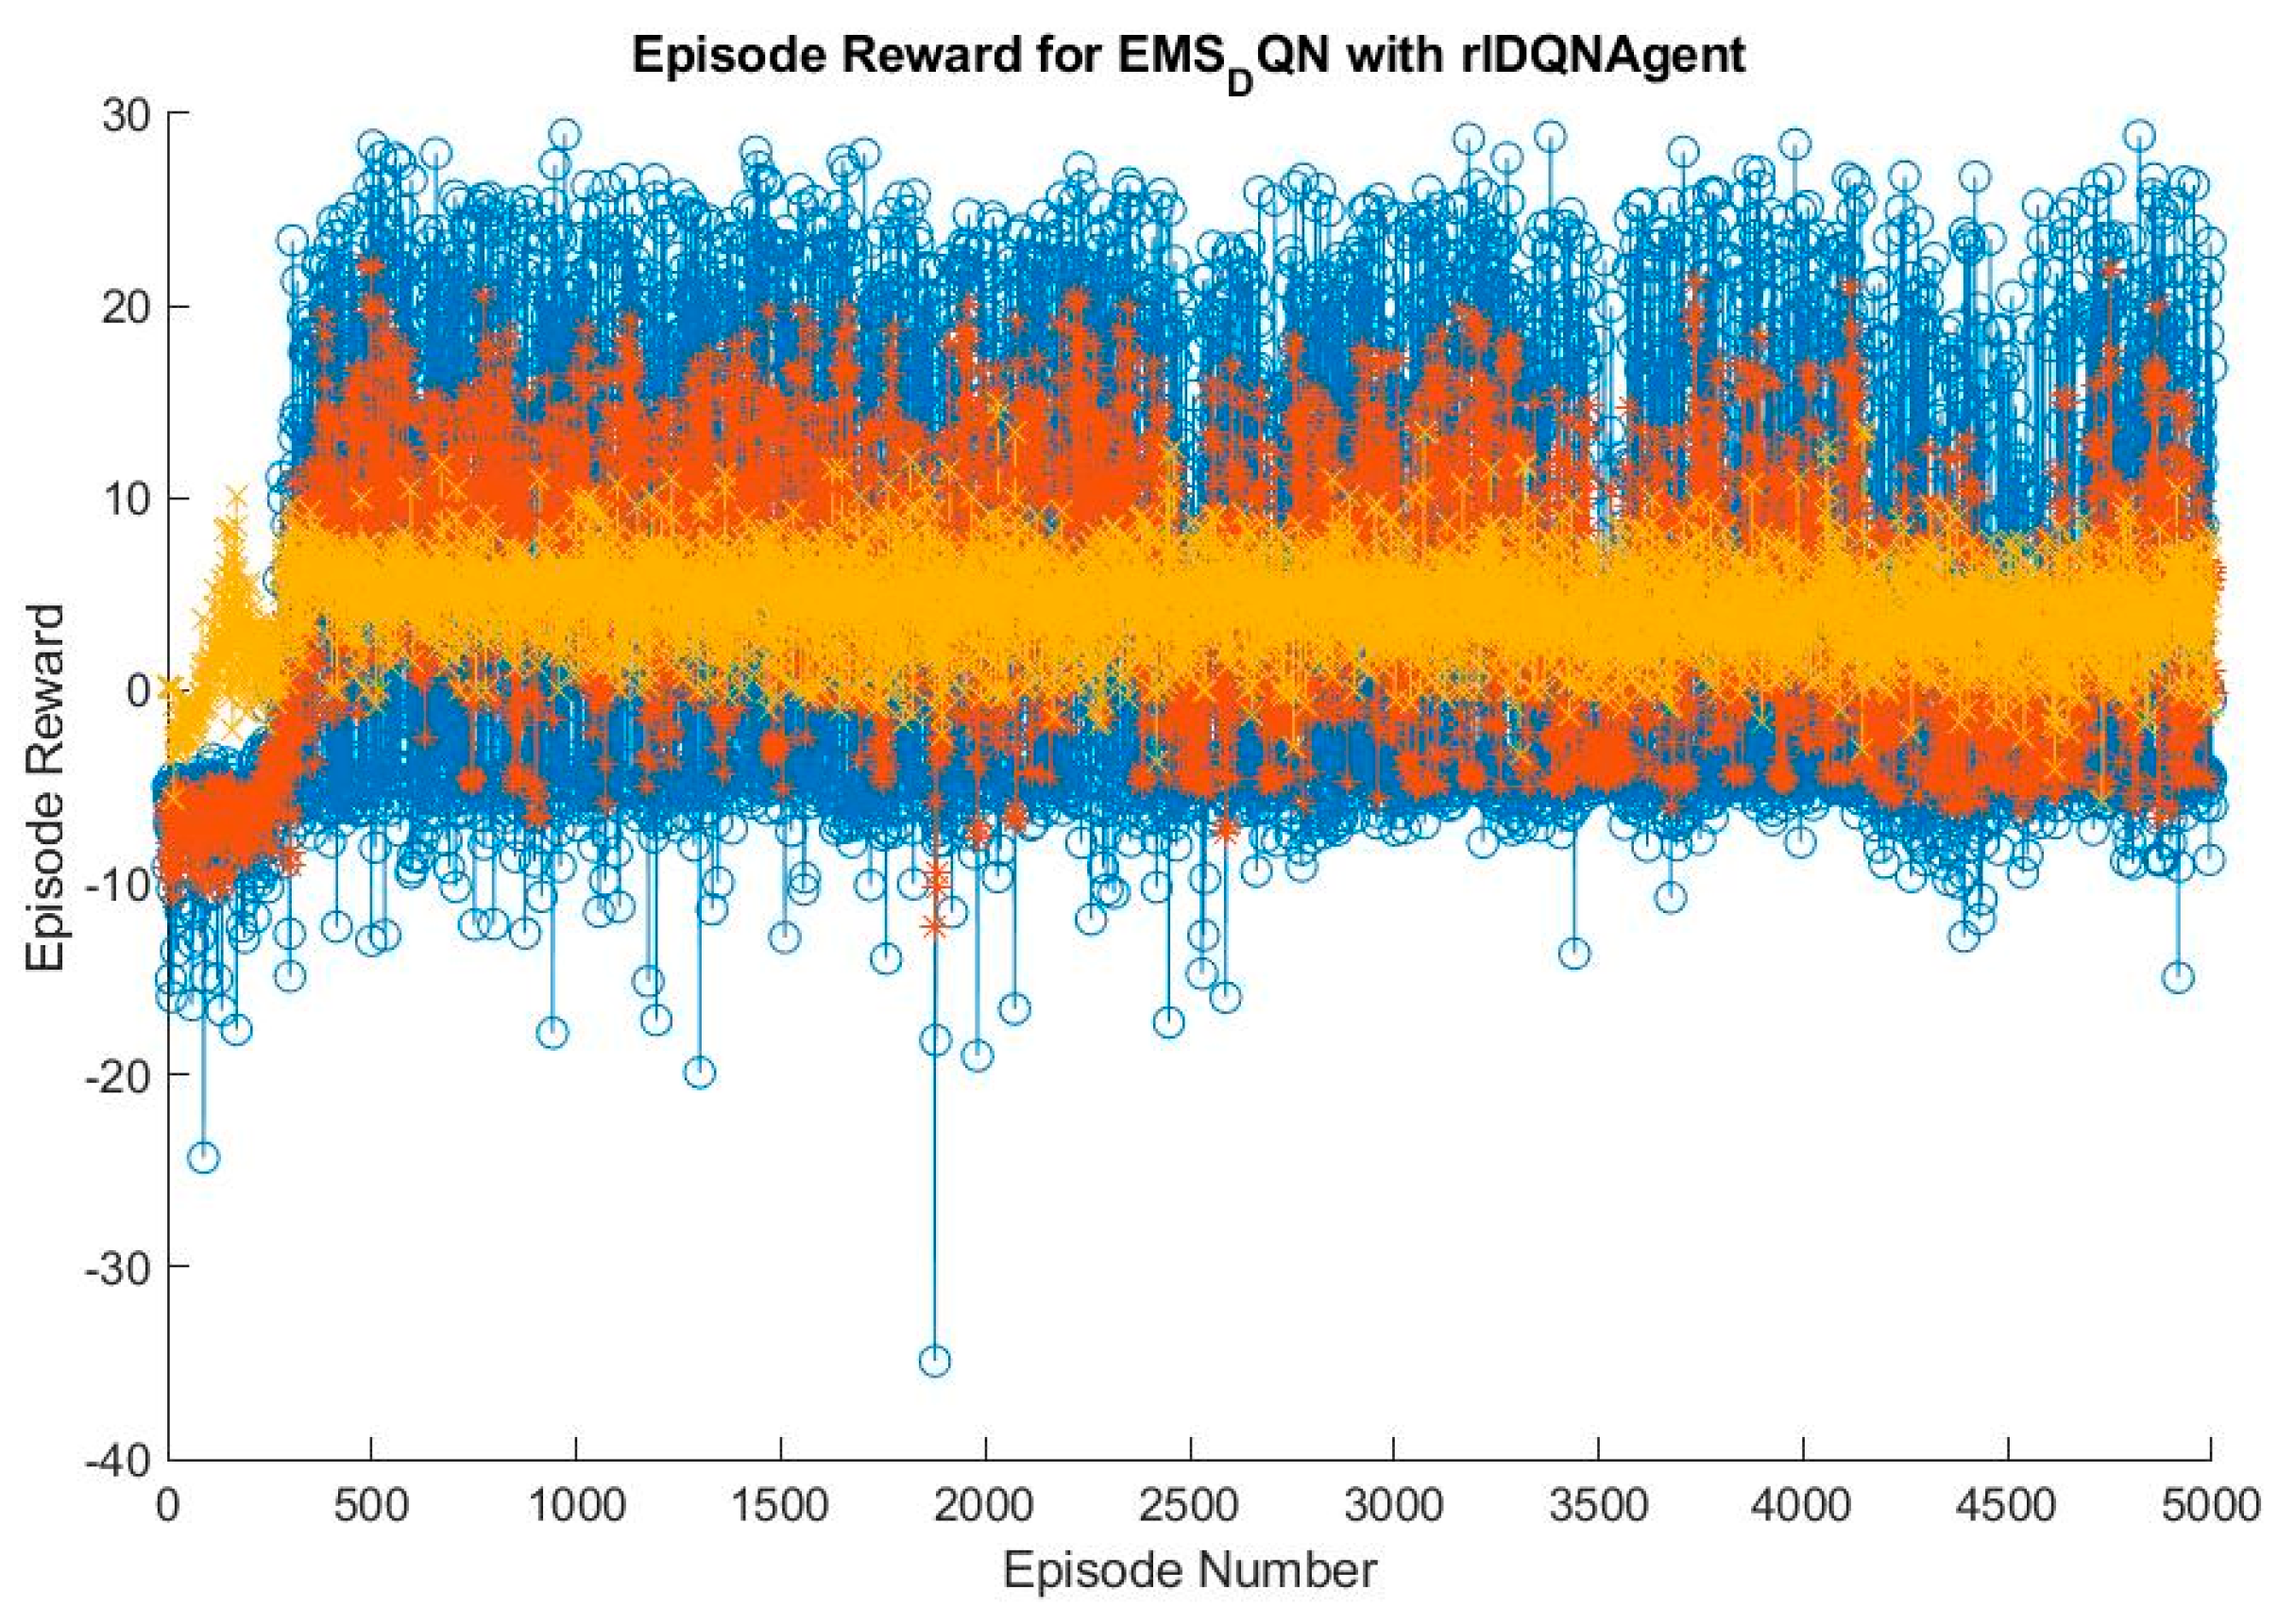
4.3. Training Result

The training progress of the EMS controller based on the DQN algorithm is shown in Figure 9. The blue line represents the total reward in each episode, while average reward of total episodes at every time step is indicated by the red line. The estimation of the discounted long-term reward of critics when each episode starts, episode Q0, is marked as the yellow line in the graph. The average reward of total episodes at every time step flattens after 500 episodes. During the training process, we save the trained agents for online use when the average reward passes the design average value.

4.4. Performance under Various Conditions

We used two scenarios for validating the performance of the proposed method. Each test also included a comparison with a conventional dispatch-based control. In the first scenarios, the operation of the diesel generator is totally turned off by the controller, because the battery and hydrogen system can fulfill the load the demand in case of not enough from solar PV and wind turbine. The second scenario is used to test for the operation of a diesel generator when all other energy resources run out of energy. It starts with less energy from PV and WT, so the operation of battery and hydrogen are required. Finally, diesel generation must be turned on to ensure the operation of the power system.
The simulation period was two days long using one-hour intervals between consecutive steps. WT, PV, and load demand were randomly generated from the year-round data. SOC and hydrogen levels were initialized with random values. Training based on random inputs shows the proposed DQN method can make effective schedules for the EMS in a deterministic environment from any initial conditions. The SOC minimum level was set to 30% in order to avoid running into deep discharging, thereby increasing battery lifetime. The minimum hydrogen level was set to 0. The simulation was implemented in the Reinforcement Learning Toolbox of MATLAB/Simulink software.

4.4.1. Scenario 1

The first scenario aimed at demonstrating the performance of the proposed DQN approach without the operation of the diesel generator. Figure 10 indicates the available power from the PV (green) and WT (blue) systems. The load demand is depicted by the red line. The simulation result is displayed in Figure 11. The three subfigures on the left apply for the DQN-based (red) EMS method, while on the right, apply for the CD-based (blue) EMS method. The first row displays the SOC of the battery. The second row displays the level of hydrogen in the tank. The third row displays the fuel consumption of the diesel generator.
Figure 11 shows that the diesel generators remained shut down under both methods. The SOCs on the left and right are almost identical. Between steps 0 and 5, the battery was charged by the power production of the WT system. Between steps 5 and 11, the battery switched to discharging due to no power from PV and WT. Between steps 11 and 24, more renewable power was available, so the battery was charged, and the excess power was used to run the electrolyzer. The amount of hydrogen increased between 17 and 20 h and between 38 and 43 h. Under the DQN method, the battery itself handled the problem of insufficient renewable input. Since the fuel cell remained shut down, there was no reduction of the hydrogen level in the tank over the simulation time. Under the CD approach, the fuel cell operated during steps 21–25 and 45–46, reducing the hydrogen level.

4.4.2. Scenario 2

The second scenario aimed at demonstrating the performance of the proposed DQN approach with the operation of the diesel generator. Similar to the previous case, Figure 12 shows the PV and WT productions and the load demand, while Figure 13 demonstrates the performance of the DQN- and CD-based methods. No renewable energy was available at the beginning. The level of SOC was 45%, and the amount of hydrogen in the tank was 10%. Thus, the diesel generator was forced to operate when power deficit occurred.
From 0 to 4 time-steps, since no power was available from PV and WT, the battery discharged to its lower limit of 30%. The fuel cell supplied the power demand from 5 to 7 time-steps, resulting in the reduction of the hydrogen level. Since the power deficit persisted, the diesel generator turned on from 6 to 8 time-steps. The battery was charged fully from 9 to 15 time-steps when more power was produced by PV and WT. Similarly, extra power was used by the electrolyzer to generate hydrogen. After that, the battery discharged from 23 to 34 time-steps, and charged to its upper limit by step 38. The diesel generator and the fuel cell remained off due to no consumption. The operating time of the diesel generator under both methods was 2 h. However, the proposed DQN method only consumed 353 L, while the CD-based method consumed 492 L.

5. Conclusions

This study presents a DQN-based control to solve the complex problem of energy management in an HRES, where the energy flow between the HRES units is managed. The power system for case study on Basco Island, Philippines, includes a PV system, a WT system, a battery system, a diesel generator, and a hydrogen system. Due to its advantages of non-polluting power generation, the hydrogen system is considered for use in the proposed HRES. In the hydrogen system, an electrolyzer uses the excess energy from PV and WT to generate hydrogen for the operation of the fuel cell when an occasion of power shortage occurs. In the field of HRES, most of the current studies applied Q-leaning method, which has the limitation of a finite state and action space. In order to confront with continuous state space and large discrete action space, we introduced a deep neural network, allowing the agent to use function approximation to generalize across states, instead of using a Q look-up table. For any given state, the agent will choose the action with the highest value of reward and move to the next state. An MDP model of the HRES and the reward functions are formulated for the implementation of the proposed method in MATLAB/Simulink environment.
A basic rule-based EMS method named CD is considered to compare with the proposed DQN following the power efficiency. Based on this comparison, we know that the proposed method is always equal to or at least is better than the CD method. Despite only two scenarios considered for the result analysis, it can be concluded that the proposed method has good performance and outperforms the CD method under any uncertain environment. This is because the agent is trained based on the random initial conditions with random weather data and load demand, generated from the whole-year data.
The future work is to perform comparative real-time experiments with different advanced EMS methods such as Fuzzy, ANFIS, and PSO. Furthermore, to overcome the disadvantage of our proposed method, which is using a simple network structure and a basic reward function, a better study on the design of deep neural networks and gradient reward functions should be considered for fast convergence and less fluctuation of the average reward during the training process. These two factors ensure that the optimal policy for optimal EMS control of HRES is always obtained. Moreover, computational complexity should be an important metric for testing and validation. In addition, lithium-ion batteries are just as cheap as lead-acid batteries. They have lower self-discharge rates and higher lifetimes and efficiencies. Moreover, in the size category of multi-MW-storages, high temperature batteries such as sodium-sulfur batteries may be worth looking into for the future development. Instead of using two-day data, multiple-year data will be applied for the simulation.
In conclusion, we believe that deep reinforcement learning is the new potential trend in the field of energy conversion and management due to the following features: (1) the ability to learn from experience, (2) the ability to solve complex optimal control problems without prior environment knowledge, (3) the requirement of a simple mathematical model, and (4) the ability to handle problems for continuous state and action spaces.

Author Contributions

Conceptualization, B.C.P., M.-T.L. and Y.-C.L.; methodology, M.-T.L. and Y.-C.L.; software, B.C.P.; validation, B.C.P. and Y.-C.L.; formal analysis, B.C.P.; investigation, B.C.P.; resources, Y.-C.L.; data curation, B.C.P.; writing—original draft preparation, B.C.P.; writing—review and editing, B.C.P., M.-T.L. and Y.-C.L.; visualization, B.C.P. and Y.-C.L.; supervision, Y.-C.L.; project administration, Y.-C.L.; funding acquisition, Y.-C.L. All authors have read and agreed to the published version of the manuscript.

Funding

This research was funded by the Ministry of Science and Technology (MOST) under grant number MOST 111-2221-E-006-110- and MOST 111-2622-E-006-012-.

Institutional Review Board Statement

Not applicable.

Informed Consent Statement

Not applicable.

Data Availability Statement

Not applicable.

Conflicts of Interest

The authors declare no conflict of interest.

References

  1. The Renewable Energy Support Programme for ASEAN (RESP) Team. ASEAN Renewable Energy Policies; ASEAN Centre for Energy (ACE): Jakarta, Indonesia, 2016. [Google Scholar]
  2. Krishan, O.; Suhag, S. Techno-economic analysis of a hybrid renewable energy system for an energy poor rural community. J. Energy Storage 2019, 23, 305–319. [Google Scholar] [CrossRef]
  3. Lin, C.E.; Phan, B.C. Optimal Hybrid Energy Solution for Island Micro-Grid. In Proceedings of the 2016 IEEE International Conferences on Big Data and Cloud Computing (BDCloud), Social Computing and Networking (SocialCom), Sustainable Computing and Communications (SustainCom) (BDCloud-SocialCom-SustainCom), Atlanta, GA, USA, 8–10 October 2016. [Google Scholar]
  4. Vivas, F.J.; De Las Heras, A.; Segura, F.; Andújar Márquez, J.M. A review of energy management strategies for renewable hybrid energy systems with hydrogen backup. Renew. Sustain. Energy Rev. 2018, 82, 126–155. [Google Scholar] [CrossRef]
  5. Indragandhi, V.; Subramaniyaswamy, V.; Logesh, R. Resources, configurations, and soft computing techniques for power management and control of PV/wind hybrid system. Renew. Sustain. Energy Rev. 2017, 69, 129–143. [Google Scholar]
  6. Heymann, B.; Bonnans, J.F.; Martinon, P.; Silva, F.J.; Lanas, F.; Jiménez-Estévez, G. Continuous optimal control approaches to microgrid energy management. Energy Syst. 2018, 9, 59–77. [Google Scholar] [CrossRef]
  7. Merabet, A.; Ahmed, K.T.; Ibrahim, H.; Beguenane, R.; Ghias, A.M.Y.M. Energy Management and Control System for Laboratory Scale Microgrid Based Wind-PV-Battery. IEEE Trans. Sustain. Energy 2017, 8, 145–154. [Google Scholar] [CrossRef]
  8. Chen, Z.; Luo, A.; Wang, H.; Chen, Y.; Li, M.; Huang, Y. Adaptive sliding-mode voltage control for inverter operating in islanded mode in microgrid. Int. J. Electr. Power Energy Syst. 2015, 66, 133–143. [Google Scholar] [CrossRef]
  9. Wang, F.-C.; Kuo, P.-C.; Chen, H.-J. Control design and power management of a stationary PEMFC hybrid power system. Int. J. Hydrogen Energy 2013, 38, 5845–5856. [Google Scholar] [CrossRef]
  10. Jayalakshmi, N.S.; Gaonkar, D.; Nempu, P.B. Power Control of PV/Fuel Cell/Supercapacitor Hybrid System for Stand-Alone Applications. Int. J. Renew. Energy Res. 2016, 6, 672–679. [Google Scholar]
  11. Roumila, Z.; Rekioua, D.; Rekioua, T. Energy management based fuzzy logic controller of hybrid system wind/photovoltaic/diesel with storage battery. Int. J. Hydrogen Energy 2017, 42, 19525–19535. [Google Scholar] [CrossRef]
  12. Varghese, N.; Reji, P. Battery charge controller for hybrid stand alone system using adaptive neuro fuzzy inference system. In Proceedings of the 2016 International Conference on Energy Efficient Technologies for Sustainability (ICEETS), Nagercoil, India, 7–8 April 2016. [Google Scholar]
  13. Battery charge controller for hybrid stand alone system using adaptive neuro fuzzy inference system Microgrids energy management systems: A critical review on methods, solutions, and prospects. Appl. Energy 2018, 222, 1033–1055. [CrossRef]
  14. Luo, L.; Abdulkareem, S.S.; Rezvani, A.; Miveh, M.R.; Samad, S.; Aljojo, N.; Pazhoohesh, M. Optimal scheduling of a renewable based microgrid considering photovoltaic system and battery energy storage under uncertainty. J. Energy Storage 2020, 28, 101306. [Google Scholar] [CrossRef]
  15. Chong, L.W.; Wong, Y.W.; Rajkumar, R.K.; Rajkumar, R.K.; Isa, D. Hybrid energy storage systems and control strategies for stand-alone renewable energy power systems. Renew. Sustain. Energy Rev. 2016, 66, 174–189. [Google Scholar] [CrossRef]
  16. Zhou, X.; Ma, H.; Gu, J.; Chen, H.; Deng, W. Parameter adaptation-based ant colony optimization with dynamic hybrid mechanism. Eng. Appl. Artif. Intell. 2022, 114, 105139. [Google Scholar] [CrossRef]
  17. An, Z.; Wang, X.; Li, B.; Xiang, Z.; Zhang, B. Robust visual tracking for UAVs with dynamic feature weight selection. Appl. Intell. 2022. [Google Scholar] [CrossRef]
  18. Wu, D.; Wu, C. Research on the Time-Dependent Split Delivery Green Vehicle Routing Problem for Fresh Agricultural Products with Multiple Time Windows. Agriculture 2022, 12, 793. [Google Scholar] [CrossRef]
  19. Chen, H.; Miao, F.; Chen, Y.; Xiong, Y.; Chen, T. A Hyperspectral Image Classification Method Using Multifeature Vectors and Optimized KELM. IEEE J. Sel. Top. Appl. Earth Obs. Remote Sens. 2021, 14, 2781–2795. [Google Scholar] [CrossRef]
  20. Hua, H.; Qin, Y.; Hao, C.; Cao, J. Optimal energy management strategies for energy Internet via deep reinforcement learning approach. Appl. Energy 2019, 239, 598–609. [Google Scholar] [CrossRef]
  21. Cao, D.; Hu, W.; Zhao, J.; Zhang, G.; Zhang, B.; Liu, Z.; Chen, Z.; Blaabjerg, F. Reinforcement learning and its applications in modern power and energy systems: A review. J. Mod. Power Syst. Clean Energy 2020, 8, 1029–1042. [Google Scholar] [CrossRef]
  22. Hsu, R.C.; Liu, C.-T.; Chen, W.-Y.; Hsieh, H.-I.; Wang, H.-L. A Reinforcement Learning-Based Maximum Power Point Tracking Method for Photovoltaic Array. Int. J. Photoenergy 2015, 2015, 496401. [Google Scholar] [CrossRef]
  23. Mnih, V.; Kavukcuoglu, K.; Silver, D.; Graves, A.; Antonoglou, I.; Wierstra, D.; Riedmiller, M. Playing atari with deep reinforcement learning. arXiv 2013, arXiv:1312.5602 . [Google Scholar] [CrossRef]
  24. Mocanu, E.; Mocanu, D.C.; Nguyen, P.H.; Liotta, A.; Webber, M.E.; Gibescu, M.; Slootweg, J.G. On-line building energy optimization using deep reinforcement learning. IEEE Trans. Smart Grid 2018, 10, 3698–3708. [Google Scholar] [CrossRef]
  25. Hu, Y.; Li, W.; Xu, K.; Zahid, T.; Qin, F.; Li, C. Energy Management Strategy for a Hybrid Electric Vehicle Based on Deep Reinforcement Learning. Appl. Sci. 2018, 8, 187. [Google Scholar] [CrossRef] [Green Version]
  26. Huang, T.; Liu, D. A self-learning scheme for residential energy system control and management. Neural Comput. Appl. 2013, 22, 259–269. [Google Scholar] [CrossRef]
  27. Leo, R.; Milton, R.S.; Sibi, S. Reinforcement learning for optimal energy management of a solar microgrid. In Proceedings of the 2014 IEEE Global Humanitarian Technology Conference-South Asia Satellite (GHTC-SAS), Trivandrum, India, 26–27 September 2014. [Google Scholar]
  28. Raju, L.; Sankar, S.; Milton, R. Distributed Optimization of Solar Micro-grid Using Multi Agent Reinforcement Learning. Procedia Comput. Sci. 2015, 46, 231–239. [Google Scholar] [CrossRef]
  29. Kim, H.-M.; Lim, Y.; Kinoshita, T. An Intelligent Multiagent System for Autonomous Microgrid Operation. Energies 2012, 5, 3347–3362. [Google Scholar] [CrossRef]
  30. Eddy, Y.S.F.; Gooi, H.B.; Chen, S.X. Multi-Agent System for Distributed Management of Microgrids. IEEE Trans. Power Syst. 2015, 30, 24–34. [Google Scholar] [CrossRef]
  31. Kofinas, P.; Vouros, G.; Dounis, A.I. Energy Management in Solar Microgrid via Reinforcement Learning. In Proceedings of the 9th Hellenic Conference on Artificial Intelligence, Thessaloniki, Greece, 18–20 May 2016; ACM: Thessaloniki, Greece, 2016; pp. 1–7. [Google Scholar]
  32. Kofinas, P.; Vouros, G.; Dounis, A.I. Energy management in solar microgrid via reinforcement learning using fuzzy reward. Adv. Build. Energy Res. 2017, 30, 97–115. [Google Scholar] [CrossRef]
  33. Kofinas, P.; Dounis, A.; Vouros, G. Fuzzy Q-Learning for multi-agent decentralized energy management in microgrids. Appl. Energy 2018, 219, 53–67. [Google Scholar] [CrossRef]
  34. Phan, B.C.; Lai, Y.-C.; Lin, C.E. A Deep Reinforcement Learning-Based MPPT Control for PV Systems under Partial Shading Condition. Sensors 2020, 20, 3039. [Google Scholar] [CrossRef]
  35. Koohi-Fayegh, S.; Rosen, M.A. A review of energy storage types, applications and recent developments. J. Energy Storage 2020, 27, 101047. [Google Scholar] [CrossRef]
  36. Ahangari Hassas, M.; Pourhossein, K. Control and Management of Hybrid Renewable Energy Systems: Review and Comparison of Methods. J. Oper. Autom. Power Eng. 2017, 5, 131–138. [Google Scholar]
  37. Luo, X.; Wang, J.; Dooner, M.; Clarke, J. Overview of current development in electrical energy storage technologies and the application potential in power system operation. Appl. Energy 2015, 137, 511–536. [Google Scholar] [CrossRef]
  38. García, P.; Torreglosa, J.P.; Fernández, L.M.; Jurado, F. Optimal energy management system for stand-alone wind turbine/photovoltaic/hydrogen/battery hybrid system with supervisory control based on fuzzy logic. Int. J. Hydrogen Energy 2013, 38, 14146–14158. [Google Scholar] [CrossRef]
  39. Skarstein, Ø.; Uhlen, K. Design consideration with respect to long term diesel saving in wind/diesel plants. Wind. Eng. 1989, 13, 72–87. [Google Scholar]
  40. Ismail, M.; Moghavvemi, M.; Mahlia, T.M.I. Techno-economic analysis of an optimized photovoltaic and diesel generator hybrid power system for remote houses in a tropical climate. Energy Convers. Manag. 2013, 69, 163–173. [Google Scholar] [CrossRef]
  41. Kaabeche, A.; Ibtiouen, R. Techno-economic optimization of hybrid photovoltaic/wind/diesel/battery generation in a stand-alone power system. Sol. Energy 2014, 103, 171–182. [Google Scholar] [CrossRef]
  42. Fan, J.; Wang, Z.; Xie, Y.; Yang, Z. A Theoretical Analysis of Deep Q-Learning. arXiv 2019, arXiv:1901.00137. [Google Scholar] [CrossRef]
  43. Phan, B.C.; Lai, Y.-C. Control Strategy of a Hybrid Renewable Energy System Based on Reinforcement Learning Approach for an Isolated Microgrid. Appl. Sci. 2019, 9, 4001. [Google Scholar] [CrossRef] [Green Version]
Figure 1. The diagram of the proposed HRES.
Applsci 12 08721 g001
Figure 2. The proposed Deep-Q-Network-based EMS.
Applsci 12 08721 g002
Figure 3. A graph of DQN-based EMS.
Applsci 12 08721 g003
Figure 4. DQN algorithm.
Applsci 12 08721 g004
Figure 5. Flow chart of the EMS controller of our HRES based on the CD method (branch 1).
Applsci 12 08721 g005
Figure 6. Flow chart of the EMS controller of our HRES based on the CD method (branch 2).
Applsci 12 08721 g006
Figure 7. The proposed HRES (left) and the load demand at Basco station (right) presented in HOMER software.
Applsci 12 08721 g007
Figure 8. The structure of the critic network for the DQN-based EMS.
Applsci 12 08721 g008
Figure 9. The training process of the DQN-based EMS.
Applsci 12 08721 g009
Figure 10. Load demand, PV, and WT power in Scenario 1.
Applsci 12 08721 g010
Figure 11. Comparison between the DQN and CD methods in Scenario 1.
Applsci 12 08721 g011
Figure 12. Load demand, PV, and WT power in Scenario 2.
Applsci 12 08721 g012
Figure 13. Comparison between the DQN and CD methods in Scenario 2.
Applsci 12 08721 g013
Table 1. Parameters for the simulation of the DQN-based EMS.
Specifications Value
Memory capacity
Batch size64
Discount factor (γ)0.9
Exploration rate (ε)1
Decay of exploration rate0.001
Minimum exploration rate (εmin)0.01
Publisher’s Note: MDPI stays neutral with regard to jurisdictional claims in published maps and institutional affiliations.

