
Solving the Moment Amplification Factor of a Lateral Jet by the Unsteady Motion Experimental Method


Abstract
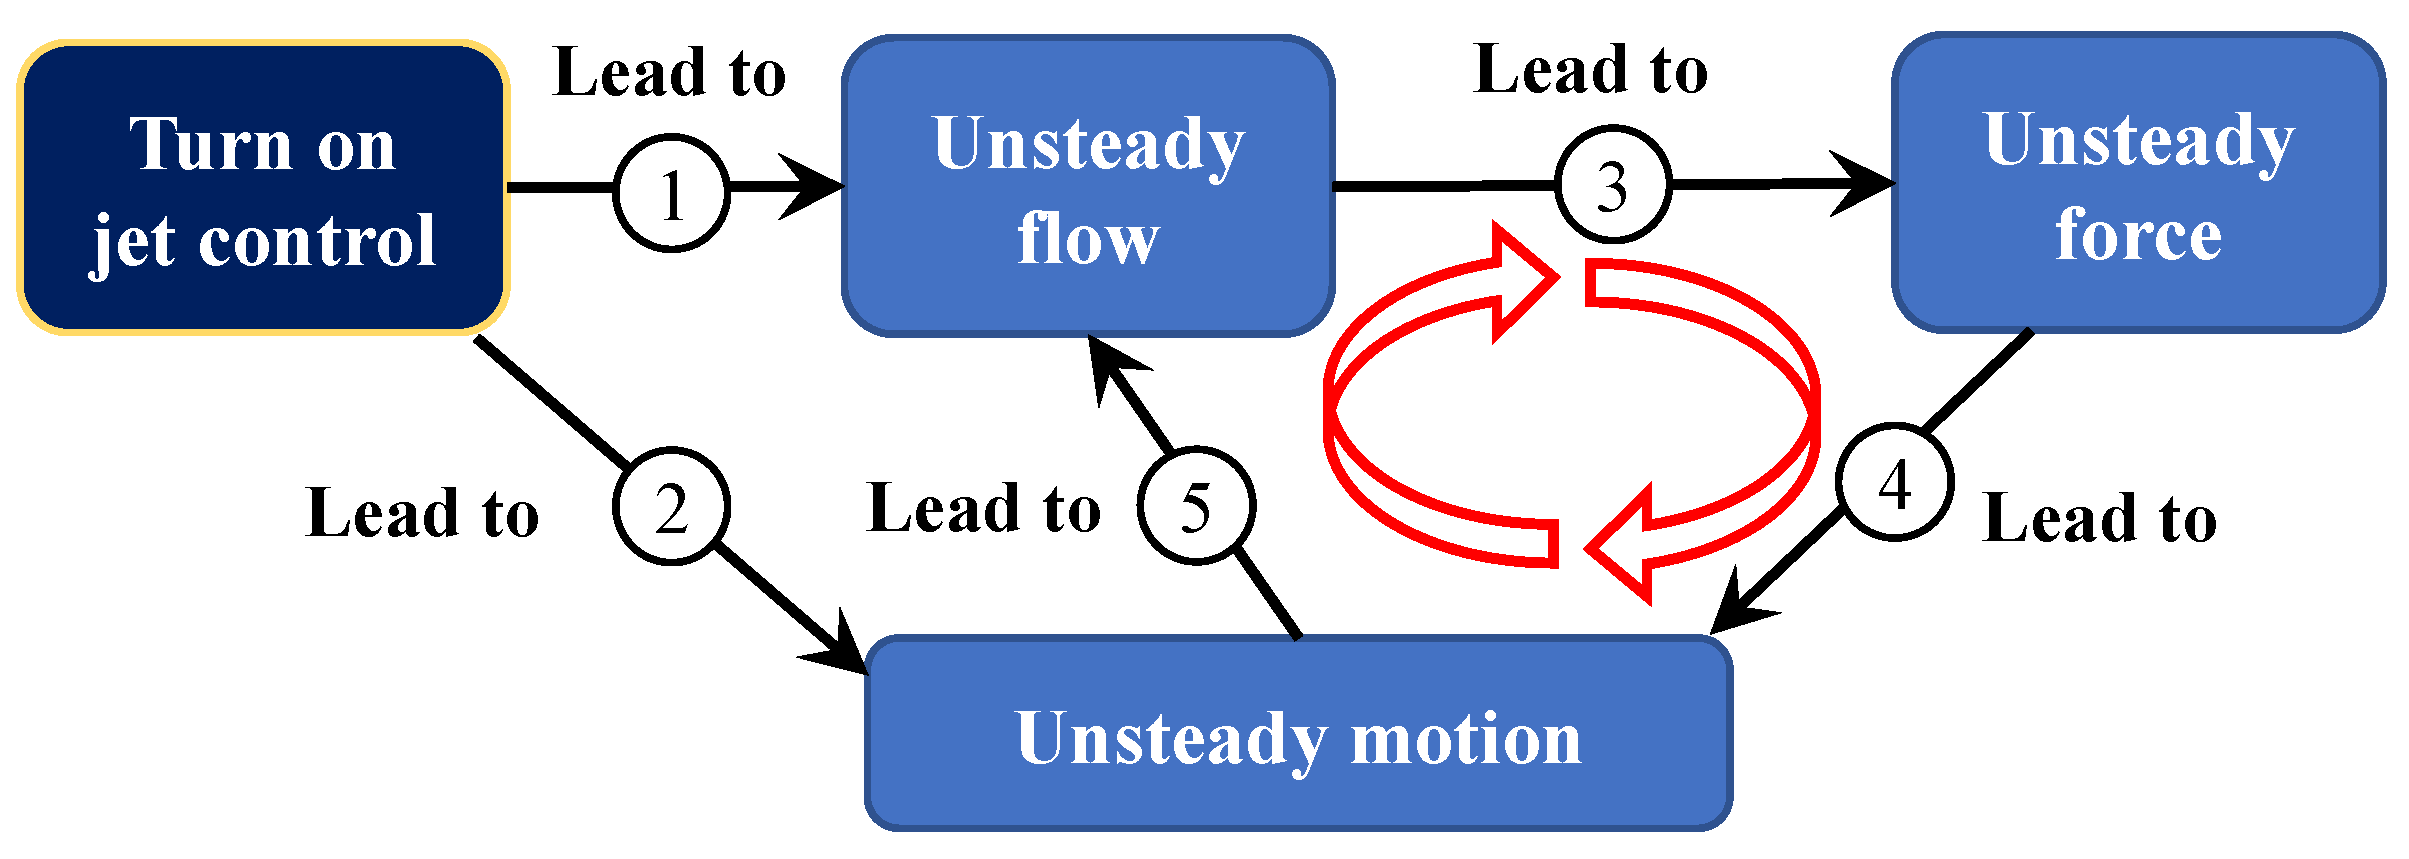
:1. Introduction
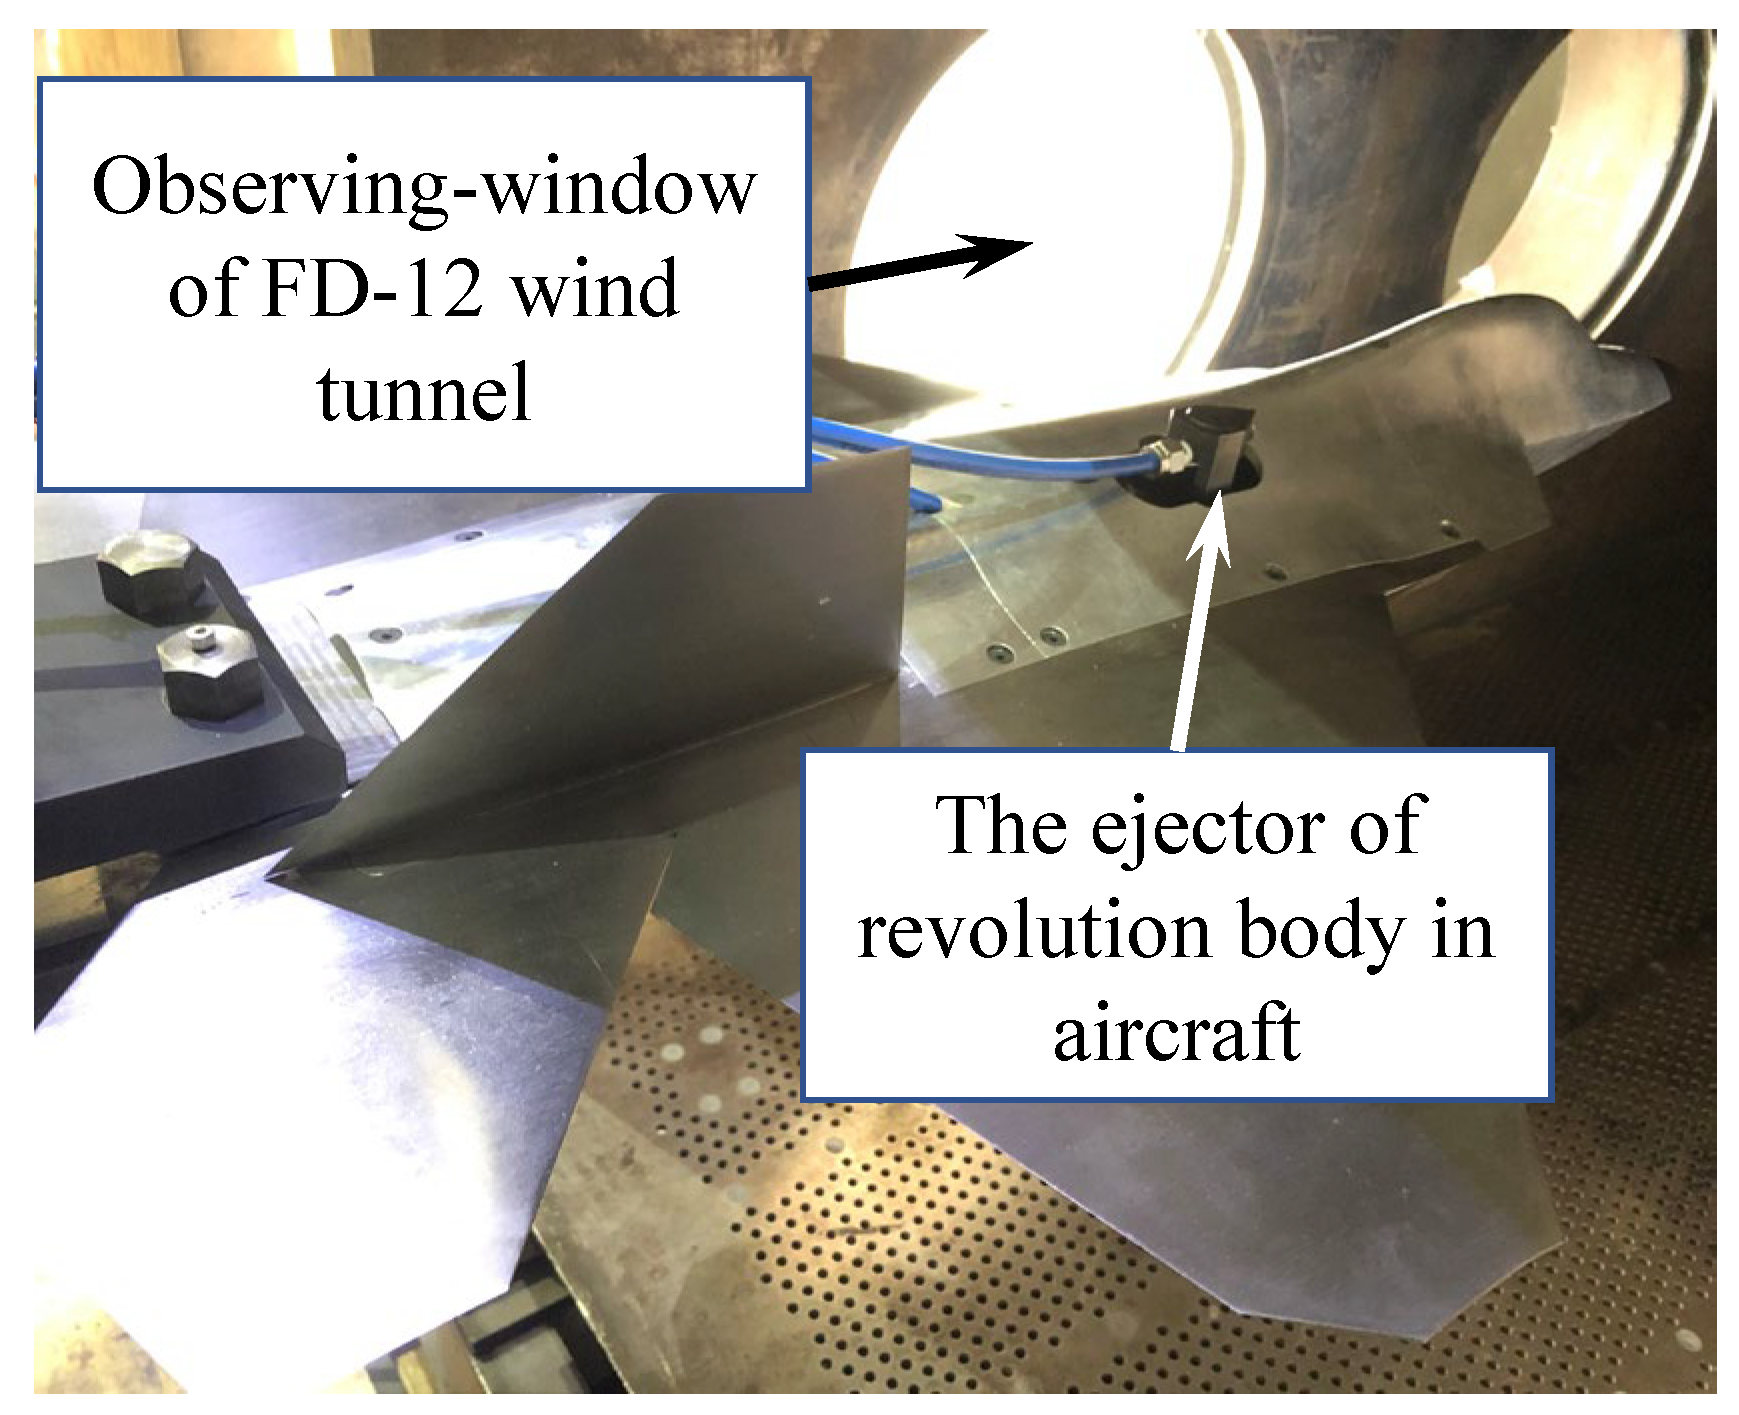
2. Test Model and FD-12 Wind Tunnel
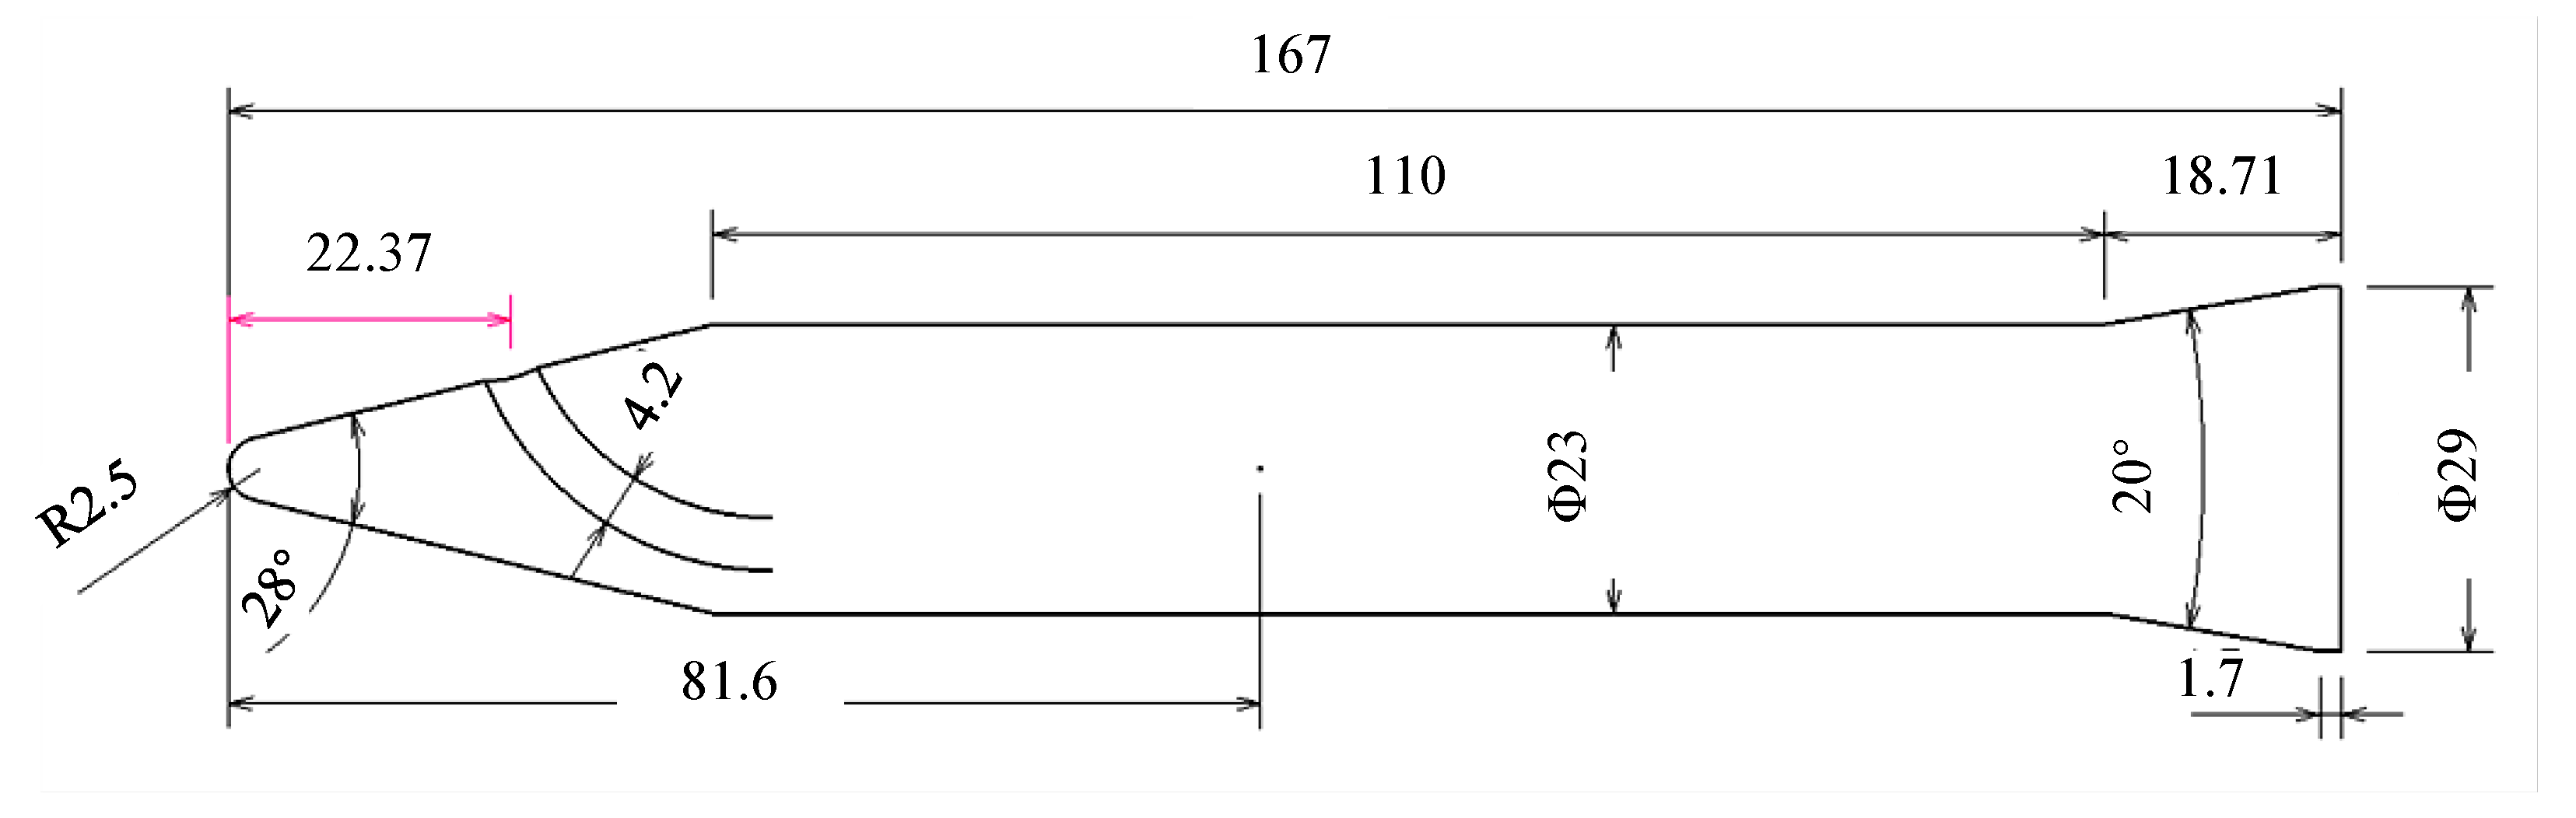
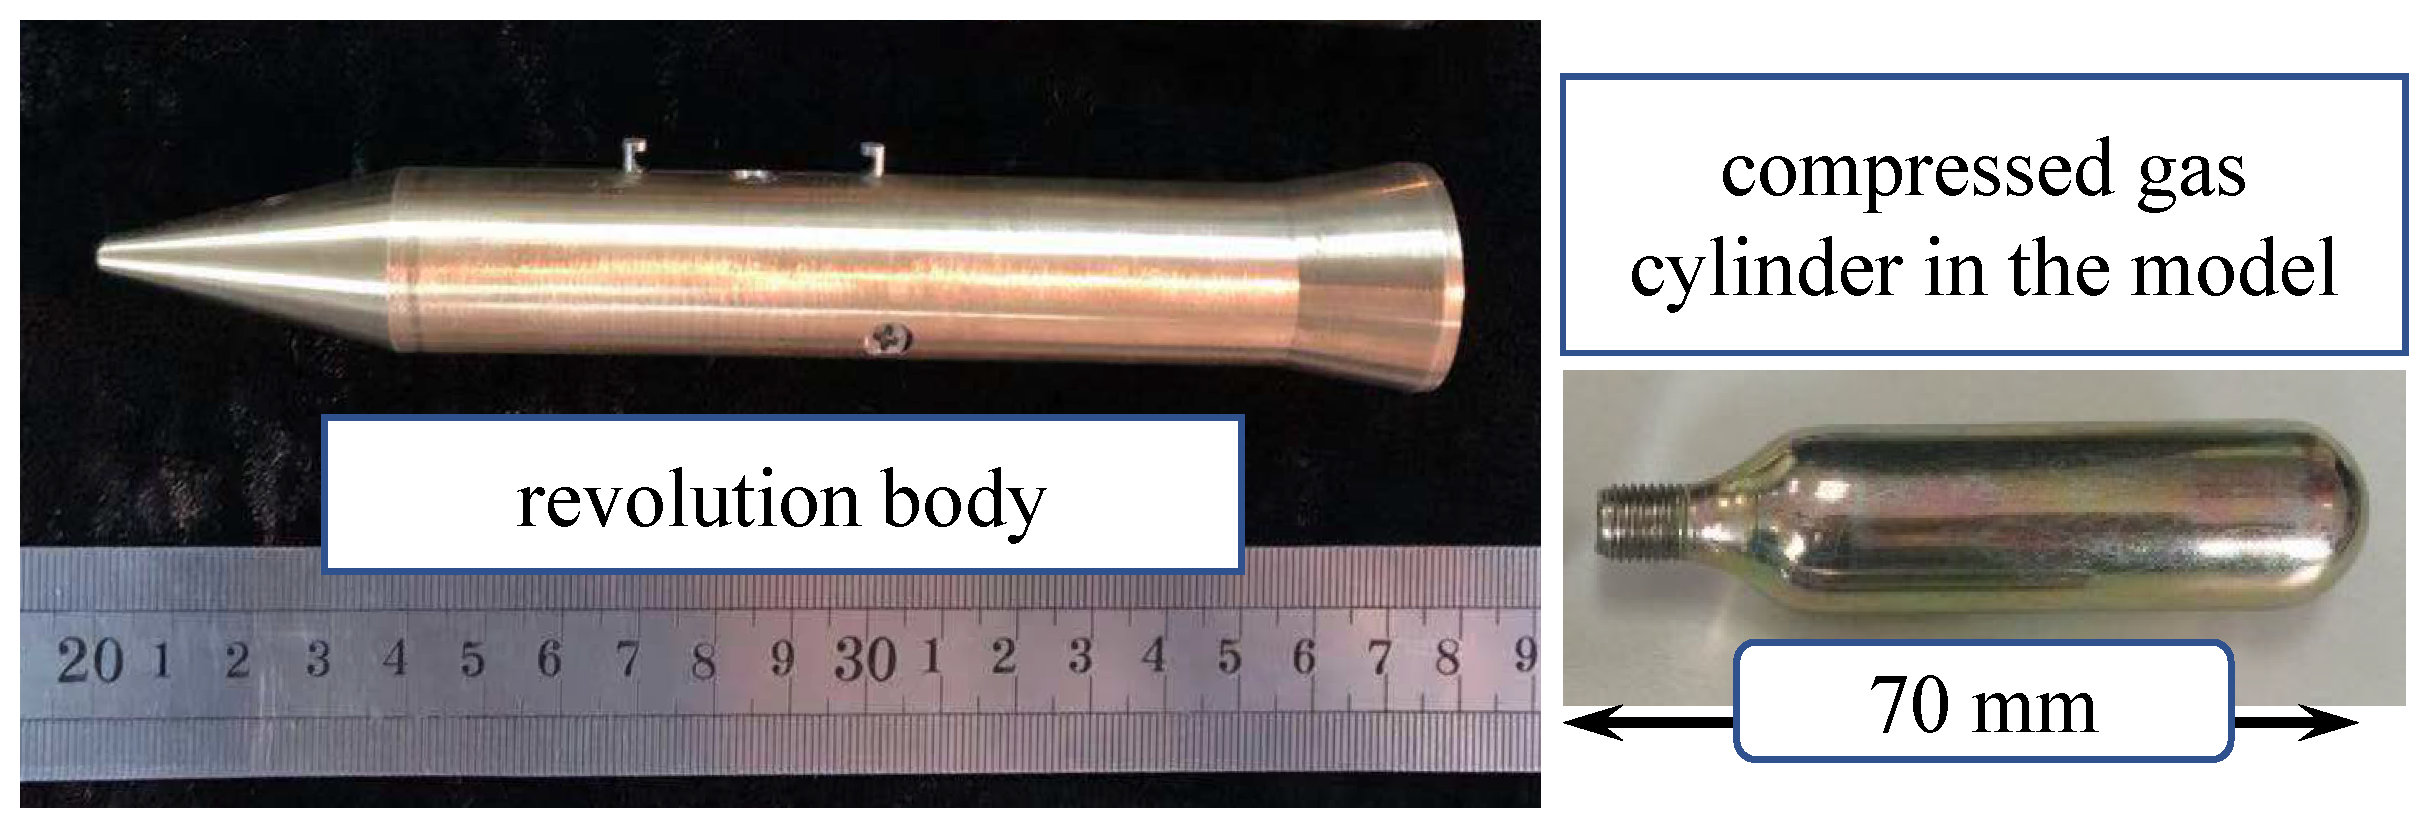
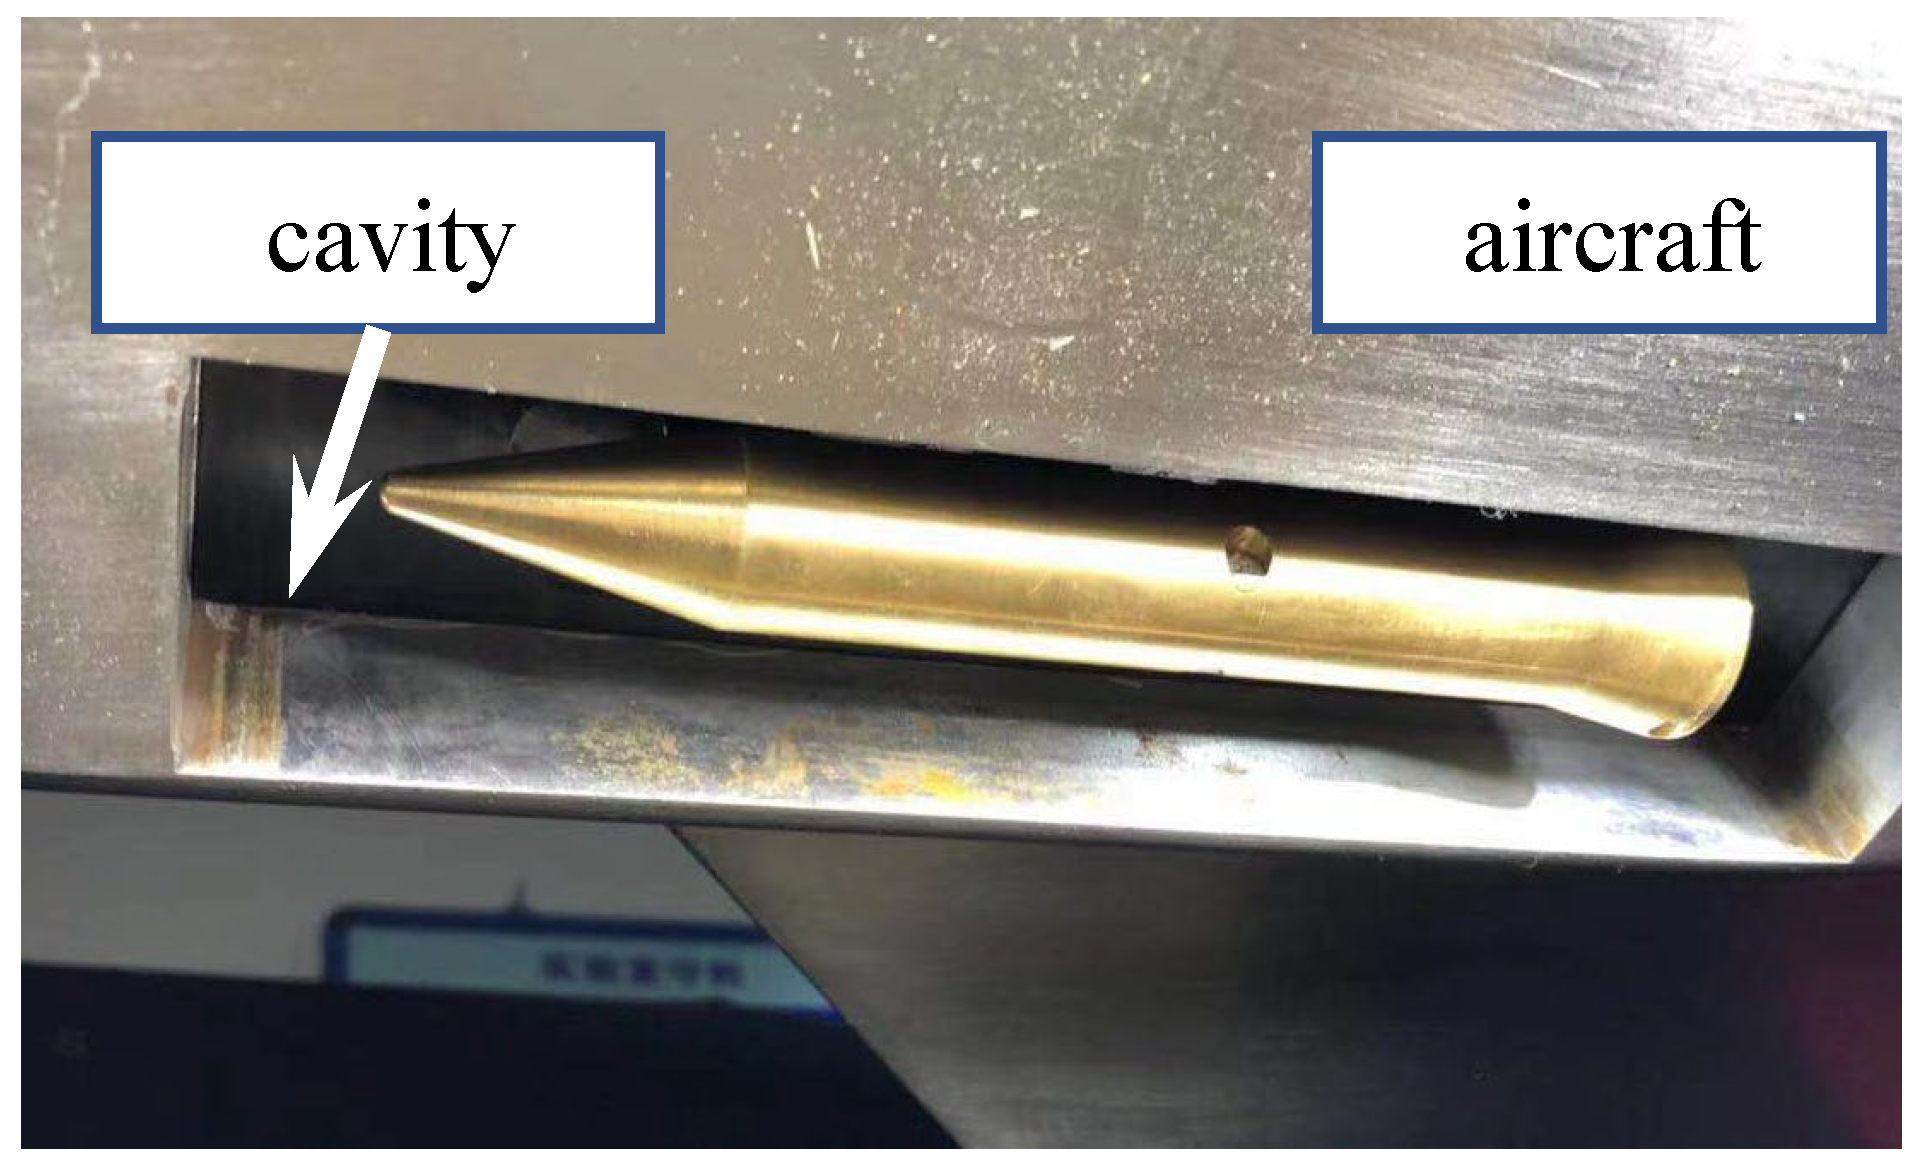
2.1. Test Model
2.2. Jet Characteristics
2.3. FD-12 Wind Tunnel
3. Tests and Results
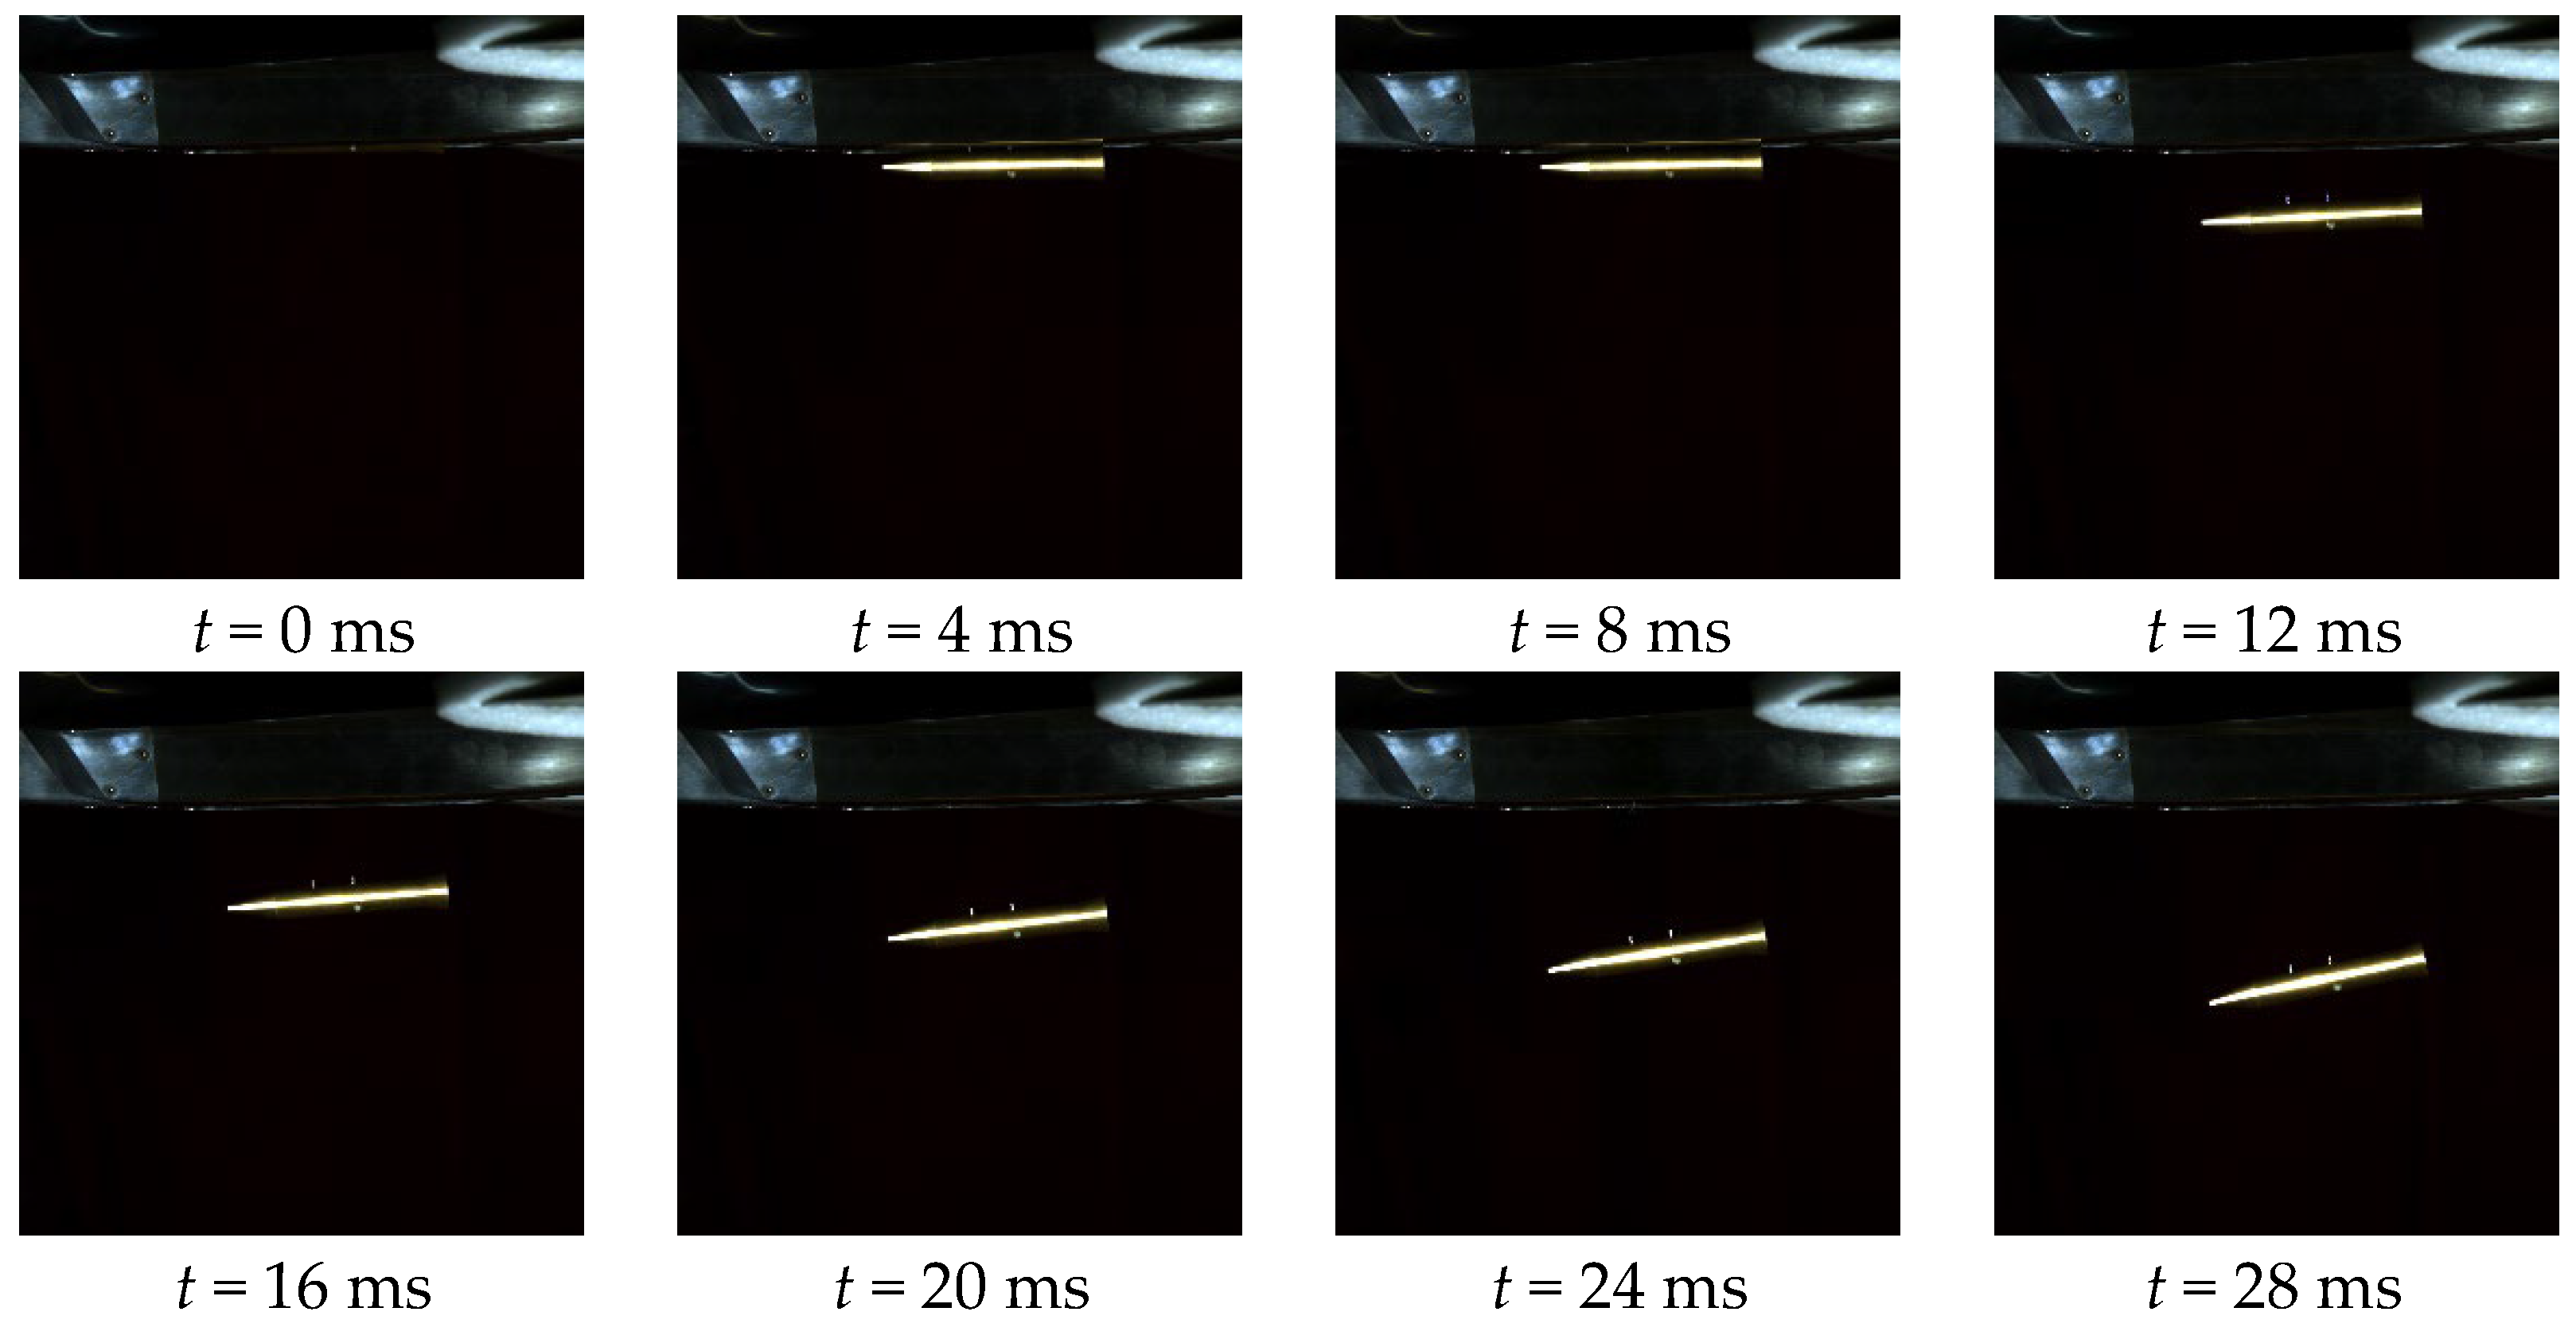
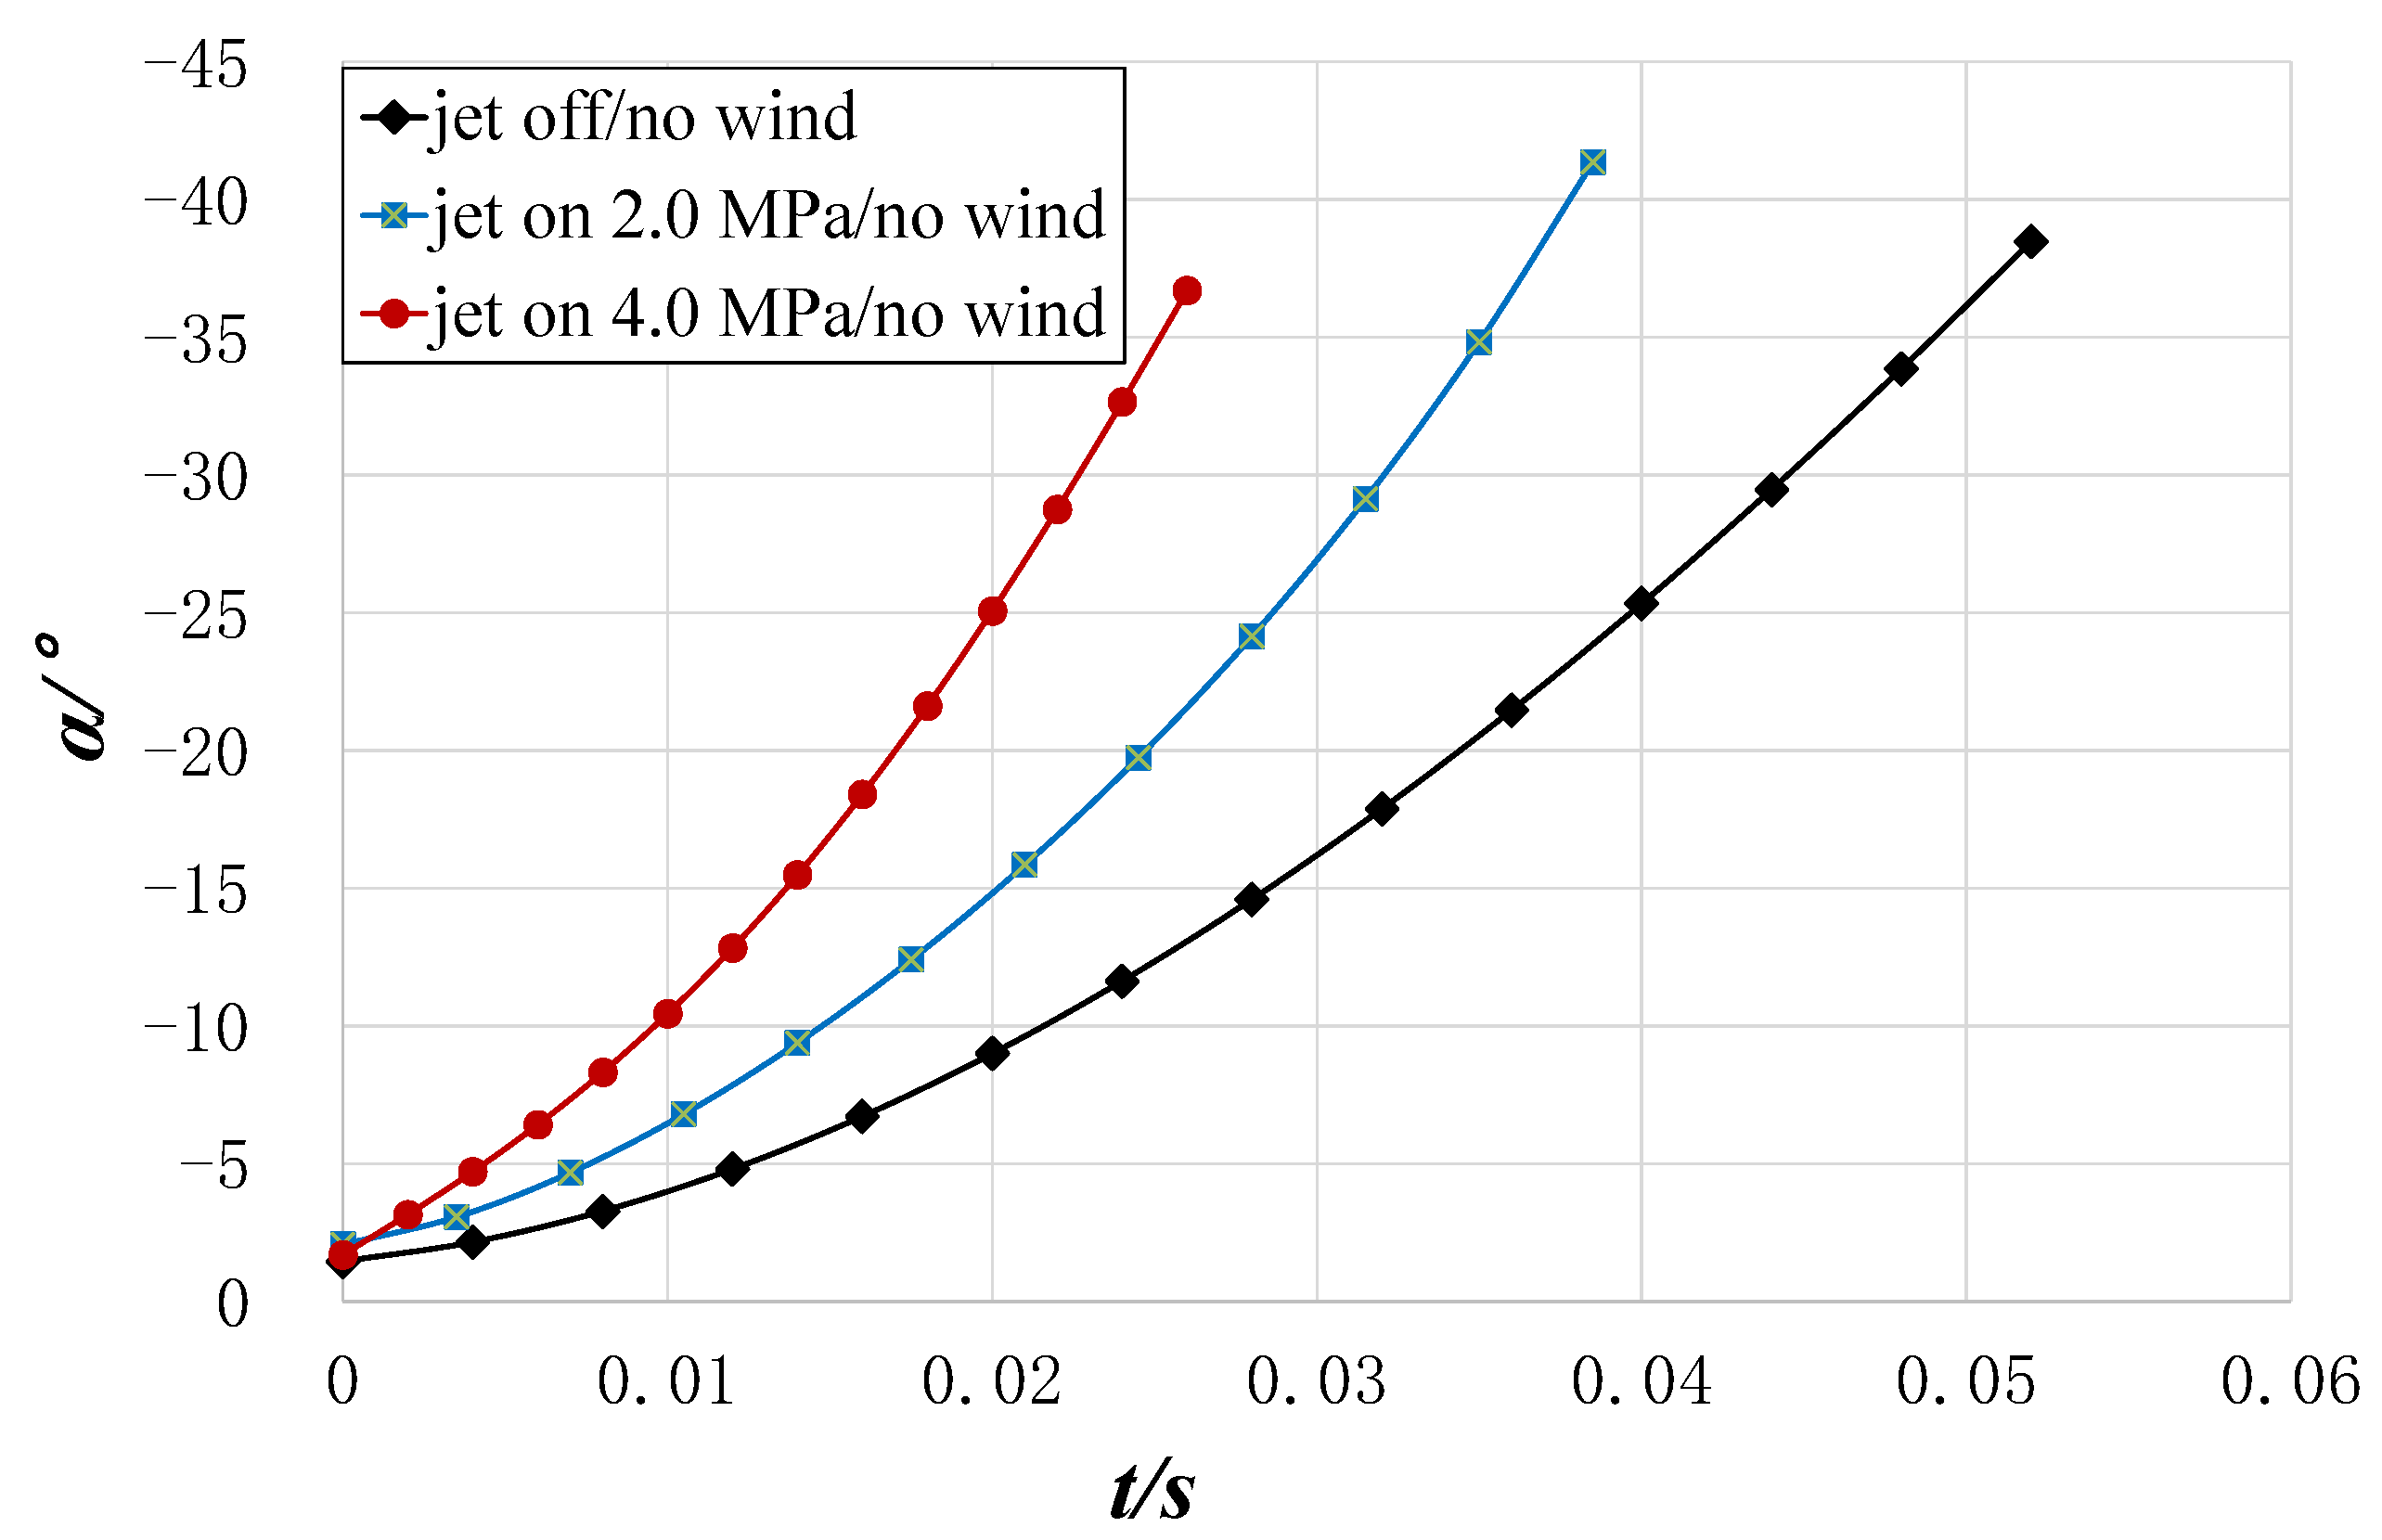
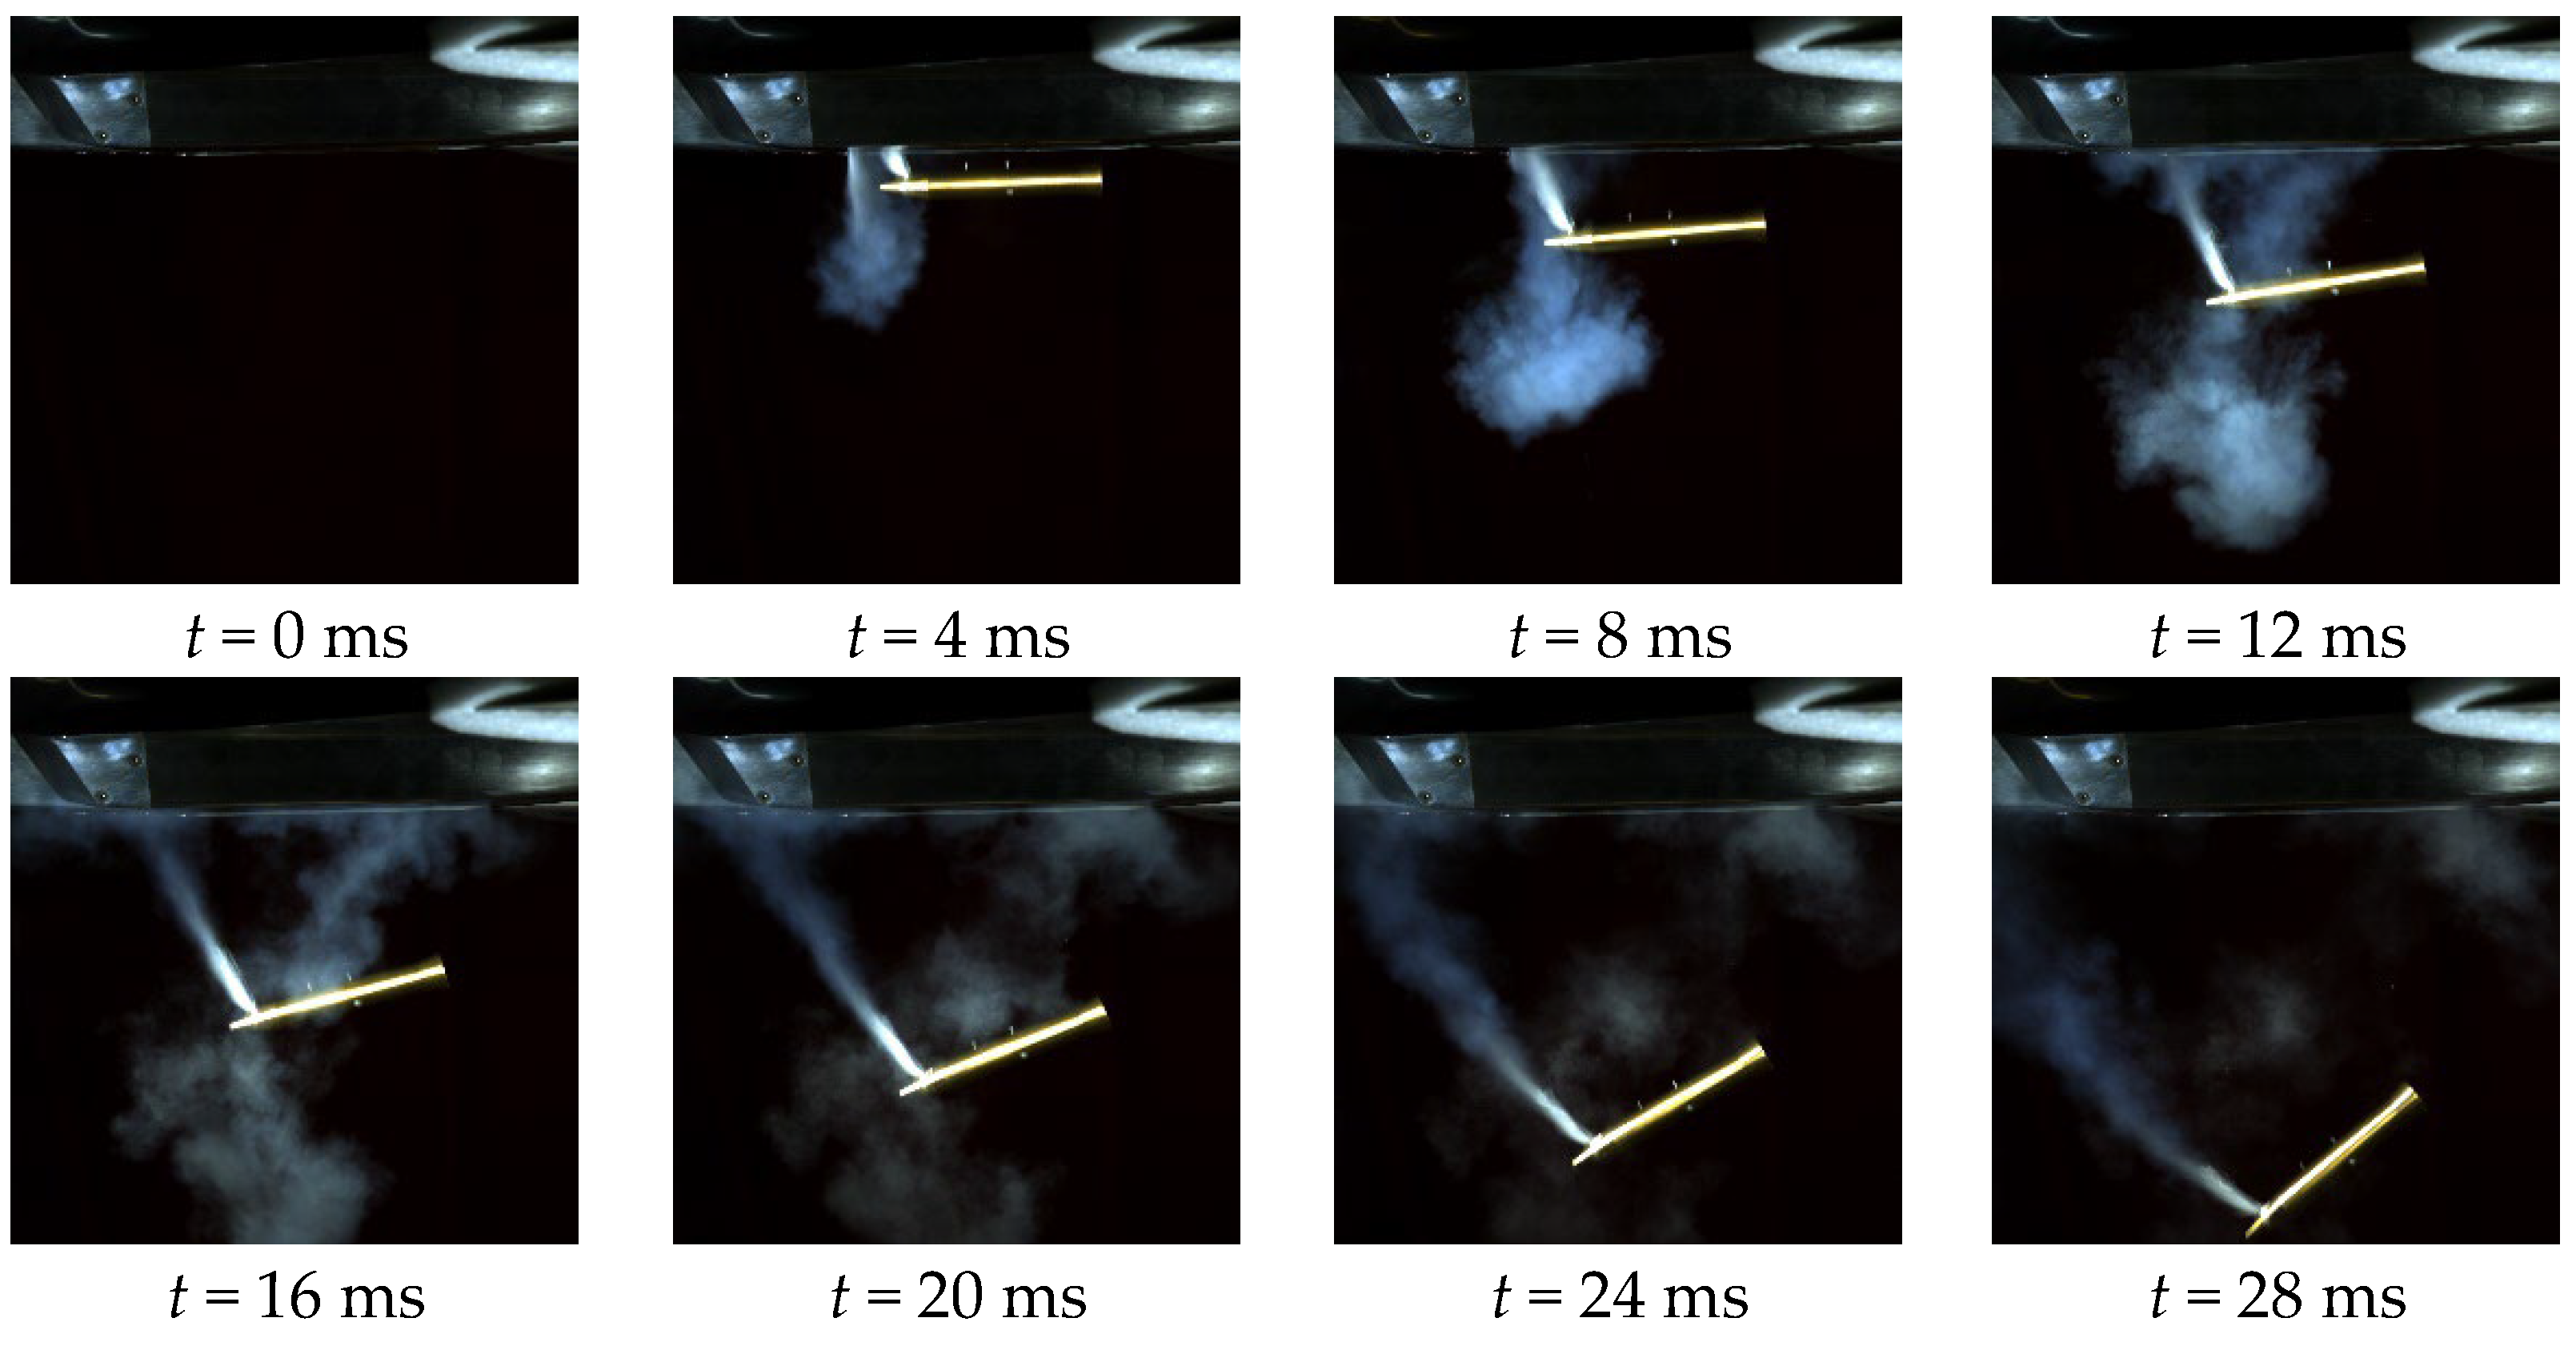
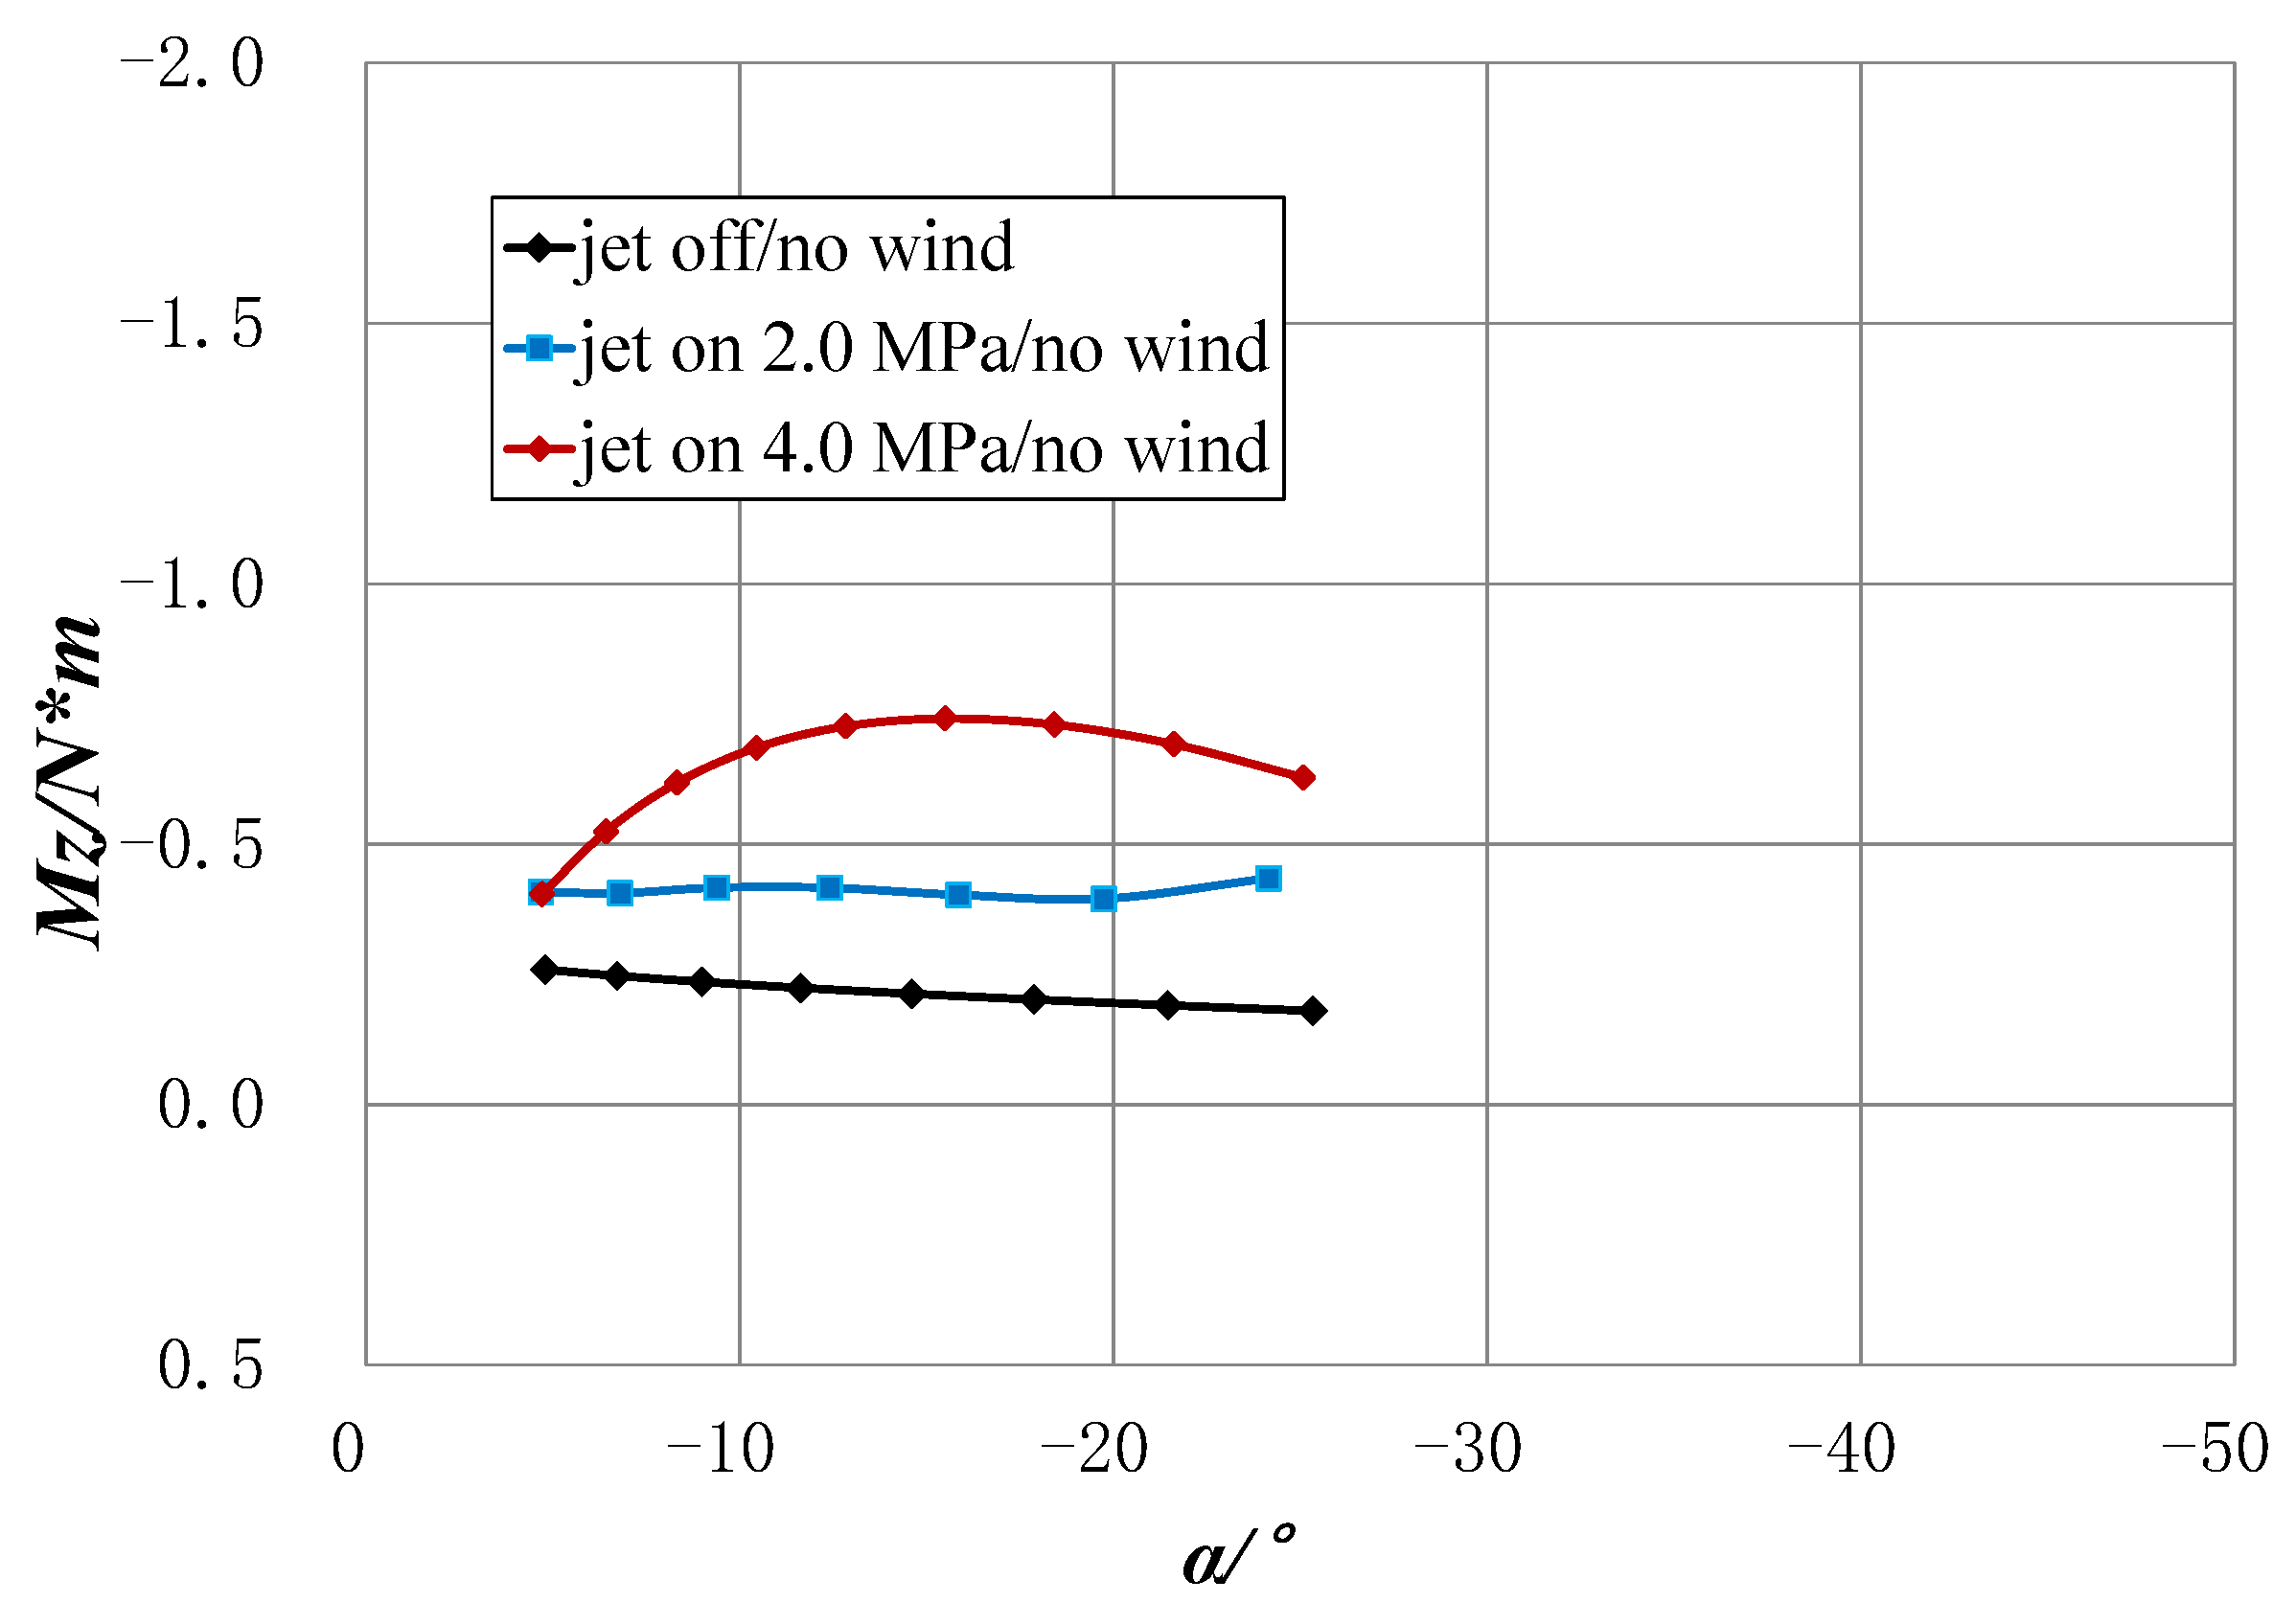
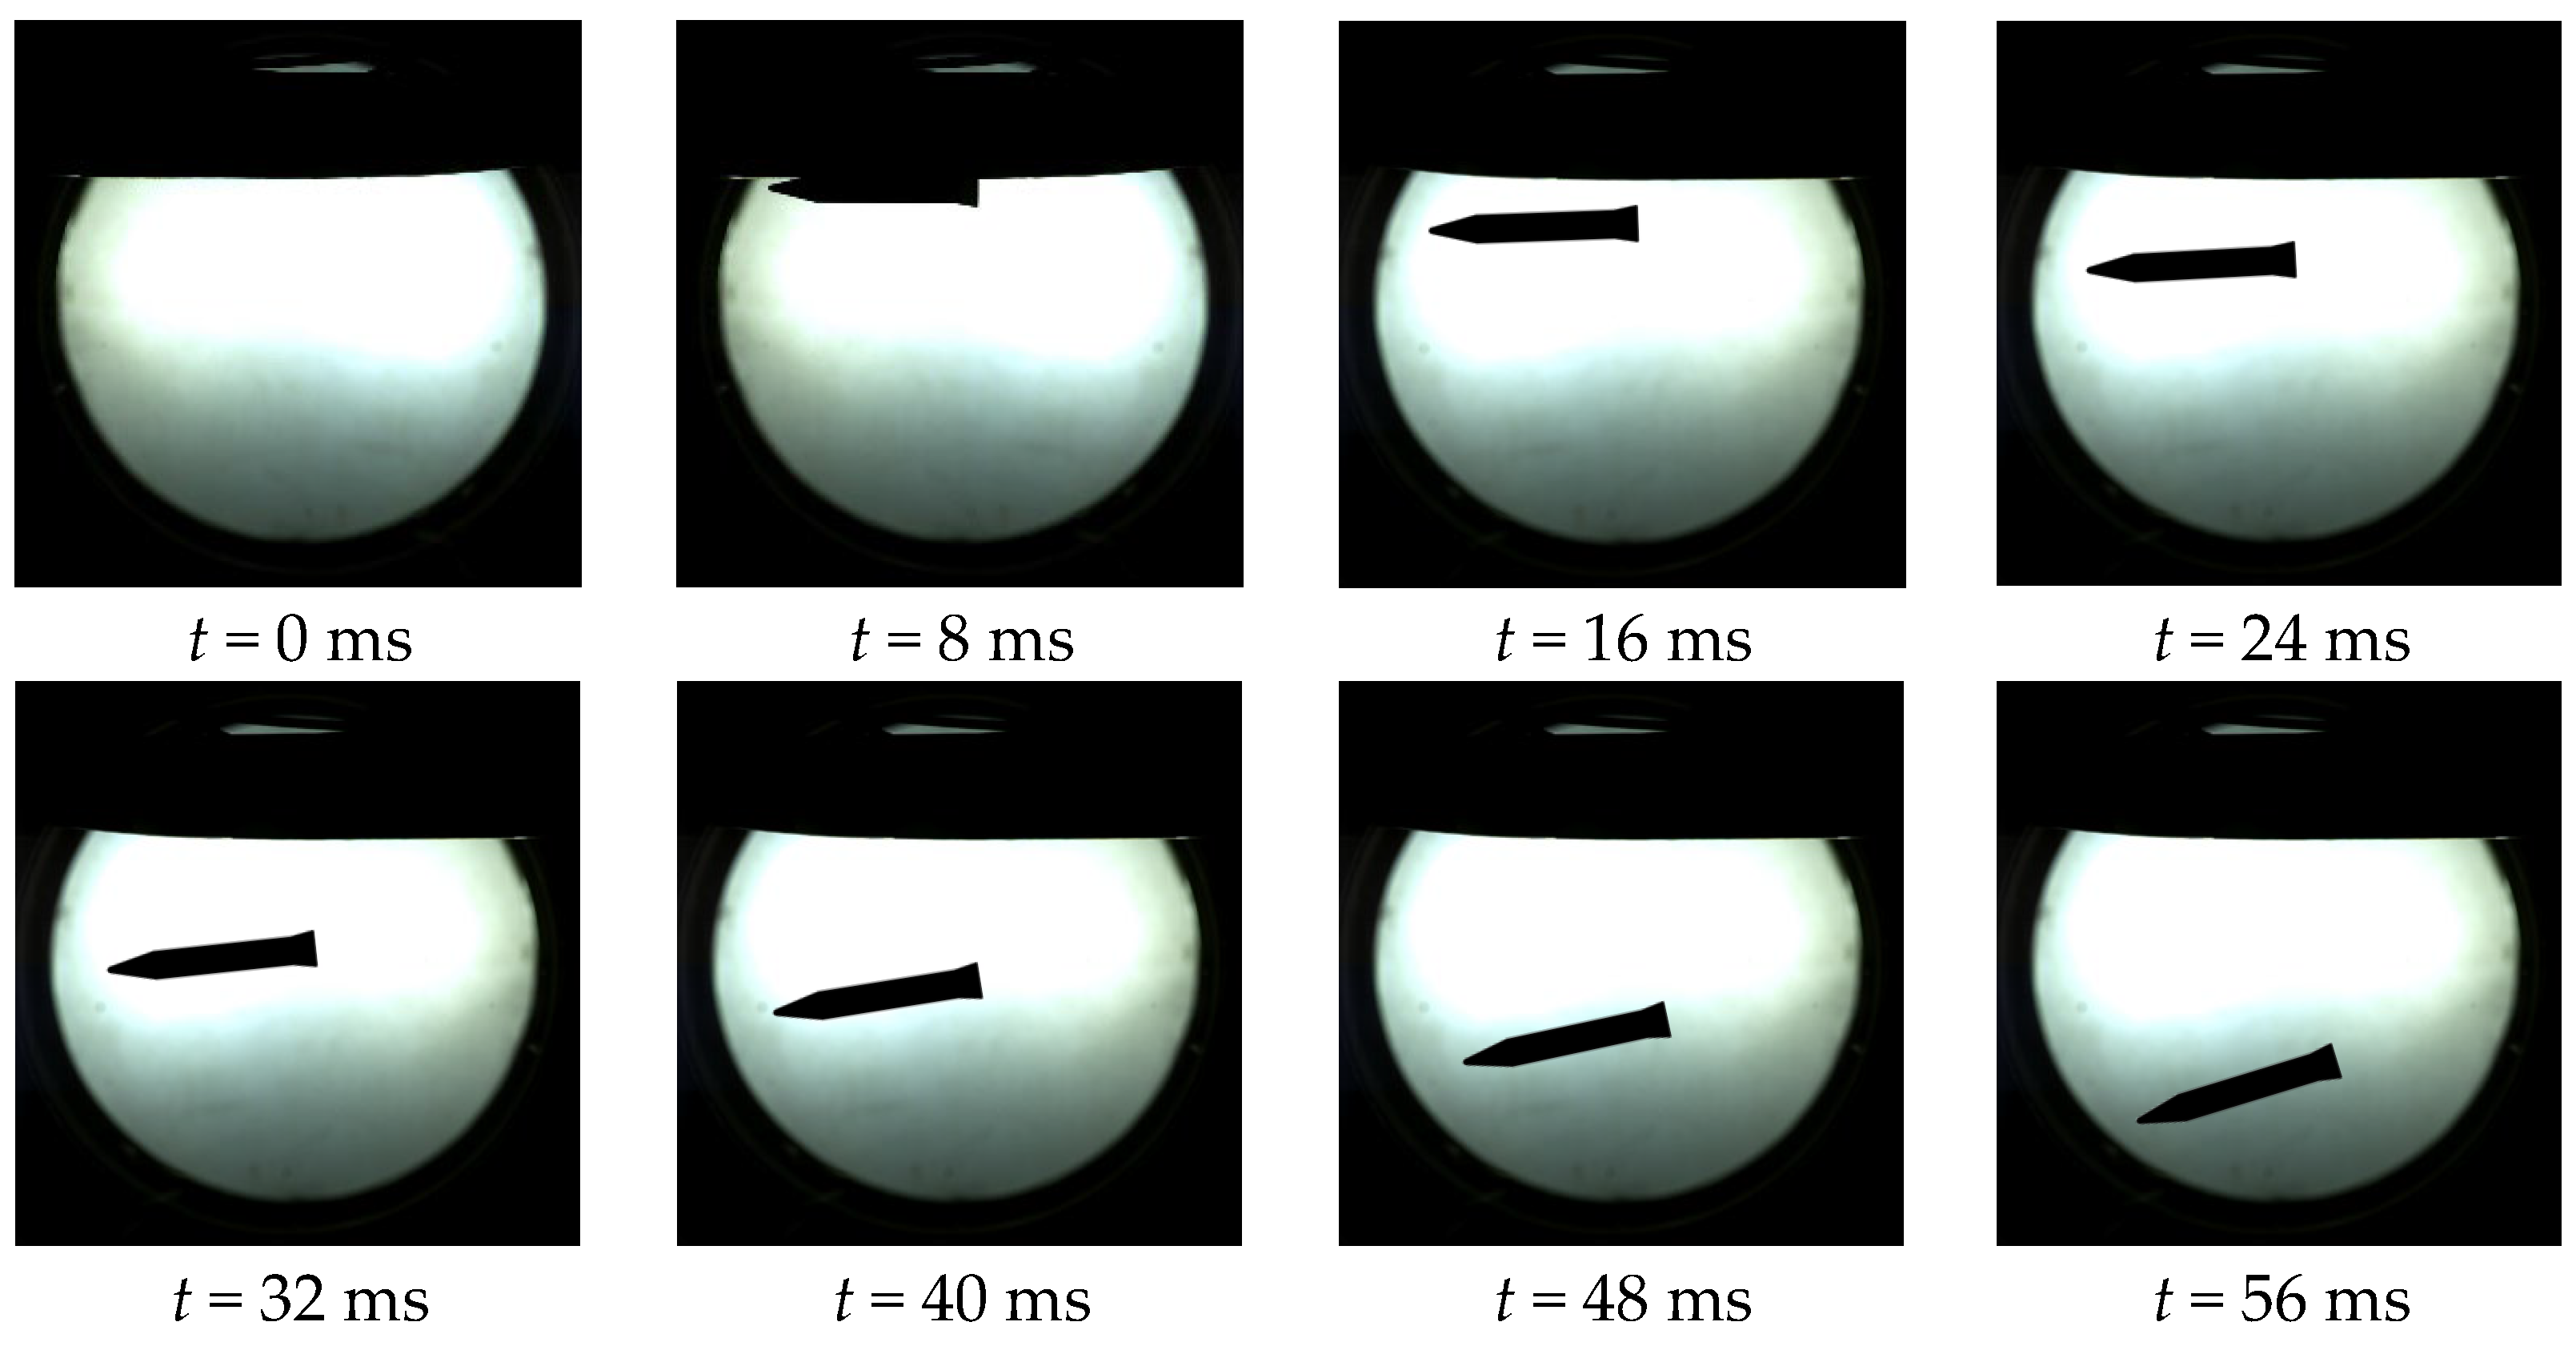
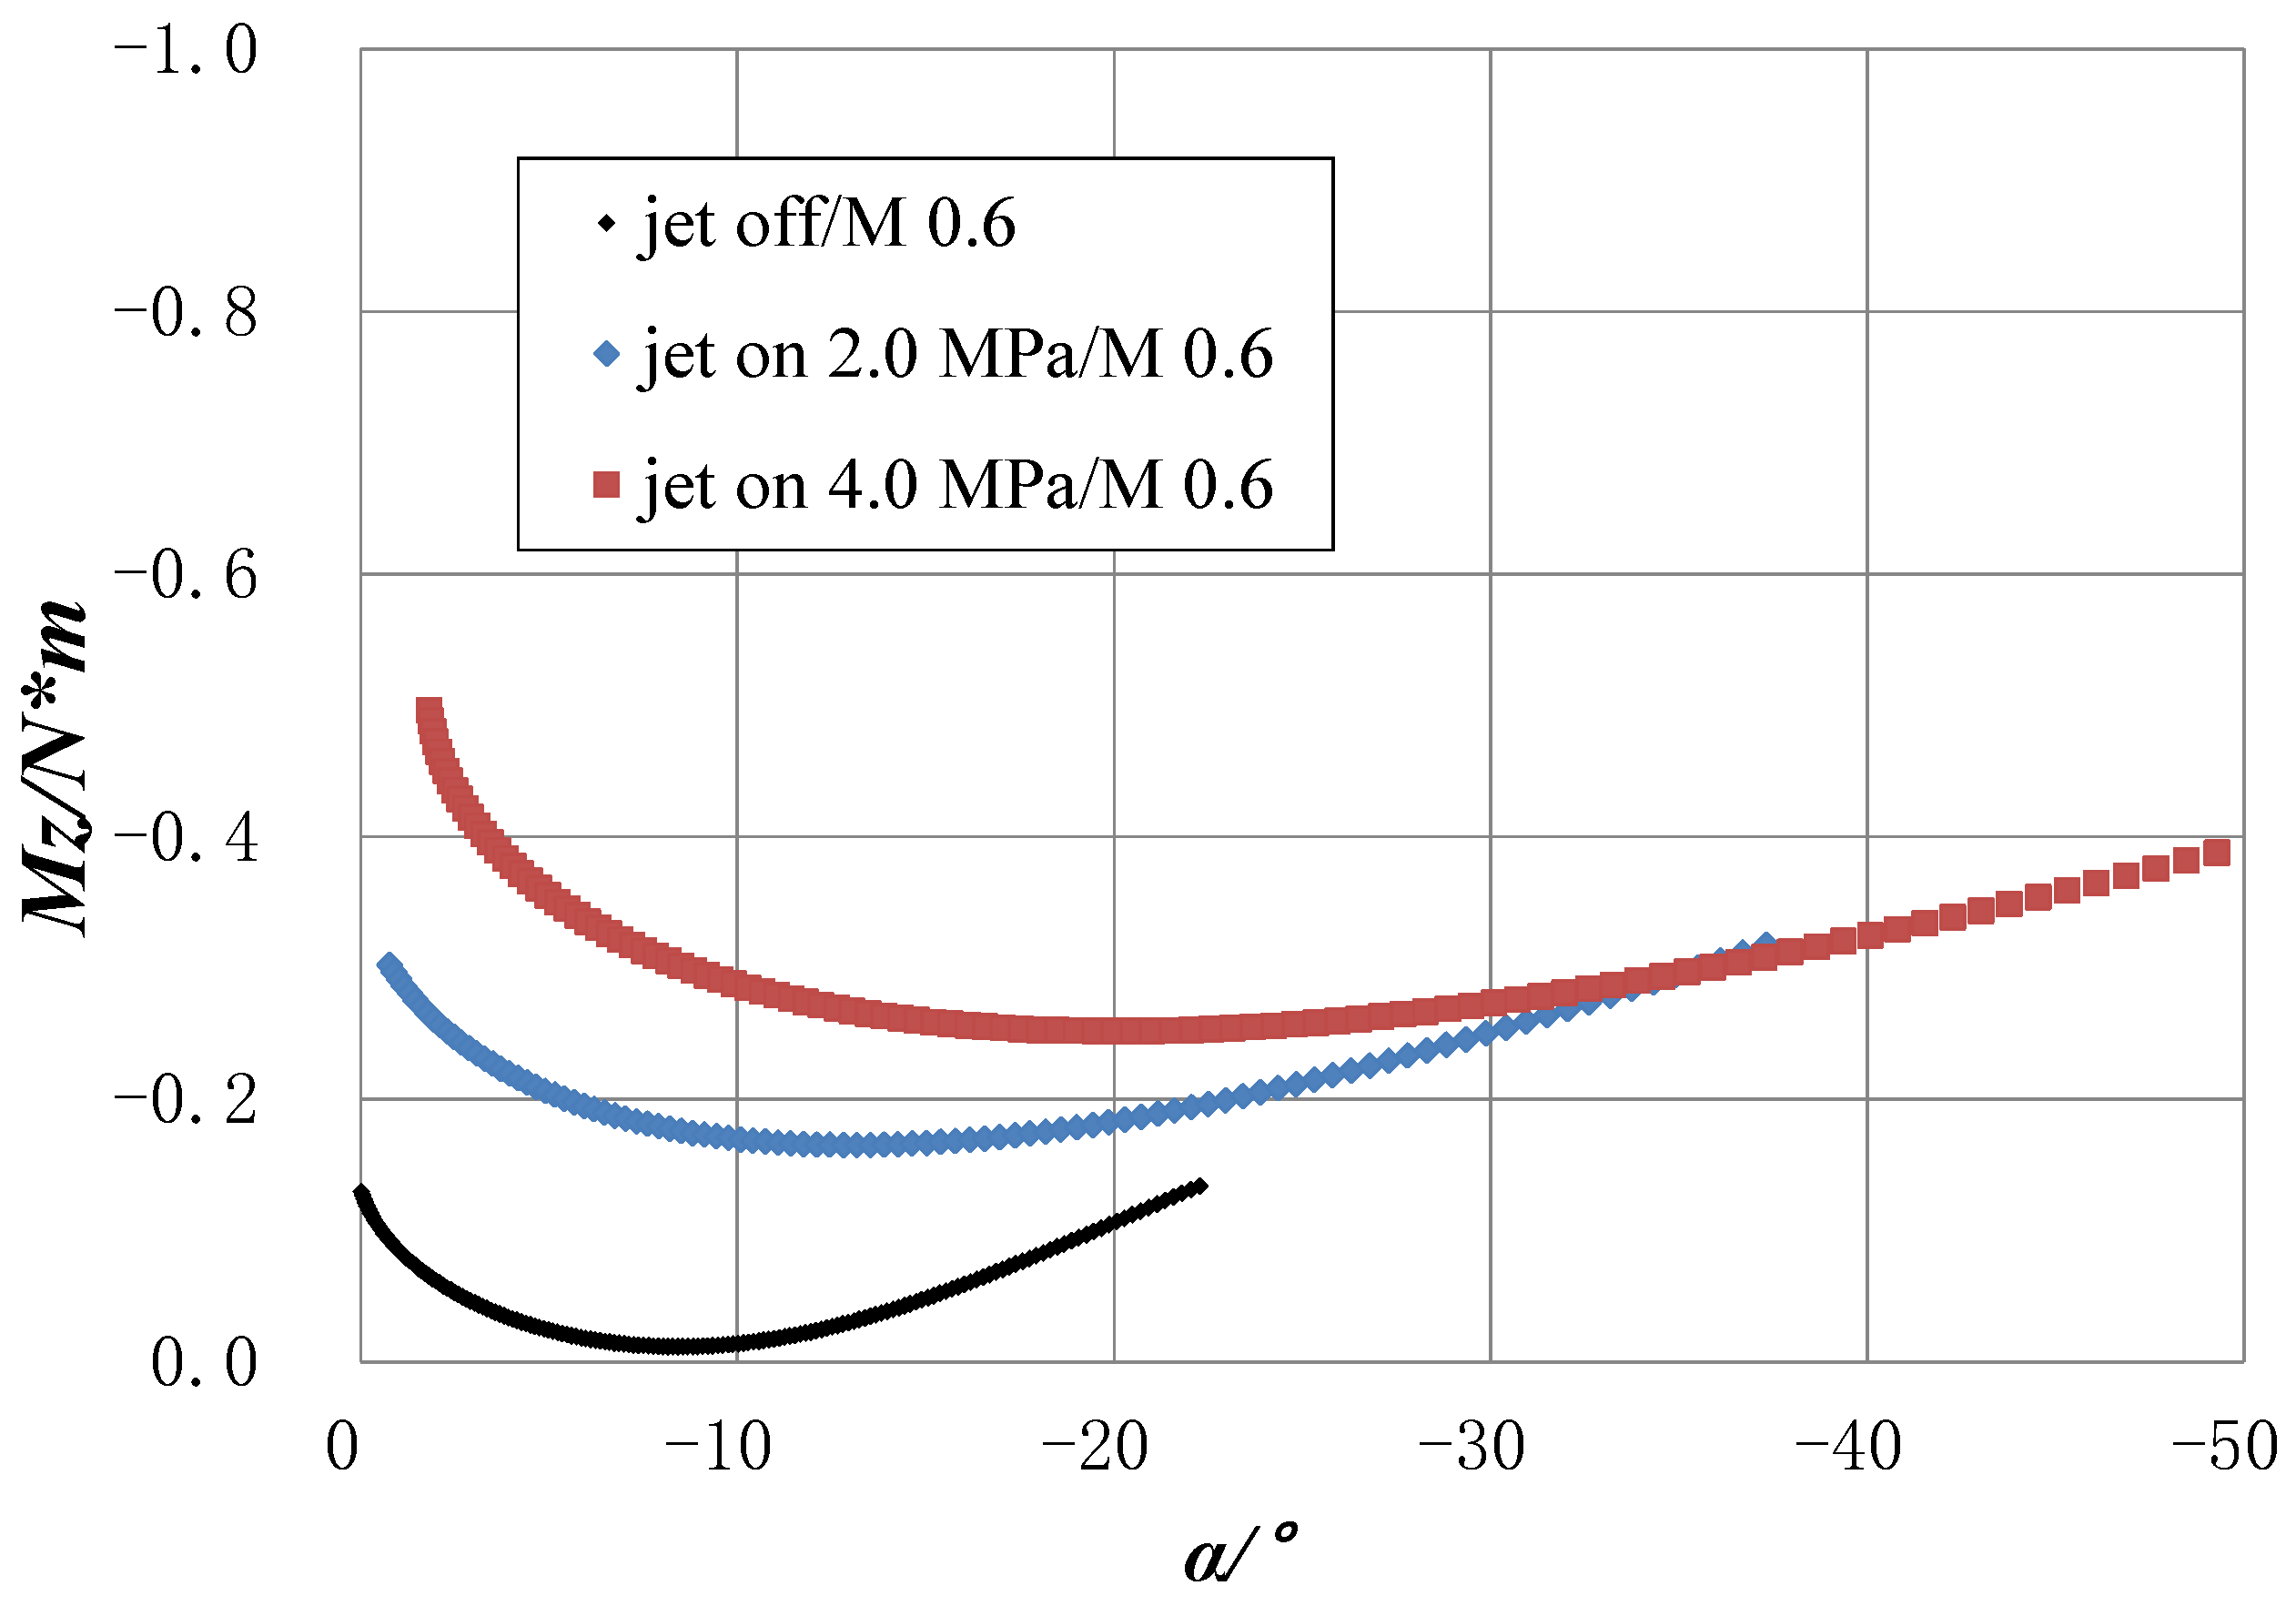
3.1. Tests without Wind Tunnel Airflow
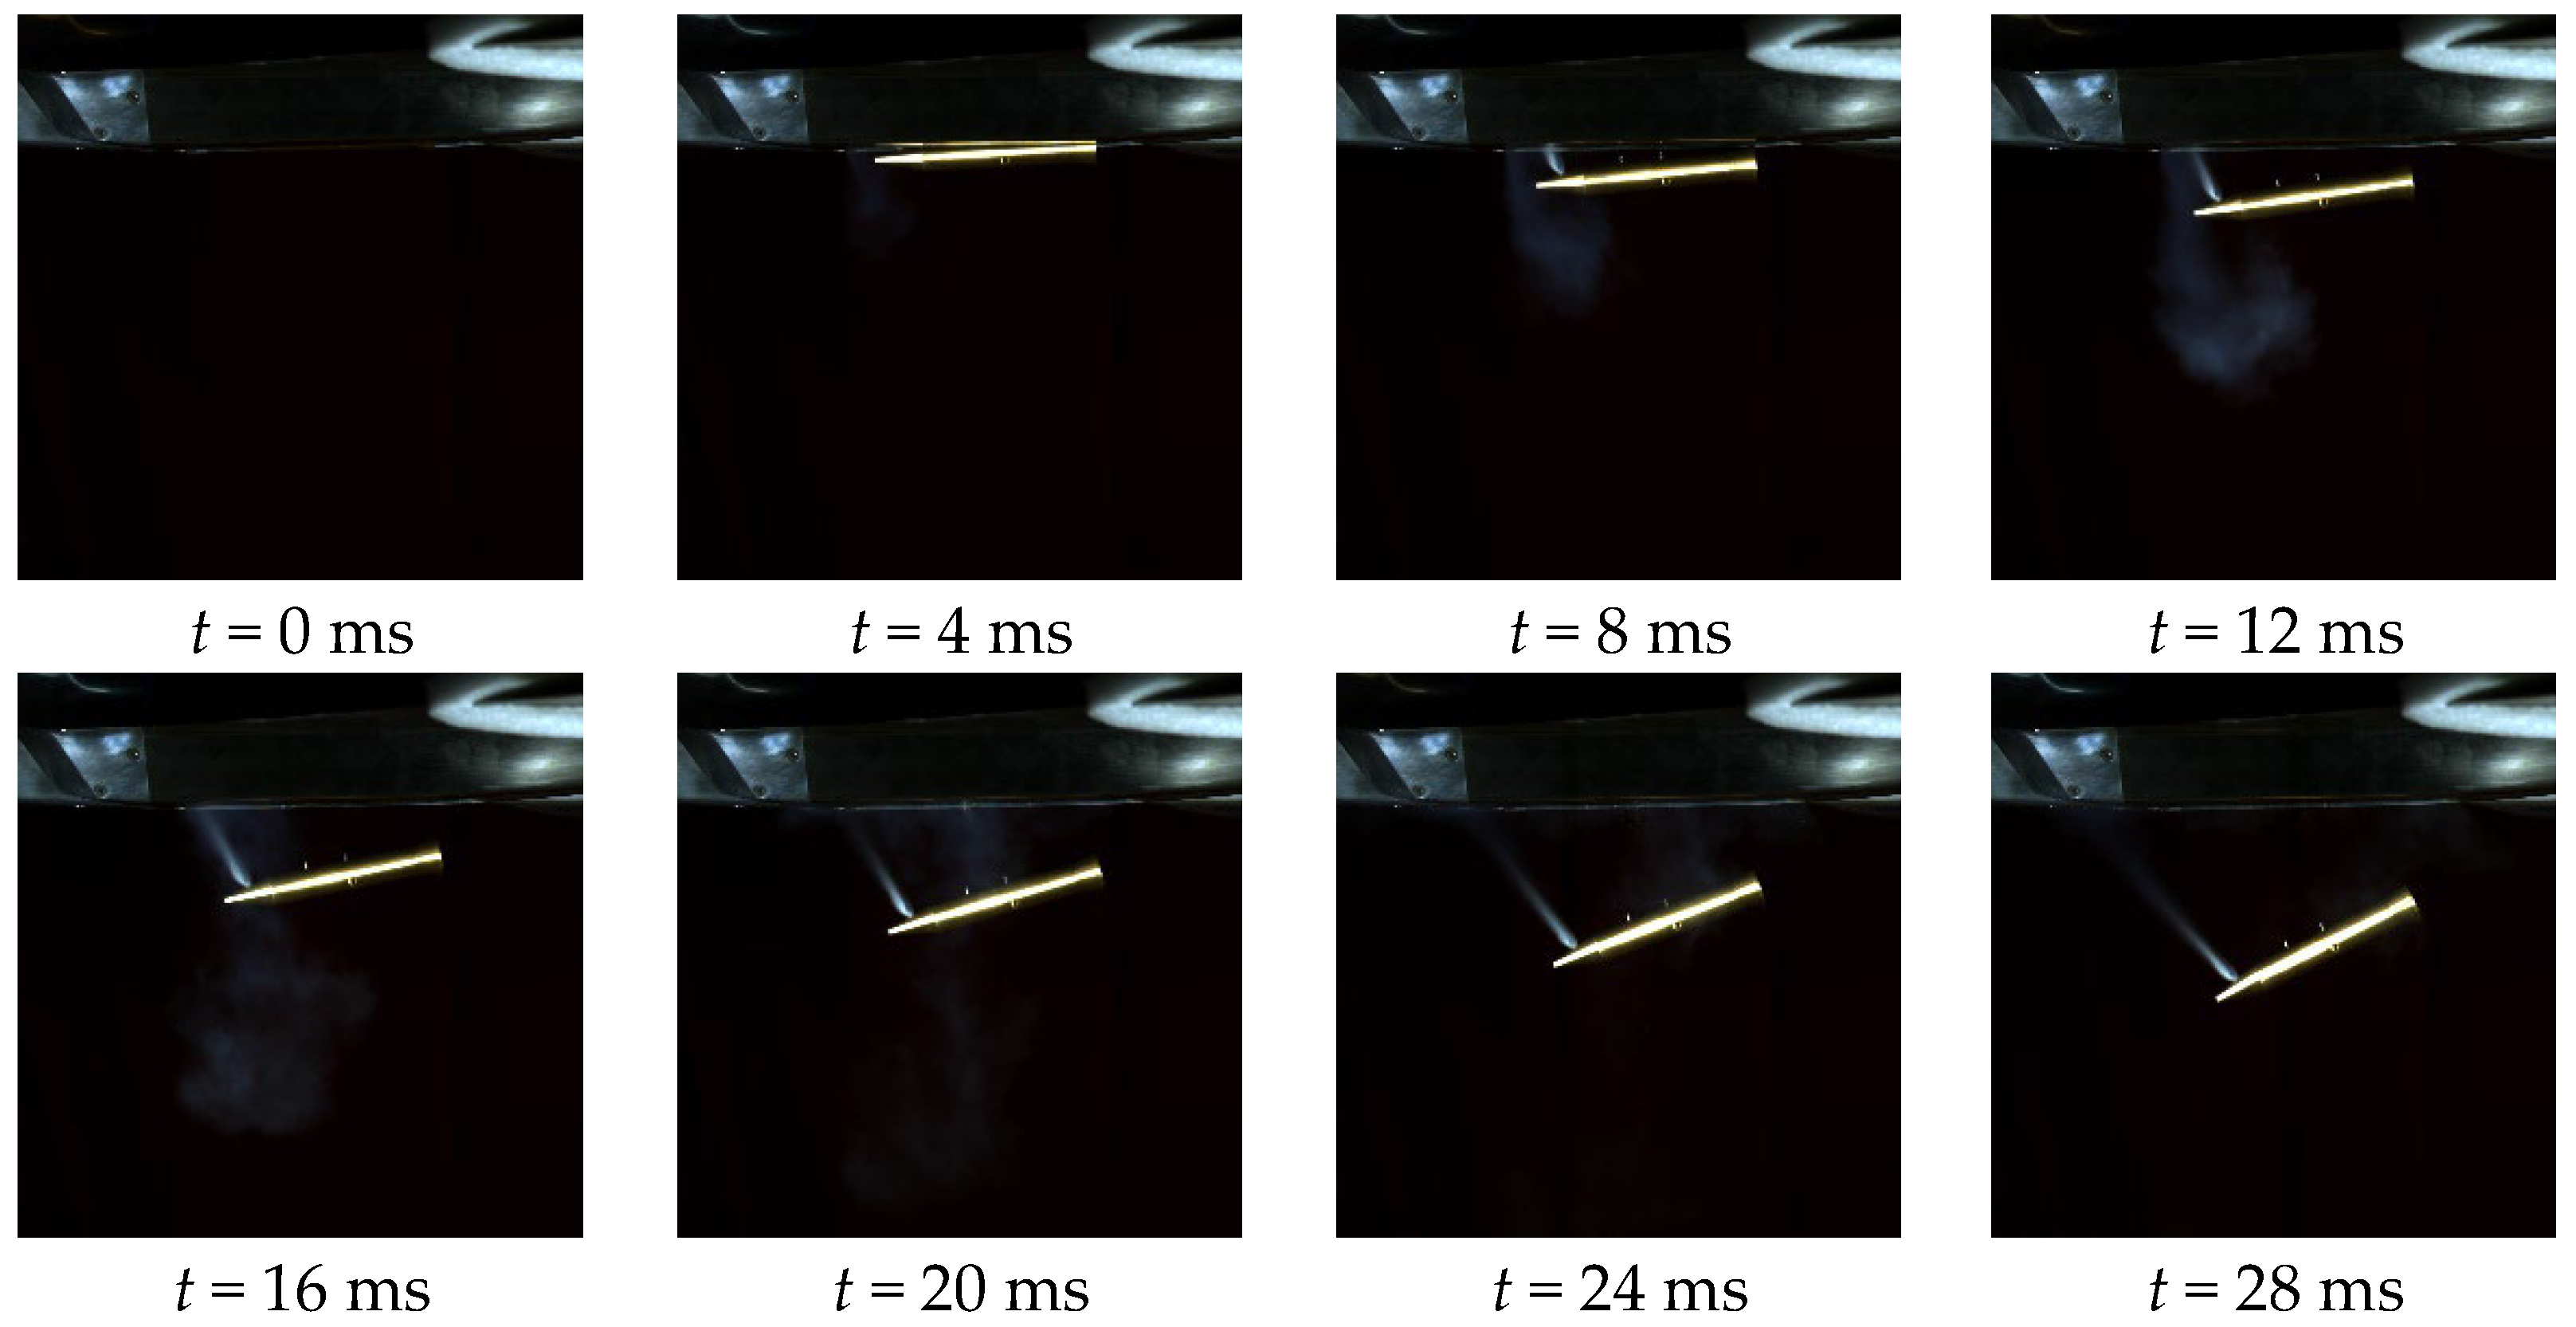
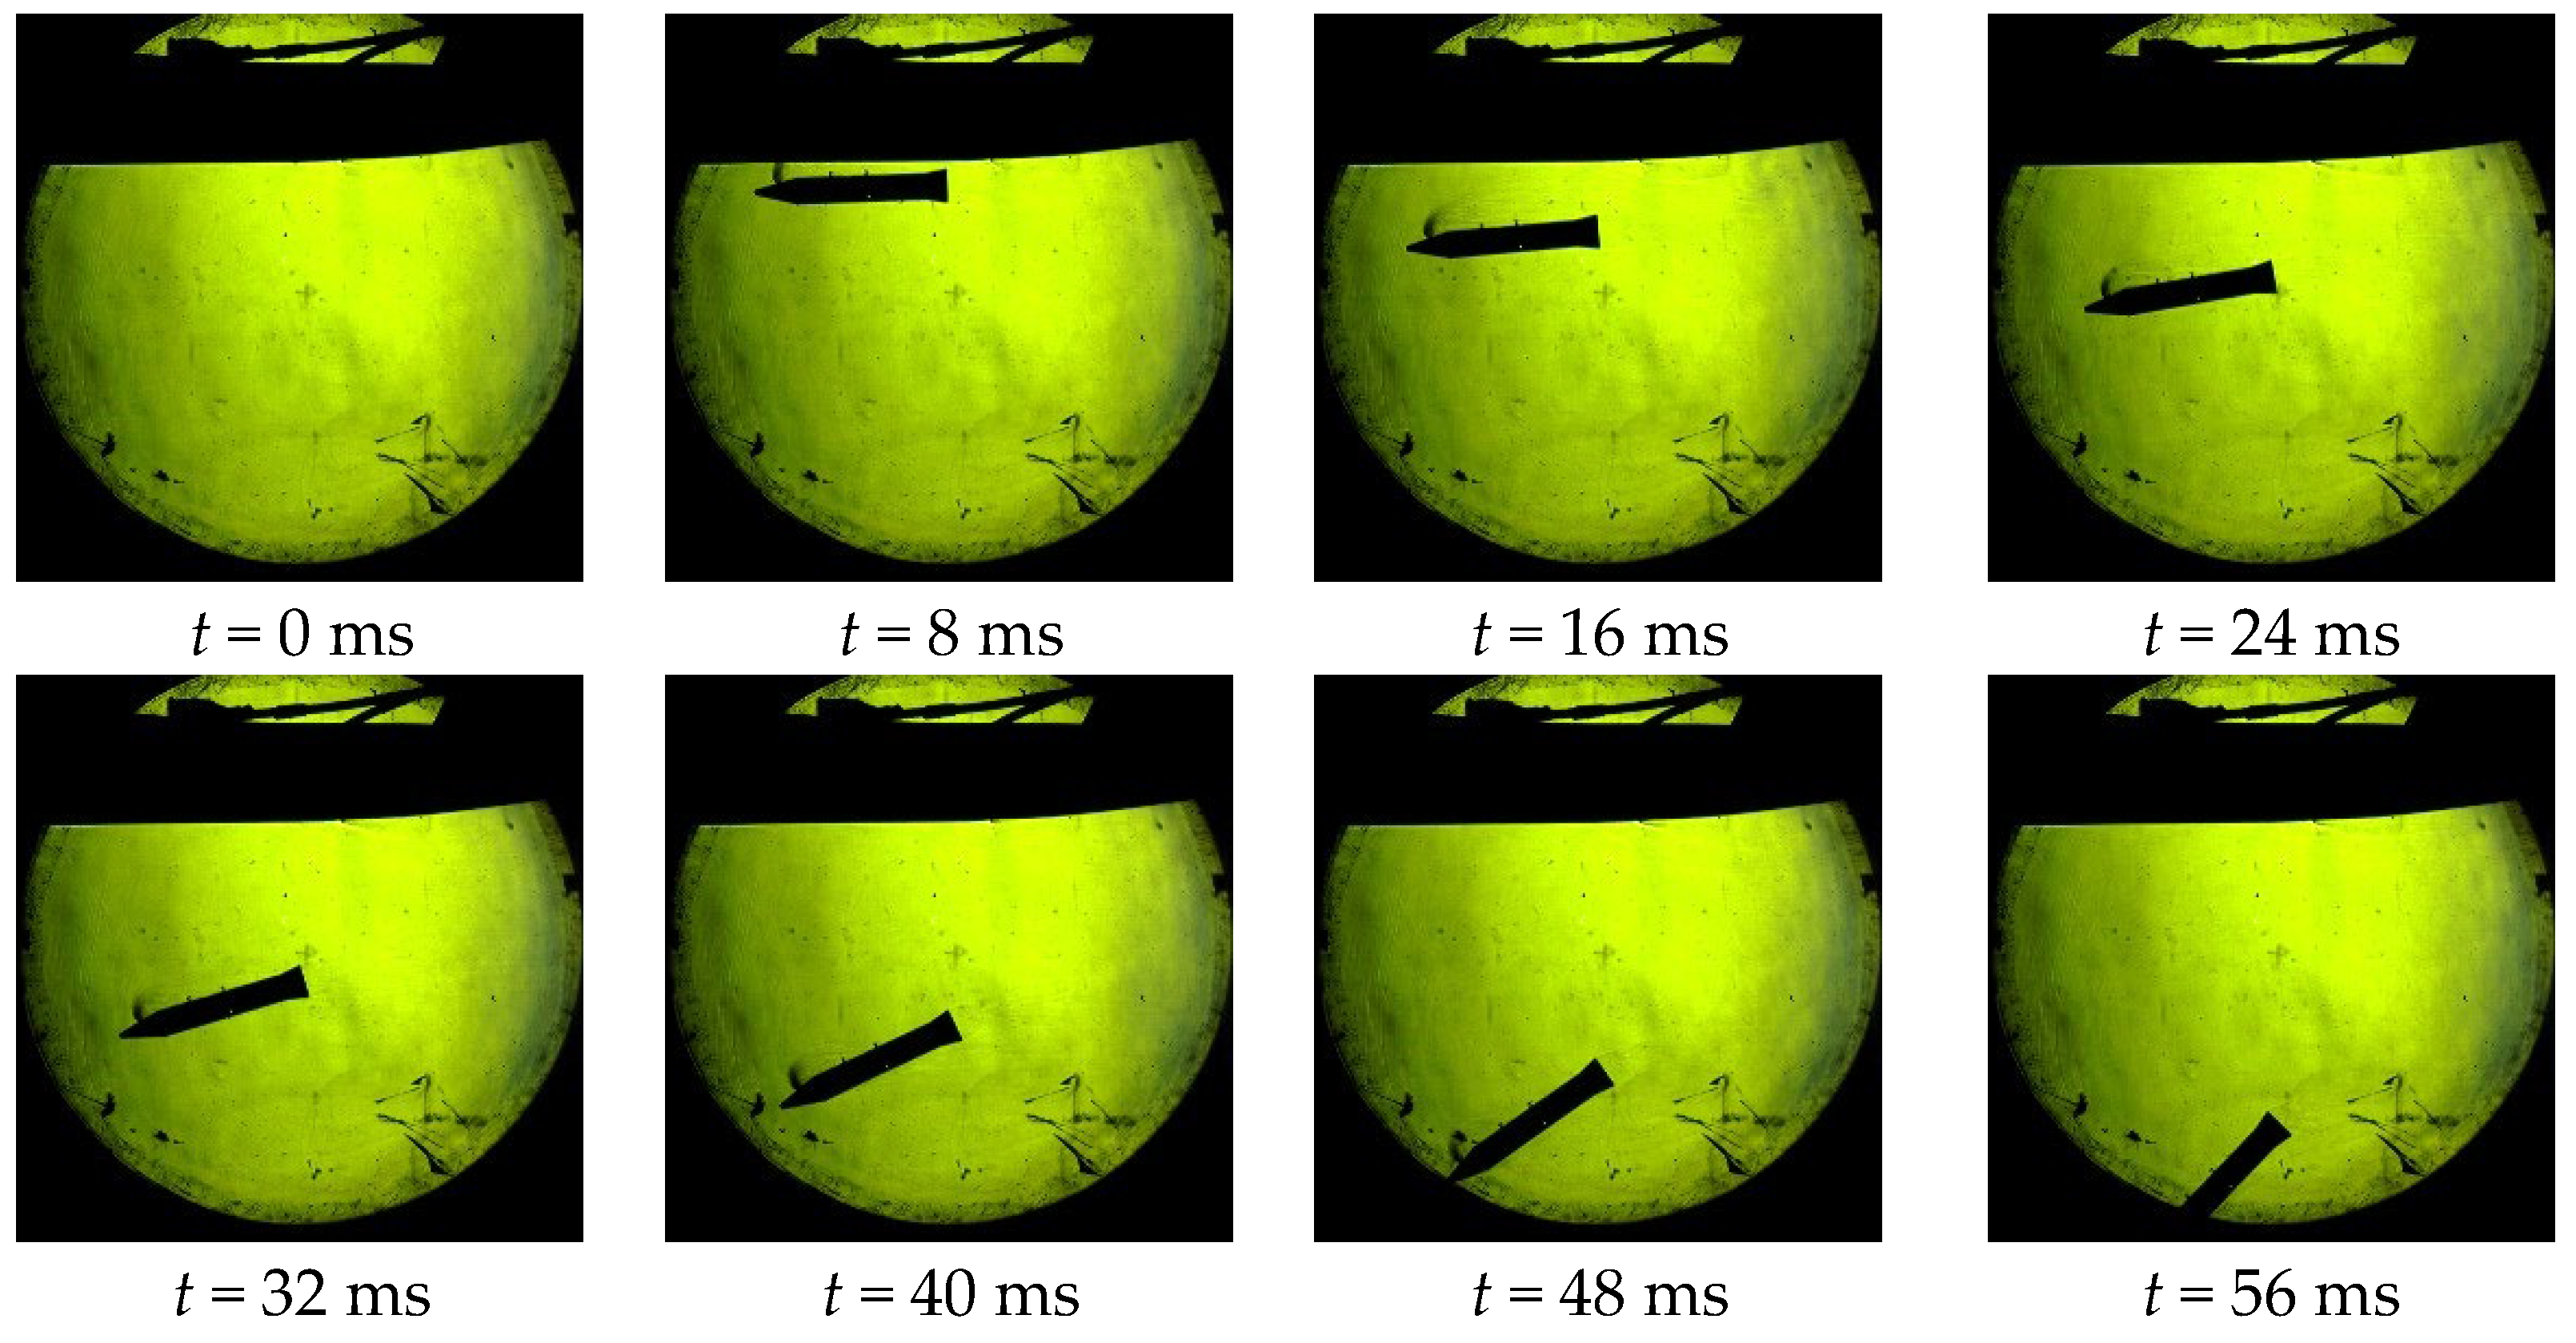
3.2. Wind Tunnel Tests without a Jet
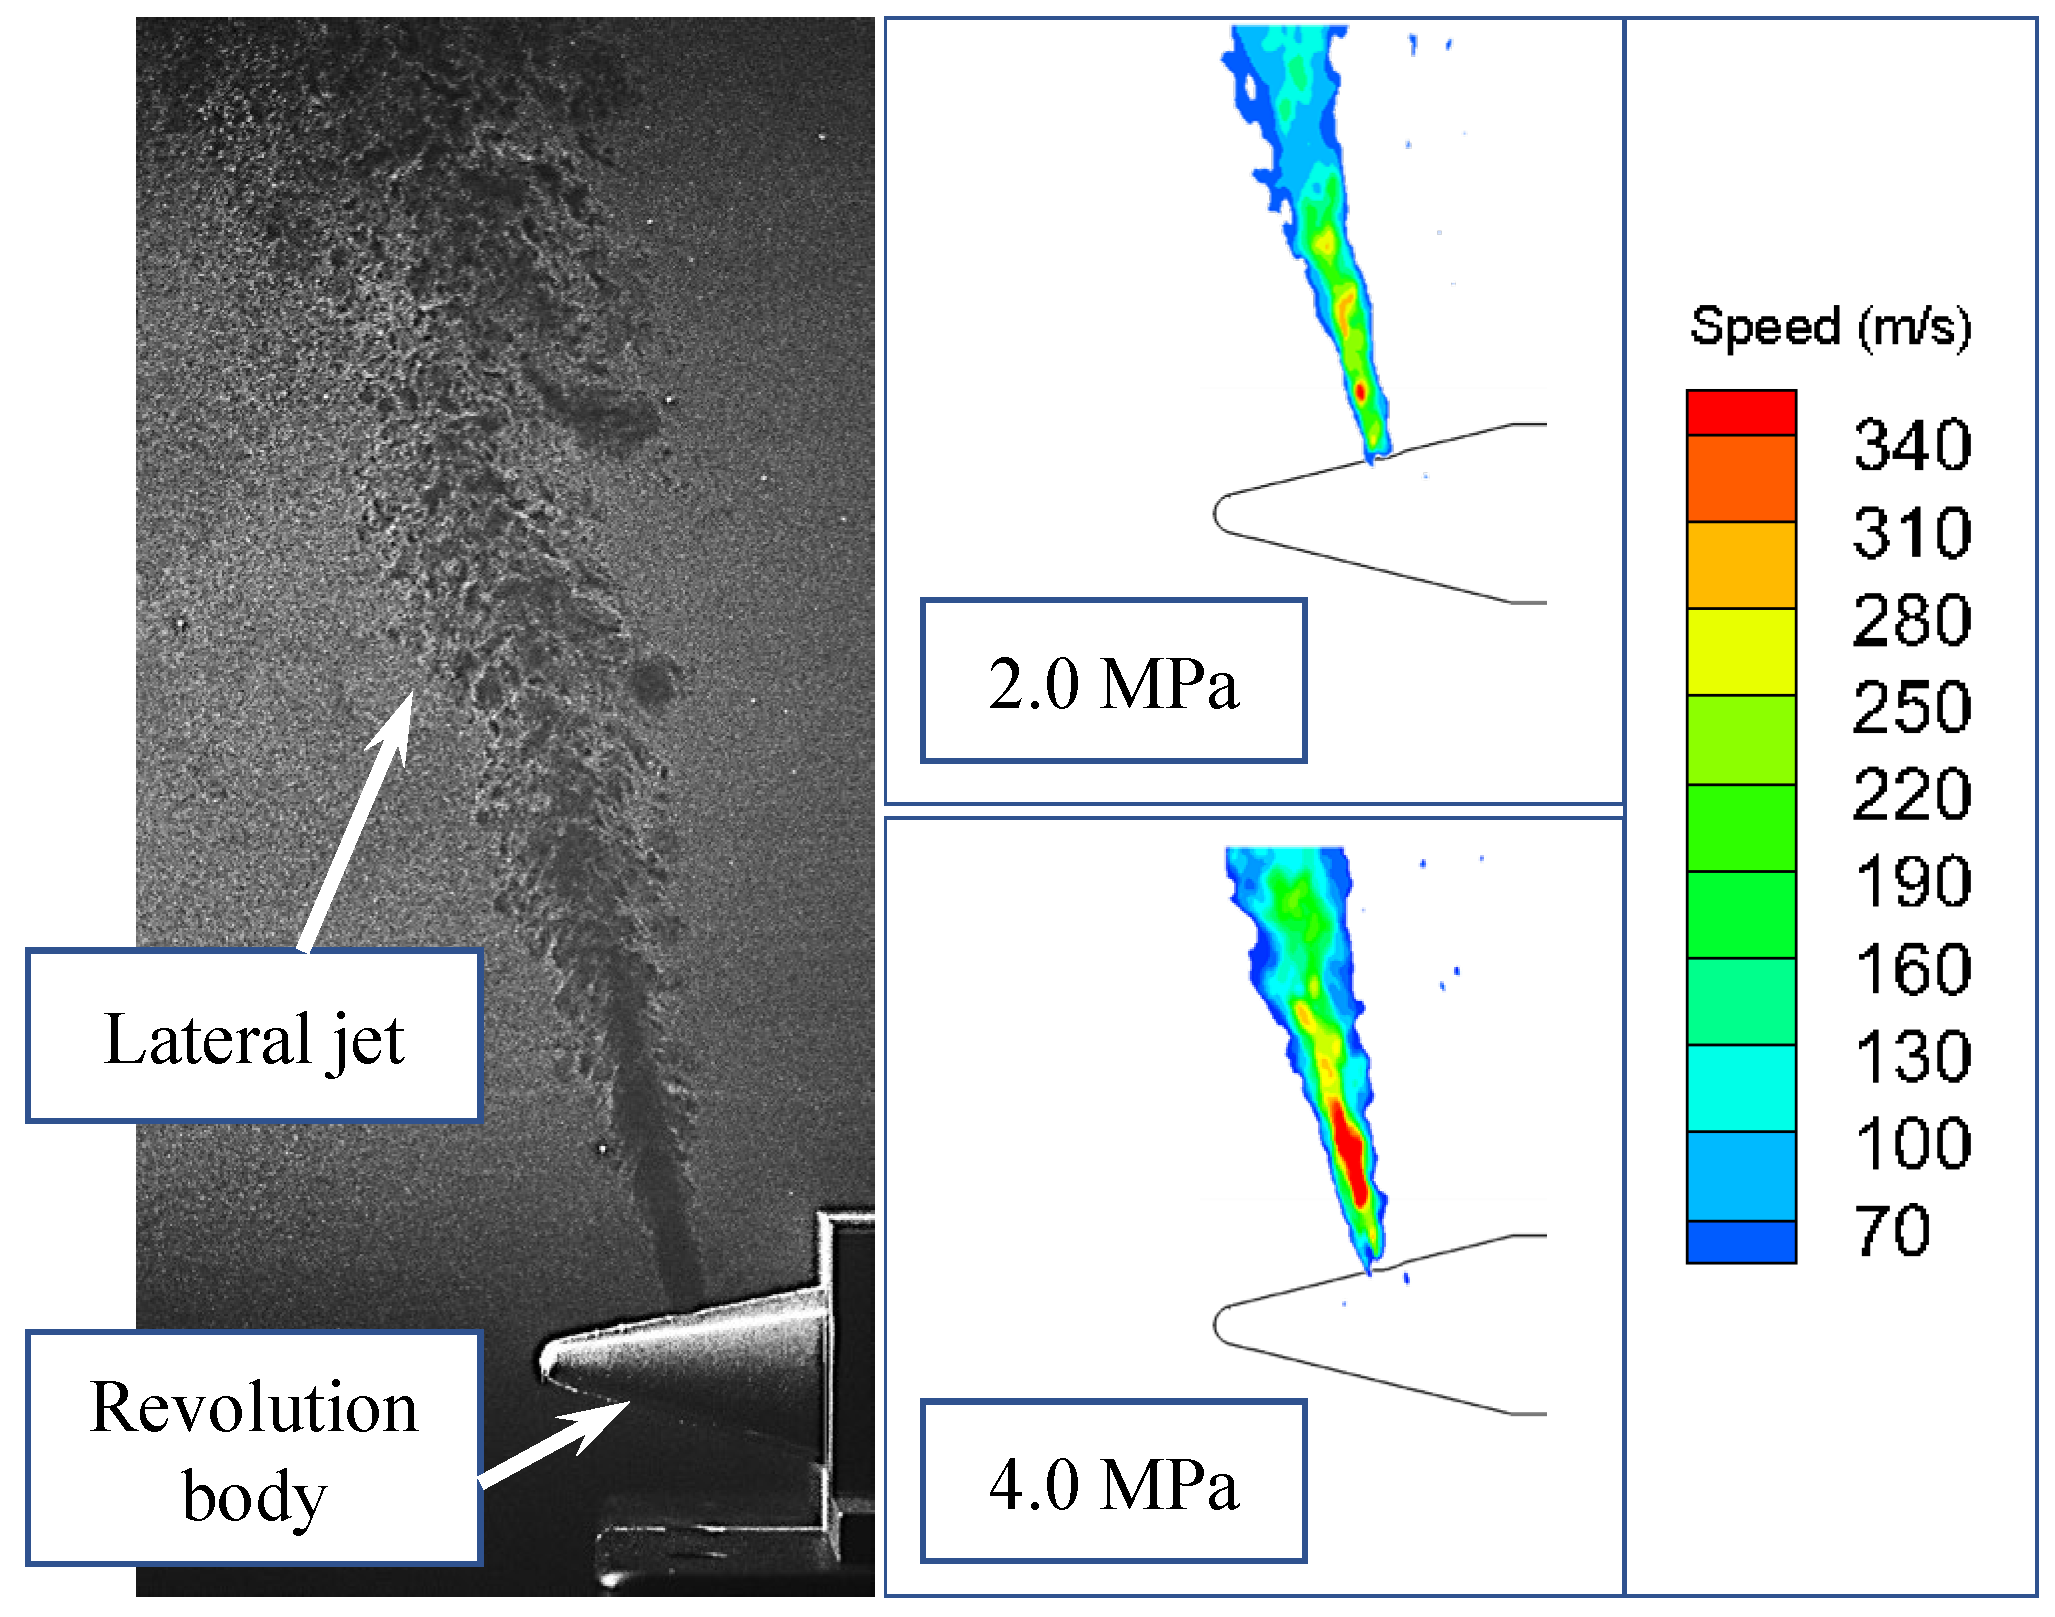
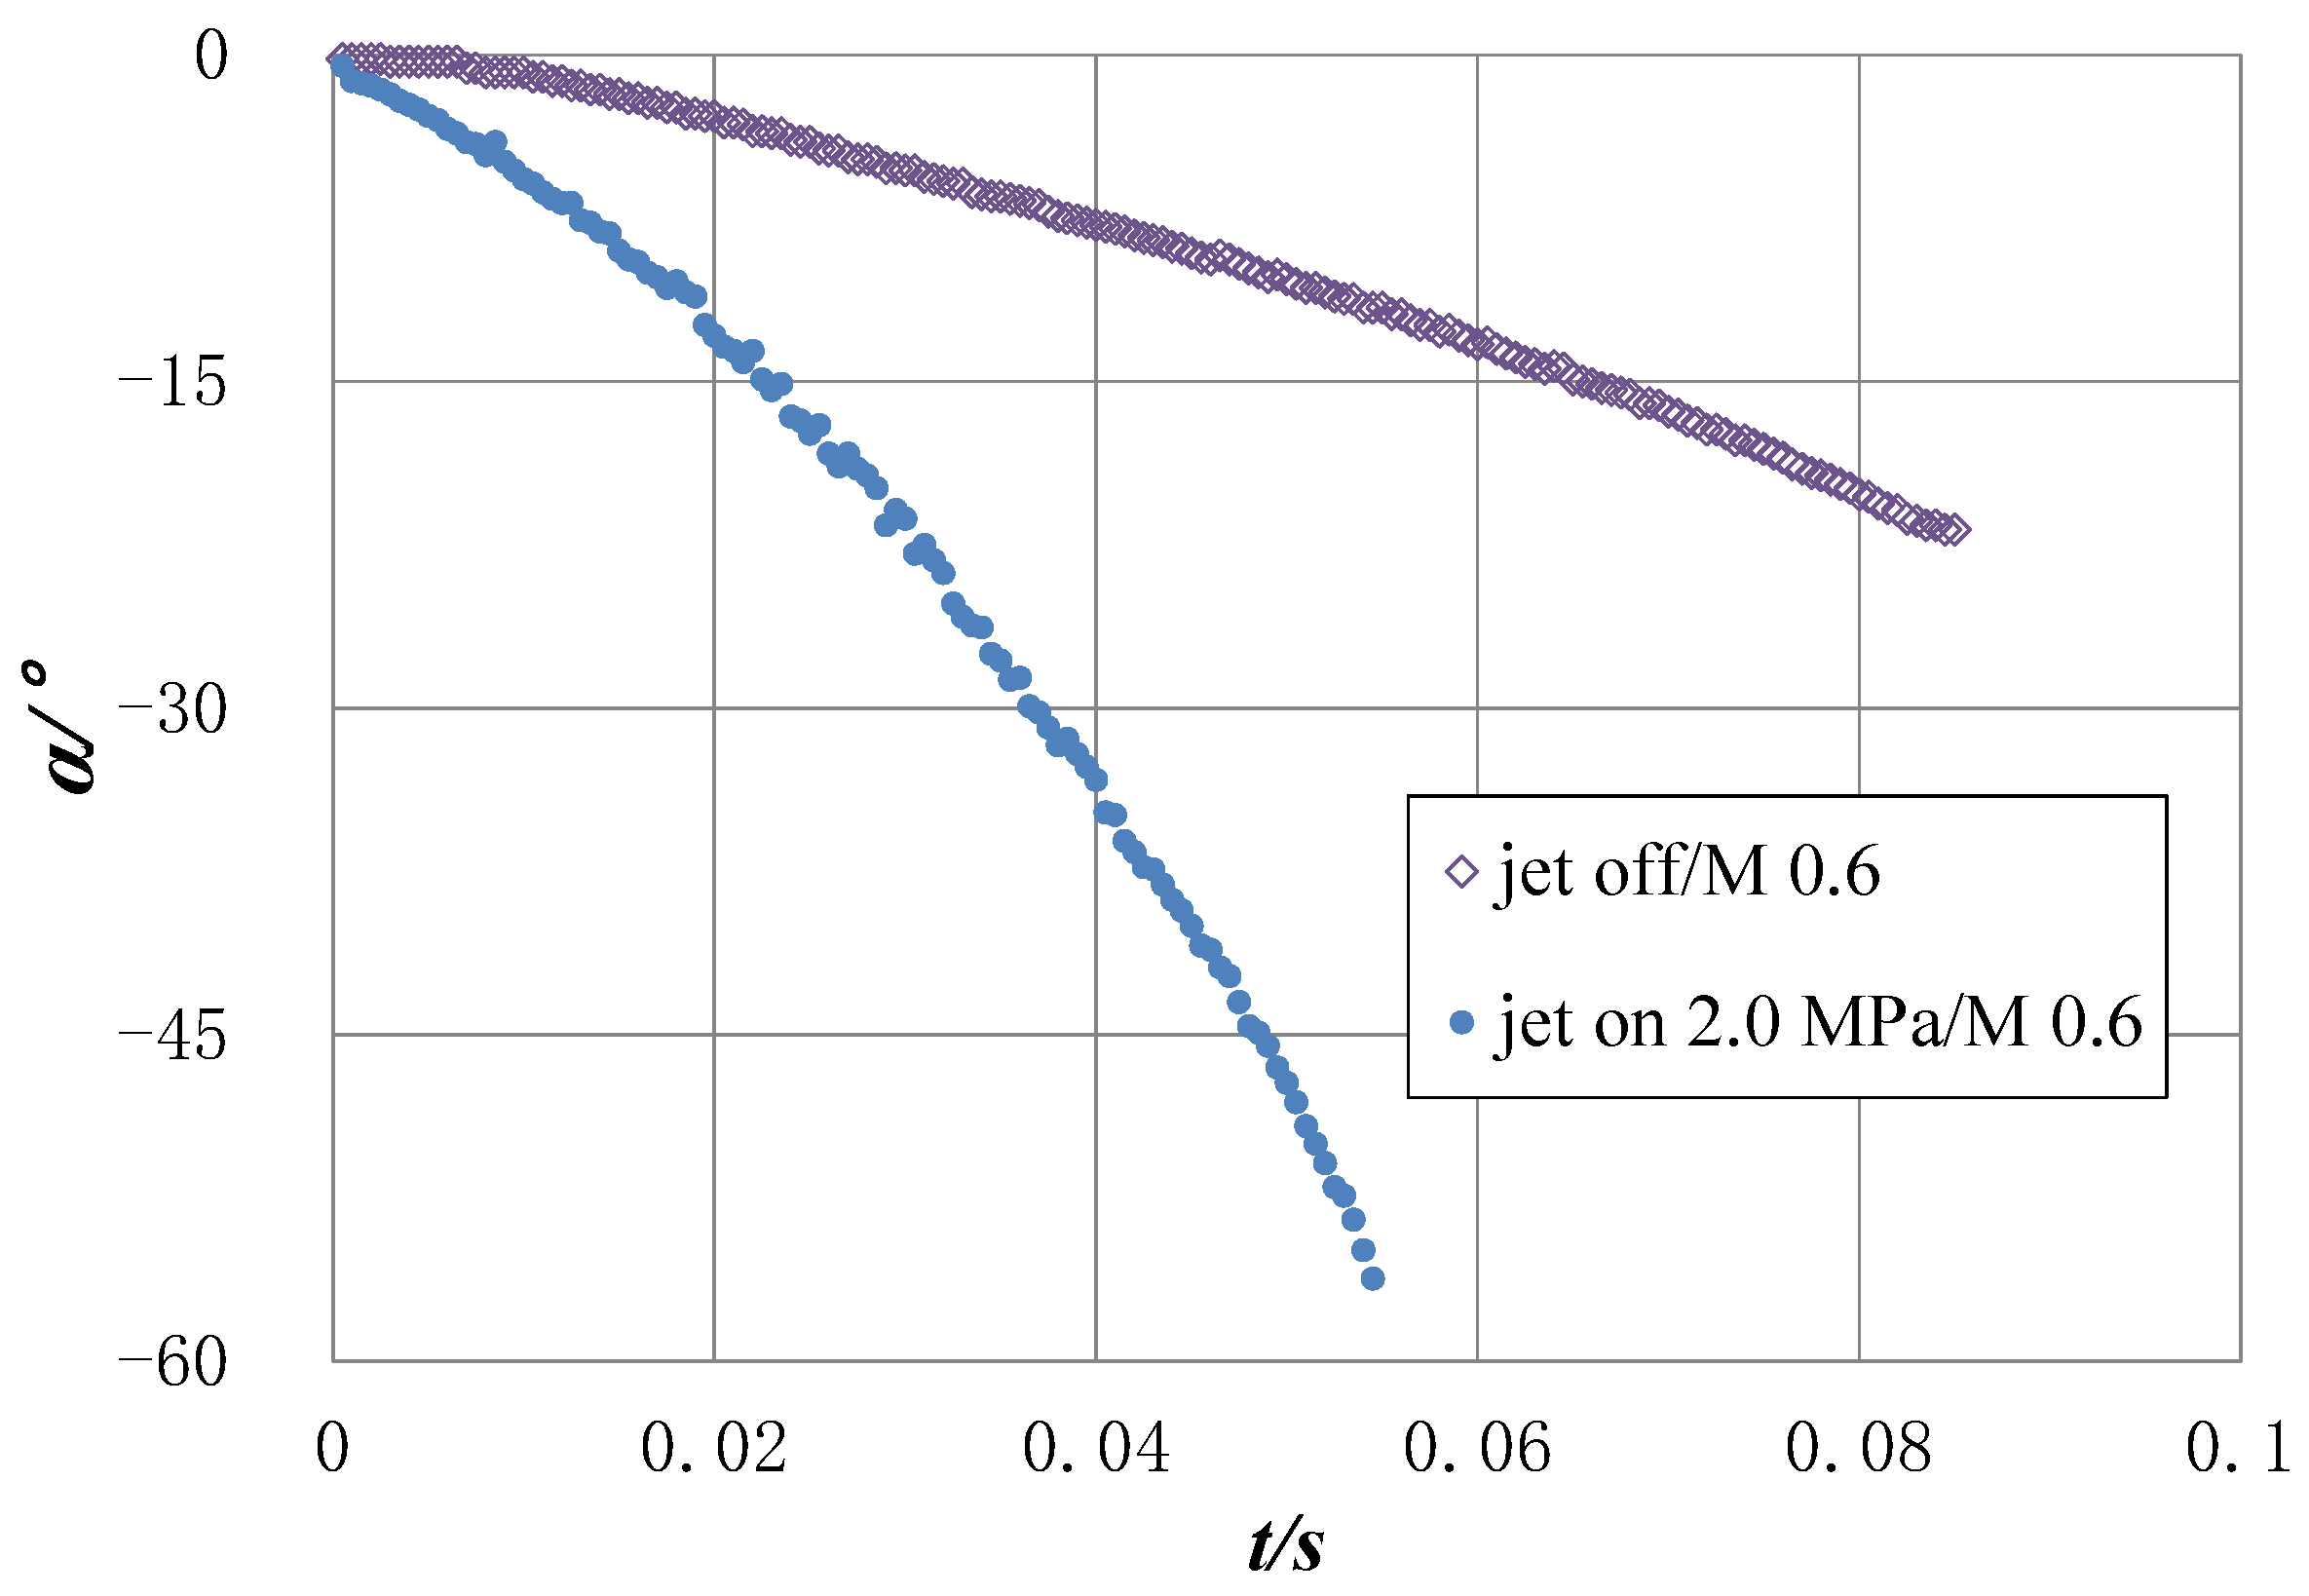
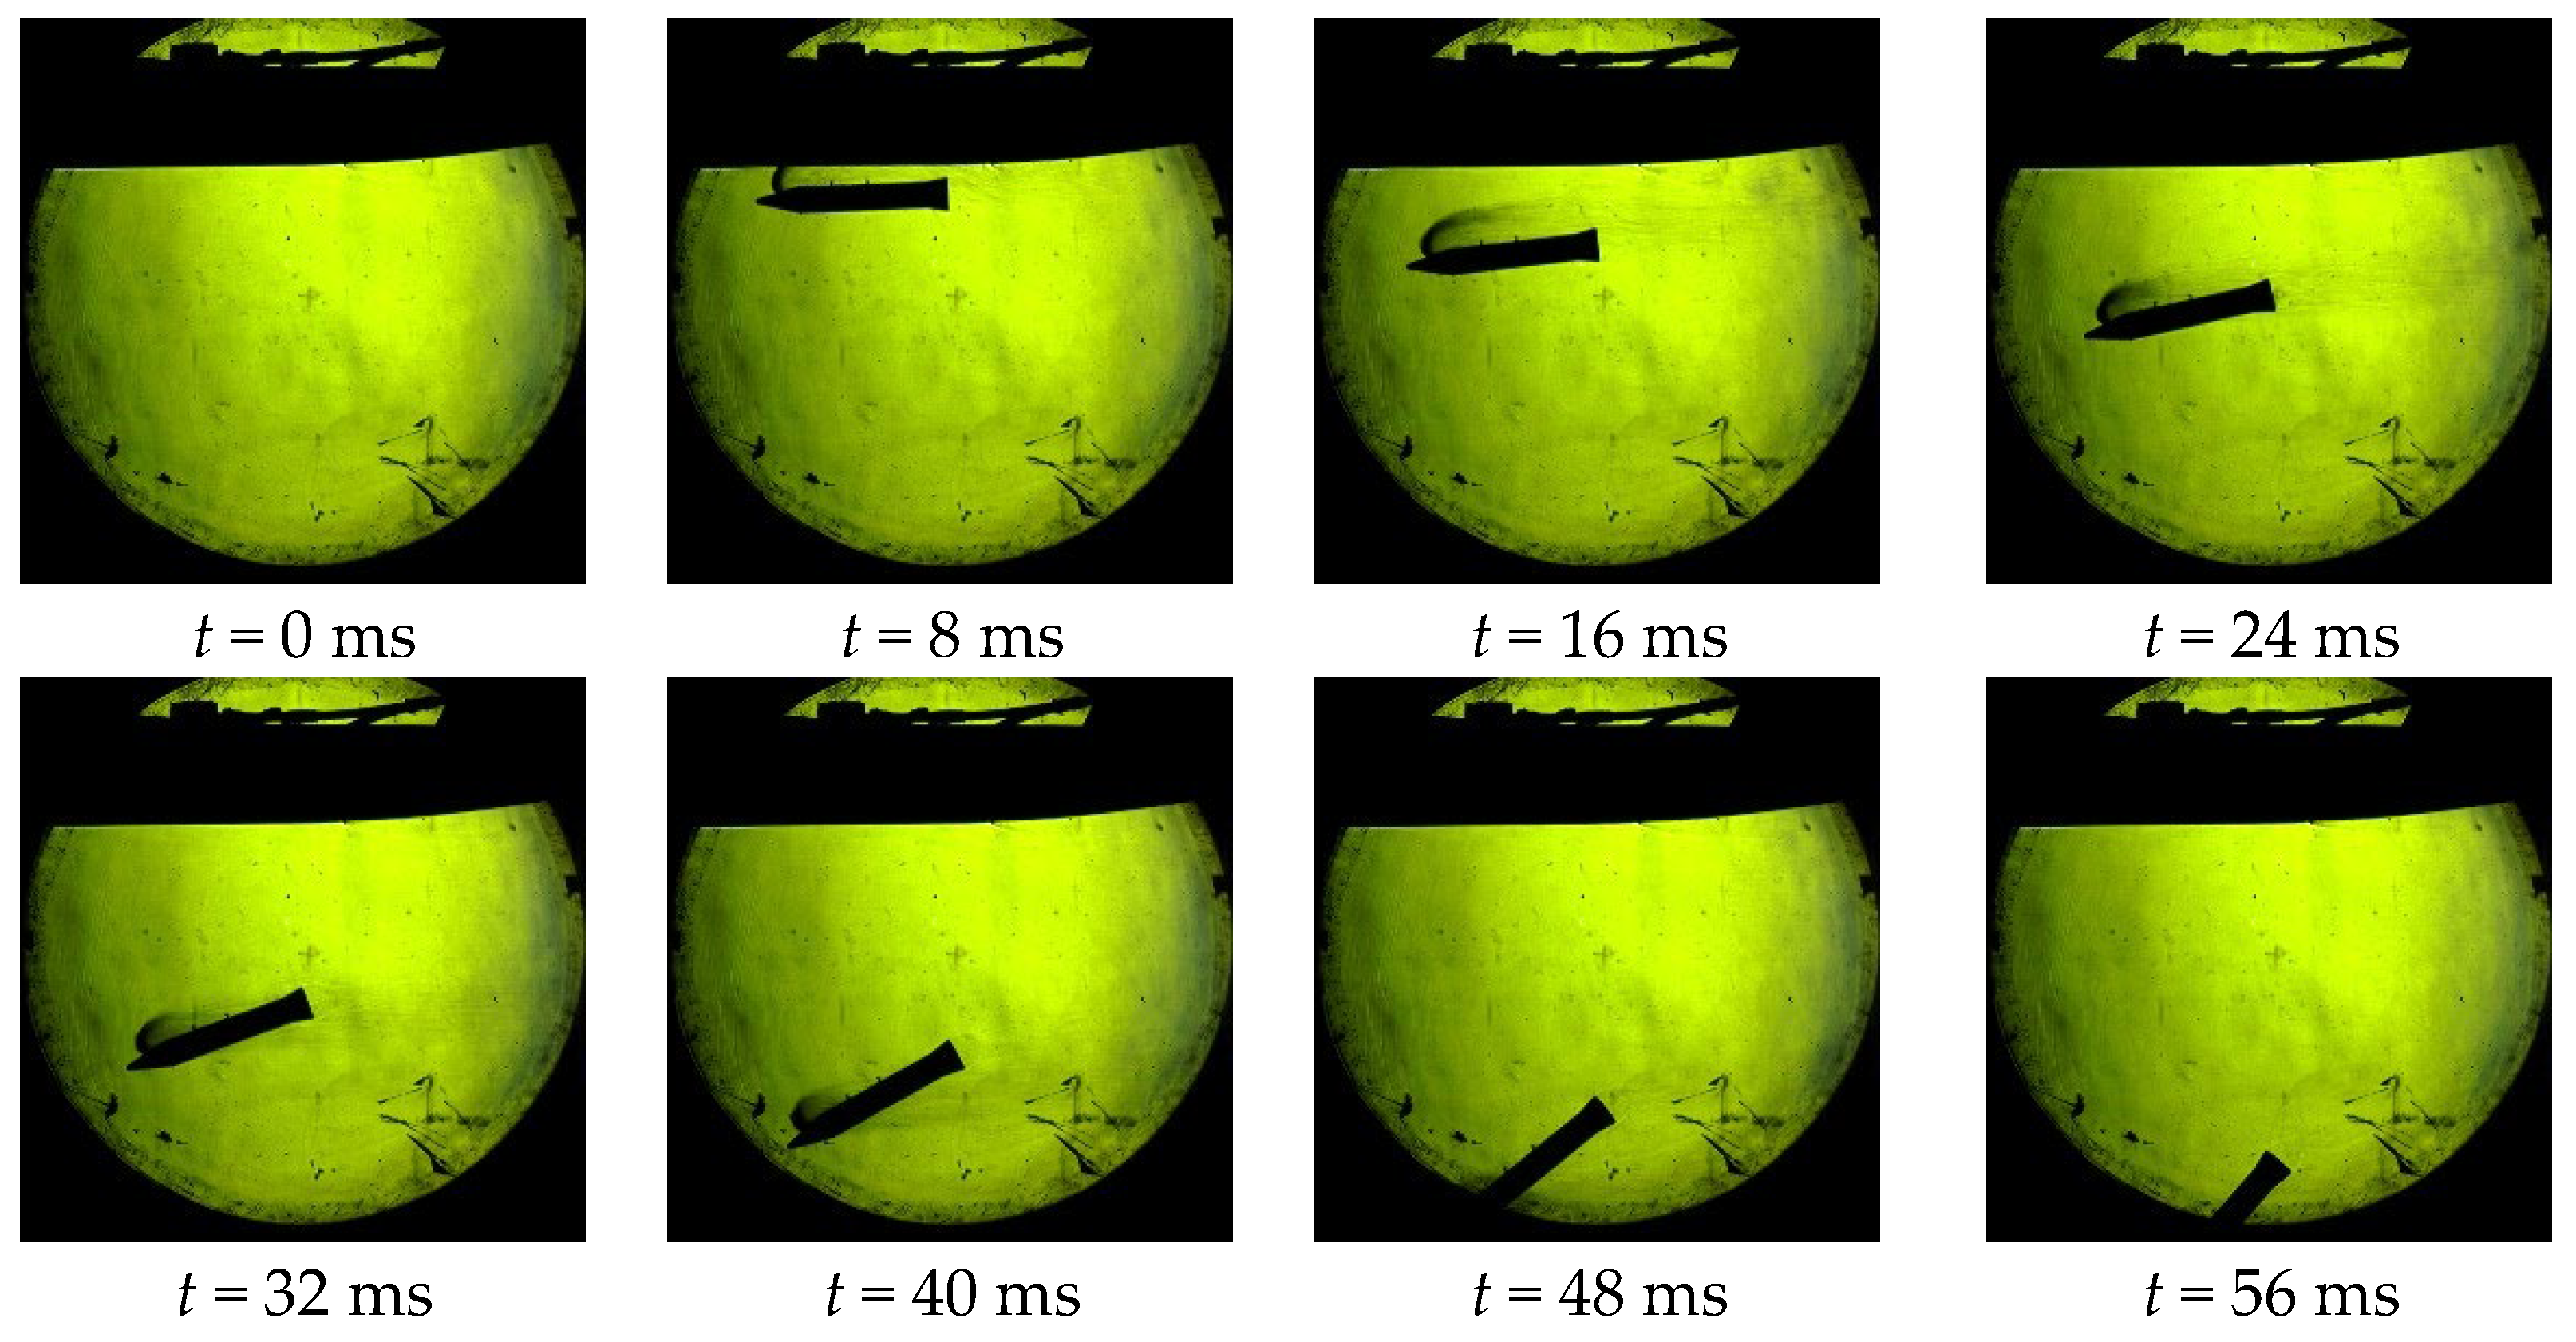
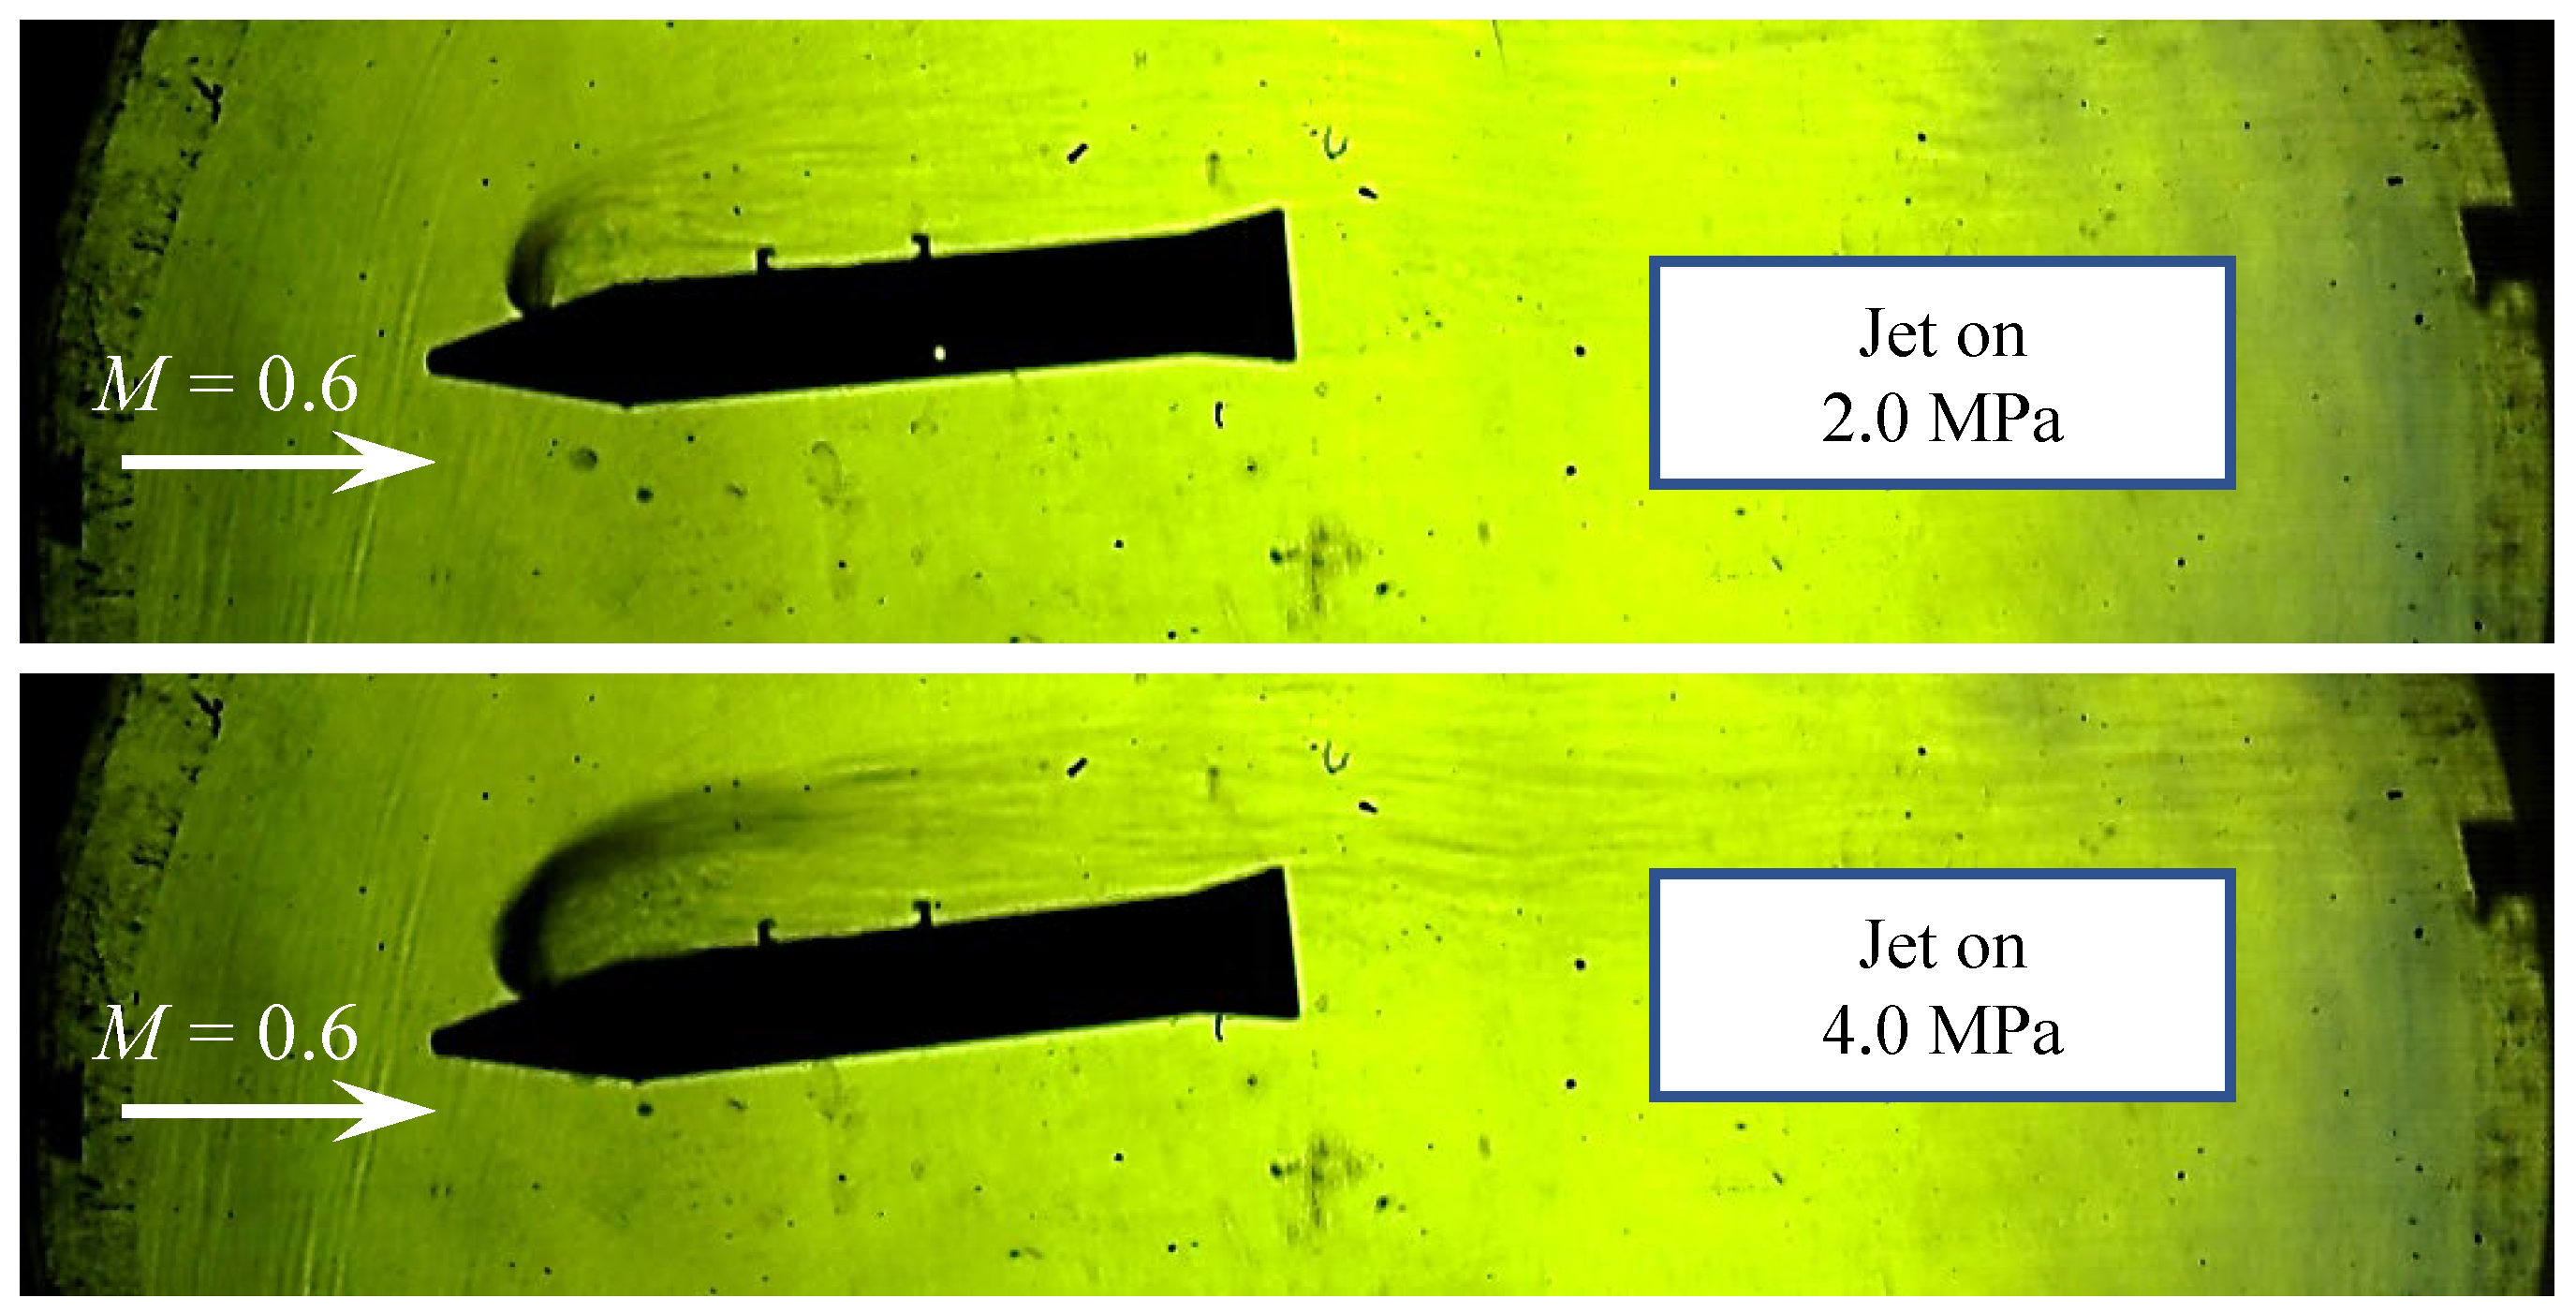
3.3. Wind Tunnel Test with a Jet at 2.0 MPa
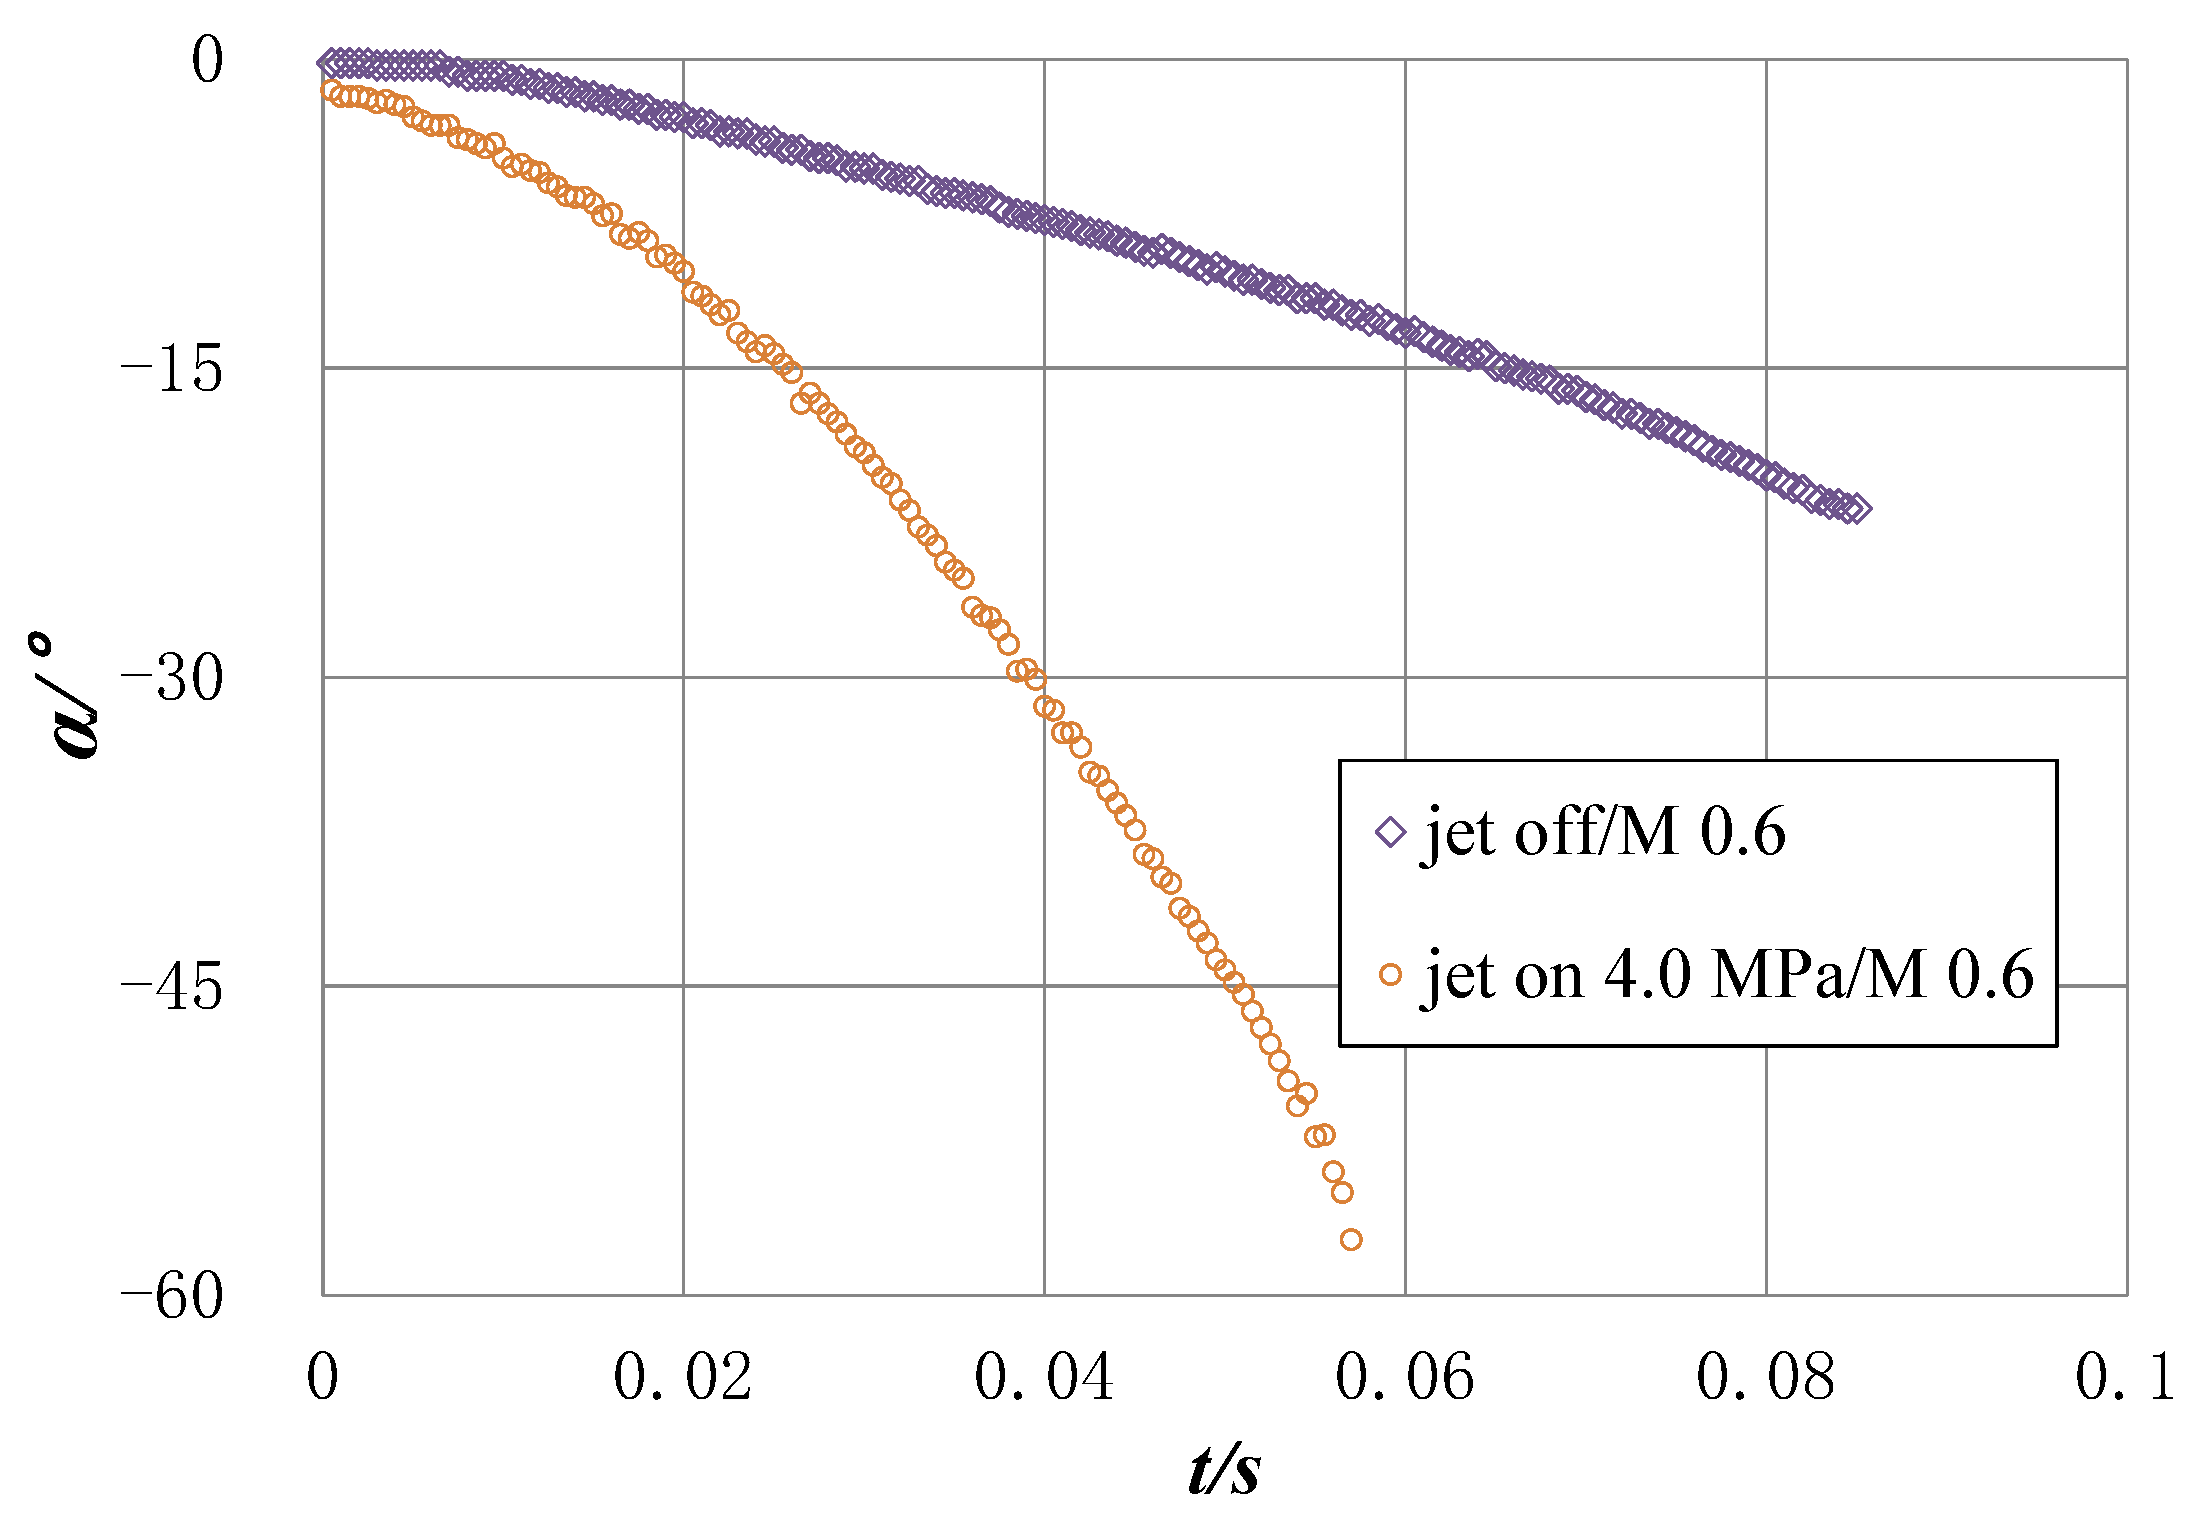
3.4. Wind Tunnel Test with a Jet at 4.0 MPa
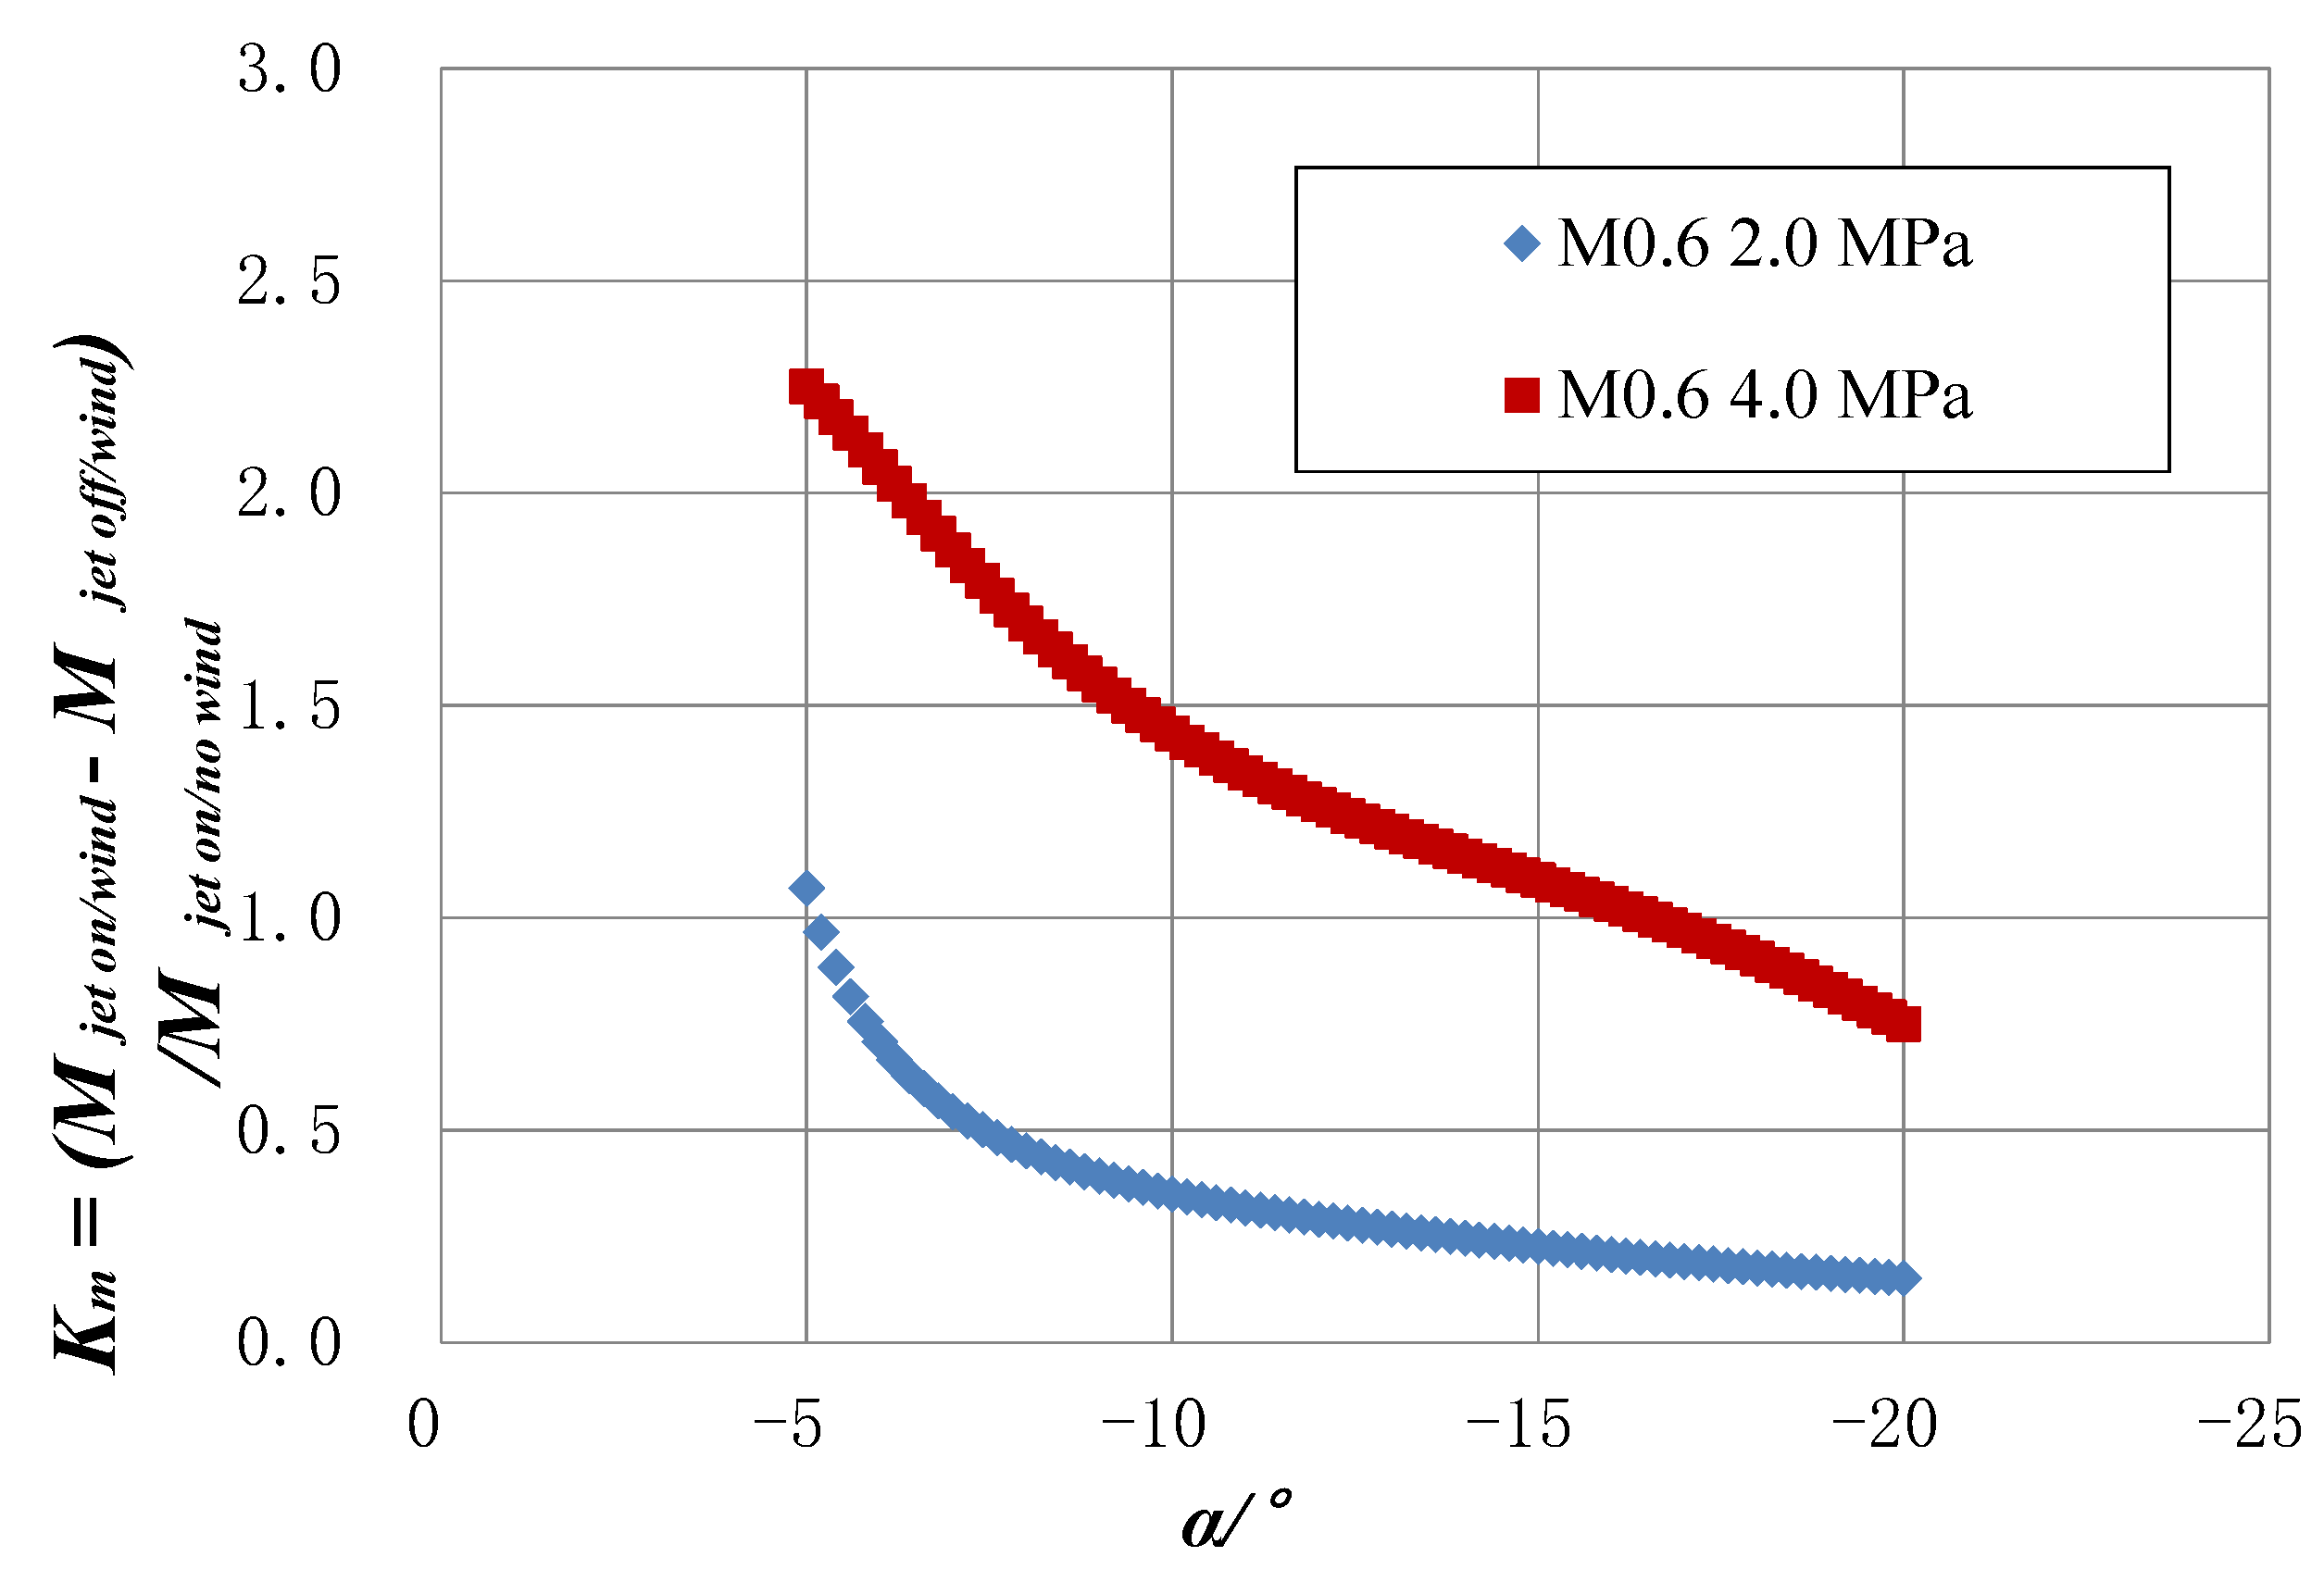
4. KM Solution
5. Conclusions
- (1)
- The tests in this paper are carried out for typical test conditions, and the results show that when the pressure is 2.0 MPa, KM at 5° < |α| < 20° is generally less than 1, indicating that the pitching moment provided by the lateral jet has no pronounced effect.
- (2)
- When the pressure is 4.0 MPa, KM at 5° < |α| < 16° is typically greater than 1, even reaching about 2.25 at 5°, which shows that the lateral jet plays a role in promoting the pitching moment. When 16° < |α| < 20°, KM is less than 1, indicating that the pitching moment contribution by the lateral jet has no significant effect.
- (3)
- It was further found that KM decreases slowly with increasing angle of attack. At 2.0 MPa, 5° is the critical angle of attack (where KM crosses 1), while at 4.0 MPa, the critical angle of attack is 16°. When the angle of attack is above 30°, the influence of the jet on the pitching moment nearly disappears.
Author Contributions
Funding
Data Availability Statement
Conflicts of Interest
References
- Brandeis, J.; Gill, J. Experimental investigation of side jet steering for missiles at supersonic and hypersonic speeds. In Proceedings of the 33rd Aerospace Sciences Meeting and Exhibit, Reno, NV, USA, 9–12 January 1995; p. 316. [Google Scholar]
- Sebastian, R.; Lürkens, T.; Schreyer, A.-M. Flow field around a spanwise-inclined jet in supersonic crossflow. Aerosp. Sci. Technol. 2020, 106, 106209. [Google Scholar] [CrossRef]
- Pourhashem, H.; Kumar, S.; Kalkhoran, I.M. Flow field characteristics of a supersonic jet influenced by downstream microjet fluidic injection. Aerosp. Sci. Technol. 2019, 93, 105281. [Google Scholar] [CrossRef] [Green Version]
- Erdem, E.; Kontis, K. Experimental investigation of sonic transverse jets in Mach 5 crossflow. Aerosp. Sci. Technol. 2021, 110, 106419. [Google Scholar] [CrossRef]
- Maldonado, V.; Peralta, N.; Gorumlu, S.; Ayele, W. On the figure of merit and streamwise flow of a propulsive rotor with synthetic jets. Aerosp. Sci. Technol. 2021, 113, 106712. [Google Scholar] [CrossRef]
- Huh, J.; Lee, S. Numerical study on lateral jet interaction in supersonic crossflows. Aerosp. Sci. Technol. 2018, 80, 315–328. [Google Scholar] [CrossRef]
- Zhu, L.; Li, Y.; Chen, X.; Li, H.; Li, W.; Li, C. Hypersonic flow characteristics and relevant structure thermal response induced by the novel combined spike-aerodome and lateral jet strategy. Aerosp. Sci. Technol. 2019, 95, 105459. [Google Scholar] [CrossRef]
- Min, B.-Y.; Lee, J.-W.; Byun, Y.-H. Numerical investigation of the shock interaction effect on the lateral jet controlled missile. Aerosp. Sci. Technol. 2006, 10, 385–393. [Google Scholar] [CrossRef]
- Luo, X.; Sun, B.; Wang, X. Experimental investigation on a cavity-step-actuated supersonic oscillating jet. Chin. J. Aeronaut. 2017, 30, 274–281. [Google Scholar] [CrossRef]
- Meng, Y.; Yan, L.; Huang, W.; Wang, Z.-W. Fluid-thermal coupled investigation on the combinational spike and opposing/lateral jet in hypersonic flows. Acta Astronaut. 2021, 185, 264–282. [Google Scholar] [CrossRef]
- Christie, R. Lateral Jet Interaction with a Supersonic Crossflow. Master’s Thesis, Cranfield University, Cranfield, UK, 2010. [Google Scholar]
- DeSpirito, J. Effects of turbulence model on prediction of hot-gas lateral jet interaction in a supersonic crossflow. In Proceedings of the 53rd AIAA Aerospace Sciences Meeting, Kissimmee, FL, USA, 5–9 January 2015. [Google Scholar]
- Huh, J.; Lee, S. Computations of supersonic lateral jet. In Proceedings of the 30th Congress of the International Council of the Aeronautical Sciences, Daejeon, Korea, 25–30 September 2016. [Google Scholar]
- Brandeis, J.; Gill, J. Experimental investigation of super and hypersonic jet interaction on configurations with lifting surfaces. In Proceedings of the 22nd Atmospheric Flight Mechanics Conference, New Orleans, LA, USA, 11–13 August 1997; p. 3723. [Google Scholar]
- Graham, M.J.; Weinacht, P.; Brandeis, J. A Numerical Investigation of Supersonic Jet Interaction for Finned Bodies. J. Spacecr. Rocket. 2000, 39, 31. [Google Scholar]
- Wang, J.; Wu, J. Aerodynamic performance improvement of a pitching airfoil via a synthetic jet. Eur. J. Mech. B 2020, 83, 73–85. [Google Scholar] [CrossRef]
- Lai, J.; Zhao, Z.; Wang, X.; Li, H.; Li, Q. Numerical investigation of pitch motion induced unsteady effects on transverse jet interaction. Aerosp. Sci. Technol. 2020, 105, 106005. [Google Scholar] [CrossRef]
- Xia, Q.; Zhong, S. Enhancement of inline mixing with lateral synthetic jet pairs at low Reynolds numbers: The effect of fluid viscosity. Flow Meas. Instrum. 2017, 53, 308–316. [Google Scholar] [CrossRef]
- Fairweather, M.; Jones, W.P.; Lindstedt, R.P.; Marquis, A.J. Predictions of a turbulent reacting jet in a cross-flow. Combust. Flame 1991, 84, 361–375. [Google Scholar] [CrossRef]
- Watanabe, T.; Zhang, X.; Nagata, K. Direct numerical simulation of incompressible turbulent boundary layers and planar jets at high Reynolds numbers initialized with implicit large eddy simulation. Comput. Fluids 2019, 194, 104314. [Google Scholar] [CrossRef]
- Kozato, Y.; Kikuchi, S.; Imao, S.; Kato, Y.; Okayama, K. Flow control of a rectangular jet by DBD plasma actuators. Int. J. Heat Fluid Flow 2016, 62, 33–43. [Google Scholar] [CrossRef]
- Gröschel, E.; Schröder, W.; Renze, P.; Meinke, M.; Comte, P. Noise prediction for a turbulent jet using different hybrid methods. Comput. Fluids 2008, 37, 414–426. [Google Scholar] [CrossRef]
- Xue, F.; Wang, Y.; Qin, H. Derivation and validation of wind tunnel free-flight similarity law for store separation from aircraft. Aerosp. Sci. Technol. 2020, 97, 105614. [Google Scholar] [CrossRef]
- Xue, F.; Wang, H.; Jiang, Z. Derivation and verification of a similarity law for wind-tunnel free-flight tests of heavy-store separation. Acta Astronaut. 2020, 174, 123–130. [Google Scholar] [CrossRef]
- Xue, F.; Jin, X.; Feng, P. Optimization and verification of free flight separation similarity law in high-speed wind tunnel. Chin. J. Aeronaut. 2020, 33, 501–507. [Google Scholar] [CrossRef]
- Xue, F.; Tang, J.; Wang, H. Optimization and verification of wind tunnel free flight similarity law for the separation of cluster munition. Chin. J. Aeronaut. 2021, 34, 61–70. [Google Scholar] [CrossRef]
- Xue, F.; Qin, H.; Wang, Y. Free flight wind tunnel test similarity law derivation for light store separation from aircraft. Adv. Mech. Eng. 2019, 11, 1–7. [Google Scholar] [CrossRef]
- Xue, F.; Gu, Y.; Wang, Y.; Qin, H. Research on control effectiveness of fluidic thrust vectoring. Sci. Prog. 2021, 104, 003685042199813. [Google Scholar] [CrossRef]
- Xue, F.; Wang, Y.; Bai, P. Investigation of aerodynamics of separator delivery from cavity. Int. J. Mod. Phys. B 2020, 34, 2040104. [Google Scholar] [CrossRef]
- Xue, F.; Jin, X.; Wang, Y.; Yang, Y. Wind tunnel test technique on high speed weapon delivery from internal weapons bay. Acta Aeronaut. Astronaut. Sin. 2017, 38, 59–65. [Google Scholar]


| M | ρ (kg/m3) | Ps (Pa) | q∞ (Pa) | Ts (°C) |
|---|---|---|---|---|
| 0.6 | 1.1156 | 85,834 | 21,408 | 268.02 |
Publisher’s Note: MDPI stays neutral with regard to jurisdictional claims in published maps and institutional affiliations. |
© 2022 by the authors. Licensee MDPI, Basel, Switzerland. This article is an open access article distributed under the terms and conditions of the Creative Commons Attribution (CC BY) license (https://creativecommons.org/licenses/by/4.0/).
Share and Cite
Xue, F.; Zhang, Y.; Cao, N.; Li, L. Solving the Moment Amplification Factor of a Lateral Jet by the Unsteady Motion Experimental Method. Appl. Sci. 2022, 12, 8387. https://doi.org/10.3390/app12168387
Xue F, Zhang Y, Cao N, Li L. Solving the Moment Amplification Factor of a Lateral Jet by the Unsteady Motion Experimental Method. Applied Sciences. 2022; 12(16):8387. https://doi.org/10.3390/app12168387
Chicago/Turabian StyleXue, Fei, Yunlong Zhang, Ning Cao, and Liugang Li. 2022. "Solving the Moment Amplification Factor of a Lateral Jet by the Unsteady Motion Experimental Method" Applied Sciences 12, no. 16: 8387. https://doi.org/10.3390/app12168387