
Evolutionary-Based Deep Stacked Autoencoder for Intrusion Detection in a Cloud-Based Cyber-Physical System

 ,
,
Abstract
:1. Introduction
2. Literature Review
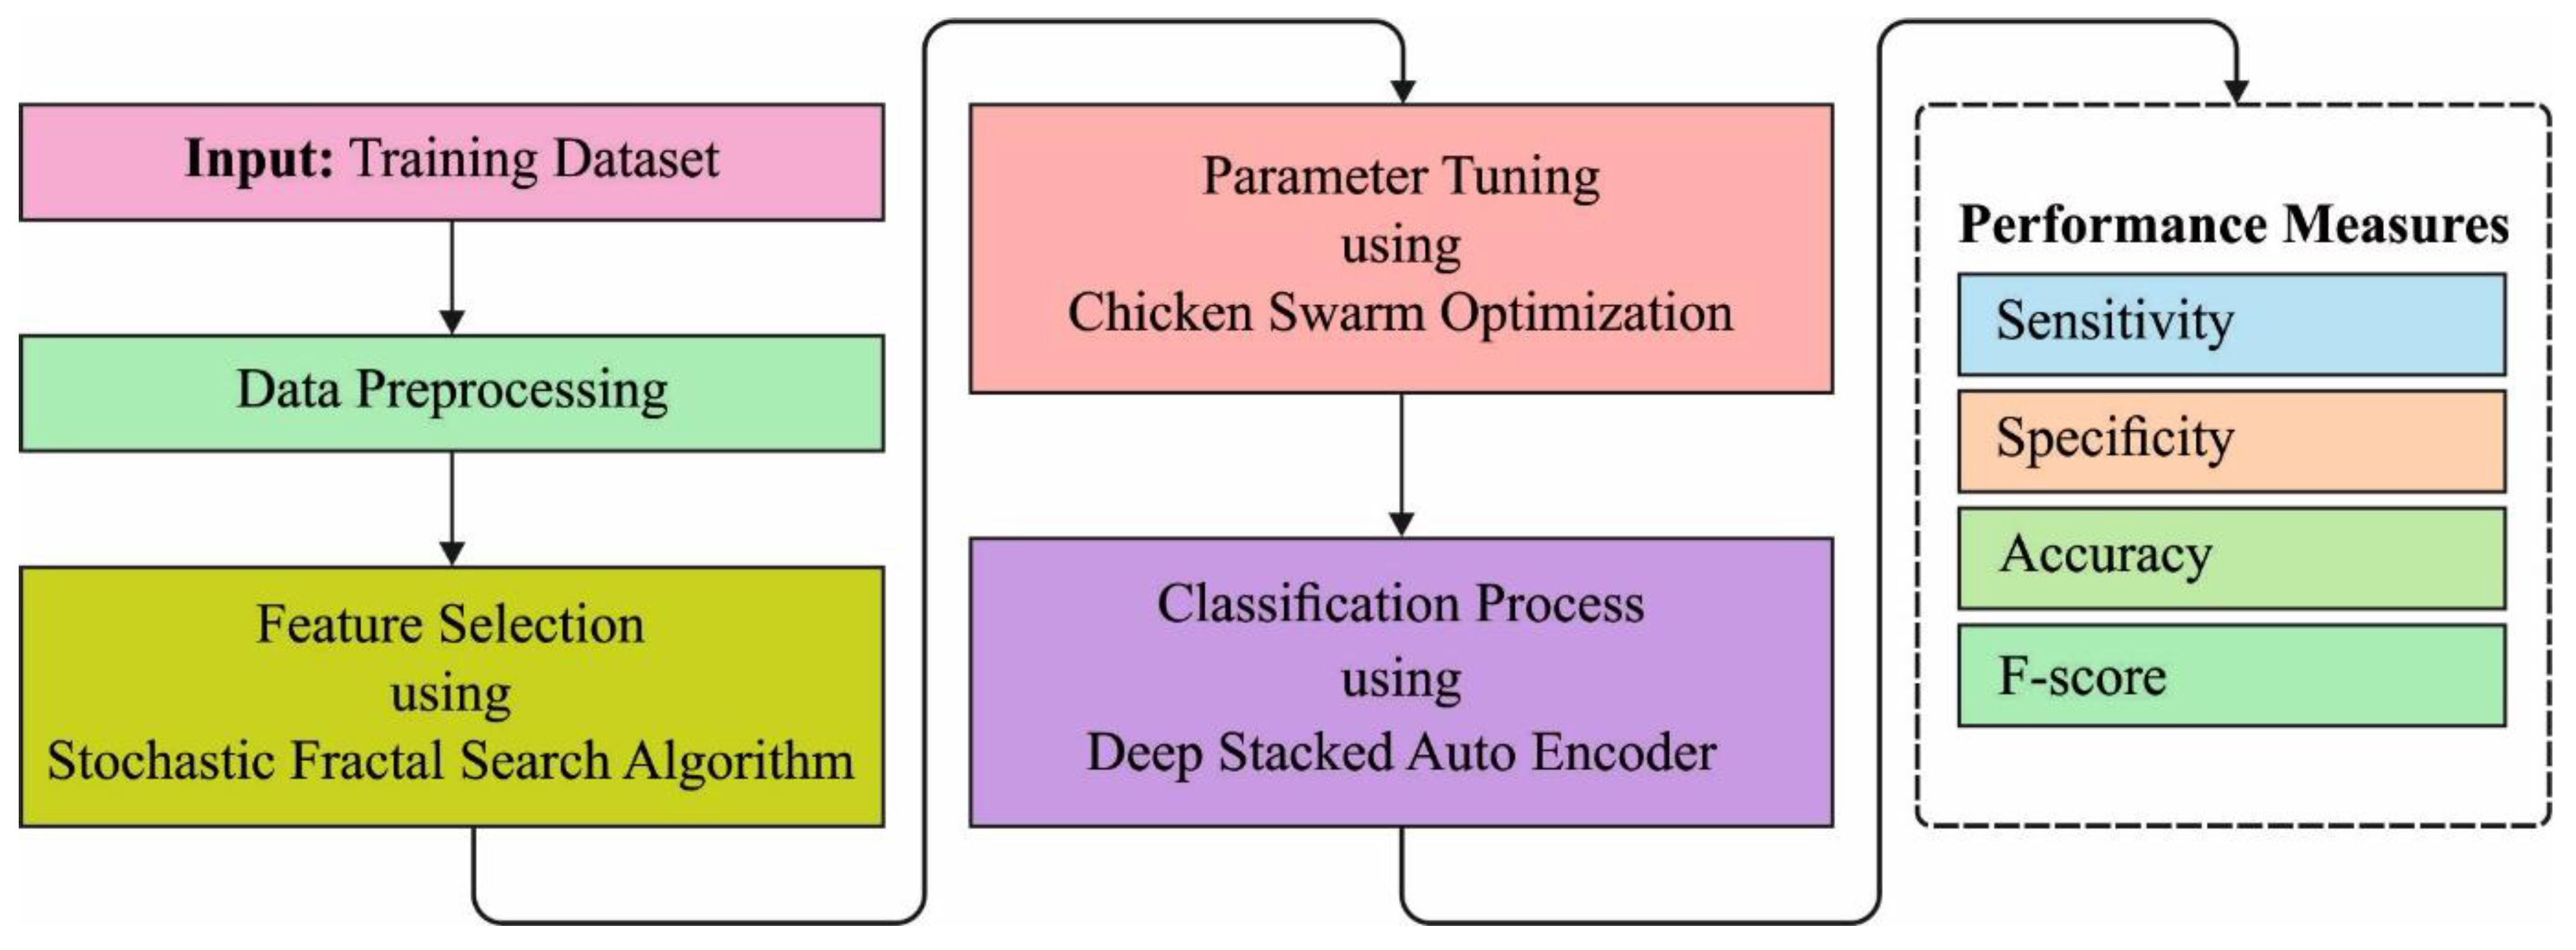
3. The Proposed Model
3.1. Data Pre-Processing
3.2. Feature Selection Using SFSA Technique
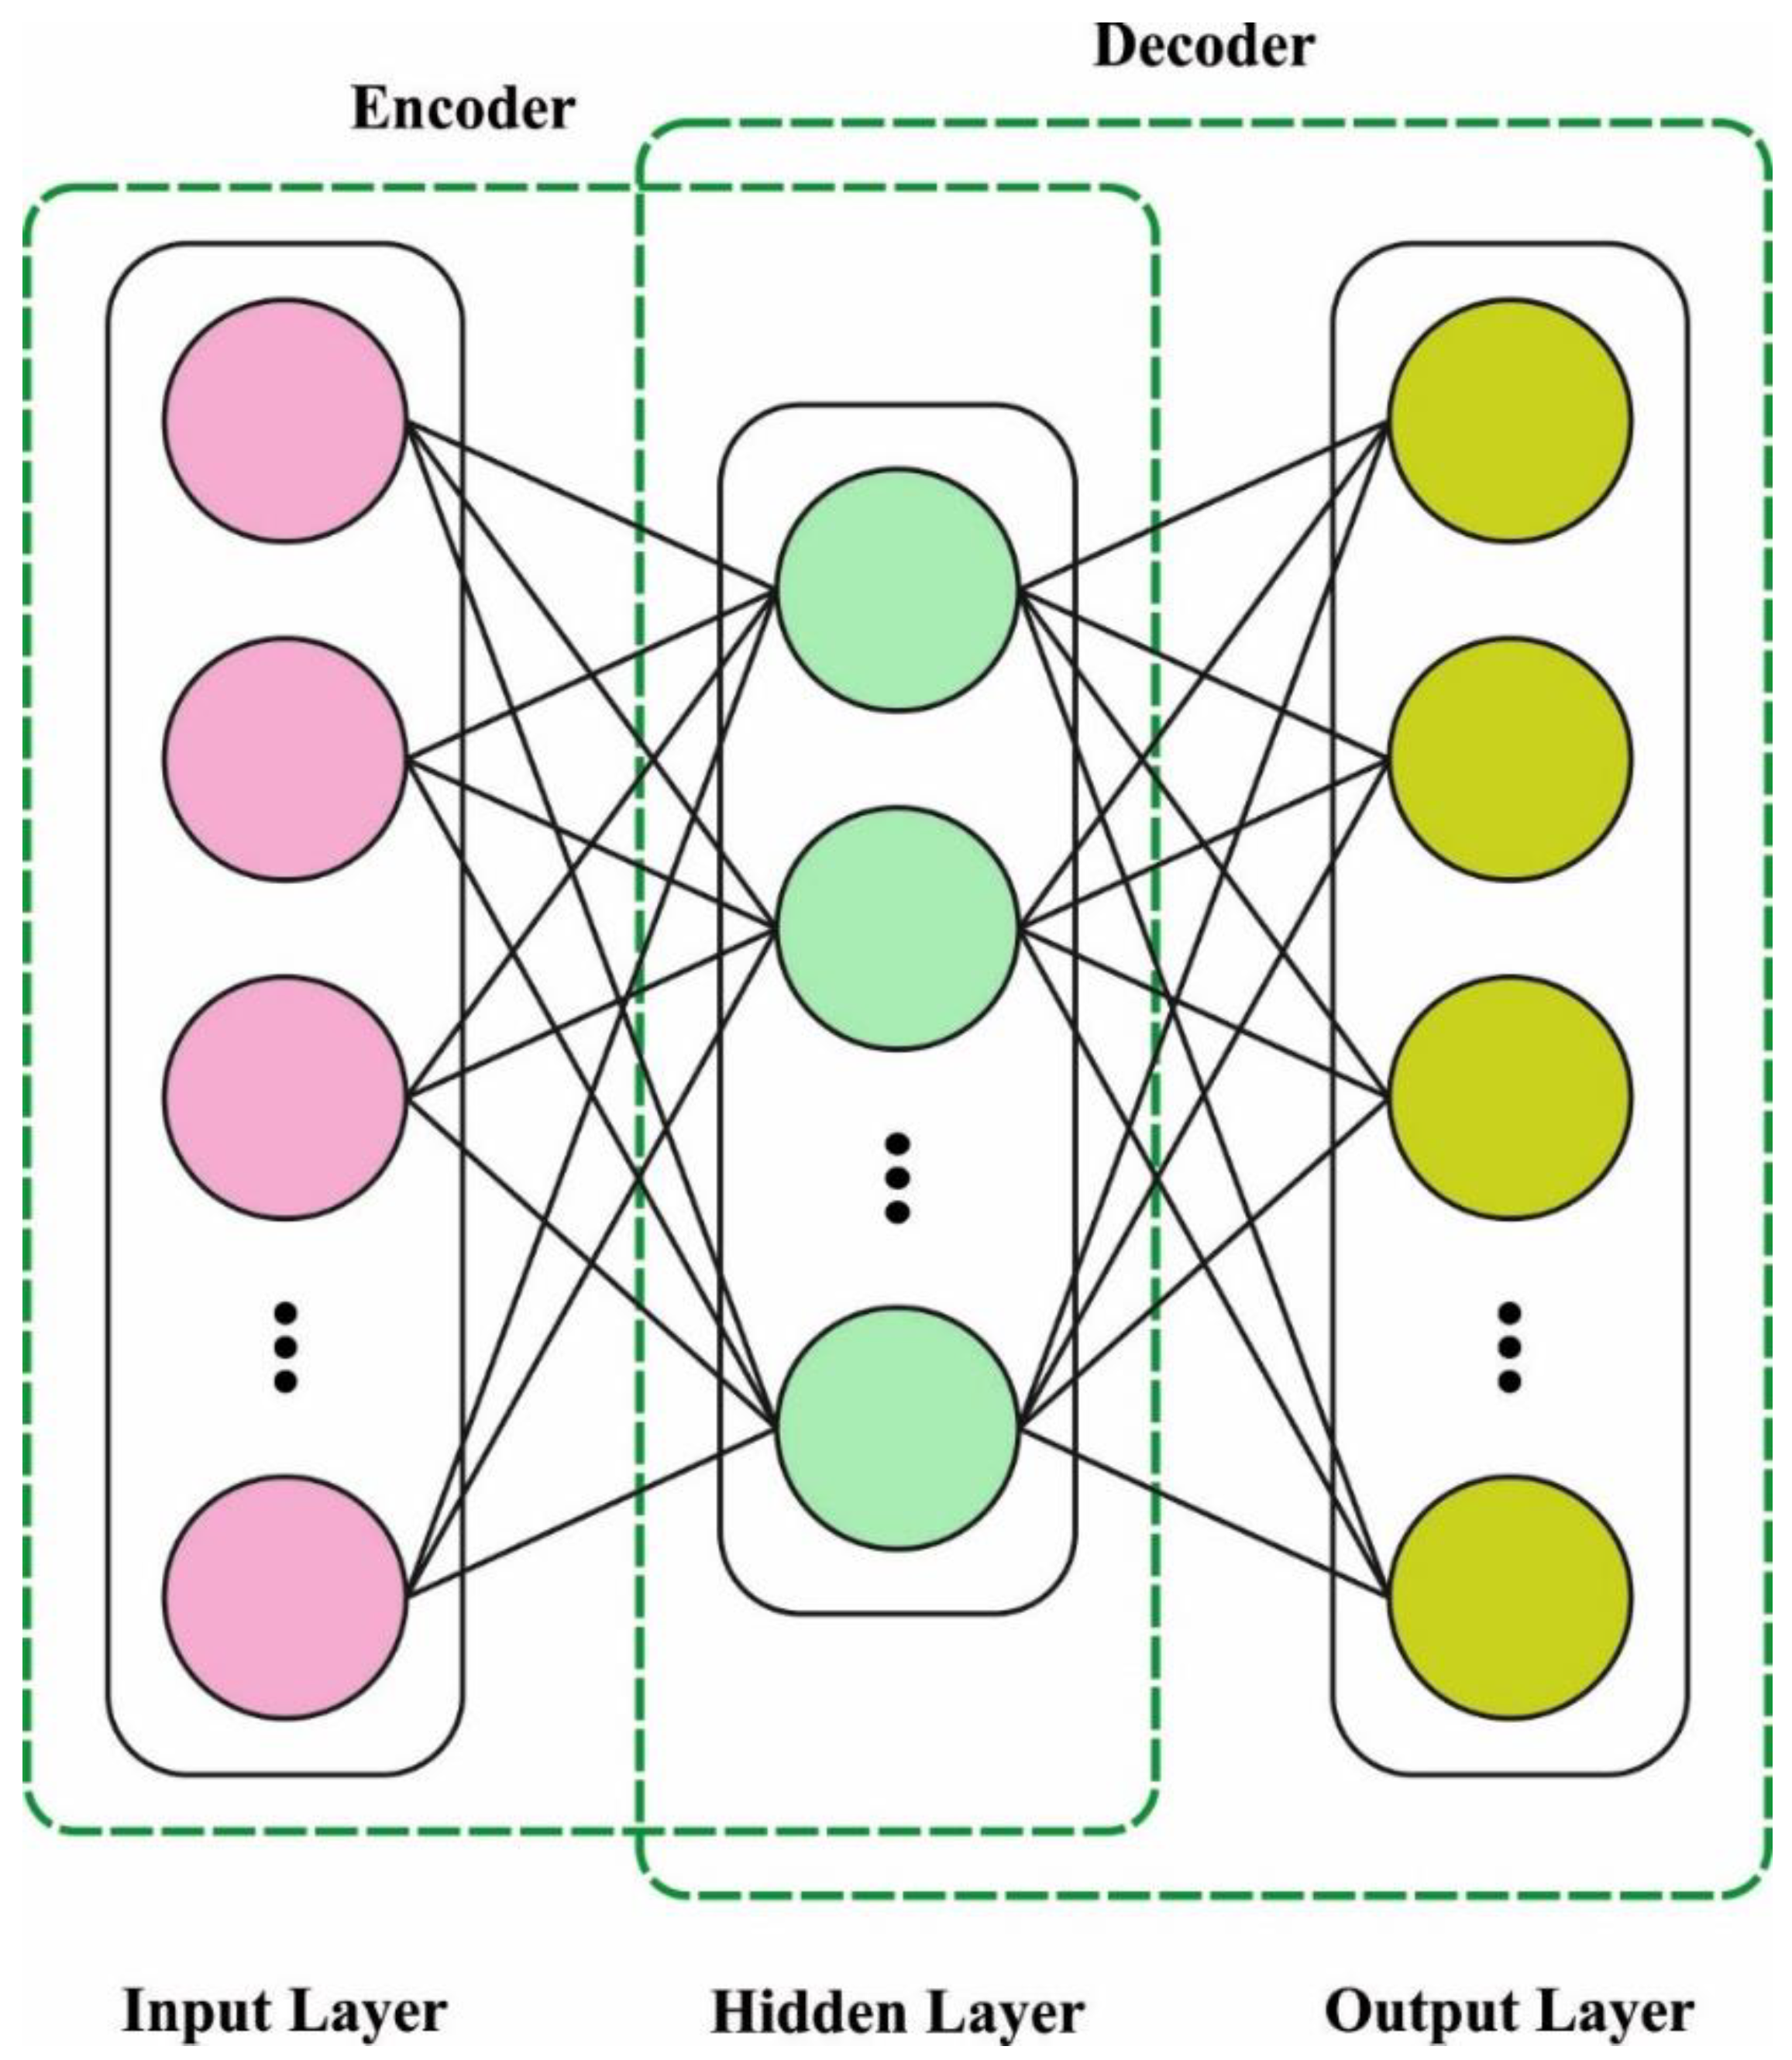
3.3. DSAE-Based Data Classification
3.4. Hyperparameter Tuning Using CSO Algorithm
- (1)
- The whole population contains many sub-populations, each of which comprises cock, amount of hens, and many chicks.
- (2)
- The fitness value (FV) of all the particles from the population was computed. The particle is classified depending upon the FV. Some particles with optimum FVs were chosen as cocks, some particles with worse FVs were chosen as chickens, and remaining particles were chosen as hens.
- (3)
- In specific hierarchy, the dominance connection and mother–child connection remained unaffected. However, as the chicks produced, the population connection was modified. The hierarchy control connection and maternal connection of chicken swarms were variations all the time.
- (4)
- The cock controls the flock, the hen follows the cock from its individual populations and the chick food was nearby the hens. The hen arbitrarily combines a subpopulation. The connection among mother as well as child from the flock was arbitrarily introduced. The cock with main searching range and an optimum searching capability was led from the flocks. The chick particle has the worse foraging capability and minimum foraging range. The foraging capability and searching range of hen particles were amongst cock as well as chick particles.
4. Results and Discussion
5. Conclusions
Author Contributions
Funding
Institutional Review Board Statement
Informed Consent Statement
Data Availability Statement
Conflicts of Interest
References
- Schneble, W.; Thamilarasu, G. Optimal feature selection for intrusion detection in medical cyber-physical systems. In Proceedings of the 2019 11th International Conference on Advanced Computing (ICoAC), Chennai, India, 18–20 December 2019; pp. 238–243. [Google Scholar]
- Wickramasinghe, C.S.; Marino, D.L.; Amarasinghe, K.; Manic, M. Generalization of deep learning for cyber-physical system security: A survey. In Proceedings of the IECON 2018—44th Annual Conference of the IEEE Industrial Electronics Society, Washington, DC, USA, 21–23 October 2018; pp. 745–751. [Google Scholar]
- Thakur, S.; Chakraborty, A.; De, R.; Kumar, N.; Sarkar, R. Intrusion detection in cyber-physical systems using a generic and domain specific deep autoencoder model. Comput. Electr. Eng. 2021, 91, 107044. [Google Scholar] [CrossRef]
- Teyou, D.; Kamdem, G.; Ziazet, J. Convolutional neural network for intrusion detection system in cyber physical systems. arXiv 2019, arXiv:1905.03168. [Google Scholar]
- Al-Qarafi, A.; Alrowais, F.; Alotaibi, S.S.; Nemri, N.; Al-Wesabi, F.N.; Al Duhayyim, M.; Marzouk, R.; Othman, M.; Al-Shabi, M. Optimal Machine Learning Based Privacy Preserving Blockchain Assisted Internet of Things with Smart Cities Environment. Appl. Sci. 2022, 12, 5893. [Google Scholar] [CrossRef]
- Panigrahi, R.; Borah, S.; Pramanik, M.; Bhoi, A.K.; Barsocchi, P.; Nayak, S.R.; Alnumay, W. Intrusion detection in cyber–physical environment using hybrid Naïve Bayes—Decision table and multi-objective evolutionary feature selection. Comput. Commun. 2022, 188, 133–144. [Google Scholar] [CrossRef]
- Albraikan, A.A.; Hassine, S.B.H.; Fati, S.M.; Al-Wesabi, F.N.; Hilal, A.M.; Motwakel, A.; Hamza, M.A.; Al Duhayyim, M. Optimal Deep Learning-based Cyberattack Detection and Classification Technique on Social Networks. Comput. Mater. Contin. 2022, 72, 907–923. [Google Scholar]
- Yadav, S.; Kalpana, R. A Survey on Network Intrusion Detection Using Deep Generative Networks for Cyber-Physical Systems. In Artificial Intelligence Paradigms for Smart Cyber-Physical Systems; Springer: Berlin/Heidelberg, Germany, 2021; pp. 137–159. [Google Scholar]
- Alohali, M.A.; Al-Wesabi, F.N.; Hilal, A.M.; Goel, S.; Gupta, D.; Khanna, A. Artificial intelligence enabled intrusion detection systems for cognitive cyber-physical systems in industry 4.0 environment. Cogn. Neurodyn. 2022. [Google Scholar] [CrossRef]
- Maleh, Y. Machine learning techniques for IoT intrusions detection in aerospace cyber-physical systems. In Machine Learning and Data Mining in Aerospace Technology; Springer: Cham, Switzerland, 2020; pp. 205–232. [Google Scholar]
- Jamal, A.A.; Majid, A.-A.M.; Konev, A.; Kosachenko, T.; Shelupanov, A. A review on security analysis of cyber physical systems using Machine learning. Mater. Today Proc. 2021. [Google Scholar] [CrossRef]
- Sharma, M.; Elmiligi, H.; Gebali, F. A Novel Intrusion Detection System for RPL-Based Cyber–Physical Systems. IEEE Can. J. Electr. Comput. Eng. 2021, 44, 246–252. [Google Scholar] [CrossRef]
- Alkayem, N.F.; Shen, L.; Asteris, P.G.; Sokol, M.; Xin, Z.; Cao, M. A new self-adaptive quasi-oppositional stochastic fractal search for the inverse problem of structural damage assessment. Alex. Eng. J. 2021, 61, 1922–1936. [Google Scholar] [CrossRef]
- Li, B.; Wu, Y.; Song, J.; Lu, R.; Li, T.; Zhao, L. DeepFed: Federated Deep Learning for Intrusion Detection in Industrial Cyber–Physical Systems. IEEE Trans. Ind. Inform. 2020, 17, 5615–5624. [Google Scholar] [CrossRef]
- de Araujo-Filho, P.F.; Kaddoum, G.; Campelo, D.R.; Santos, A.G.; Macedo, D.; Zanchettin, C. Intrusion Detection for Cyber–Physical Systems Using Generative Adversarial Networks in Fog Environment. IEEE Internet Things J. 2020, 8, 6247–6256. [Google Scholar] [CrossRef]
- Althobaiti, M.M.; Kumar, K.P.M.; Gupta, D.; Kumar, S.; Mansour, R.F. An intelligent cognitive computing based intrusion detection for industrial cyber-physical systems. Measurement 2021, 186, 110145. [Google Scholar] [CrossRef]
- Gao, Y.; Chen, J.; Miao, H.; Song, B.; Lu, Y.; Pan, W. Self-Learning Spatial Distribution-Based Intrusion Detection for Industrial Cyber-Physical Systems. IEEE Trans. Comput. Soc. Syst. 2022, 1–10. [Google Scholar] [CrossRef]
- Ibor, A.E.; Okunoye, O.B.; Oladeji, F.A.; Abdulsalam, K.A. Novel Hybrid Model for Intrusion Prediction on Cyber Physical Systems’ Communication Networks based on Bio-inspired Deep Neural Network Structure. J. Inf. Secur. Appl. 2022, 65, 103107. [Google Scholar] [CrossRef]
- Kaddoura, S.; Arid, A.E.; Moukhtar, M. Evaluation of Supervised Machine Learning Algorithms for Multi-class Intrusion Detection Systems. In Proceedings of the Future Technologies Conference, Vancouver, BC, Canada, 28–29 October 2021; Springer: Cham, Switzerland, 2021; pp. 1–16. [Google Scholar]
- Quincozes, S.E.; Passos, D.; Albuquerque, C.; Mossé, D.; Ochi, L.S. An extended assessment of metaheuristics-based feature selection for intrusion detection in CPS perception layer. Ann. Telecommun. 2022, 1–15. [Google Scholar] [CrossRef]
- Nagarajan, S.M.; Deverajan, G.G.; Bashir, A.K.; Mahapatra, R.P.; Al-Numay, M.S. IADF-CPS: Intelligent Anomaly Detection Framework towards Cyber Physical Systems. Comput. Commun. 2022, 188, 81–89. [Google Scholar] [CrossRef]
- Wang, Z.; Li, Z.; He, D.; Chan, S. A lightweight approach for network intrusion detection in industrial cyber-physical systems based on knowledge distillation and deep metric learning. Expert Syst. Appl. 2022, 206, 117671. [Google Scholar] [CrossRef]
- Çelik, E. Improved stochastic fractal search algorithm and modified cost function for automatic generation control of interconnected electric power systems. Eng. Appl. Artif. Intell. 2020, 88, 103407. [Google Scholar] [CrossRef]
- Adem, K. Diagnosis of breast cancer with Stacked autoencoder and Subspace kNN. Phys. A Stat. Mech. Appl. 2020, 551, 124591. [Google Scholar] [CrossRef]
- Meng, X.; Liu, Y.; Gao, X.; Zhang, H. A new bio-inspired algorithm: Chicken swarm optimization. Adv. Swarm Intell. 2014, 5, 86–94. [Google Scholar]
- Fu, C.; Li, G.-Q.; Lin, K.-P.; Zhang, H.-J. Short-Term Wind Power Prediction Based on Improved Chicken Algorithm Optimization Support Vector Machine. Sustainability 2019, 11, 512. [Google Scholar] [CrossRef] [Green Version]
- NSL-KDD Dataset. Available online: https://www.unb.ca/cic/datasets/nsl.html (accessed on 4 June 2022).
- CICIDS 2017 Dataset. Available online: https://www.unb.ca/cic/datasets/ids-2017.html (accessed on 4 June 2022).


| Class | No. of Samples | |
|---|---|---|
| NSLKDD 2015 | CICIDS 2017 | |
| Normal | 67,343 | 50,000 |
| Anomaly | 58,630 | 50,000 |
| Total | 125,973 | 100,000 |
| Class Labels | Accuracy | Precision | Recall | F-Score |
|---|---|---|---|---|
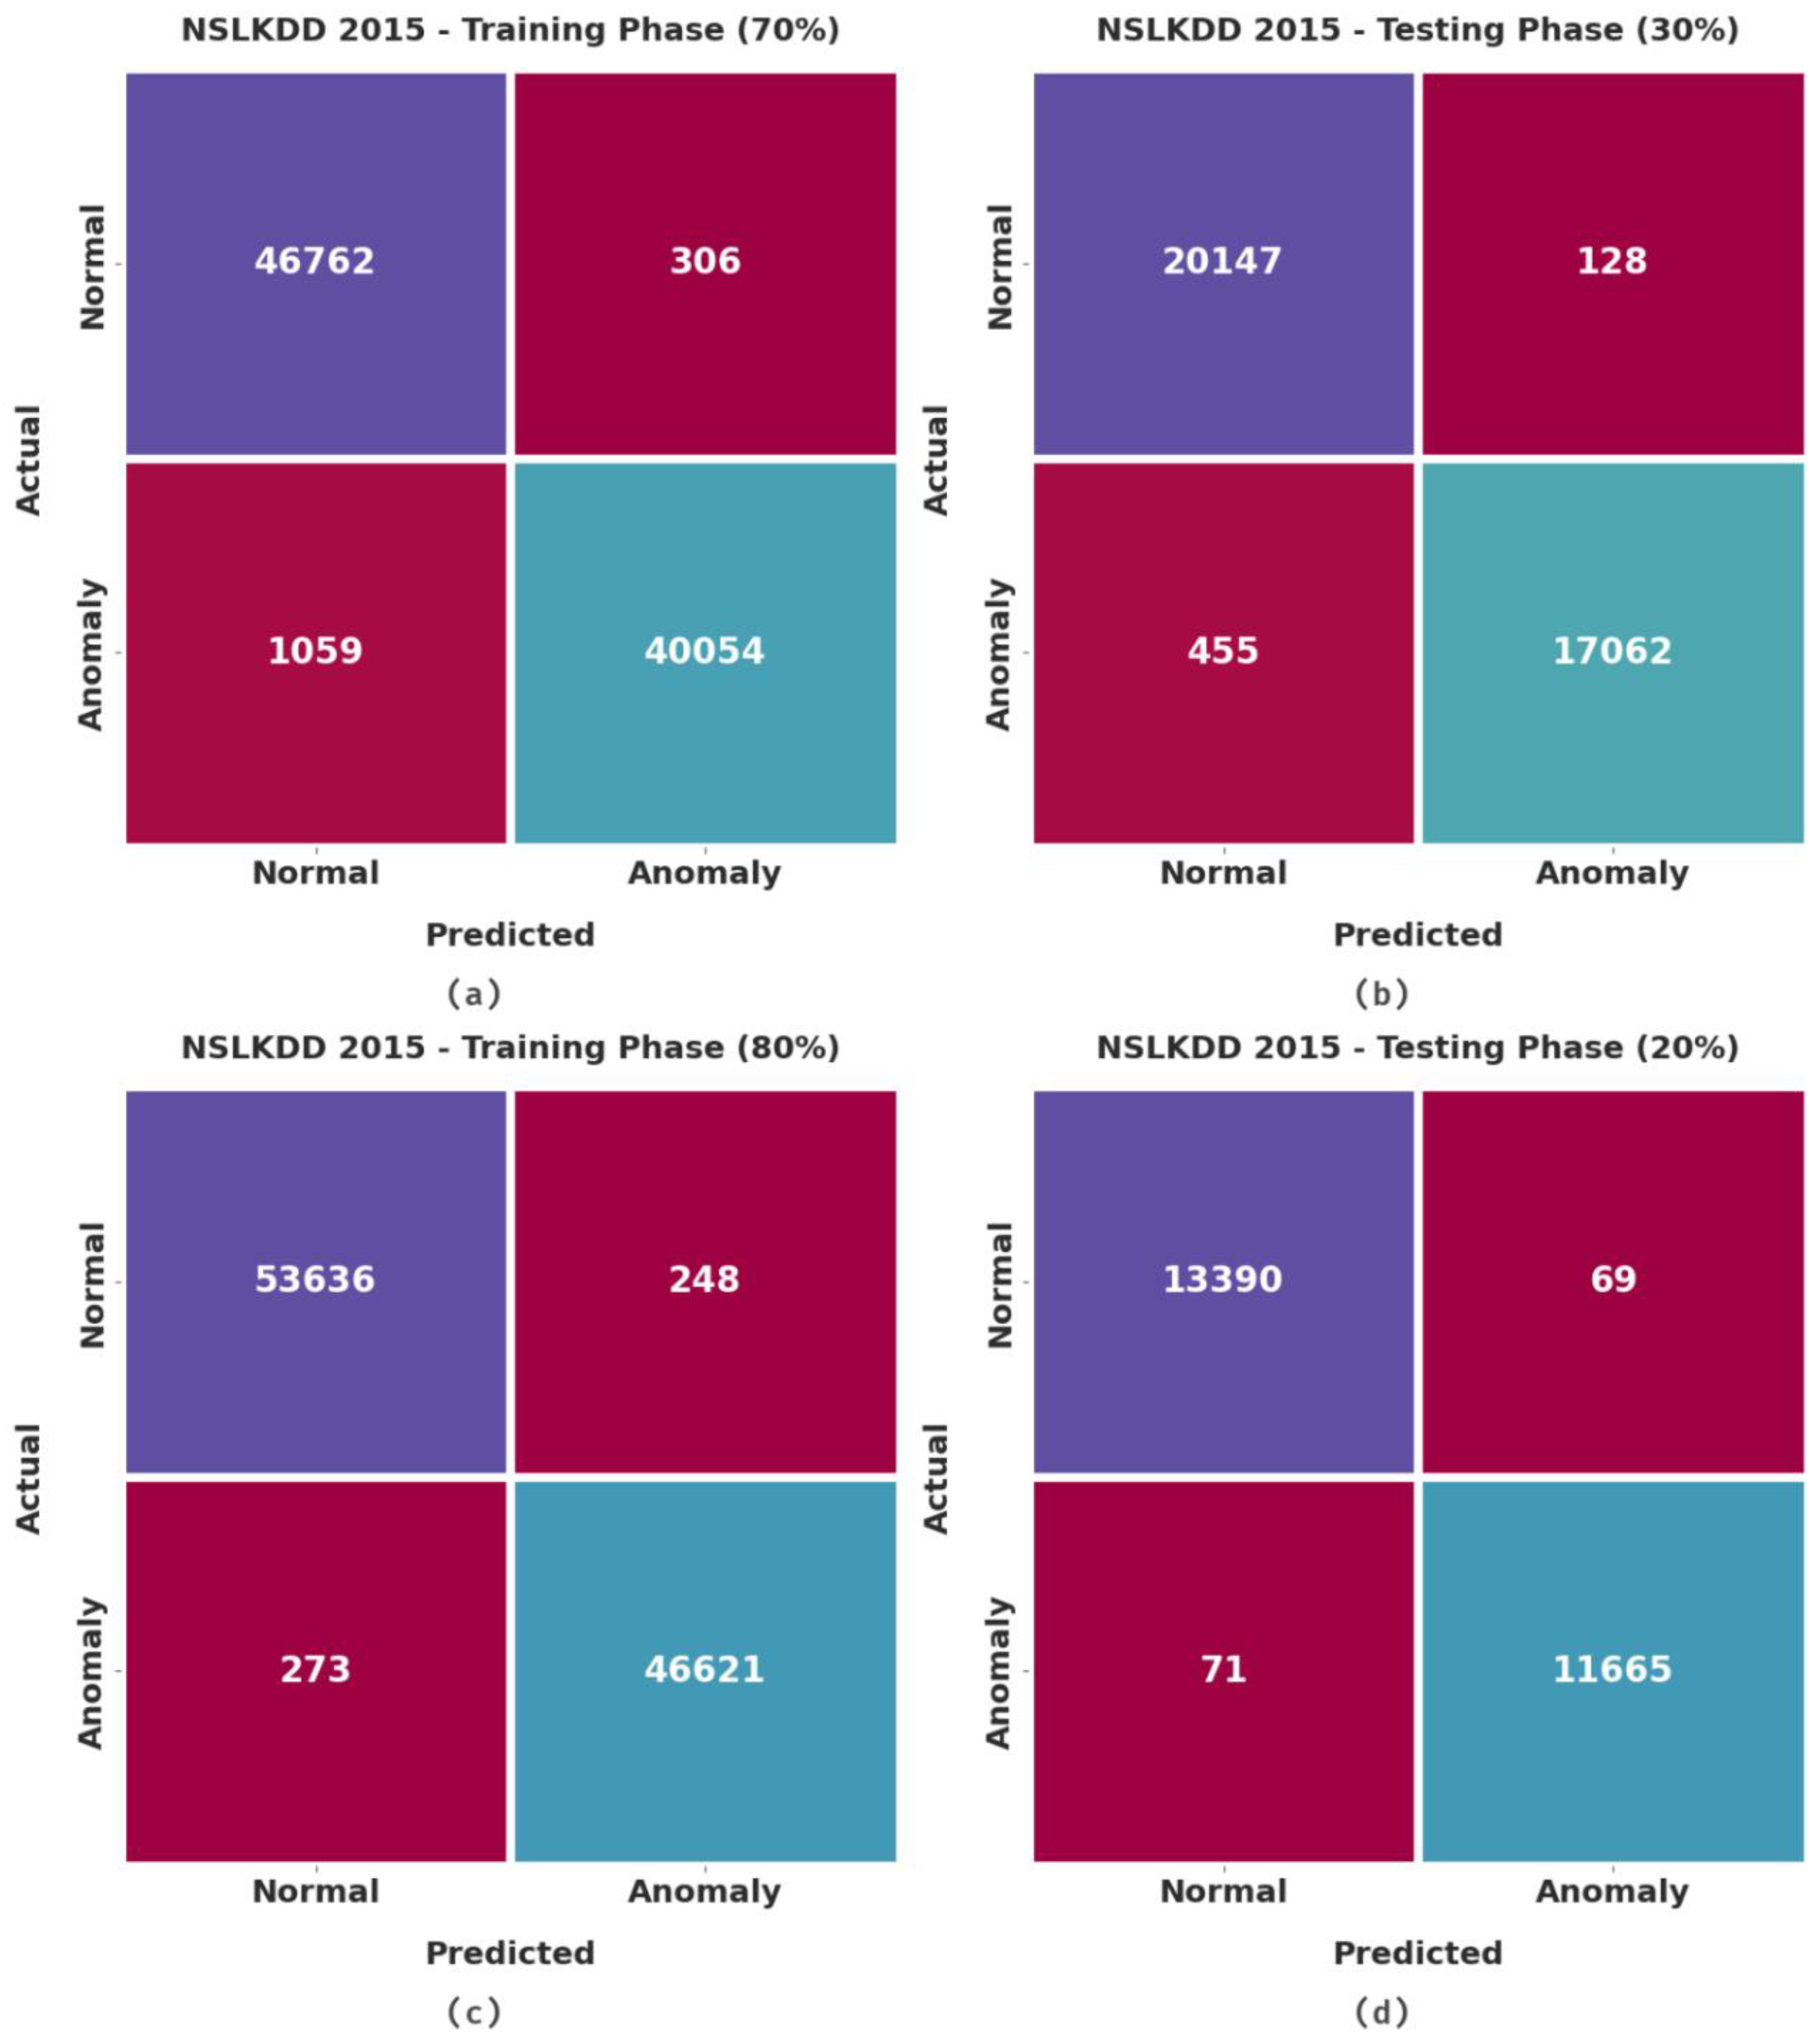
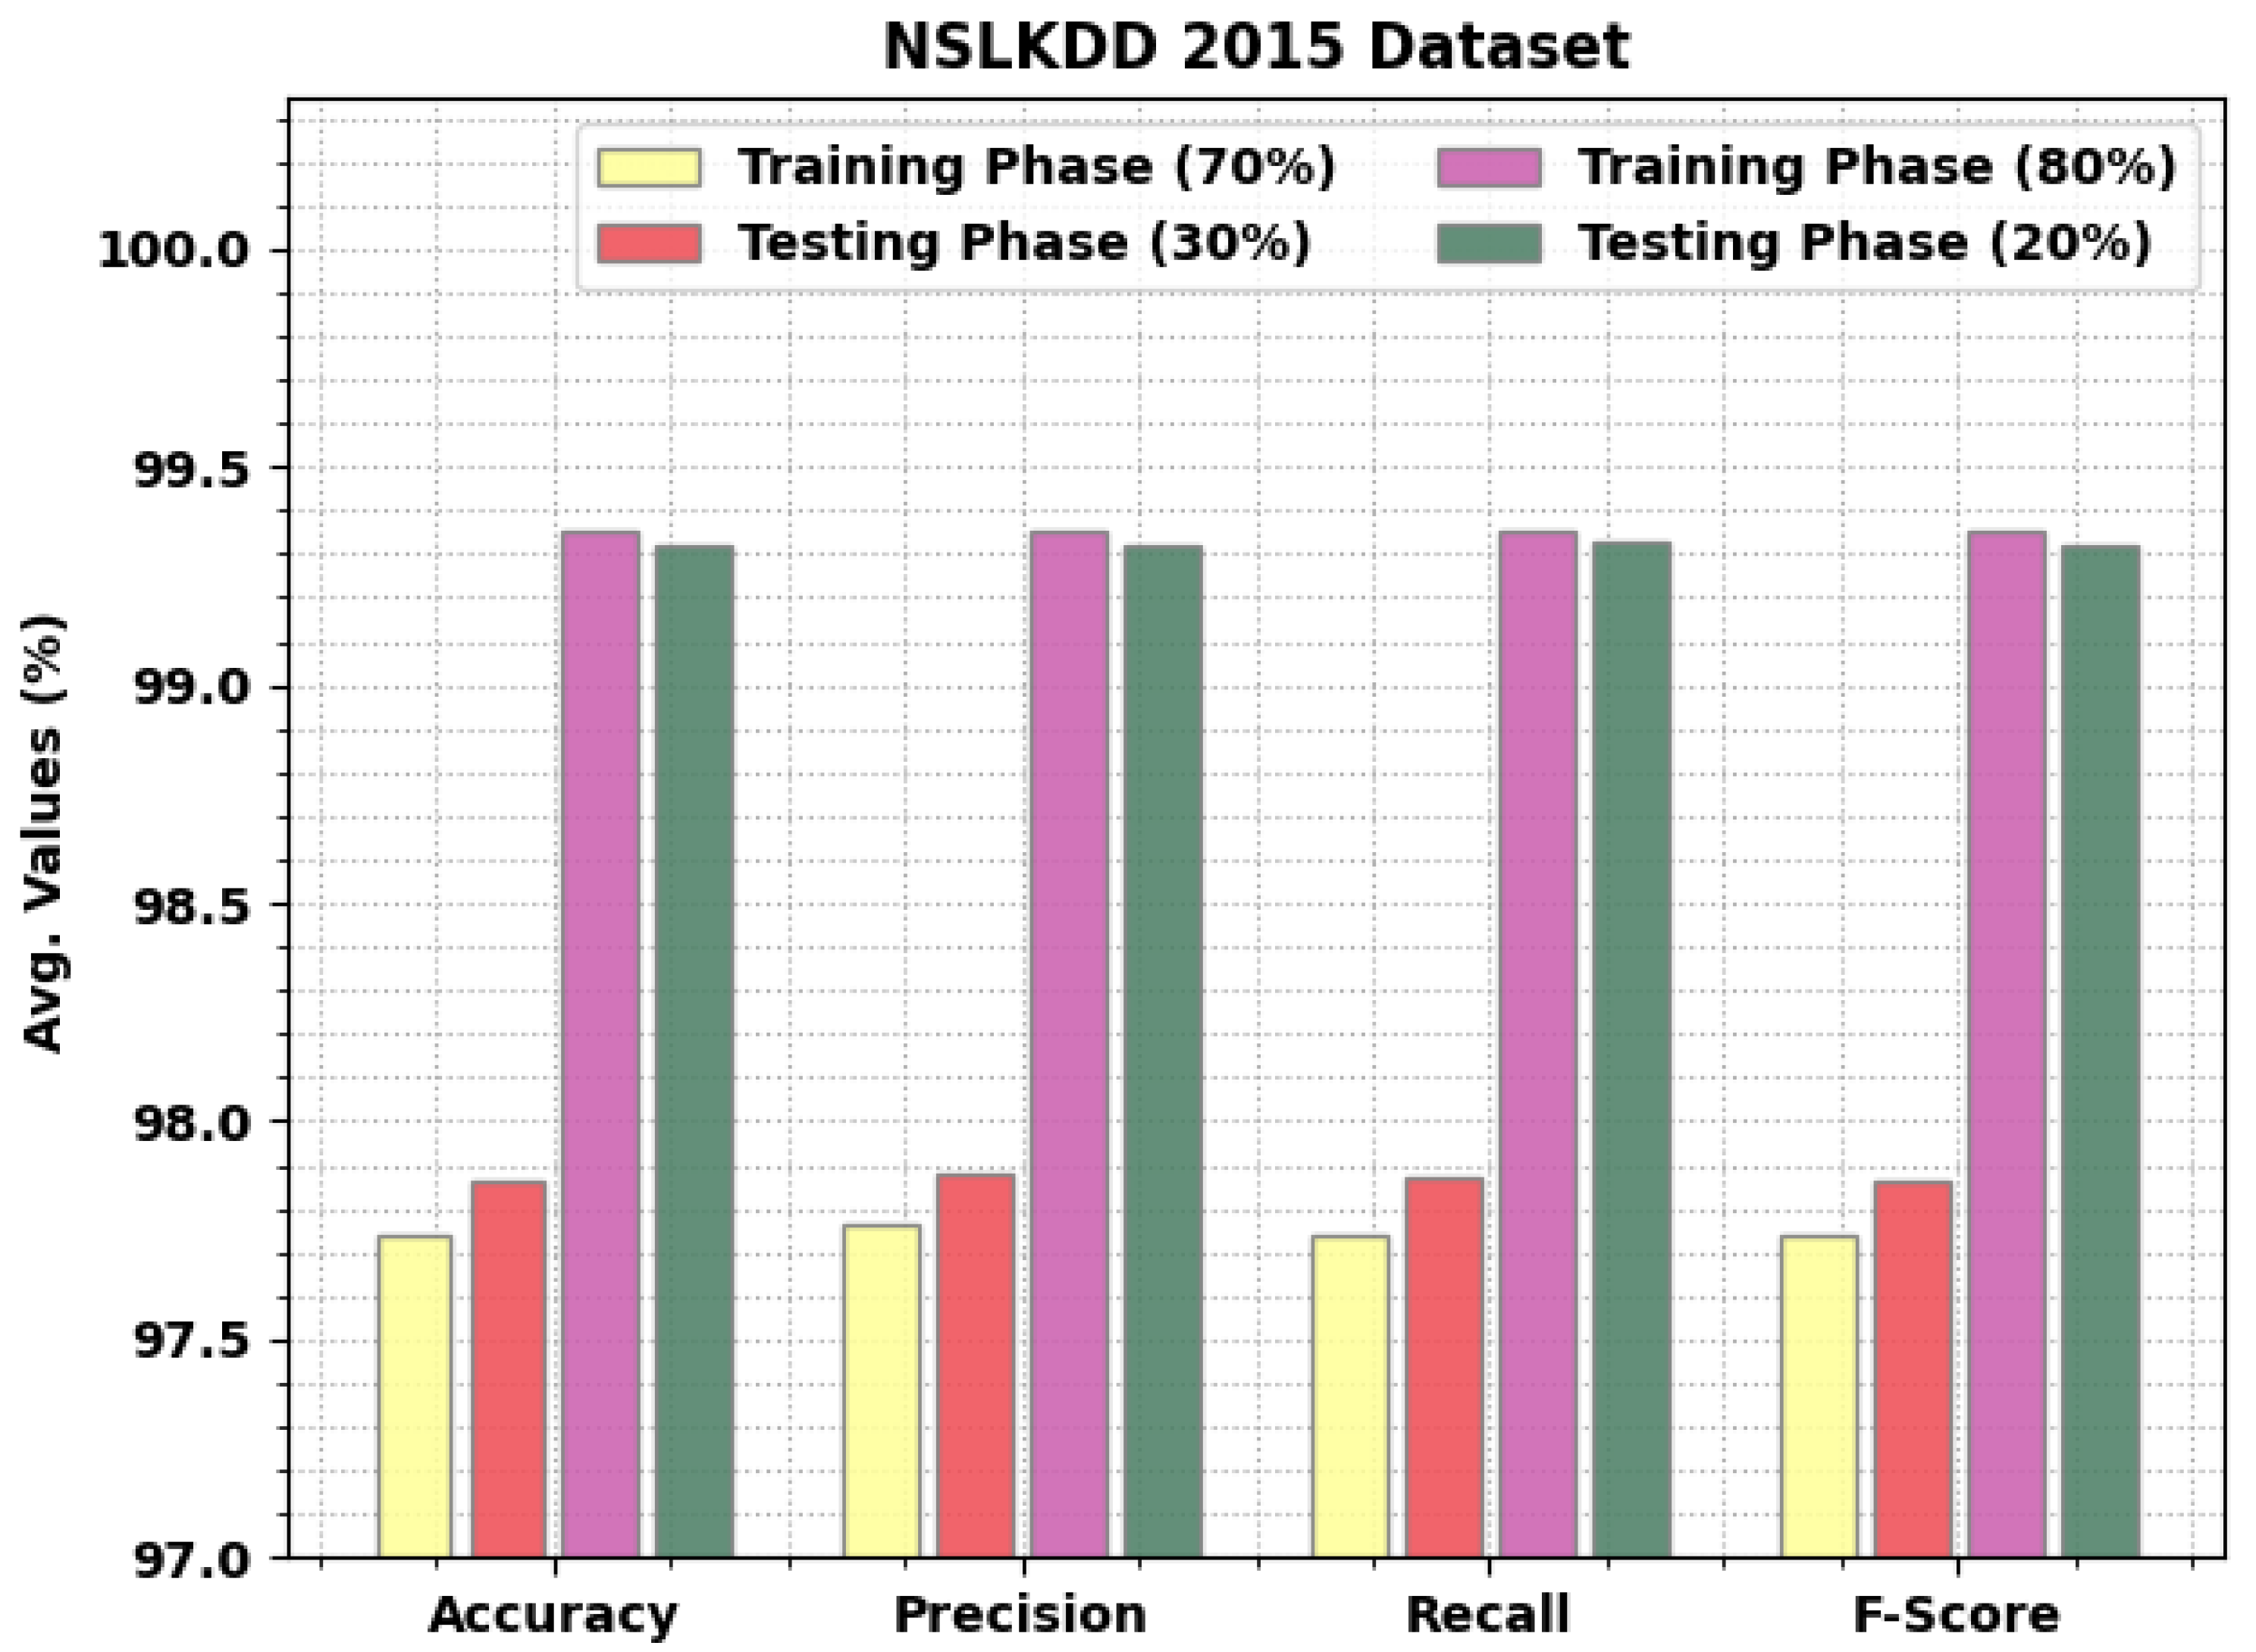
| Training Phase (70%) | ||||
| Normal | 97.74 | 98.76 | 96.67 | 97.71 |
| Anomaly | 97.74 | 96.76 | 98.80 | 97.77 |
| Average | 97.74 | 97.76 | 97.74 | 97.74 |
| Testing Phase (30%) | ||||
| Normal | 97.86 | 98.94 | 96.79 | 97.85 |
| Anomaly | 97.86 | 96.82 | 98.95 | 97.87 |
| Average | 97.86 | 97.88 | 97.87 | 97.86 |
| Training Phase (80%) | ||||
| Normal | 99.35 | 99.34 | 99.36 | 99.35 |
| Anomaly | 99.35 | 99.37 | 99.34 | 99.35 |
| Average | 99.35 | 99.35 | 99.35 | 99.35 |
| Testing Phase (20%) | ||||
| Normal | 99.32 | 99.39 | 99.28 | 99.33 |
| Anomaly | 99.32 | 99.26 | 99.37 | 99.32 |
| Average | 99.32 | 99.32 | 99.33 | 99.32 |
| Class Labels | Accuracy | Precision | Recall | F-Score |
|---|---|---|---|---|
| Training Phase (70%) | ||||
| Normal | 98.45 | 97.79 | 99.35 | 98.56 |
| Anomaly | 98.45 | 99.24 | 97.42 | 98.32 |
| Average | 98.45 | 98.51 | 98.39 | 98.44 |
| Testing Phase (30%) | ||||
| Normal | 98.46 | 97.79 | 99.37 | 98.57 |
| Anomaly | 98.46 | 99.26 | 97.40 | 98.32 |
| Average | 98.46 | 98.52 | 98.39 | 98.45 |
| Training Phase (80%) | ||||
| Normal | 99.48 | 99.49 | 99.54 | 99.52 |
| Anomaly | 99.48 | 99.47 | 99.42 | 99.44 |
| Average | 99.48 | 99.48 | 99.48 | 99.48 |
| Testing Phase (20%) | ||||
| Normal | 99.44 | 99.47 | 99.49 | 99.48 |
| Anomaly | 99.44 | 99.41 | 99.40 | 99.40 |
| Average | 99.44 | 99.44 | 99.44 | 99.44 |
| Methods | Accuracy | Precision | Recall | F1-Score |
|---|---|---|---|---|
| SFSA-DLIDS | 99.44 | 99.44 | 99.44 | 99.44 |
| GSAE | 97.44 | 96.44 | 98.79 | 97.74 |
| AE-RF | 97.55 | 97.08 | 98.15 | 97.66 |
| WISARD | 96.22 | 97.27 | 96.85 | 98.75 |
| Forest-PA | 96.53 | 96.99 | 96.85 | 97.88 |
| LIB-SVM | 96.56 | 97.38 | 97.32 | 97.75 |
| FURIA | 98.82 | 97.83 | 96.94 | 98.55 |
Publisher’s Note: MDPI stays neutral with regard to jurisdictional claims in published maps and institutional affiliations. |
© 2022 by the authors. Licensee MDPI, Basel, Switzerland. This article is an open access article distributed under the terms and conditions of the Creative Commons Attribution (CC BY) license (https://creativecommons.org/licenses/by/4.0/).
Share and Cite
Duhayyim, M.A.; Alissa, K.A.; Alrayes, F.S.; Alotaibi, S.S.; Tag El Din, E.M.; Abdelmageed, A.A.; Yaseen, I.; Motwakel, A. Evolutionary-Based Deep Stacked Autoencoder for Intrusion Detection in a Cloud-Based Cyber-Physical System. Appl. Sci. 2022, 12, 6875. https://doi.org/10.3390/app12146875
Duhayyim MA, Alissa KA, Alrayes FS, Alotaibi SS, Tag El Din EM, Abdelmageed AA, Yaseen I, Motwakel A. Evolutionary-Based Deep Stacked Autoencoder for Intrusion Detection in a Cloud-Based Cyber-Physical System. Applied Sciences. 2022; 12(14):6875. https://doi.org/10.3390/app12146875
Chicago/Turabian StyleDuhayyim, Mesfer Al, Khalid A. Alissa, Fatma S. Alrayes, Saud S. Alotaibi, ElSayed M. Tag El Din, Amgad Atta Abdelmageed, Ishfaq Yaseen, and Abdelwahed Motwakel. 2022. "Evolutionary-Based Deep Stacked Autoencoder for Intrusion Detection in a Cloud-Based Cyber-Physical System" Applied Sciences 12, no. 14: 6875. https://doi.org/10.3390/app12146875