
Reliability and Validity of IMU-Based Foot Progression Angle Measurement under Different Gait Retraining Strategies


Abstract
:1. Introduction
2. Materials and Methods
2.1. Study Design
2.2. Participants
2.3. Procedures
2.3.1. Instrumentation
2.3.2. Assessment
2.3.3. Outcome Measures
2.4. Statistical Analysis
3. Results
3.1. Outcome Measures
3.2. Reliability
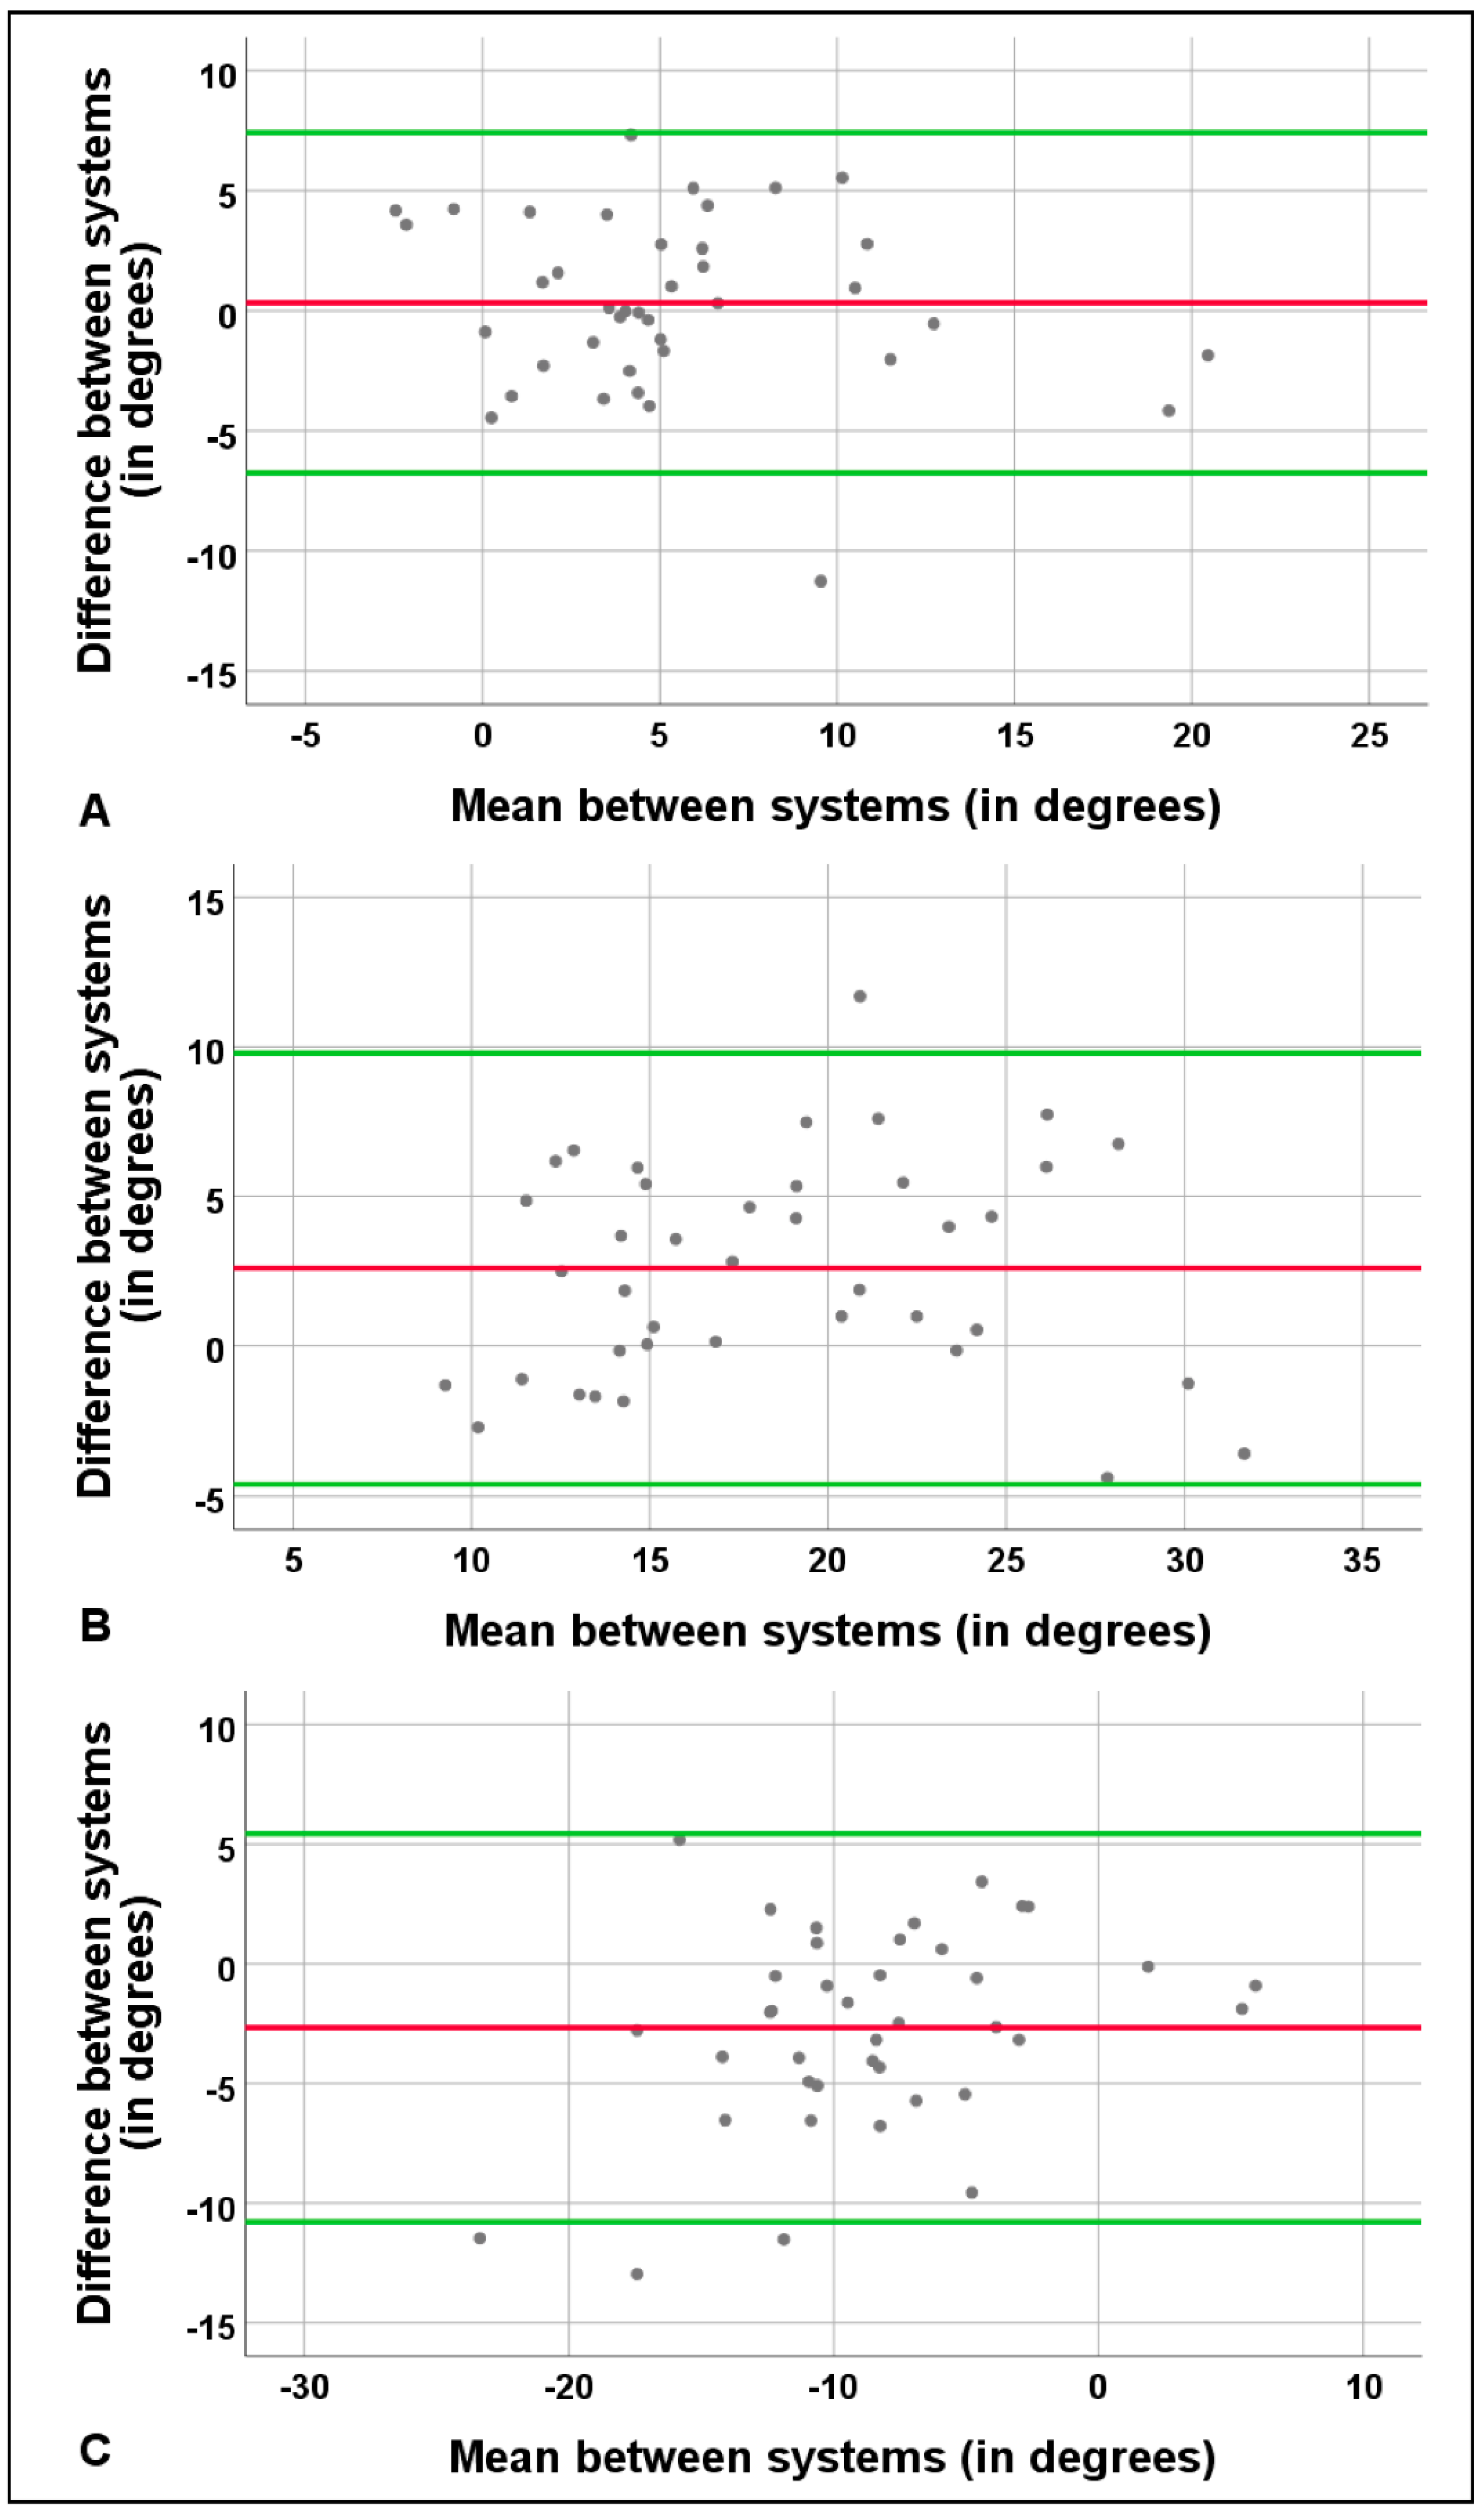
3.3. Validity
4. Discussion
4.1. Summary of the Main Findings
4.2. Outcome Measures
4.3. Reliability
4.4. Validity
4.5. Strengths and Limitations
4.6. Recommendations for Future Studies
5. Conclusions
Author Contributions
Funding
Institutional Review Board Statement
Informed Consent Statement
Data Availability Statement
Conflicts of Interest
References
- Simic, M.; Hinman, R.; Wrigley, T.; Bennell, K.; Hunt, M.A. Gait modification strategies for altering medial knee joint load: A systematic review. Arthritis Care Res. 2010, 63, 405–426. [Google Scholar] [CrossRef] [PubMed]
- Simic, M.; Wrigley, T.; Hinman, R.; Hunt, M.; Bennell, K. Altering foot progression angle in people with medial knee osteoarthritis: The effects of varying toe-in and toe-out angles are mediated by pain and malalignment. Osteoarthr. Cartil. 2013, 21, 1272–1280. [Google Scholar] [CrossRef] [PubMed] [Green Version]
- Shull, P.B.; Silder, A.; Shultz, R.; Dragoo, J.L.; Besier, T.F.; Delp, S.L.; Cutkosky, M.R. Six-week gait retraining program reduces knee adduction moment, reduces pain, and improves function for individuals with medial compartment knee osteoarthritis. J. Orthop. Res. 2013, 31, 1020–1025. [Google Scholar] [CrossRef] [PubMed]
- McGinley, J.L.; Baker, R.; Wolfe, R.; Morris, M.E. The reliability of three-dimensional kinematic gait measurements: A systematic review. Gait Posture 2009, 29, 360–369. [Google Scholar] [CrossRef] [PubMed]
- Parrington, L.; Jehu, D.A.; Fino, P.C.; Pearson, S.; El-Gohary, M.; King, L.A. Validation of an Inertial Sensor Algorithm to Quantify Head and Trunk Movement in Healthy Young Adults and Individuals with Mild Traumatic Brain Injury. Sensors 2018, 18, 4501. [Google Scholar] [CrossRef] [PubMed] [Green Version]
- McDonough, A.L.; Batavia, M.; Chen, F.C.; Kwon, S.; Ziai, J. The validity and reliability of the GAITRite system’s measurements: A preliminary evaluation. Arch. Phys. Med. Rehabil. 2001, 82, 419–425. [Google Scholar] [CrossRef] [Green Version]
- Karatsidis, A.; Richards, R.E.; Konrath, J.M.; van den Noort, J.C.; Schepers, H.M.; Bellusci, G.; Harlaar, J.; Veltink, P.H. Validation of wearable visual feedback for retraining foot progression angle using inertial sensors and an augmented reality headset. J. Neuroeng. Rehabil. 2018, 15, 78. [Google Scholar] [CrossRef]
- Menz, H.B.; Latt, M.D.; Tiedemann, A.; Mun San Kwan, M.; Lord, S.R. Reliability of the GAITRite® walkway system for the quantification of temporo-spatial parameters of gait in young and older people. Gait Posture 2004, 20, 20–25. [Google Scholar] [CrossRef]
- Walter, S.D.; Eliasziw, M.; Donner, A. Sample size and optimal designs for reliability studies. Stat. Med. 1998, 17, 101–110. [Google Scholar] [CrossRef]
- APDM Wearable Technologies. Moveo Explorer: User Guide; APDM Wearable Technologies Inc.: Portland, OR, USA, 2018; Available online: https://share.apdm.com/documentation/MoveoExplorerUserGuide.pdf (accessed on 15 April 2019).
- Moveo Explorer, Version 1. Computer Software. APDM Wearable Technologies Inc.: Portland, OR, USA, 2018.
- ProtoKinetics. ProtoKinetics Movement Analysis Software: Measurements and Definitions; ProtoKinetics, LLC: Havertown, PA, USA, 2011–2013. [Google Scholar]
- Shirley Ryan AbilityLab. Statistical Terms & Use: Terms & Definitions. 2016. Available online: https://www.sralab.org/statistical-terms-use (accessed on 28 September 2020).
- Thomas, E.L.; Frost, G.; Taylor-Robinson, S.D.; Bell, J.D. Excess body fat in obese and normal-weight subjects. Nutr. Res. Rev. 2012, 25, 150–161. [Google Scholar] [CrossRef] [Green Version]
- Portney, L.G.; Watkins, M.P. Responsiveness to change. In Foundations of Clinical Research: Applications to Practice, 2nd ed.; Prentice Hall Health: Upper Saddle River, NJ, USA, 2000; pp. 103–105. [Google Scholar]
- Brehm, M.-A.; Scholtes, V.A.; Dallmeijer, A.J.; Twisk, J.W.; Harlaar, J. The importance of addressing heteroscedasticity in the reliability analysis of ratio-scaled variables: An example based on walking energy-cost measurements. Dev. Med. Child Neurol. 2011, 54, 267–273. [Google Scholar] [CrossRef]
- Nevill, A.M.; Atkinson, G. Assessing agreement between measurements recorded on a ratio scale in sports medicine and sports science. Br. J. Sports Med. 1997, 31, 314–318. [Google Scholar] [CrossRef] [PubMed] [Green Version]
- Richards, R.E.; Noort, J.C.V.D.; van der Esch, M.; Booij, M.J.; Harlaar, J. Effect of real-time biofeedback on peak knee adduction moment in patients with medial knee osteoarthritis: Is direct feedback effective? Clin. Biomech. 2018, 57, 150–158. [Google Scholar] [CrossRef] [PubMed]
- Van Uden, C.J.T.; Besser, M.P. Test-retest reliability of temporal and spatial gait characteristics measured with an instrumented walkway system (GAITRite®). BMC Musculoskelet. Disord. 2004, 5, 13. [Google Scholar] [CrossRef] [PubMed]
- Wouda, F.J.; Jaspar, S.L.J.O.; Harlaar, J.; van Beijnum, B.-J.F.; Veltink, P.H. Foot progression angle estimation using a single foot-worn inertial sensor. J. Neuroeng. Rehabil. 2021, 18, 37. [Google Scholar] [CrossRef] [PubMed]
- Morris, R.; Stuart, S.; McBarron, G.; Fino, P.C.; Mancini, M.; Curtze, C. Validity of Mobility Lab (version 2) for gait assessment in young adults, older adults and Parkinson’s disease. Physiol. Meas. 2019, 40, 095003. [Google Scholar] [CrossRef] [PubMed]
- Xia, H.; Charlton, J.M.; Shull, P.B.; Hunt, M.A. Portable, automated foot progression angle gait modification via a proof-of-concept haptic feedback-sensorized shoe. J. Biomech. 2020, 107, 109789. [Google Scholar] [CrossRef] [PubMed]


| Number of Sensors | Positioning | Description of Position |
|---|---|---|
| 1 | Lumbar | Centered on the low back, at the base of the spine. Superior aspect of the posterior sacral surface. |
| 2 | Upper leg | Lateral aspect of thigh, midline right over the iliotibial band, between the muscular tissue, one hand’s width above the knee. |
| 2 | Lower leg | Medial to the front of the tibia, on the flat surface of the bone, high enough for the strap to wrap just above the widest part of the calf muscle. |
| 2 | Foot | Centered on top of the foot, aligned with the second metatarsal. |
| Instrument | Variable | Baseline | Toe-Out Gait | Toe-In Gait |
|---|---|---|---|---|
| IMUs | Mean FPA ± SD | 5.6 ± 4.9 | 19.9 ± 6.3 | −9.9 ± 6.8 |
| (95% CI) | (4.0: 7.1) | (17.9: 21.9) | (−12.1: −7.7) | |
| Min; Max | −2.0; 19.5 | 8.6; 31.5 | −29.1; 5.5 | |
| PSW | Mean FPA ± SD | 5.2 ± 5.5 | 17.3 ± 6.0 | −7.2 ± 5.4 |
| (95% CI) | (3.5: 7.0) | (15.4: 19.2) | (−9.0: −5.5) | |
| Min; Max | −4.5; 21.4 | 9.1; 33.5 | −18.4; 6.4 | |
| IMU-PSW | Mean ΔFPA between systems ± SD | 0.3 ± 3.6 | 2.6 ± 3.7 | −2.7 ± 4.1 |
| (95% CI) | (−0.82: 1.5) | (1.4: 3.8) | (−4.0: −1.3) | |
| Min; max | −11.3; 7.3 | −4.4; 11.7 | −13.0; 5.2 | |
| p-value | 0.57 | p < 0.001 | p < 0.001 |
| IMUs Baseline Test-Retest | PSW Baseline Test-Retest | |
|---|---|---|
| ICC absolute agreement | 0.89 | 0.97 |
| (95% CI) | (0.79; 0.94) | (0.95; 0.99) |
| p-value | p < 0.001 | p < 0.001 |
| SEM (°) | 1.6 | 0.96 |
| MDC (°) | 4.5 | 2.7 |
| IMUs | PSW | IMUs—PSW | ||||
|---|---|---|---|---|---|---|
| Variable | ΔFPA toe-out | ΔFPA toe-in | ΔFPA toe-out | ΔFPA toe-in | Difference in ΔFPA toe-out | Difference in ΔFPA toe-in |
| Mean FPA ± SD | 14.3 ± 5.4 | −15.5 ± 6.7 | 12.0 ± 4.8 | −12.5 ± 5.1 | 2.3 ± 2.4 | −3.0 ± 3.6 |
| Median | 14.4 | −14.1 | 11.5 | −11.6 | 2.3 | −2.5 |
| Min; max | 4.0; 26.6 | −41.6; −7.0 | 2.3; 25.1 | −30.6; −4.1 | −3.1; 7.3 | −11.7; 2.9 |
| 95% CI | 12.6; 16.0 | −17.6; −13.3 | 10.5; 13.6 | −14.1; −10.9 | 1.5; 3.0 | −4.2; −1.8 |
Publisher’s Note: MDPI stays neutral with regard to jurisdictional claims in published maps and institutional affiliations. |
© 2022 by the authors. Licensee MDPI, Basel, Switzerland. This article is an open access article distributed under the terms and conditions of the Creative Commons Attribution (CC BY) license (https://creativecommons.org/licenses/by/4.0/).
Share and Cite
Urbanus, F.C.A.; Grayson, J.; Harlaar, J.; Simic, M. Reliability and Validity of IMU-Based Foot Progression Angle Measurement under Different Gait Retraining Strategies. Appl. Sci. 2022, 12, 6519. https://doi.org/10.3390/app12136519
Urbanus FCA, Grayson J, Harlaar J, Simic M. Reliability and Validity of IMU-Based Foot Progression Angle Measurement under Different Gait Retraining Strategies. Applied Sciences. 2022; 12(13):6519. https://doi.org/10.3390/app12136519
Chicago/Turabian StyleUrbanus, Francine C. A., Jane Grayson, Jaap Harlaar, and Milena Simic. 2022. "Reliability and Validity of IMU-Based Foot Progression Angle Measurement under Different Gait Retraining Strategies" Applied Sciences 12, no. 13: 6519. https://doi.org/10.3390/app12136519