
Dispersion of Knee Helical Axes during Walking after Maximal versus Resistant Strength Training in Healthy Subjects


 , ,
, ,
Abstract
:1. Introduction
2. Material and Methods
2.1. Participants
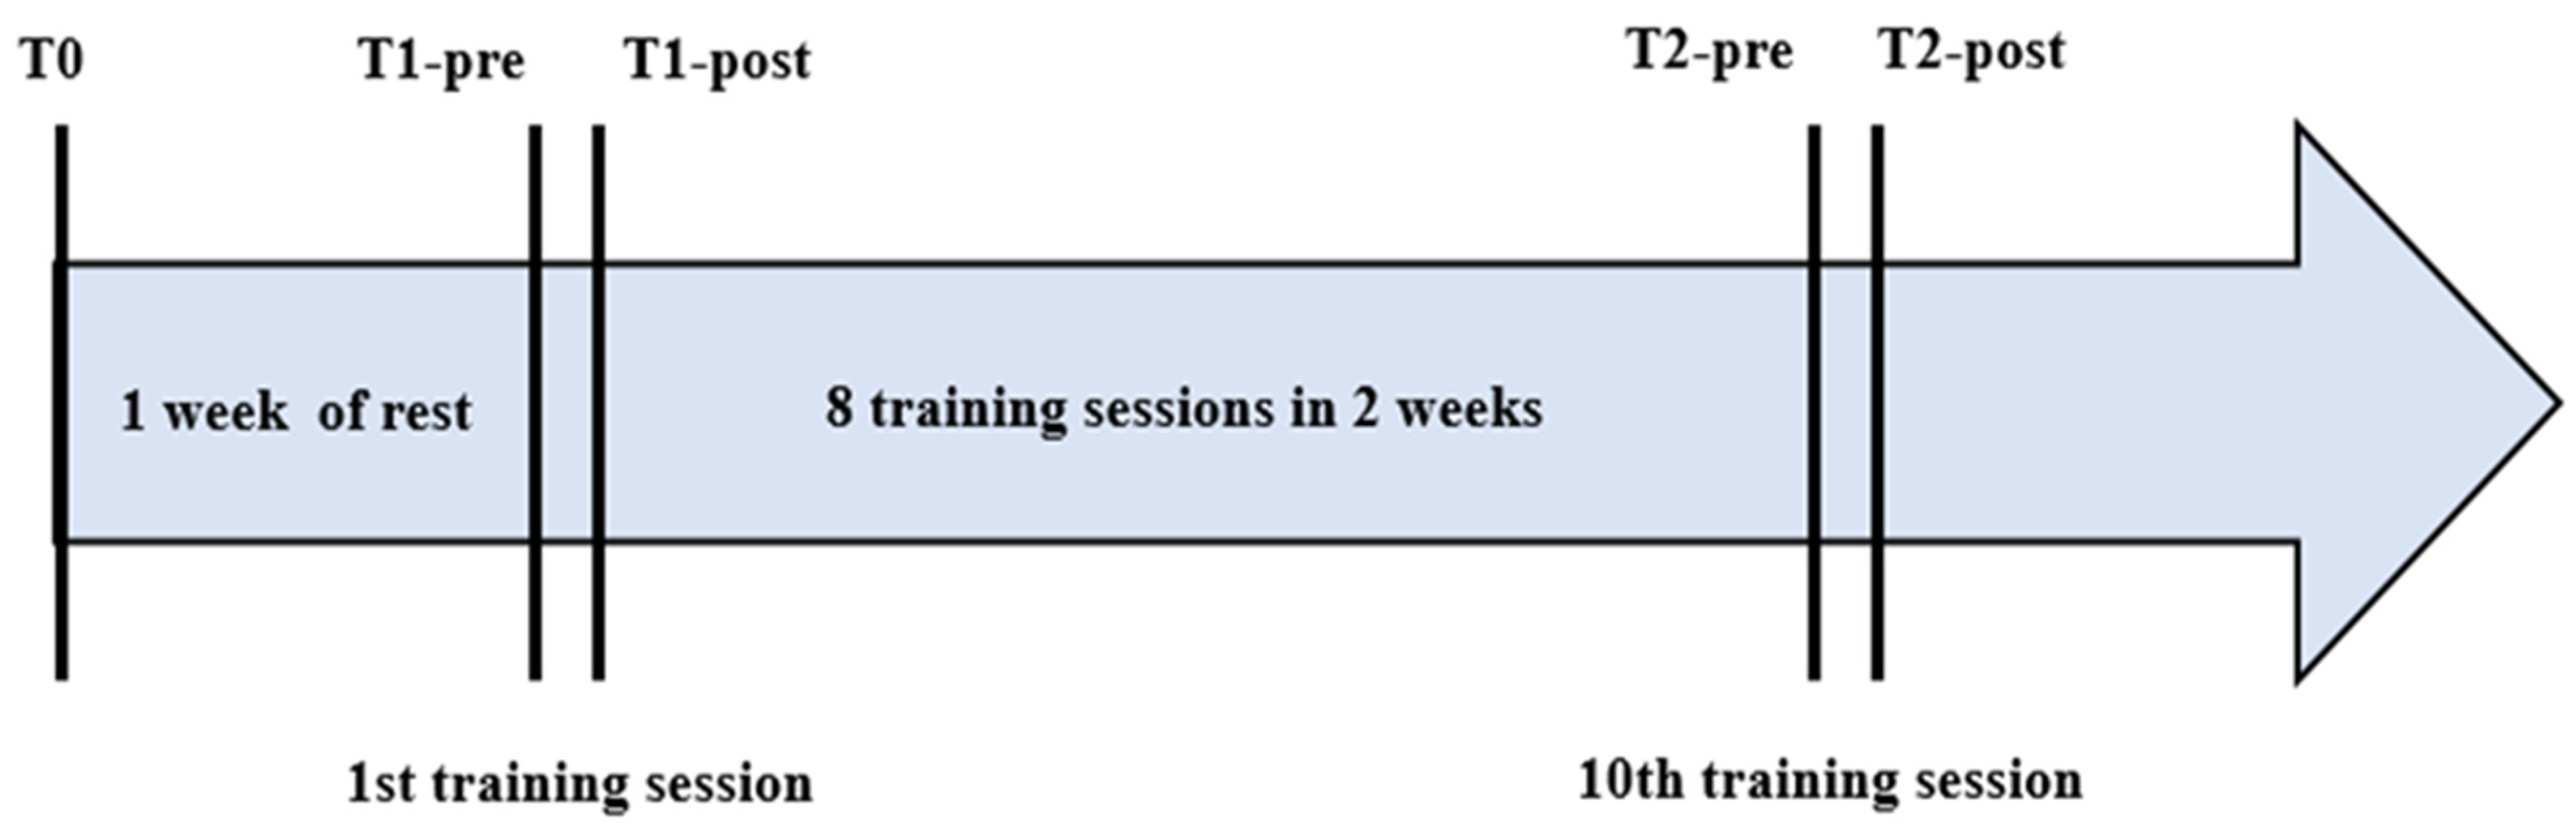
2.2. Intervention
2.3. Knee Kinematics Assessment
2.4. MVC Assessment
2.5. Statistical Analysis
3. Results
3.1. Test–Retest Reliability
3.2. RT versus MT
4. Discussion
Author Contributions
Funding
Institutional Review Board Statement
Informed Consent Statement
Data Availability Statement
Conflicts of Interest
References
- Koo, S.; Andriacchi, T.P. The knee joint center of rotation is predominantly on the lateral side during normal walking. J. Biomech. 2008, 41, 1269–1273. [Google Scholar] [CrossRef] [PubMed] [Green Version]
- Conconi, M.; Halilaj, E.; Castelli, V.P.; Crisco, J.J. Is early osteoarthritis associated with differences in joint congruence? J. Biomech. 2014, 47, 3787–3793. [Google Scholar] [CrossRef] [PubMed] [Green Version]
- Woltring, H.; Huiskes, H.R.; De Lange, A.; Veldpaus, F.F. Finite centroid and helical axis estimation from noisy landmark measurements in the study of human joint kinematics. J. Biomech. 1985, 18, 379–389. [Google Scholar] [CrossRef]
- Cescon, C.; Cattrysse, E.; Barbero, M. Methodological analysis of finite helical axis behavior in cervical kinematics. J. Electromyogr. Kinesiol. 2014, 24, 628–635. [Google Scholar] [CrossRef]
- Barbero, M.; Falla, D.; Clijsen, R.; Ghirlanda, F.; Schneebeli, A.; Ernst, M.; Cescon, C. Can parameters of the helical axis be measured reliably during active cervical movements? Musculoskelet. Sci. Pract. 2017, 27, 150–154. [Google Scholar] [CrossRef] [Green Version]
- Temporiti, F.; Furone, R.; Cescon, C.; Barbero, M.; Gatti, R. Dispersion of helical axes during shoulder movements in young and elderly subjects. J. Biomech. 2019, 88, 72–77. [Google Scholar] [CrossRef]
- Adamo, P.; Temporiti, F.; Natali, F.; Trombin, S.; Cescon, C.; Barbero, M.; Gatti, R. Dispersion of shoulder helical axes during upper limb movements after muscle fatigue. J. Biomech. 2020, 113, 110075. [Google Scholar] [CrossRef]
- Bogert, A.V.D.; Reinschmidt, C.; Lundberg, A. Helical axes of skeletal knee joint motion during running. J. Biomech. 2008, 41, 1632–1638. [Google Scholar] [CrossRef] [Green Version]
- Temporiti, F.; Cescon, C.; Adamo, P.; Natali, F.; Barbero, M.; De Capitani, F.; Gatti, R. Dispersion of knee helical axes during walking in young and elderly healthy subjects. J. Biomech. 2020, 109, 109944. [Google Scholar] [CrossRef]
- Grip, H.; Häger, C. A new approach to measure functional stability of the knee based on changes in knee axis orientation. J. Biomech. 2013, 46, 855–862. [Google Scholar] [CrossRef]
- Knoop, J.; Dekker, J.; van der Leeden, M.; van der Esch, M.; Thorstensson, C.; Gerritsen, M.; Voorneman, R.; Peter, W.; de Rooij, M.; Romviel, S.; et al. Knee joint stabilization therapy in patients with osteoarthritis of the knee: A randomized, controlled trial. Osteoarthr. Cartil. 2013, 21, 1025–1034. [Google Scholar] [CrossRef] [PubMed] [Green Version]
- De la Fuente, C.; Stoelben, K.J.; Silvestre, R.; Yañez, R.; Cheyre, J.; Guadagnin, E.C.; Carpes, F.P. Steadiness training improves the quadriceps strength and self-reported outcomes in persistent quadriceps weakness following nine months of anterior cruciate ligament reconstruction and failed conventional physiotherapy. Clin. Biomech. 2022, 92, 105585. [Google Scholar] [CrossRef] [PubMed]
- Jenkins, N.D.M.; Housh, T.J.; Bergstrom, H.C.; Cochrane, K.C.; Hill, E.C.; Smith, C.M.; Johnson, G.O.; Schmidt, R.J.; Cramer, J.T. Muscle activation during three sets to failure at 80 vs. 30% 1RM resistance exercise. Graefe’s Arch. Clin. Exp. Ophthalmol. 2015, 115, 2335–2347. [Google Scholar] [CrossRef] [PubMed]
- Schoenfeld, B.J.; Grgic, J.; Ogborn, D.; Krieger, J.W. Strength and Hypertrophy Adaptations Between Low- vs. High-Load Resistance Training: A Systematic Review and Meta-analysis. J. Strength Cond. Res. 2017, 31, 3508–3523. [Google Scholar] [CrossRef]
- Lacio, M.; Vieira, J.G.; Trybulski, R.; Campos, Y.; Santana, D.; Filho, J.E.; Novaes, J.; Vianna, J.; Wilk, M. Effects of Resistance Training Performed with Different Loads in Untrained and Trained Male Adult Individuals on Maximal Strength and Muscle Hypertrophy: A Systematic Review. Int. J. Environ. Res. Public Health 2021, 18, 11237. [Google Scholar] [CrossRef]
- Fink, J.; Kikuchi, N.; Nakazato, K. Effects of rest intervals and training loads on metabolic stress and muscle hypertrophy. Clin. Physiol. Funct. Imaging 2018, 38, 261–268. [Google Scholar] [CrossRef]
- Jenkins, N.D.; Housh, T.J.; Buckner, S.L.; Bergstrom, H.C.; Cochrane, K.C.; Hill, E.C.; Smith, C.M.; Schmidt, R.J.; Johnson, G.O.; Cramer, J. Neuromuscular Adaptations After 2 and 4 Weeks of 80% Versus 30% 1 Repetition Maximum Resistance Training to Failure. J. Strength Cond. Res. 2016, 30, 2174–2185. [Google Scholar] [CrossRef]
- Jenkins, N.D.M.; Miramonti, A.A.; Hill, E.C.; Smith, C.M.; Cochrane-Snyman, K.C.; Housh, T.J.; Cramer, J. Greater Neural Adaptations following High- vs. Low-Load Resistance Training. Front. Physiol. 2017, 8, 331. [Google Scholar] [CrossRef]
- Dinyer, T.K.; Byrd, M.T.; Garver, M.J.; Rickard, A.J.; Miller, W.M.; Burns, S.; Clasey, J.L.; Bergstrom, H.C. Low-Load vs. High-Load Resistance Training to Failure on One Repetition Maximum Strength and Body Composition in Untrained Women. J. Strength Cond. Res. 2019, 33, 1737–1744. [Google Scholar] [CrossRef]
- Lewek, M.D.; Scholz, J.; Rudolph, K.S.; Snyder-Mackler, L. Stride-to-stride variability of knee motion in patients with knee osteoarthritis. Gait Posture 2006, 23, 505–511. [Google Scholar] [CrossRef] [Green Version]
- van Melick, N.; Meddeler, B.M.; Hoogeboom, T.J.; Nijhuis-van der Sanden, M.W.G.; van Cingel, R.E.H. How to determine leg dominance: The agreement between self-reported and observed performance in healthy adults. PLoS ONE 2017, 12, e0189876. [Google Scholar] [CrossRef] [PubMed] [Green Version]
- Grant, S.; Aitchison, T.; Henderson, E.; Christie, J.; Zare, S.; Mcmurray, J.; Dargie, H. A Comparison of the Reproducibility and the Sensitivity to Change of Visual Analogue Scales, Borg Scales, and Likert Scales in Normal Subjects During Submaximal Exercise. Chest 1999, 116, 1208–1217. [Google Scholar] [CrossRef] [PubMed]
- Beauchet, O.; Allali, G.; Sekhon, H.; Verghese, J.; Guilain, S.; Steinmetz, J.-P.; Kressig, R.W.; Barden, J.; Szturm, T.; Launay, C.P.; et al. Guidelines for Assessment of Gait and Reference Values for Spatiotemporal Gait Parameters in Older Adults: The Biomathics and Canadian Gait Consortiums Initiative. Front. Hum. Neurosci. 2017, 11, 353. [Google Scholar] [CrossRef] [PubMed]
- Plotnik, M.; Azrad, T.; Bondi, M.; Bahat, Y.; Gimmon, Y.; Zeilig, G.; Inzelberg, R.; Siev-Ner, I. Self-selected gait speed–over ground versus self-paced treadmill walking, a solution for a paradox. J. Neuroeng. Rehabil. 2015, 12, 20. [Google Scholar] [CrossRef] [Green Version]
- Söderkvist, I.; Wedin, P. Determining the movements of the skeleton using well-configured markers. J. Biomech. 1993, 26, 1473–1477. [Google Scholar] [CrossRef]
- Westphal, C.J.; Schmitz, A.; Reeder, S.B.; Thelen, D.G. Load-dependent variations in knee kinematics measured with dynamic MRI. J. Biomech. 2013, 46, 2045–2052. [Google Scholar] [CrossRef] [Green Version]
- Fellin, R.E.; Rose, W.C.; Royer, T.D.; Davis, I.S. Comparison of methods for kinematic identification of footstrike and toe-off during overground and treadmill running. J. Sci. Med. Sport 2010, 13, 646–650. [Google Scholar] [CrossRef] [Green Version]
- Wu, G.; Siegler, S.; Allard, P.; Kirtley, C.; Leardini, A.; Rosenbaum, D.; Whittle, M.; D’Lima, D.D.; Cristofolini, L.; Witte, H.; et al. ISB recommendation on definitions of joint coordinate system of various joints for the reporting of human joint motion—Part I: Ankle, hip, and spine. J. Biomech. 2002, 35, 543–548. [Google Scholar] [CrossRef]
- Koo, T.K.; Li, M.Y. A Guideline of Selecting and Reporting Intraclass Correlation Coefficients for Reliability Research. J. Chiropr. Med. 2016, 15, 155–163. [Google Scholar] [CrossRef] [Green Version]
- Ramsey, D.; Wretenberg, P.F. Biomechanics of the knee: Methodological considerations in the in vivo kinematic analysis of the tibiofemoral and patellofemoral joint. Clin. Biomech. 1999, 14, 595–611. [Google Scholar] [CrossRef]
- Button, K.S.; Ioannidis, J.P.A.; Mokrysz, C.; Nosek, B.A.; Flint, J.; Robinson, E.S.J.; Munafò, M.R. Power failure: Why small sample size undermines the reliability of neuroscience. Nat. Rev. Neurosci. 2013, 14, 365–376, Erratum in Nat. Rev. Neurosci. 2013, 14, 451. [Google Scholar] [CrossRef] [PubMed] [Green Version]
- McGinley, J.L.; Baker, R.; Wolfe, R.; Morris, M.E. The reliability of three-dimensional kinematic gait measurements: A systematic review. Gait Posture 2009, 29, 360–369. [Google Scholar] [CrossRef] [PubMed]
- Fukuchi, C.; Fukuchi, R.K.; Duarte, M. Effects of walking speed on gait biomechanics in healthy participants: A systematic review and meta-analysis. Syst. Rev. 2019, 8, 153. [Google Scholar] [CrossRef] [PubMed] [Green Version]
- Helseth, J.; Hortobágyi, T.; Devita, P. How do low horizontal forces produce disproportionately high torques in human locomotion? J. Biomech. 2008, 41, 1747–1753. [Google Scholar] [CrossRef] [PubMed] [Green Version]
- Grip, H.; Tengman, E.; Häger, C.K. Dynamic knee stability estimated by finite helical axis methods during functional performance approximately twenty years after anterior cruciate ligament injury. J. Biomech. 2015, 48, 1906–1914. [Google Scholar] [CrossRef]


| Plane of Motion | MD (cm) | ||||
| Phase | T0 | T1-pre | ICC (95% CI) | SEM | |
| Sagittal | 95–10% | 3.2 ± 0.9 | 3.3 ± 1.0 | 0.75 (0.56–0.84) | 0.44 |
| 10–40% | 2.8 ± 1.4 | 2.9 ± 1.2 | 0.86 (0.77–0.92) | 0.34 | |
| 40–75% | 2.5 ± 0.8 | 2.7 ± 0.9 | 0.87 (0.79–0.92) | 0.19 | |
| 75–95% | 2.5 ± 1.0 | 2.6 ± 1.0 | 0.90 (0.83–0.94) | 0.20 | |
| Frontal | 95–10% | 5.5 ± 1.8 | 5.5 ± 2.2 | 0.23 (−0.56–0.74) | 2.56 |
| 10–40% | 4.8 ± 2.1 | 5.2 ± 1.9 | 0.47 (−0.18–0.76) | 1.73 | |
| 40–75% | 3.4 ± 1.9 | 4.0 ± 2.2 | 0.63 (0.31–0.80) | 1.29 | |
| 75–95% | 3.3 ± 1.5 | 3.9 ± 2.2 | 0.50 (−0.04–0.76) | 1.52 | |
| Transverse | 95–10% | 3.0 ± 1.5 | 3.2 ± 1.4 | 0.76 (0.60–0.86) | 0.62 |
| 10–40% | 3.4 ± 1.5 | 3.7 ± 1.6 | 0.47 (0.07–0.70) | 1.34 | |
| 40–75% | 2.9 ± 1.6 | 3.4 ± 1.8 | 0.59 (0.30–0.76) | 1.16 | |
| 75–95% | 2.5 ± 1.2 | 2.8 ± 1.3 | 0.61 (0.29–0.78) | 0.82 | |
| Plane of Motion | MA (°) | ||||
| Phase | T0 | T1-pre | ICC (95% CI) | SEM | |
| Sagittal | 95–10% | 14.2 ± 5.7 | 14.0 ± 4.7 | 0.70 (0.49–0.82) | 2.79 |
| 10–40% | 11.0 ± 4.4 | 12.3 ± 5.5 | 0.78 (0.63–0.87) | 1.92 | |
| 40–75% | 10.1 ± 3.4 | 10.8 ± 3.5 | 0.88 (0.79–0.93) | 0.76 | |
| 75–95% | 10.3 ± 3.6 | 11.1 ± 4.7 | 0.74 (0.56–0.84) | 1.94 | |
| Frontal | 95–10% | 22.6 ± 8.6 | 19.6 ± 8.8 | 0.44 (-0.43–0.79) | 7.75 |
| 10–40% | 20.5 ± 10.3 | 20.0 ± 9.3 | 0.79 (0.54–0.91) | 3.72 | |
| 40–75% | 15.1 ± 4.8 | 16.1 ± 8.5 | 0.42 (−0.11–0.69) | 6.40 | |
| 75–95% | 12.8 ± 5.5 | 17.2 ± 9.1 | 0.32 (−0.29–0.66) | 7.75 | |
| Transverse | 95–10% | 12.8 ± 6.9 | 14.4 ± 7.4 | 0.70 (0.49–0.82) | 3.77 |
| 10–40% | 16.3 ± 9.2 | 13.2 ± 6.7 | 0.64 (0.36–0.79) | 4.89 | |
| 40–75% | 15.6 ± 6.1 | 16.5 ± 6.7 | 0.70 (0.47–0.83) | 3.40 | |
| 75–95% | 14.4 ± 6.7 | 15.8 ± 7.2 | 0.62 (0.32–0.79) | 4.44 | |
| Plane of Motion | HAs Percentage (%) | ||||
| Phase | T0 | T1-pre | ICC (95% CI) | SEM | |
| Sagittal | 95–10% | 76.2 ± 17.0 | 73.2 ± 19.9 | 0.78 (0.63–0.87) | 7.46 |
| 10–40% | 79.6 ± 23.7 | 78.9 ± 24.6 | 0.87 (0.78–0.92) | 6.07 | |
| 40–75% | 83.5 ± 13.0 | 84.8 ± 11.9 | 0.90 (0.84–0.94) | 2.27 | |
| 75–95% | 84.5 ± 14.6 | 86.5 ± 11.5 | 0.86 (0.76–0.91) | 3.52 | |
| Frontal | 95–10% | 3.0 ± 6.7 | 2.2 ± 3.9 | 0.48 (0.13–0.69) | 4.63 |
| 10–40% | 2.8 ± 5.1 | 3.4 ± 8.4 | 0.86 (0.76–0.91) | 1.87 | |
| 40–75% | 3.7 ± 5.2 | 4.3 ± 4.7 | 0.70 (0.50–0.82) | 2.60 | |
| 75–95% | 3.8 ± 5.5 | 3.0 ± 4.6 | 0.42 (0.03–0.65) | 4.69 | |
| Transverse | 95–10% | 20.9 ± 14.7 | 24.6 ± 18.2 | 0.79 (0.65–0.88) | 6.14 |
| 10–40% | 17.6 ± 21.7 | 17.8 ± 22.1 | 0.84 (0.73–0.90) | 6.62 | |
| 40–75% | 12.7 ± 12.1 | 11.2 ± 10.3 | 0.84 (0.74–0.91) | 3.28 | |
| 75–95% | 11.8 ± 13.1 | 10.6 ± 10.6 | 0.89 (0.89–0.93) | 2.60 | |
| Plane of Motion | RoM (°) | ||||
| Phase | T0 | T1-pre | ICC (95% CI) | SEM | |
| Sagittal | 95–10% | 11.0 ± 5.6 | 11.3 ± 5.7 | 0.89 (0.82–0.94) | 1.15 |
| 10–40% | 10.1 ± 4.3 | 9.6 ± 3.9 | 0.86 (0.77–0.92) | 1.05 | |
| 40–75% | 57.8 ± 4.0 | 57.2 ± 4.1 | 0.92 (0.85–0.95) | 0.63 | |
| 75–95% | 58.6 ± 4.7 | 58.8 ± 4.9 | 0.89 (0.81–0.93) | 1.02 | |
| Frontal | 95–10% | 1.8 ± 1.3 | 1.7 ± 1.2 | 0.57 (0.28–0.75) | 0.92 |
| 10–40% | 1.5 ± 1.1 | 1.3 ± 1.0 | 0.35 (−0.08–0.61) | 1.06 | |
| 40–75% | 5.5 ± 4.1 | 4.9 ± 4.2 | 0.50 (0.16–0.70) | 3.39 | |
| 75–95% | 4.8 ± 3.8 | 4.8 ± 3.9 | 0.37 (−0.06–0.63) | 3.79 | |
| Transverse | 95–10% | 5.4 ± 3.2 | 5.9 ± 3.3 | 0.92 (0.86–0.95) | 0.50 |
| 10–40% | 3.4 ± 2.4 | 3.1 ± 2.4 | 0.79 (0.64–0.87) | 0.93 | |
| 40–75% | 5.6 ± 4.1 | 5.2 ± 3.7 | 0.62 (0.37–0.77) | 2.51 | |
| 75–95% | 7.8 ± 4.6 | 7.8 ± 4.3 | 0.65 (0.41–0.79) | 2.68 | |
| RT Group (n = 15) | MT Group (n = 15) | p-Value | |
|---|---|---|---|
| Variables | |||
| Age (years) | 22.5 ± 1.4 | 22.8 ± 2.7 | 0.739 |
| Weight (kg) | 66.3 ± 15.2 | 63.0 ± 12.4 | 0.524 |
| Height (cm) | 173.5 ± 12.1 | 173.0 ± 8.8 | 0.905 |
| Gender (M/F) | 7 M/8 F | 7 M/8 F | 1.000 |
| Dominant limb (R/L) | 15 R/0 L | 15 R/0 L | 1.000 |
| Outcomes | Phase | T1-Pre | T1-Post | T2-Pre | T2-Post | p-Value | p-Value | p-Value | ||||
|---|---|---|---|---|---|---|---|---|---|---|---|---|
| RT | MT | RT | MT | RT | MT | RT | MT | Group Factor | Time Factor | Group × Time Interaction | ||
| MD | 95–10% | 3.6 ± 1.2 | 3.2 ± 1.0 | 3.8 ± 1.3 | 3.4 ± 1.2 | 3.5 ± 1.3 | 3.0 ± 0.9 | 3.5 ± 1.1 | 3.3 ± 0.9 | 0.073 | 0.635 | 0.991 |
| (cm) | 10–40% | 3.2 ± 1.5 | 2.8 ± 0.9 | 3.0 ± 1.5 | 3.1 ± 1.3 | 2.8 ± 1.3 | 2.7 ± 1.0 | 3.0 ± 1.3 | 2.6 ± 0.9 | 0.398 | 0.769 | 0.762 |
| 40–75% | 2.5 ± 1.0 | 2.8 ± 0.8 | 2.6 ± 1.1 | 2.7 ± 0.8 | 2.4 ± 1.0 | 2.5 ± 0.8 | 2.6 ± 0.9 | 2.6 ± 0.7 | 0.458 | 0.85 | 0.942 | |
| 75–95% | 2.3 ± 1.0 | 2.7 ± 0.7 | 2.3 ± 0.6 | 2.4 ± 0.7 | 2.2 ± 0.8 | 2.5 ± 0.8 | 2.3 ± 0.8 | 2.5 ± 0.8 | 0.045 | 0.845 | 0.947 | |
| MA | 95–10% | 13.0 ± 3.2 | 11.8 ± 3.5 | 14.4 ± 3.1 ** | 11.9 ± 3.4 | 14.0 ± 4.0 ** | 11.0 ± 3.3 | 15.0 ± 5.2 | 12.1 ± 3.8 | <0.001 | 0.625 | 0.778 |
| (°) | 10–40% | 11.8 ± 5.2 | 9.8 ± 4.1 | 11.7 ± 5.3 | 11.2 ± 5.3 | 10.9 ± 4.5 | 9.6 ± 2.7 | 13.0 ± 6.6 | 10.2 ± 4.4 | 0.064 | 0.689 | 0.829 |
| 40–75% | 11.3 ± 4.3 | 10.2 ± 3.6 | 11.2 ± 4.8 | 10.3 ± 3.6 | 10.9 ± 4.6 | 10.0 ± 3.3 | 9.4 ± 3.6 | 9.8 ± 3.6 | 0.378 | 0.643 | 0.898 | |
| HAs | 75–95% | 9.2 ± 2.4 | 11.0 ± 3.6 | 9.7 ± 2.3 | 11.1 ± 3.2 | 9.6 ± 3.4 | 10.6 ± 2.3 | 10.6 ± 3.7 | 11.0 ± 2.6 | 0.035 | 0.766 | 0.832 |
| percentage | 95–10% | 75.4 ± 16.6 | 74.9 ± 14.3 | 75.5 ± 13.8 | 72.2 ± 16.3 | 74.2 ± 19.2 | 76.7 ± 18.0 | 74.1 ± 21.3 | 70.2 ± 18.3 | 0.686 | 0.881 | 0.887 |
| (%) | 10–40% | 82.2 ± 26.2 | 83.0 ± 21.4 | 79.3 ± 24.4 | 70.2 ± 29.2 | 80.8 ± 24.6 | 84.1 ± 17.4 | 76.7 ± 25.1 | 76.7 ± 23.7 | 0.78 | 0.487 | 0.773 |
| 40–75% | 92.0 ± 9.4 | 88.6 ± 8.2 | 90.5 ± 9.1 | 84.8 ± 9.2 | 91.6 ± 8.5 | 90.0 ± 6.9 | 92.9 ± 7.2 | 87.6 ± 8.9 | 0.011 | 0.48 | 0.77 | |
| 75–95% | 92.5 ± 8.3 | 86.0 ± 13.7 | 93.6 ± 6.7 | 90.7 ± 8.6 | 89.0 ± 12.6 | 88.7 ± 10.2 | 88.4 ± 15.7 | 91.7 ± 7.0 | 0.42 | 0.659 | 0.355 | |
| 95–10% | 10.7 ± 6.3 | 12.2 ± 4.1 | 10.9 ± 5.9 | 11.0 ± 4.2 | 11.1 ± 7.4 | 12.6 ± 4.2 | 10.3 ± 6.6 | 10.8 ± 4.4 | 0.369 | 0.818 | 0.951 | |
| RoM | 10–40% | 9.9 ± 4.3 | 9.7 ± 3.0 | 9.7 ± 4.4 | 8.9 ± 3.5 | 9.5 ± 4.2 | 10.5 ± 3.0 | 9.3 ± 3.9 | 9.3 ± 3.3 | 0.984 | 0.827 | 0.83 |
| (°) | 40–75% | 57.8 ± 3.2 | 56.2 ± 4.9 | 58.6 ± 4.4 | 56.7 ± 4.8 | 57.1 ± 3.4 | 56.6 ± 5.3 | 57.4 ± 4.0 | 57.2 ± 5.0 | 0.183 | 0.918 | 0.856 |
| 75–95% | 58.5 ± 3.2 | 58.7 ± 5.1 | 59.8 ± 3.3 | 58.8 ± 5.1 | 58.7 ± 4.8 | 58.6 ± 5.9 | 58.6 ± 4.4 | 58.6 ± 5.2 | 0.817 | 0.922 | 0.957 | |
Publisher’s Note: MDPI stays neutral with regard to jurisdictional claims in published maps and institutional affiliations. |
© 2022 by the authors. Licensee MDPI, Basel, Switzerland. This article is an open access article distributed under the terms and conditions of the Creative Commons Attribution (CC BY) license (https://creativecommons.org/licenses/by/4.0/).
Share and Cite
Adamo, P.; Oddenino, F.; De Leo, D.; Agnelli, M.; Cescon, C.; Temporiti, F.; Gatti, R. Dispersion of Knee Helical Axes during Walking after Maximal versus Resistant Strength Training in Healthy Subjects. Appl. Sci. 2022, 12, 5850. https://doi.org/10.3390/app12125850
Adamo P, Oddenino F, De Leo D, Agnelli M, Cescon C, Temporiti F, Gatti R. Dispersion of Knee Helical Axes during Walking after Maximal versus Resistant Strength Training in Healthy Subjects. Applied Sciences. 2022; 12(12):5850. https://doi.org/10.3390/app12125850
Chicago/Turabian StyleAdamo, Paola, Francesco Oddenino, Davide De Leo, Miriana Agnelli, Corrado Cescon, Federico Temporiti, and Roberto Gatti. 2022. "Dispersion of Knee Helical Axes during Walking after Maximal versus Resistant Strength Training in Healthy Subjects" Applied Sciences 12, no. 12: 5850. https://doi.org/10.3390/app12125850