
Tooth Shade Relationship with Age, Gender, and Skin Color in a Saudi Population: A Cross-Sectional Study

 , ,
, ,
Abstract
:1. Introduction
2. Materials and Methods
3. Result
4. Discussion
5. Conclusions
Author Contributions
Funding
Institutional Review Board Statement
Informed Consent Statement
Data Availability Statement
Conflicts of Interest
References
- Mayekar, S. Shades of a color. Illusion or reality? Dent. Clin. N. Am. 2001, 45, 155–172, vii. [Google Scholar] [CrossRef]
- Qualtrough, A.J.; Burke, F.J. A look at dental esthetics. Quintessence Int. 1994, 25, 7–14. [Google Scholar] [PubMed]
- Tam, W.K.; Lee, H.J. Dental shade matching using a digital camera. J. Dent. 2012, 40, 3–10. [Google Scholar] [CrossRef] [PubMed]
- Fujimoto, J.; Land, M.F.; Rosenstiel, S.F. Contemporary Fixed Prosthodontics; Mosby Elsevier: St. Louis, MI, USA, 2015. [Google Scholar]
- Alkhatib, M.N.; Holt, R.; Bedi, R. Prevalence of self-assessed tooth discolouration in the United Kingdom. J. Dent. 2004, 32, 561–566. [Google Scholar] [CrossRef]
- Jahangiri, L.; Reinhardt, S.B.; Mehra, R.V.; Matheson, P.B. Relationship Between Tooth Shade Value and Skin Color: An Observational Study. J. Prosthet. Dent. 2002, 87, 149–152. [Google Scholar] [CrossRef]
- Naveh, G.; Grossman, Y.; Bachner, Y.G.; Levin, L. Patients’ self-perception of tooth shade in relation to professionally objective evaluation. Quintessence Int. 2010, 41, e80–e83. [Google Scholar]
- Haralur, S.B.; Dibas, A.M.; Almelhi, N.A.; Al-Qahtani, D.A. The Tooth and Skin Colour Interrelationship across the Different Ethnic Groups. Int. J. Dent. 2014, 2014, 146028. [Google Scholar] [CrossRef] [Green Version]
- Gómez-Polo, C.; Montero, J.; Gómez-Polo, M.; de Parga, J.A.M.V. Celemin-Viñuela A. Natural Tooth Color Estimation Based on Age and Gender. J. Prosthodont. 2017, 26, 107–114. [Google Scholar] [CrossRef]
- Elamin, H.O.; Abubakr, N.H.; Ibrahim, Y.E. Identifying the tooth shade in group of patients using Vita Easyshade. Eur. J. Dent. 2015, 9, 213–217. [Google Scholar] [CrossRef]
- Karaman, T.; Altintas, E.; Eser, B.; Yildirim, T.T.; Oztekin, F.; Bozoglan, A. Spectrophotometric Evaluation of Anterior Maxillary Tooth Color Distribution According to Age and Gender. J. Prosthodont. 2019, 28, e96–e102. [Google Scholar] [CrossRef] [Green Version]
- Al-Nsour, H.F.; Al-Zoubi, T.T.; Al-Rimawi, A.S. Relationship between tooth value and skin color in patients visiting Royal Medical Services clinics of Jordan. Electron. Physician 2018, 10, 6448–6453. [Google Scholar] [CrossRef] [PubMed] [Green Version]
- Pradhan, D.; Shrestha, L.; Lohani, J. Tooth Shade and Skin Colour: A Descriptive Cross-Sectional Study. J. Nepal Med. Assoc. 2020, 58, 144–147. [Google Scholar] [CrossRef]
- Veeraganta, S.K.; Savadi, R.C.; Baroudi, K.; Nassani, M.Z. Differences in tooth shade value according to age, gender and skin color: A pilot study. J. Indian Prosthodont. Soc. 2015, 15, 138–141. [Google Scholar] [CrossRef] [PubMed]
- Kim, H.K. A study on the color distribution of natural teeth by age and gender in the Korean population with an intraoral spectrophotometer. J. Esthet. Restor. Dent. 2018, 30, 408–414. [Google Scholar] [CrossRef]
- Brodbelt, R.H.; O’Brien, W.J.; Fan, P.L.; Frazer-Dib, J.G.; Yu, R. Translucency of human dental enamel. J. Dent. Res. 1981, 60, 1749–1753. [Google Scholar] [CrossRef]
- Miller, A.; Long, J.; Cole, J.; Staffanou, R. Shade selection and laboratory communication. Quintessence Int. 1993, 24, 305–309. [Google Scholar]
- Sachdeva, S. Fitzpatrick skin typing: Applications in dermatology. Indian J. Dermatol. Venereol. Leprol. 2009, 75, 93–96. [Google Scholar] [CrossRef]
- Treesirichod, A.; Chansakulporn, S.; Wattanapan, P. Correlation between skin color evaluation by skin color scale chart and narrowband reflectance spectrophotometer. Indian J. Dermatol. 2014, 59, 339–342. [Google Scholar] [CrossRef]
- Ardu, S.; Braut, V.; Di Bella, E.; Lefever, D. Influence of background on natural tooth colour coordinates: An in vivo evaluation. Odontology 2014, 102, 267–271. [Google Scholar] [CrossRef] [Green Version]
- Dozić, A.; Kleverlaan, C.J.; El-Zohairy, A.; Feilzer, A.J.; Khashayar, G. Performance of five commercially available tooth color-measuring devices. J. Prosthodont. 2007, 16, 93–100. [Google Scholar] [CrossRef]
- Chen, H.; Huang, J.; Dong, X.; Qian, J.; He, J.; Qu, X.; Lu, E. A systematic review of visual and instrumental measurements for tooth shade matching. Quintessence Int. 2012, 43, 649–659. [Google Scholar] [PubMed]
- Labban, N.; Al-Otaibi, H.; Alayed, A.; Alshankiti, K.; Al-Enizy, M.A. Assessment of the influence of gender and skin color on the preference of tooth shade in Saudi population. Saudi Dent. J. 2017, 29, 102–110. [Google Scholar] [CrossRef] [PubMed]
- Haralur, S.B. Effect of Age on Tooth Shade, Skin Color and Skin-Tooth Color Interrelationship in Saudi Arabian Subpopulation. J. Int. Oral Health 2015, 7, 33–36. [Google Scholar] [PubMed]


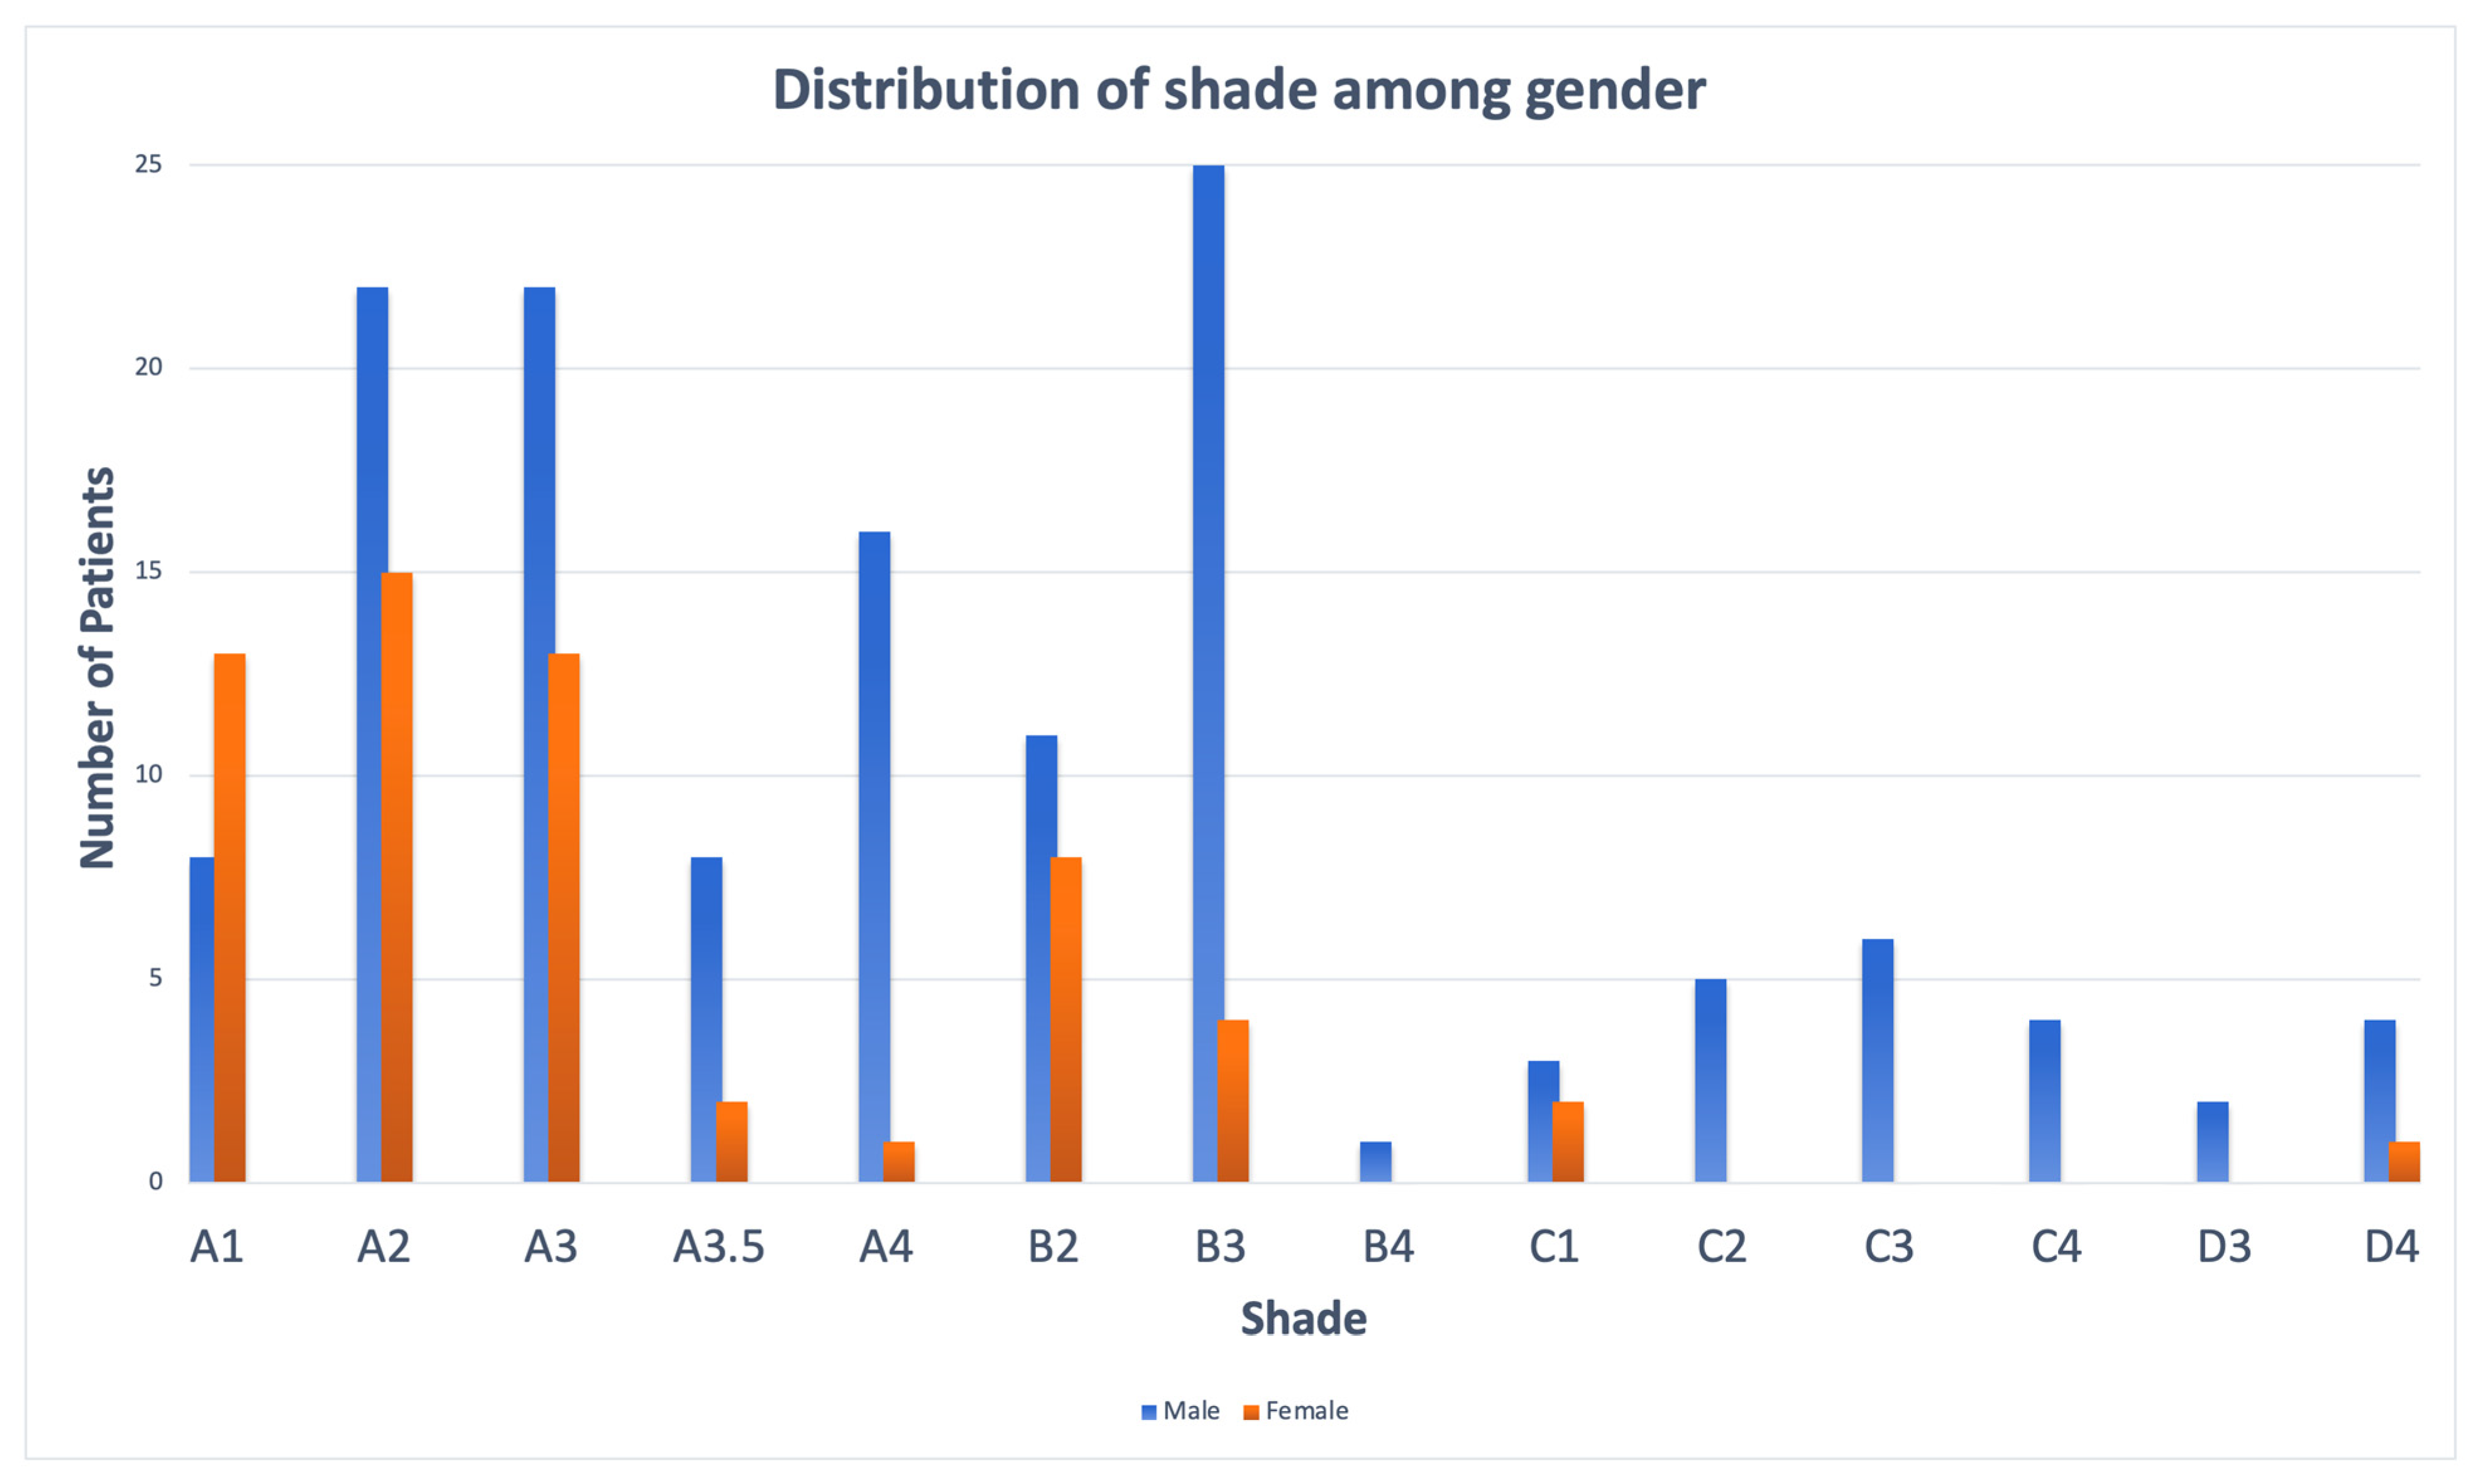
| Relationship between Shade and Gender * | ||||
|---|---|---|---|---|
| Shade | Gender | Total | ||
| Male | Female | |||
| A1 | No. Participants | 8 | 13 | 21 |
| % within Shade | 38.1% | 61.9% | 100.0% | |
| % within Gender | 5.8% | 22.0% | 10.6% | |
| A2 | No. Participants | 22 | 15 | 37 |
| % within Shade | 59.5% | 40.5% | 100.0% | |
| % within Gender | 15.8% | 25.4% | 18.7% | |
| A3 | No. Participants | 22 | 13 | 35 |
| % within Shade | 62.9% | 37.1% | 100.0% | |
| % within Gender | 15.8% | 22.0% | 17.7% | |
| A3.5 | No. Participants | 8 | 2 | 10 |
| % within Shade | 80.0% | 20.0% | 100.0% | |
| % within Gender | 5.8% | 3.4% | 5.1% | |
| A4 | No. Participants | 16 | 1 | 17 |
| % within Shade | 94.1% | 5.9% | 100.0% | |
| % within Gender | 11.5% | 1.7% | 8.6% | |
| B2 | No. Participants | 11 | 8 | 19 |
| % within Shade | 57.9% | 42.1% | 100.0% | |
| % within Gender | 7.9% | 13.6% | 9.6% | |
| B3 | No. Participants | 25 | 4 | 29 |
| % within Shade | 86.2% | 13.8% | 100.0% | |
| % within Gender | 18.0% | 6.8% | 14.6% | |
| B4 | No. Participants | 1 | 0 | 1 |
| % within Shade | 100.0% | 0.0% | 100.0% | |
| % within Gender | 0.7% | 0.0% | 0.5% | |
| C1 | No. Participants | 3 | 2 | 5 |
| % within Shade | 60.0% | 40.0% | 100.0% | |
| % within Gender | 2.2% | 3.4% | 2.5% | |
| C2 | No. Participants | 5 | 0 | 5 |
| % within Shade | 100.0% | 0.0% | 100.0% | |
| % within Gender | 3.6% | 0.0% | 2.5% | |
| C3 | No. Participants | 6 | 0 | 6 |
| % within Shade | 100.0% | 0.0% | 100.0% | |
| % within Gender | 4.3% | 0.0% | 3.0% | |
| C4 | No. Participants | 4 | 0 | 4 |
| % within Shade | 100.0% | 0.0% | 100.0% | |
| % within Gender | 2.9% | 0.0% | 2.0% | |
| D3 | No. Participants | 2 | 0 | 2 |
| % within Shade | 100.0% | 0.0% | 100.0% | |
| % within Gender | 1.4% | 0.0% | 1.0% | |
| D4 | No. Participants | 4 | 1 | 5 |
| % within Shade | 80.0% | 20.0% | 100.0% | |
| % within Gender | 2.9% | 1.7% | 2.5% | |
| Total | No. Participants | 139 | 59 | 198 |
| % within Shade | 70.2% | 29.8% | 100.0% | |
| % within Gender | 100.0% | 100.0% | 100.0% | |
| Chi-Square Tests | |||
|---|---|---|---|
| Value | df | Asymptotic Significance (2-Sided) | |
| Pearson Chi-Square | 32.294 a | 15 | 0.006 |
| Likelihood Ratio | 38.688 | 15 | 0.001 |
| Linear-by-Linear Association | 16.805 | 1 | 0.000 |
| N of Valid Cases | 198 | ||
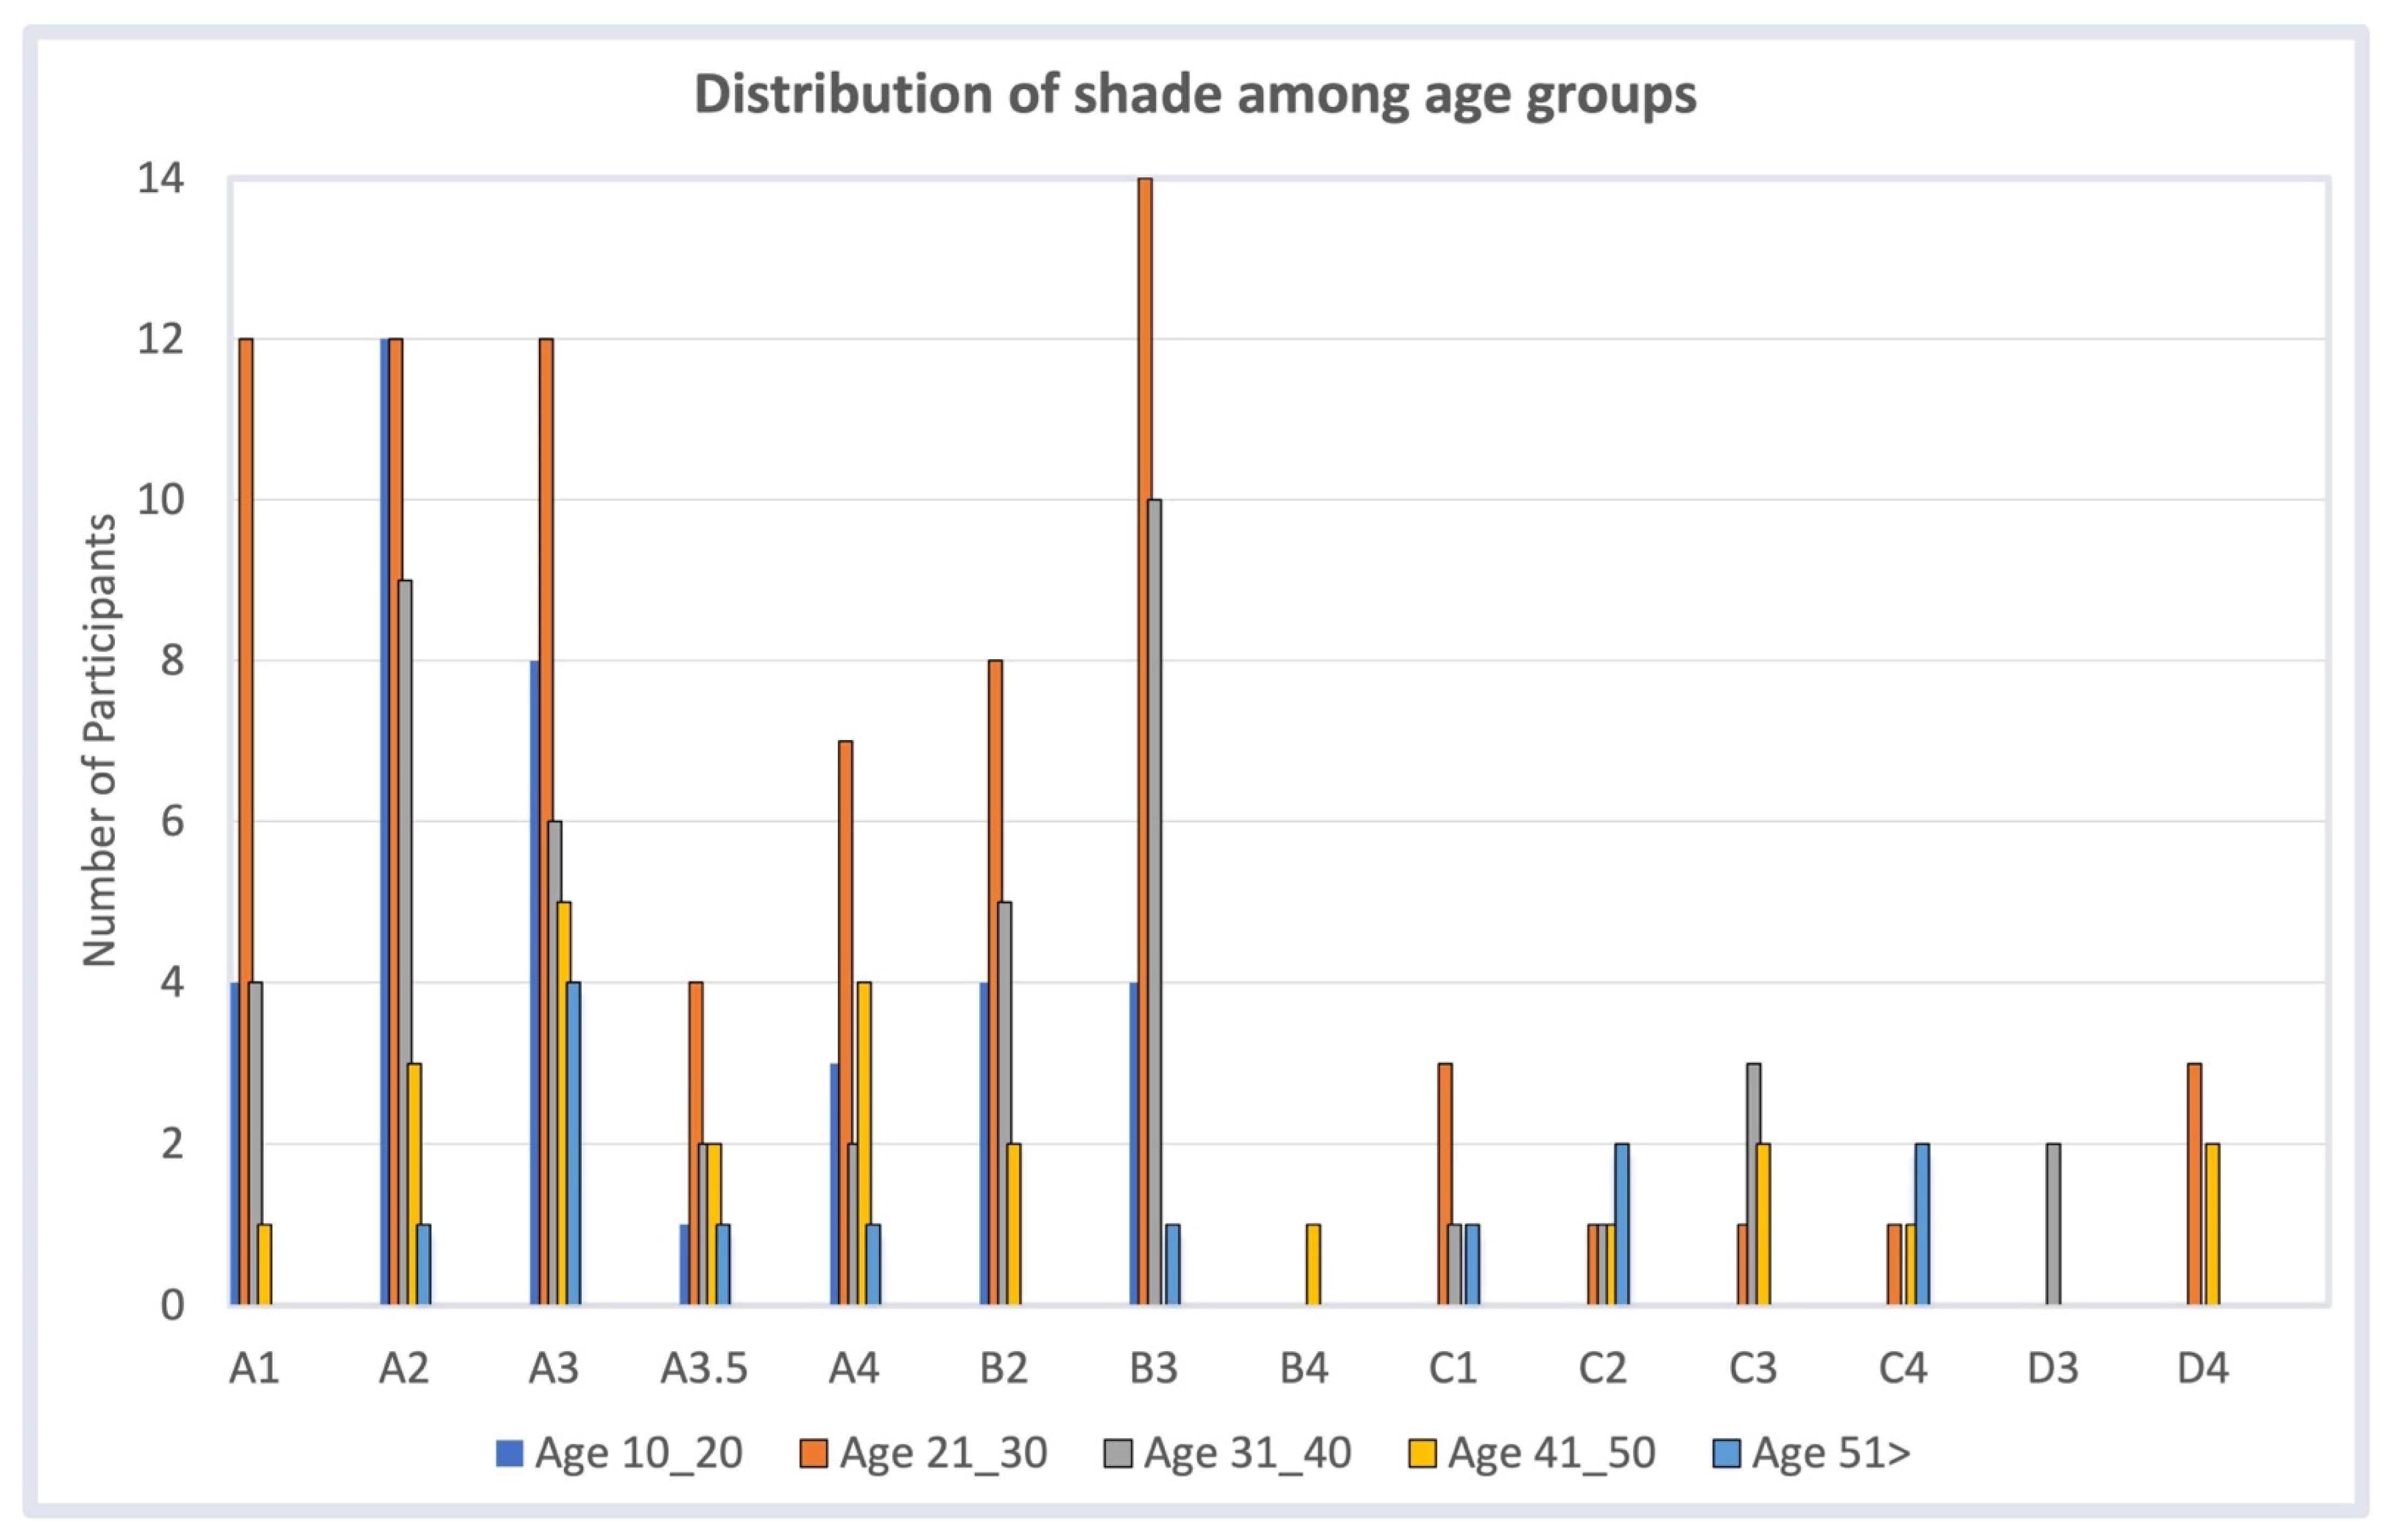
| Relationship between Shade and Age * | |||||||
|---|---|---|---|---|---|---|---|
| Shade | Age | Total | |||||
| 10–20 | 21–30 | 31–40 | 41–50 | 51> | |||
| A1 | No. Participants | 4 | 12 | 4 | 1 | 0 | 21 |
| % within Shade | 19.0% | 57.1% | 19.0% | 4.8% | 0.0% | 100.0% | |
| % within Age | 11.1% | 15.4% | 8.9% | 4.0% | 0.0% | 10.6% | |
| A2 | No. Participants | 12 | 12 | 9 | 3 | 1 | 37 |
| % within Shade | 32.4% | 32.4% | 24.3% | 8.1% | 2.7% | 100.0% | |
| % within Age | 33.3% | 15.4% | 20.0% | 12.0% | 7.1% | 18.7% | |
| A3 | No. Participants | 8 | 12 | 6 | 5 | 4 | 35 |
| % within Shade | 22.9% | 34.3% | 17.1% | 14.3% | 11.4% | 100.0% | |
| % within Age | 22.2% | 15.4% | 13.3% | 20.0% | 28.6% | 17.7% | |
| A3.5 | No. Participants | 1 | 4 | 2 | 2 | 1 | 10 |
| % within Shade | 10.0% | 40.0% | 20.0% | 20.0% | 10.0% | 100.0% | |
| % within Age | 2.8% | 5.1% | 4.4% | 8.0% | 7.1% | 5.1% | |
| A4 | No. Participants | 3 | 7 | 2 | 4 | 1 | 17 |
| % within Shade | 17.6% | 41.2% | 11.8% | 23.5% | 5.9% | 100.0% | |
| % within Age | 8.3% | 9.0% | 4.4% | 16.0% | 7.1% | 8.6% | |
| B2 | No. Participants | 4 | 8 | 5 | 2 | 0 | 19 |
| % within Shade | 21.1% | 42.1% | 26.3% | 10.5% | 0.0% | 100.0% | |
| % within Age | 11.1% | 10.3% | 11.1% | 8.0% | 0.0% | 9.6% | |
| B3 | No. Participants | 4 | 14 | 10 | 0 | 1 | 29 |
| % within Shade | 13.8% | 48.3% | 34.5% | 0.0% | 3.4% | 100.0% | |
| % within Age | 11.1% | 17.9% | 22.2% | 0.0% | 7.1% | 14.6% | |
| B4 | No. Participants | 0 | 0 | 0 | 1 | 0 | 1 |
| % within Shade | 0.0% | 0.0% | 0.0% | 100.0% | 0.0% | 100.0% | |
| % within Age | 0.0% | 0.0% | 0.0% | 4.0% | 0.0% | 0.5% | |
| C1 | No. Participants | 0 | 3 | 1 | 0 | 1 | 5 |
| % within Shade | 0.0% | 60.0% | 20.0% | 0.0% | 20.0% | 100.0% | |
| % within Age | 0.0% | 3.8% | 2.2% | 0.0% | 7.1% | 2.5% | |
| C2 | No. Participants | 0 | 1 | 1 | 1 | 2 | 5 |
| % within Shade | 0.0% | 20.0% | 20.0% | 20.0% | 40.0% | 100.0% | |
| % within Age | 0.0% | 1.3% | 2.2% | 4.0% | 14.3% | 2.5% | |
| C3 | No. Participants | 0 | 1 | 3 | 2 | 0 | 6 |
| % within Shade | 0.0% | 16.7% | 50.0% | 33.3% | 0.0% | 100.0% | |
| % within Age | 0.0% | 1.3% | 6.7% | 8.0% | 0.0% | 3.0% | |
| C4 | No. Participants | 0 | 1 | 0 | 1 | 2 | 4 |
| % within Shade | 0.0% | 25.0% | 0.0% | 25.0% | 50.0% | 100.0% | |
| % within Age | 0.0% | 1.3% | 0.0% | 4.0% | 14.3% | 2.0% | |
| D3 | No. Participants | 0 | 0 | 2 | 0 | 0 | 2 |
| % within Shade | 0.0% | 0.0% | 100.0% | 0.0% | 0.0% | 100.0% | |
| % within Age | 0.0% | 0.0% | 4.4% | 0.0% | 0.0% | 1.0% | |
| D4 | No. Participants | 0 | 3 | 0 | 2 | 0 | 5 |
| % within Shade | 0.0% | 60.0% | 0.0% | 40.0% | 0.0% | 100.0% | |
| % within Age | 0.0% | 3.8% | 0.0% | 8.0% | 0.0% | 2.5% | |
| Total | No. Participants | 36 | 78 | 45 | 25 | 14 | 198 |
| % within Shade | 18.2% | 39.4% | 22.7% | 12.6% | 7.1% | 100.0% | |
| % within Age | 100.0% | 100.0% | 100.0% | 100.0% | 100.0% | 100.0% | |
| Chi-Square Tests | |||
|---|---|---|---|
| Value | df | Asymptotic Significance (2-Sided) | |
| Pearson Chi-Square | 96.008 a | 60 | 0.002 |
| Likelihood Ratio | 82.950 | 60 | 0.027 |
| Linear-by-Linear Association | 16.142 | 1 | 0.000 |
| N of Valid Cases | 198 | ||
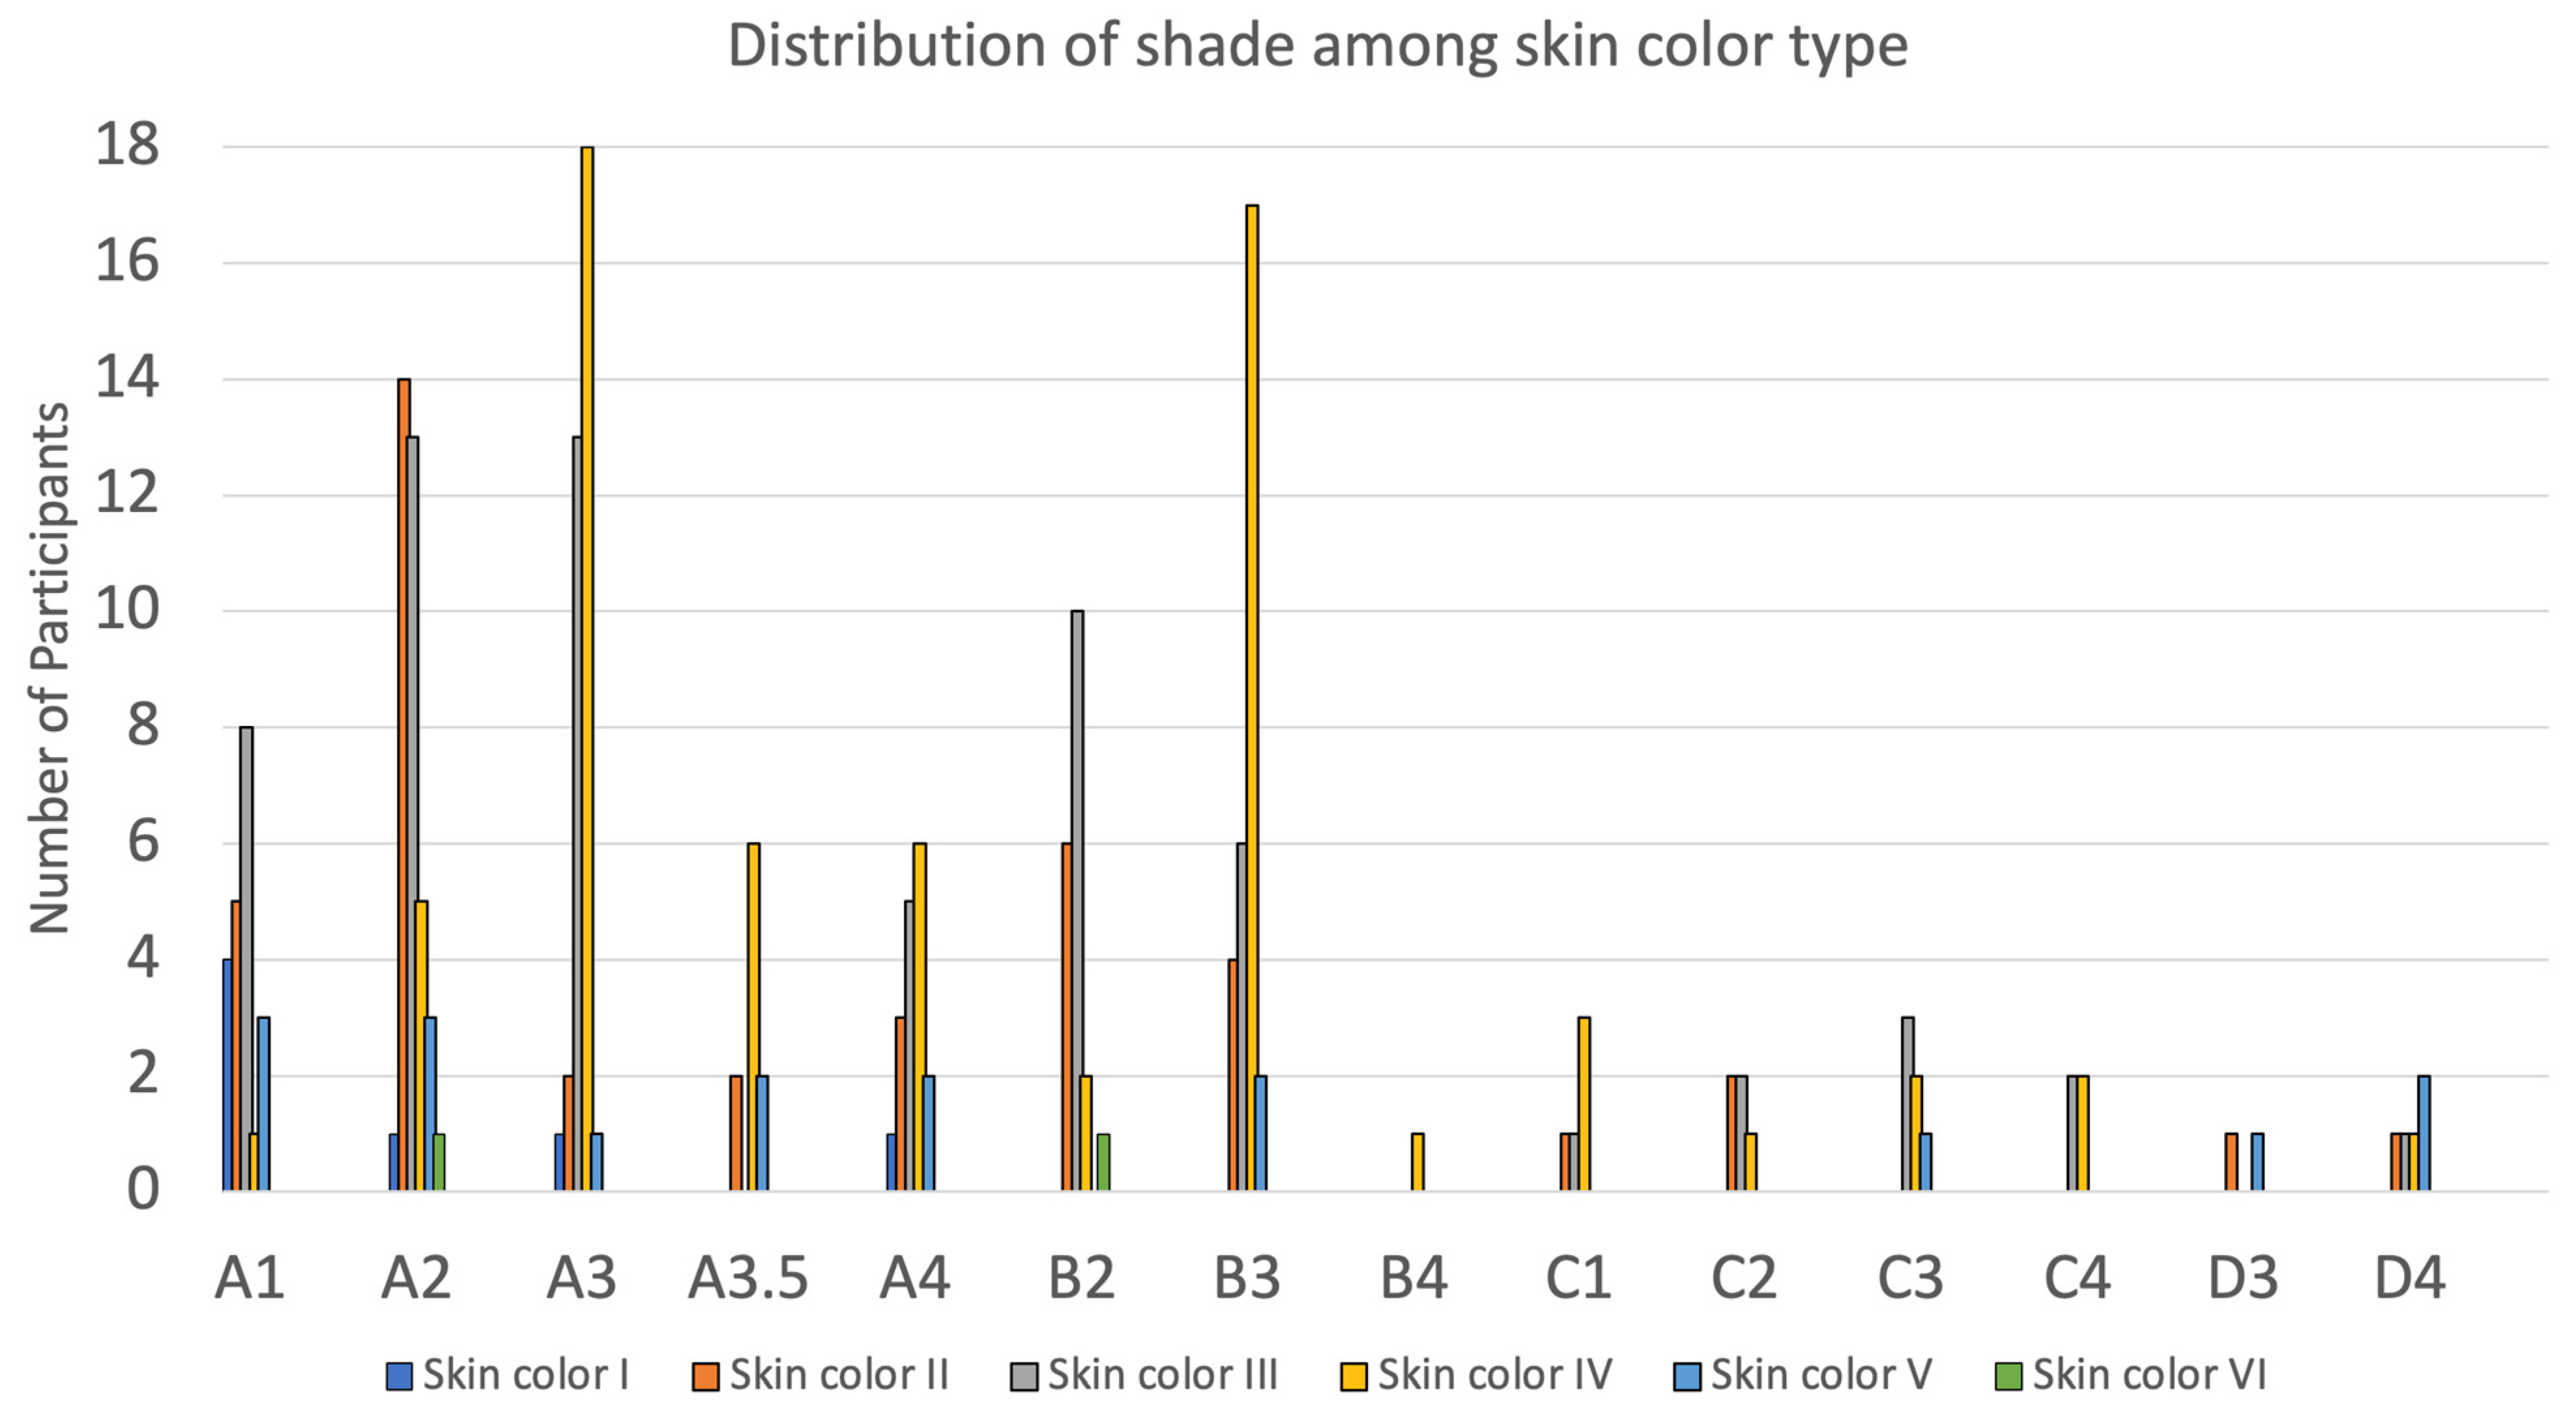
| Relationship between Shade and Skin Color * | ||||||||
|---|---|---|---|---|---|---|---|---|
| Shade | Skin Color | Total | ||||||
| I | II | III | IV | V | VI | |||
| A1 | No. Participants | 4 | 5 | 8 | 1 | 3 | 0 | 21 |
| % within Shade | 19.0% | 23.8% | 38.1% | 4.8% | 14.3% | 0.0% | 100.0% | |
| % within Skin color | 57.1% | 12.2% | 12.5% | 1.5% | 17.6% | 0.0% | 10.6% | |
| A2 | No. Participants | 1 | 14 | 13 | 5 | 3 | 1 | 37 |
| % within Shade | 2.7% | 37.8% | 35.1% | 13.5% | 8.1% | 2.7% | 100.0% | |
| % within Skin color | 14.3% | 34.1% | 20.3% | 7.5% | 17.6% | 50.0% | 18.7% | |
| A3 | No. Participants | 1 | 2 | 13 | 18 | 1 | 0 | 35 |
| % within Shade | 2.9% | 5.7% | 37.1% | 51.4% | 2.9% | 0.0% | 100.0% | |
| % within Skin color | 14.3% | 4.9% | 20.3% | 26.9% | 5.9% | 0.0% | 17.7% | |
| A3.5 | No. Participants | 0 | 2 | 0 | 6 | 2 | 0 | 10 |
| % within Shade | 0.0% | 20.0% | 0.0% | 60.0% | 20.0% | 0.0% | 100.0% | |
| % within Skin color | 0.0% | 4.9% | 0.0% | 9.0% | 11.8% | 0.0% | 5.1% | |
| A4 | No. Participants | 1 | 3 | 5 | 6 | 2 | 0 | 17 |
| % within Shade | 5.9% | 17.6% | 29.4% | 35.3% | 11.8% | 0.0% | 100.0% | |
| % within Skin color | 14.3% | 7.3% | 7.8% | 9.0% | 11.8% | 0.0% | 8.6% | |
| B2 | No. Participants | 0 | 6 | 10 | 2 | 0 | 1 | 19 |
| % within Shade | 0.0% | 31.6% | 52.6% | 10.5% | 0.0% | 5.3% | 100.0% | |
| % within Skin color | 0.0% | 14.6% | 15.6% | 3.0% | 0.0% | 50.0% | 9.6% | |
| B3 | No. Participants | 0 | 4 | 6 | 17 | 2 | 0 | 29 |
| % within Shade | 0.0% | 13.8% | 20.7% | 58.6% | 6.9% | 0.0% | 100.0% | |
| % within Skin color | 0.0% | 9.8% | 9.4% | 25.4% | 11.8% | 0.0% | 14.6% | |
| B4 | No. Participants | 0 | 0 | 0 | 1 | 0 | 0 | 1 |
| % within Shade | 0.0% | 0.0% | 0.0% | 100.0% | 0.0% | 0.0% | 100.0% | |
| % within Skin color | 0.0% | 0.0% | 0.0% | 1.5% | 0.0% | 0.0% | 0.5% | |
| C1 | No. Participants | 0 | 1 | 1 | 3 | 0 | 0 | 5 |
| % within Shade | 0.0% | 20.0% | 20.0% | 60.0% | 0.0% | 0.0% | 100.0% | |
| % within Skin color | 0.0% | 2.4% | 1.6% | 4.5% | 0.0% | 0.0% | 2.5% | |
| C2 | No. Participants | 0 | 2 | 2 | 1 | 0 | 0 | 5 |
| % within Shade | 0.0% | 40.0% | 40.0% | 20.0% | 0.0% | 0.0% | 100.0% | |
| % within Skin color | 0.0% | 4.9% | 3.1% | 1.5% | 0.0% | 0.0% | 2.5% | |
| C3 | No. Participants | 0 | 0 | 3 | 2 | 1 | 0 | 6 |
| % within Shade | 0.0% | 0.0% | 50.0% | 33.3% | 16.7% | 0.0% | 100.0% | |
| % within Skin color | 0.0% | 0.0% | 4.7% | 3.0% | 5.9% | 0.0% | 3.0% | |
| C4 | No. Participants | 0 | 0 | 2 | 2 | 0 | 0 | 4 |
| % within Shade | 0.0% | 0.0% | 50.0% | 50.0% | 0.0% | 0.0% | 100.0% | |
| % within Skin color | 0.0% | 0.0% | 3.1% | 3.0% | 0.0% | 0.0% | 2.0% | |
| D3 | No. Participants | 0 | 1 | 0 | 0 | 1 | 0 | 2 |
| % within Shade | 0.0% | 50.0% | 0.0% | 0.0% | 50.0% | 0.0% | 100.0% | |
| % within Skin color | 0.0% | 2.4% | 0.0% | 0.0% | 5.9% | 0.0% | 1.0% | |
| D4 | No. Participants | 0 | 1 | 1 | 1 | 2 | 0 | 5 |
| % within Shade | 0.0% | 20.0% | 20.0% | 20.0% | 40.0% | 0.0% | 100.0% | |
| % within Skin color | 0.0% | 2.4% | 1.6% | 1.5% | 11.8% | 0.0% | 2.5% | |
| Total | No. Participants | 7 | 41 | 64 | 67 | 17 | 2 | 198 |
| % within Shade | 3.5% | 20.7% | 32.3% | 33.8% | 8.6% | 1.0% | 100.0% | |
| % within Skin color | 100.0% | 100.0% | 100.0% | 100.0% | 100.0% | 100.0% | 100.0% | |
| Chi-Square Tests | |||
|---|---|---|---|
| Value | df | Asymptotic Significance (2-Sided) | |
| Pearson Chi-Square | 96.689 a | 75 | 0.047 |
| Likelihood Ratio | 100.032 | 75 | 0.028 |
| Linear-by-Linear Association | 7.172 | 1 | 0.007 |
| N of Valid Cases | 198 | ||
Publisher’s Note: MDPI stays neutral with regard to jurisdictional claims in published maps and institutional affiliations. |
© 2022 by the authors. Licensee MDPI, Basel, Switzerland. This article is an open access article distributed under the terms and conditions of the Creative Commons Attribution (CC BY) license (https://creativecommons.org/licenses/by/4.0/).
Share and Cite
Alsayed, H.; Alaqeely, R.; Almazrouei, N.; Alzahrani, M.; Alzahrani, F.; Bin Oun, A.; Alshihri, A. Tooth Shade Relationship with Age, Gender, and Skin Color in a Saudi Population: A Cross-Sectional Study. Appl. Sci. 2022, 12, 6315. https://doi.org/10.3390/app12136315
Alsayed H, Alaqeely R, Almazrouei N, Alzahrani M, Alzahrani F, Bin Oun A, Alshihri A. Tooth Shade Relationship with Age, Gender, and Skin Color in a Saudi Population: A Cross-Sectional Study. Applied Sciences. 2022; 12(13):6315. https://doi.org/10.3390/app12136315
Chicago/Turabian StyleAlsayed, Hussain, Razan Alaqeely, Nawaf Almazrouei, Mohammed Alzahrani, Faris Alzahrani, Abdulaziz Bin Oun, and Abdulmonem Alshihri. 2022. "Tooth Shade Relationship with Age, Gender, and Skin Color in a Saudi Population: A Cross-Sectional Study" Applied Sciences 12, no. 13: 6315. https://doi.org/10.3390/app12136315