Article

Investigation of the Effect of Capillary Barrier on Water–Oil Movement in Water Flooding

1
School of Human Settlements and Civil Engineering, Xi’an Jiaotong University, Xi’an 710049, China
2
Mechanical Engineering College, Xi’an Shiyou University, Xi’an 710065, China
3
School of Chemistry and Chemical Engineering, Shaanxi University of Science and Technology, Xi’an 710021, China
*
Authors to whom correspondence should be addressed.
Appl. Sci. 2022, 12(12), 6285; https://doi.org/10.3390/app12126285
Submission received: 31 May 2022 / Revised: 14 June 2022 / Accepted: 15 June 2022 / Published: 20 June 2022
(This article belongs to the Topic Enhanced Oil Recovery Technologies)

Abstract

:
Water flooding technology is widely used to improve oil recovery efficiency in oilfields. The capillary barrier effect induced by the complex pore structures in the reservoir rocks is a crucial reason for the trapping of a great deal of residual oil in oil reservoirs after water flooding. However, the formation condition along with the effect on the recovery rate of the capillary barrier under different wettability conditions should be investigated further. To bridge the gap between the microscopic mechanism of the capillary barrier effect and the macroscopic mechanism of oil displacement efficiency, a simple conceptual capillary model is constructed to obtain the formation conditions of the capillary barrier using the analysis method, and its influence on macroscopic oil displacement efficiency in the porous media model with an opening angle of 45° is systematically investigated in this study using direct numerical simulations (DNS) coupled with the volume of fluid method. The results showed that the capillary barrier effect plays a significant role in the formation of the residual oil in the reservoir rock and the contact angle and the opening angle are the primary factors for the formation of the capillary barrier. The capillary force is the driving force when the oil–water interface advances in the throat channel under water-wet conditions, while the capillary force hinders the movement of oil–water movement when the liquid flows out of the throat channel and when θ + β > 90o. Furthermore, the highest oil displacement efficiency is achieved at the intermediate capillary number and in the case that the minimum conditions of occurrence of the capillary barrier phenomenon are satisfied. This is of great significance for controlling the optimized contact angle to further enhance the oil recovery rate of current oil reservoirs using waterflooding technology.

1. Introduction

Crude oil has a significant impact on industrial civilization development and economic prosperity. According to the British oil company’s 2020 Statistical Review of World Energy [1], crude oil accounts for approximately 33.1% of global energy consumption. However, the oil reserves of the world are limited, and the overall world oil reserves are approximately 24.46 billion tons as of the end of 2019 based on a proven/probable basis, and the world’s oil reserves can last up to 49.9 years at current production levels [1]. Crude oil is recovered from the oil reservoir via the natural energy and pressure of the reservoirs in the primary oil recovery stage.
Waterflooding technology is extensively applied to further enhance the oil recovery rate in oilfields in the initial stage of crude oil extraction, which will ultimately result in a high ratio of water to oil in producing wells and a low oil recovery rate, thus reducing the oil recovery rate at a later stage of oil extraction [2]. It is well acknowledged that ~60% of the residual oil still remains in the reservoir rock after waterflooding [3]. The crude oil recovery process can be characterized by a typical multiphase flow within porous media. The flowing conditions, the injected fluid properties, and the pore structure characteristics play a significant role in the multiphase flow dynamics in porous media. The configurations of residual oil trapped in the water-wet porous medium mainly include irregular strings, streaks, squirts, and discontinuous oleic saturations [4,5], and a great deal of residual oil is trapped in dead-end or semi dead-end pores. While under oil-wet conditions, the residual oil is either attached to the pore walls in the form of oil film or it is trapped in dead-end pores [5]. An oil bank created ahead of the frontal zone will also result in discontinuous ganglia of the residual oil within the larger pores [6]. The capillary entrapment and bypassing induced by the heterogeneity of reservoir rock play a crucial role in the residual oil formation, and the competition of viscous and capillary forces at pore scale determines oil–water two-phase flow dynamics during waterflooding [7,8,9]. Nanofluids, a kind of fluid wherein nanoparticles are suspended in a base fluid, can enormously remobilize the trapped residual oil after waterflooding via reducing the interfacial tension (IFT), improving rheological properties, and reducing the droplet coalescence compared with chemical flooding [10]. A variety of novel nanofluids are developed to enhance oil recovery. Khoramian [11] found that a kind of nanofluid prepared using Janus–graphene oxide nanosheets can considerably enhance oil recovery by restoring wettability to mixed-wettability and reducing the viscous fingering phenomenon and revealed that the Janus nanofluid can be a promising nanomaterial for nanofluid flooding. Mariyate [12] pointed out that microemulsions-based nanofluids can recuperate bypassed oil and remaining oil caught in the reservoir via plunging interfacial tension and modifying the rock wettability, and this can be a potential strategy for improving oil recuperation. Core flooding tests conducted by Sagala [13] using hydroxyl-functionalized silicate-based nanofluids indicated that the nanofluid flooding offers ~12–14.5% additional oil in addition to waterflooding and revealed that higher capillary forces resulted from interfacial tension reduction can remobilize trapped oil. Viktorovich [14] numerically investigated the effect of the addition of nanoparticles to the displacing fluid on the oil recovery rate and found that the use of nanosuspensions is most effective for low-permeability reservoirs with high oil viscosity. The state-of-the-art nanofluid flooding literatures revealed that nanofluid flooding achieved promising results in the laboratory and is still in the development stage.
The capillary effect is one of the important causes of remaining oil. Wettability is the most important factor that directly determines the magnitude and direction of the capillary force. In a straight capillary tube, the capillary force is the driving force to promote the movement of oil and water under hydrophilic condition. However, the capillary force is resistant under hydrophobic condition, which hinders the movement of oil and water. In complex porous media, the pore geometry will affect the apparent wettability [15]. The reservoir rock is characterized mainly via X-ray tomography and scanning electron microscopy methods to obtain characteristics of the void space such as the facies, the pore throat size, and the structure heterogeneity, which has a significant impact on the multiphase flow within porous media [16,17,18,19]. To mobilize the residual oil in the void space, it is necessary to study the capillary effect based on the structure of the void space. In a certain pore structure, the oil–water interface may still show resistance under hydrophilic condition, as shown in Figure 1. Figure 1a shows the oil–water interface in the throat channel; (b) the oil–water interface at the pore–throat interface. Among them, θ is the wetting angle and β is the opening angle from pore to throat. Under hydrophilic condition (θ < 90o), when the oil–water interface is in the throat, the capillary force is the driving force for the oil in the water flooding process; When the oil–water interface moves to the throat outlet and enters the pore, the oil–water interface will gradually deform and show a contact angle θ with the pore wall. As a result, the oil–water interface may reverse and show resistance (Figure 1b). Subsequently, it moves forward along the pore wall, the radius increases, and the capillary force decreases. During the movement of the oil–water interface from throat to pore, the capillary effect will have peak resistance. When the displacement force is not enough to break through the peak resistance, the oil–water interface will stop, hinder the spread of water, and cause the remaining oil. This peak resistance is the capillary barrier discussed in this paper. The capillary barrier is specific capillary behavior when the oil–water interface meets the pore–throat interface.
The capillary barrier phenomenon in porous media was initially observed that the water cannot flow from the fine layers upwards to the coarse layers in the subsurface; the phenomenon was termed ‘capillary barrier’, which was later employed in the fields of soil remediation, landfill cover design, unclear waste management, microfluidics, chemical engineering, and multiphase flow in porous media [20,21,22,23,24,25]. In the fields of microscale immiscible two-phase flow within porous media, a variety of studies have been conducted on the capillary barrier effect. Arab [26] investigated the interplay between viscous and capillary forces as a function of oil viscosity and injection velocity via water flooding experiments. Interaction between capillary and viscous effects plays a significant role in the flow instability and immiscible displacement and is verified by macroscopic capillary number with a critical value of Nca~1 [27]. Suo [28] pointed out that the displacement pattern can be transitioned between capillary-dominated and viscous-dominated modes via the adjustment in pore geometry, capillary fingering in porous media with hierarchical structures can be suppressed by adjusting the pore geometry, and the weak capillary effects can enhance the displacement stability. The complex capillary pressure distribution and configuration of fluid during displacement in highly heterogeneous porous media were measured via image processing methods and the results can facilitate better understanding of fluid displacement process [29]. Pavuluri [30] identified the critical contact angle θc in pore network models using direct numerical simulations and found that the capillary barrier zones in which capillary forces along with viscous forces resist spontaneous imbibition were observed when contact angle θ exceeds θc. Factors affecting capillary effect in two-phase flow include the effect of porous media properties (pore–throat size, grain size, heterogeneity, fracture), the effect of fluid saturation and properties, and the effect of external factors (domain size, surfactant, temperature), which are reviewed extensively in the literature [31]. Previous investigations indicate that the capillary barrier effect is largely responsible for the trapping of a great deal of residual oil after waterflooding, and studies of the underlying mechanism of the capillary barrier effect are in the open literature. Furthermore, studies of the capillary barrier effect in the fields of oil recovery are limited to phenomenological description and qualitative analysis, and detailed, accurate, and quantitative analysis of the capillary barrier phenomenon as well as its specific occurrence conditions are rare. Therefore, it is of great significance to systematically investigate the underlying mechanism of the capillary barrier effect as well as its effect on the mobilization of the residual oil within pore spaces of the reservoir rock. The main objective of the paper is to qualitatively and quantitatively characterize the capillary effect in the porous media flow and to investigate the influence of the capillary barrier effect on the microscopic oil–water flow dynamics and the macroscopic oil recovery efficiency of waterflooding reservoirs as well as its underlying displacement mechanisms.
In order to provide a detailed, accurate and quantitative analysis of the capillary barrier phenomenon as well as its specific occurrence conditions, a conceptual physical model of capillary barrier with circular cross-section is constructed first. Then, the morphology (the shape of the oil–water interface in the displacement process) of the oil–water interface at different positions and their corresponding equivalent hydraulic radius and capillary forces are systemically analyzed in theory. Subsequently, the effect of different contact angles and opening angles on the capillary force are investigated. Finally, the capillary barrier effect on oil–water two-phase flow and the oil displacement efficiency in the constructed pore-scale network with opening angle of 45° are systematically investigated using the volume of fluid method. This work is of great significance in understanding the underlying mechanism of the oil recovery process in reservoir rock and can provide theoretical and technological guidelines for enhancing the oil recovery of current conventional oil reservoirs.

2. Oil–Water Two-Phase Flow Dynamics

In this study, Navier–Stokes equations are adopted to characterize the oil–water flow dynamics, and the VOF (Volume of Fluid) method is used to obtain the spatial distribution of the individual phases. The equilibrium contact angle is used to characterize the rock wettability [32]. The governing equations for incompressible immiscible isothermal oil–water two-phase flow dynamics in rigid porous media are composed of three volume-averaged partial differential equations: the continuity equation (Equation (1)), momentum equation (the Navier–Stokes equation) (Equation (2)), and the fluid saturation equation (Equation (8)). Among these equations, the continuity equation is used to impose incompressibility constraint on each phase, the Navier–Stokes equation is adopted to describe water–oil two-phase flow dynamics in an Eulerian framework, and the fluid saturation equation is applied to implicitly capture the oil–water interface and to obtain the phase distribution. The pressure field and velocity field for each phase as well as the wetting-fluid saturation are calculated by solving these equations using the finite volume method. It is worth noting that the governing equations are derived through volume averaging the momentum equations within a control volume.

2.1. Continuity Equation

The continuity equation in differential form for incompressible immiscible oil–water flow reads
· u = 0
where u is the average velocity of the oil and water phase, m·s−1.

2.2. Momentum Conservation Equation

The momentum conservation equation is given by
ρ u t + · ( ρ u u ) · ( μ τ ) = p + ρ g + F σ
where ρ is the average density of the two phases, kg·m−3; μ is the average dynamic viscosity of the two phases, Pa·s; p is the dynamic pressure, Pa; g is the gravity acceleration, m·s−2; Fσ is the interfacial tension (IFT) between oil and water, kg·m−2·s−2; τ is the rate of strain tensor, s−1, which can be expressed as
τ = ( u + ( u ) T )
It can be seen from Equation (2) that viscosity μ and interfacial tension Fσ affect the oil–water two-phase dynamics other than pressure gradient (driving force). Therefore, in addition to artificial adjustment of the driving force, efforts are made via the change of the viscosity μ and interfacial tension Fσ in the development process of the oil and gas field.

2.3. Oil–Water Interfacial Tension

The fundamental difference between low-salinity and high-salinity waterflooding displacement lies in the salinity content of the displacing fluid and there is no difference in terms of viscosity between the displacing fluids. Therefore, the influence of the viscosity on the waterflooding process can be ignored and the influence of low-salinity waterflooding on the oil recovery rate depends largely on the interfacial tension Fσ. The term Fσ in Equation (2) represents the interfacial tension between oil and water and can be expressed as
F σ = σ δ s k n
where σ is the surface tension coefficient, N·m−1; δ s is the area of oil–water interface per unit volume, m−1; k is the curvature of the oil–water interface, m−1; n is the unit normal vector of the interface.
The area of oil–water interface per unit volume δ s is given by
δ s = | α |
where α is the volume fraction of water phase.
The unit normal vector of the interface n reads
n = α | α |
The curvature of the interface k is given by
k = · n

2.4. Volume of Fluid Method

VOF method is used to track the oil–water two-phase spatial distribution and the interface of the two-phase flow. The interface is determined by solving the equation for the volume fraction of water phase α in each cell. The cell is fully filled with the water phase when the value of α is unity; the cell is fully filled with the oil phase when the value of α is zero; the cell contains the free interface when the value of α is in the range of 0 to 1. Here, the surface is defined as the oil–water interface where the value of α is equal to 0.5. The equation for the volume fraction of wetting phase reads
α t + · ( α u ) = 0

2.5. Rock Wettability

The contact angle is commonly adopted to characterize the rock wettability. The wettability of the homogeneous oil reservoir rock can be divided into three regimes: water-wet, intermediate wettability, and oil-wet. The rock wettability is crucial to accurately simulate the oil–water flow dynamics and to determine the residual oil distribution. The wettability regimes are explored by prescribing different values of the contact angle in this paper.
Here, the contact angle is imposed as a boundary condition and the unit vector normal to the interface can be expressed as
n = n w c o s θ + s w s i n θ
where nw is the unit vector normal to the wall; sw is the unit vector perpendicular to the contact line, tangent to and pointing into the wetting–solid interface surface; θ is the contact angle, radian.

2.6. Averaging Properties of Oil–Water Flow

In Equation (2), ρ and μ represent the average density and dynamic viscosity of the water phase and the oil phase, respectively, which can be calculated respectively by Equations (10) and (11).
ρ = α ρ w + ( 1 α ) ρ o
μ = α μ w + ( 1 α ) μ o
where ρw is the density of the water phase, kg·m−3; ρo is the density of the oil phase, kg·m−3; μw is the dynamic viscosity of the water phase, Pa·s; μo is the dynamic viscosity of the oil phase, Pa·s.
Solution scheme and procedures are given in Appendix A. Model validation are given in Appendix B.

3. Capillary Barrier Phenomenon

3.1. Remaining Oil Formation during the Water-Flooding Process

Figure 2 shows the remaining oil distribution after water flooding of the water-wet porous structure initially filled with oil. The black line is the pore boundary, the white part in the pore is filled with water, and the black part is the remaining oil. Water flows in from the left and out from right. The capital letters (A–Y) in the figure indicate the locations of the oil–water interface. It can be seen that these oil–water interfaces stagnate at the pore–throat interface.
Figure 1a shows the morphology of the oil–water interface in the throat channel. As to a pore space with the radius of R, the resultant interfacial tension (capillary force) can be expressed by Laplace formula
f = σ cos ( θ ) R
where σ is the interfacial tension coefficient and R is the pore channel radius.
It can be known from Equation (12) that three factors determine the magnitude of the capillary force: interfacial tension coefficient σ, contact angle θ, and channel radius R. For a given oil reservoir, R is constant. Therefore, enhancing the oil recovery rate of low-salinity waterflooding depends largely on the influence of the salinity on interfacial tension σ and contact angle θ. It has been found that salinity has a significant influence on the contact angle θ via measuring the interfacial tension σ and contact angle θ of the fluid. Thus, the influence of the low-salinity waterflooding on the oil recovery rate is regulated via the contact angle θ.
Under water-wet conditions, the contact angle θ is an acute angle, and the direction of f is consistent with the flow direction of the water phase, which is the driving force in the water-flooding process. Figure 1b shows the morphology of the oil–water interface at the location of the pore–throat interface. After that, the oil–water interface will keep contact angle θ with the pore wall, and the capillary force induced by the oil–water interface is
f = σ cos ( θ + β ) R
Under water-wet conditions, the direction of the capillary force is pointing to the concave side of the interface when the interface advances in the throat channel, which is consistent with the oil–water flow direction, and the capillary force is the driving force; while when the liquid flows out of the throat channel, and when θ + β > 90o, the interface will reverse. At this time, the capillary force obtained by Equation (13) is negative, which is opposite to the direction of water–oil displacement and hinders the interface advancement. As the interface moves forward, R will gradually increase, and the blocking effect of the capillary force on oil–water interface will gradually decrease. When the displacement force cannot overcome the capillary barriers, the interface movement stops, resulting in oil surplus. The capillary resistance caused by the change of geometry is called the capillary barrier in this work. The capillary barrier is caused by the geometric structure; even in the water-wet conditions, capillary force can still present resistance characteristics. However, how the capillary barrier influences the oil–water movement needs to be further investigated.

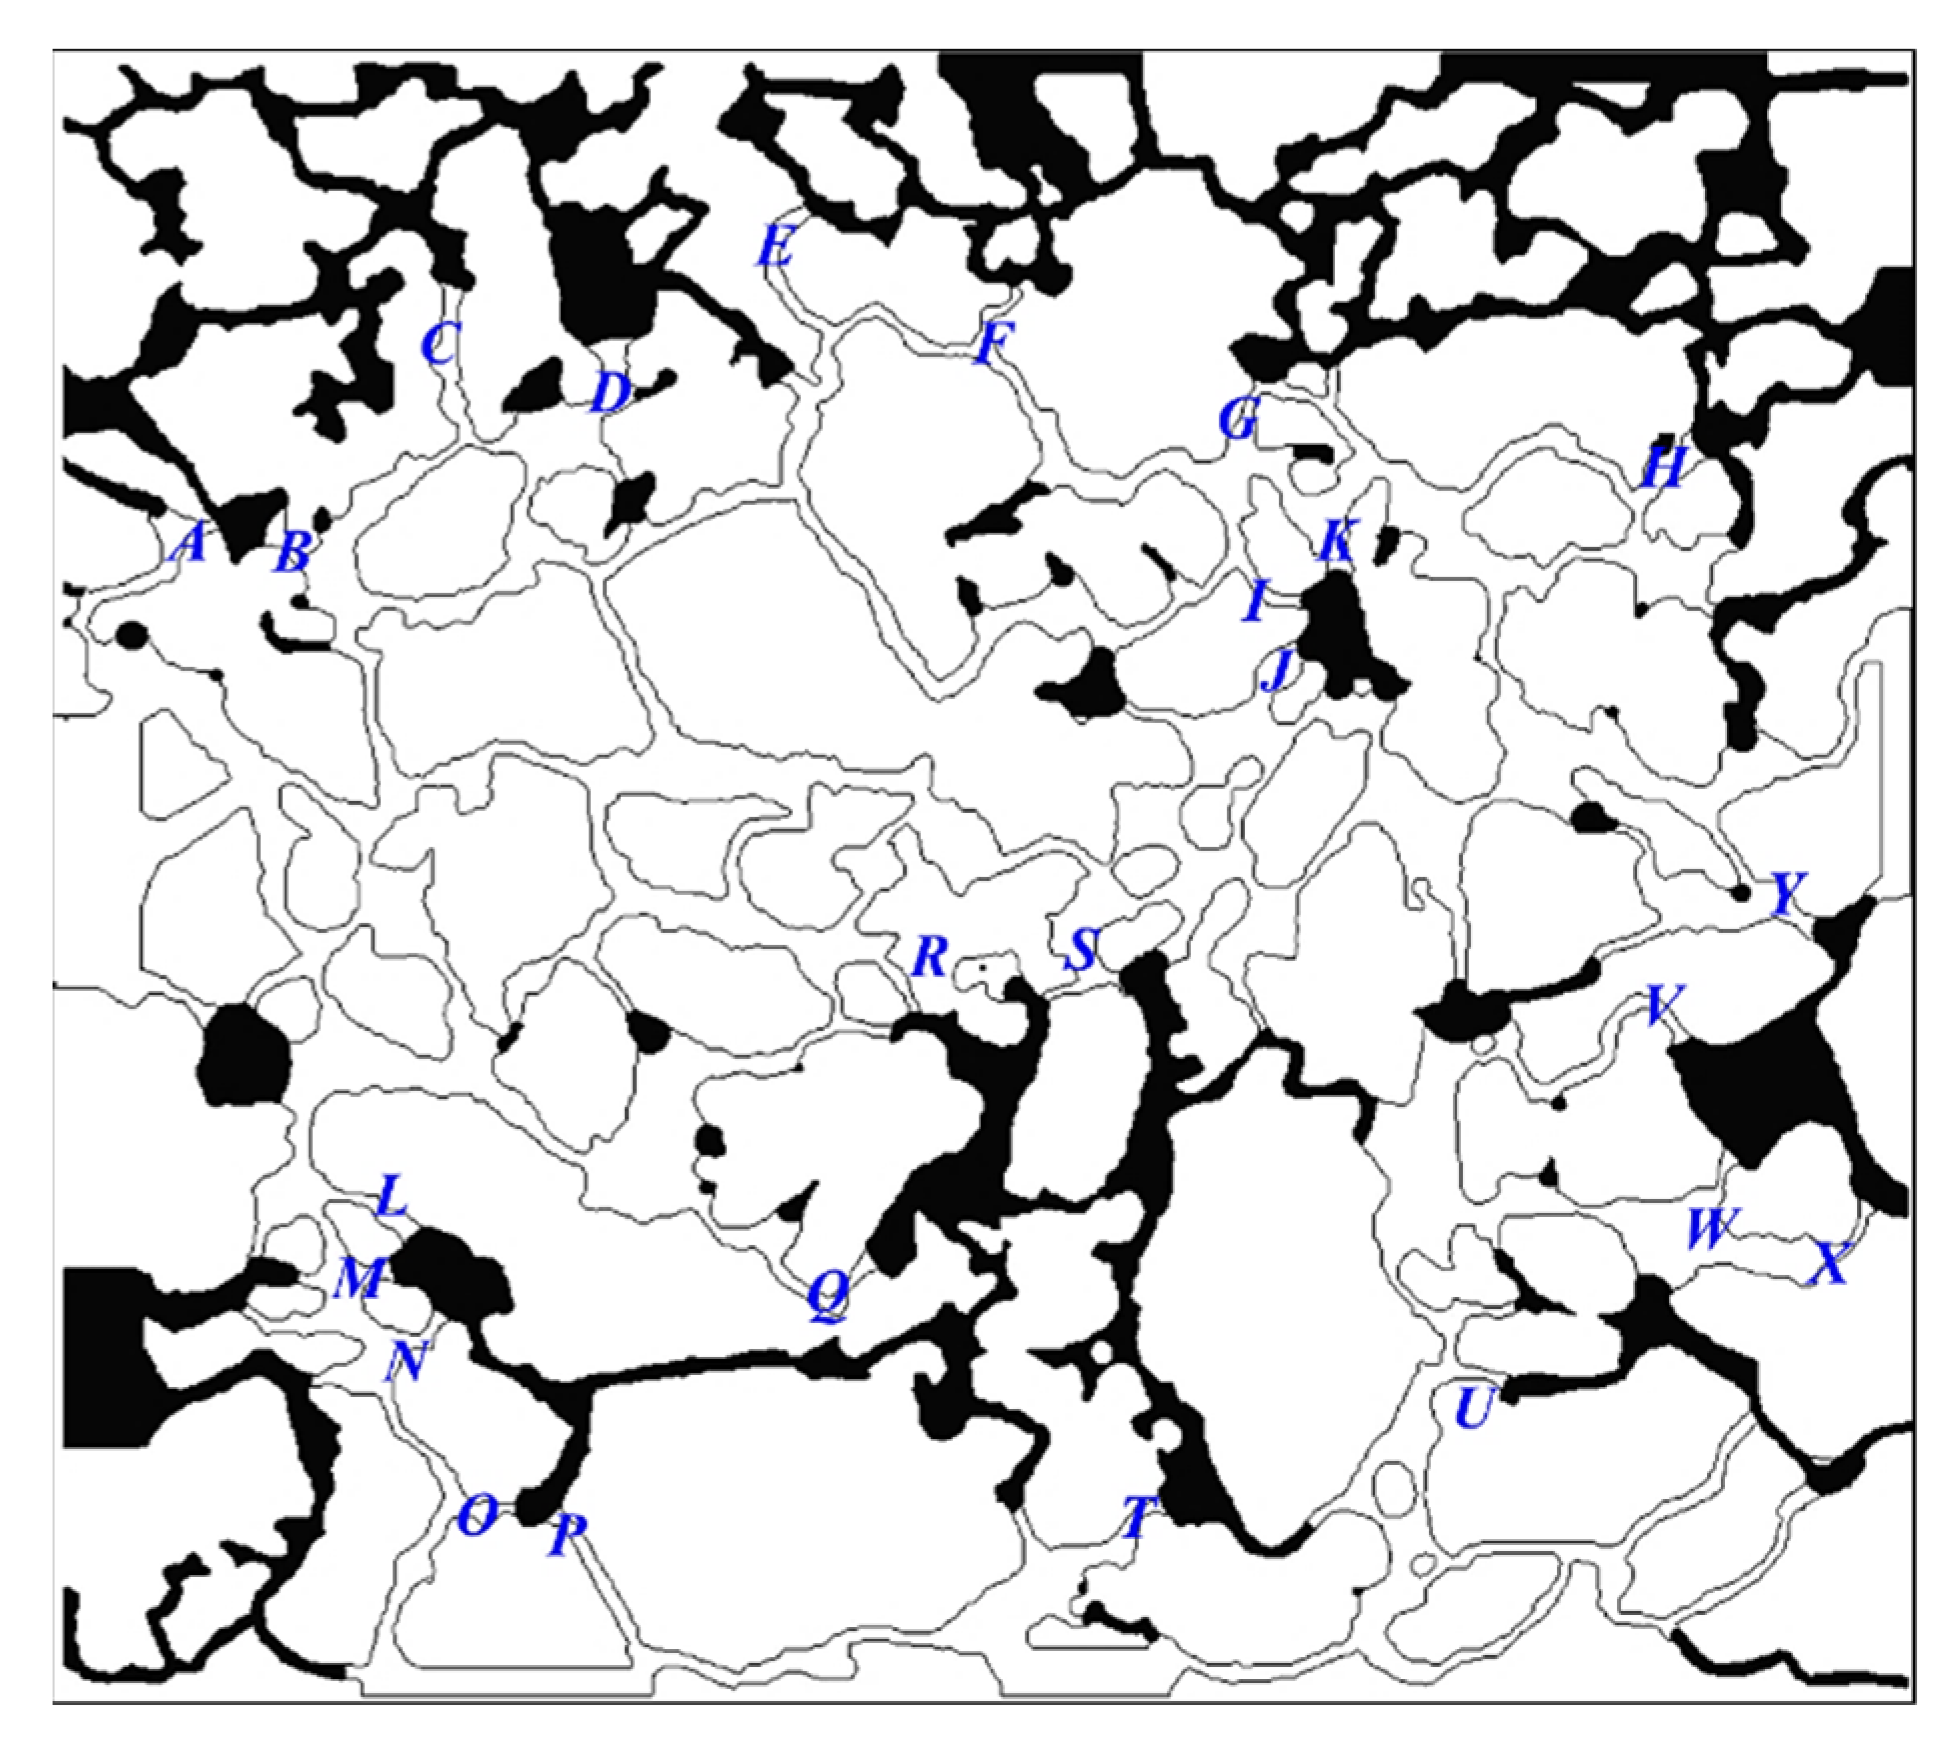
3.2. Conceptual Physical Model of Capillary Barrier

In view of the aforementioned capillary barrier phenomenon, a cylindrical tube model is presented in Figure 3. The proposed capillary barrier model with circular cross-section is analogous to a regular cylindrical tube. The length of the inlet section, the throat section, and the outlet section of the model are L and the throat radius is r. The unit of length L is m. θ is the contact angle of the water phase and β is the opening angle, as shown in Figure 3. The unit of the angle is a degree. The opening angles in the inlet section and the outlet section are identical. The liquid will flow through the throat section from the inlet section and then flow out of the channel from the outlet section. The origin of the coordinate is set at the center of the cross-section of the inlet section.

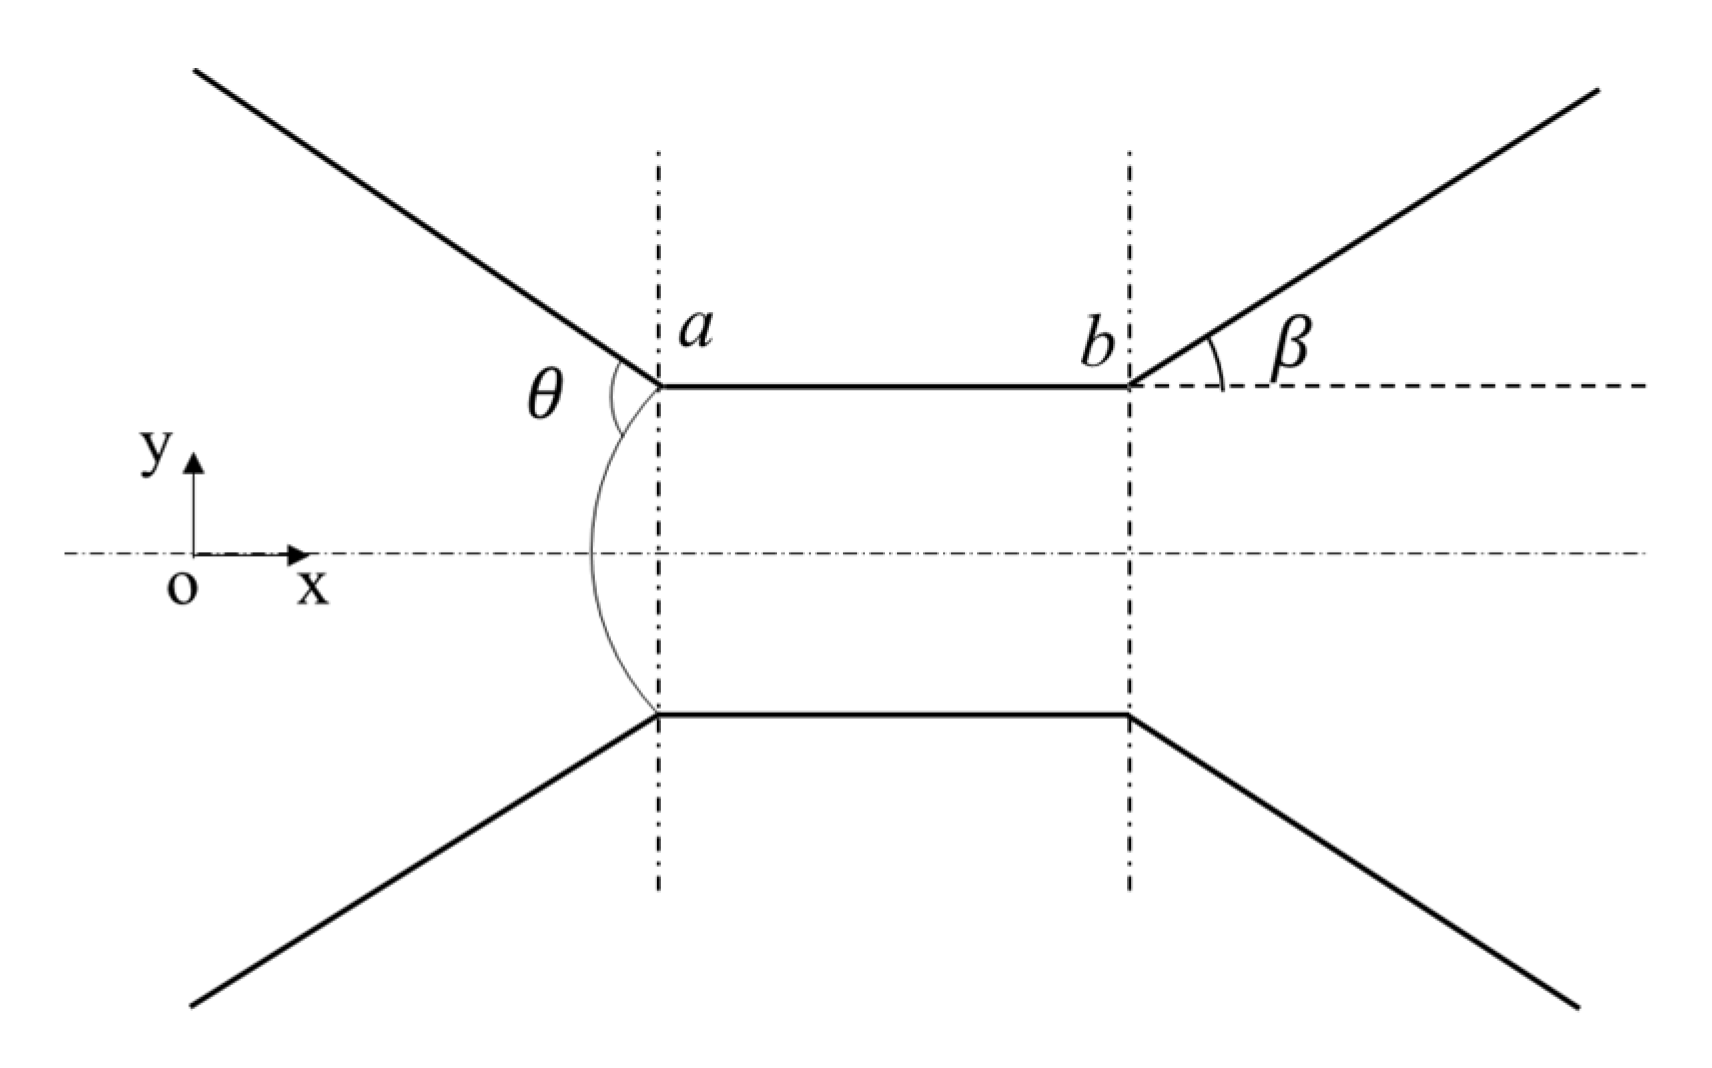
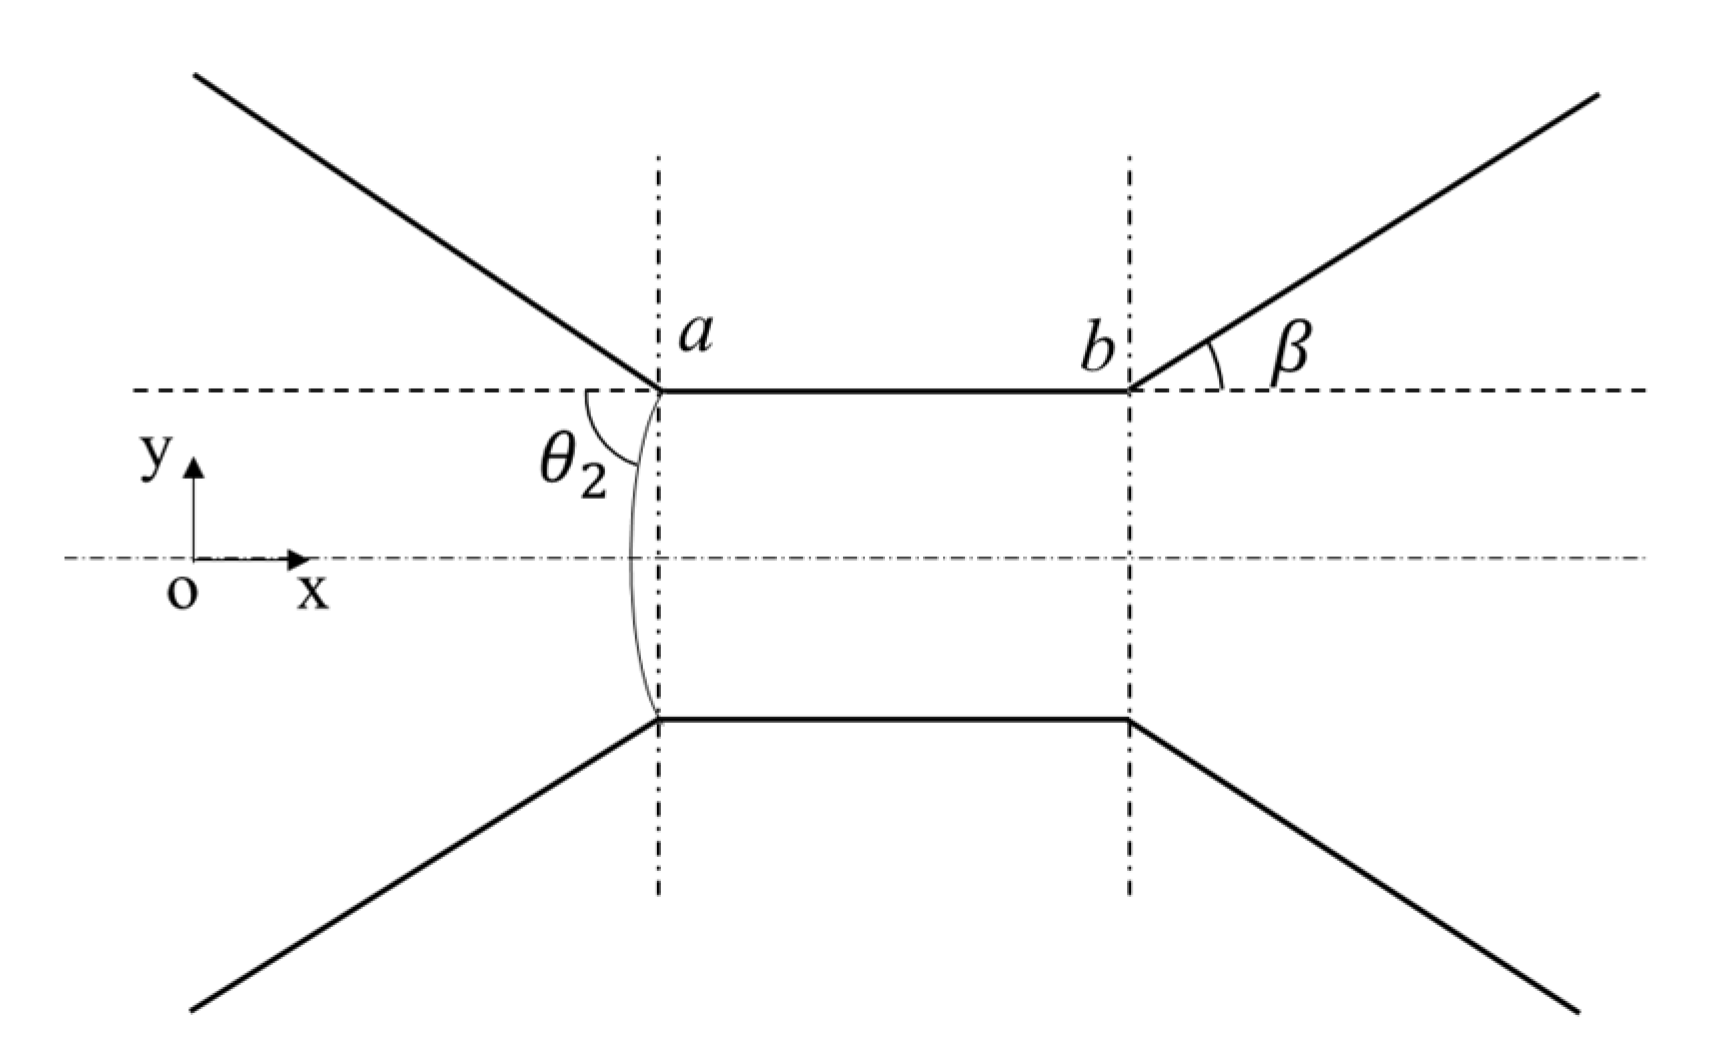
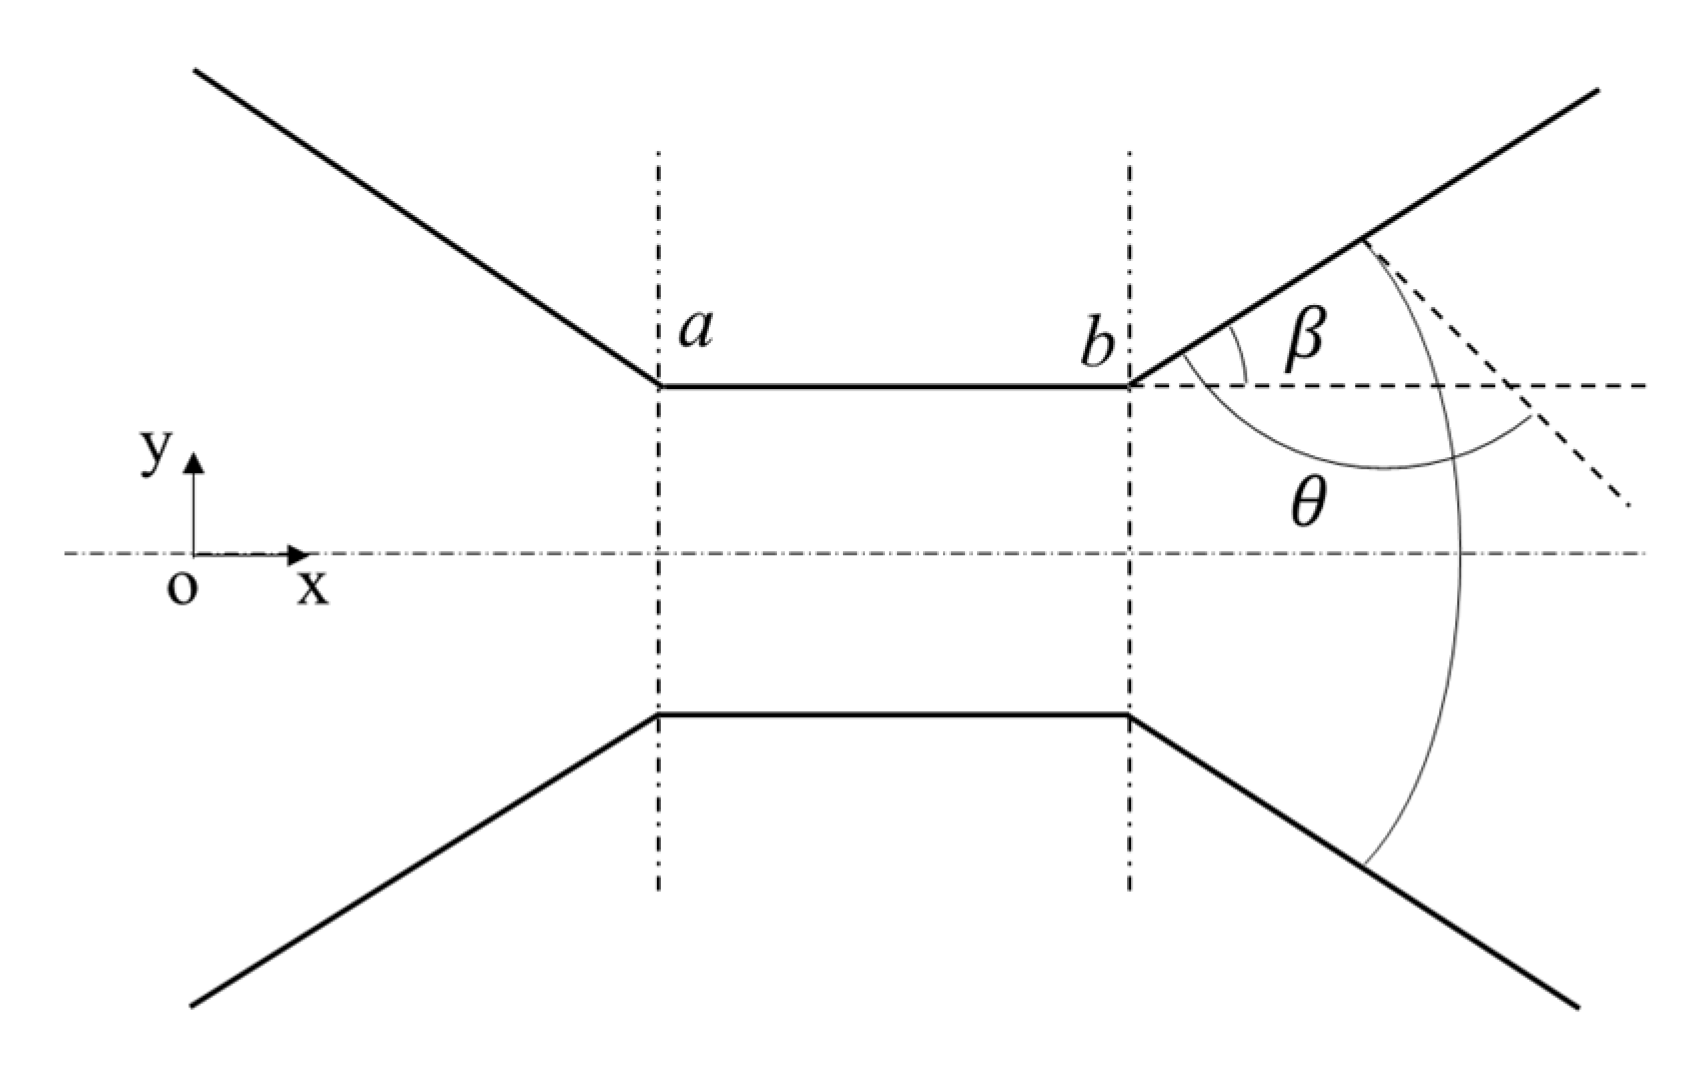
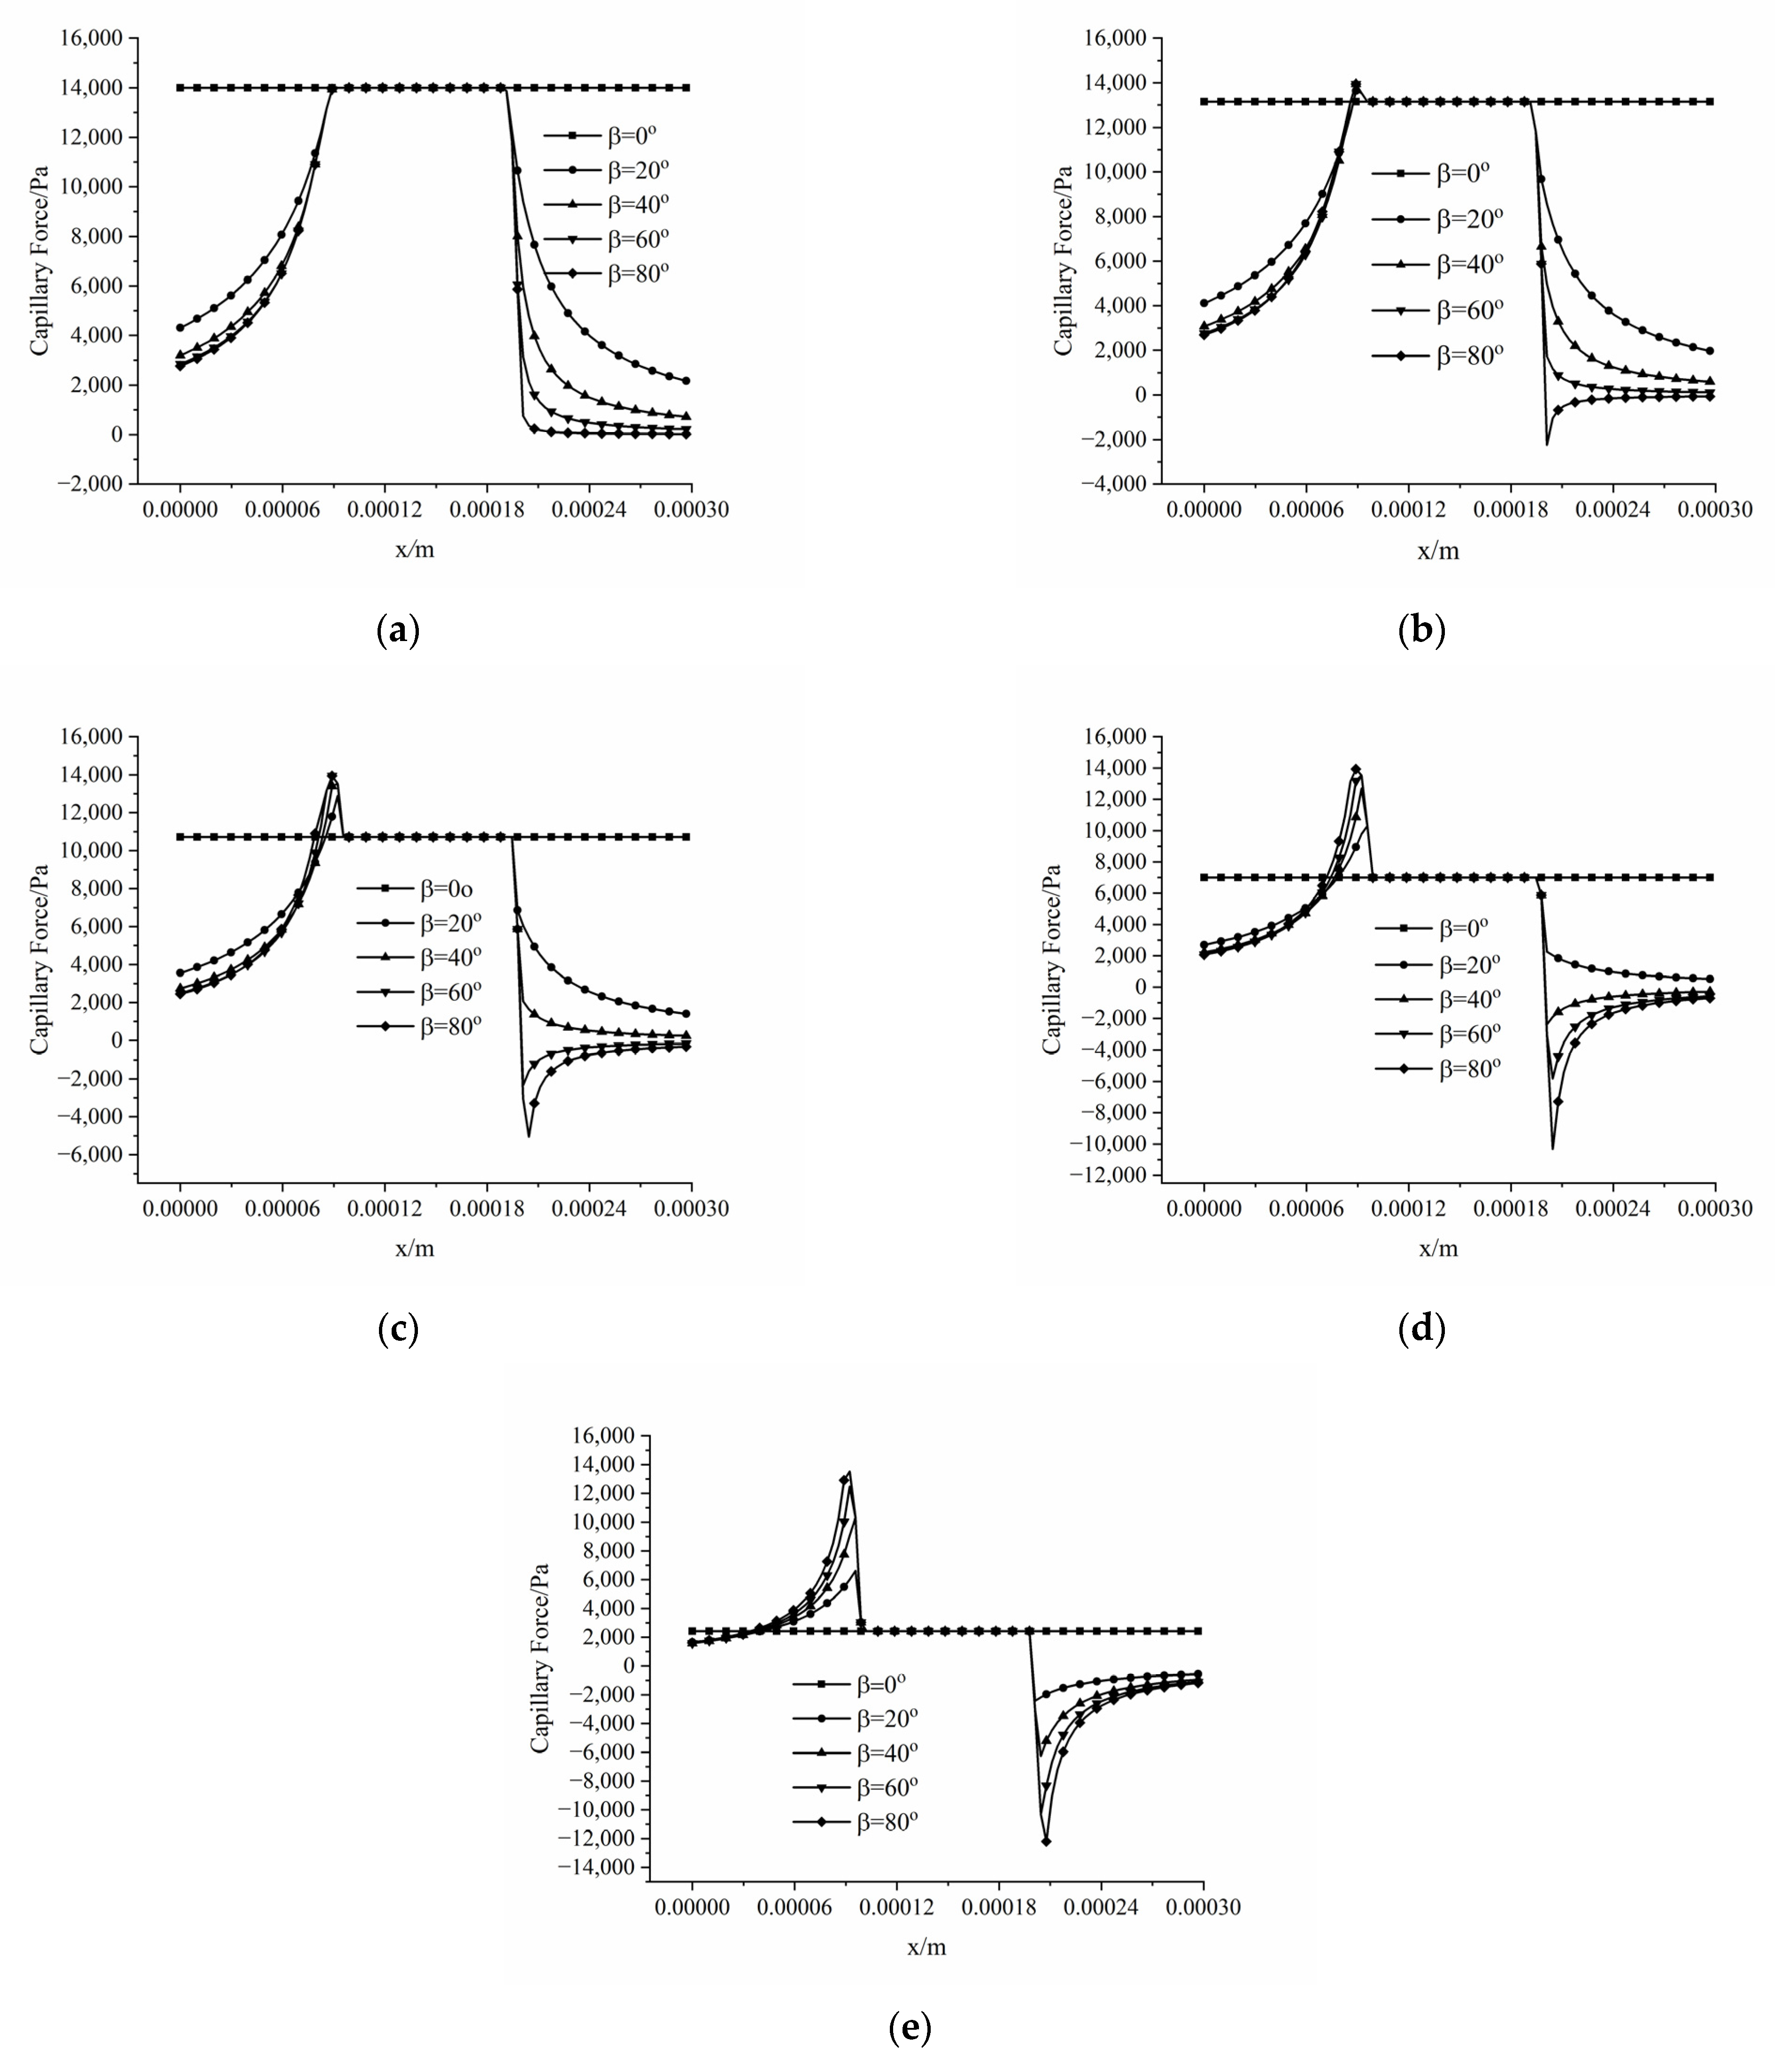
3.3. Variation of the Capillary Force along the Central Axis

3.3.1. Analysis of the Capillary Force at Different Stages

The pressure difference across the static interface can be calculated based on the Young–Laplace equation and the surface energy equation and the relevant equations are given by
p = γ ow ( k 1 + k 2 )
γ s w + γ o w cos θ = γ o s
where ∆p is the pressure difference across the interface, Pa; γow is the interfacial tension of the oil–water interface, N; k1 and k2 are components of the curvature of the oil–water interface in two perpendicular directions, m−1; γsw is the interfacial tension of the water–solid interface, N; γos is the interfacial tension of the oil–solid interface, N.
It is worth noting that the contact angle θ is a constant during the process of oil–water two-phase flow. However, in order to derive expressions of capillary force in all the situations, the θ adopted in the figure can be different. At the same stage, different symbols of θ are used if there are different situations about the relation between contact angle θ and opening angle β. Otherwise, θ is used.
The advancing of the oil–water interface in the physical capillary barrier model can be divided into five stages.
Stage I: The solid–liquid contact line advances along the wall of the capillary channel from the leftmost end to position a, and the process is shown in Figure 4. The position of the interface at this stage satisfies the following condition:
0 x < L r 1 + sin ( β θ ) cos ( β θ )
At stage I, with the continuous advancing of the interface from left to right, the radius of the capillary barrier tube gradually decreases, and the capillary force continues to increase. Here, the equivalent radius is the curvature radius of the oil–water interface. Thus, the equivalent capillary tube radius can be derived from the geometrical relationship of the capillary tube, which can be written as
R = ( L x ) sin β + r cos β cos θ + sin β
Due to the centrosymmetric property of the capillary barrier tube, the radii of curvature in two perpendicular directions are identical and can be given by
κ 1 = κ 2 = 1 / R
The pressure difference across the interface can be calculated by
p = 2 γ lg R
Stage II: The solid–liquid contact line stays at position a, but the contact angle initially formed by the liquid phase and the wall of the inlet section will gradually change to the one formed by the liquid phase and the wall of the throat section with the advance of the interface from left to right. Finally, a stable contact angle will be formed, and an immobile contact line will be observed, but the morphology of the interface is continuously changing; the initial state and the final state are shown in Figure 5 and Figure 6, respectively.
The position of the interface at stage II satisfies the following condition:
L r 1 + sin ( β θ 2 ) cos ( β θ 2 ) x < L r 1 sin θ 2 cos θ 2
The equivalent capillary tube radius R at this stage can be written as
R = ( ( L x ) 2 + r 2 ) 2 ( L x )
The change of the capillary pressure along the axis at this stage can be divided into two situations:
Situation 1. When β > θ2, the change of the capillary force is shown in Figure 7a. The equivalent capillary tube radius R changes from R1 to r, and then from r to R2; thus, the capillary force gradually increases and finally, it will reach the maximum value, which can be expressed as
p m a x = 2 γ lg r
Then, the capillary force will gradually decrease to a value when the stable contact angle is formed, and the value is given by
p = 2 γ lg r cos θ 2
Situation 2. When βθ2, the change of the capillary force is shown in Figure 7b. The equivalent capillary tube radius R changes from R3 to R4; thus, the capillary force is gradually decreasing along the axis.
Stage III: At this stage, the contact line moves in the throat section and the interface advances steadily from position a to position b. The initial state and the final state are illustrated in Figure 6 and Figure 8, respectively. The position of the interface at this stage satisfies the following condition:
L r 1 sin θ 2 cos θ 2 x < 2 L r 1 sin θ cos θ
The equivalent capillary tube radius R at this stage can be written as
R = r cos θ
The capillary force at this stage is constant (r/cosθ) and is closely related to the contact angle and the radius of the capillary tube.
Stage IV: At this stage, the contact line stops at junction b of the throat section and the outlet section. The contact angle will gradually change to the one formed by the liquid phase and the outlet section, and the contact line still stays immobile. The morphology of the interface is determined based on the contact angle θ and the opening angle β and can be divided into two situations:
Situation 1. When 0 < θ4 + β < 90°, the interface advances from the position shown in Figure 8 to the position shown in Figure 9a. The capillary force at this stage gradually decreases along the axis, but the value is always positive. Thus, no capillary barrier phenomenon is observed.
Situation 2. When θ4 + β ≥ 90°, the interface advances from the position shown in Figure 8 to the position shown in Figure 9b. The capillary force along the axis gradually decreases to zero and the value is negative. The capillary barrier is observed.
The position of the interface at this stage satisfies the following condition:
2 L r 1 sin θ cos θ x < 2 L r 1 sin ( θ 4 + β ) cos ( θ 4 + β )
The equivalent capillary tube radius R at this stage can be written as
R = ( 2 L x ) 2 + r 2 2 ( 2 L x )
The capillary barrier phenomenon occurs when θ4 + β ≥ 90° and the change of the equivalent capillary tube radius R is shown in Figure 10. The equivalent capillary tube radius gradually increases from R5 to +∞, then gradually decreases to R6. The negative values of the capillary force indicate the occurrence of the capillary barrier phenomenon. The plus or minus value of the capillary force is determined by the contact angle θ and the opening angle β. The capillary force with a positive value is the driving force, which will result in the displacement of the oil phase by the water phase; while with the advancing of the water–oil interface, the value of the capillary force becomes negative, which presents resistance characteristics, thus hindering the advancing of the water–oil interface movement just like a barrier.
Stage V: At this stage, the interface advances from the throat section to the outlet section and the change of the capillary force results from the change of radius of the capillary barrier tube. The morphology of the interface changes from Figure 9b, Figure 10, Figure 11.
The position of the interface at this stage satisfies the following condition:
2 L r 1 sin ( θ + β ) cos ( θ + β ) x < 3 L
The equivalent capillary tube radius R at this stage can be written as
R = ( x 2 L ) sin β + r cos β cos θ sin β

3.3.2. The Maximal Value and Minimal Value of the Capillary Force and Its Corresponding Conditions

From the abovementioned theoretical analysis of the position of the interface and the equivalent capillary tube radius at stage I presented in Section 3.3.1, the capillary force increases with x if R > 0, and the maximum capillary force is obtained when the rightmost value is assigned to R, which leads to the maximum driving force; while the capillary force decreases with the increase of x when R < 0, and the minimum capillary force is obtained when the rightmost value is assigned to R, which leads to the maximum resistance in this case. Therefore, the capillary force is a type of driving force when the interface enters the throat section if the following condition is satisfied:
| β θ | < 90 °
The opening angle β of pore space in oil reservoirs is generally less than 90°, and the capillary force is always a type of driving force under water-wet conditions, only when Equation (28) holds true; while the capillary force at stage I presents characteristics of driving force under oil-wet conditions if the opening angle β is large enough. The capillary force presents resistance characteristics if the following condition is satisfied:
θ β > 90 °
Based on the specific values of the contact angle θ and the opening angle β, the extrema of the capillary force under water-wet and oil-wet conditions when the interface entering the throat section and leaving the throat section are derived, as listed in Table 1, Table 2 and Table 3.
There are various types of pores and throats in realistic sandstone, and the radii of the pores and throats vary considerably with different positions. Generally, the radius at the junction of the pore space and the throat channel changes abruptly. From the abovementioned theoretical analysis presented in Section 3.3.1, it is noted that the capillary force under water-wet conditions is positive and is a type of driving force when the oil-wet interface advances in the throat section. The direction of the force (pointing to the concaved side of the interface) is consistent with the direction of the oil–water two-phase flow. The static contact angle formed by the interface and the wall of the pore space is θ when the liquid flows out of the throat section. When θ + β > 90°, the oil–water interface will reverse, and the direction of the capillary force will point to the side of the water phase. There exists a negative maximum value of the capillary force. In this case, the capillary force impedes the forward movement of the two-phase flow, that is, the capillary force under water-wet conditions can be changed to a type of resistance under certain conditions. The interface will stay immobile if the displacement force is insufficient to overcome the maximum resistance and the morphology of the interface continues to change, either increasing or decreasing the displacement force. The resistance dwindles when the displacement force is sufficient to overcome the maximum resistance and the interface can still move forward slowly under the low displacement pressure. Therefore, the displacement pressure must exceed a specific threshold value of the capillary force to displace the fluid. Once the displacement pressure exceeds the threshold value, the pressure needed to displace the fluid will gradually decrease.

3.4. Effect of Different Contact Angles and Opening Angles on the Capillary Force

The change of the capillary force with the position of the water phase at different stages under water-wet and oil-wet conditions can be obtained based on the proposed conceptual physical capillary barrier model, which are shown in Figure 12, Figure 13, Figure 14 and Figure 15.

3.4.1. Water-Wet Conditions

Figure 12 shows the change of the capillary force with the contact angle and the opening angle under water-wet conditions. As shown in Figure 12, the reverse of the oil–water interface is observed during the advancing process when θ + β > 90°, and the capillary force presents resistance characteristics, and there is a negative maximum value of p c m i n . The increase and decrease of the driving force in the process can only result in the deformation of the interface. When the driving force of the fluid is sufficient to overcome the maximum resistance, the resistance value will decrease, and the interface will continue advancing even at a small driving pressure. Therefore, the driving pressure must be above a certain threshold to induce fluid motion, and once this threshold value is reached, the displacement force required for fluid motion will decrease. The following can be known from Figure 12: (1) Under water-wet conditions, the capillary force is positive in the process of the liquid entering the throat section; (2) When θ > 0°, there exist extrema of the capillary force, but the maximum capillary force (Δpmax = 2γlg/r) appears when β > θ; (3) When β + θ > 90°, the capillary force is negative and the occurrence of the capillary barrier phenomenon can be observed in the process of the liquid leaving the throat section; (4) Define Δ = β + θ − 90°, which can characterize the intensity of the capillary phenomenon effect. The larger the value of Δ, the larger the extrema of the capillary resistance, indicating stronger capillary barrier effect.
Figure 13 shows the distribution of the maximum and minimum capillary force varying with contact angle θ and opening angle β under water-wet conditions. It can be observed from the Figure 13 that the minimum capillary pressure is obtained at the interface of liquid flowing out of the throat; while when 90° < β + θ, the minimum capillary pressure is negative, and the capillary barrier phenomenon occurs in the process of the liquid leaving the throat section.

3.4.2. Oil-Wet Conditions

Figure 14 shows the influence of opening angles on the capillary force with different contact angles under oil-wet conditions. As can be seen from Figure 14: (1) The capillary pressure is negative under oil-wet conditions when the liquid is leaving the throat section; (2) When θβ < 90°, there is a positive peak capillary pressure when the oil–water interface enters the throat from the pore; (3) Define Δ = 90° − β + θ; the larger the value of Δ, the larger the displacement force in the process of liquid entering the throat section.
Figure 15 shows the distribution of the maximum and minimum capillary force varying with contact angle θ and opening angle β under oil-wet conditions. As can be seen from Figure 15, the maximum capillary pressure is obtained at the interface of liquid entering the throat under oil-wet conditions. Generally speaking, the capillary pressure is negative, but when θβ < 90°, the capillary pressure is positive and can mobilize the fluid in the process of liquid entering the throat section.

4. Effect of the Capillary Barrier on Oil–Water Two-Phase Flow in Porous Media Model

4.1. Physical Model and Case Setup

In order to investigate the influence of the capillary barrier effect on oil–water two-phase flow and the oil displacement efficiency at a macroscopic scale, a two-dimensional porous media model with opening angle 45° is constructed in this paper based on the proposed capillary barrier model, which is shown in Figure 16. The shape of the pore cavity is a symmetrical octagon, and the length of each four wall edges is 40 2 × 10⁻⁶ m. The angle between the wall and the opening edge is 135° to ensure the opening angle is 45°. The length of the throat section is 40 × 10−5 m. The opening at the bottom left is the injection inlet of the water phase and the opening at the upper right is the outlet of the oil.
It should be stressed that the 2D model used here is different from the cylindrical model discussed above. The capillary force of a cylinder model (with radius r) should be two times that of a 2D model (with width 2r). Thus, in the simulation with the 2D model, the capillary force should be decreased by half relative to that with the cylinder model. However, the size of the pore channels used in the 2d model will not influence the occurrence of the capillary barriers. The capillary barrier criterion is only related to the contact angle and open angle but not the pore radius. Thus, the effect of the capillary barrier on the pore-scale flow behaviors should be captured using a 2D model and it is adopted for its simplicity.
It is reasonable to adopt a structured grid to simulate the oil–water flow dynamics in this porous media model. In the process of the structured grid generation, an opening edge and a wall edge of the pore cavity is considered as a set, the grid number at each edge is 20, and the total grid number is 2.2 × 10⁶. The parameters used in the simulation are listed in Table 4. Among the parameters, ∣v∣ is the velocity scalar of the water injection, vx, vy are the velocity components of the injection velocity of water phase in the x-y plane, σ is the surface tension coefficient, ρoil and ρwater represent the density of the oil and the water, μoil and μwater are the viscosity of the oil and water. Seven values of the contact angle (15°, 30°, 45°, 60°, 90°, 120°, 165°) are adopted in this simulation.

4.2. Numerical Conditions

The numerical boundary conditions are given in Table 5. Dirichlet boundary condition is used for velocity at the inlet and the wall, outlet pressure, inlet water volume fraction. Neumann boundary condition is employed for outlet velocity, inlet pressure and the wall, outlet water volume fraction. Constant contact angle boundary condition is adopted for water–oil–solid contact line on the wall. Gamma Scheme presented in work [33] is used to discretize the convection term and Crank–Nicolson scheme is used to discretize the time term [34]. The residual errors of different physical quantities were set to 10−6. The Courant number in the simulation was set to 0.1 and time step is adjusted adaptively [35].

4.3. Results and Discussion

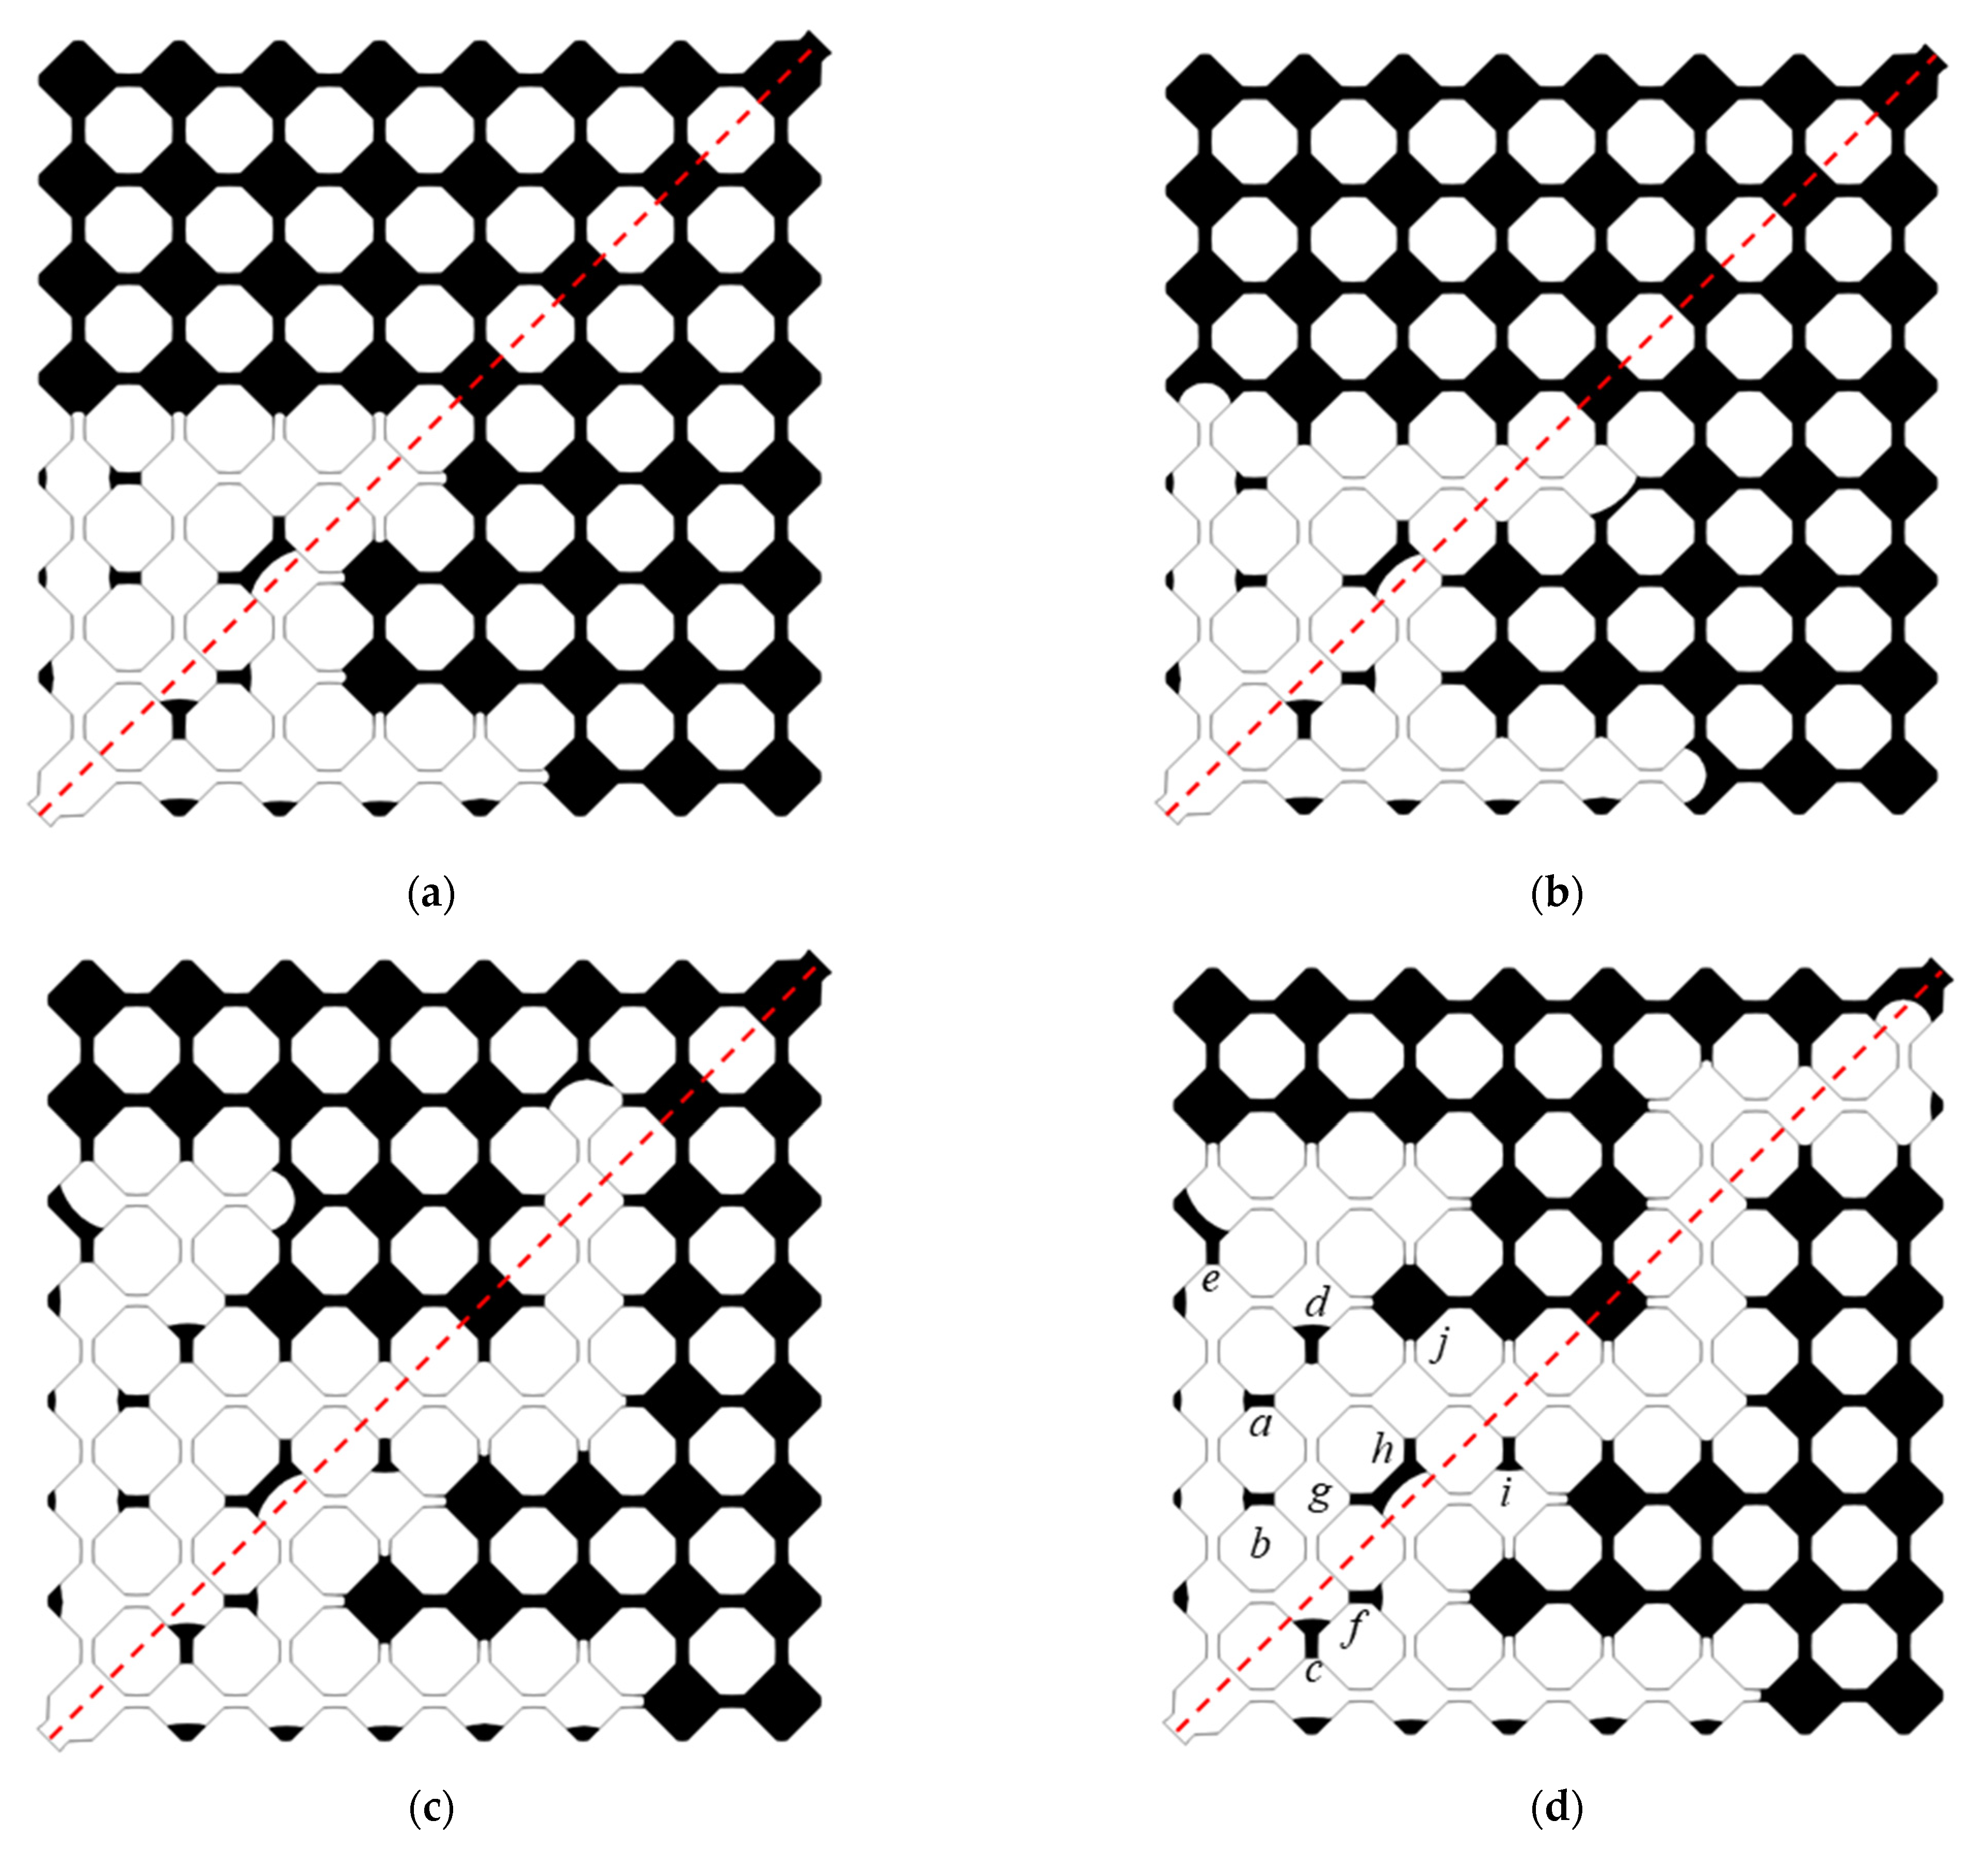
4.3.1. Water-Wet Condition

Better understanding of the characteristics of the oil–water two-phase flow pattern during waterflooding is necessary to elucidate the influence of the capillary barrier on the macroscopic immiscible displacement process. To this end, the dimensionless capillary number Ca is adopted to characterize the two-phase flow dynamics and is used to describe the relative importance of the viscous force to the capillary force, which can be defined as follows [36]:
C a = μ w a t e r V σ
where V is the injection velocity of the water phase, m/s; σ is the interface tension of the oil phase and water phase, N; μwater is the dynamic viscosity of the water, Pa·s.
Figure 17 shows the change of pressure difference between the inlet and outlet and the change of saturation of oil phase in the porous media model under water-wet conditions. It can be seen from Figure 17a that there are large fluctuations of the pressure difference between the inlet and outlet before and after the breakthrough of the water phase at the low capillary number of 1.8 × 10⁻⁴ and there are negative values of the pressure difference. This dramatic fluctuation can be explained by the instability induced by the strong capillary effects during a capillary-dominated displacement process at a low capillary number [28]. With the advancing of the water phase, small fluctuations of the pressure difference are observed, and the pressure difference is positive. Although the pressure difference in the process of liquid leaving the throat is negative, the decrease amplitude of the capillary force is still larger than the increase amplitude of the resistance induced by the capillary barrier effect. Therefore, the fluctuations of the pressure difference weaken. The capillary force plays a dominant role at low injection velocity. At the intermediate capillary number of 1.8 × 10⁻³, the capillary force and the viscous force are at play simultaneously. There are obvious fluctuations of the pressure difference before and after the breakthrough of the water phase and the value of the pressure difference is always above zero. At the large capillary number of 1.8 × 10⁻², viscous force plays a crucial role in the displacement process and there are little fluctuations of the pressure difference before the breakthrough of the water phase. This is because the frequency of Haines-jump events decreased with the increase of the capillary number and the displacement process is thus dominated by viscous fingering [37]. Large fluctuations of the pressure difference are observed after the breakthrough of the water phase. As can be seen from Figure 17b, the highest oil displacement efficiency under water-wet conditions is obtained at the intermediate capillary number of 1.8 × 10⁻³. The reason is that the sum of the contact angle and the opening angle satisfies the minimum conditions of the occurrence of the capillary barrier effect.
Dramatic fluctuations of pressure difference between and the outlet under water-wet conditions (the contact angle is 60°) and at low capillary number of 1.8 × 10⁴ are observed in Figure 18a. In order to clarify the underlying reasons behind the fluctuations, the waterflooding process is systematically investigated from the change of oil and water distribution, with time at capillary number of 1.8 × 10⁻⁴ shown in Figure 18, based on the aforementioned theoretical analysis of the capillary barrier phenomenon. Considering the value of the contact angle (60°) and opening angle (45°) in this case, the capillary force is positive and continues to increase until a maximum positive value is reached before the water phase flows into the throat channel. Then, the capillary force decreases suddenly to a stable value as the fluid fully flows into the throat channel. The capillary force here is a type of driving force; while when the fluid flows out of the throat channel, θ + β > 90°, the value of the capillary force becomes negative and decreases dramatically to a maximum negative value, which presents resistance characteristics. Therefore, the capillary blocking effect is generally observed when the fluid flows out of the throat channel. As shown in Figure 18, a large amount of residual oil keeps a stagnant state and is trapped in the pore space when the fluid leaves the throat channel. The displacement pressure is not sufficient to overcome the capillary barrier resistance formed at these sections, thus resulting in the trapping of the oil in the pore space. As shown in Figure 18d, the capillary barriers formed at position a, b, c, d, e, f, g, h, i, and j cannot be overcome even at the end of the displacement (0.0687 s).
Furthermore, a backflow phenomenon is observed at position c shown in Figure 18a and Figure 18b, which can be explained by the capillary inhibiting effect in parallel channels. The capillary imbibition will accelerate the fluid in the channel and has an inhibiting effect on the fluid in parallel channels. The continuous formation and breakthrough of the capillary barrier in the displacement process is the main reason for the fluctuations of pressure difference before time 0.0687 s. Therefore, the capillary pressure barrier plays a crucial role in determining the oil–water two-phase flow under low capillary numbers.
Figure 19 shows the distribution of oil and water in the porous media model with different capillary numbers under water-wet conditions. As shown in Figure 19, the oil–water interface stays immobile at the sudden expansion section of the pore–throat connection with the increase of the capillary number. Under a larger capillary number, the influence of the capillary force is relatively small, and the viscous force plays a leading role. The effect of the capillary front is not significant, and the water phase displaces the oil phase along the shortest path (main path); while the liquid following along other paths flows at relatively low speed and the residual oil is displaced rapidly from the pore space when the liquid flows along the main path. The effect of the capillary barrier on the fluid mobilization in other paths weakens as with the decrease of the resistance along the main path. Under lower capillary numbers, the capillary force is dominant, and the effect of the capillary front is significant, thus resulting in the detour flow. When the water flows out of the outlet, the decreased pressure difference is insufficient to overcome the capillary force and the residual oil is trapped in the pore space. From the authors’ perspective, the pressure drop along the channel is mainly due to the viscous dissipation of the fluid. The higher injection velocity of the water phase results in a relatively weaker capillary barrier effect, which indicates that the breakthrough of the water phase occurs along the diagonal line of the porous media and the porous media will be quickly filled with the water phase; while the lower injection of the water phase results in the relatively stronger effect of the capillary barrier, which indicates that the breakthrough of the water phase is not along the diagonal line and the porous media will be slowly filled with the water phase, which leads to larger sweep area.

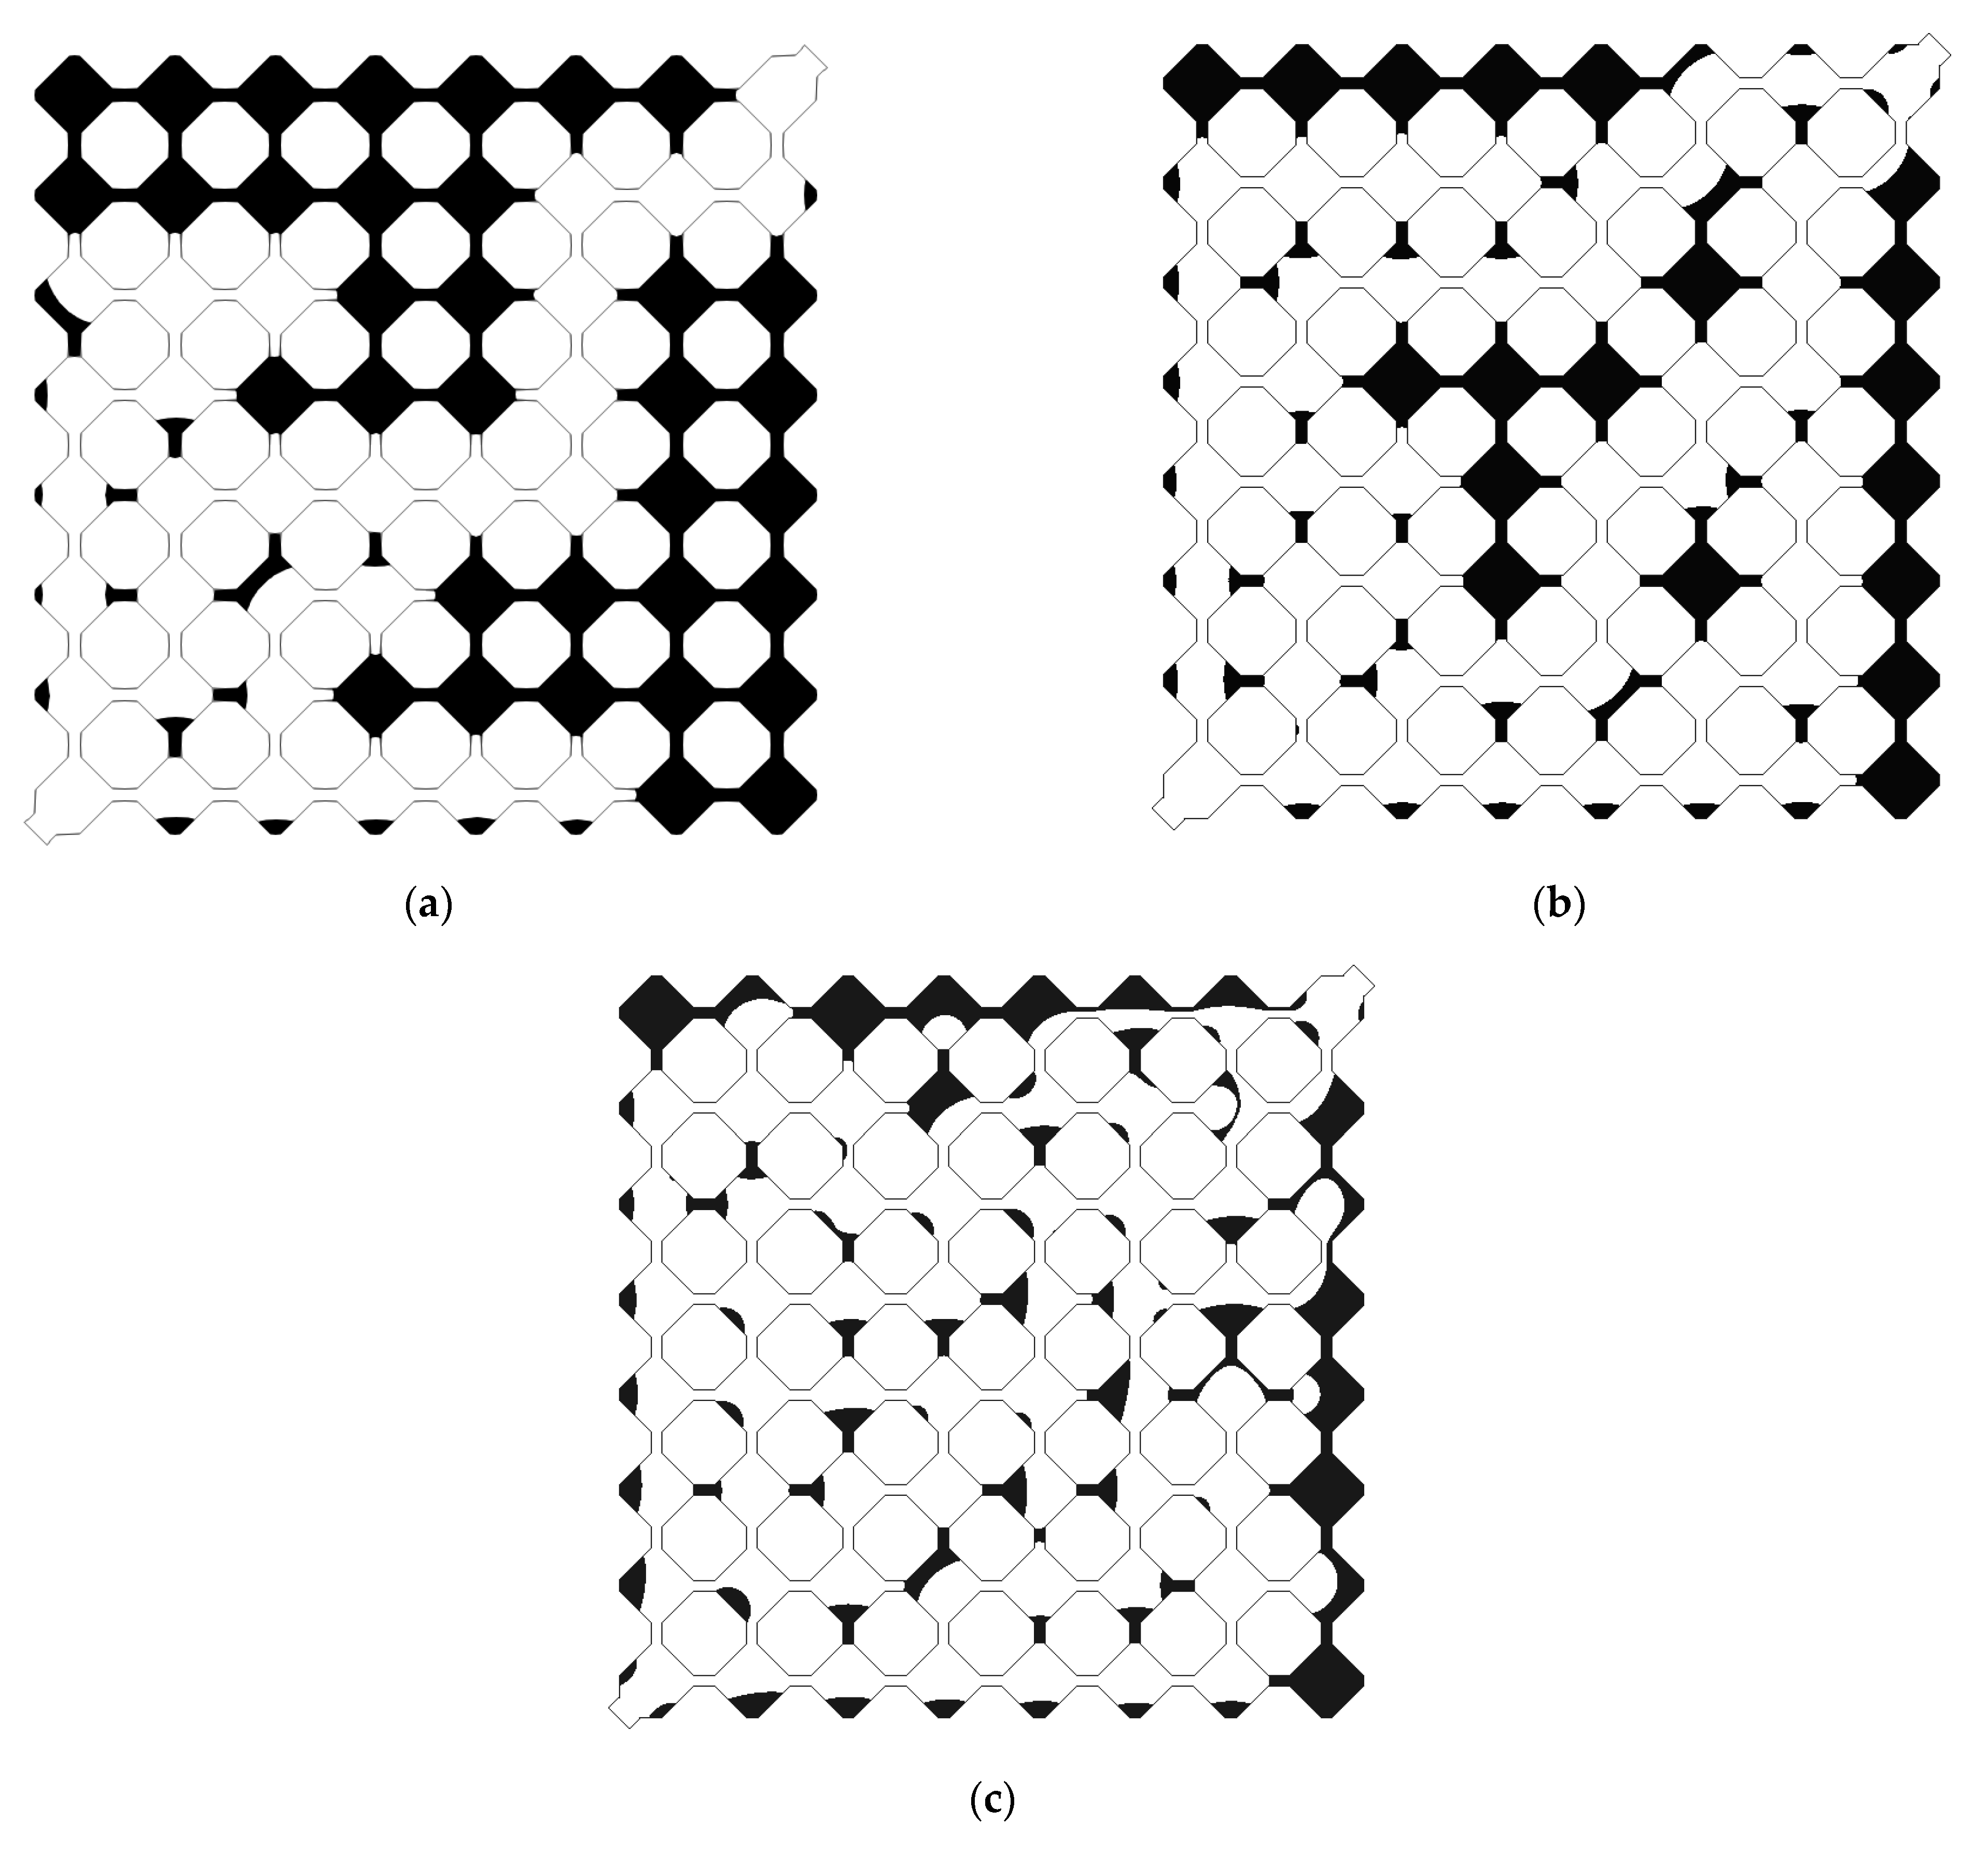
4.3.2. Oil-Wet Condition

Figure 20 shows the change of pressure difference between the inlet and outlet and the change of saturation of oil phase in the porous media model under oil-wet conditions. As can be seen from Figure 20a, there is a large fluctuation amplitude of pressure difference before and after the breakthrough of the water phase at the large capillary number of 1.8 × 10⁻², which is more obvious than the fluctuation amplitude of the pressure difference at the capillary number of 1.8 × 10⁻⁴ and 1.8 × 10⁻³. With the advancing of the water phase, small fluctuations of the pressure difference are observed. It can be seen from Figure 20b that the highest oil displacement efficiency is obtained at the large capillary number of 1.8 × 10⁻², which indicates that the larger the capillary number, the higher the oil displacement efficiency. The higher capillary number indicates that the viscous force dominates the displacement process, which will result in the viscous fingering, and the high capillary pressure in the pore space can be overwhelmed, which will enhance the oil recovery rate [19]. Under oil-wet conditions, the occurrence of the capillary barrier effect facilitates the mobilization of the fluid phase, and the increase of the sweep area when θβ ≤ 90° thus improves the oil displacement efficiency.
Figure 21 shows the change of oil and water distribution with time at the capillary number of 1.8 × 10⁻⁴ under oil-wet conditions. As shown in Figure 21, a couple of capillary barriers are formed in the throat section (as shown in Figure 21d at position a, b, c, d, e, f, g, h, i, j) and some of the residual oil is trapped in the dead end of the pore space and cannot be displaced from the outlet. Considering θβ < 90° in this case, the capillary force is positive and there is a maximum positive value of the capillary force when the fluid flows into the throat channel and is a type of driving force. Then, the capillary force decreases to a stable negative maximum value in the throat channel and presents resistance characteristics. The capillary force will gradually increase and is still negative when the fluid flows out of the throat channel. That’s why part of the residual oil stays stagnant or stays trapped in the throat channel or pore space. At the end of the displacement (0.0736 s), a water-bearing channel is formed in Region I and the residual oil trapped in the lateral direction cannot be extracted thereafter. Likewise, the dramatic fluctuations of pressure difference between the inlet and outlet are due to the formation and breakthrough of the capillary barrier alternatively at low capillary numbers, and the capillary inhibiting effect in parallel channels is also observed in this case.
Figure 22 shows the distribution of oil and water in the porous media model with different capillary numbers under oil-wet conditions. As can be seen from Figure 22, the water flows along both sides of the diagonal line of the porous media model at the initial stage and only part of the water can flow into the intermediate region along the diagonal line. Then, the interface of both sides of the diagonal line of the model becomes stagnant at the increase of the displacement force. At the final stage, the water flows out of the model along the diagonal line of the model. The high injection rate leads to the increase of the pressure along with the main displacement direction and viscous force dominating the displacement process, while too high an injection rate can inhibit the spontaneous imbibition perpendicular to the injection direction [38]. The capillary force induced by the capillary barrier phenomenon is a type of driving force in the process of liquid entering the throat section at the contact angle of 120°, which results in a larger sweep area on both sides of the diagonal line, thus, largely improving the oil displacement efficiency. Therefore, when the minimum conditions of the occurrence of the capillary barrier phenomenon are stratified, the blocking effect induced by the capillary barrier phenomenon will lead to an increased sweep area of the water phase, and the further movement of the displacement front will not be hindered, which further enhances the oil displacement efficiency.

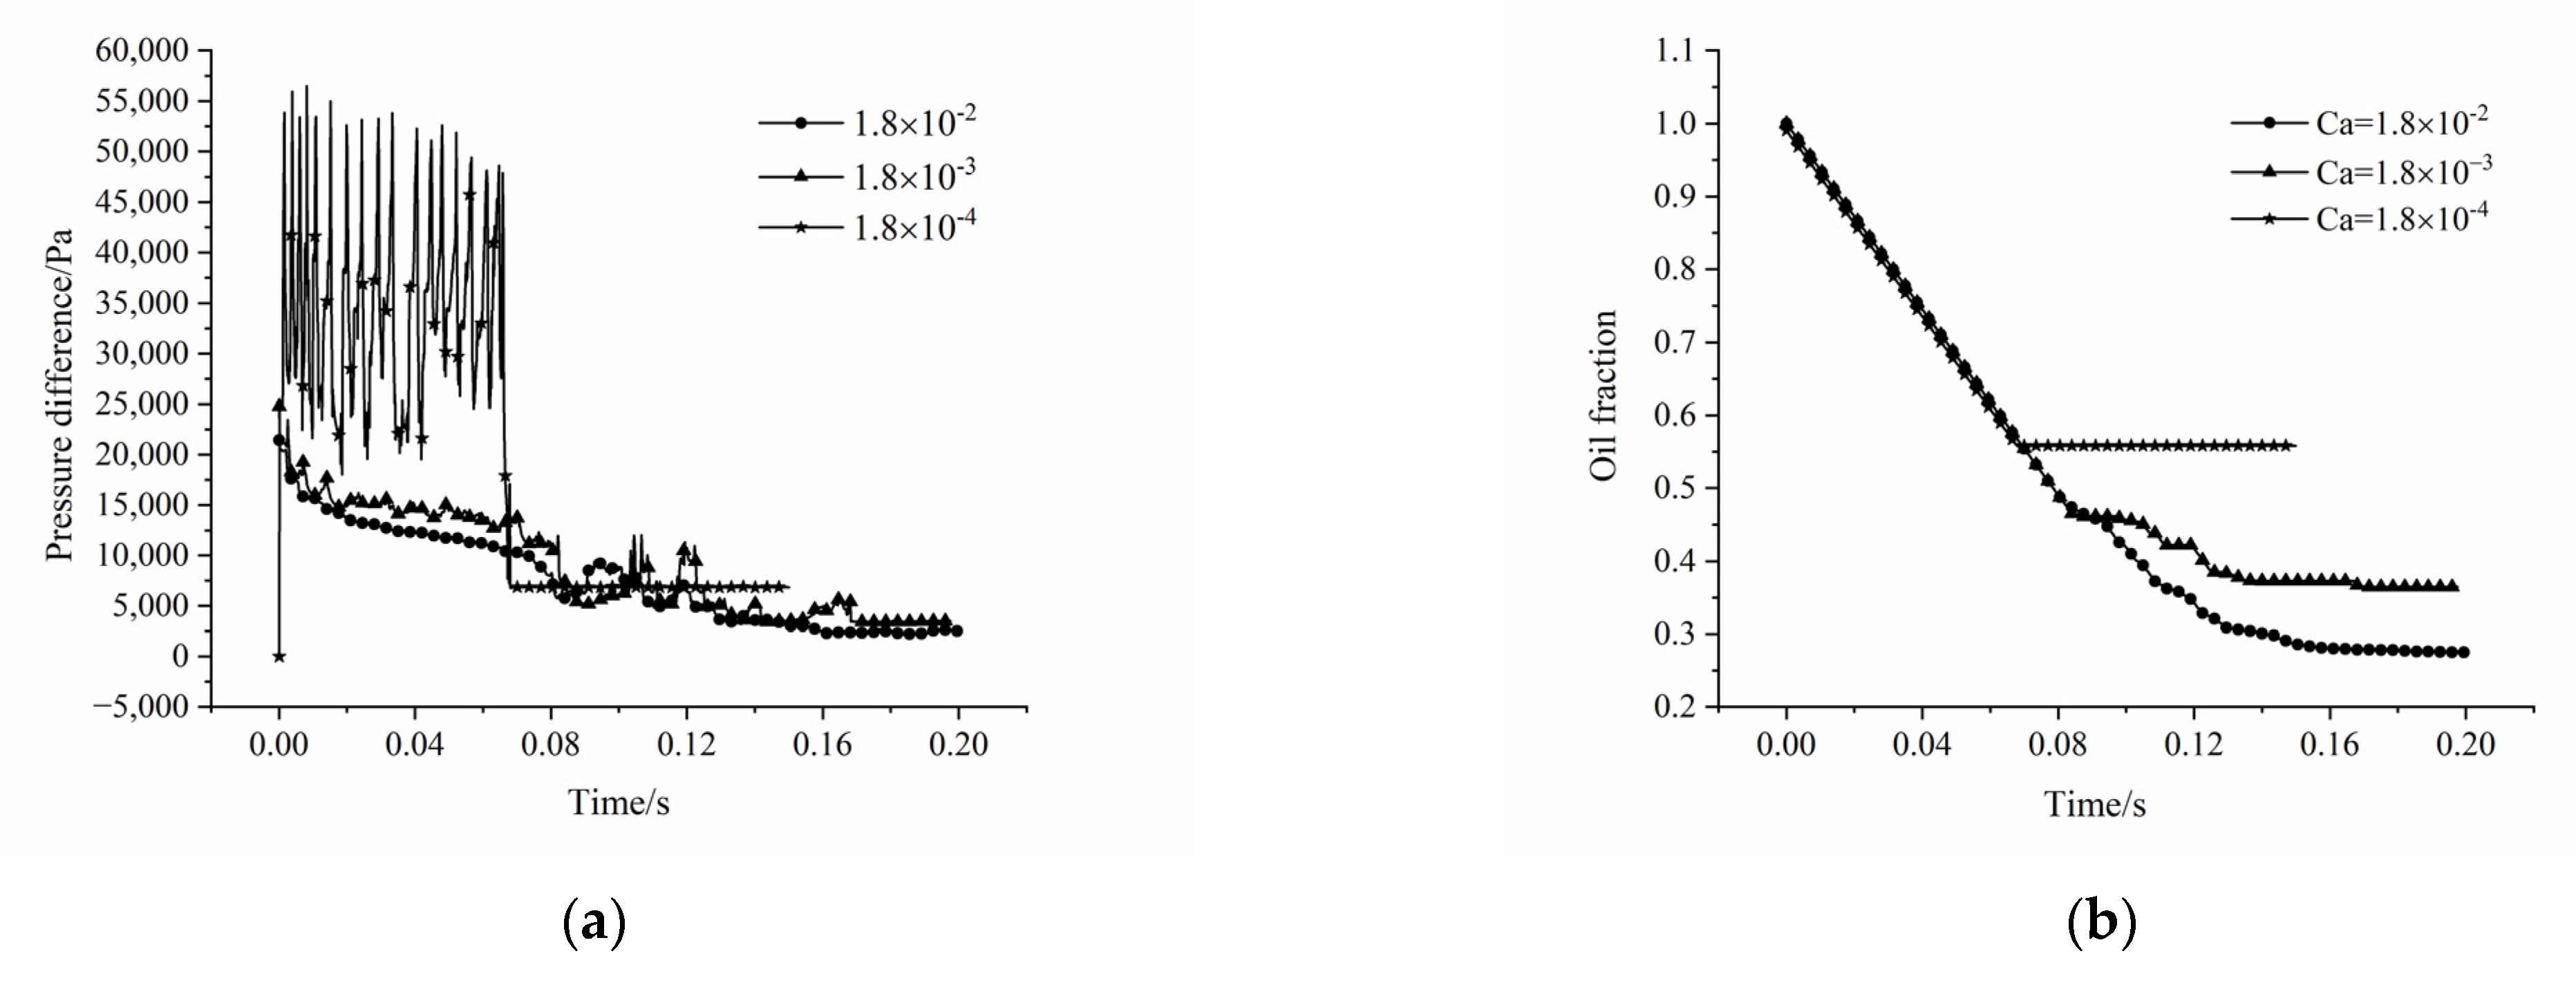
4.3.3. The Change of Oil Displacement Efficiency

Seven different values of the contact angle (θ1~7: 15°, 30°, 45°, 60°, 90°, 120°, 165°) are chosen for the porous media model with an opening angle of 45° in order to investigate the influence of the capillary barrier effect on the macroscopic oil displacement efficiency. Numerical simulations are performed to investigate the change of the oil displacement efficiency with contact angles and the influence of the capillary barrier effect on the change of the distribution of the oil and water in the porous media model based on the aforementioned oil–water two-phase flow dynamic model. The conditions of optimal oil displacement efficiency in the porous media model with capillary barrier correspond to different opening angles. In the case of the intermediate capillary number, that is, the viscous force and capillary force are at play, and the optimal oil displacement efficiency is obtained when the minimum conditions of the occurrence of the capillary barrier phenomenon are satisfied.
Figure 23 shows the change of oil displacement efficiency with the capillary numbers and the distribution of oil and water in the porous media model when the optimal oil displacement efficiency is obtained. It can be seen from Figure 23 that under oil-wet conditions, the larger the capillary number, the higher the oil displacement efficiency; while under water-wet conditions, the optimal oil displacement efficiency is obtained under intermediate capillary numbers and at the contact angles that the capillary barrier phenomenon cannot be observed. In addition, the sweep area of water flooding in the intermediate region of the porous media model is increased by the capillary barrier effect, and the oil displacement efficiency is higher on both sides of the intermediate region along the diagonal line. At the contact angle of 45°, the effect of the dynamic mobilization of the water phase is stronger than that at the contact angle of 30° without considering the process of the liquid leaving the throat, and the displacement force prompts the advancing of the displacement front on both sides.
There is a significant difference in the oil displacement efficiency before and after the occurrence of the capillary barrier phenomenon. A stronger capillary barrier effect will impede the advancing of the displacement front, thus reducing the sweep area of the water phase. However, the capillary barrier effect can be used to increase the sweep area of the displacing phase especially in the case that the capillary barrier effect and the viscous force are at play in the waterflooding process. The weaker capillary barrier effect will prevent the displacement front from advancing along a path with the minimum resistance, which will result in the formation of a stable channel to discharge the water phase. To increase the displacement pressure will not work and the displacement front will switch to other routes instead of advancing along a path with large resistance, which will result in the formation of a pause and breakthrough of the blocking, thus improving the oil displacement efficiency to a large extent.

5. Conclusions

In this paper, detailed theoretical analysis of the capillary barrier phenomenon as well as its occurrence conditions are identified under different wetting regimes, and the oil–water two-phase flow dynamics in the porous media model are investigated using direct numerical simulations (DNS) coupled with the volume of fluid method at different capillary numbers. The main conclusions drawn from this study are as follows:
  • The capillary barrier effect is largely responsible for the formation of the residual oil in the reservoir rock. The interplay between the capillary force and viscous force determines the oil–water two-phase flow in the porous media; and the capillary barrier effect is caused by a geometric structure; even in the water-wet conditions, capillary force can still present resistance characteristics. The negative values of capillary force indicate the occurrence of the capillary barrier phenomenon. The capillary force is a type of driving force when the interface enters the throat section if the condition | β θ | < 90 ° is satisfied. The capillary force presents resistance characteristics if the condition θ β > 90 ° is satisfied. When θ + β > 90°, the oil–water interface will reverse, and the direction of the capillary force will point to the side of the water phase.
  • The occurrence of capillary barrier phenomena under different wettability regimes are mainly dominated by the contact angle and the opening angle during the oil displacement process. Under water-wet conditions, the capillary force is positive in the process of the liquid entering the throat section. The capillary force is negative, and the occurrence of the capillary barrier phenomenon can be observed in the process of the liquid leaving the throat section when β + θ > 90°; while under oil-wet conditions, the capillary force is negative when the liquid is leaving the throat section, and there is a positive peak capillary pressure when the oil–water interface enters the throat from the pore once the condition θβ < 90° is satisfied.
  • The highest oil displacement efficiency under water-wet conditions is obtained at the intermediate capillary number of 1.8 × 10⁻³ and obvious fluctuations of the pressure difference before and after the breakthrough of the water phase are observed; while the highest oil displacement efficiency under oil-wet conditions is obtained at the large capillary number of 1.8 × 10⁻² and the occurrence of the capillary barrier effect facilitates the mobilization of the fluid phase and the increase of the sweep area when θβ ≤ 90°.
  • Under oil-wet conditions, the larger the capillary number, the higher the oil displace-mint efficiency; while under water-wet conditions, the optimal oil displacement efficiency is obtained under intermediate capillary numbers and at the contact angles at which the capillary barrier phenomenon cannot be observed.
However, the established porous media model in the present study can preliminarily illustrate the influence of the capillary barrier effect on the oil–water two-phase flow to some extent; the model is relatively simple, which is limited in characterizing the realistic structure of the oil reservoir rock. Besides, the role of surface roughness, the advancing and receding of the contact angle, and the gradual change of the geometrical structure have not been considered in this work, which do have a far-reaching impact on the oil–water two-phase flow in the porous media. However, it is difficult to obtain analytical results when considering the effects of these factors. Numerical methods or microfluidics techniques may be better options.

Author Contributions

Data curation, B.H. and C.Z.; Formal analysis, B.H.; Investigation, B.H., L.W. and C.H.; Methodology, J.S.; Supervision, Z.G. and J.S.; Visualization, B.H.; Writing—original draft, B.H.; Writing—review & editing, Z.G. and J.S. All authors have read and agreed to the published version of the manuscript.

Funding

This research was funded by the National Natural Science Foundation of China, grant number: (12072256, 42141011); Key research and development program in Shaanxi Province of China, grant number: 2021GXLH-Z-071; Excellent Youth Foundation of SINOPEC (P20009).

Institutional Review Board Statement

Not applicable.

Informed Consent Statement

Not applicable.

Data Availability Statement

Not applicable.

Conflicts of Interest

The authors declared that there is no conflict of interest.

Appendix A. Solution Scheme and Solution Procedures

Numerical solution methods currently available are divided into coupled and splitting types. The splitting type is widely used due to its simple and convenient characteristics. The most commonly used method for solving flow problems is the pressure correction method, which includes SIMPLE [39], SIMPLEC [40], PISO [41], and other algorithms. Among them, PISO algorithm can greatly reduce the number of iterations for unsteady flow problems, thus further improving the efficiency of the calculation. In this paper, the PISO algorithm is used to calculate the velocity and pressure fields, and the calculation procedure is shown in Figure A1.
Figure A1. Schematic diagram of the calculation procedure for PISO algorithm.
Applsci 12 06285 g0a1
The procedures for solving the system of equations during the numerical simulation process in this paper can be described as: First, the momentum Equation (2) is discretized using the finite volume method to obtain the velocity field u, then the pressure Poisson equation is derived using the PISO algorithm, the volume fraction Equation (8) is solved to obtain the volume fraction at the next time step, and the fluid properties are tracked using Equations (10) and (11), and then the process is looped to the first step until the end of the cycle or the convergence accuracy is reached.

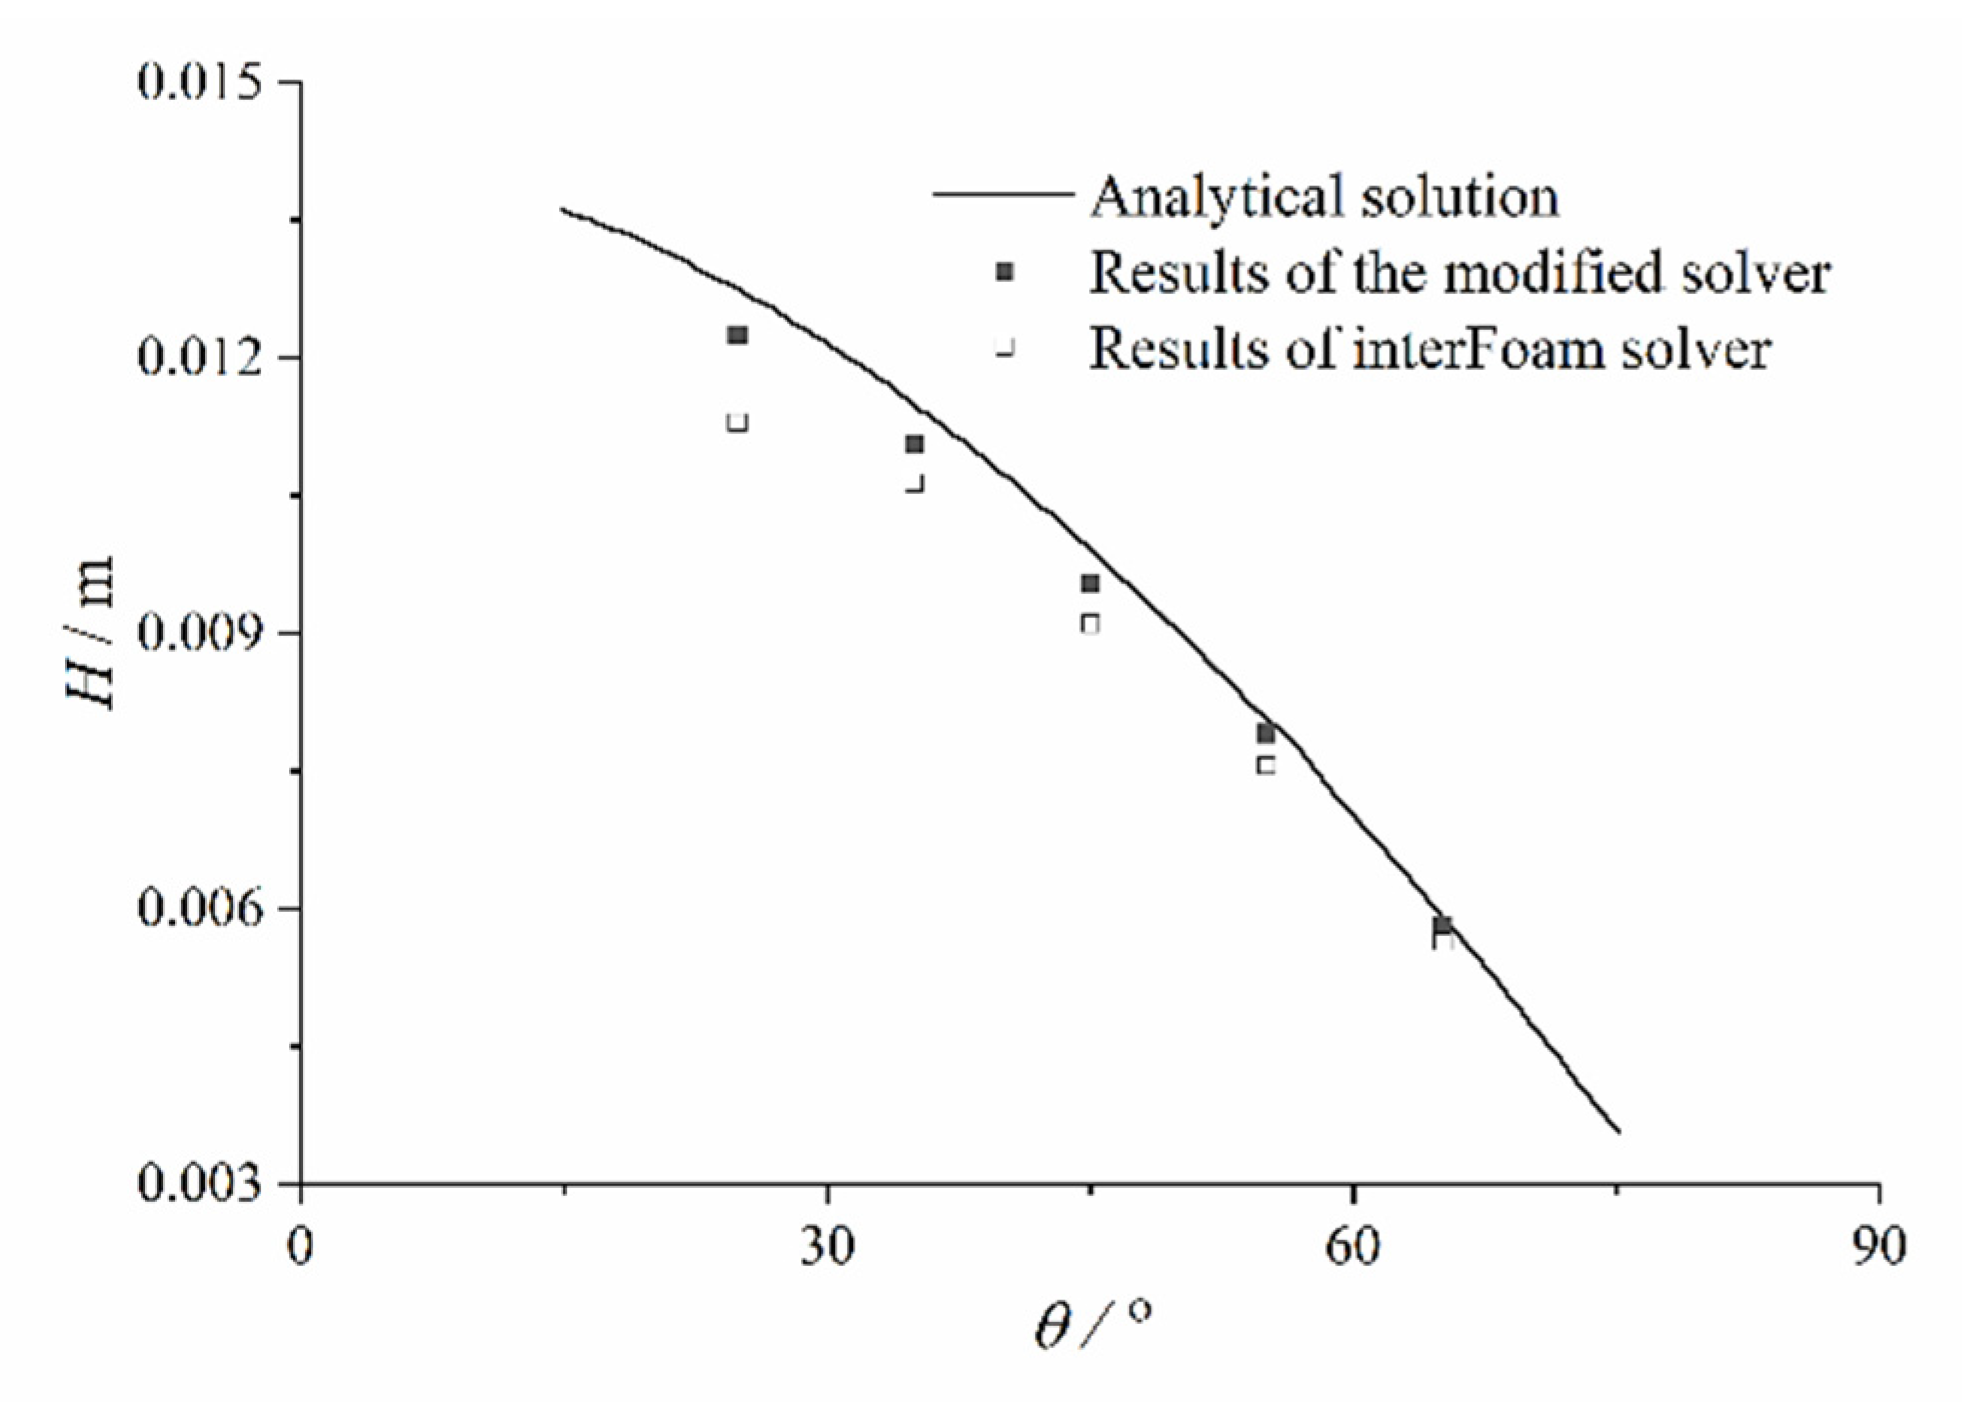
Appendix B. Model Validation

The aforementioned numerical model for oil–water two-phase flow dynamics is implemented into the inherent free interface solver interFoam of the open-source software OpenFOAM and the modified solver is different from interFoam solver only in the treatment of interfacial tension. The capillary rise case is chosen in this paper in order to verify the feasibility and validity of the numerical model. The comparison of the simulation results using the interFoam solver and the modified solver shows the superiority of the modified solver. Readers are referred to the literature [42,43] for more details.
Figure A2 shows the results of the height of liquid column H under different wall wettability regimes obtained from the interFoam solver, the modified solver, and analytic solution. It can be seen from Figure A2 that the modified solver offers a better approximation to the analytical solution compared with the interFoam solver. It should be noted that the higher accuracy of the modified solver is mainly attributed to the distinct treatment of the interfacial tension and the simulation results demonstrate the validity of the presented numerical model.
Figure A2. The height of liquid column varying with different wall contact angles.
Applsci 12 06285 g0a2

References

  1. BP. Statistical Review of World Energy, 69th ed.; BP: London, UK, 2020. [Google Scholar]
  2. Chai, R.; Liu, Y.; He, Y.; Liu, Q.; Xue, L. Dynamic behaviors and mechanisms of fluid-fluid interaction in low salinity waterflooding of carbonate reservoirs. J. Pet. Sci. Eng. 2021, 208, 109256. [Google Scholar] [CrossRef]
  3. Zallaghi, M.; Khazali, A.R. Experimental and modeling study of enhanced oil recovery from carbonate reservoirs with smart water and surfactant injection. Fuel 2021, 304, 121516. [Google Scholar] [CrossRef]
  4. Jamaloei, B.Y.; Kharrat, R. Analysis of microscopic displacement mechanisms of dilute surfactant flooding in oil-wet and water-wet porous media. Transp. Porous Media 2010, 81, 1–19. [Google Scholar] [CrossRef]
  5. Jamaloei, B.Y.; Kharrat, R.; Asghari, K.; Torabi, F. The influence of pore wettability on the microstructure of residual oil in surfactant-enhanced water flooding in heavy oil reservoirs: Implications for pore-scale flow characterization. J. Pet. Sci. Eng. 2011, 77, 121–134. [Google Scholar] [CrossRef]
  6. Moore, T.F.; Slobod, R.L. Displacement of oil by water-effect of wettability, rate, and viscosity on recovery. In Proceedings of the SPE-502-G Presented at the Fall Meeting of the Petroleum Branch of AIME, New Orleans, LA, USA, 2–5 October 1955. [Google Scholar]
  7. Vivas, F.J.A.; Babadagli, T. Drainage type oil and heavy-oil displacement in circular tubes: Two- and three-phase flow characteristics and residual oil saturation development in the form of film at different temperatures. J. Pet. Sci. Eng. 2014, 118, 61–73. [Google Scholar] [CrossRef]
  8. Sohrabi, M.; Danesh, A.; Jamiolahmady, M. Visualisation of residual oil recovery by near-miscible gas and SWAG injection using high-pressure micromodels. Transp. Porous Media 2008, 74, 239–257. [Google Scholar] [CrossRef]
  9. Ning, T.; Xi, M.; Hu, B.; Wang, L.; Huang, C.; Su, J. Effect of viscosity action and capillarity on pore-scale oil-water flowing behaviors in a low-permeability sandstone waterflood. Energies 2021, 14, 8200. [Google Scholar] [CrossRef]
  10. Saha, R.; Tiwari, P.; Uppaluri, R.V.S. Chemical Nanofluids in Enhanced Oil Recovery: Fundamentals and Applications; CRC Press: Boca Raton, FL, USA, 2021. [Google Scholar]
  11. Khoramian, R.; Kharrat, R.; Golshokooh, S. The development of novel nanofluid for enhanced oil recovery application. Fuel 2022, 311, 122558. [Google Scholar] [CrossRef]
  12. Mariyate, J.; Bera, A. Recent progresses of microemulsions-based nanofluids as a potential tool for enhanced oil recovery. Fuel 2021, 306, 121640. [Google Scholar] [CrossRef]
  13. Sagala, F.; Hethnawi, A.; Nassar, N.N. Hydroxyl-functionalized silicate-based nanofluids for enhanced oil recovery. Fuel 2020, 269, 117462. [Google Scholar] [CrossRef]
  14. Minakov, A.V.; Guzei, D.V.; Pryazhnikov, M.I.; Filimonov, S.A.Y.; Voronenkova, Y.O. 3D pore-scale modelling of nanofluids-enhanced oil recovery. Pet. Explor. Dev. 2021, 48, 956–967. [Google Scholar] [CrossRef]
  15. Rabbani, H.S.; Zhao, B.; Juanes, R.; Shokri, N. Pore geometry control of apparent wetting in porous media. Sci. Rep. 2018, 8, 15729. [Google Scholar] [CrossRef] [PubMed]
  16. Galkin, S.V.; Martyushev, D.A.; Osovetsky, B.M.; Kazymov, K.P.; Song, H. Evaluation of void space of complicated potentially oil-bearing carbonate formation using X-ray tomography and electron microscopy methods. Energy Rep. 2022, 8, 6245–6257. [Google Scholar] [CrossRef]
  17. Silva, G.O.M.; Lamas, L.F.; Soares, A.P. Characterization of carbonate facies and study of their relationship with dissolution and wettability in CO2 injection. J. Pet. Sci. Eng. 2021, 206, 108938. [Google Scholar] [CrossRef]
  18. Adegbite, J.O.; Belhaj, H.; Bera, A. Investigation on the relationship among the porosity, permeability and pore throat size of transition zone samples in carbonate reservoirs using multiple regression analysis, artificial neural network and adaptive neuro-fuzzy interface system. Pet. Res. 2021, 6, 321–332. [Google Scholar] [CrossRef]
  19. Wei, H.; Zhu, X.; Liu, X.; Yang, H.; Tao, W.-Q.; Chen, L. Pore-scale study of drainage processes in porous media with various structural heterogeneity. Int. Commun. Heat Mass Transf. 2022, 132, 105914. [Google Scholar] [CrossRef]
  20. Ho, C.K.; Webb, S.W. Capillary barrier performance in heterogeneous porous media. Water Resour. Res. 1998, 34, 603–609. [Google Scholar] [CrossRef]
  21. Tami, D.; Rahardjo, H.; Leong, E.-C.; Fredlund, D.G. Design and laboratory verification of a physical model of sloping capillary barrier. Can. Geotech. J. 2004, 41, 814–830. [Google Scholar] [CrossRef]
  22. Avanzi, F.; Hirashima, H.; Yamaguchi, S.; Katsushima, T.; De Michele, C. Observations of capillary barriers and preferential flow in layered snow during cold laboratory experiments. Cryosphere 2016, 10, 2012–2026. [Google Scholar] [CrossRef] [Green Version]
  23. Man, P.; Mastrangelo, C.; Burns, M.; Burke, D. Microfabricated capillarity-driven stop valve and sample injector. In Proceedings of the Eleventh International Workshop on Micro Electro Mechanical Systems, Heidelberg, Germany, 25–29 January 1998; IEEE Xplore: Piscataway, NJ, USA, 1998. [Google Scholar]
  24. Glière, A.; Delattre, C. Modeling and fabrication of capillary stop valves for planar microfluidic systems. Sens. Actuators A Phys. 2006, 130, 601–608. [Google Scholar] [CrossRef]
  25. Leu, T.S.; Chang, P.Y. Pressure barrier of capillary stop valves in micro sample separators. Sens. Actuators A Phys. 2004, 115, 508–515. [Google Scholar] [CrossRef]
  26. Arab, D.; Kantzas, A.; Bryant, S.L. Water flooding of oil reservoirs: Effect of oil viscosity and injection velocity on the interplay between capillary and viscous forces. J. Pet. Sci. Eng. 2020, 186, 106691. [Google Scholar] [CrossRef]
  27. Jin, X.; Chao, C.; Edlmann, K.; Fan, X. Understanding the interplay of capillary and viscous forces in CO2 core flooding experiments. J. Hydrol. 2022, 606, 127411. [Google Scholar] [CrossRef]
  28. Suo, S.; Gan, Y.X. Tuning capillary flow in porous media with hierarchical structures. Phys. Fluids 2021, 33, 034107. [Google Scholar] [CrossRef]
  29. Lin, Q.; Bijeljic, B.; Raeini, A.Q.; Rieke, H.; Blunt, M.J. Drainage Capillary Pressure Distribution and Fluid Displacement in a Heterogeneous Laminated Sandstone. Geophys. Res. Lett. 2021, 48, e2021GL093604. [Google Scholar] [CrossRef]
  30. Pavuluri, S.; Maes, J.; Yang, J.; Regaieg, M.; Moncorgé, A.; Doster, F. Towards pore network modelling of spontaneous imbibition: Contact angle dependent invasion patterns and the occurrence of dynamic capillary barriers. Comput. Geosci. 2020, 24, 951–969. [Google Scholar] [CrossRef] [Green Version]
  31. Chen, Y.; Mao, Y.; Yang, L.; Wei, W.; Meng, Q.; Cai, J. A comprehensive review of factors affecting dynamic capillary effect in two-phase flow. Transp. Porous Media 2022, 1–22. [Google Scholar] [CrossRef]
  32. Ubbink, O. Numerical Prediction of Two Fluid Systems with Sharp Interfaces; University of London: London, UK, 1997. [Google Scholar]
  33. Jasak, H.; Weller, H.G.; Gosman, A.D. High resolution NVD differencing scheme for arbitrarily unstructured meshes. Int. J. Numer. Methods Fluids 1999, 31, 431–449. [Google Scholar] [CrossRef]
  34. Crank, J.; Phyllis, N. A practical method for numerical evaluation of solutions of partial differential equations of the heat-conduction type. Math. Proc. Camb. Philos. Soc. 1947, 43, 431–449. [Google Scholar] [CrossRef]
  35. Su, J.; Chai, G.; Wang, L.; Cao, W.; Gu, Z.; Chen, C.; Xu, X.Y. Pore-scale direct numerical simulation of particle transport in porous media. Chem. Eng. Sci. 2019, 199, 613–627. [Google Scholar] [CrossRef]
  36. Blunt, M.J. Multiphase Flow in Permeable Media: A Pore-Scale Perspective; Imperial College London: London, UK, 2017. [Google Scholar]
  37. Ambekar, A.S.; Mattey, P.; Buwa, V.V. Pore-resolved two-phase flow in a pseudo-3D porous medium: Measurements and volume-of-fluid simulations. Chem. Eng. Sci. 2021, 230, 116128. [Google Scholar] [CrossRef]
  38. Tian, Y.; Ju, B.; Chen, X.; Chen, Z.; Dong, Y.; Wu, D. Pore-scale Investigation of Waterflooding Based on Experiments and Numerical Simulations Considering the Change in Geometry and Wettability. Energy Fuels 2021, 35, 17617–17628. [Google Scholar] [CrossRef]
  39. Patankar, S.V.; Spalding, D.B. A calculation procedure for heat, mass and momentum transfer in three-dimensional parabolic flows. Int. J. Heat Mass Transf. 1972, 15, 1787–1806. [Google Scholar] [CrossRef]
  40. van Doormaal, J.P.; Raithby, G.D. Enhancement of the SIMPLE method for predicting incompressible fluid flow. Numer. Heat Transf. Appl. 1984, 7, 147–163. [Google Scholar]
  41. Issa, R.I. Solution of implicitly discretized fluid flow equations by operator-splitting. J. Comput. Phys. 1986, 62, 40–65. [Google Scholar] [CrossRef]
  42. Sun, H.X.; Su, J.W. A sub-grid interface locating algorithm for free surface two-phase flows. J. Xi’an Jiaotong Univ. 2017, 51, 79–87. [Google Scholar]
  43. Su, J.; Chai, G.; Wang, L.; Cao, W.; Yu, J.; Gu, Z.; Chen, C. Direct numerical simulation of pore scale particle-water-oil transport in porous media. J. Pet. Sci. Eng. 2019, 180, 159–175. [Google Scholar] [CrossRef]
Figure 1. The oil–water interface morphology at different positions: (a) the oil–water interface in the throat channel; (b) the oil–water interface at the pore–throat interface.
Applsci 12 06285 g001
Figure 2. Water (white color) and oil (black color) distribution after water flooding.
Applsci 12 06285 g002
Figure 3. Schematic representation of the conceptual physical model of the capillary barrier.
Applsci 12 06285 g003
Figure 4. The first stage during the process of interface advancing.
Applsci 12 06285 g004
Figure 5. Oil–water interface morphology when the static contact angle is formed in equilibrium with the wall of the inlet part.
Applsci 12 06285 g005
Figure 6. Oil–water interface morphology when the static contact angle is formed in equilibrium with the wall of the throat.
Applsci 12 06285 g006
Figure 7. The change of the capillary force along the axis at the second stage of interface advancing: (a) situation 1; (b) situation 2.
Applsci 12 06285 g007
Figure 8. The third stage of interface advancing.
Applsci 12 06285 g008
Figure 9. The fourth stage of interface advancing: situation 1 (a); situation 2 (b).
Applsci 12 06285 g009
Figure 10. The occurrence of the capillary barrier effect.
Applsci 12 06285 g010
Figure 11. Interface morphology in the fifth stage.
Applsci 12 06285 g011
Figure 12. The influence of opening angles on the capillary force with different contact angles under water-wet conditions: (a) θ = 0°; (b) θ = 20°; (c) θ = 40°; (d) θ = 60°; (e) θ = 80°.
Applsci 12 06285 g012
Figure 13. The distribution of the maximum (a) and minimum (b) capillary force varying with contact angle θ and opening angle β under water-wet conditions.
Applsci 12 06285 g013
Figure 14. The influence of angles of orientation on the capillary force with different contact angles under oil-wet conditions: (a) θ = 90°; (b) θ = 110°; (c) θ = 130°; (d) θ = 150°; (e) θ = 170°.
Applsci 12 06285 g014
Figure 15. The distribution of the maximum (a) and minimum (b) capillary force varying with contact angle θ and opening angle β under oil-wet conditions.
Applsci 12 06285 g015
Figure 16. The porous media model integrated using the proposed conceptual capillary barrier model with the opening angle of 45°.
Applsci 12 06285 g016
Figure 17. Under water-wet conditions and the contact angle as 60°: (a) The change of pressure difference between the inlet and outlet with time under different capillary numbers; (b) The change of saturation of oil with time under different capillary numbers.
Applsci 12 06285 g017
Figure 18. The change of oil and water distribution with time at capillary number of 1.8 × 10⁻⁴ under water-wet conditions (the contact angle is 60°): (a) 0.0265 s; (b) 0.0330 s; (c) 0.0513 s; (d) 0.0670 s. (The italic letters (a–j) in the figure indicate the locations of the oil–water interface.)
Applsci 12 06285 g018
Figure 19. The distribution of oil and water in the porous media model under different capillary numbers and water-wet conditions with the contact angle of 60°: (a) Ca = 1.8 × 10⁴; (b) Ca = 1.8 × 10⁻³; (c) Ca = 1.8 × 10⁻².
Applsci 12 06285 g019aApplsci 12 06285 g019b
Figure 20. Under oil-wet conditions and the contact angle as 120°: (a) The change of pressure difference between the inlet and outlet with time under different capillary numbers; (b) The change of saturation of oil with time under different capillary numbers.
Applsci 12 06285 g020
Figure 21. The change of oil and water distribution with time at the capillary number of 1.8 × 10⁻⁴ under oil-wet conditions (the contact angle is 120°): (a) 0.0333 s; (b) 0.0356 s; (c) 0.0576 s; (d) 0.0665 s. (The italic letters (a–j) in the figure indicate the locations of the oil–water interface.)
Applsci 12 06285 g021
Figure 22. The distribution of oil and water in the porous media model with different capillary numbers under oil-wet conditions and at the contact angle of 120°: (a) Ca = 1.8 × 10⁻⁴; (b) Ca = 1.8 × 10⁻³; (c) Ca = 1.8 × 10⁻².
Applsci 12 06285 g022
Figure 23. At the opening angle of 45°: (a) The change of oil displacement efficiency with the capillary numbers; (b) The distribution of oil and water in the porous media model when the optimal oil displacement efficiency is reached.
Applsci 12 06285 g023
Table 1. Conditions of the extrema when oil–water interface entering the throat section.
WettabilityConditionsMaximal ValueMinimal Value
0 < θ < 90° (water-wet)
90° < θ < 180° (oil-wet)
0 < βθ < 90°r (driving force)r/cosθ (driving force)
90° < βθ < 0r/cos(θβ) (driving force)r/cosθ (driving force)
−180° < βθ < 0r/cos(θβ) (driving force, resistance)r/cosθ (resistance)
Table 2. Conditions of the extrema when oil–water interface leaving the throat section.
WettabilityConditionsMaximal ValueMinimal Value
0 < θ < 90° (water-wet)
90° < θ < 180° (oil-wet)
0 < β + θ < 180°r/cosθ (driving force)r/cos(θ + β) (driving force, resistance)
90° < β + θ < 180°r/cosθ (resistance)r/cos(θ + β) (resistance)
180° < β + θ < 270°r/cosθ (resistance)r (resistance)
Table 3. Conditions of the extrema when oil–water interface entering the outlet section.
WettabilityConditionsMaximal ValueMinimal Value
0 < θ < 180°0 < β + θ < 90°r/cos(θ + β) (driving force)(Lsinβ + rcosβ)/(cosθ – sinβ)
90° < β + θ < 270°(Lsinβ + rcosβ)/(cosθ – sinβ)r/cos(θ + β) (resistance)
Table 4. Parameters used in numerical simulation.
ItemsValue
|v|/m·s−10.1
vx, vy/m·s−10.0707
σ1~3/N·m−10.5, 0.05, 0.005
θ1~715°, 30°, 45°, 60°, 90°, 120°, 165°
ρoil/g·cm−30.8498
ρwater/g·cm−31
μoil/m2 s−11.89 × 10⁻⁵
μwater/m2 s−11.0 × 10⁻⁶
Table 5. Numerical boundary conditions.
Physical QuantityBoundaries
InletOutletWall
velocityfixed valuezero gradientfixed value
pressurezero gradientfixed valuezero gradient
water volume fractionfixed valuezero gradientconstant contact angle
Publisher’s Note: MDPI stays neutral with regard to jurisdictional claims in published maps and institutional affiliations.

