Article

Load-Settlement Behaviour Analysis Based on the Characteristics of the Vertical Loads under a Pile Group

1
College of Civil Engineering, Henan University of Technology, Zhengzhou 450001, China
2
Department of Civil Engineering, Hong Kong University of Science and Technology, Hong Kong, China
*
Author to whom correspondence should be addressed.
Appl. Sci. 2022, 12(12), 6282; https://doi.org/10.3390/app12126282
Submission received: 17 May 2022 / Revised: 16 June 2022 / Accepted: 18 June 2022 / Published: 20 June 2022
(This article belongs to the Section Civil Engineering)

Abstract

:
The nonlinear load-settlement behaviours of vertically loaded pile groups containing various numbers of piles (up to a few hundred piles in a group) are analysed using the method proposed by Lee and Xiao. This back-analysis method assumes the “local shear displacement” of a thin layer of disturbed soil along the pile–soil interface and the soil outside the interface is assumed to be linear elastic. Parametric studies are conducted to examine the load-displacement behaviours of the rigidly capped pile groups. Factors such as the number of piles in a group, pile slenderness (L/D), and pile spacing (S/D) are examined to study the effects on the performance of pile groups up to the failure state. Some phenomenological features of large pile groups under nonlinear conditions, which are difficult to obtain through an elastic analysis, are revealed in the present analysis.

1. Introduction

Pile foundations are commonly used basic forms of foundations in engineering, which have the advantages of a high degree of mechanized construction, strong stability, high carrying capacity, and small soil settlement. Usually, pile foundations in actual engineering applications are based on pile group foundations, and basic soil settlement calculations of the pile groups are essential to pile foundation design. A large number of studies show that the base soil-settlement characteristics of piles are substantially different from those of a single pile, whereas the basic soil-settlement characteristics of pile groups are related to a single pile.
At present, the commonly used calculation methods for the soil-settlement characteristics of the pile group load-settlement are the empirical method, the equivalent replacement method, the analytical method, and the numerical simulation method. Among them, an empirical method represented by Skempton [1] and Meyerhof [2] established the relationship between single pile–soil settlement and pile groups based on engineering measures. The equivalent replacement method, represented by Bjerrum et al. [3] and Tomlinson [4], proposed that the pile group foundation should be equivalent to a simple basic form, effectively simplifying the calculation of pile group soil settlement. The analyses of Butterfield and Banerjee [5], Poulos and Davis [6], Randolph and Wroth [7], and Chow [8] are also represented, and the main consideration in those studies is the interaction of a pile–soil surface.
With developments in technology, numerical simulation methods are widely used in the analysis of the soil-settlement characteristics of pile groups under loading. By using the boundary element method (BEM) to analyse the factors that influence the pile group interactions, Mandolini and Viggiani [9] produced the nonlinear characteristics of pile group soil settlement by assuming that the pile was rigid and by overlaying the single pile soil-settlement characteristics in the pile groups using the superposition principle. Guo [10] proposed that the pile–pile interaction factors of the pile groups in the finite soil layer were reduced with the reduction in the axial load-transfer coefficient. Based on the theory of elastic continuity, Guo and Randolph [11] proposed the calculation method of pile group soil settlement with load transfer, which considers the compression characteristics of soil in a non-homogeneous soil layer.
Konagai et al. [12] described the interaction characteristics of pile groups and soil in the form of a single pile analogy, which produced the nonlinear characteristics of the settlement of the pile groups under loading. Combined with the stiffness matrix theory and the integral interaction factors of pile groups, Roberto and Enrico [13] proposed a nonlinear analysis method of the soil settlement of the vertical load under the pile groups. Based on the sedimentation characteristics of the single pile and the pile groups under loading in layered soil, a simple method of analysis of the soil-settlement characteristics of the pile groups was proposed by Zhang et al. [14]. Hussien et al. [15] used finite element methods to analyse the displacement characteristics of a pile group foundation in a sand base under vertical and lateral loads. Others, Ghalesari et al. [16], Cui et al. [17], Pan et al. [18], and Kong et al. [19] have all used numerical simulation methods to analyse the soil-displacement characteristics of piles under loading.
The abovementioned research shows that soil settlement of the pile groups under vertical loading is nonlinear and there is a certain connection between the single pile and the pile groups. However, previous research did not consider the sedimentation characteristics of the settlement of the soil of the next pile due to vertical loading or the influence of the interaction between the raft plate, pile foundation, and the soil on the sedimentation characteristics of the pile groups. Therefore, based on the simplified analysis method of Lee and Xiao [20,21], this paper establishes a back-analysis method that considers the sedimentation characteristics of soil, whereas the interaction between the soil raft plate and the pile foundation has the advantage of being an efficient and simple method with reliable parameters and convenient calculations.
In this paper, the nonlinear load-settlement behaviour of the pile groups will also be examined. Parametric studies are conducted to examine the performances of different sizes of pile groups under various states of loading. Parametric factors, such as the effects of the total number of individual piles in the pile groups, the slenderness ratio of an individual pile, and the pile spacing, are examined. Through these studies, the load-transfer mechanisms of pile groups are examined throughout the entire loading stage. Some phenomenological features of large pile groups under nonlinear conditions, which are difficult to obtain through elastic analysis, are revealed in the present analysis.

2. Methods

2.1. Group Transfer Functions for Pile Shafts and Pile Bases

Based on the nonlinear analysis method of the pile groups proposed by Lee and Xiao [20,21], the change law of the soil subjected to a disturbance decreases with the increase in the distance in the base shaft. It is assumed that any given depth of soil is the total displacement, sz, of the axial displacement along the pile that contains the nonlinear displacement of the destruction area and the elastic region of the soil (Figure 1a). At the same time, the nonlinear displacement is defined by Lee and Xiao [21] as “local shear displacement”, Δsz, the total displacement of the pile in the depth, z, position, which is caused by the pile axial shear stress τz, and a narrow disturbance area is formed around the pile shaft. The stress–strain, compressibility and thickness changes in the narrow disturbed zone perch are complex and are mainly influenced by the construction method of the pile, the type of pile, the type of soil, and the loading procedure. In addition, the nonlinear soil displacement characteristics caused by the axial shear force of the pile can be approximated as noncontinuous (Figure 1b). It is assumed that the soil outside the “local shear displacement” is elastic, and the soil displacement caused by the axial shear stress, τz, of the pile is the elastic displacement, Wsz. Thus, the shaft displacement, siz, caused by pile element i in a pile group, and when given a depth, z, of the soil, can be calculated using the following formula:
s i z = Δ s i z + W i s z ,
where Δsiz is the “local shear displacement” caused by the interface of pile element i in a pile group. Wisz is the elastic soil displacement outside the disturbed soil around pile element i in the pile group.
Lee and Xiao [20] proposed to represent the “local shear displacement”, Δsiz, with a hyperbolic nonlinear relationship in the following form:
τ i z = Δ s i z a + b Δ s i z ,
in which τiz is the shaft shear stress caused by a pile element i shaft interface, a and b describe the empirical factors of the soil interface. a and b can be determined by experimental or back-analysis methods.
The physical meaning of coefficient, a, represents the reciprocal of the initial stiffness, Ksi, which is the relationship of the pile–soil interface that is caused by shear stress and local shear displacement (see Figure 2). The units of the force per cubic length can also be represented as follows:
K s i = 1 a ,
The inverse of the coefficient b is the asymptotic shear stress, demonstrated by τult (i.e., τult = 1/b), which is obtained by the shear stress–displacement curve with a very large local shear displacement value (see Figure 2). The failure strength of a pile–soil interface, τf, is slightly lower than the asymptomatic shear stress, τult. By introducing a failure ratio, Rf, to describe it, the calculation can be performed using the following formula:
τ f = R f τ u l t ,
According to Clough and Duncan’s [22] research, the relative displacement curve of the shear stress is shown in Figure 2, where the Rf value is between 0.8 and 0.95.
According to coefficients a and b given above, two parameters Ksi and τf need to properly define the behaviours caused by the pile–soil interface. Both the initial shear stiffness, Ksi, and the shear strength of the interface, τf, are dependent on the normal stress value of the interaction on the interface. The relationship between the “local shear displacement” and the shaft shear stress as defined in Equation (2), was verified by laboratory test results conducted by ring shear tests on the soil–steel interface conducted by Lehane [23]. Detailed information about this field test case and the corresponding back-analysis method are described in later sections.
Considering the pile-to-pile interaction, the soil displacement, Wisz, for pile element i is because of shaft shear stress, τz, that the loading caused by its own pile load and additional interactive soil displacement is applied to the other piles in a pile group. Using the principle of superposition, the vertical soil-displacement of the pile element i at depth z, Wisz, consists of two parts: it is dependent upon the shaft shear stresses of pile element i at depth z, Wiisz, and it is dependent on the interactive displacement effect, which is dependent on the adjacent pile j, Wijsz. Usually, the vertical displacement is obtained by calculating the formula proposed by Randolph and Wroth [7]. For a group of piles consisting of n piles, the displacement of the pile element i at depth z because of its own loading and adjacent pile action can be calculated using the following:
W i s z = r o G j = 1 n τ j z ln ( r m s i j ) ,
Lee and Xiao [21] proposed a simplification of this equation in that they assume that the shaft shear stress, τjz, at depth, z, as expressed in Equation (5), is the same for all piles in a pile group (i.e., τiz = τ jzs for I = 1 to n). They verified the correctness and rationality of this hypothesis. Thus, the hypothetical constant values of τjz (j = 1 to n) can cause Equation (5) to be simplified as follows:
W i s z = τ i z r o G j = 1 n ln ( r m s i j ) = c ¯ τ i z ,
where c ¯ is a group parameter, which can be written as:
c ¯ = r o G j = 1 n ln ( r m s i j ) ,
Thus, the load-transfer function of the pile groups will also be computed by substituting Equations (6) and (2) into Equation (1). Therefore, the total shaft displacement of pile i at depth z can also be written in the following form:
s i z = a τ i z 1 b τ i z + c ¯ τ i z ,
Equation (8) can also be replaced with the following equation:
τ i z = a + c ¯ + b s i z ( a i z + c ¯ + b s i z ) 2 4 b c ¯ s i z 2 b c ¯ ,
Equation (8) or Equation (9) is the load-transfer function of the pile shaft of the pile groups. The equation can also be presented in the following form:
w i b = a ˜ p i b 1 b ˜ p i b + c ˜ p i b ,
where c ˜ = j = 1 i j n ( 1 ν s ) 2 G b s i j , a ˜ is the inverse of the initial elastic soil stiffness of the pile base; thus, k i b = 1 a ˜ = 4 G r o ( 1 ν s b ) and b ˜ = p i b R f b p b f , where pib is the basic load of the movement, and Gb and νb are the shear modulus and Poisson’s ratio of the soil at the bottom of pile j. R f b is the hyperbolic fit constant and pbf is the ultimate base load (Chow [8]). Equation (10) can be written as:
p i b = a ˜ + c ˜ + b ˜ w i b ( a ˜ + c ˜ + b ˜ w i b ) 2 4 b ˜ c ˜ w i b 2 b ˜ c ˜ ,
Equation (10) or Equation (11) is the load-transfer function at the pile base for a pile group analysis.

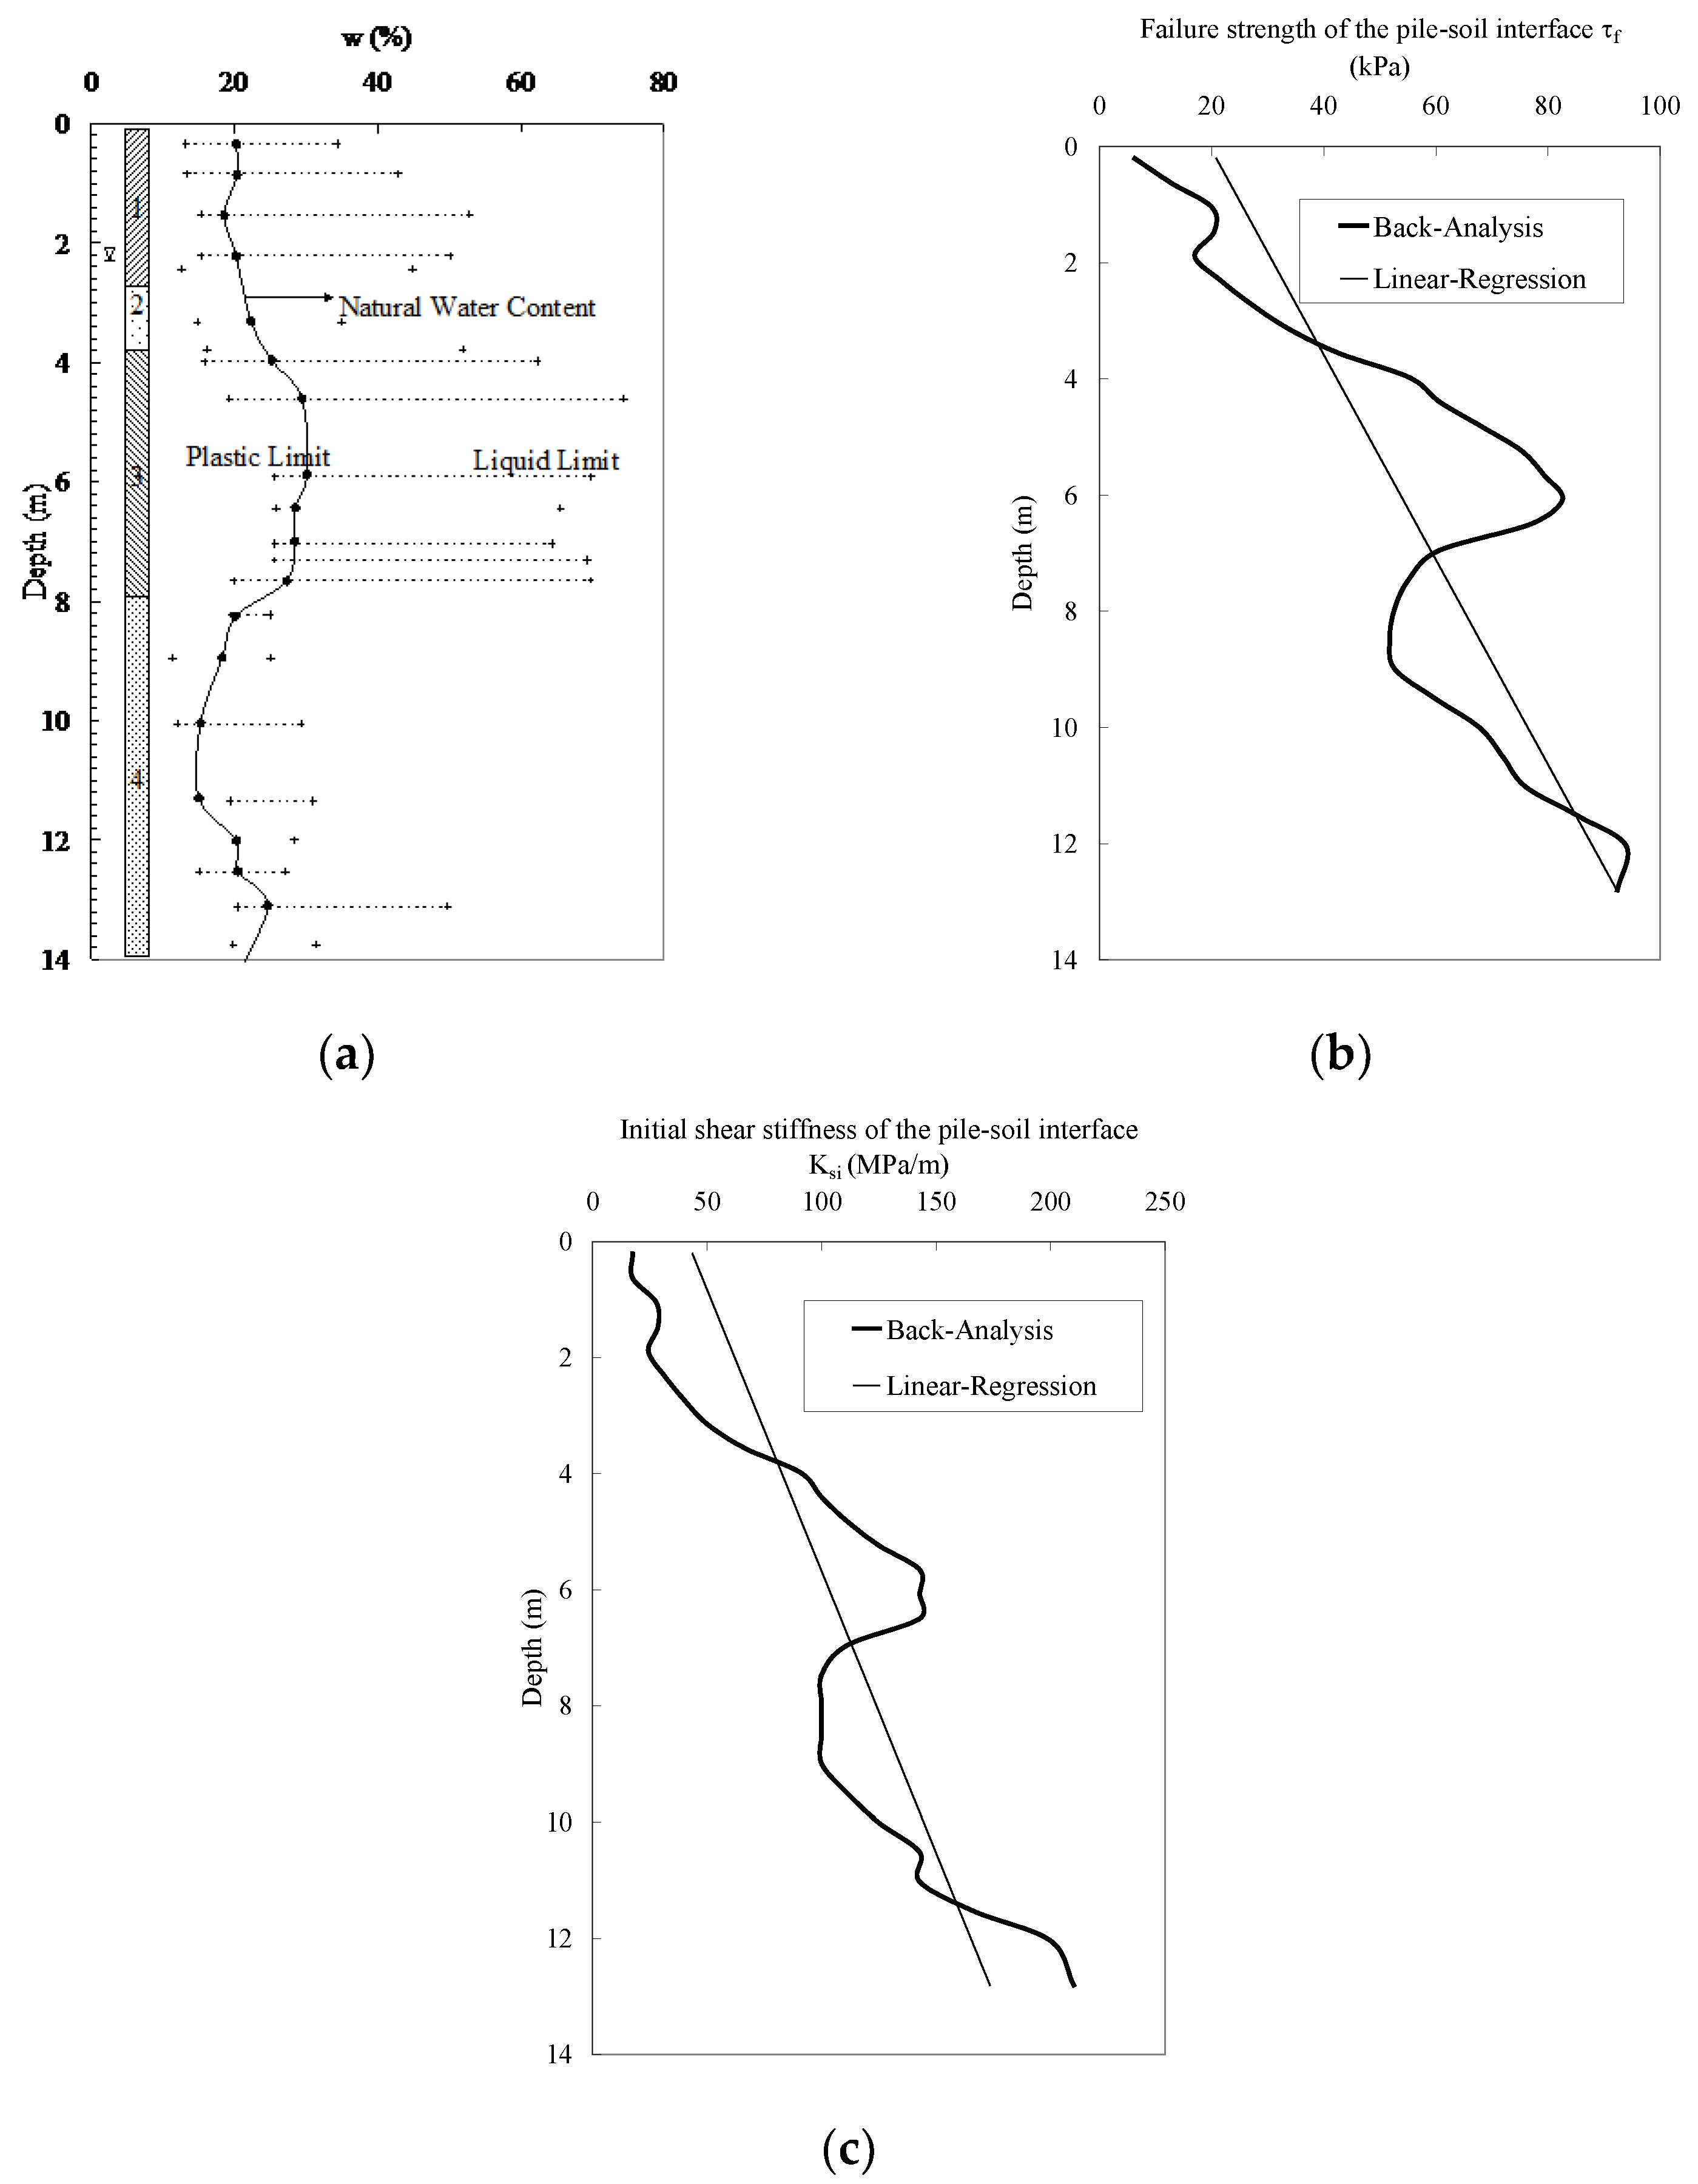
2.2. The Back-Analysis Method Procedure and Analysis Results

In theory, laboratory tests, such as ring shear tests, can be used to obtain a and b, which are the parameters of the recommended hyperbolic model. Nevertheless, it is difficult for laboratory tests to restore the relative displacement characteristics of the actual pile–soil interface in the field. At the same time, the relative displacement characteristics of the materials and soil contact interfaces are not obvious and have significant effects on a and b, such as the roughness of the pile–soil interface, the piling method, and the soil type. Therefore, the use of back-analysis methods can effectively improve the accuracy and rationality of the a and b values, and the back-analysis approach is given as follows:
The depth, p(z), and load distribution results are obtained from the pile load test data measured in the field. The interpolated spline curve is used to fit the measurement data to obtain a load distribution with a depth function, p ¯ ( z ) ;
According to the spline fitting function, p ¯ ( z ) , the shaft shear stresses are calculated by the following formula:
τ z = 1 2 π r o d p ¯ ( z ) d z ,
Equation (12) can also be used to determine the failure strength of a pile–soil interface τf(z) at depth z. The value of b at various depths, z, can also be calculated as follows:
b ( z ) = R f / τ f ( z ) ,
The shaft displacement, sz, at depth, z, can also be calculated as follows:
s z = s t i 1 E p A p 0 z p ¯ ( z ) d z ,
where Ep is the elastic modulus of the pile, Ap is the cross-sectional area of the pile, and sti is the displacement of the pile head at the different load steps.
According to Equation (14), the value of a can be calculated as follows:
a ( z ) = ( s z c τ z ) ( 1 b ( z ) τ z ) τ z ,
Based on Equations (13) and (15), a(z) and b(z) can be determined.

2.3. Comparison of the Simplified Approach with Boundary Integral Solutions and the Elastic Approximate Approach

The details of the algorithm and programming procedure are described in the work by Lee and Xiao [21]. The flowchart of the proposed method is presented in Figure 3. To verify that the simplified nonlinear approach and the algorithm proposed by Li and Xiao [21] are useful in the analysis of pile groups, in this paper, comparisons are conducted with the results predicted by the more stringent boundary integral solution proposed by Butterfield and Banerjee [5] and by the elastic approximate approach projections of Randolph and Wroth [7]. In the comparison, assuming that the cap is rigid and not in direct contact with the ground, the stiffness ratio, λ = (Ep/Gs), is equal to 1000. Since the other two methods only predict the elastic behaviour of the pile groups, the total load applied on a rigid cap is only 10% of the ultimate total load in this study. This will ensure that the pile group behaviour predicted by the proposed analysis is largely in the elastic stage.
Figure 4 graphically presents a comparison of the results in terms of the normalised stiffness (Pi/wroGs) versus the pile group slenderness ratio (L/D), where Pi is the sensing vertical load on the single pile head of the 3 × 3 pile groups, w is the displacement of a pile group, and D and L are the pile diameter and the length of the pile, respectively. The normalised spacing (S/D) of the pile groups is equal to 3. It can be observed that very good agreements are obtained between the simplified method, the boundary integral solution, and the elastic approximate approach. Figure 5a,b show the comparison of the results expressed as a ratio between the vertical load, Pi, developed at the single pile head of the pile groups and the average applied load, Pavg, versus the load level for L/D = 20 and L/D = 50, respectively. The black dots in the figures represent the results obtained by the elastic approximate method (Randolph and Wroth [7]). It can be seen that at lower load levels, good agreements can be observed between the simplified method and the elastic approximate method. The distributions of pile loads among the individual piles vary with an increase in the load level. The distributions of the loads become more uniform among the pile groups at relatively high load levels. At the ultimate loading level, the ratio approaches unity, which means that all the single piles of the pile groups carry the same load at the ultimate failure condition.

2.4. Comparison of Computed Results with Field-Measured Results

O’Neill [26] analysed the load-settlement characteristics of a single pile and pile groups in overconsolidated clay using field tests and adopted closed-mouthed steel pipe piles with a diameter of 273 mm, a wall thickness of 9.3 mm, and a pile length of 13.1 m. The pile was jacked into the overconsolidated clay by static load and the pile groups were 9-pile by 3 × 3 and the centre-to-centre spacing is S = 3D, where D is the diameter of the pile. The two single piles were located at a distance of 3.7m from the center of the pile groups. As the interaction between the pile group and pile cap in clay is low [27], in this analysis, the group pile stage was a rigid high pile cap and the cap was without contact with the soil. We compared these test results with the results of the back-analysis method in this paper for the load-settlement characteristics of the single pile. The pile group load-settlement characteristics of the 4-pile subgroup (pile marked 1), the 5-pile subgroup (piles marked 2 and 3), and the 9-pile group, are shown in Figure 6b.
Kraft et al. [28] presented the exploration data of the field test and the soil shear modulus, and Chow [8] selected the parameters of the soil shear model of the field test, assuming that the soil shear modulus linearly increased, whereas the surface was taken at G = 47.9MN/m2 and the bottom of the pile was G = 151MN/m2. In this paper, the back-analysis method also adopts a similar method, taking the surface soil without a drainage shear strength of 47.9 kN/m2, the pile bottom increased linearly to 239 kN/m2. At the same time, it is assumed that the Poisson’s ratio of the soil, υ, was assumed to be 0.5, the Rf was 0.9, the ultimate end-bearing pressure was 2.15 MN/m2 (i.e., qult = 9Cu), and the single pile is the same as the middle soil parameters of the group piles consisting of the 4-pile subgroup, the 5-pile subgroup, and the 9-pile group.
Figure 7 shows the results of the predicted Ksi(z) and τf(z) profiles for the single reference pile determined by the back-analysis method as proposed in the previous section. It is obvious that both the predicted Ksi(z) and τf(z) profiles varied rather non-uniformly but with an increasing trend in relation to depth. The variability of Ksi(z) and τf(z) was highly correlated to the variation of Atterberg’s limits and the natural water content of the soils with depth. In fact, the variability of Ksi(z) and τf(z) could be used to delineate the natural stratification of the soil layers in the field. Thus, the soil conditions around the reference piles could be clearly reflected by the Ksi(z) and τf(z) profiles (i.e., the a and b parameters) as determined by the proposed back-analysis method. These back-calculated Ksi(z) and τf(z) profiles were used for a comparative study as discussed in the following sections. Furthermore, for illustration purposes, the average trend of K ¯ s i and τ ¯ f in relation to depth was determined by linear regression analysis on the actual back-calculated Ksi(z) and τf(z) profiles. This resulted in the following linear distribution equations for K ¯ s i and τ ¯ f in relation to the depth as follows:
K ¯ s i = 10.3 z + 41.5 ( M P a ) ,
τ ¯ f = 5.67 z + 19.68 ( k P a ) ,
Figure 6a,b show the field-measured single load-settlement curves of the average of the two reference single piles and the pile group’s load-settlement curves. The computed results were determined based on the values of the actual Ksi(z) and τf(z) values obtained from the back-analysis method. For comparison purposes, Figure 6a and Figure 5b also show the results predicted by the average K ¯ s i and τ ¯ f profiles obtained by the linear regression analysis. For the back-analysis method and linear regression, as well as the cross-section analysis of the K ¯ s i and τ ¯ f profiles, a good protocol between the measured and calculated results is usually observed. In fact, the differences predicted by the back-analysed Ksi(z) and τf(z) profiles and those predicted by the linear regression analysed profiles are very small. The recommended method predicts results that are similar to the observed behaviour in the field, with a maximum of two-thirds of the ultimate load. However, when the pile approaches its ultimate load, the difference between the predicted behaviour and the observed behaviour usually becomes slightly larger. Small differences may be approximated by the hyperbolic albinos of the undisturbed soil zone while modelling the strain-softening and expansion behaviour of overconsolidated clay. In addition, the assumption of the linear elastic behaviour of the surrounding pile shaft of the soil can underestimate the total amount of plastic deformation when the pile shaft is close to its ultimate condition.

3. Results of the Parametric Study

3.1. Basic Performance of Large Pile Groups

In this section, the soil parameter profiles determined through back-analysis as described by O’Neill [26] will be adopted for the parametric study. For the convenience of analysis and to capture the basic behaviour of pile groups, the linear regression-analysed K ¯ s i and τ ¯ f profiles (Equations (16) and (17)) are adopted to model the nonlinear soil–pile interface in this parametric study. As the first step in parametric research, the 9 × 9 pile groups will be studied to understand the performance of the large pile groups. The pile cap is assumed to be rigid and has no contact with the ground. The pile slenderness ratio, L/D, is assumed to be 20 and the spacing ratio, S/D, is assumed to be 3.
Figure 8 shows the load-settlement curves of the various individual piles at different locations in the 9 × 9 pile groups. The results show that the load-settlement behaviour is different at the various pile locations. Under a given settlement, the individual pile located at the corner of the group (pile 1) carries the largest axial load and the lowest load occurs at the centre pile (pile 5). As the total load increases and the failure state approaches, the differences in the pile loads carried by individual piles at different locations become very small and they all fail at the same ultimate load. Figure 9a,c show the degrees of mobilisation of the shaft shear stress that develop along the pile at different pile locations under load levels of 80%, 50%, and 30% of the ultimate load. Generally, at a low-stress level, the degree of mobilisation of the shaft shear stress at a shallower pile depth is larger than that at a deeper pile depth. This indicates that shaft shear stresses are gradually mobilised from the top of the piles and transferred to deeper portions of the piles. However, as the stress level increases, the mobilisation of the shaft shear stress becomes more uniform with depth. It should be noted that the distributions of the shaft shear stresses with depth for the 9 × 9 pile group are substantially more uniform in comparison with that of the single pile. Furthermore, it can also be observed that the mobilisation of the shaft shear stress is the highest for the corner range piles and the lowest for the core range piles. At 80% of the ultimate load, the corner pile is almost fully mobilised along the entire pile shaft and more shear stresses are transferred from the corner piles to the core piles just prior to the ultimate failure of the pile group.
Figure 10b shows the load ratio (Pi/Pavg) between the vertical load induced at a given pile location (Pi) and the average vertical load carried by the pile groups (Pavg) with the applied load level. Generally, when the total load is less than approximately 30% of the ultimate load, the responses of individual piles are largely elastic. The load carried by the corner pile is approximately 1.3 times the average applied load, whereas the centre pile carries approximately 0.8 times the average applied load. The load ratio remains constant at this range of load levels, which implies that the load distribution among the pile group basically remains unchanged and that the stiffness of the pile group remains constant. Cooke et al. [29] observed similar features in experiments when piles that were loaded through a stiff pile cap took a higher proportion of an applied load than the central piles. As the load level increases above 50%, the load ratio for the corner pile decreases, whereas the load ratio of the centre pile increases until the total load reaches the ultimate load of the system. All the load ratios approach unity when the ultimate load of the pile groups is reached. This observation is consistent with the mobilisation of the shaft shear stress profiles as observed in Figure 9.

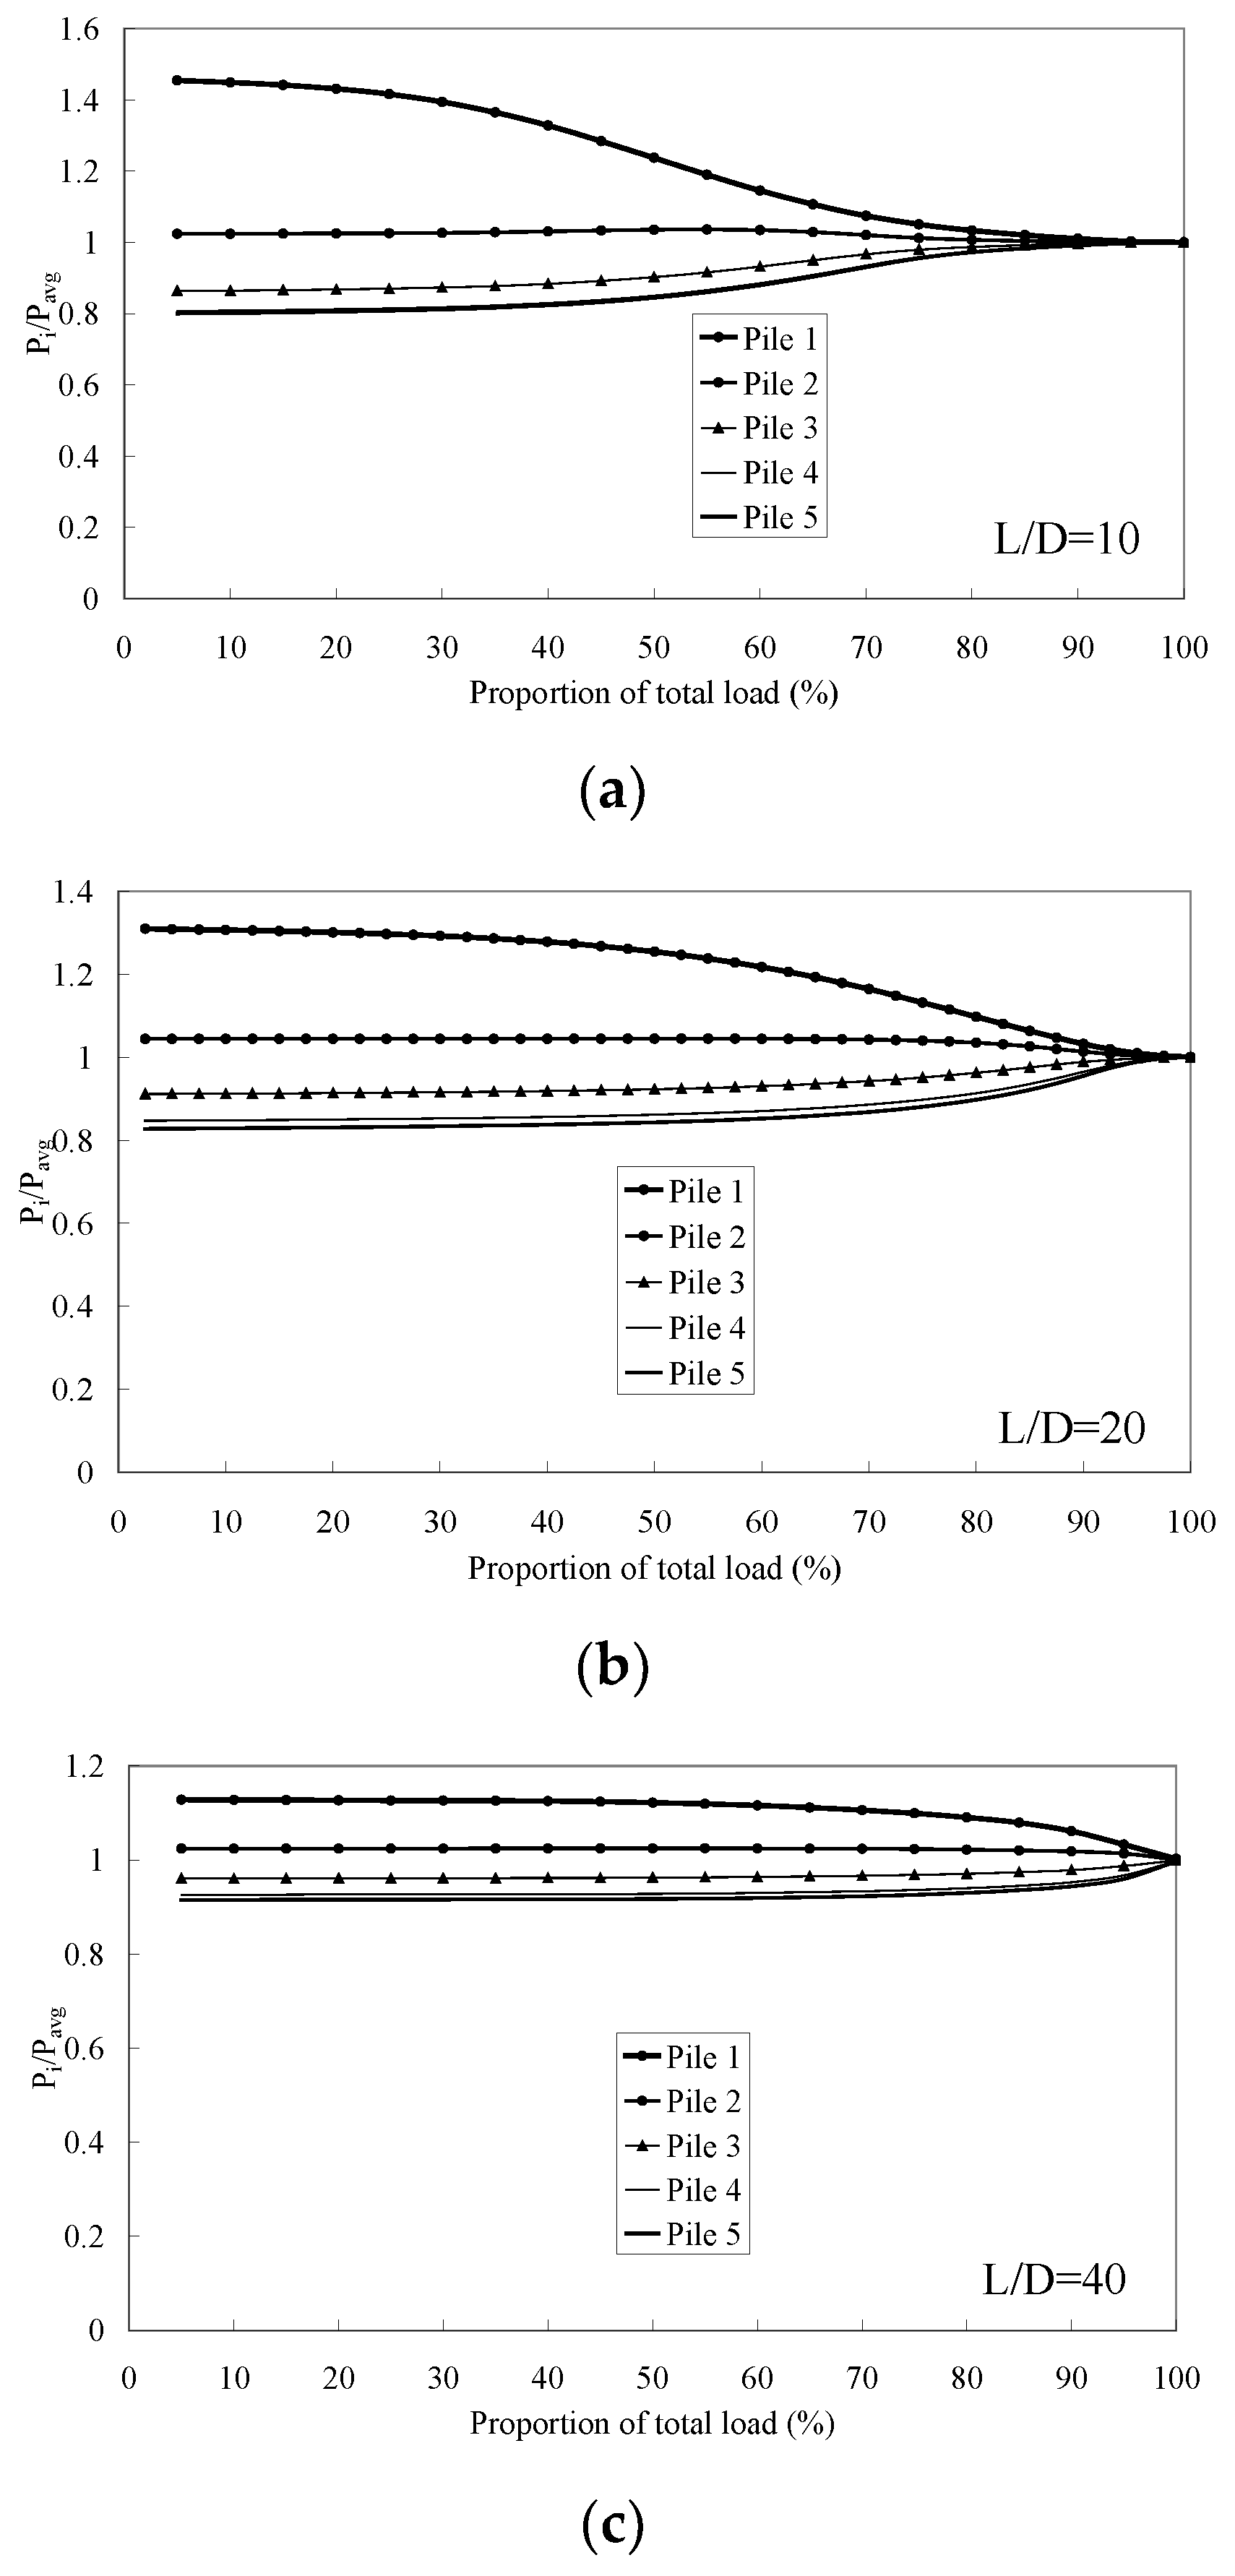
3.2. Effect of the Pile Slenderness (L/D) on the Behaviour of Pile Groups

The distributions of loads at different pile locations for pile slenderness ratios, L/D, of 10, 20, and 40 are shown in Figure 10a,c, respectively. It can be seen that the developments of the load ratios, Pi/Pavg, at different pile locations are not constant and are dependent on the load level and the pile slenderness ratio. The load distributions for the short pile group with L/D = 10 are more nonuniform and more sensitive to changes in the load level than those for the long pile group (i.e., L/D = 20 or L/D = 40). These results indicate that the load-transfer mechanisms of the short pile group are quite different from those of the long pile group. The long pile group deforms similar to a rigid “block” and, therefore, results in a more uniform load distribution along a single pile in a pile group. However, the shorter pile group introduces different degrees of loads at different pile locations in the group. Interestingly, the load ratio for the longer pile groups remains constant up to a load level of approximately 60%, which indicates that the longer pile group is more effective in transferring the pile loads into the deeper and stronger soil strata below the pile base.
An alternative way of understanding the load-transfer mechanisms of pile groups is through the examination of the shaft shear stress development profiles as shown in Figure 11a–c (only showing the results at 30% of the ultimate pile group’s capacity). For comparison proposes, the development of the shaft shear stress profiles for single piles is also included in the figures for reference. In the short pile groups, the development of the shaft shear stress profile (especially pile 2) is very similar to that of a single short pile, whereas the development of the shear stress of the shaft of the long pile groups is very different from the development of the shaft shear stress of a single long pile. The shaft shear stress increases rather gradually with depth for the long pile group, whereas the development of the shaft shear stress for a single long pile is highly nonlinear and is mobilised to a higher degree than for the pile group.
Figure 12a–c show the ratios of the total shaft load of an individual pile, psi, and the base load of an individual pile, pbi, with the pile head load carried at each individual pile, pti, of a 9 × 9 pile group under different load levels and slenderness ratios. The behaviour of the single pile is also included in the figure for a direct comparison. For the single pile, the shaft shear stress is mobilised more substantially and carries most of the applied load, while only a small portion of the total load is transferred to the bottom of the pile. At the same time, more loads are being transferred to the base area of the pile groups. In pile groups with slenderness ratios, L/D, of 20 and 40, the shaft load increases with the load level, which is contrary to the response of the single pile whose shaft load decreases with an increase in the total load level. As pointed out by Randolph [30], because the axis response is more interactive than the base response, the interaction is that the load is transferred to a larger proportion of the base of the group pile than the single isolated pile. Through three-dimensional finite element analysis, Ottavian [31] proposed that the load transmitted to the bottom of a pile is much higher for the 3 × 3 and 3 × 5 pile groups than for the single pile. Similar behaviour was also observed in experiments by O’Neill et al. [32] and by Ghosh [33]. Randolph and Wroth [7] explain this phenomenon by suggesting an increase in the proportion of the load transmitted at the bottom of the pile groups compared to a single pile, from a much larger interaction between the pile shafts than between the pile bottom. This is contrary to the behaviour of a single pile, in which most of the load is carried by the shaft load, whereas the base takes only a small proportion of the applied load. For the short-length pile group (i.e., L/D = 10), the trend of the corner pile (pile 1) is quite similar to that of a single pile. However, the core piles (piles 3 and 5) exhibit a different load-support mechanism than the corner pile. In a short pile group, higher loads are distributed to the outside range piles (piles 1 to 3) than to the core piles. The load distribution for the short pile group shows some resemblances to the load distribution of a rigid raft resting on elastic ground. However, in the longer pile group, the load distributions at various pile locations are more uniform and the pile group deforms similar to a rigid “block”. It should be noted that the relative contributions generated from the pile shaft and the pile base are not constant but vary with the applied load level. The importance of the shaft resistance in the pile group increases with the load level, which is opposite to the behaviour of a long slender single pile.

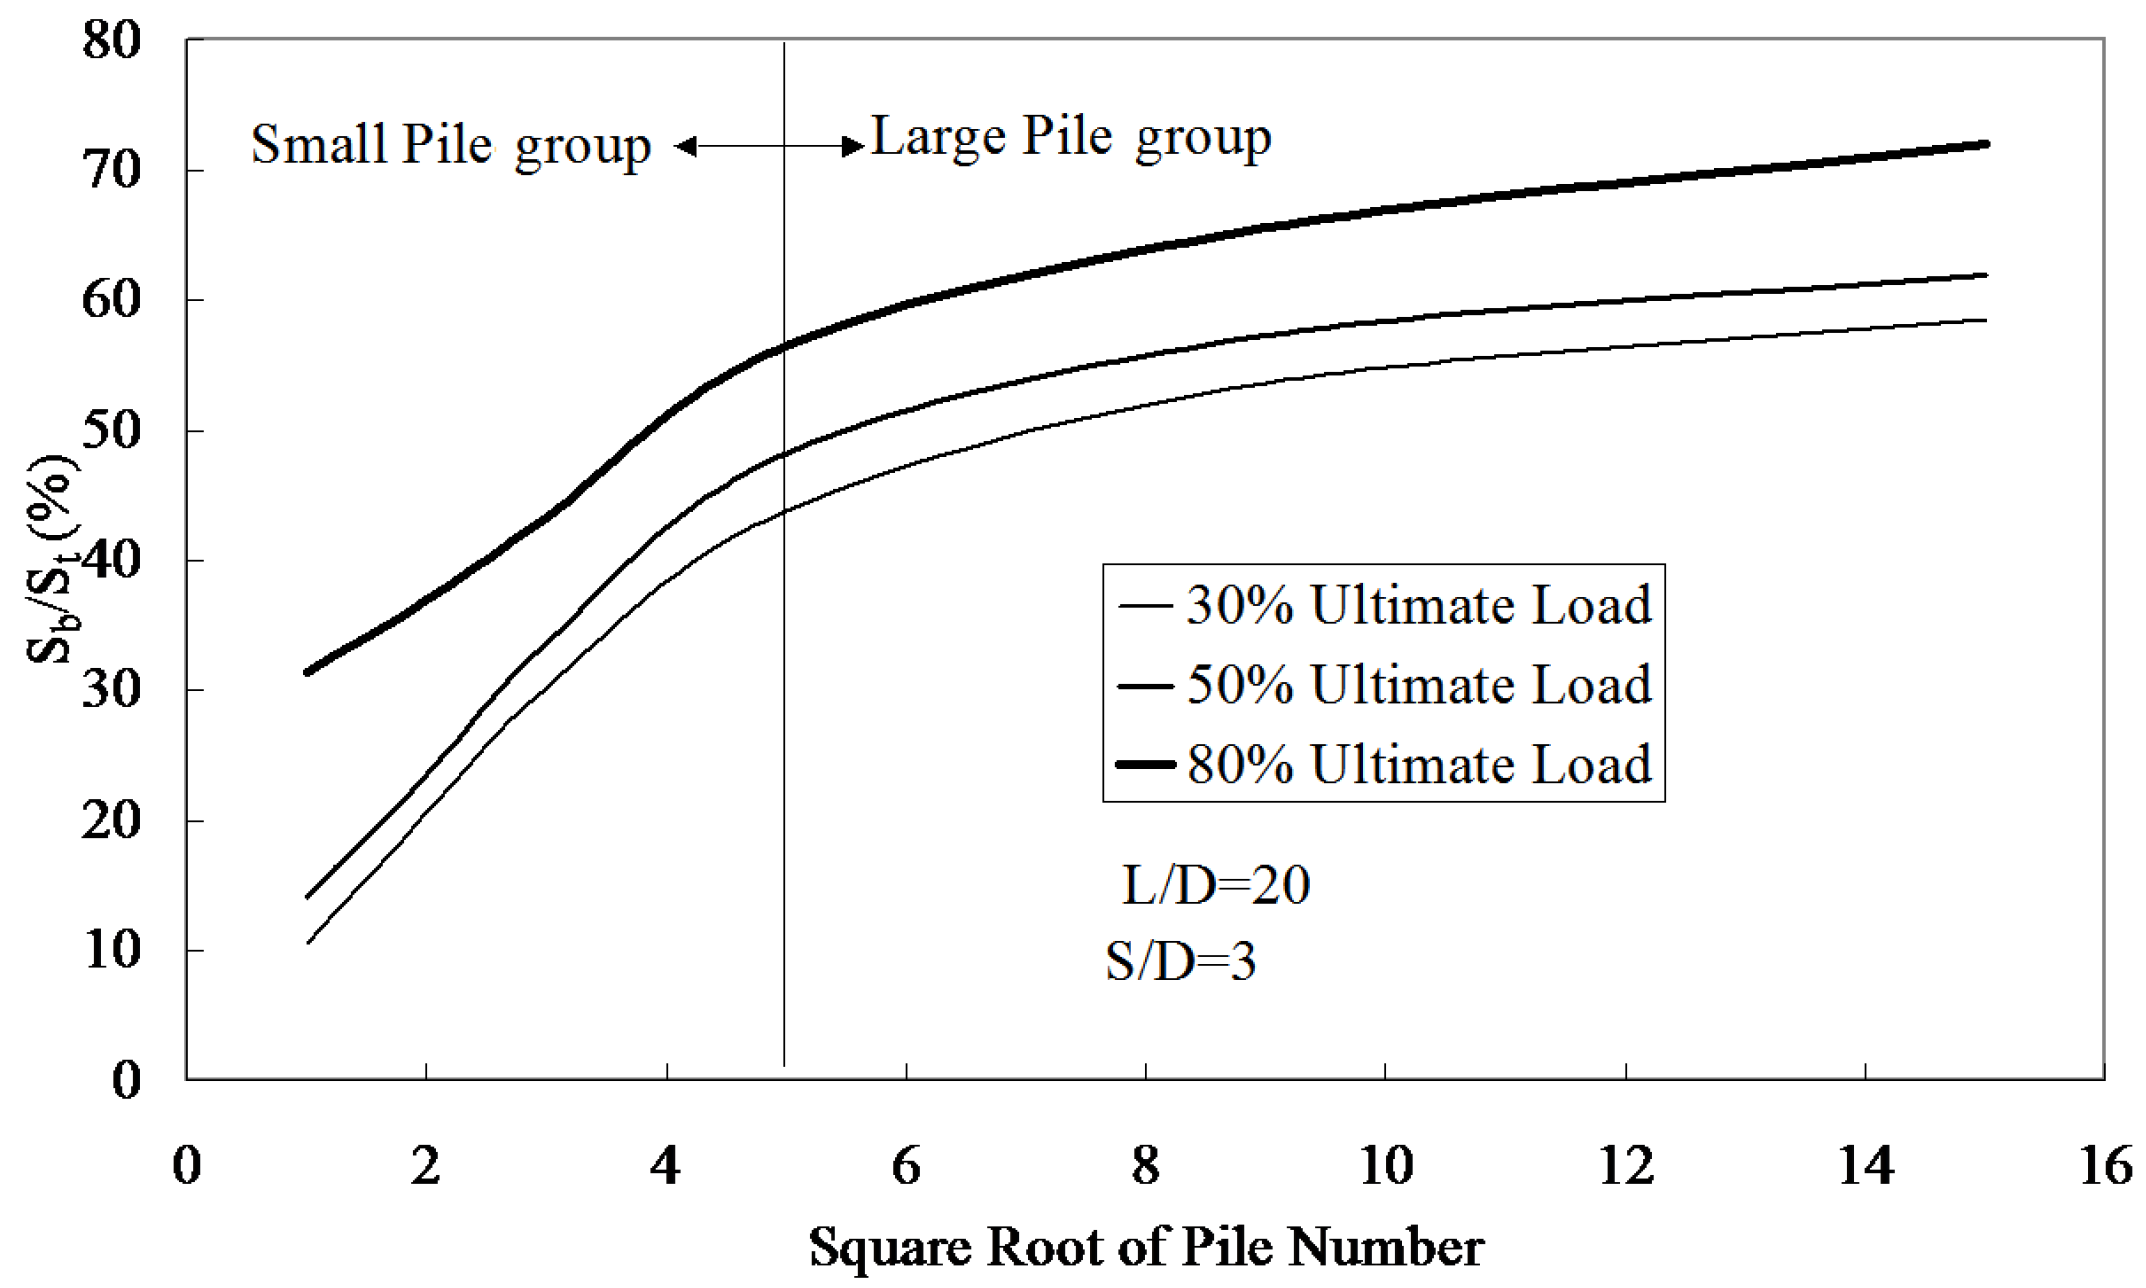
3.3. Number of Piles in a Pile Group

Figure 13a–f show the results of the shaft shear stress mobilisation with pile groups of different depths (single pile, 2 × 2, 3 × 3, 5 × 5, 9 × 9, and 15 × 15 pile groups, respectively) and different pile slenderness ratios (L/D of 50, 40, 30, 20, and 10) at a load level of 30% of the ultimate load. In a general sense, the 2 × 2 and 3 × 3 pile groups display responses very similar to that of a single pile. The 5 × 5 pile groups can be considered a transitional case. The behaviours of the 9 × 9 and 15 × 15 pile groups are substantially different from those of the smaller pile groups. The shaft shear stresses for the larger pile groups are mobilised more uniformly and increase gradually with depth. The behaviours for the large pile groups are very similar to those of the short and stubby single piles. This can be explained by following the logic suggested by Fleming et al. in which the interaction effects along the pile shaft in a large pile group transfer more loads into the end-bearing strata of the group. Since the end-bearing pressure is much greater than the average skin friction, block failure occurs only when the increase in the base area is offset by a large decrease in the surface zone of a pile group shaft. As a result, pile groups with large numbers of long slender piles at a specific spacing are more likely to fail as a block than groups of multiple short stubby piles that fail at the same spacing. Poulos [34] also found that as the number of interaction piles increases, the shear stress distribution along the shaft decreases and more pile loads are transferred to the bottom of the pile groups.
The behaviours of the small pile group and the large pile group are illustrated in Figure 14a–c. These figures show the degrees of the mobilisation of the base load, which is represented by the ratio of the average total base load, Pb(avg), and the ultimate total base load, Pb(ult), for different pile slenderness ratios (L/D = 10 to 60) and different numbers of piles in the pile groups (single pile, 2 × 2, 3 × 3, 5 × 5, 9 × 9, and 15 × 15 pile groups) under different load levels (30, 50, 80% of the ultimate capacity of the pile group). These figures indicate that the contribution of the base load of the group varies with the size of the pile group, the pile slenderness ratio, and the level of load mobilisation. In short pile groups, the contribution of the base loads of the pile groups are very similar to that of the single pile regardless of the size of the pile group. This is consistent with the relatively uniform trends of the shaft shear stress profiles for short pile groups (L/D = 10) under different group sizes as indicated in Figure 13a–f. However, for longer pile groups with higher L/D values, the contribution of the base load for the large pile groups is very different from that of the single pile behaviours. For a single pile, the importance of the base capacity of the pile decreases with the pile length, which indicates that the pile shaft becomes more effective in providing the load capacity of the single pile. Although there are substantial amounts of pile–shaft interactions in large pile groups, the importance of the pile shaft in large pile groups diminishes quickly with the pile length. Thus, more loads are transferred to the base of the group and the total contributions of the base capacity of the group increase substantially. Large pile groups thus behave similar to a large rigid block embedded in the soil. The 5 × 5 pile group (with the conditions undertaken in this study) can be considered the transition group size to delimit small-group from large-group behaviours. The observations generally remain the same under different load levels, except that the overall importance of the base capacities becomes significant at higher load levels. Figure 15 shows the settlement ratio of the average settlement of the pile base, Sb, and the settlement of the pile cap, St, with the size of the pile group at a pile slenderness ratio of L/D = 20. The settlement ratio increases rapidly up to the 5 × 5 group, after which the rate of increase becomes very gradual for the larger groups. Two distinct zones of behaviour can be delineated as indicated by the change in the settlement ratio. The results shown in Figure 15 reinforce the previously described pile group interaction behaviours.
Figure 16a–f summarises the pile group behaviours in terms of the normalised pile stiffness τpavg/GsoDw, where pavg is the average load applied on the pile group, D is the diameter of the pile, Gso is the shear modulus of the soil at the ground surface, and w is the pile cap settlement at the corresponding applied load on the cap) with different pile slenderness ratios (L/D), for various pile group sizes (single pile, 2 × 2, 3 × 3, 5 × 5, 9 × 9, and 15 × 15 pile groups) and under different load levels (30%, 50% and 80% of the ultimate load of the pile group). In a general sense, the normalised pile stiffness reflects the overall efficiency of the pile group system, with a higher normalised pile stiffness indicating that the system can support higher loads under a given pile cap settlement or that it deforms to a lesser degree under a given load. The results in Figure 16a–f indicate that the normalised pile stiffness generally decreases with the size of the pile group and loading level. For the single pile and the small pile group cases (up to a size of 5 × 5), the normalised pile stiffness initially increases with L/D to a critical pile slenderness ratio, after which the normalised pile stiffness decreases with a further increase in L/D. However, for larger sizes of pile groups (9 × 9 and 15 × 15), such a critical slenderness ratio cannot be observed and the normalised stiffness continuously increases with L/D but at a substantially reduced rate. The critical pile slenderness ratios are 20, 25, 30, and 45 for the single pile, 2 × 2, 3 × 3, and 5 × 5 pile groups, respectively. For the single pile, as mentioned previously (see Figure 13a), the mobilisations of the shaft shear stress profiles change from being almost uniformly distributed for the short pile with L/D = 10 to highly concentrated at the upper portion (with L/D from 0 to approximately 0.6) for the long single pile with L/D = 50. Since most of the pile settlements are developed at the concentrated shear zones, this will cause the resulting normalised pile stiffness to change according to the L/D ratio. Similar behaviours are observed for the smaller pile group cases. When the number of piles in the group increases, the interaction effects among the pile shafts become more substantial. The overall efficiencies of the large pile groups are thus much smaller than those of the small pile groups. For large pile groups with short pile lengths, the axial loads induced on the individual piles are highly nonlinear with a much higher magnitude of loads developed at the corner piles than at the centre piles. This load distribution is somewhat similar to that of a large rigid raft resting on elastic soil, thus the overall efficiency of the system is quite low. For large pile groups with longer piles, the pile shaft interaction causes more loads to be transferred to the pile base and the overall load-settlement behaviours of the system become similar to that of equivalent large blocks embedded in the elastic ground. This, in turn, will improve the overall efficiency of the system as reflected by the results of the 9 × 9 and 15 × 15 pile groups.

3.4. Effect of the Pile Spacing Ratio (S/D) on the Behaviour of the Pile Group

The effects of pile spacing on the pile group behaviour can be examined by the changes in the psi/pti and pbi/pti ratios with load levels under different pile spacing ratios, S/D. In Figure 12b, the results for a 9 × 9 pile group with S/D = 3 and L/D = 20 are presented. To research the pile interaction effect under different S/D ratios, analyses are conducted for the two additional cases with identical geometries and soil conditions but only changing the S/D ratios to 6 and 9. The results are shown in Figure 17a,b for S/D ratios of 6 and 9, respectively. The overall behaviours of the three cases are very different. As previously mentioned, owing to the more pronounced interaction effects along the pile shaft than at the pile base for the case with a closer pile spacing (i.e., S/D = 3), more loads are transferred to the bottom of the pile groups and the group behaves similar to an equivalent rigid block. The behaviours of the pile groups are, therefore, very different from that of the single pile as shown in Figure 12b. As the pile spacing increases to S/D values of 6 and 9 as shown in Figure 17a,b, the shaft interaction effects reduce significantly. As a result, the overall behaviours of the pile groups are closer to that of a single pile. In fact, for S/D = 9, the interaction effect is very small and all the piles in the 9 × 9 group behave similar to a single pile. Figure 18 shows that the normalised stiffness of the pile groups varies with different pile spacing ratios (S/D) under different pile group configurations of 3 × 3, 5 × 5, and 9 × 9. The effects of the pile spacing on the normalised group stiffness are more significant for large pile groups under low S/D ratios. As the S/D ratios increase, the efficiency of the pile groups increases in response to lower shaft interaction effects [35]. It is interesting to note that the normalised group stiffness values are almost identical regardless of the size of the pile groups at large S/D ratios. Under such conditions, the pile group behaviours are simply the sum of the individual isolated single piles, and the pile interaction effect has little relevance.

4. Conclusions

In this paper, based on the simplified nonlinear load transfer functions for pile shaft and pile load as derived by Lee and Xiao [20,21], analyses were conducted to understand the behaviours of the pile groups in a nonhomogeneous soil medium and of various sizes. This method is suitable for pile groups embedded in any layered soil. The accuracy of the method based on the proposed load-transfer function was verified by comparisons with the more rigorous boundary integral solution reported by Butterfield and Banerjee[7] and with Randolph and Wroth’s [24] results for pile groups in linear elastic homogeneous soils. Field pile load test results for the single pile and the pile groups as described by O’Neill [26] were also referenced for the verification of the proposed method. Reasonable agreements were obtained for all cases. Furthermore, through systemic parametric studies, the following conclusions can be drawn:
(1)
The soil–pile interface parameters a and b as described by Lee and Xiao [20,21] can be obtained using the back-analysis method proposed in this paper. Both parameters bear strong physical relationships with the stratigraphy of the soils. It is shown through field tests that the approach accurately computes the load-settlement behaviours of the single pile and the pile groups.
(2)
The proposed method is an efficient method for the nonlinear analysis of large pile groups, which makes the method ideally suited to small computers. There is no requirement for a computer with a large storage capacity.
(3)
There are significant differences between the single pile and the pile groups’ behaviours. However, there are two primary factors affecting the overall behaviours of the pile groups, which are the number of piles in the pile groups and the pile slenderness ratio, L/D.
(4)
Contrary to the behaviour of the long slender single piles, the soil located at the pile base plays an important role in the load-transfer mechanism of large pile groups. Due to the increasing amount of shaft interactions in large pile groups, the overall shaft resistance of pile groups is significantly reduced, and a larger proportion of the pile load is transferred to the base of the pile groups, especially under lower load levels (30–50%). From a conventional design point of view, one often designs a pile group based on single pile behaviour or a single pile test. This could sometimes be misleading since the load-transfer mechanism of the single pile differs from that of the pile groups.
(5)
For small pile groups, the load transfer behaviours are similar to the behaviours of single piles but for larger pile groups, such behaviours are similar to an equivalent rigid block foundation.
(6)
When the pile slenderness ratio increases, the load distributions for the individual piles in the pile groups become more uniform and the normalised group stiffness becomes smaller.
(7)
Under a normal pile spacing ratio, S/D, of 2 to 6, the shaft interaction factor is significant and it has some effects on the overall behaviours of the pile groups. Beyond this range, the interaction effects become quite small and the overall behaviours of the pile group are similar to those of isolated single piles.

Author Contributions

Data curation, H.L.; investigation, H.L. and Z.X.; project administration, K.L.; supervision, K.L.; writing—original draft, H.L.; writing—review & editing, Z.X. All authors have read and agreed to the published version of the manuscript.

Funding

This research was funded by the National Natural Science Foundation of China grant number [50978086 and 51178165].

Acknowledgments

In particular, the author would like to thank the editor for the careful editing and layout of this article, as well as for the reviewer’s valuable comments and suggestions for this article. This paper has also been supported by the National Natural Science Foundation of China (grant No. 50978086 and 51178165).

Conflicts of Interest

The authors declare no conflict of interest.

List of Notations

Apis the cross-sectional area of the pile
ais the empirical factor of the soil interface
bis the empirical factor of the soil interface
c ¯ is the group parameter
Dis the pile diameter
Epis the elastic modulus of the pile
Gis the shear modulus of the soil surrounding the pile
Gbis the shear modulus
Gsois the shear modulus of the soil at the ground surface
Ksiis the reciprocal of the initial stiffness
Lis the length of the pile
nis the number of piles
Pavgis the load applied at the pile base
Piis the sensing vertical load
Psiis the total shaft load of an individual pile
Pbiis the base load of an individual pile
Ptiis the pile-head load carried by each pile
pbfis the ultimate base load
p ¯ ( z ) is the spline-fitting function
Rfis the failure ratio
R f b is the hyperbolic fit constant
rois the pile radius
rmis the radius from the pile centre to a distance at which the shear stress induced by the pile load becomes negligible
Sis the centre-to-centre spacing
sijis the centre-to-centre distance between pile i and pile j
szis the total displacement
stiis the displacement of the pile head at the different load step
sizis the shaft displacement caused by pile element i in a pile group
wis the displacement of a pile group
Wiszis the vertical soil displacement of the pile element i at depth z
Wijszis the interactive displacement effect dependent on the adjacent pile j
Wszis the elastic displacement
Wiis the soil displacement of pile i at the pile base
zis the depth of the soil
Δsizis the local shear displacement
υsis the Poisson’s ratio of the soil
υsbis the Poisson’s ratio of the soil at the pile base
λis the stiffness ratio
τzis the pile axial shear stress
τizis the shaft shear stress caused by a pile element i at the shaft interface
τultis the asymptotic shear stress
τfis the failure strength of a pile–soil interface
τjzis the shaft shear stress at depth z
τf(z)is the failure strength of a pile–soil interface at depth z

References

  1. Skempton, A.W. Discussion: Piles and pile foundations, settlement of pile foundations. In Proceedings of the Third International Conference on Soil Mechanics and Foundation Engineering, Zurich, Switzerland, 16–27 August 1953; p. 172. [Google Scholar]
  2. Meyerhof, G.G. Bearing Capacity and Settlement of Pile Foundations. J. Geotech. Eng. Div. 1976, 102, 197–228. [Google Scholar] [CrossRef]
  3. Bjerrum, L.; Jonson, W.; Ostenfeld, C. The settlement of a bridge abutment on friction piles. In Proceedings of the 4th ICSMFE, London, UK, 12–24 August 1957; pp. 12–24. [Google Scholar]
  4. Tomlinson, M.J. Foundation Design and Construction, 5th ed.; Longman Scientific and Technical: Harlow, UK, 1986. [Google Scholar]
  5. Butterfield, R.; Banerjee, P.K. The elastic analysis of compressible piles and pile groups. Geotechnique 1971, 21, 43–60. [Google Scholar] [CrossRef]
  6. Poulos, H.G.; Davis, E.H. Pile Foundation Analysis and Design; Wiley: New York, NY, USA, 1980. [Google Scholar]
  7. Randolph, M.F.; Wroth, C.P. An analysis of the vertical deformation of pile groups. Géotechnique 1979, 29, 423–439. [Google Scholar] [CrossRef]
  8. Chow, Y.K. Analysis of vertically loaded pile groups. Int. J. Numer. Anal. Methods Geomech. 1986, 10, 59–72. [Google Scholar] [CrossRef]
  9. Mandolini, A.; Viggiani, C. Settlement of piled foundations. Geotechnique 1997, 47, 791–816. [Google Scholar] [CrossRef]
  10. Guo, W.D.; Randolph, M.F. Vertically loaded piles in non-homogeneous media. Int. J. Numer. Anal. Methods Geomech. 1997, 21, 507–532. [Google Scholar] [CrossRef]
  11. Guo, W.D.; Randolph, M.F. An efficient approach for settlement prediction of pile groups. Geotechnique 1999, 49, 161–179. [Google Scholar] [CrossRef]
  12. Konagai, K.; Yin, Y.; Murono, Y. Single beam analogy for describing soil–pile group interaction. Soil Dyn. Earthq. Eng. 2003, 23, 31–39. [Google Scholar] [CrossRef]
  13. Cairo, R.; Conte, E. Settlement analysis of pile groups in layered soils. Can. Geotech. J. 2006, 43, 788–801. [Google Scholar] [CrossRef]
  14. Zhang, Q.Q.; Zhang, Z.M.; He, J.Y. A simplified approach for settlement analysis of single pile and pile groups considering interaction between identical piles in multilayered soils. Comput. Geotech. 2010, 37, 969–976. [Google Scholar] [CrossRef]
  15. Hussien, M.N.; Tobita, T.; Iai, S.; Karray, M. On the influence of vertical loads on the lateral response of pile foundation. Comput. Geotech. 2014, 55, 392–403. [Google Scholar] [CrossRef]
  16. Ghalesari, A.T.; Barari, A.; Amini, P.F.; Ibsen, L.B. Development of optimum design from static response of pile–raft interaction. J. Mar. Sci. Technol. 2015, 20, 331–343. [Google Scholar] [CrossRef]
  17. Cui, W.; Zheng, X. Analysis of the Response of Pile Groups Considering Pile–Cap–Soil Interaction in Layered Soil. Soil Mech. Found. Eng. 2018, 55, 87–95. [Google Scholar] [CrossRef]
  18. Pan, D.; Zhang, Q.; Liu, S.; Zhang, S. Analysis on response prediction of a single pile and pile groups based on the Runge-Kutta method. KSCE J. Civ. Eng. 2018, 22, 92–100. [Google Scholar] [CrossRef]
  19. Kong, L.; Fan, J.; Liu, J.; Chen, Y.-M. Group effect in piles under eccentric lateral loading in sand. J. Zhejiang Univ.-Sci. A 2019, 20, 243–257. [Google Scholar] [CrossRef]
  20. Lee, K.M.; Xiao, Z.R. A new analytical model for settlement analysis of a single pile in multi-layered soil. Soils Found. 1999, 39, 131–143. [Google Scholar] [CrossRef] [Green Version]
  21. Lee, K.M.; Xiao, Z.R. A simplified nonlinear approach for pile group settlement analysis in multilayered soils. Can. Geotech. J. 2001, 38, 1063–1080. [Google Scholar] [CrossRef]
  22. Clough, G.W.; Duncan, J.M. Finite element analyses of retaining wall behavior. J. Soil Mech. Found. Eng. 1971, 97, 1657–1673. [Google Scholar] [CrossRef]
  23. Lehane, B. Experimental Investigations of Pile Behaviour Using Instrumented Field Piles. Ph.D. Thesis, The University of London (Imperial College of Science, Technology and Medicine), London, UK, 1992. [Google Scholar]
  24. Randolph, M.F.; Wroth, C.P. Analysis of Deformation of Vertically Loaded Piles. J. Geotech. Eng. Div. 1978, 104, 1465–1488. [Google Scholar] [CrossRef]
  25. Banerjee, P.K. Effects of the pile cap on the load displacement behaviour of pile groups when subjected to eccentric loading. In Proceedings of the 2nd Australia-New Zealand Conference on Geomechanics; Australian Geomechanics Society and New Zealand Geomechnics Society: Brisbane, Australia, 1975; pp. 179–184. [Google Scholar]
  26. O’Neill, M.W. Field Study of Pile Group Action: Final Report; Report No. FHWA RD-81-002; Federal Highway Administration, U.S. Department of Transportation: Washington, DC, USA, 1981.
  27. Mendoza, C.C.; Caicedo, B.; Cunha, R. Determination of vertical bearing capacity of pile foundation systems in tropical soils with uncertain and highly variable properties. J. Perform. Constr. Facil. 2017, 31, 04016068. [Google Scholar] [CrossRef]
  28. Kraft, L.M., Jr.; Ray, R.P.; Kagawa, T. Theoretical t-z curves. J. Geotech. Eng. Div. 1981, 107, 1543–1561. [Google Scholar] [CrossRef]
  29. Cooke, R.W.; Price, G.; Tarr, K. Jacked Piles in London Clay: Interaction and Group Behaviour under Working Conditions. Geotechnique 1980, 30, 97–136. [Google Scholar] [CrossRef]
  30. Randolph, M.F. Design methods for pile groups and piled rafts. In Proceedings of the 13th ICSMGE, New Delhi, India, 5 January 1994; Volume 5, pp. 61–82. [Google Scholar]
  31. Ottaviani, M. Three-dimensional finite element analysis of vertically loaded pile groups. Geotechnique 1975, 25, 159–174. [Google Scholar] [CrossRef]
  32. O’Neill, M.W.; Hawkins, R.A.; Mahar, L.J. Load Transfer Mechanisms in Piles and Pile Groups. J. Geotech. Eng. Div. 1982, 108, 1605–1623. [Google Scholar] [CrossRef]
  33. Ghosh, N. A Model Scale Investigation of the Working Load Stiffness of Single Piles and Groups of Piles in Clay under Centric and Eccentric Vertical Loads; University of Southampton: Southampton, UK, 1975. [Google Scholar]
  34. Poulos, H.G. Analysis of the settlement of pile groups. Geotechnique 1968, 18, 449–471. [Google Scholar] [CrossRef]
  35. Jeong, S.; Cho, J. Proposed nonlinear 3-D analytical method for piled raft foundations. Comput. Geotech. 2014, 59, 112–126. [Google Scholar] [CrossRef]
Figure 1. (a) Idealised displacements developed around the pile element; (b) A simplified approximation to model the disturbed soil zone.
Applsci 12 06282 g001
Figure 2. Assumed shear stress and relative displacement relationship at the pile–soil interface.
Applsci 12 06282 g002
Figure 3. Flowchart for study load-settlement behaviour of pile group.
Applsci 12 06282 g003
Figure 4. Comparison of results in terms of normalised stiffness vs. pile slenderness ratio (Randolph [24] and Banerjee et al. [25]).
Applsci 12 06282 g004
Figure 5. Comparison of results between the present method and the elastic approximate methods under different load levels (Randolph and Wroth [7]). (a) L/D = 20; (b) L/D = 50.
Applsci 12 06282 g005
Figure 6. Comparisons between the measured results (O’Neill’s case [26]) and the predicted results (a) Single pile; (b) Pile groups.
Applsci 12 06282 g006
Figure 7. (a) Geology of ground for the O’Neill [26] case; (b) Predicted Ksi profile; (c) Predicted τf profile. 1: Very Stiff Gray and Tan Clay (CL-CH) 2: Stiff Gray and Tan Sandy Clay with Sand Seams (CL)3: Stiff to Very Stiff Red and Light-Gray Clay (CH) 4: Stiff to Very Stiff Light-Gray and Tan Sandy Clay with Sand Pockets (CL).
Applsci 12 06282 g007
Figure 8. Load-settlement curves for various individual piles in a 9 × 9 pile group.
Applsci 12 06282 g008
Figure 9. Degrees of mobilisation of shaft stress along the pile depth at different individual pile locations under different load levels in a 9 × 9 pile group. (a) 80% ultimate load; (b) 50% ultimate load; (c) 30% ultimate load.
Applsci 12 06282 g009
Figure 10. Load ratios developed at individual piles of the 9 × 9 pile group with load levels. (a) L/D = 10; (b) L/D = 20; (c) L/D = 40.
Applsci 12 06282 g010
Figure 11. Development of shaft shear stress profiles. (a) L/D = 10; (b) L/D = 20; (c) L/D = 40.
Applsci 12 06282 g011
Figure 12. Load ratios developed at the pile shaft and the pile base with load levels for a 9 × 9 pile group and a single pile. (a) L/D = 10; (b) L/D = 20; (c) L/D = 40.
Applsci 12 06282 g012
Figure 13. Mobilisation degrees of average shaft shear stress distribution with depth at 30% of the ultimate load. (a) Single pile; (b) 2 × 2 pile group; (c) 3 × 3 pile group; (d) 5 × 5 pile group; (e) 9 × 9 pile group; (f) 15 × 15 pile group.
Applsci 12 06282 g013
Figure 14. Degrees of mobilisation of pile base load with different pile slenderness ratios. (a) 30% ultimate load; (b) 50% ultimate load; (c) 80% ultimate load.
Applsci 12 06282 g014aApplsci 12 06282 g014b
Figure 15. Displacement ratios between the base and head settlement with sizes of pile groups.
Applsci 12 06282 g015
Figure 16. Normalised pile stiffness with different pile slenderness ratios (a) single pile; (b) 2 × 2 pile group; (c) 3 × 3 pile group; (d) 5 × 5 pile group; (e) 9 × 9 pile group; (f) 15 × 15 pile group.
Applsci 12 06282 g016
Figure 17. Load ratios developed at the pile shaft and the pile base with load level for a 9×9 pile group and a single pile (a) S/D = 6; (b) S/D = 9.
Applsci 12 06282 g017
Figure 18. Normalised pile stiffness with different pile group span ratios.
Applsci 12 06282 g018
Publisher’s Note: MDPI stays neutral with regard to jurisdictional claims in published maps and institutional affiliations.

