1. Introduction
Coal is a significant energy resource. For most countries, the coal-based energy structure will be maintained for a long time [
1,
2]. Hence, enhancing the coal utilization efficiency is one of the best solutions to alleviate the contradiction between energy consumption and environmental protection [
3]. The moisture content (MC) of coal is closely related to its calorific value. In the process of coal coking and burning, both excessive and low MC will cause many problems, including reduced coal utilization efficiency, environmental pollution, and energy waste [
4,
5]. Therefore, rapid and accurate measurement of coal MC is of great significance.
The coal MC measurement methods can be mainly divided into direct and indirect methods. The direct measurement method is the standard gravimetric method, which is commonly known as a loss-in-weight method, and it can be mainly divided into nitrogen drying and air drying [
6]. The standard gravimetric method evaporates free (surface) moisture by drying coal at a controlled temperature and weighing it regularly to determine the dry weight. This is a laboratory measurement method, which can provide a high measurement accuracy. However, this method is time-consuming and can affect the original properties of a coal sample, which is not conducive to rapid and online measurement of coal MC. Currently, the conventional indirect measurement methods mainly include neutron [
7], conductance [
8], capacitance [
9], and infrared reflection [
10]. The principle of coal MC measurement by the neutron method is based on measuring the hydrogen content in a coal sample. However, in addition to water, many other chemical impurities in coal also contain hydrogen [
11]. In addition, this method relies on expensive equipment due to the risks of using radioactive neutron sources. The conductance and capacitance methods are susceptible to changes in various factors, such as temperature, density, and electrolyte content, which leads to a poor accuracy without compensation strategies [
12,
13]. The infrared reflection method has a good determination effect on the moisture content of mixed liquid samples; however, it is limited to the measurement of surface moisture of small solid samples (penetration depth within microns) [
14]. The characteristics of the aforementioned methods are summarized in
Table 1. Due to the shortcomings of these methods, there is an urgent need for a measurement method that can rapidly and accurately determine coal MC.
The microwave method is a new method for MC determination, and has gradually developed into an independent rapid and non-destructive measurement technology with the development of microwave electronics and microwave measurement technology. The microwave method has the advantages of being safe, stable, non-destructive, and contactless, and it has been successfully applied to many MC measurement applications, including food crops, light industrial products, and building materials. For instance, Li et al. [
15] used the traveling-standing wave attenuation method to predict the grain MC. They established temperature and bulk density calibration models based on the maximum field attenuation of the transmission traveling-standing wave. Xiang et al. [
16] derived a calibration equation for determining the MC of cotton and polyester blended fabrics and predicted and evaluated the MCs of different fabrics under the condition of a 10-GHz microwave propagating in free space. Piuzzi et al. [
17] used a microwave method to characterize the dielectric constants of two types of stones in building structures at different humidity levels. The obtained laboratory results could be used to derive MC-relative dielectric permittivity calibration curves that could be employed for noninvasive on-the-field moisture monitoring of structures made of the two types of stones.
The free-space transmission measurement method with the antenna group as a signal transceiver and the air as a signal transmission medium has been the most used method in the microwave MC measurement [
18]. The main principle of this method is to establish the relationship between the dielectric properties (dielectric constant
and dielectric loss factor
) of the measured sample and the microwave parameters (attenuation and phase shift). Cutmore et al. [
19] investigated an online measurement method of moisture in black coal, brown coal, and iron ore using low-frequency microwave technology and trialed at a coal export facility. Ponte et al. [
20] determined the MC of different types of coal by measuring the phase shift of microwaves passing through the sample. However, the above studies only selected a single-point frequency signal or narrow bandwidth microwave signals as the calibration signals. The shape and size of coal particles can vary greatly. The experimental results have shown that the instability of coal samples can lead to random noise interference, which can severely affect the expression of effective information when there are fewer data points [
21]. These problems can bring many difficulties in the quantitative analysis of coal MC. Therefore, the microwave measurement method based on a single-point frequency signal or narrow bandwidth signals is not suitable for solving the problem considered in this study. With the development of microwave technology and the popularization of vector network analysis equipment, it has become more convenient to obtain the microwave spectrum of the measured sample under broader bandwidth microwave signals rapidly [
22,
23]. The existing research has shown that the application of a multi-frequency microwave measurement is conducive to improving the range and accuracy of the MC measurement of the sample under test (SUT) [
24]. Moreover, the development and popularization of machine learning and neural network methods have brought greater advantages for processing multi-dimensional complex nonlinear data [
25,
26].
To address the above problems, this study innovatively combines microwave scattering parameters with the distance-weighted k-nearest neighbor (DW-kNN) algorithm to design a measurement system that realizes rapid and non-destructive measurement of coal MC. To the best of our knowledge, no prior work has employed broad bandwidth microwave signals combined with machine learning algorithms to measure the MC of coal. The main contributions of this paper are as follows:
- (1)
Portable microwave analysis equipment is used to design a measurement system that can efficiently generate and measure broad bandwidth microwave scattering parameters containing 133 frequency points from 8.05 GHz to 12.01 GHz and visualize the microwave spectra.
- (2)
To improve the cleanliness of modeling spectrum data, an iterative clipping method based on Mahalanobis distance (MD-ICM) is used to detect and eliminate abnormal samples, i.e., outliers. To overcome the problem of information leakage due to the limited samples, this study uses the nested cross-validation (NCV) method to evaluate the performance of the proposed method.
- (3)
Based on multiple microwave frequency bands, typical machine learning regression models are also evaluated. The comparative experimental results show that using broad bandwidth microwave signals for coal MC measurement can achieve better results.
- (4)
In order to examine the regional robustness of the proposed method, experiments are also carried out on coal from different regions. The designed measurement system can realize rapid and non-destructive measurement of coal MC regardless of coal origin.
The rest of the paper is organized as follows.
Section 2 introduces the materials and methods, including the measurement principle, measurement system and procedure, and data analysis.
Section 3 presents and discusses the experimental results. Finally,
Section 4 concludes this paper.
2. Materials and Methods
2.1. Measurement Principle
The polarization phenomenon of the SUT dielectric can change the dielectric properties of the SUT and the energy of the applied electromagnetic field [
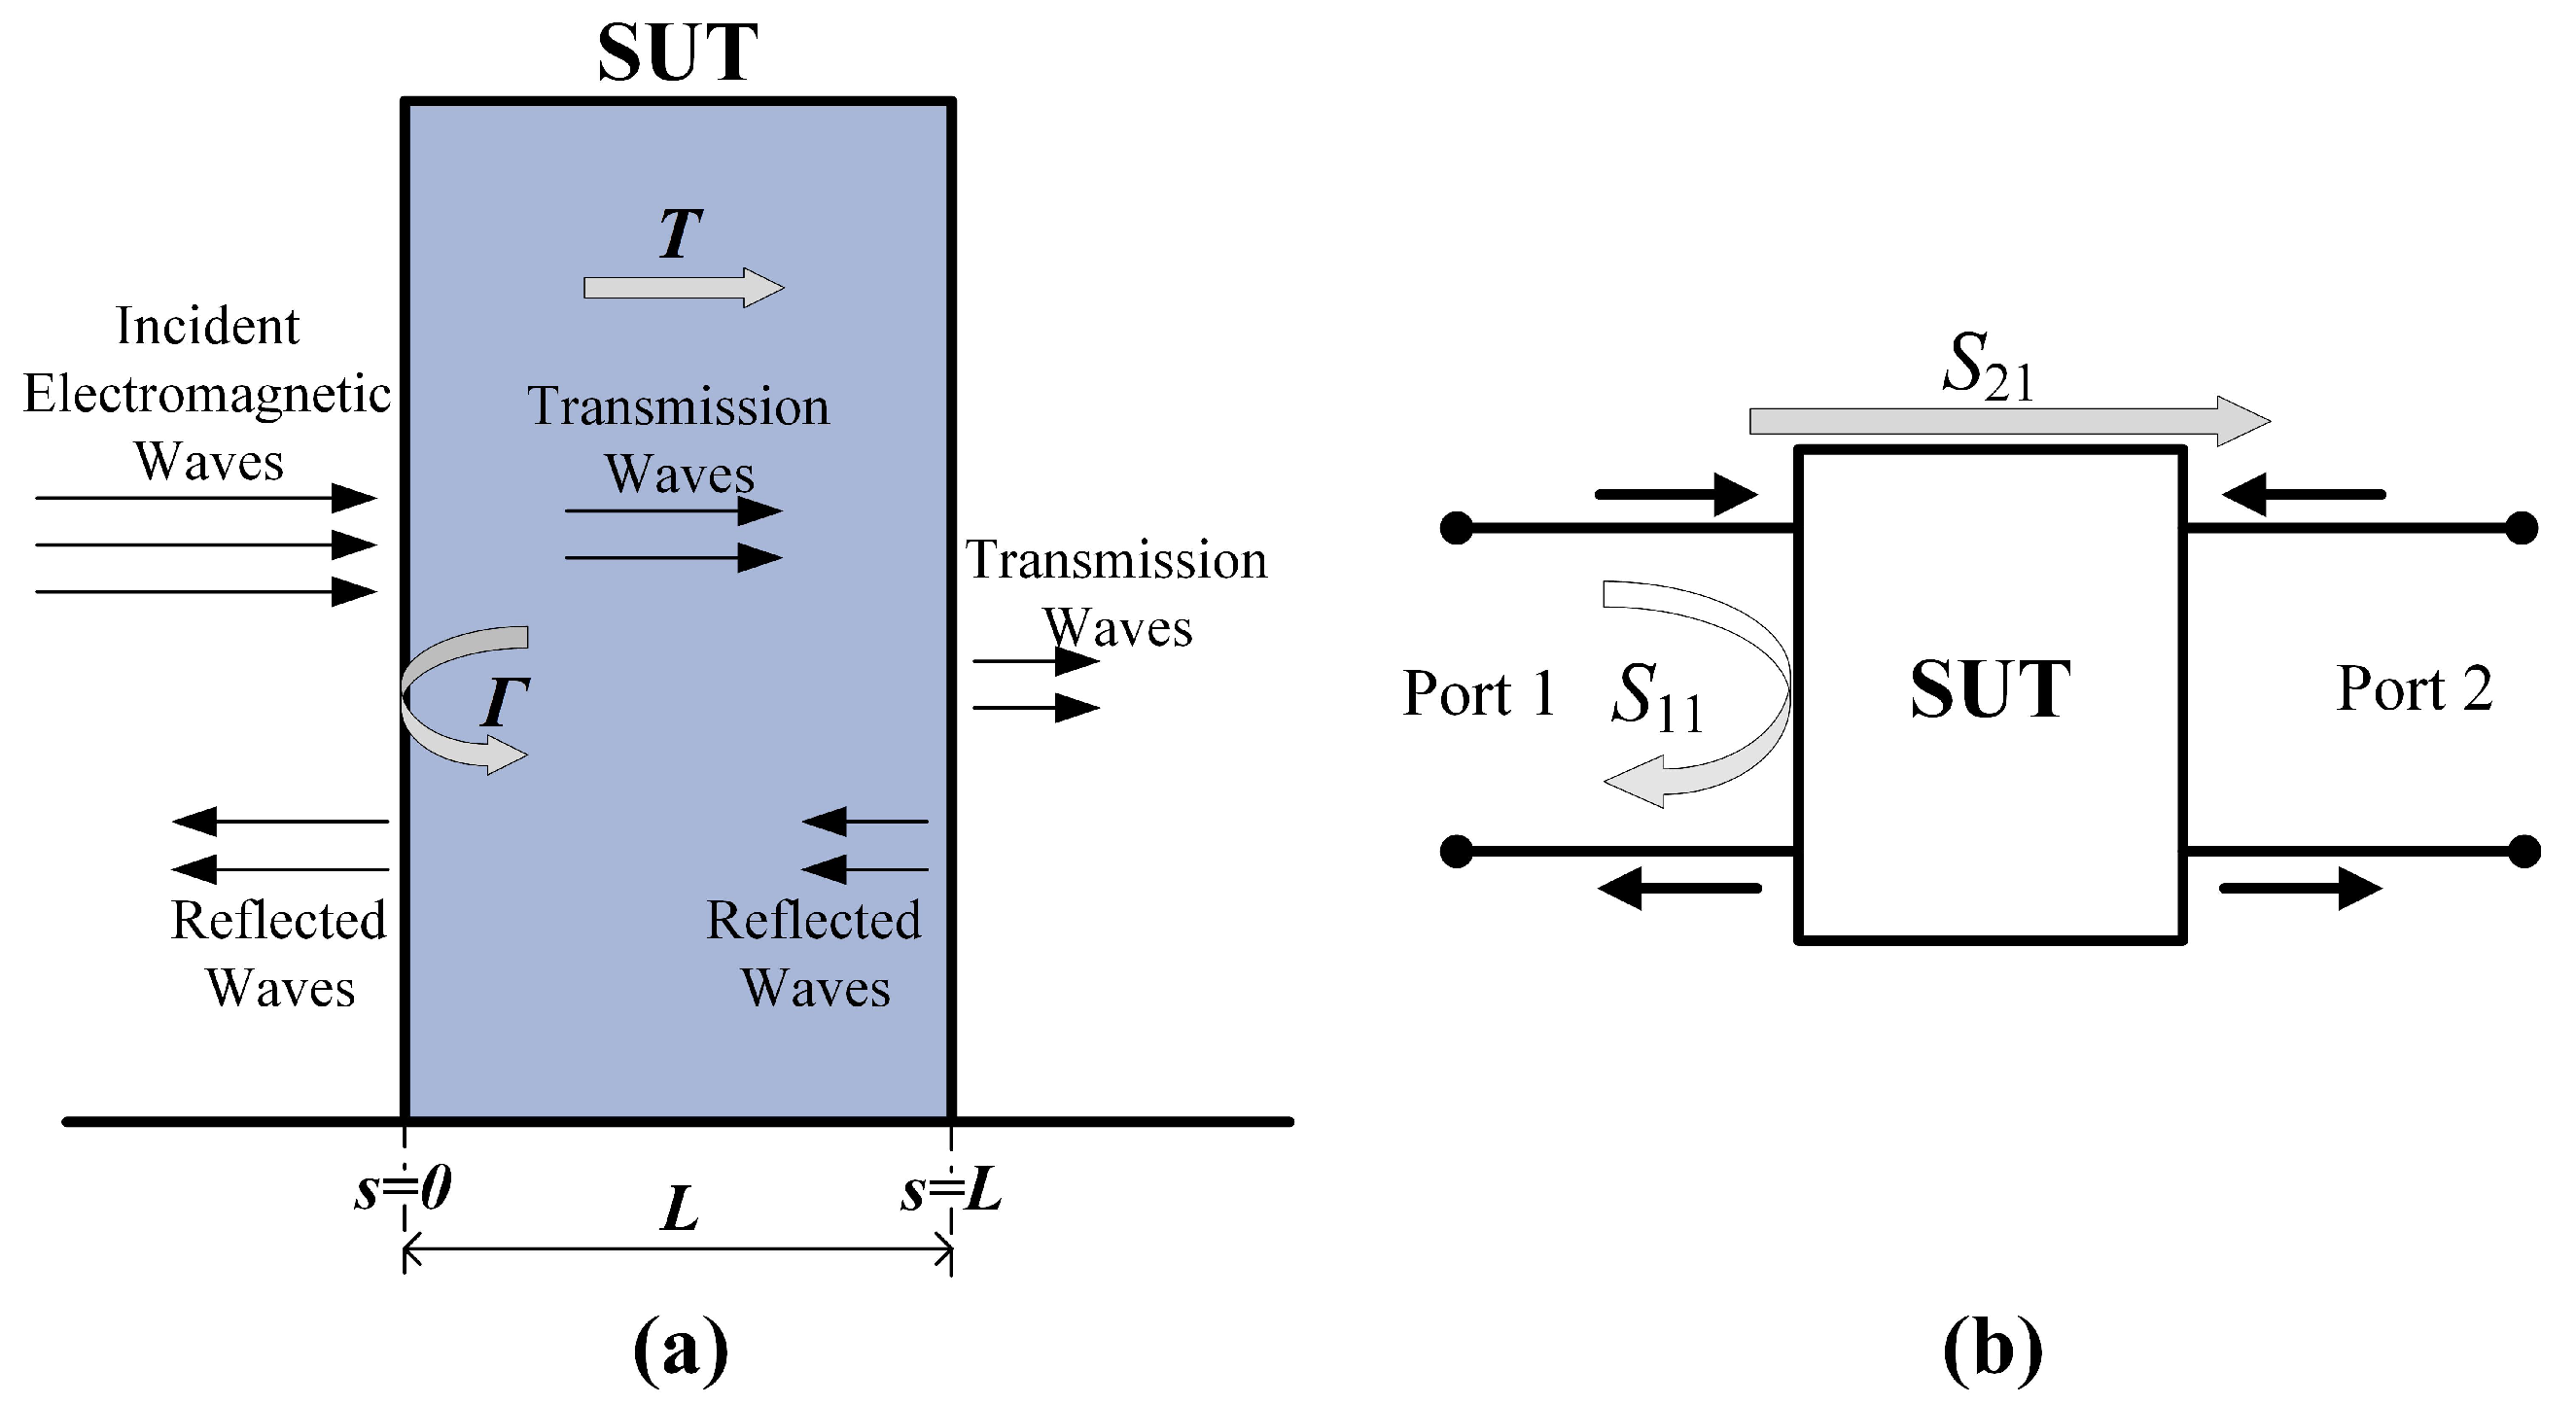
27]. The SUT composition can be obtained by measuring changes in the mentioned values. The interaction diagram of the SUT and electromagnetic waves is presented in
Figure 1.
As shown in
Figure 1a, it is assumed that the electromagnetic waves propagate through the air medium and are perpendicularly incident to the interface (
) of the SUT with a thickness of
L. Part of the incident waves are reflected into the air medium, and the remaining part is transmitted through the interface (
) to the inside of the SUT. The wave transmitted into the SUT can also be reflected or transmitted to the interface (
). This propagation channel is equivalent to a two-port network, as shown in
Figure 1b. Thus, part of the electromagnetic waves incident to the SUT surface will be reflected on port 1 and indicated by the reflection coefficient (
); yet, the other part will pass through the SUT and be transmitted to port 2, which is indicated by the transmission coefficient (
). The reflection and transmission coefficients are respectively expressed as:
where
is the reflection coefficient at the SUT interface (
), and
T is the transmission coefficient inside the SUT, which is also called the propagation factor.
The Nicolson-Ross-Weir method [
28,
29] gives the key equations for determining the relative permittivity
and magnetic permeability
, as follows:
where
and
are the wavelengths corresponding to the free-space propagation frequency and the cutoff frequency, respectively.
By substituting Equations (
1) and (
2) into Equations (
3)–(
5), the relative permittivity of the SUT (non-magnetic medium) can be obtained by:
where
c is the free space velocity and
is the angular frequency.
The and are generally expressed in a complex form consisting of real and imaginary parts. Therefore, the dielectric constant of the SUT can also be expressed as a complex number, which is called complex relative permittivity ().
2.2. Measurement System and Procedure
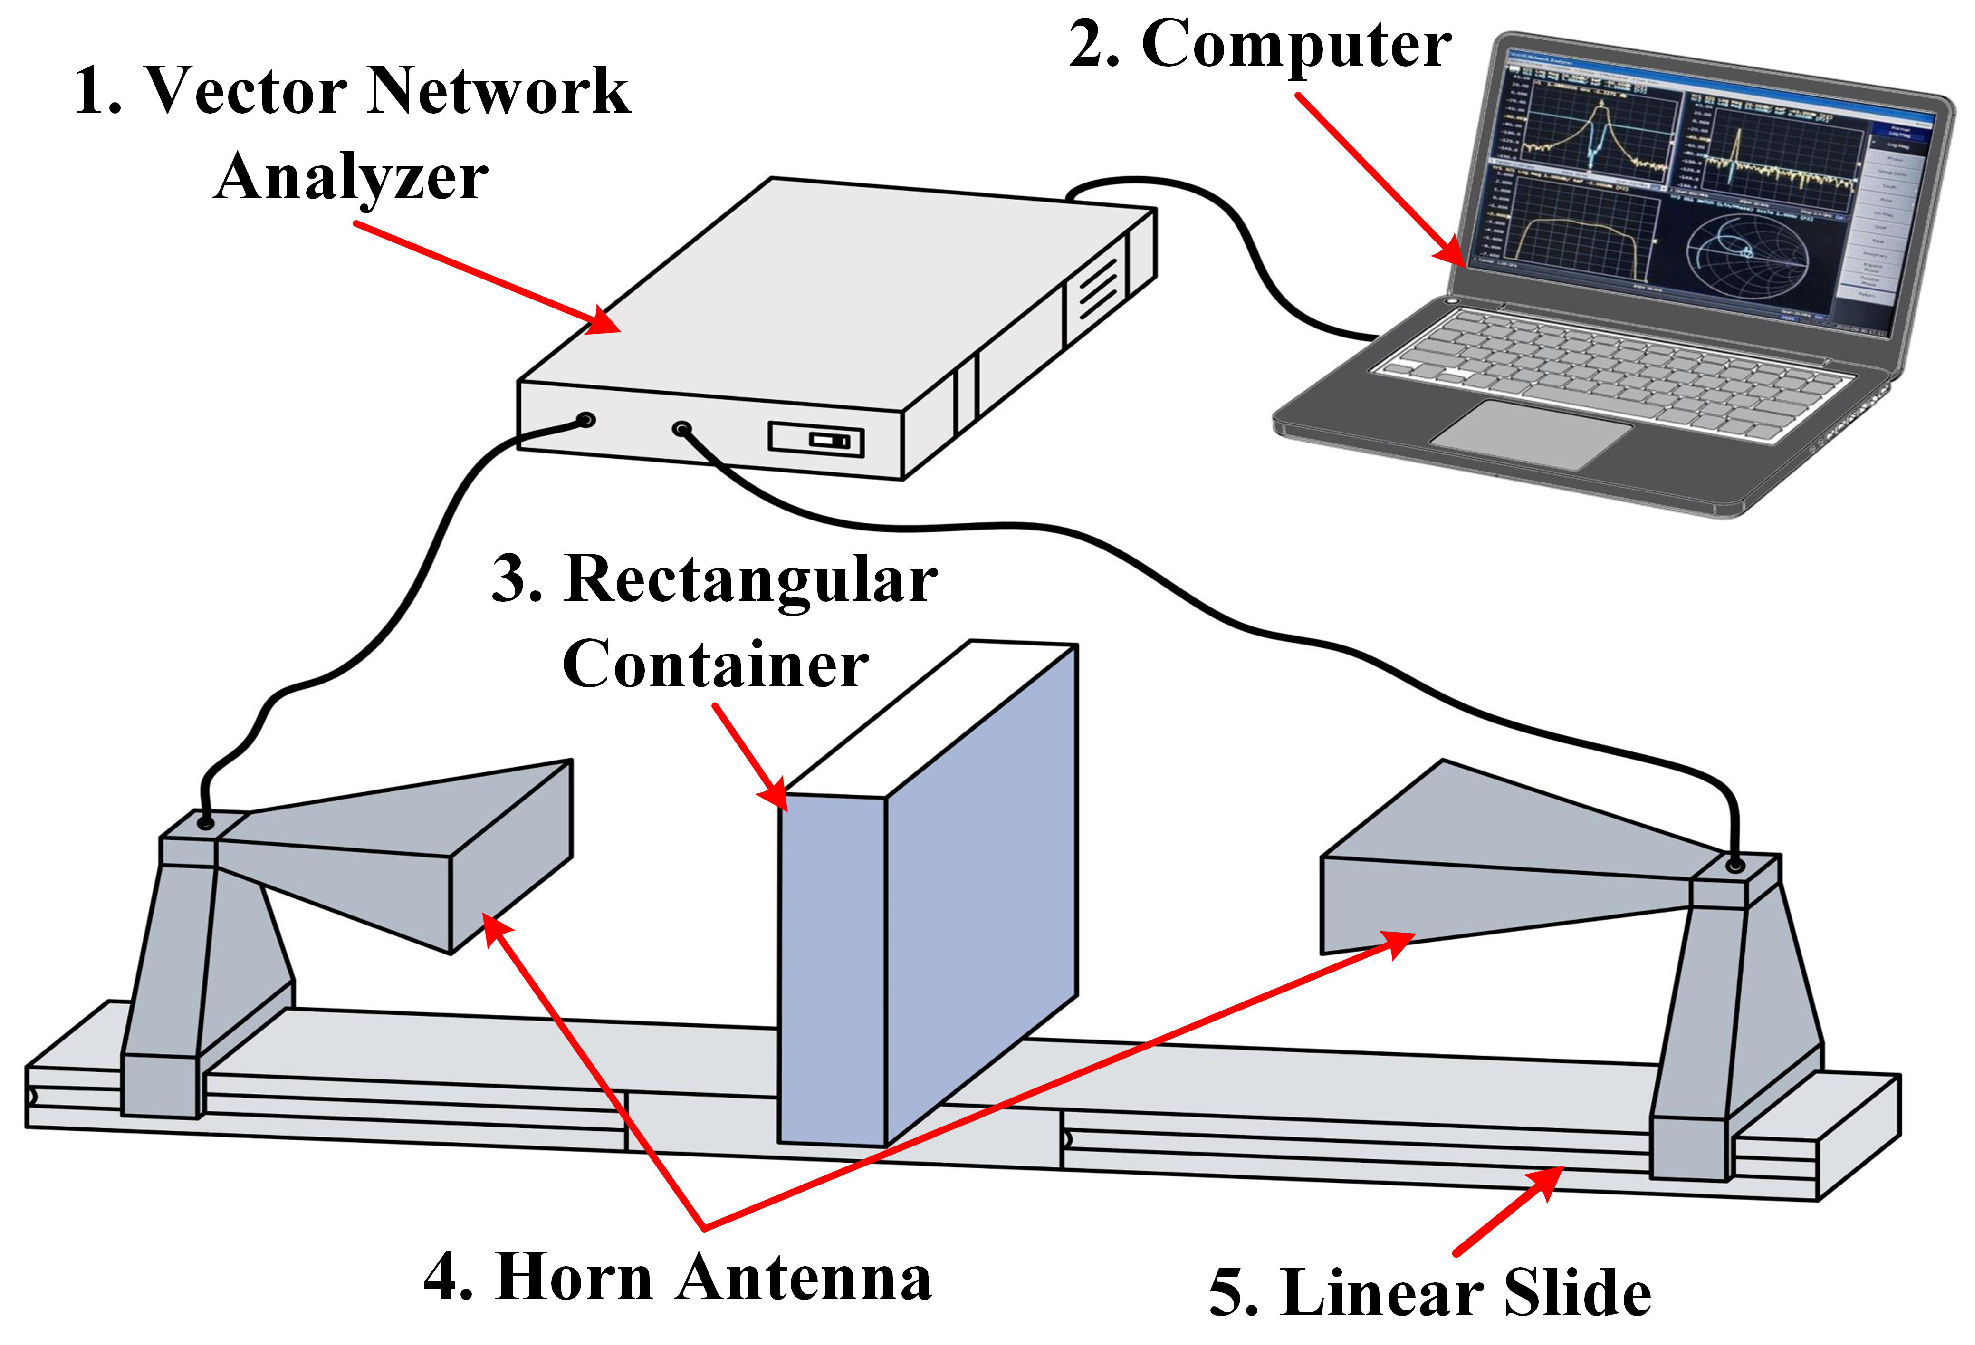
The measurement system based on the microwave free-space transmission, which was used in this study, is shown in
Figure 2. A portable Vector Network Analyzer (VNA, MS46122B-020, Anritsu, Japan) was used to generate and measure broad bandwidth microwave signals. A mechanical calibration kit (TOSLKF50A-20, Anritsu) was employed to calibrate the VNA using the short-open-load-through (SOLT) method to correct the system error. A pair of identical standard-gain horn antennas (EIA standard-WR90 waveguide type) were fixed on a linear slide rail and connected to the transmitting and receiving ports of VNA through a coaxial cable. A rectangular container (material: Polymeric Methyl Methacrylate, PMMA) with an open-top was used to hold coal. The VNA was connected to the computer through a USB-interface data transmission line, and the measurement control and further signal processing were performed by the computer.
The coal samples used throughout this experiment were manually collected commercial coals from six different regions in China, including Henan province (Region-A), Shandong province (Region-B), Shanxi province (Region-C), Inner Mongolia (Region-D), Guizhou province (Region-E) and Shaanxi province (Region-F). According to the standard for measurement of coal moisture content [
6], the commercial coal samples of each group were sieved through a 13-mm sieve to obtain the experimental coal samples. To obtain coal samples with different MCs, three steps were performed on the experimental coal samples: (1) Sample drying. The experimental coal samples were dried in a forced-air oven at 108 °C for two hours to obtain completely dry coal samples. (2) Moisture addition. An appropriate amount of water was added to the dry coal samples in order to obtain coal samples with specific moisture content. Constant stirring was required at this point to mix the coals and water evenly. (3) Static diffusion. Put the coal samples obtained in the previous step into a sealed bucket for 12 h to ensure that the water was fully diffused in the coal samples. The processes of static diffusion and subsequent microwave signal acquisition were both carried out at the normal temperature of 25 °C.
The coal samples after diffusing were taken out and packed into the rectangular container for microwave signal acquisition. During the signal acquisition, the VNA generated microwave signals containing 133 frequency points from 8.05 GHz to 12.01 GHz with a 30-MHz interval. When microwaves penetrated the coal sample successively, the microwave scattering parameters of coal were sequentially recorded. After the signal acquisition, the MC of the coal samples was measured according to the method of standard [
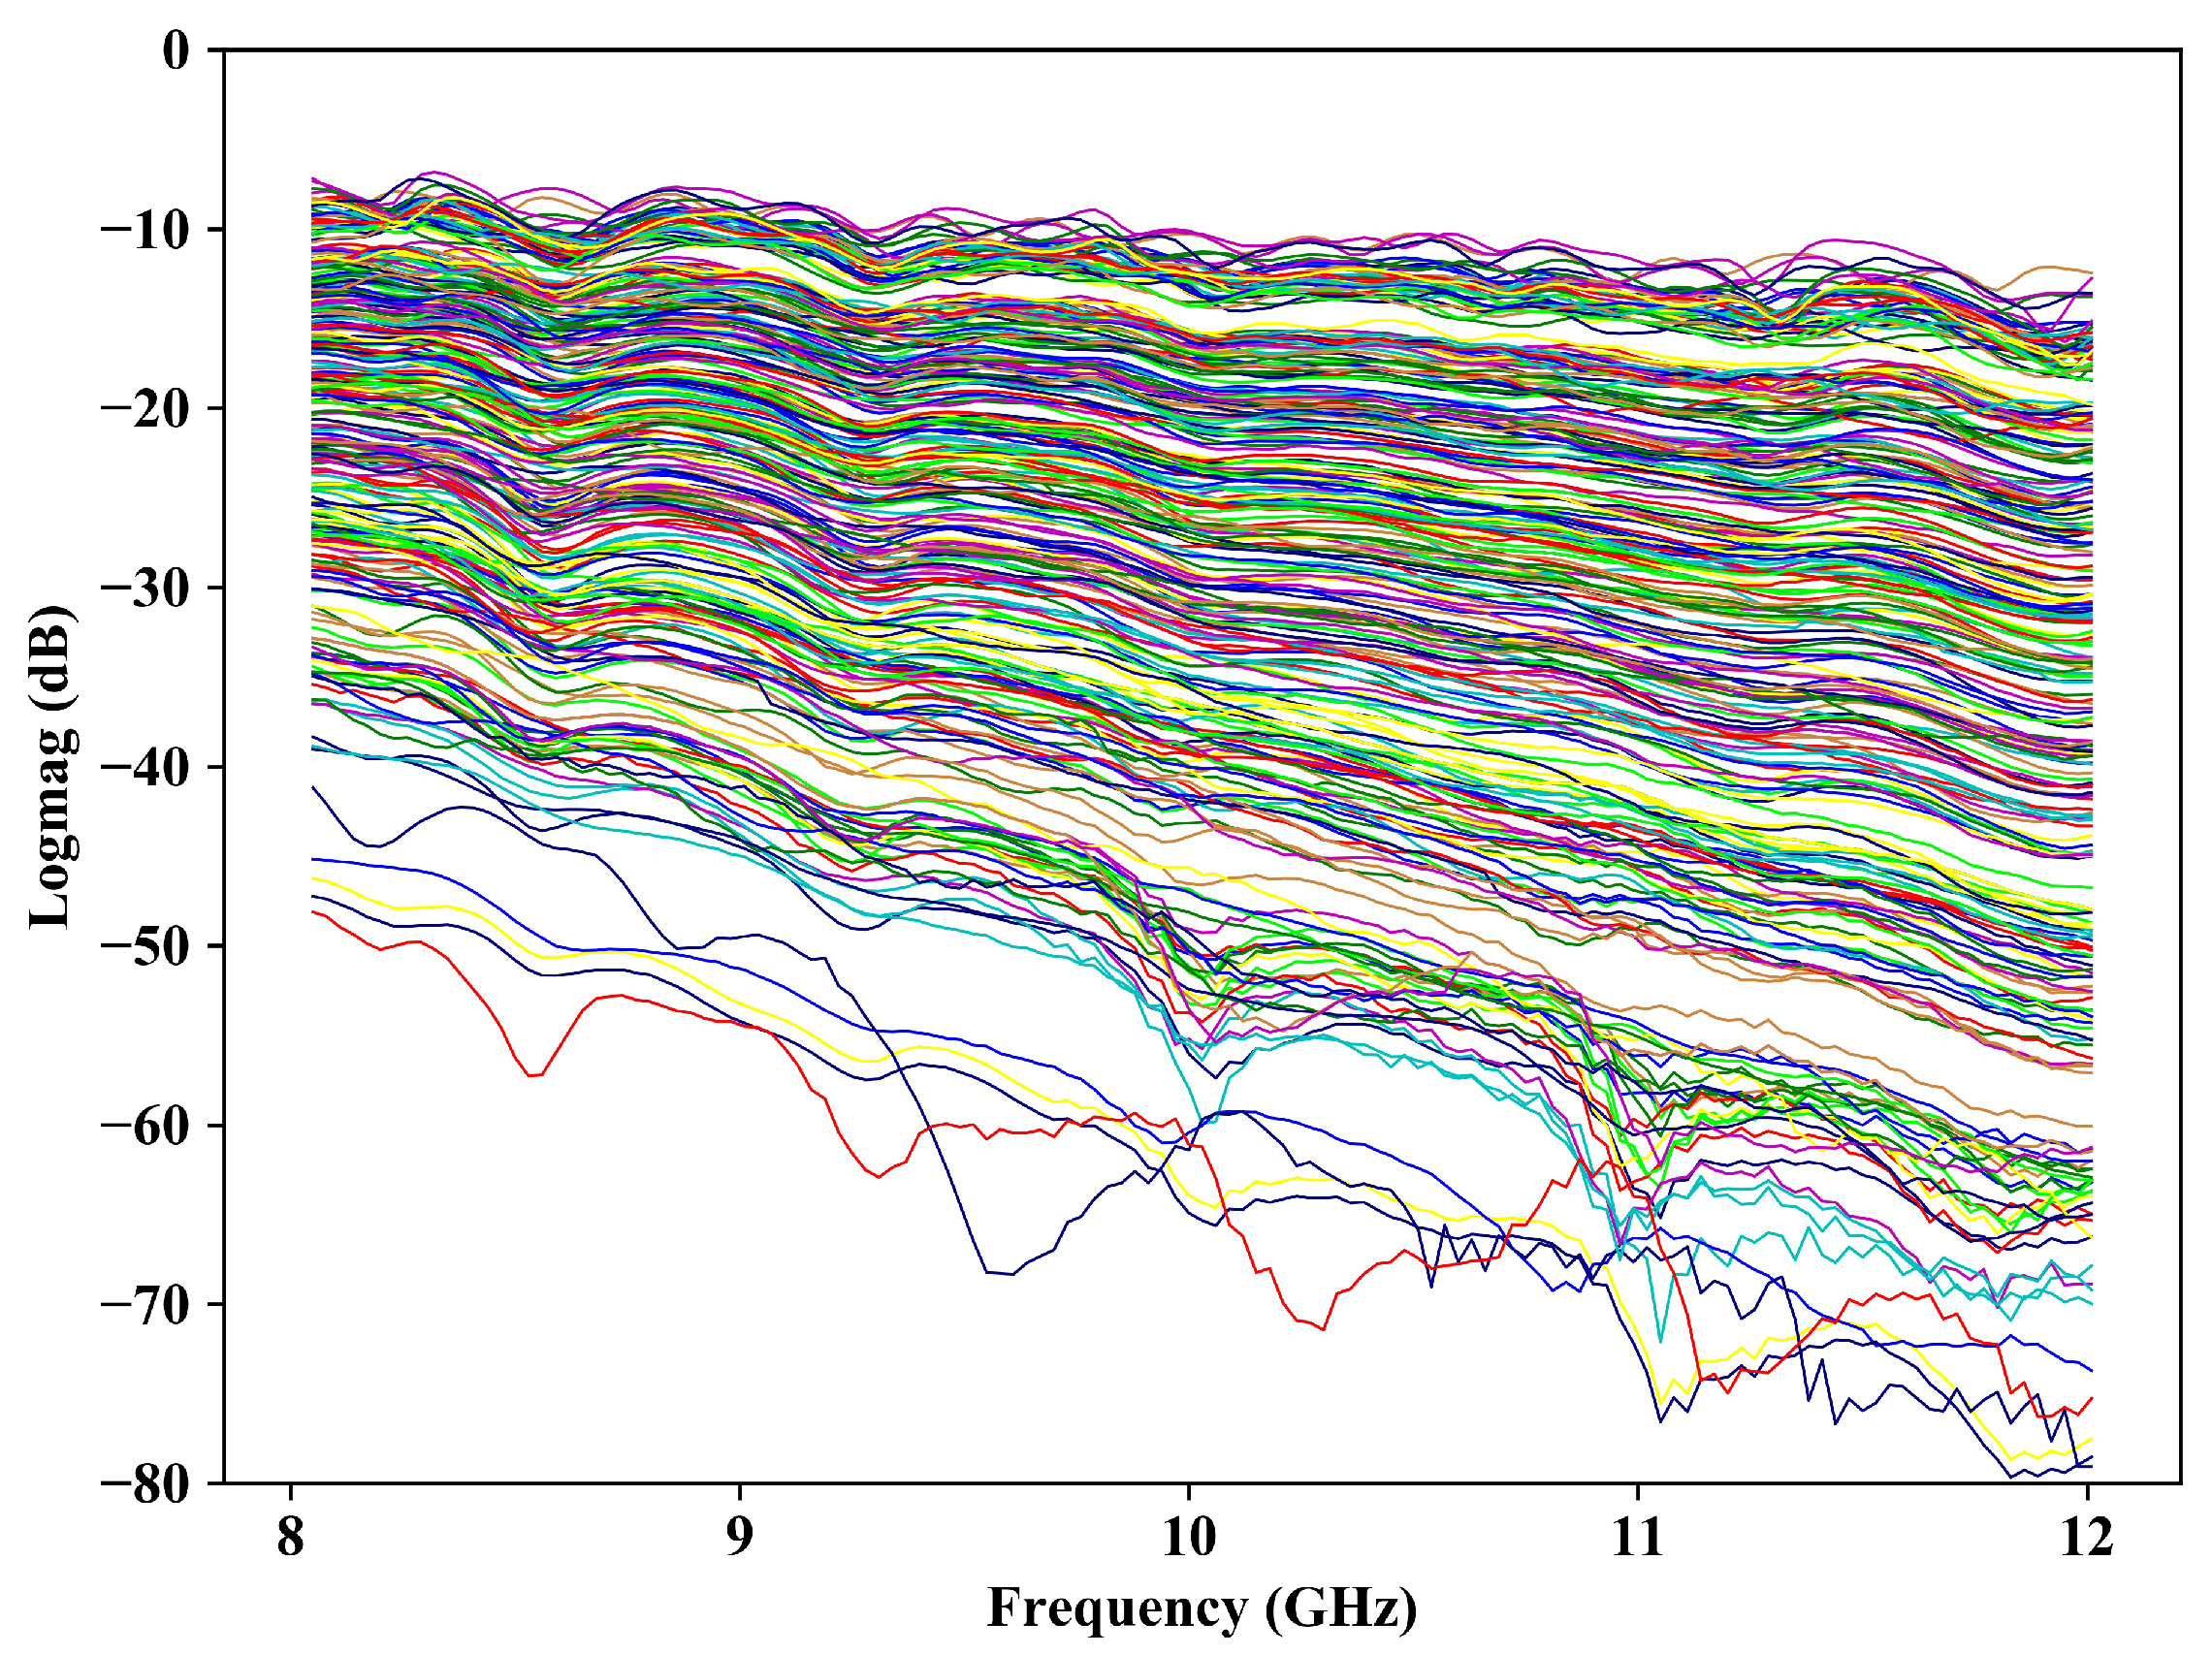
6] and used as the standard reference value. The above processes of sample preparation were repeated to obtain the sample for the next moisture level. In this experiment, a total of 294 original microwave spectrum curves were obtained, as shown in
Figure 3.
2.3. Data Analysis
In this paper, the process of data analysis combined with machine learning methods mainly includes outlier detection and elimination, data split, data modeling and model testing. The purpose of outlier detection and elimination is to improve the cleanliness of the data for accurate subsequent modeling. Data split is to randomly divide the data set into training sets and test sets according to a certain proportion. The training set is used for subsequent data modeling, while the test set is used to test the trained model to verify the effect of the model. Next, the methods used in this paper are introduced in detail.
In practical applications, experimental spectral data may contain random noise fluctuations in different frequency bands. These fluctuations can be caused by environmental changes or incorrect operation during the spectral data collection process. When the noise fluctuation exceeded a certain threshold range, the signal was considered an outlier signal. The existence of outliers could interfere with the spectral feature extraction by machine learning models, and the prediction results could be adversely affected. Therefore, it was necessary to detect and eliminate abnormal samples. To address this problem, an iterative clipping method based on Mahalanobis distance (MD-ICM) was employed.
The Mahalanobis distance (MD) indicates the similarity between a point and a cluster of points [
30]. It accounts for the distribution and correlations of the cluster data while keeping the scale-invariant features [
31]. Let
be the
ith sample in the spectral data
= [
,
,…,
]
, where
m denotes the number of samples, and
n denotes the number of frequency points. Then, the MD value between
and
is calculated by:
where
and
are the mean and the covariance matrix of the spectral data, respectively, and they are expressed as follows:
where
and
are the
vth element of
and the sample
, respectively.
The selection of distance threshold determines whether outliers can be effectively detected and eliminated. According to the Pauta criterion, outliers can be detected under the 3
threshold (i.e., three times the MD standard deviation between a sample and the mean) with a confidence probability of 99.73% if the distance between the target sample and the mean spectrum follows the Gaussian distribution [
32].
The specific steps of the MD-ICM diagnostic are as follows:
- 1.
Calculate the MD, mean, and covariance matrix of the spectral data by Equations (
7)–(
9), respectively;
- 2.
Calculate the mean and standard deviation of the MDs by Equations (
10) and (
11), respectively:
- 3.
Compare with the threshold; if , sample is considered an outlier;
- 4.
After outlier detection, repeat the above steps until no outlier is found.
There is a strong nonlinear and complex relationship between the microwave signals and coal MC. Therefore, it is difficult for traditional linear fitting methods to establish an accurate relationship model between them. In response to this problem, a coal MC analysis method based on the DW-kNN algorithm is proposed.
The
k-nearest neighbor (kNN) is a machine learning method for predicting continuous data based on sample spacing in the feature space, which has been widely used in the fields of data classification and regression analysis. This method is independent of the distribution and linearity of data, and the prediction results are limited only by the range of training samples [
33,
34]. The DW-kNN algorithm is weighted by the distance of samples based on the traditional kNN algorithm. In other words, the closer the neighbors are, the greater their distance weight is. Compared with the methods that do not consider the distance weight, the DW-kNN algorithm can overcome several misevaluated limitations and further improve the accuracy of the regression model [
35].
The calculation steps of the DW-kNN method are as follows.
First, calculate the Euclidean distance
d between the data to be predicted
and the training data by:
where
and
denote the
qth dimension data corresponding to the data to be predicted and the
pth training spectrum data sample, respectively.
Then, according to the Euclidean distance, calculate the distance weight
by:
Finally, obtain the prediction result
as the weighted average of
k nearest samples by:
where
represents the true moisture value of a training sample
.
In this study, the coefficient of determination (), the mean absolute error (MAE) and the root mean square error (RMSE) were used to evaluate the performance of the proposed method.
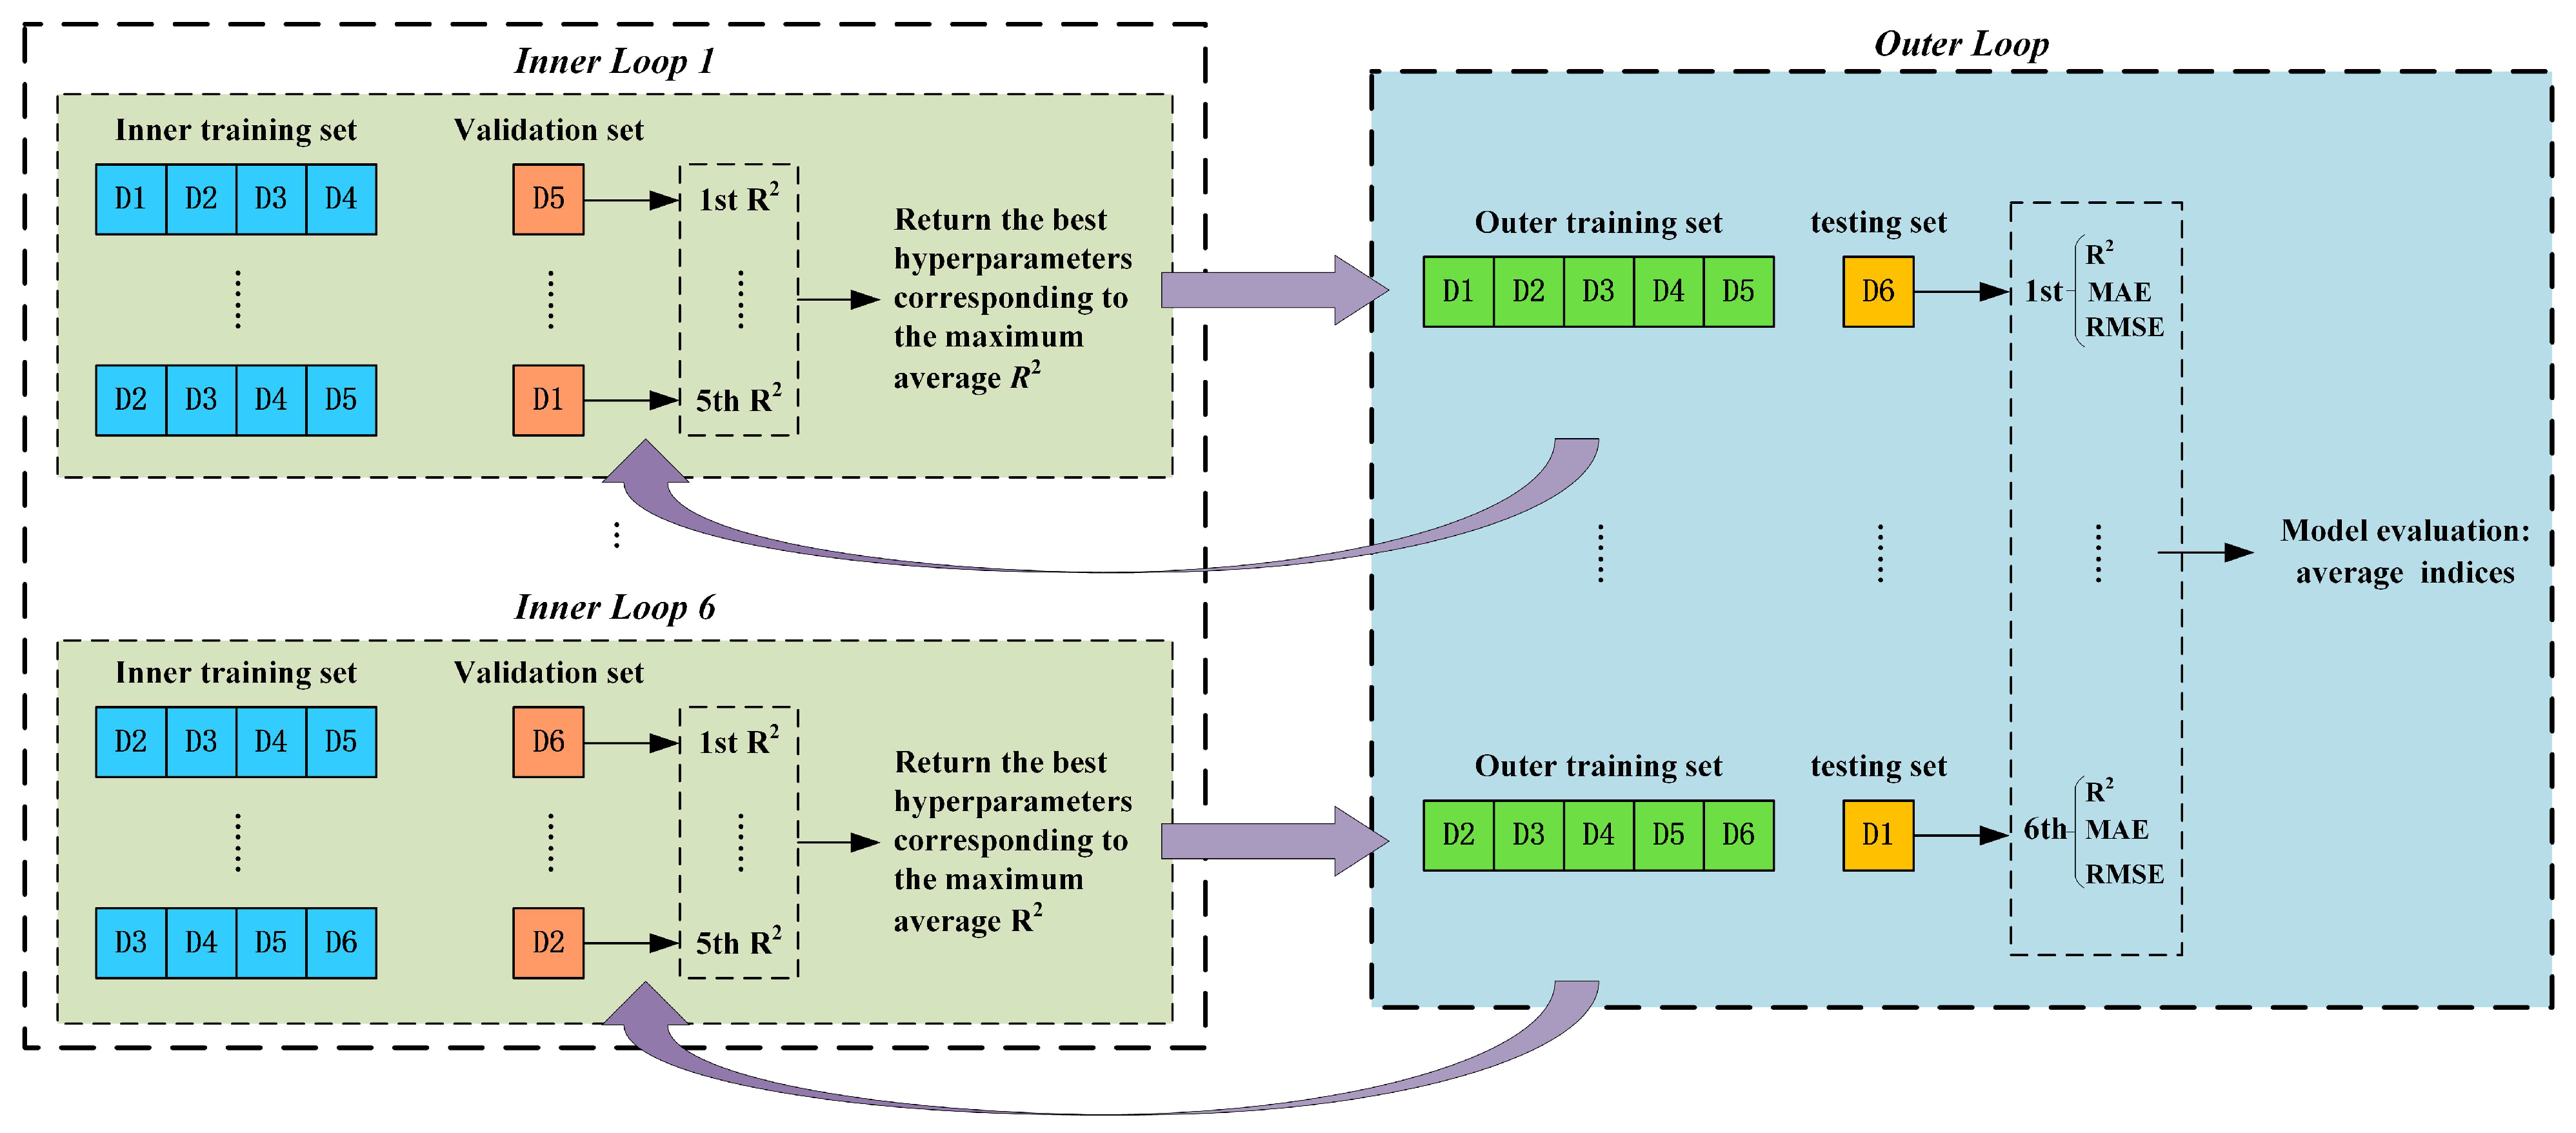
2.4. Nested Cross-Validation Method
Feature selection can affect the accuracy of machine learning models. For the DW-kNN algorithm, the nearest neighbor number
k is a fundamental factor affecting the accuracy. Under a small
k value, the DW-kNN algorithm was equivalent to the prediction with a small number of training samples, and only a small part of useful data could be captured, which could lead to the high overall complexity of the model and overfitting. On the contrary, under a larger
k value, the training samples far from the sample to be tested could also be processed by the model, leading to a wrong prediction [
36,
37]. Therefore, choosing an appropriate
k value is crucial for achieving the high prediction performance of a model.
The NCV is a well-known method for estimating the generalization ability of a model, especially when the amount of data is limited [
38]. In the field of classification and regression analysis, the NCV has been used to select data features and adjust model hyperparameters to avoid model overfitting [
39,
40]. The NCV typically includes two types of loops: an inner loop, which is used to optimize hyperparameters of a model, and an outer loop, which is used to evaluate model performances using unprecedented test data. The schematic diagram of the NCV is shown in
Figure 4.
The dataset was divided into six outer folds, each of which was retained for outer testing, while the remaining five folds were used in the inner loop as an outer training set. In the inner loop, the five folds were used as a validation set in turn, and the remaining data were used for inner training. The hyperparameters were constant in each inner cross-validation and were evaluated by the average obtained from the validation set. The hyperparameters corresponding to the best prediction effect of the model in the inner loop were selected to test the test set. After repeating the above loops, six groups of outer loop results were obtained, and the performance of the model was evaluated by the average indices.
3. Results and Discussion
3.1. Outlier Detection
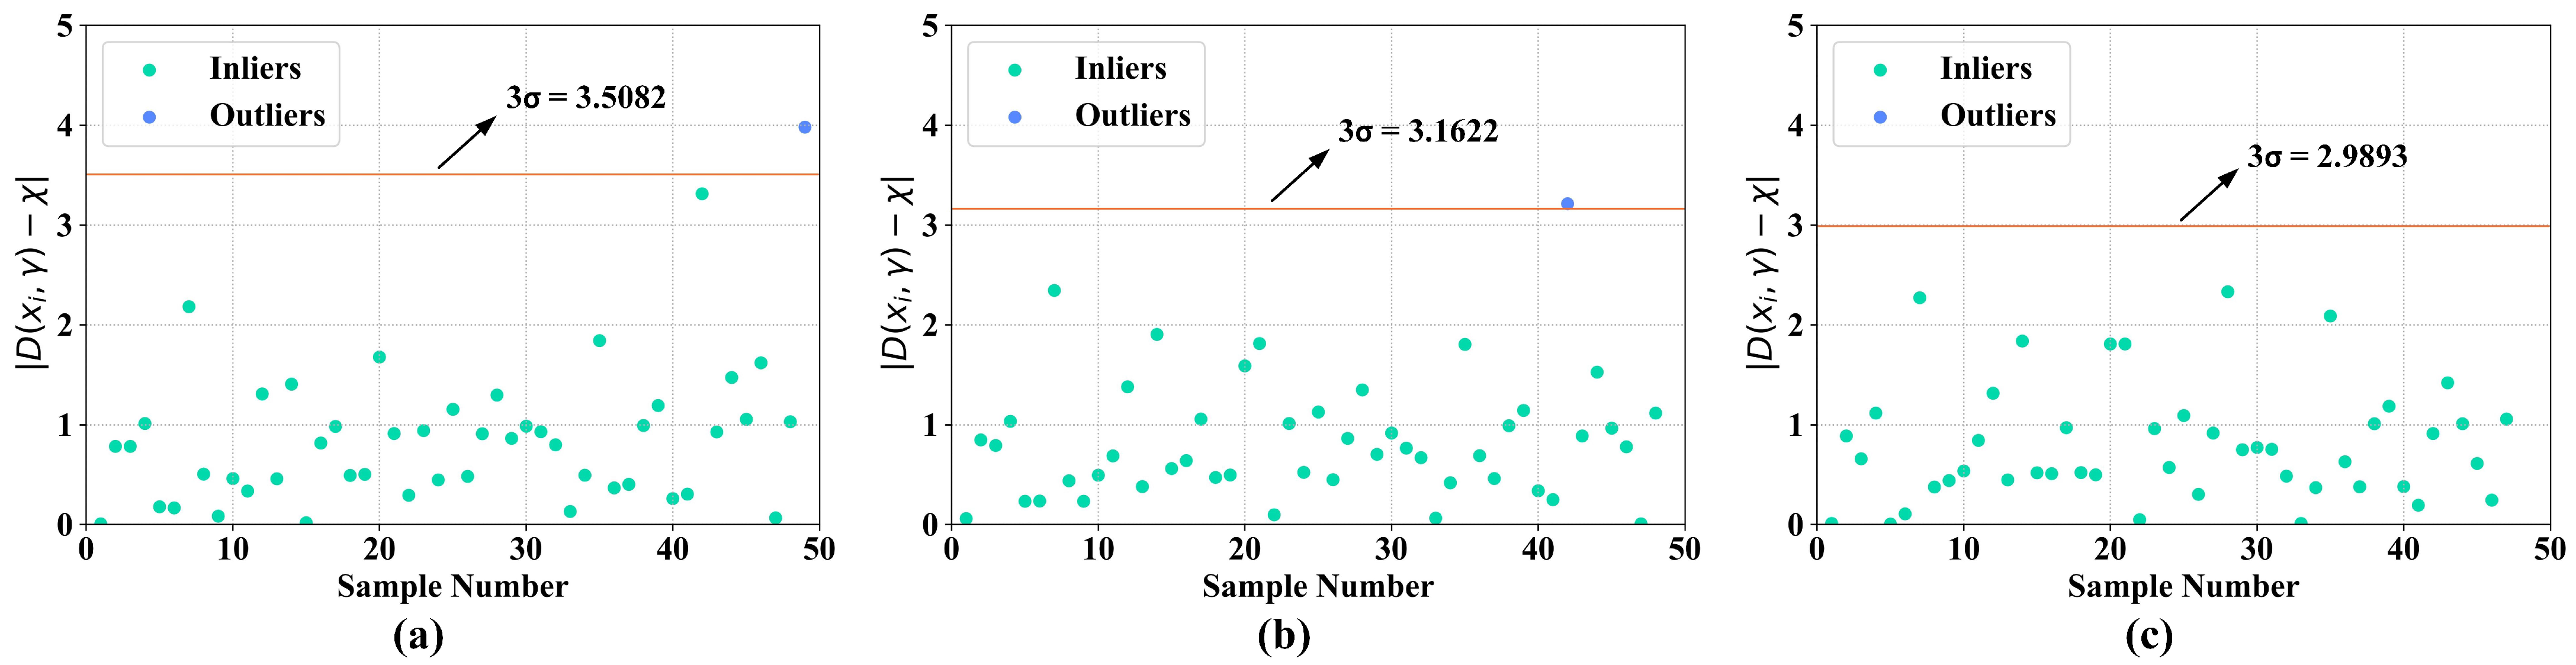
As mentioned previously, the existence of outliers can interfere with the spectral feature extraction by machine learning model and adversely affect prediction results. Therefore, the MD-ICM was used to detect and eliminate outliers. Since the number of samples in each group was less than the feature dimension, the principal component analysis (PCA) was performed to reduce the dimension before outlier detection. It should be mentioned that PCA was used only for outlier detection, and in the subsequent experiments, the model input was still the original feature dimension. The principal components representing more than 99.99% of the variance were retained to overcome the disadvantage of fewer data.
The process of outlier detection is shown in
Figure 5. In the first iteration, one sample with a distance longer than 3
was detected and eliminated, as shown in
Figure 5a. Then, the 3
value was recalculated, and in the second iteration, another outlier sample was detected and eliminated, as shown in
Figure 5b. In the third iteration, no outliers were detected, and the iteration ended, as shown in
Figure 5c. Hence, a total of two outliers were detected and eliminated from this dataset. The same process of outlier sample elimination was used for the remaining data, and the obtained results are listed in
Table 2. Finally, a total of 13 outliers were eliminated from 294 data samples of the six datasets. After the outlier elimination, the six datasets were mixed into one dataset containing 281 data samples to facilitate the application of the NCV method in the subsequent analysis.
Table 3 shows the comparison of experimental results before and after data preprocessing. The measurement effect corresponding to the combination of DW-kNN for regression and MD-ICM for outlier detection is better than that without data preprocessing. This shows that the individual inferior spectral data caused by inevitable factors could interfere with the spectral feature extraction by machine learning models. These problems will seriously affect the prediction results. Through the detection and elimination of outliers based on the MD-ICM, inferior spectral data can be avoided, and the accuracy of the prediction results of coal MC can be effectively improved.
3.2. Comparison with Different Methods
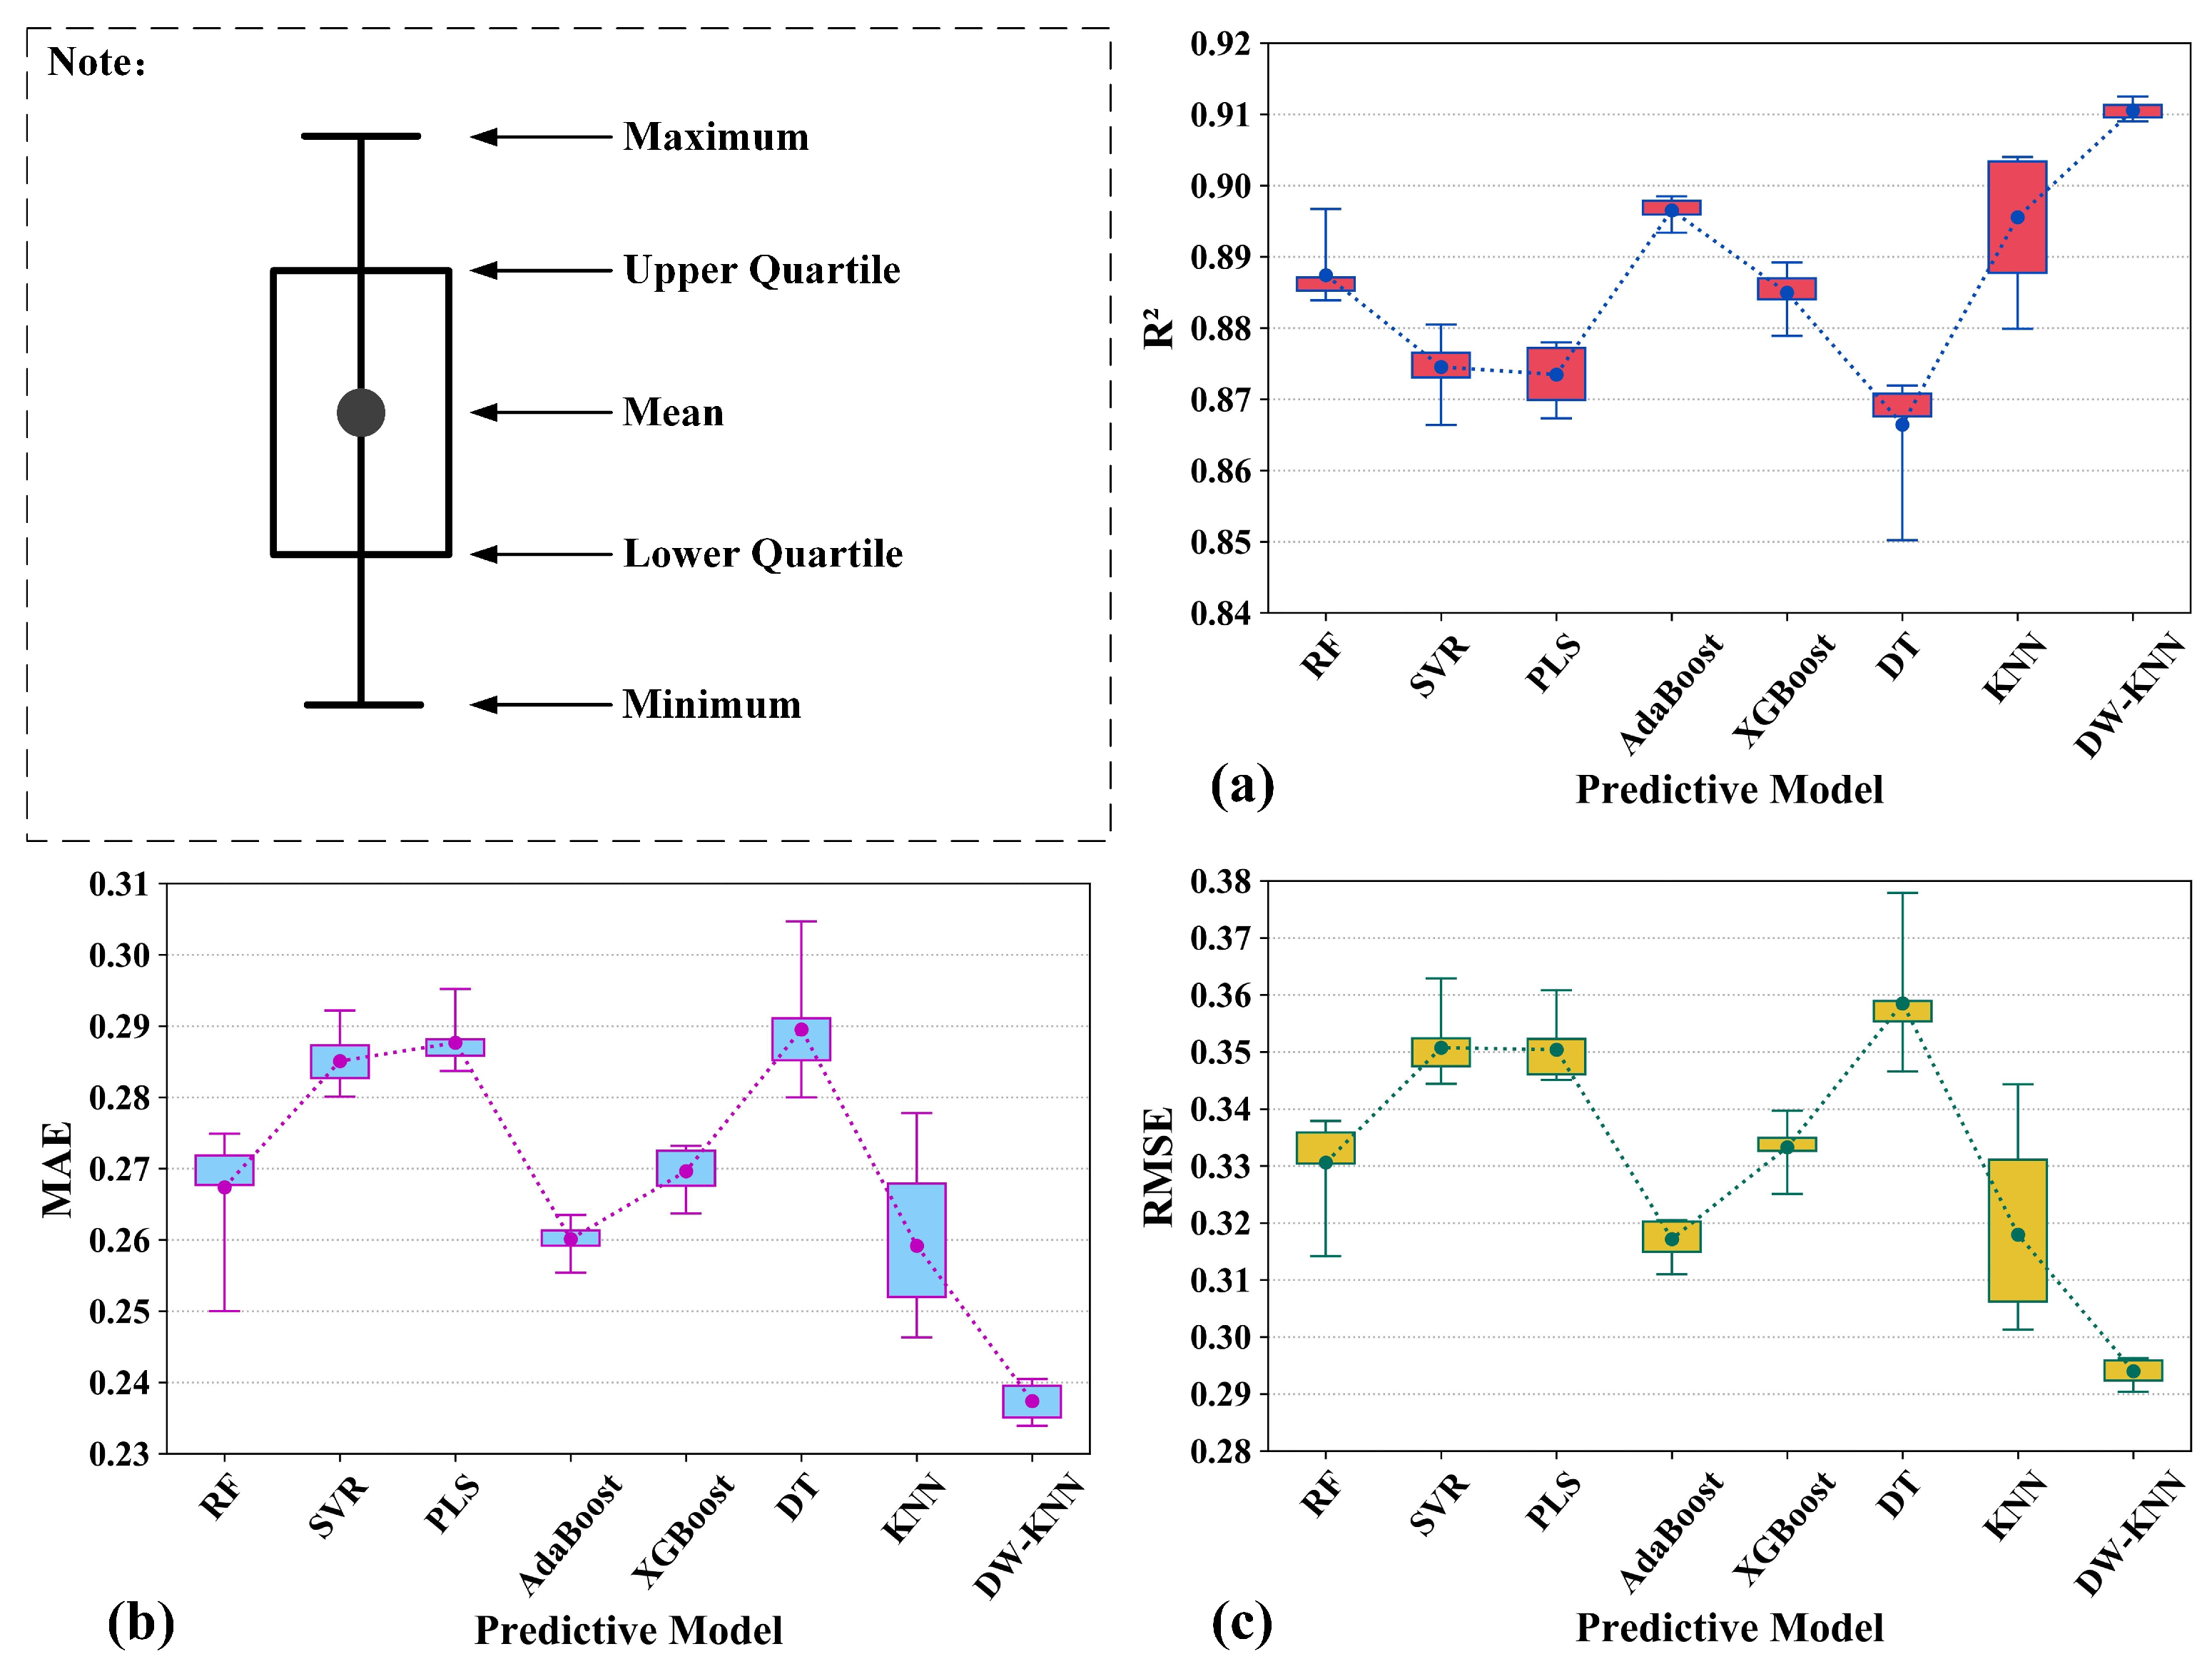
To verify the effectiveness of the proposed method in predicting the coal MC further, comparative experiments were carried out using typical machine learning regression models, including random forest (RF), support vector regression (SVR), partial least squares (PLS), AdaBoost, XGBoost, decision tree (DT), and kNN. In all experiments, the NCV method was used to adjust the parameters of the models. To avoid accidental errors, each experiment was repeated six times, and the average results were used to evaluate the performances of the models, as shown in
Table 4.
As shown in
Table 4, the overall average prediction result of the DW-kNN model was the best among all the models; it achieved
of 0.9106, MAE of 0.2374, and RMSE of 0.2940; still, the
values of the other models were all less than 0.9. The repeated experimental results of different models are presented in
Figure 6, where it can be seen that the results of all comparison models were acceptable except for the DT model, which had a slightly worse performance than the other models—both single-sample results and average results were poor. When the sample MC is high, the electromagnetic waves react violently with moisture and thus show natural fluctuations in high frequency bands. These fluctuations will lead to the generation of unstable decision trees in the process of model training, which will seriously affect the robustness of the model. The results obtained by AdaBoost and kNN models are second only to those obtained by DW-kNN models. This shows that the microwave signals corresponding to similar coal MCs are highly correlated. Proper weight distribution can overcome the influence of fluctuation and improve the measurement effect. Moreover, the box size and the extreme value difference obtained by the DW-kNN model were small, which indicated that this model had good stability. This result further demonstrates that the DW-kNN model can achieve good results in coal MC prediction.
3.3. MC Measurement of Coals from Different Regions
In the above-presented experiments, the sample data were mixed and then randomly divided into the test and training sets. Thus, the two datasets contained coal samples from the same region, so it was impossible to determine whether the coal origin had an impact on the model detection effect. Therefore, additional experiments based on the coal origin were carried out to test the model’s predictive effect on the MC of coal samples from unknown areas further.
These experiments also used the NCV method, but the difference was that the samples in the test dataset were from different regions compared to the training dataset. The prediction effects of the models were also evaluated by the average results of the NCV method. The test results of different models are given in
Table 5, where it could be seen that the results of the same model varied greatly when the MC of coals from different regions was predicted. The maximum difference obtained by RF model was less than that of DT model, which indicated that the performance effect of integrated learning was better than that of single learning. The difference in
value was the largest for the kNN model, and it was 0.1094. However, the smallest difference in
value was achieved by the DW-kNN model, and it was 0.0533, which is significantly smaller than that of the kNN model. This shows that adding weight factors plays an important role in processing nonlinear locally correlated data.
In addition, regarding the average result, the prediction effect of the DW-kNN model was the best among all the models; its , MAE, and RMSE were 0.9088, 0.2417, and 0.2993, respectively. Moreover, for coals from different regions, the values obtained using the DW-kNN model were all above 0.875. Consequently, the coal origin can affect the MC detection performance, but the DW-kNN model can accurately extract features related to the coal MC and can reduce this influence.
3.4. Performance of Different Frequency Bands
To explore the influence of widths and types of frequency band on the measurement of coal MC, comparative experiments based on multiple frequency bands combined with the aforementioned machine learning algorithms were also carried out. As mentioned in
Section 2.2, each original microwave spectrum curve contained 133 frequency points in the range of 8.05 GHz–12.01 GHz. Therefore, 133 frequency points were divided into seven narrow bandwidth signal bands that were independent of each other, and each band contained 19 frequency points for testing the correlation with the coal MC. Each band was analyzed using the six-fold NCV method, and the results are shown in
Table 6.
As shown in
Table 6, although the machine learning algorithms used were different, the broad bandwidth microwave signals can significantly improve the accuracy of coal MC measurement compared to the narrow bandwidth signals. From the analysis results based on the DW-kNN algorithm, it can be seen that the
values obtained using the narrow bandwidth signals were all lower than 0.9; the best
result was 0.8985, and it was achieved for the signal band of 10.9 GHz–11.44 GHz, but it was still less than the best result of 0.9106 obtained using the broad bandwidth microwave signals. This indicates that appropriately increasing the number of frequency points can not only provide more features related to the coal MC but can also improve the accuracy of regression analysis. Similarly, the MAE and RMSE values obtained using the broad bandwidth microwave signals were better than those of the narrow bandwidth signals, which showed that using broader bandwidth microwave signals to predict the coal MC had smaller errors, and the prediction results were closer to the actual values. Thus, using broader bandwidth microwave signals to predict coal MC can ensure greater advantages.
3.5. Further Evaluation on Additional Data
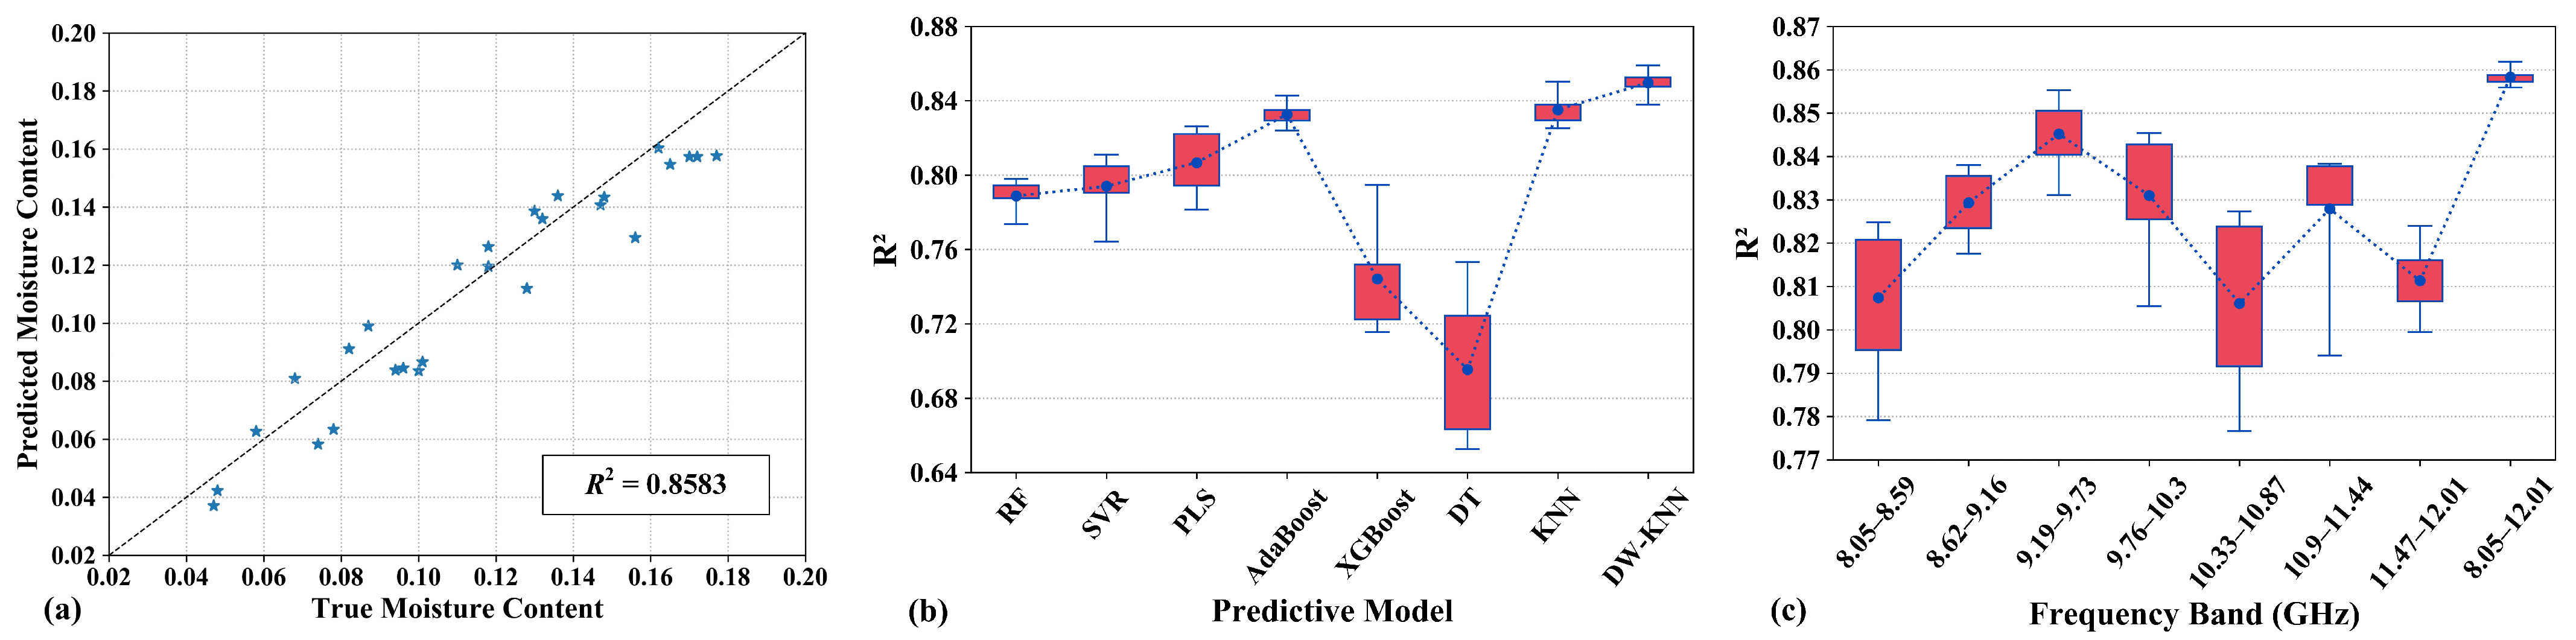
To better verify the effectiveness of the proposed measurement method of coal MC, on-site testing was carried out using the designed measurement system. The coal samples (validation samples) collected from the site were sieved through a 13-mm sieve and then packed into the rectangular container for microwave signal collections. The true MCs of the validation samples were obtained by standard laboratory methods [
6]. A total of 27 verification experiments were carried out, and the corresponding 27 groups of coal validation samples were independent of the previous 281 normal data. The scatter results of the true and the predicted MCs are shown in
Figure 7a. The
, MAE, and RMSE values of the verification experiments are 0.8583, 0.2903, and 0.3541, respectively. Verification experiments based on different methods and based on different frequency bands were also carried out on the verification samples, and the results are shown in
Figure 7b,c, respectively. It should be noted that the same calculation process was repeated 6 times to reduce accidental errors. Although the results of the validation experiment were reduced compared with those of the laboratory, the DW-kNN method still achieved the best results, indicating that the proposed method can effectively measure the MC of coal.
3.6. Discussion
The research results of this paper can provide technical guidance for coal washing and processing industries to reduce labor costs and realize efficient automation of coal production and transportation. First, it could be seen that the designed coal moisture content measurement system is able to be applied on the experimental site basically through the verification experiment in
Section 3.5. Moreover, the measurement process is carried out in an open-air environment, and the horn antenna is resistant to environmental pollution. These advantages provide a reference for online measurement and control in the production processes, such as the measurement of coal moisture content during belt transport.
4. Conclusions
In this paper, a rapid and non-destructive measurement system for coal MC is designed, and the verification experiments are carried out in the routine range of MC by combining with machine learning techniques. The designed measurement system can efficiently generate and measure broader continuous-frequency microwave signals and visualize the spectra. To improve the cleanliness of modeling spectrum data, an iterative clipping method based on Mahalanobis distance (MD-ICM) is used to detect and eliminate outliers. Comparative evaluation of typical machine learning regression models is performed. The results show that proper weight distribution is able to effectively overcome the influence of microwave oscillation in high frequency band. Moreover, the DW-kNN algorithm can process imbalanced data well and show higher generalization performance in MC determination of coal samples from unknown regions. Based on multiple microwave frequency bands, different regression models are evaluated. The comparison results show that the proposed method based on the DW-kNN algorithm using broader bandwidth microwave signals for coal MC measurement performs best, achieving an of 0.9106, MAE of 0.2374 and RMSE of 0.2940. Finally, on-site testing was carried out using the designed measurement system, which proves its availability and reliability.
Although the proposed method has not been widely applied in real applications, the measurement accuracy demonstrates that it is of great potential in on-line measurement and control of coal MC. It can provide technical guidance for the development of rapid and non-destructive determination devices of coal MC in the coal washing and processing industries.


