1. Introduction
With the advances in human scientific cognition and information technology, network science has become a hot topic in academia. As the primary research object of network science, complex networks are gradually emerging in the eyes of scholars [
1]. A complex network refers to a network with some or all of the properties of self-organization, self-similarity, attractor, small world, and scale-free. Complex networks can model all aspects of real-life human society, and through the study of these networks abstracted from reality, people can explore the laws of the real world. Therefore, analysis of complex networks and their applications is a crucial issue.
Many research papers on complex networks have been published [
2,
3,
4,
5]. Early research covered the traditional statistical properties of networks (e.g., the two papers that laid the foundation of complex networks—scale-free networks [
6] and small-world networks [
7]). Later works described the structural properties of networks (e.g., the exploration of “community phenomena” [
8] and “network modalities” [
9]). Even later, papers addressed the deeper study of points and lines. The examination of complex networks has undergone tremendous evolution, and the study of the importance of the nodes or edges of complex networks is one of the most important topics.
Nodes and edges are the basic elements of network structure. Studying important nodes or edges helps us protect the system better, but also helps us understand the system better. For example, a disease transmission network can search for known infected people. Then, susceptible people can be searched, treated, and isolated, in order to prevent further spread of the virus. For another example, Fan et al. collected 20 years of trade data from 232 countries and regions around the world, and then constructed a trade network. In this network, a novel node importance ranking and analysis method was proposed by comprehensively considering factors such as generalized degree, DHC theorem and weight [
10]. This method helps the formulation of trade policies in countries around the world, and deepens our understanding of the history of world trade. Xu et al. also pointed out that for traditional information retrieval evaluation metrics based on citation network structure, it is difficult to accurately assess the impact of a particular piece of literature. They experimentally argued that the adapted PageRank and LeaderRank methods are still the most accurate evaluation criteria available [
11].
As an interdisciplinary subject, there are examples of applying various computer technologies to the research of complex networks. For example, Liu et al. proposed an artificial neural network-based model for information dissemination and opinion evolution, IPNN (Information propagation and public opinion evolution model based on artificial neural network, IPNN) [
12]. Fan et al. proposed a reinforcement learning-based algorithm for node importance identification in complex networks, FINDER. It first learns the exhaustive method in a simulated BA network, continues training the previously trained model in the real network, and evaluates the performance of the model based on the order of node removal [
13]. In addition, many excellent improvements to the traditional node importance recognition algorithm have also been proposed. For example, Fan et al. proposed a new node importance ranking metric, the circle ratio, beginning from a circular structure in the network [
14]. Traditional methods judge the importance of a node by the contributions of neighboring nodes. However, the circle ratio judges the importance of the current node by the amount of information it brings to its neighbors, which inspires a new research idea [
14]. Lu and Liao et al. summarized and sorted out the current node importance identification and ranking methods in various existing networks [
15,
16].
As we can see, most of the current research on nodes focuses on the mining and discovery of important nodes in a network, but little research exists on the mining of relatively important nodes. The idea of relative node importance considers questions like “which node in a network is the most important relative to a specific node or a specific group of nodes?” Compared with other research fields, the relative or local importance of nodes also has practical implications, especially when the scale of the network grows larger. Some research results on relative node importance mining are available today, but these methods still need improvement. Areas of improvement include whether the time complexity and space complexity can be further reduced, how to further improve the accuracy of exiting method, which kind of method performs the best on a specific type of network, and the parameter selection and optimization method, etc.
In this paper, we consider the connection role of important edges in an unweighted network, where the edge importance represents the degree of association between two nodes. The connections between important nodes should be closer, thus we propose a metric to measure edge closeness for important nodes in an unweighted network. It is based on the idea of “the node with the largest edge closeness to a known important node is likely to be an important node” for which an edge importance greedy strategy (EG) is proposed to mine relatively important nodes. Through the comparison experiments with the NN [
17] and the RD [
18], which originated from protein networks, and the Katz [
19], which is based on random wandering, it can be proved that the EG strategy achieves ideal experimental results and shows its application value in identifying the importance level of unprivileged network nodes.
2. Greedy Strategy Based on Edge Importance
The EG algorithm uses greedy strategy that requires an importance measure for the edges in a network before each use. It works by adding known important nodes to a set
that includes all their neighbors, after which one can assign an importance score to the connected edges of the known important nodes based on the topological information of the network. The importance score can be calculated as follows:
where
is an important component called
value, which measures the importance of a certain node
is the degree of known important node
;
is the degree of known important neighbor node
;
is the shortest distance between node
and the set of known important nodes; and
is the number of common neighbors of node
and known important nodes.
The core idea of Equation (1) is actually very straightforward: the larger the is, the greater the importance of node . On the other hand, since is the shortest distance between node and the set of known important nodes, the larger the is, the smaller the value of . A small or a large results in a smaller , and thus a lower importance score for node . In other words, nodes with low degree and large distance from known important nodes tend to have lower importance, and vice versa.
In particular, there will be cases where two nodes have the same value. In order to solve this problem, a bias value is added to Equation (1) to distinguish their importance.
Once the importance score is obtained, the greedy strategy is used to find the node whose edge has the largest score from an edge set that corresponds to known important nodes. The found node will then be added to set . The edge scores corresponding to each node in set will be again calculated, and the node will be found by using the same strategy stated previously. This process is repeated until all nodes are added. The order in which nodes are added to set is exactly the order of their importance.
The pseudo-code for the EG algorithm, also known as Algorithm 1, is as follows:
| Algorithm 1: EG Algorithm |
|
| Input Network , the set of known important nodes ; |
| Initialization ; ; |
| 1. | While the number of elements in is less than do: |
| 2. | for do: |
| 3. | for neighbors do: |
| 4. | ; |
| 5. |
end for |
| 6. | ; |
| 7. | Place the node into set; |
| 8. |
end for |
| 9. | end while |
| 10. | return |
|
The EG algorithm is divided into three parts, which are as follows: computation of the shortest path of a single source; computation of the node importance score; and selection of the greedy policy. The EG algorithm chooses to compute the neighboring nodes of known important nodes. Lines 1–2 of the algorithm are the traversal of the set , and the nodes in it are computed and analyzed. Lines 3–5 of the algorithm calculate the node importance score by first selecting a node from among the set of known important nodes, then traversing its neighbor nodes and calculating the importance score of each neighboring node. Lines 6–8 of the algorithm apply a greedy strategy to select nodes, and the node with the highest is added to set . The above process is repeated until all nodes are added to set .
It can be found that the time complexity of the EG algorithm depends mainly on the calculation of the shortest path of a single source and the importance score. It is easy to see that the calculation of the node importance score is a cumulative process, and depends on the degree of the important nodes. When there is only one element in the set of important nodes, its time complexity is , and is the average degree of the network; when there are two elements, its time complexity is 2, and so on. The time complexity of this part can be written as , which equals to .
One can also notice that the previously calculated node importance scores are fully reusable when new nodes are added to the set of important nodes. In this case, each time an important node is added, only the neighboring node scores of the newly added node need to be calculated. Based on above analysis, one can conclude that the time complexity actually depends on the number and average degree of nodes in the network, thus the overall time complexity would be .
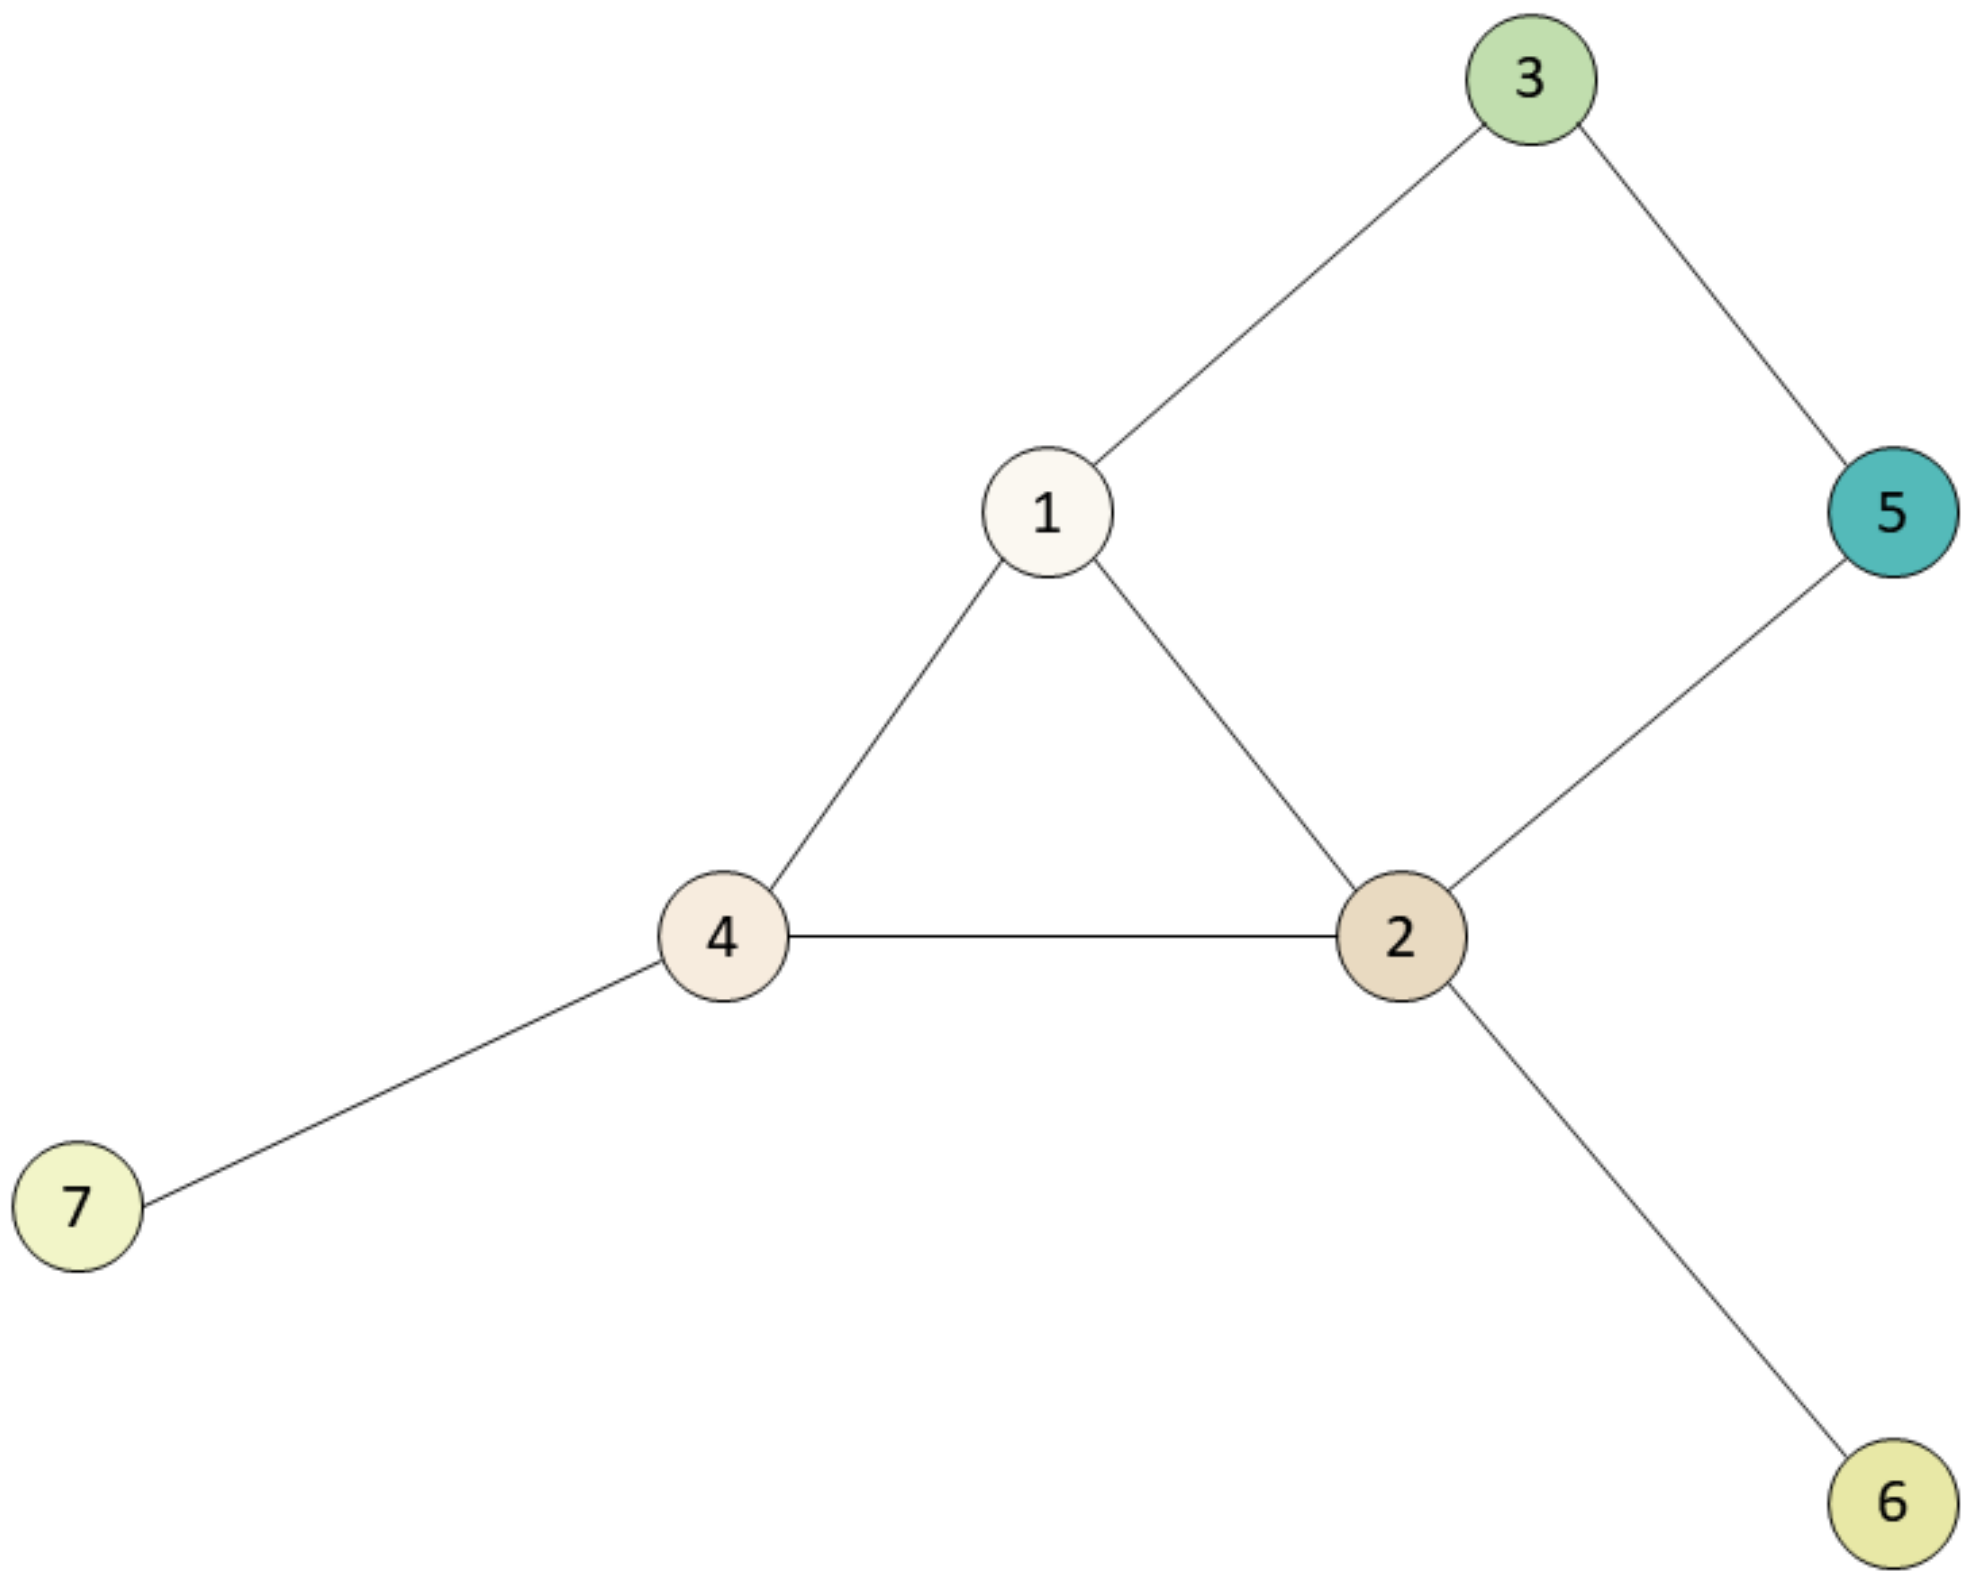
The following section will use the network shown in
Figure 1 to illustrate the computation process of the edge greedy strategy.
Step 1, number the nodes in
Figure 1 sequentially are 1, 2, 3, 4, 5, 6 and 7. Let node 1 be a known important node, and add node 1 to set
. Calculate the edge scores first according to the known important node. The edge scores here are (1,2):2.33, (1,3):1.65 and (1,4):2.0. Node 2, which corresponds to edge (1,2), has the largest value of 2.33, and it is added to set
.
Step 2, calculate the edge importance score for nodes 1 and 2 in set , and one obtains (1,3):1.65, (2,4):1.75, (2,5):1.125, and (2,6):1.0625. Node 4, which corresponds to edge (2,4), has the largest value and is added to set .
Step 3, calculate the edge importance score for nodes 1, 2 and 4 in set , and one obtains (1,3):1.65, (2,5):1.125, (2,6):1.0625 and (4,7):1.083. Node 3 has the largest value and is added to set .
Step 4, calculate the edge importance score for nodes 1, 2, 4 and 3 in set and obtain (2,5):1.125, (2,6):1.0625 and (4,7):1.083. Node 5 is selected and added to set .
Step 5, calculate the edge importance score for nodes 1, 2, 4, 3 and 5 in set and obtain (2,6):1.0625 and (4,7):1.083, and node 7 is added to set .
Step 6, calculate the edge importance score for nodes 1, 2, 4, 3, 5 and 7 in set . The edge importance score is (2,6):1.0625 and node 6 is added to set .
At this point, all nodes are added and the loop ends. For node 1, the order of relatively important nodes possibilities would be 2, 4, 3, 5, 7 and 6.
3. Experiment
The experiments in this paper use four real network data sets.
- (1)
The 9/11 criminal relationship network [
20]. The nodes represent the terrorists who hijacked the planes and those who had contact with them; the edges represent the interpersonal relationships between them; and the set of important nodes represents the group of terrorists who hijacked the planes on 9/11.
- (2)
SARS international aviation network [
21]. Each node represents a country; the edge represents the existence of routes between two countries; and the earliest group of countries with the SARS virus is the set of important nodes.
- (3)
Mouse protein interaction network [
22]. The nodes represent mouse proteins; edges represent the existence of interactions between proteins; and the group of mouse protein kinases is the set of the important nodes.
- (4)
Human protein interaction network [
22]. The nodes represent human proteins; edges represent the existence of interactions between proteins; and the group of human protein kinases is the set of the important nodes.
The topological information of these network data sets is listed in the following
Table 1.
The table header indicates the topological attributes of a network. is the number of nodes in the network; is the number of important node sets; is the number of edges; and and are the average degree and clustering coefficient of the entire network, respectively.
In this paper, we use
(Area Under Curve) to evaluate the overall results of this algorithm for mining relatively important nodes. The
is calculated as follows.
where
represents the number of times that the importance score of a node selected from the unknown important node set equals that of a node selected from the unimportant node set;
represents the number of times that the importance score of a node selected from the unknown important node set is larger than that of a node selected from the unimportant node set.
represents the number of comparisons, which is the product of the size of the unknown important node set and the size of the unimportant node set.
In this paper, we conduct nine rounds of experiments for each network, and the ratios (p) of known important nodes for each round are set to 10%, 20%, 30%, 40%, 50%, 60%, 70%, 80% and 90%. Each round uses a different algorithm to calculate the relative importance of the nodes, according to which these nodes are ranked. Twenty independent experiments are conducted, and the values are calculated for the ranking results.
This paper uses NN [
17], RD [
18] and Katz [
19] for comparison, and the results are as follows.
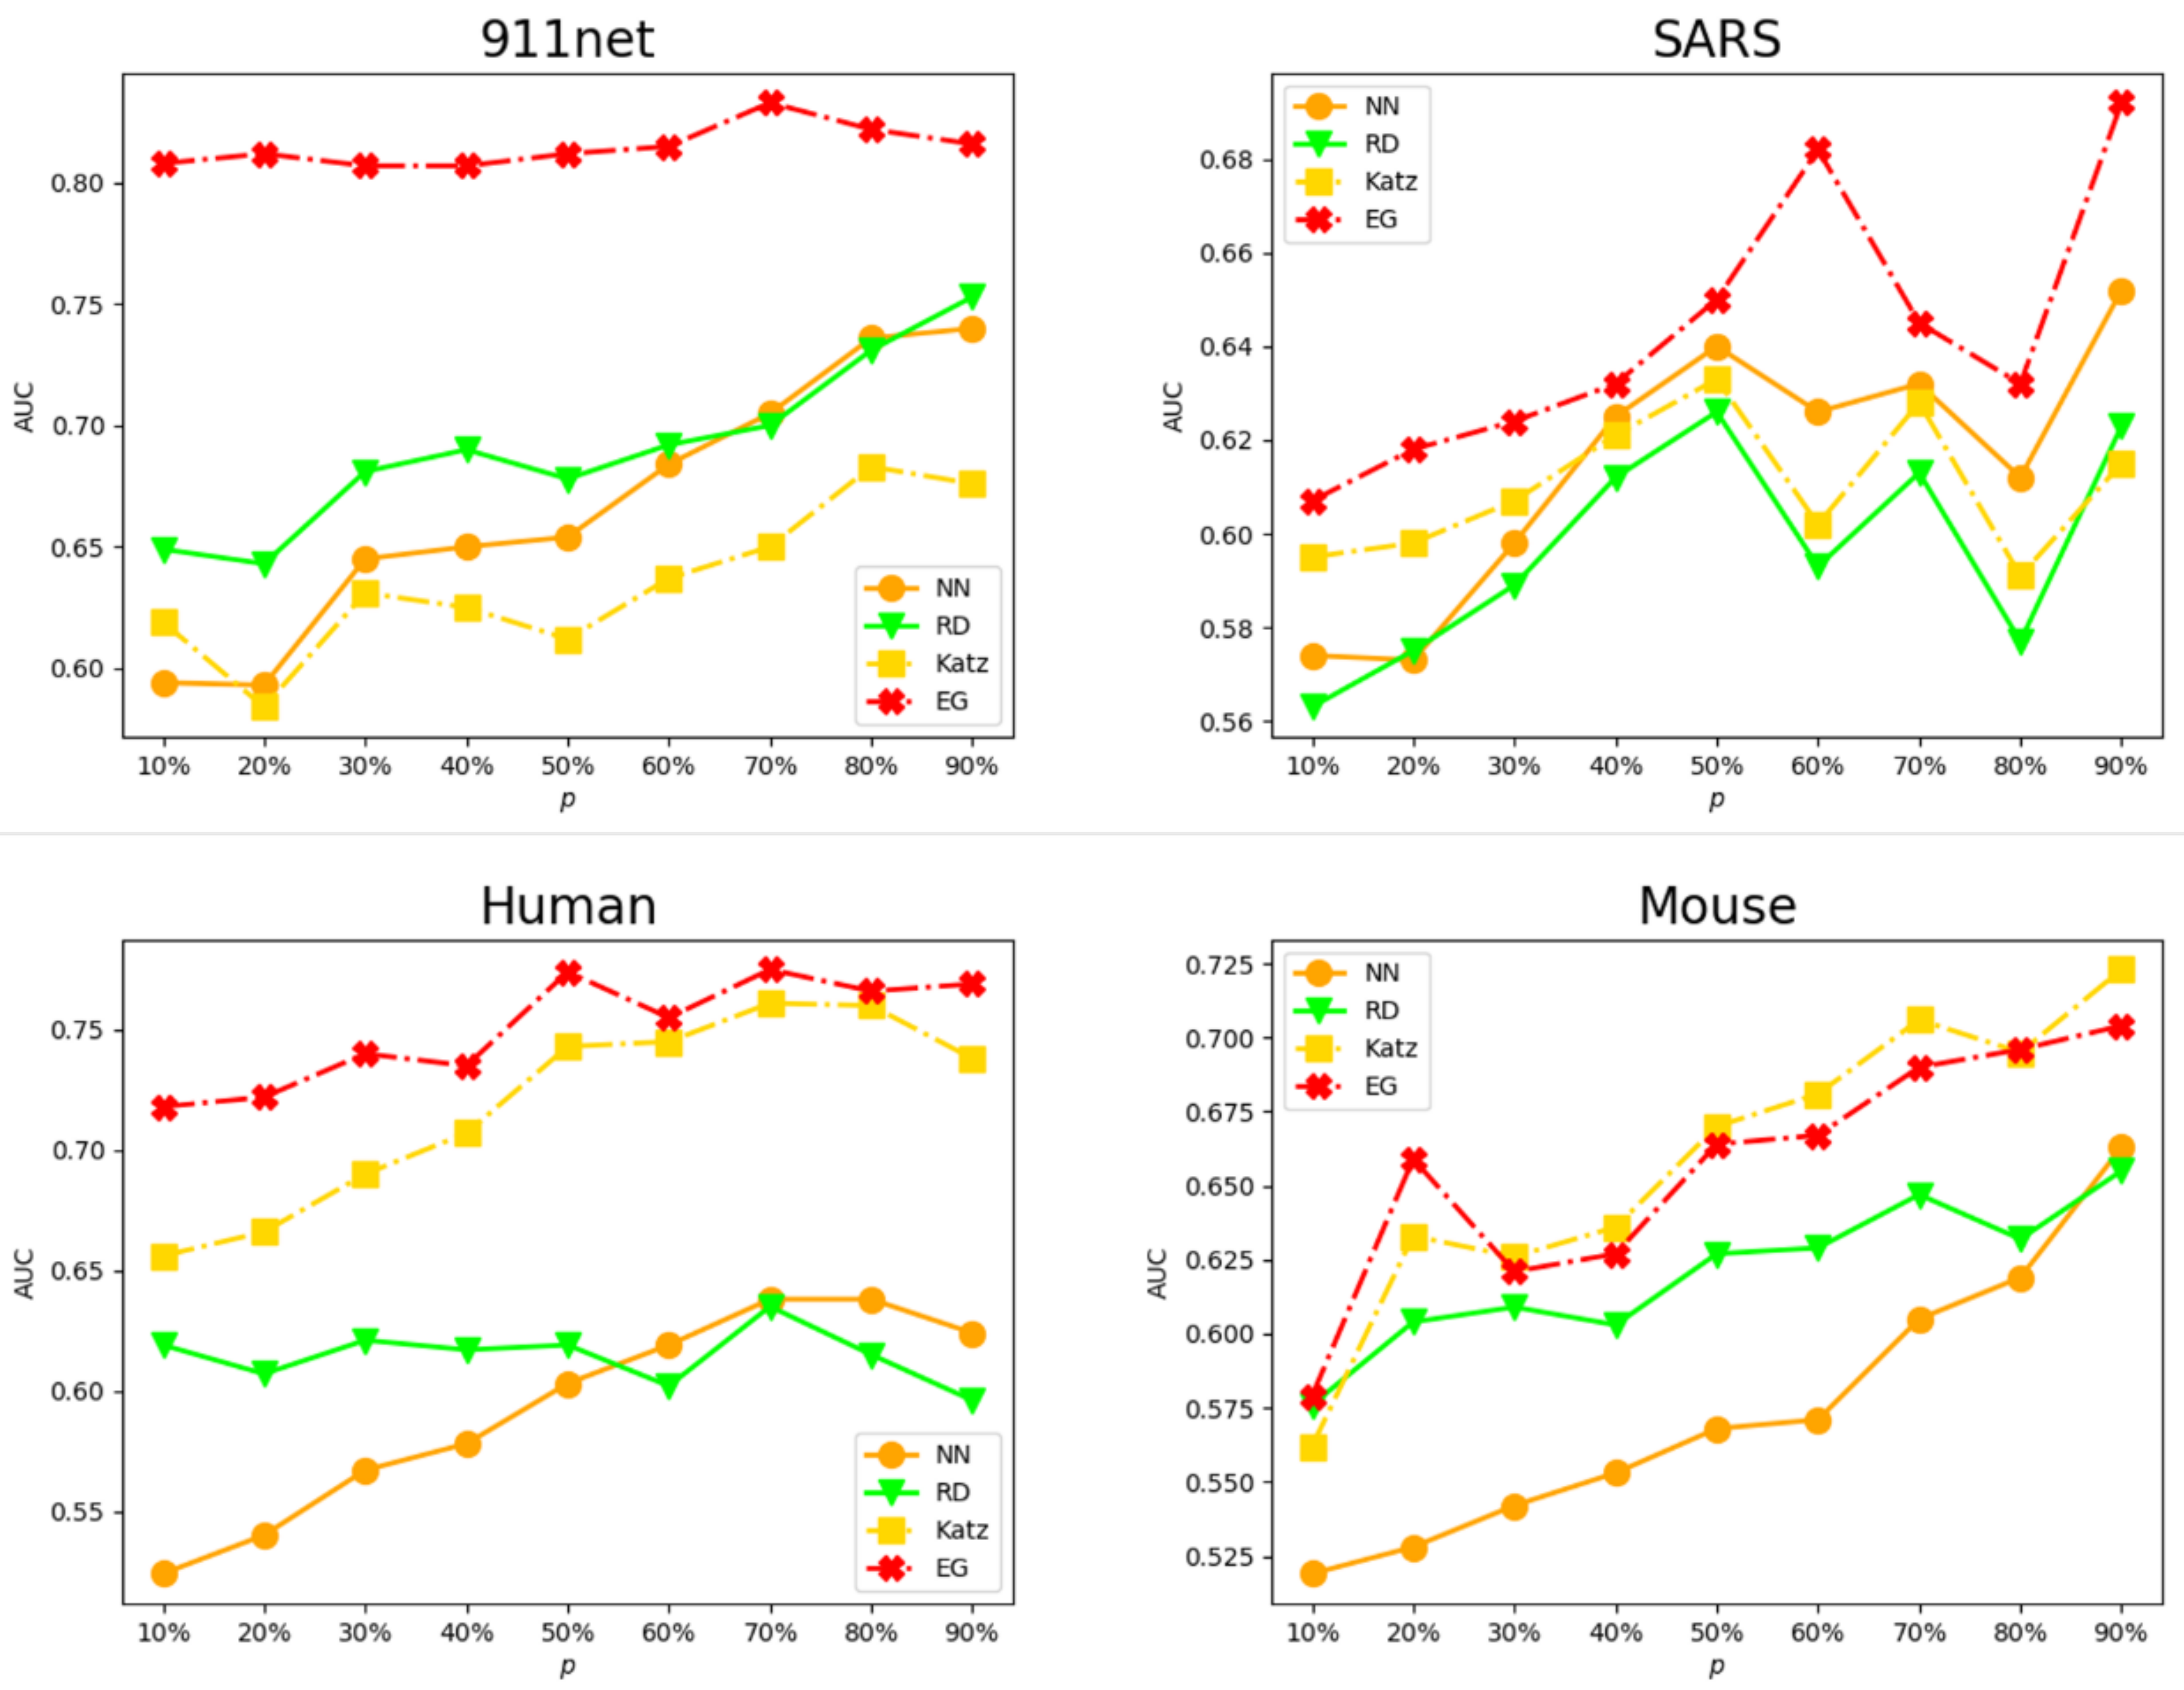
In
Figure 2, the horizontal axis represents the percentage of known important nodes of the set of important nodes, and the vertical axis represents the average
value. A higher
value represents a higher effectiveness. It is easy to see that the
values of most algorithms show an increasing trend as the ratio of important nodes in the network increases. The effect of the EG algorithm is most significant for the 9/11 network, and its
value remains stable at around 0.8, which is far ahead of other algorithms. In the SARS network and the Human network, our algorithm also achieved satisfactory results. The
index maintains its leading position against comparison algorithms, although the margins are not as prominent as those for 911net. One can also note that when the proportion of important nodes exceeds 30%, the
value of the EG algorithm in the Mouse network is slightly lower than that of the Katz algorithm, which may be due to the fact that the EG algorithm depends on adjacent nodes for judgment.
The experiments proved that the EG method performs best on the 9/11, SARS, and Human networks based on the evaluation of the , regardless of the ratio of known important nodes. It performs second-best on the Mouse network. From the perspective of network topology, the SARS network is different from other networks and possesses the highest average degree (20). At the same time, both the 911net and SARS networks are with high node aggregation. It can be inferred that the EG algorithm performs the best in those networks that are similar to SARS and 911net. The fluctuation amplitudes of the s for the four algorithms at different important node ratios reside in the scope of 0.08~0.12. This indicates that the ratio value in dense graphs has limited effect on these four algorithms. However, the clustering coefficients for both the Human and Mouse networks are smaller compared with those of the SARS and 9/11 networks, and we believe it is this attribute that reduces the advantage of EG over Katz, which performs second best for the Human network.
Further analysis finds that the NN algorithm considers the nodes with more connections to known important nodes as relatively important nodes, so its accuracy decreases when the known important nodes are fewer. On the other hand, when the known important nodes are in large amounts, it is also very challenging for an algorithm like NN to distinguish important nodes when the number of connected nodes equals that of the known important nodes. The RD method uses the inverse sum of the shortest path lengths with known important nodes to measure relative importance. However, in real networks, the nodes close to known important nodes are not necessarily the nodes we are looking for, and those far from the known important node may actually be the ones we need. The Katz method adopts a random wandering strategy that can better complete the mining task of relatively important nodes in some networks, but it still needs to improve its accuracy for other networks.


