Article

Numerical Analysis of Ground Settlement Patterns Resulting from Tunnel Excavation in Composite Strata

1
School of Resources and Safety Engineering, Central South University, Changsha 410083, China
2
Sinohydro Engineering Bereau 8 Co., Ltd., Changsha 410004, China
*
Author to whom correspondence should be addressed.
Appl. Sci. 2022, 12(11), 5479; https://doi.org/10.3390/app12115479
Submission received: 8 April 2022 / Revised: 22 May 2022 / Accepted: 25 May 2022 / Published: 28 May 2022

Abstract

:
Cross-river twin tunnels are prone to deformation and uneven settlement of the surrounding soil due to the complexity of the strata crossed, which has a negative impact on the tunnel structure. A numerical calculation model was established using the COMSOL Multiphysics to study the effects of twin tunnel excavation in composite strata on the ground settlement and the ground settlement pattern. The results indicated that after the construction of the twin tunnels is completed, the ground settlement above the first tunnel is slightly larger than the ground settlement above the second tunnel. The further the spacing between the two tunnels before and after excavation, the smaller the amount of ground settlement and the impact on the surrounding soil. The ground settlement value increases with the increase in burial depth, and the ground settlement curve gradually changes from a W-shaped curve to a V-shaped curve. As the distance between the two tunnels increases, the maximum settlement value of the settlement curve gradually decreases, and the ground lateral settlement curve changes from V-shaped to W-shaped. The higher the water level on the riverbed side, the greater the settlement value of the ground.

1. Introduction

Due to the further improvement of people’s requirements for an urban landscape environment, the rational use of underground space and the construction of subways have become an effective way to relieve urban traffic congestion, increase people’s travel mode options and reduce travel time [1,2]. In the rapid development of subway construction, the shield method has been widely used with high safety [3,4]. Meanwhile, in order to save time for tunnel construction, most metro tunnels are excavated in two lines simultaneously [5]. However, shield construction will inevitably disrupt the original equilibrium of the soil layer and cause ground settlement, especially for twin-tunnel construction, in which ground settlement is more pronounced compared to a single tunnel. Excessive ground settlement has a serious impact on existing buildings or roads on the surface. Therefore, it is important to deeply study the ground settlement pattern caused by the construction of twin tunnels.
So far, there are many research results on ground settlement for tunnel construction, including theoretical analysis methods, numerical simulations, field measurements and other methods of analyzing the mechanism and law of ground deformation caused by the tunnel excavation process. In the theoretical analysis method, the formula proposed by Peck [6] based on a large amount of monitoring data can predict the ground settlement trough curve caused by a single tunnel. New and O’Reilly [7] obtained the final profiles for two and multiple tunnels by summing the same Gaussian curves but did not take into account the interactions between the tunnels. The disturbance caused by the excavation of the first tunnel affects the deformation of the surrounding rock in the vicinity of the second tunnel, which can cause asymmetries in the settlement trough. Hence, Ma, L. et al. [8] provided a new settlement trough model for horizontally aligned twin tunnels and also established a new method for calculating ground losses in twin tunnels. Zhou, Z. et al. [9] introduced disturbance correction coefficients after analyzing the influence mechanism of double tunneling excavation, thus obtaining a prediction formula for the influence of double tunneling excavation on ground settlement, which was finally verified using an actual engineering case of Changsha Metro Line 2 in Hunan Province, China. Fang, K.D. et al. [10] improved the Peck by considering the tunnel axial depth and stratigraphic losses to make it more suitable for modeling the ground settlement curve of fully overlapping tunnels. The results show that the width of the settlement trough inside the settlement curve is only affected by the downstream tunnel, and the maximum settlement values caused by the stratigraphic losses and the upstream tunnel excavation are reduced by the overlap effect between the tunnels. In the meantime, scholars have conducted extensive studies based on engineering field measurements and monitoring data [11,12,13,14]. In a study by Chingke, N. et al. [15], the ground settlement analysis of the urban rail transit tunnel in Luoyang revealed that the ground settlement curve was affected by the post-excavation tunnel and the curve shifted from V-shaped to W-shaped. Fu, C.Q. et al. [16] developed a modified equivalent stiffness model based on field monitoring data from the Beijing metro project and also investigated the effects of underpass angle, vertical spacing, and soil parameters on settlement. Fargnoli, V. et al. [17] analyzed the variation in the settlement curve of Milan metro line 5 using a Gaussian empirical prediction method and summarized the influence of twin tunnels on each other in excavation. Others have studied the mechanism of influence between twin tunnels using a large physical–mechanical model [18,19,20,21].
In addition to the above methods, numerical simulation methods are also commonly used to study the interaction between twin tunnels and the ground settlement caused by them [22,23]. He, C. et al. [24] developed an analytical model in three dimensions and validated the model by numerical simulation, and the results demonstrated that this model can be accurately used to study the effect of the interaction between twin tunnels on ground vibrations. Agbay, E. et al. [25] presented numerical simulations of different sections along the twin tunnels considering the pre-support system, and the analysis presented that the deformation modulus of the ground around the tunnel is the main factor determining the ground settlement. Akbari, S. et al. [26] obtained four numerical models using FLAC 3D, with the models including single and twin tunnels, and found that the interaction between the tunnels is related to the distance between the tunnels, with less effect at longer distances. Similarly, Dibavar, B.H. [27] studied the effect of horizontal spacing between twin metro tunnels on ground settlement and the results were consistent. In general, numerical methods are a useful tool for studying the effect of twin tunnels on ground settlement by simulating different construction scenarios and the relative tunnel location relationships. However, studies on twin tunnels have generally focused on the horizontal spacing of the tunnels and the vertical spacing of the tunnels, with little research on the distance between tunnel excavation faces and the water level on the riverbed side. Moreover, most of the existing studies are based on the assumption of the homogeneity of the strata and do not build 3D models of complex strata according to the actual conditions.
Based on the Changsha metro tunnel project, this paper establishes a three-dimensional finite element numerical model in a composite stratum based on the engineering background and uses fluid–solid coupled multi-physics fields to conduct the study. This paper focuses on the analysis of the effect of twin tunnels on the ground settlement curve under the influence of four different factors (tunnel excavation surface spacing, tunnel spacing, tunnel depth and water level on the riverbed side) and summarizes the ground settlement deformation law.

2. Project Description

2.1. Engineering Background

Construction of Changsha metro line 6 passes under the Liuyang River reach involved the excavation of two single-track tunnels. The total length of the left tunnel is 1012.807 m, and that of the right tunnel is 1007.285 m. The tunnels were realized using two tunnel boring machines, and the machine excavation rate is 1.5 m/r (r is ring). The twin tunnels are almost parallel to the Guitang River Bridge above the Liuyang River, and the bridge pile is 18.65 m away from the nearest part of the tunnel. Figure 1 shows a planar graph of the Liuyang River, the Guitang River Bridge and the twin tunnels. The minimum radius of a plane curve of the left tunnel and the right tunnel is 400 m, and the distance between the left tunnel and right tunnel is 13.2~15.2 m. The minimum slope of the right tunnel is 15.797‰, and the maximum slope is 26‰. The minimum slope of the left tunnel is 15.953‰, and the maximum slope is 25.199‰. Therefore, longitudinal sections of the twin tunnels are “V”-shaped slopes. The buried depth of the twin tunnels is 9.2 m~25.9 m, and they can be regarded as typical shallow tunnels. The twin tunnels were built at the distance of 40.4045 km (DK40 + 404.5) to DK41 + 411.399. The DK40 + 400~DK40 + 620 sections pass under or near some buildings, and the DK40 + 750~DK41 + 020 sections pass under the Liuyang River.

2.2. Geological Drilling

In order to investigate the detailed geological conditions of the tunnel area, the method of geological drilling was adopted in the project. According to the results of geological drilling, the rock strata can be divided into six layers, as shown in Figure 2. The ① layer (miscellaneous fill) has a thickness of 2.7–2.9 m and is mainly composed of clayey soil and weathered rock. The thickness of the ② layer (silt clay) is 4.3–4.4 m; it is wet, and as the depth increases, it changes into silt. The ③ layer (silt) is 2.1–2.2 m thick, with particle sizes greater than 2 mm. The ④ layer (round gravel) has a thickness of 2.0–2.6 m, with particle sizes of 0.2–2.0 cm. The ⑤ layer (strongly weathered argillaceous siltstone) has an obvious weathering metamorphism, with particle sizes of 2–10 cm. In the horizontal direction, this layer is sporadically distributed in the site of this section, and the distribution regularity is not obvious, with an average thickness of 1.71 m. The ⑥ layer (moderately weathered argillaceous siltstone) has a silty structure, medium-thick layered structure and argillaceous cementation, with an average thickness of 17.97 m. The twin tunnels mainly pass through moderately weathered argillaceous siltstone, and a few pass through strongly weathered argillaceous siltstone.

2.3. Hydrogeology

In the sections of DK40 + 750~DK41 + 020, the Liuyang River and groundwater are mainly recharged through the round gravel layer. There are two types of pore water in the loose soil layer (phreatic water, pore confined water) and bedrock fissure water in the tunnel site. However, because the gravel layer in most sections is directly connected with the bedrock aquifer, the pore confined water and bedrock fissure water can be regarded as the same groundwater. The main aquifer of groundwater in the tunnel site is bedrock fissure water. Most of the tunnels in this area pass through the moderately weathered argillaceous siltstone, and some of them are located in the strongly weathered argillaceous siltstone. Pore phreatic water and pore confined water have little influence on the construction. Strongly weathered argillaceous siltstone and moderately weathered argillaceous siltstone have poor water permeability and poor water yield, which have little impact on tunnel excavation. However, strongly weathered argillaceous siltstone is easy to soften when it meets with water, and moderately weathered argillaceous siltstone’s strength decreases when it is soaked for too long.

3. Numerical Simulations

3.1. Numerical Model and Boundary Conditions

COMSOL Multiphysics analysis was conducted to investigate the tunneling-induced effect on the settlement of the overlying embankment. To simplify the calculation, each stratum was considered homogeneous and isotropic in this paper. It was assumed that the damage of moderately weathered argillaceous siltstone follows the Hoek–Brown criterion [28] and the other strata follow the Mohr–Coulomb criterion [29]. The friction angle was greater than 22 degrees, and the Mohr–Coulomb yield criterion was well adapted and accurate, so it was used to model the mechanical behavior of the soil. Meanwhile, the seepage field was assumed to satisfy Darcy’s law [30,31] because the pressure gradient of groundwater flow was not large, and the coupling condition was assumed to satisfy the Biot–Willis law [32,33]. A numerical model dimension of 80 m (length) × 200 m (width) × 30 m (height) was used to simulate the shield tunneling process, and the radius of the two tunnels was 3.1 m. The mesh and the whole 3D model used in the simulations are depicted in Figure 3. The mesh parameters of this model were maximum size 10 m, minimum size 0.6 m, maximum growth rate of adjacent cells 1.5, curvature factor 0.6 and thin domain resolution 0.02.
The model was treated with roll support all around, so the normal direction on both sides was fixed and could only move in the vertical direction. The bottom of the model was fixed and constrained and could not be moved. The top surface of the model was free. The gravity field was set and applied to the numerical model, considering a lateral pressure coefficient of 1.5. According to the perennial water level of Liuyang River, the water level on the bank side and the riverbed side was set to 29 m. In addition to providing the osmotic pressure on the riverbed surface, the gravity of the water body flowing in the river channel also acts as pressure on the riverbed surface, and the water body in the river channel was applied as an applied load on the riverbed surface. It was assumed that water has no flow exchange on any other surface or outside the model except for the ends of the tunnel and the bed surface, and the remaining surfaces were set as no flow. Borehole samples were taken at the construction site, and a professional organization was commissioned to experimentally determine the parameters of each stratum. Thus, Table 1 lists the main parameters of the surrounding strata used in the numerical model.

3.2. Numerical Modeling Procedure

In this paper, the modeling process consists of two stages: continuous excavation of the tunnel through the river and coupled solution of the groundwater seepage and stress fields. In COMSOL Multiphysics, excavation could be implemented using the “activation” function, as shown in Figure 4. The principle was to set an activation multiplier for the part of the model that needs to be excavated. When the excavation operation was required, the elasticity matrix of the computational node was multiplied by the activation multiplier and the density was multiplied by the square of the activation multiplier, thus causing the loss of the bearing capacity at that location and achieving the excavation effect. In order to control the progress of the tunnel excavation, this can be achieved by controlling the length of the tunnel excavation (defined as depth_l). Then, depending on the length at which the node was calculated with respect to the size of the parameter, it was decided whether the node was activated or not, and the excavation progress can be controlled simply by changing the value of depth_l. In order to achieve continuous excavation, the result of the previous excavation step was assigned as the initial condition for the next excavation step.
The excavation procedure was as follows:
  • In the first step, the pressure expressions on the grid points at different elevations were obtained based on the water level of 29 m on the bank side and the riverbed side. The water level pressure added to the numerical model takes into account the effect of water level changes in the Liuyang River. The gravity of the water body in the river was applied to the surface of the riverbed as an applied uniform load.
  • In the second step, the ground stress equilibrium was performed for the whole model. For the finite element model involving the joint action of groundwater and geotechnical body, the initial ground stress field was obtained by coupling the gravity field with the seepage field for equilibrium. At this point, the initial deformation was zero because the deformation has been completed before the construction of the new tunnel.
  • In the third step, the “activation” function was used to simulate tunnel excavation. The numerical simulation took into account four factors: the tunnel excavation surface spacing, the tunnel depth, the tunnel spacing and the water level on the riverbed side. The tunnel boring process is in the x-direction of the model (see Figure 3a) and is simulated using a stepwise excavation method with a step length of 10 m. The newly excavated part of prestressing is zero, and the remaining part of prestressing is the stress field after excavation stability in the previous step.

4. Analysis of Numerical Results

In this section, the numerical simulation results are analyzed and the influence of the four factors (the tunnel excavation surface spacing, the tunnel depth, the tunnel spacing and the water level on the riverbed side) on the settlement of surface are mainly studied, as shown in Table 2. Numerical simulations can easily obtain results that are not easily observed in model tests, and they can also well complement and verify the conclusions of physical models. Numerical simulation can visually reveal the degree of influence caused by different factors on the settlement of embankment projects and further obtain the general law of influence of different factors on settlement.

4.1. Influence of Tunnel Excavation Surface Spacing

During tunnel construction, tunnels that are dug one after another are prone to mutual disturbance. In order to speed up the construction process, the two tunnels are often excavated to be kept at a certain distance from each other, so that the structural and rock interaction between the two tunnels should be kept within an acceptable range. At the same time, the two shield machines in the actual construction of the twin tunnels usually do not go hand in hand, because the disturbance to the surrounding rock is too large and the stress at the palm surface is sharply concentrated, which may cause too much deformation of the tunnel and jam the shield machine.
In this section, we analyze the spatial effects of tunnels in the special terrain conditions of river tunnels, numerically simulate shallow buried tunnels with different excavation surface distances between the left and right lines, and propose a reasonable distance between excavation surfaces. In the simulation, it is assumed that the right line is the first hole and the left line is the later hole. Five working conditions of tunnel excavation surface spacing (0 m, 25 m, 50 m, 75 m and 100 m) were selected for the simulation of stepwise excavation, numbered 1–5 as shown in Table 2.

4.1.1. Ground Settlement Analysis

Figure 5 presents the lateral variation curves of ground settlement for different tunneling surface spacing at the position of 10 m in the excavation direction, and the curves roughly conform to the form of “normal distribution”. The curve was large in the middle and small at the ends, symmetrically distributed along the distribution center. When the distance between tunnel excavation surfaces gradually increases, the degree of mutual influence of the two line tunnels is smaller, and each tunnel tends to be constructed independently from the other. However, this influence does not increase with the spacing of the tunnel excavation surface; when the distance increases to a certain value, the influence on ground settlement is close to equilibrium. When the tunnel excavation surface spacing is small, the stress on the surrounding rock is larger, so when is later tunnel is excavated, the first tunnel surrounding rock deformation is not yet stable enough to share part of the surrounding rock stress, resulting in the cave perimeter and the ground surface producing a large displacement deformation.
Figure 6 shows the three surface monitoring points set at the position of 10 m depth in the excavation direction, which is numbered and presented in the figure. Figure 7 shows the variation curve of the displacement at different monitoring points with the spacing of the tunnel excavation surface. From Figure 7, we can see that the larger the spacing of the excavation surface, the smaller the ground settlement value, and the maximum settlement values of 4.93 mm, 4.57 mm, 4.058 mm, 3.658 mm and 3.508 mm corresponding to 0 m, 25 m, 50 m, 75 m and 100 m spacing of the tunnel excavation surface, respectively, and the maximum settlement point occurs at the centerline of the tunnel. According to the above settlement law, it can be concluded that in the excavation stage of the right cavern first, the excavation load is mainly borne by the surrounding rock of the right cavern, and after the excavation of the left cavern, the load is shared by the left and right caverns, and the settlement trough is biased in the direction of the right cavern.

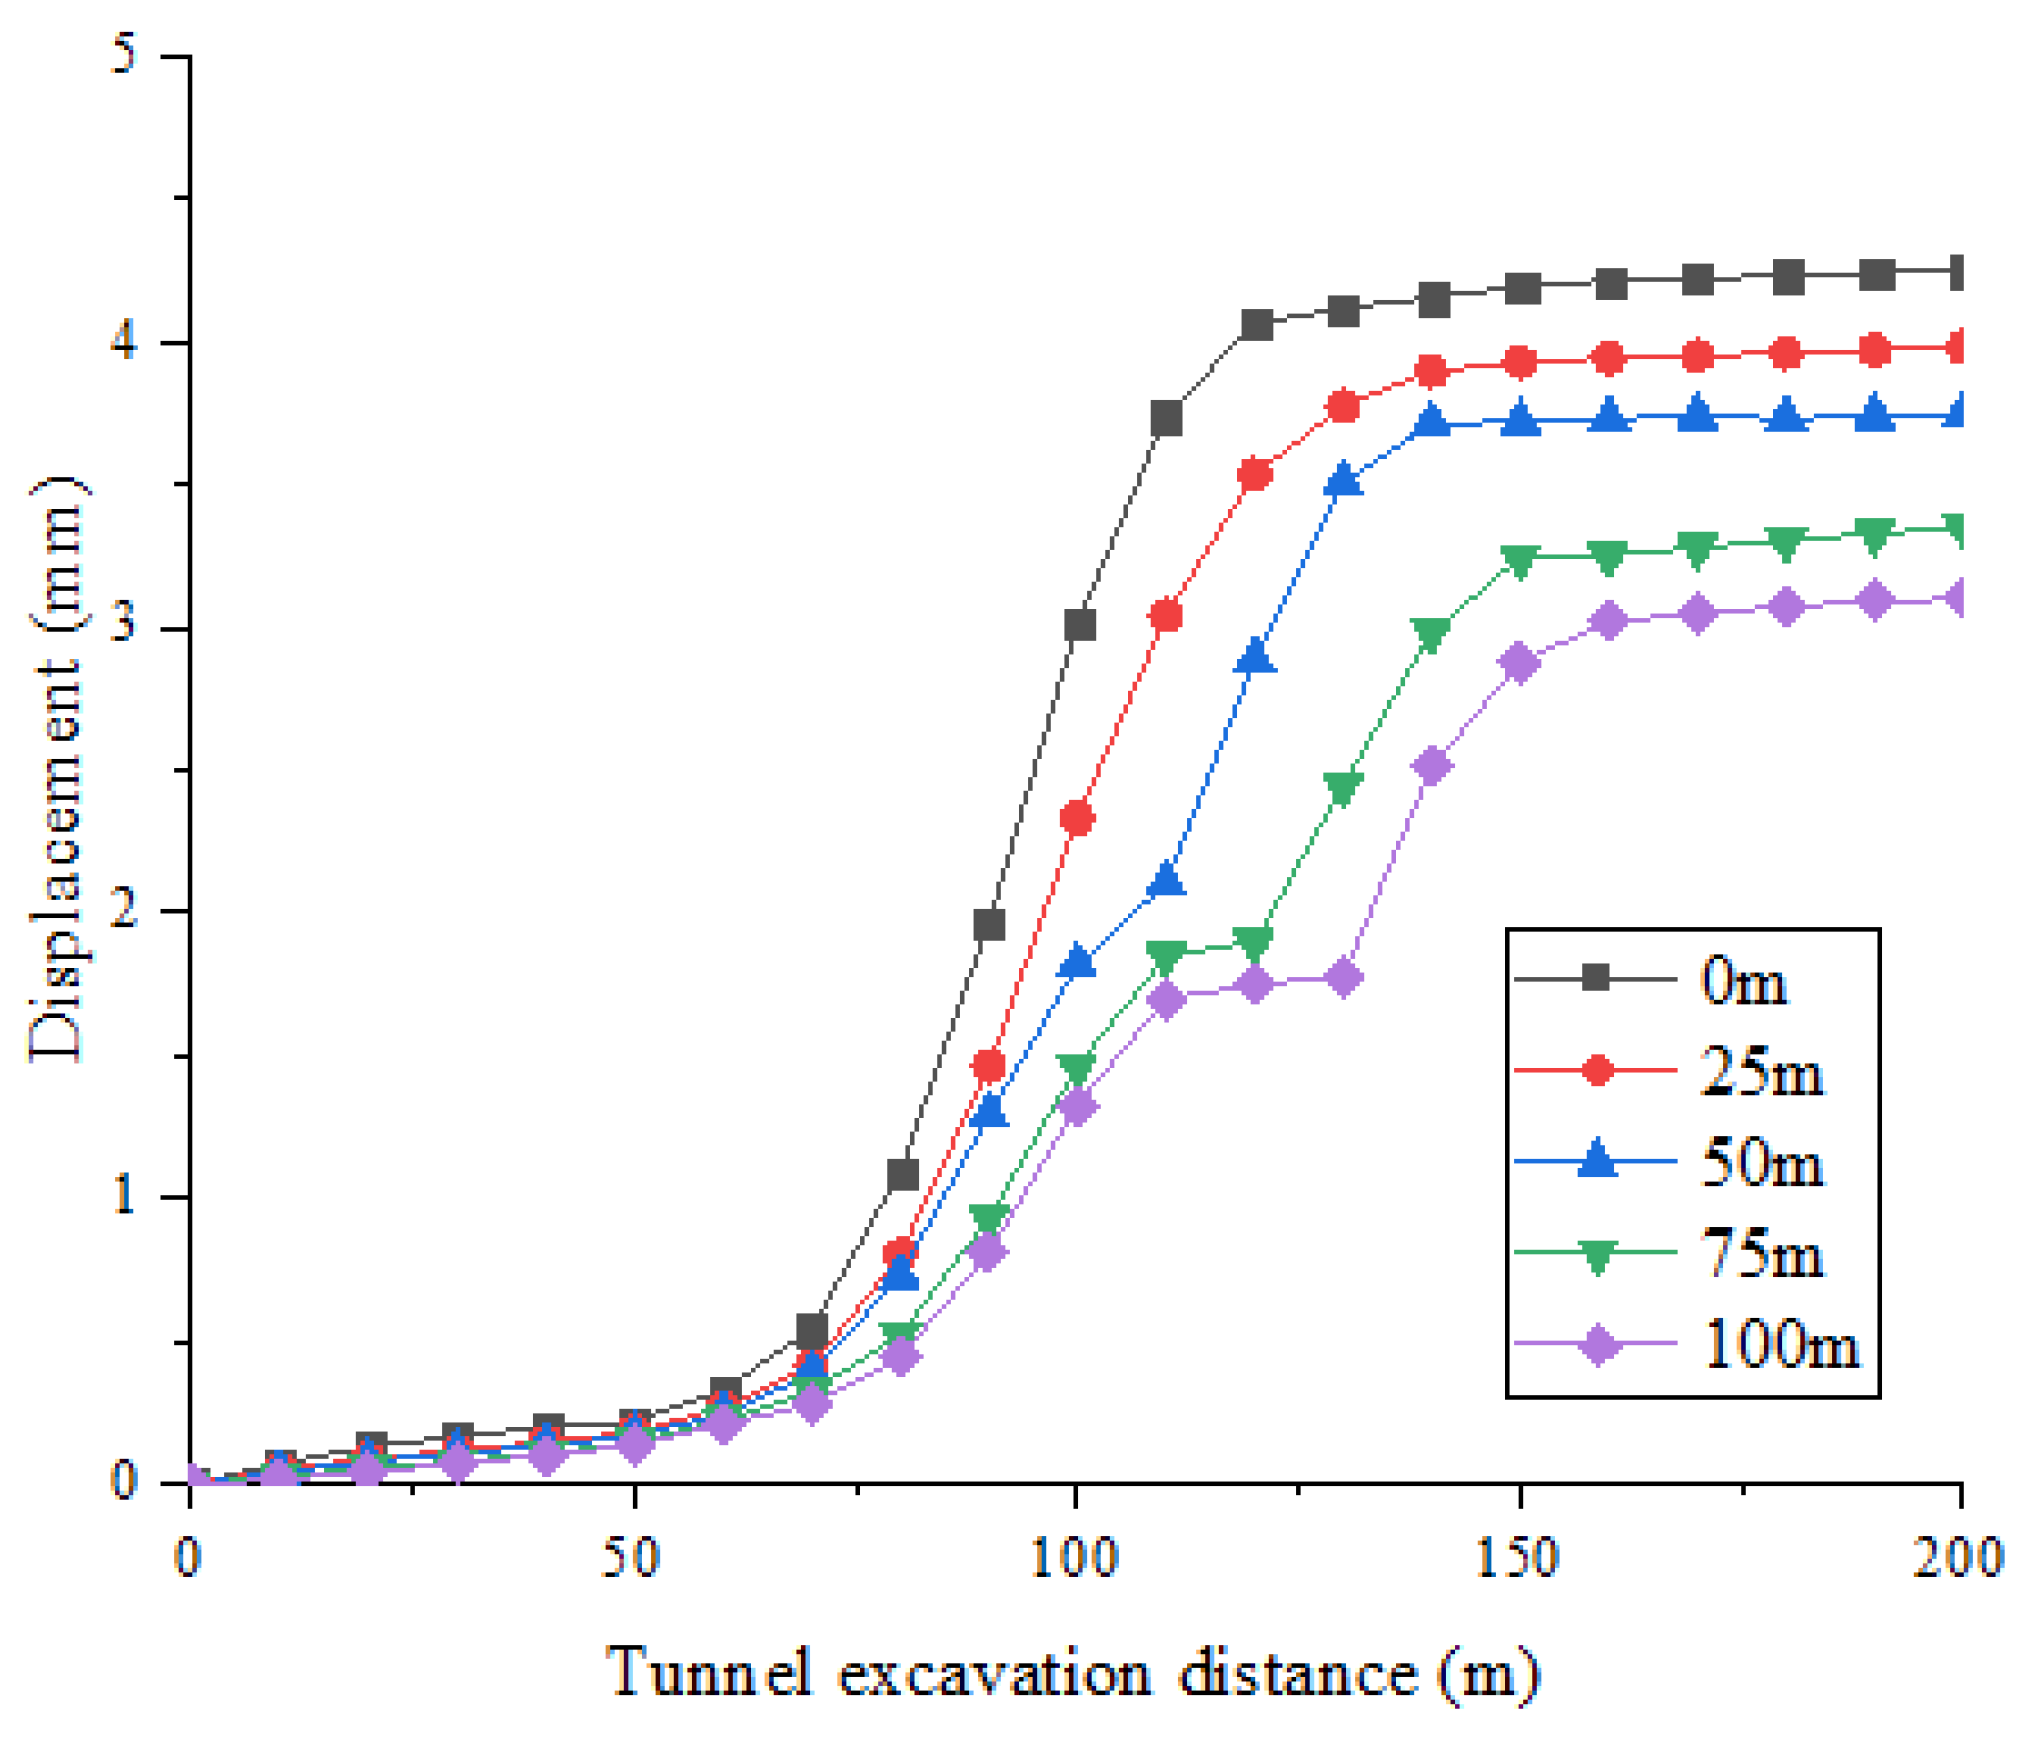
4.1.2. Excavation Process Displacement Analysis

Figure 8 shows the effect of different progress differences on the variation in displacement at monitoring point 1. Monitoring point 1 is located at the location of the right tunnel under the embankment. The two tunnels cross the dike at the same time when the spacing between the tunnel excavation faces is 0. The displacement curve at the monitoring point is steeper, indicating that the displacement rate of the overlying rock layer is large when the double tunnels are dug simultaneously. The displacement tends to stabilize when the tunnel palm surface crosses the embankment. When the tunnel excavation surface spacing is 25 m, the displacement curve of monitoring point 1 during excavation is still continuously rising. However, it can be found that the slope of the rising section decreases more than before at this time, indicating that the displacement rate of the overlying rock layer decreases as the excavation progress difference increases during the expansion of the double tunneling progress difference from 0 to 25 m. When the tunnel excavation surface spacing is 50 m, the displacement increases with the increase in excavation distance, and the curve appears to slow down at the stage when the tunnel excavation distance reaches near 100 m and then continues to grow again. This indicates that the influence area of the palm faces of the two tunnels has started to separate when the distance between the tunnel excavation faces is 50 m. The curve already shows a more obvious step surface at 75 m distance from the tunnel excavation, which means that the influence area of the palm surface of the two tunnels has been roughly separated at 75 m difference in the progress of excavation. At a distance of 100 m, the curve is similar to that at 75 m, but the step surface is more obvious. At this point, the palm face of the later tunnel is already located outside the influence area of the palm face of the first tunnel, and the influence on ground settlement is similar to that of the two tunnels excavated separately. It can be seen that the further the spacing between the two tunnels before and after excavation, the smaller the amount of ground settlement and the impact on the surrounding soil. Therefore, synchronous excavation with a spacing of 100 m between the two tunnels can be chosen for this project in order to reasonably shorten the construction period.

4.1.3. Plastic Area Analysis

From the contour distribution of the plastic zone at the top of Figure 9, it can be seen that the difference in the distance between the tunnel excavation faces affects the distribution of the plastic areas in the strata above the tunnel. The plastic zone of the right line tunnel is larger than that of the left line, which shows that the first excavated tunnel caused more plastic deformation than the later excavated tunnel. The largest plastic area appears at the location of the sidewalls on both sides of the cavern, and the plastic area in the left line is affected by the excavation in the right line increases with the decrease in the distance of the tunnel excavation face. The plastic area of the overlying rock forms a complete funnel over the smaller distance between the two tunnel excavation faces, and the central location directly above the two tunnels will not generate large shear stress due to the overall subsidence. The plastic area becomes asymmetric as the distance between the tunnel excavation faces increases. After a small funnel-shaped plastic area is generated in the first tunnel, the plastic strain generated in the second tunnel expands in the area close to the side of the second tunnel and eventually becomes an asymmetric funnel shape.
After the excavation of the right line tunnel, a settlement area and plastic areas are formed above the tunnel as shown in Figure 10a. Shear areas occur between the settlement area and the surrounding unsettled area due to the incompatibility of displacements, and the plastic strain in the overlying soil layer occurs mainly in this area. When the left line passes through the tunnel, the part of the settlement area formed by the left line and the settlement zone formed by the right line overlap because the settlement has already occurred, so the shear area formed after the excavation of the left line mainly occurs on the left side of the left settlement ellipse, which is further expanded on top of the plastic strain area formed by the right line as seen from the plastic strain contour map. Moreover, the plastic area generated by the surrounding soil of the first tunnel is larger than that of the later tunnel because the stresses in the surrounding rock are released after the excavation of the first tunnel.

4.2. Influence of the Tunnel Depth

Five working conditions of the tunnel depth (22 m, 25 m, 28 m, 31 m and 34 m) were selected for the simulation of stepwise excavation, as shown in Table 2.
Figure 11 shows that the ground settlement curve changes from a W-shaped curve to a V-shaped curve, and the maximum value of the ground settlement is shifted from the surface above the right hole vault to the vertical centerline. At the same time, the ground settlement value increases with the increase in burial depth, as shown in Figure 12. When the burial depth of the tunnel increases, the maximum settlement values of the ground surface are 2.745 mm, 3.508 mm, 3.735 mm, 3.851 mm and 4.084 mm. The maximum sedimentation value increased by 27.80%, 6.47%, 3.11% and 6.05%. As the tunnel depth increases from 22 m to 25 m, the ground settlement value increases significantly, but when the tunnel depth is 28 m, 31 m and 34 m, the maximum ground settlement value is closer, and the sensitivity of ground settlement to the tunnel depth decreases. This is due to the fact that when the tunnel depth reaches a certain level, a soil arch will form. The soil arch effect is formed when the tunnel depth reaches a certain level and can mitigate the ground settlement effect.
The ground settlement deformation is smaller when the tunnel is at a depth of 22 m. This is mainly because the thickness of the overburden above the tunnel is relatively small when the tunnel is shallow, and the load acting on the tunnel structure is smaller, which causes less ground loss, and the final surface soil settlement is smaller. When the tunnel depth is greater than 25 m, the tunnel is in a moderately weathered argillaceous siltstone layer. Due to the high strength of the surrounding rock, the ground loss that occurred during excavation is smaller, so the impact of the burial depth growth on the ground settlement is also smaller.

4.3. Influence of the Tunnel Spacing

Five working conditions of the tunnel spacing (7.2 m, 10.2 m, 13.2 m, 16.2 m and 19.2 m) were selected for the simulation of stepwise excavation, as shown in Table 2.
With the increase in tunnel spacing, the lateral ground settlement curve changes from V-shape to W-shape, the ground settlement range expands and the settlement trough becomes shallow, as shown in Figure 13. The maximum settlement was shifted from the right tunnel which was excavated first to the centerline of the two tunnels. As the tunnel spacing increases, the settlement of the strata above the tunnel gradually decreases, as shown in Figure 14. When the two tunnels are close together, the area of superimposed ground settlement caused by the twin-tunnel construction is larger, forming a V-shaped settlement curve, and the maximum settlement is larger than the maximum settlement at the surface of the single-lane tunnel excavation. This is due to the fact that the ground settlement curve of the twin tunnels is obtained by superimposing the ground settlement caused by the excavation of two single-lane tunnels, so the settlement values are larger than those caused by the construction of a single tunnel. As the tunnel spacing becomes larger, the area of superimposed ground settlement caused by the twin-tunnel construction becomes smaller, forming a W-shape settlement curve with more obvious characteristics. The twin tunnels are considered to be small spaced construction when the settlement curve is V-shaped, and the degree of mutual disturbance during excavation is strong. Meanwhile, the twin tunnel is considered a large spacing construction when the settlement curve is W-shaped, and the mutual disturbance is weak at this time.

4.4. Influence of the Water Level on the Riverbed Side

Five working conditions of the water level on the riverbed side (23 m, 26 m, 29 m, 32 m and 35 m) were selected for the simulation of stepwise excavation, as shown in Table 2. In the annual flood season, the water level of the Liuyang River will rise significantly. In order to study the influence of the change in riverbed water level on the surface displacement after excavation, different water level values are set in the working condition, and the settlement changes of each monitoring point under different water level conditions are recorded; the results are shown in Figure 15 below.
From Figure 15, it can be seen that the higher the water level is, the larger the settlement value of the strata is, and the settlement at the centerline of the two tunnels is the largest. As the water level on the riverbed side rises, the lateral and vertical pressures in each part of the tunnel increase almost linearly with the water level, and the difference between the two increases is small. However, the increase in both is smaller than the increase in river pressure, which is because the river pressure added to the surrounding rock changes the lateral pressure coefficient of each part. With the increase in water level on the riverbed side, the ground settlement increases, but its settlement difference is smaller than the difference under the influence of the other three factors, which indicates that the ground settlement is less affected by the change in water level. This is due to the fact that the river water weight is smaller than the unit weight of soil, so the effect of tunnel settlement is less affected by the change in water level. In conclusion, the tunnel construction period should be chosen during the river dry period as much as possible when building the tunnel through the river.

5. Conclusions

In this study, the construction process was numerically simulated by establishing a multistratum-tunnel 3D elastoplastic finite element model, and an in-depth investigation of the ground settlement pattern and deformation influencing factors during the construction of a two-lane tunnel was conducted to analyze the mutual influence mechanism between the two tunnels during construction. The main conclusions are as follows:
  • When the distance between tunnel excavation faces gradually increases, the degree of mutual influence of the two-lane tunnel is smaller, resulting in smaller ground settlement values and greater influence on the surrounding soil. Because the excavation load is mainly borne by the surrounding rock of the right tunnel during the excavation stage of the right tunnel first, and the load is shared by the left and right tunnels after the excavation of the left tunnel, the settlement value in the direction of the right tunnel is slightly larger. When the spacing between tunnel excavations is greater than 75 m, there is little interaction between the tunnels. Therefore, it is recommended that the spacing be greater than this distance so that the settlement can be kept within acceptable limits.
  • For the tunnel depth, when the tunnel depth increases, the ground settlement curve changes from a W-shaped curve to a V-shaped curve, the maximum value of ground settlement moves from the surface above the right hole vault to the vertical centerline and the number of ground settlement increases. However, the ground settlement will show a trend of a large increase first and then a gentle increase, which is caused by the soil arch effect.
  • As the tunnel spacing increases, the ground lateral settlement curve changes from V-shaped to W-shaped. The final ground settlement curve is obtained after the superposition of two single-line tunnel excavations, so when the tunnel spacing becomes larger, the degree of mutual interference during excavation becomes weaker, resulting in a smaller superposition area of ground settlement caused by the twin-tunnel excavation.
  • The higher the water level on the riverbed side, the greater the settlement value of the ground, with the maximum settlement occurring at the centerline of both tunnels. The ground settlement is less affected by changes in water level, due to the fact that the weight of the river water is less than the unit weight of the soil. Nevertheless, when a tunnel through a river is excavated, the period when the river level is low should be chosen.
  • By comparing the values of maximum surface settlement between different factors, it can be found that the distance between tunnel excavation faces has the greatest influence on surface settlement, followed by the tunnel spacing and the tunnel depth and finally the water level on the riverbed side. This can give some useful suggestions for better control of surface settlement during the actual construction of the project. In the actual construction, more attention needs to be paid to the distance between tunnel excavation faces.

Author Contributions

Conceptualization, H.D., P.C., Y.L. and Z.L.; Formal analysis, H.D.; Investigation, G.M., Z.F. and W.X.; Methodology, H.D. and P.C.; Resources, G.M., Z.F. and W.X.; Software, H.D. and Y.L.; Writing—original draft, H.D.; Writing—review & editing, Z.L. All authors have read and agreed to the published version of the manuscript.

Funding

This research was funded by the National Natural Science Foundation of China (Grant No. 11772358, 52004327); the Water Conservancy Science and Technology Major Project of Hunan Province, China (Grant No. XSKJ2019081-10); and the Fundamental Research Funds for the Central South University, China (2020zzts198).

Institutional Review Board Statement

Not applicable.

Conflicts of Interest

The authors declare no conflict of interest. The authors declare that they have no known competing financial interests or personal relationships that could appear to have influenced the work reported in this paper.

References

  1. Namli, M. Evaluation of the effect of using fiber reinforcement in tunnel linings for metro projects. Undergr. Space 2021, 6, 732–750. [Google Scholar] [CrossRef]
  2. Xie, S.; Lin, H.; Cheng, C.; Chen, Y.; Wang, Y.; Zhao, Y.; Yong, W. Shear strength model of joints based on Gaussian smoothing method and macro-micro roughness. Comput. Geotech. 2022, 143, 104605. [Google Scholar] [CrossRef]
  3. Yang, H.; Lin, H.; Chen, Y.; Wang, Y.; Zhao, Y.; Yong, W.; Gao, F. Influence of wing crack propagation on the failure process and strength of fractured specimens. Bull. Eng. Geol. Environ. 2022, 81, 71. [Google Scholar] [CrossRef]
  4. Li, P.F.; Wang, L.; Fan, H.; Wang, G. Analytical scrutiny of loosening pressure on deep twin-tunnels in rock formations. Tunn. Undergr. Space Technol. 2019, 83, 373–380. [Google Scholar] [CrossRef]
  5. Karakus, M.; Ozsan, A.; Basarir, H. Finite element analysis for the twin metro tunnel constructed in Ankara Clay, Turkey. Bull. Eng. Geol. Environ. 2007, 66, 71–79. [Google Scholar] [CrossRef]
  6. Peck, R.B. Deep Excavations and Tunnelling in Soft Ground. In Proceedings of the 7th International Conference on Soil Mechanics and Foundation Engineering, Mexico City, Mexico, 29 August 1969; State of the Art Volume. pp. 225–290. [Google Scholar]
  7. O’Reilly, M.P.; New, B.M. Settlements above Tunnels in the United Kingdom. Their Magnitudes and Prediction. In Proceedings of Tunnelling’82 Symposium; Jones, M.J., Ed.; Springer: Berlin, Germany, 1982; pp. 173–181. [Google Scholar]
  8. Ma, L.; Ding, L.; Luo, H. Non-linear description of ground settlement over twin tunnels in soil. Tunn. Undergr. Space Technol. Inc. Trenchless Technol. Res. 2014, 42, 144–151. [Google Scholar] [CrossRef]
  9. Zhou, Z.; Ding, H.; Miao, L.; Gong, C. Predictive model for the surface settlement caused by the excavation of twin tunnels. Tunn. Undergr. Space Technol. 2021, 114, 104014. [Google Scholar] [CrossRef]
  10. Fang, K.; Yang, Z.; Jiang, Y.; Sun, Z.; Wang, Z. Surface subsidence characteristics of fully overlapping tunnels constructed using tunnel boring machine in a clay stratum. Comput. Geotech. 2020, 125, 103679. [Google Scholar] [CrossRef]
  11. Deng, H.S.; Fu, H.L.; Yue, S.; Huang, Z.; Zhao, Y.Y. Ground loss model for analyzing shield tunneling-induced surface settlement along curve sections. Tunn. Undergr. Space Technol. 2022, 119, 104250. [Google Scholar] [CrossRef]
  12. Alhaddad, M.; Wilcock, M.J.; Chang, Y.G.; Soga, K.; Devriendt, M.; Dewhirst, M. Cast-Iron Tunnels’ Tolerance to Imposed Longitudinal Settlement Curvature. Géotechnique 2020, 71, 1044–1055. [Google Scholar] [CrossRef]
  13. Liang, R.; Wu, J.; Lianwei, S.; Shen, W.; Wu, W. Performances of adjacent metro structures due to zoned excavation of a large-scale basement in soft ground. Tunn. Undergr. Space Technol. 2021, 117, 104123. [Google Scholar] [CrossRef]
  14. Qibin, L.; Ping, C.; Rihong, C.; Hang, L.; Jingjing, M. Mechanical behavior around double circular openings in a jointed rock mass under uniaxial compression. Arch. Civ. Mech. Eng. 2020, 20, 19. [Google Scholar]
  15. Qingke, N.; Guang, S.; Siyuan, G.; Hongtao, L.; Lichao, Z.; Jianpeng, H. Disturbance Process of Sandy Gravel Stratum Caused by Shield Tunneling and Ground Settlement Analysis. Front. Earth Sci. 2021, 9, 782927. [Google Scholar] [CrossRef]
  16. Fu, C.; Gao, Y. Numerical Analysis on the Behavior of Existing Tunnels Subjected to the Undercrossed Shield Tunneling at a Small Proximity. Adv. Civ. Eng. 2020, 2020, 8823331. [Google Scholar] [CrossRef]
  17. Fargnoli, V.; Boldini, D.; Amorosi, A. Twin tunnel excavation in coarse grained soils: Observations and numerical back-predictions under free field conditions and in presence of a surface structure. Tunn. Undergr. Space Technol. Inc. Trenchless Technol. Res. 2015, 49, 454–469. [Google Scholar] [CrossRef]
  18. Zheng, H.; Li, P.; Ma, G. Stability analysis of the middle soil pillar for asymmetric parallel tunnels by using model testing and numerical simulations. Tunn. Undergr. Space Technol. 2020, 108, 103686. [Google Scholar] [CrossRef]
  19. Qibin, L.; Ping, C.; Guanping, W.; Jingjing, M.; Rihong, C.; Zhiye, Z. Crack coalescence in rock-like specimens with two dissimilar layers and pre-existing double parallel joints under uniaxial compression. Int. J. Rock Mech. Min. Sci. 2021, 139, 104621. [Google Scholar]
  20. Zheng, H.B.; Li, P.F.; Ma, G.W.; Zhang, Q.B. Experimental investigation of mechanical characteristics for linings of twins tunnels with asymmetric cross-section. Tunn. Undergr. Space Technol. 2022, 119, 104209. [Google Scholar] [CrossRef]
  21. Xu, Z.; Luo, Y.; Chen, J.; Su, Z.; Zhu, T.; Yuan, J. Mechanical properties and reasonable proportioning of similar materials in physical model test of tunnel lining cracking. Constr. Build. Mater. 2021, 300, 123960. [Google Scholar] [CrossRef]
  22. Lin, H.; Sun, P.H.; Chen, Y.F.; Zhu, Y.Y.; Fan, X.; Zhao, Y.L. Analytical and experimental analysis of the shear strength of bolted saw-tooth joints. Eur. J. Environ. Civ. Eng. 2022, 26, 1639–1653. [Google Scholar] [CrossRef]
  23. Qibin, L.; Ping, C.; Jingjing, M.; Rihong, C.; Zhiye, Z. Strength and failure characteristics of jointed rock mass with double circular holes under uniaxial compression: Insights from discrete element method modelling. Theor. Appl. Fract. Mech. 2020, 109, 102692. [Google Scholar]
  24. He, C.; Zhou, S.H.; Guo, P.J.; Gong, Q.M. Three-dimensional analytical model for the dynamic interaction of twin tunnels in a homogeneous half-space. Acta Mech. 2019, 230, 1159–1179. [Google Scholar] [CrossRef]
  25. Agbay, E.; Topal, T. Evaluation of twin tunnel-induced surface ground deformation by empirical and numerical analyses (NATM part of Eurasia tunnel, Turkey). Comput. Geotech. 2020, 119, 103367. [Google Scholar] [CrossRef]
  26. Akbari, S.; Zare Sh Chakeri, H.; Mirzaei, H. A 3D Finite-Difference Analysis of Interaction between a Newly-Driven Large Tunnel with Twin Tunnels in Urban Areas. J. Min. Environ. 2020, 11, 809–823. [Google Scholar]
  27. Dibavar, B.H.; Ahmadi, M.H.; Davarpanah, S.M. 3D Numerical Investigation of Ground Settlements Induced by Construction of Istanbul Twin Metro Tunnels with Special Focus on Tunnel Spacing. Period. Polytech. -Civ. Eng. 2019, 63, 1225–1234. [Google Scholar]
  28. Hoek, E.; Marinos, P. A brief history of the development of the Hoek-Brown failure criterion. Soils Rocks 2007, 2, 2–13. [Google Scholar]
  29. Yong-Bok, J.; Eui-Seob, P.; Dong-Woo, R.; Dae-Sung, C. Analysis of Whole Tunnel Stability by Using Rock Mass Classification and Mohr-Coulomb Analytical Solution. Tunn. Undergr. Space 2013, 23, 280–287. [Google Scholar]
  30. Whitaker, S. Flow in porous media I: A theoretical derivation of Darcy’s law. Transp. Porous Media 1986, 1, 3–25. [Google Scholar] [CrossRef]
  31. Darcy, H. Les Fontaines Publiques de La Ville de Dijon; Victor Dalmont: France, Paris, 1856. [Google Scholar]
  32. Fatt, I. The Biot-Willis Elastic Coefficients for a Sandstone. J. Appl. Mech. 1959, 26, 296–297. [Google Scholar] [CrossRef]
  33. Biot, M.A.; Willis, D.G. The Elastic Coefficients of the Theory of Consolidation. J. Appl. Mech. 1957, 24, 594–601. [Google Scholar] [CrossRef]
Figure 1. Location of the Liuyang River, the Guitang River Bridge and the tunnels.
Applsci 12 05479 g001
Figure 2. Geological cross-section of the tunnels.
Applsci 12 05479 g002
Figure 3. The whole 3D model and detailed mesh shape in the simulation (unit: m). (a) The whole 3D model. (b) The mesh of the 3D model. (c) The mesh of the twin tunnels.
Applsci 12 05479 g003aApplsci 12 05479 g003b
Figure 4. Schematic diagram of “activation” treatment.
Applsci 12 05479 g004
Figure 5. Lateral variation curve of ground settlement for different tunneling surface spacing at 10 m depth in excavation direction.
Applsci 12 05479 g005
Figure 6. Arrangement of surface monitoring points at the position of 10 m depth in excavation direction.
Applsci 12 05479 g006
Figure 7. Variation curve of displacement at different monitoring points with the spacing of tunnel excavation surface.
Applsci 12 05479 g007
Figure 8. Variation curve of displacement of monitoring point 1 with tunnel excavation surface spacing.
Applsci 12 05479 g008
Figure 9. Contour map of plastic strain area (tunnel excavation surface spacing 0 m/25 m/50 m/100 m). (a) A distance of 0 m. (b) A distance of 25 m. (c) A distance of 50 m. (d) A distance of 100 m.
Applsci 12 05479 g009aApplsci 12 05479 g009b
Figure 10. Distribution diagram of settlement area and plastic area. (a) Before the excavation of the left tunnel. (b) After the excavation of the left tunnel.
Applsci 12 05479 g010
Figure 11. Lateral variation curve of ground settlement for different tunnel depths at 10 m depth in excavation direction.
Applsci 12 05479 g011
Figure 12. Variation curve of displacement at different monitoring points with the tunnel depth.
Applsci 12 05479 g012
Figure 13. Lateral variation curve of ground settlement for different tunnel spacing at 10 m depth in excavation direction.
Applsci 12 05479 g013
Figure 14. Variation curve of displacement at different monitoring points with the tunnel spacing.
Applsci 12 05479 g014
Figure 15. Variation curve of displacement at different monitoring points with the water level on the riverbed side.
Applsci 12 05479 g015
Table 1. The main parameters of the strata.
The StrataFilling Density ρ (kg/m3)Bulk Modulus K (MPa)Shear Modulus K (MPa)PorosityPermeabilityc (kPa)φ (◦)
Miscellaneous fill2.016.724.230.097.09 × 10−142416
Silt clay and silt2.056.383.830.19.45 × 10−121823
Round gravel2.233.33250.31.12 × 10−11235
Moderately weathered argillaceous siltstone2.45393.804150.2251.77 × 10−131.238
Table 2. Working conditions of four factors.
NumberWorking NumberThe Tunnel Excavation Surface Spacing (m)The Tunnel Depth (m)The Tunnel Spacing (m)The Water Level on the Riverbed Side (m)
1J100H25D13.2W291002513.229
2J75H25D13.2W29752513.229
3J50H25D13.2W29502513.229
4J25H25D13.2W29252513.229
5J0H25D13.2W2902513.229
6J100H22D13.2W291002213.229
7J100H28D13.2W291002813.229
8J100H31D13.2W291003113.229
9J100H34D13.2W291003413.229
10J100H25D7.2W29100257.229
11J100H25D10.2W291002510.229
12J100H25D16.2W291002516.229
13J100H25D19.2W291002519.229
14J100H25D13.2W231002513.223
15J100H25D13.2W261002513.226
16J100H25D13.2W321002513.232
17J100H25D13.2W351002513.235
Publisher’s Note: MDPI stays neutral with regard to jurisdictional claims in published maps and institutional affiliations.

