Article

Deformation Characteristics of Bolted Rock Joints under Compression-Shear Load

School of Resources and Safety Engineering, Central South University, Changsha 410083, China
*
Authors to whom correspondence should be addressed.
Appl. Sci. 2022, 12(10), 5226; https://doi.org/10.3390/app12105226
Submission received: 28 April 2022 / Revised: 15 May 2022 / Accepted: 18 May 2022 / Published: 21 May 2022

Abstract

:
Joints exist widely in tunnel engineering. Studying the deformation characteristics of the bolted joint is beneficial for preventing rock mass disasters. To reveal the deformation characteristics of bolted rock joints, the elastic solutions of the radial deformation characteristics of bolted rock joints under compression-shear load were derived, which were based on the Lame solution in elastic mechanics and the displacement coordination condition of the interface between the bolt and the joint (assuming that the displacement at the interface between the bolt and joint is equal). Then, the distance from any point of the compression-shear side of the joint to the center of the bolt was denoted as r. The minimum of the radial displacement of the joint at the compression-shear side urmin was calculated. Numerical simulation verified the correctness of the elastic solutions by calculating the influence range and distance. In addition, the variation law of the value of the radial displacement (ur) was analyzed and discussed by changing the elastic modulus of the rock block (Er), radius (R), and elastic modulus (Eb) of the bolt. The results indicate the following: (1) The radial displacement will decrease as r decreases; the influence range of the bolt on the joint is approximately an ellipse, whereas the long axis of the ellipse is equal to the influence distance of the bolt. (2) The influence distance of the bolt is roughly six times the bolt radius (6R). (3) The radial displacement shows an exponential relationship with the elastic modulus of the rock and a nonlinear negative correlation with the radius and elastic modulus of the bolt. The increase in the elastic modulus of the rock, the elastic modulus, and the radius of the bolt will make the radial displacement smaller.

1. Introduction

Joints exist widely in tunnel engineering. The rock joints in engineering rock mass reduce the overall strength of rock mass. Under the influence of external load or environmental change, rock mass is prone to shear-slip failure along rock joints, which poses a serious threat to engineering safety [1,2,3]. As the weak plane in rock mass, the mechanical properties of rock joints control the stability of rock mass to a great extent [4,5,6,7,8]. As a flexible reinforcement measure, bolts are widely used in the support and reinforcement of geotechnical engineering such as mine, slope, and dam foundations due to their significant engineering benefits [9,10]. Therefore, studying the shear performance of bolted rock joints is necessary and practical for the stability assessment and safety design of geotechnical engineering. In this case, a series of studies on this issue have been conducted, and numerous achievements have been made. For example, the influence of different displacement angles, surrounding rock material, the fracture openings of rock joints, bolt dip angles, and the length of the shear strength of bolted rock joints have received attention from researchers worldwide [11,12,13]. Martín, et al. [14], Grasselli [15], and Jalalifar, et al. [16] investigated the shear strength of bolted joints. Other experts simultaneously considered the influence of the tensile and shear strength of the bolt on the shear strength of rock joints [17,18]. To better fit engineering practice, performing investigations on the shear strength of bolted rock joints under cyclic load is an important task [19,20,21]. Li [22] and Kang, et al. [23] conducted field tests to explore the reinforcement performance of bolts in highly stressed rock masses.
These studies were mainly conducted through experiments and numerical simulations, and most of the conclusions were qualitative. Quantitatively describing the shear strength of bolted rock joints is necessary for obtaining a deeper understanding of their features. Under the circumstances, some scholars have conducted theoretical analyses of the shear strength of bolted rock joints. Xiao, et al. [24] deduced the calculation formula of the ultimate elastic load of the bolt based on the elastic-plastic theory. Ren, et al. [25], Martin, et al. [26], and Chen, et al. [27] proposed analytical models that can predict the entire process of the tension and tensile shear of bolts. Ma, et al. [28] and Cao, et al. [29] derived the analytical expressions of various failure modes of bolts considering the interaction between bolts and surrounding media. By conducting a theoretical analysis, Liu, et al. [30] pointed out that the lateral shear force of bolts played an important role in strengthening the rock joints, and the established theoretical model was helpful for improving the design method of bolts. Veisi, et al. [31] discovered that the maximum failure load takes place at an optimum load distance, which was related to the selected configuration. However, the above theoretical analyses mostly studied the mechanical behavior of the bolt in the bolted joint, and there is little research on the mechanical properties of the joint.
Although existing studies are significant for revealing the shear strength of bolted rock joints, they do not effectively describe the deformation and failure characteristics of such joints. Additionally, the deformation characteristics of the compression-shear side of bolted joints have not been quantitatively employed, and the influence range of the bolt has not been analyzed quantitatively. Consequently, in this study, the distance between any point on the bolted joint to the bolt center was first treated as an independent variable r, the influence range of the bolt on the rock joint was drawn through an example, and the relationships between the radial displacement of joint at the compression-shear side ur, radius R, and elastic modulus Eb of the bolt and elastic modulus of the rock Er were taken into account to establish the theoretical model of the radial displacement of the bolted joint in the polar coordinate system, whose correctness and feasibility were then verified by numerical simulation method. The analysis process is shown in Figure 1.

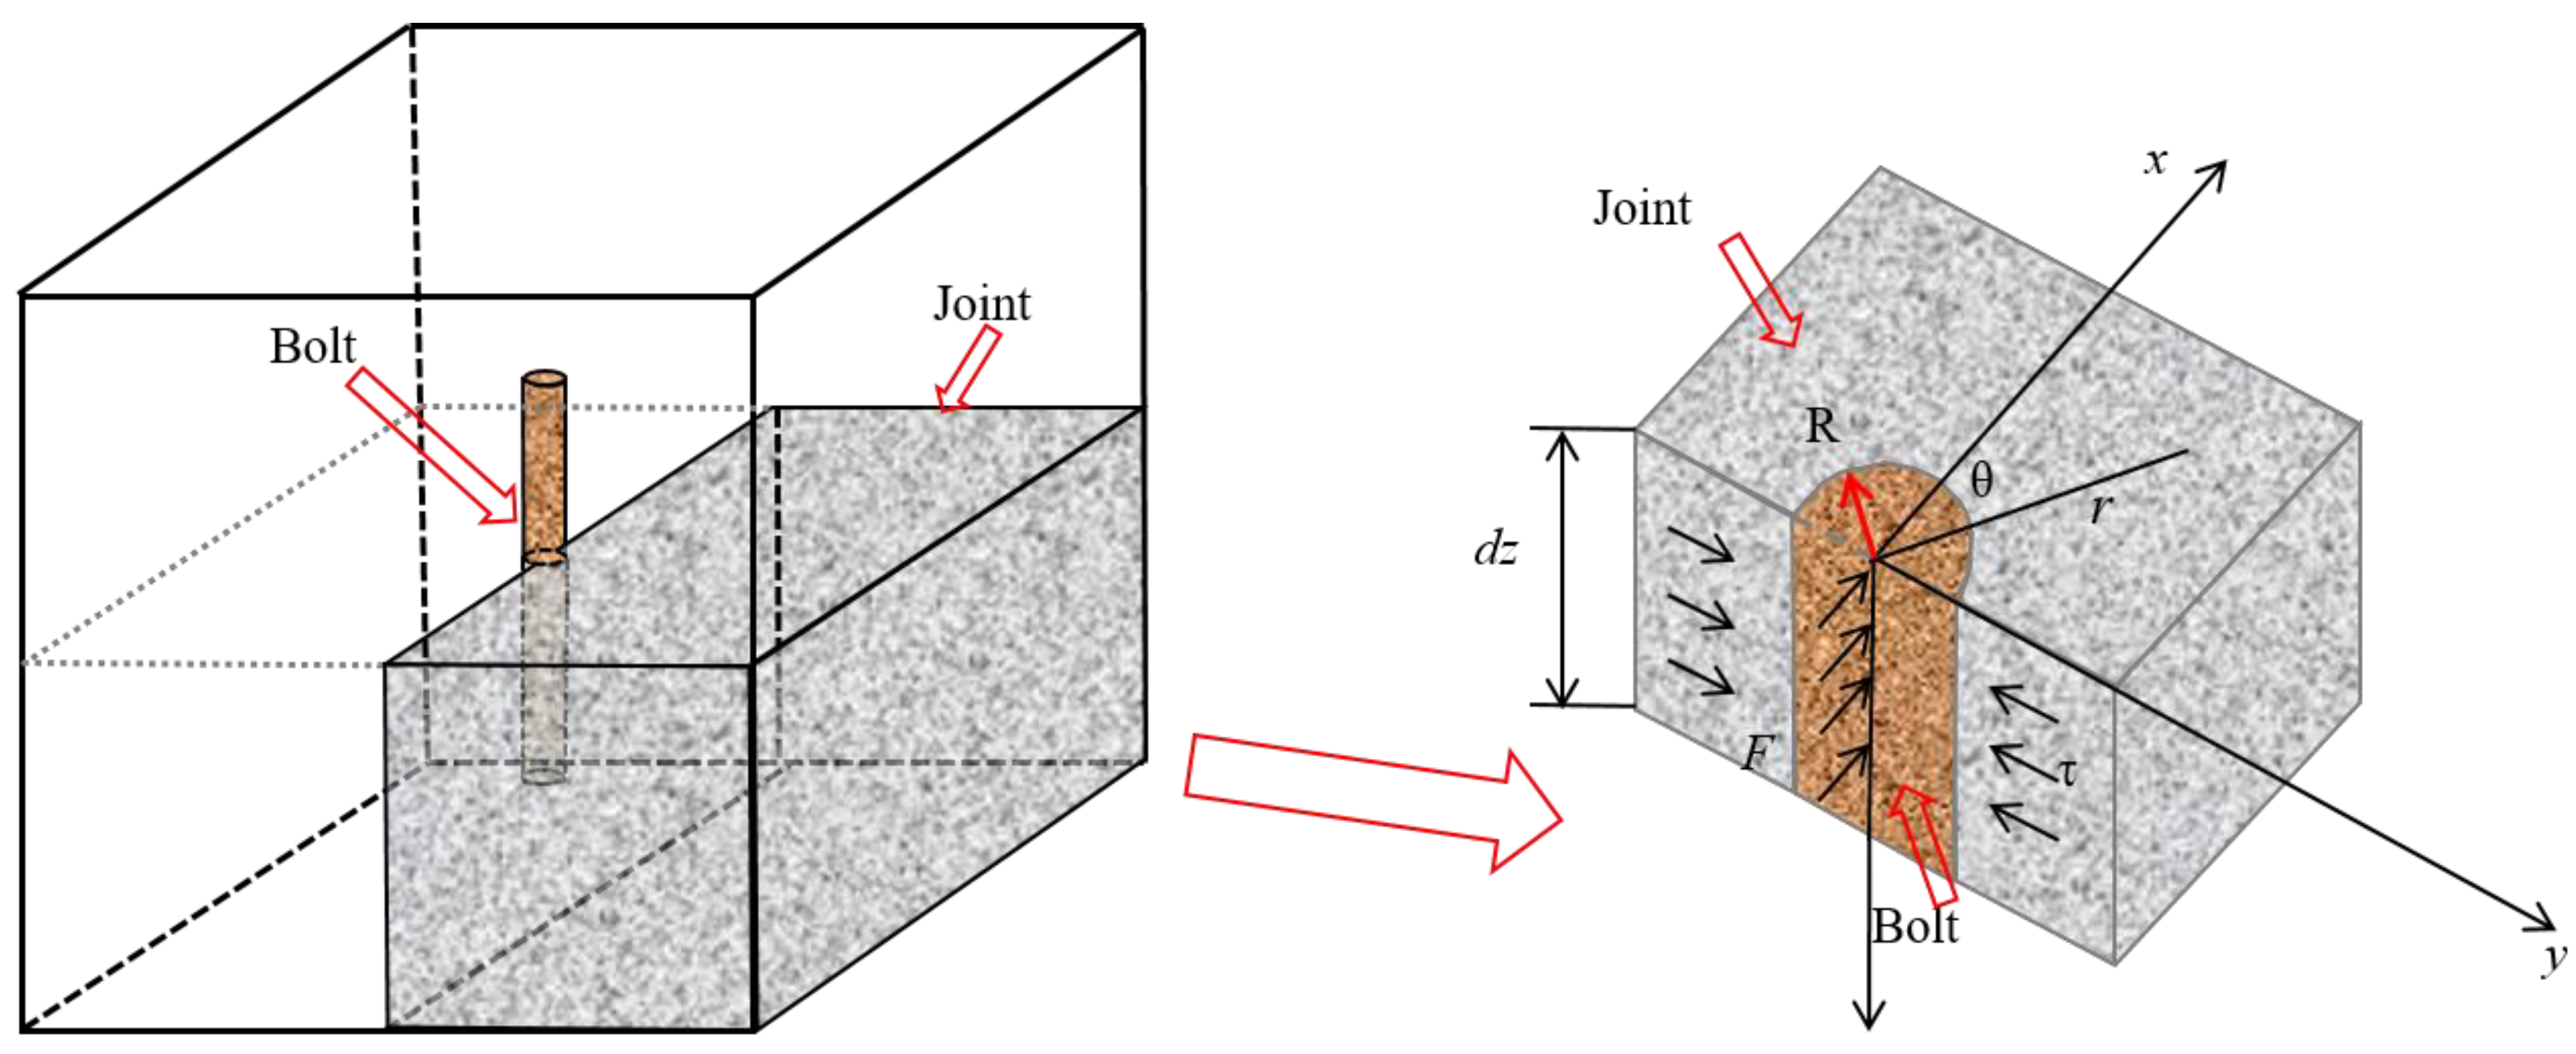
2. Deformation Characteristics of Rock Joint

2.1. Basic Equations

As shown in Figure 2, the bolted rock joint at the compression-shear side was taken as the research object, and its dimensions in x and y directions are much larger than those in the z direction. Thus, rock joints at the compression-shear side can be regarded as an infinite plane, and the bolt can be considered as a rigid disk in the infinite plane. According to the stress analysis of the bolted rock joint, in addition to the impact of the shear force F on the bolt on plane x = 0 in Figure 2, shear stress also exists on the surface of the rock block. Therefore, the basic equation of the bolted rock joint in polar coordinates (excluding body force) is
{ σ r r + 1 r τ r θ θ + σ r σ θ r = 0 1 r σ θ θ + τ r θ r + 2 τ r θ r = 0
In the formula, r is the radial distance between the point and bolt center, mm; σr, σθ, and τ are, respectively, the radial normal stress, tangential normal stress, and shear stress of rock joints in polar coordinates, MPa. They are all unknowns, and the conditions of geometry and physics must be applied to solve them.
The geometric relationship between the displacement and strain in polar coordinates can be expressed as
{ ε r = u r r ε θ = u r r + 1 r u θ θ γ r θ = 1 r u r θ + u θ r u θ r
where ur and uθ are, respectively, the radial and circumferential displacements of rock joints, mm. εr, Ɛθ, and γ are the radial strain, circumferential strain, and shear strain of rock joints, respectively.
Considering that the size of the microunits on the bolted rock joint in x and y directions is much larger than that in the z direction, and the external forces received are parallel to the rock joint and uniformly distributed around the joint, it can be regarded as a plane stress problem. The stress–strain relationship in polar coordinates can be expressed as
{ ε r = ( σ r μ σ θ ) E ε θ = ( σ θ μ σ r ) E γ r θ = τ r θ G = 2 ( 1 + μ ) τ r θ E
where μ is the Poisson’s ratio of rock mass, E is the elastic modulus, and G is the shear modulus of rock.
The basic solution of the radial stress of rock joints at the compression-shear side can be deduced according to the Lame solution [32] in elastic mechanics, as shown in Figure 3 and Equation (4).
σ r = R 2 r 2 q 1 , σ θ = R 2 r 2 q 1
In Equation (4), R is the inner radius of the ring, r is the distance between any point on the ring and the center of the circle, and q1 is the internal pressure.
According to Equation (4) and Figure 1, we assume that the three stress components of rock mass are
{ σ r = R 2 r 2 F cos θ π r = R 2 F cos θ π r 3 σ θ = R 2 r 2 F cos θ π r = R 2 F cos θ π r 3 τ r θ = R 2 F sin θ π r 3
where R is the radius of the bolt, and F is the external force on the bolt. We substitute the expressions of σr, σθ, and τ in Equation (5) into Equation (1), respectively, and Equation (1) holds.
When the calculation point is located at the junction of the bolt and the rock joint, i.e., when r = R, the resultant force of the rock joint on half a circle should be equal to the force exerted on bolt F, i.e., the boundary condition is shown as Figure 4 and Equation (6). The negative sign represents the direction of the force pointing to the negative direction of the x axis:
π 2 π 2 σ r cos θ r d θ + π 2 π 2 τ r θ sin θ r d θ = F
Substituting the stress σr and τ expressions assumed by Equation (5) into the left side of Equation (6) and letting r = R in Equation (5) after integration, Equation (7) can be obtained.
π 2 π 2 R 2 π r 3 F cos 2 θ r d θ π 2 π 2 R 2 π r 3 F sin 2 θ r d θ = F π π 2 π 2 ( sin 2 θ + cos 2 θ ) d θ = F π ( π 2 + π 2 ) = F
The value on the right side of Equation (7) is equal to the value on the right side of Equation (6). Therefore, Equation (5) satisfies the condition that the stress of the contact part between the bolt and joint is equal. The stress solution given by Equation (5) can satisfy both Equations (1) and (6) of the stress boundary condition, that is, Equation (5) is the exact stress solution of the problem.

2.2. Elastic Solution of Displacement and Stress Distributions of Rock Joints

After the exact solutions of σr, σθ, and τ of the rock joint are obtained from Section 2.1, the strain can be deduced from the physical Equation (3) of the rock joint. Substituting the exact stress solution (Equation (5)) into physical Equation (3), we obtain
{ ε r = R 2 F cos θ 2 π G r 3 ε θ = R 2 F cos θ 2 π G r 3 γ r θ = R 2 F sin θ π G r 3
According to the geometric Equations (2) and (8), Equation (9) can be obtained as follows:
{ ε r = u r r = R 2 F cos θ 2 π G r 3 ε θ = u r r + 1 r u θ θ = R 2 F cos θ 2 π G r 3 γ θ r = 1 r u r θ + u θ r u θ r = R 2 F sin θ π G r 3
From the integral of the expression (9) εr, the radial displacement ur of the compressive-shear side rock joint can be obtained as
u r = R 2 F cos θ 4 π G r 2 + f 1 ( θ )
where f1(θ) is a function of θ. Substituting Equation (10) into the second expression of Equation (9) (εθ) yields
u θ θ = R 2 F cos θ 4 π G r 2 f 1 ( θ )
According to the aforementioned integral, the displacement uθ of the rock joint at the compression-shear side along the polar angle can be expressed as
u θ = R 2 F sin θ 4 π G r 2 f 1 ( θ ) d θ + f 2 ( r )
where f2(r) is a function of r and then substituting Equations (10) and (12) into Equation (9) and multiplying both sides by r yields
R 2 F sin θ 4 π G r 2 + d f 1 ( θ ) d θ R 2 F sin θ 2 π G r 2 + r d f 2 ( r ) d r R 2 F sin θ 4 π G r 2 + f 1 ( θ ) d θ f 2 ( r ) = R 2 F sin θ π G r 2
After sorting out Equation (13), we obtain
d f 1 ( θ ) d θ + f 1 ( θ ) d θ = 0
r d f 2 ( r ) d r f 2 ( r ) = 0
From Equation (14), we obtain
f 1 ( θ ) = m cos θ + n sin θ
where m and n are undetermined coefficients.
From Equation (15), we can obtain
f 2 ( r ) = λ r
where λ is the undetermined coefficient.
Substituting Equations (16) and (17) into Equations (10) and (12), we can obtain Equation (18), which is the displacement component of the joint on the compression-shear side expressed in polar coordinates in the bolted joint system. The three undetermined coefficients m, n, and λ have to be determined according to the boundary conditions of the specific problem:
{ u r = R 2 F cos θ 4 π G r 2 + m cos θ + n sin θ u θ = R 2 F sin θ 4 π G r 2 m sin θ + n cos θ + λ r
For the shear bolt in Figure 2, if the bolt on the rock joint, i.e., the rigid disk, is subjected to shear load, its displacement only occurs in the x direction and is 0 in the y direction such that
u = x 0 , v = 0
In the formula, u and v are displacements in the x and y directions, respectively, and x0 is the displacement of the bolt in the x direction and is the known value.
The displacement transformation relationship between the polar coordinate and Cartesian coordinate systems can be expressed as
{ u r = u cos θ + v sin θ u θ = u sin θ + v cos θ
According to Equation (20), the displacement of the disc, namely the bolt, in the polar coordinate system can be written as
{ u r D = x 0 cos θ u θ D = x 0 sin θ
Then, according to the deformation coordination condition of the rock joint and bolt (displacement continuity condition of the rigid disk and the rock joint), that is, when r = R and urD = ur, and combining Equation (18) with (21), we obtain
x 0 cos θ = F cos θ 4 π G + m cos θ + n sin θ
Observing both sides of the Equation (22), we have the following result:
n = 0 , m = x 0 F 4 π G
According to classical elastic theory, the contact boundary between the compression-shear side rock joint and bolt should be in a state of “complete contact,” that is, neither disengage from each other nor slide relative to each other. In this case, the displacement on the contact boundary should be equal. In addition, the model is symmetric about the x axis, so the toroidal displacement on the contact boundary is zero, that is, uθ|θ=0 = 0. Combining the expression of uθ (Equation (18)) with Equation (23), λ = 0 can be obtained. Substituting Equation (23) and λ = 0 into the ur expression of Equation (18), the ur expression can be expressed as follows:
u r = [ x 0 + F 4 π G ( R 2 r 2 1 ) ] cos θ
Equation (24) is the analytical model established in this study for the radial distribution of displacements at the compression-shear side of the bolted rock joint in polar coordinates.

2.3. Analysis of Calculation Examples

The compressive strength of a certain granite is 250 MPa; E, μ, G are 2 × 10⁴ MPa, 0.2, 8.3 × 10³ MPa, respectively [33]. For the granite bolted joint, the radius of the bolt R is 5 mm, the uniform load F is 5.2 × 10⁵ N/mm, and the overall displacement x0 is 5.4 mm at the interface between the bolt and the granite. By putting the preceding test data into Equation (24), we can obtain the analytical solution of the compression-shear side displacement along the radial distribution of the bolted rock joint as follows:
u r = [ 5.4 + 15.663 π ( 25 r 2 1 ) ] cos θ
Figure 5a shows the variation of ur with distance r at different angles θ. As shown in Figure 5a, the value of ur at different θ decreases with the increase of r. When r varies in the range of 5–30 mm (R~6R), the decrease trend of ur with r is very obvious, from 5.40 mm (0°), 4.68 mm (30°), 3.82 mm (45°), 2.70 mm (60°) plunged to 0.55 mm (0°), 0.48 mm (30°), 0.39 mm (45°), 0.28 mm (60°), respectively, and an 89.8% drop of the initial radial displacement can be observed. When r is greater than 30 mm, the change of ur tends to be gentle with the increase of r. Figure 5b shows the change rate of ur with the increase of r, in which the rate of change goes to 0 after r is greater than 6R. Therefore, when the value of r is greater than six times the radius of the bolt (i.e., 6R, 30 mm), the bolt basically does not have any influence on the rock joint at the compression shear side, i.e., the influence distance of the bolt on the rock joint at the compression shear side is approximately 6R.
When r equals 6R, by comparing the value of ur corresponding to θ in Figure 5a (0°, 30°, 45° and 60°), we can see that the maximum radial displacement urmax is 0.55 mm. The determination of this value is significant for the analysis of the mechanical properties of bolted rock joints. This radial displacement only accounts for 10.2% of the initial radial displacement u0 (5.40 mm). Assuming that the radial displacement at any point of the bolted rock joint is smaller than 0.55 mm, that is, the ratio to the initial radial displacement u0 is smaller than 10.2%, we can consider that the bolt has few influences on the rock joint at this point. According to the preceding assumptions, when ur is 0.55 mm, θ is 0°, 15°, 30°, 45°, 60°, 75°, the corresponding r is 30.00, 28.13, 23.69, 18.45, 13.46, and 8.53, respectively (Figure 6 gives these points), and the adjacent points are connected. Based on this, the action range diagram of the bolt at the compression-shear side of the rock joint can be drawn, as shown in Figure 6. The figure shown in the red curve in Figure 6 approximates an ellipse, and the radial displacements of all points inside the ellipse are greater than 0.55 mm, which means that the rock joint within the ellipse region can be significantly affected by the bolt.

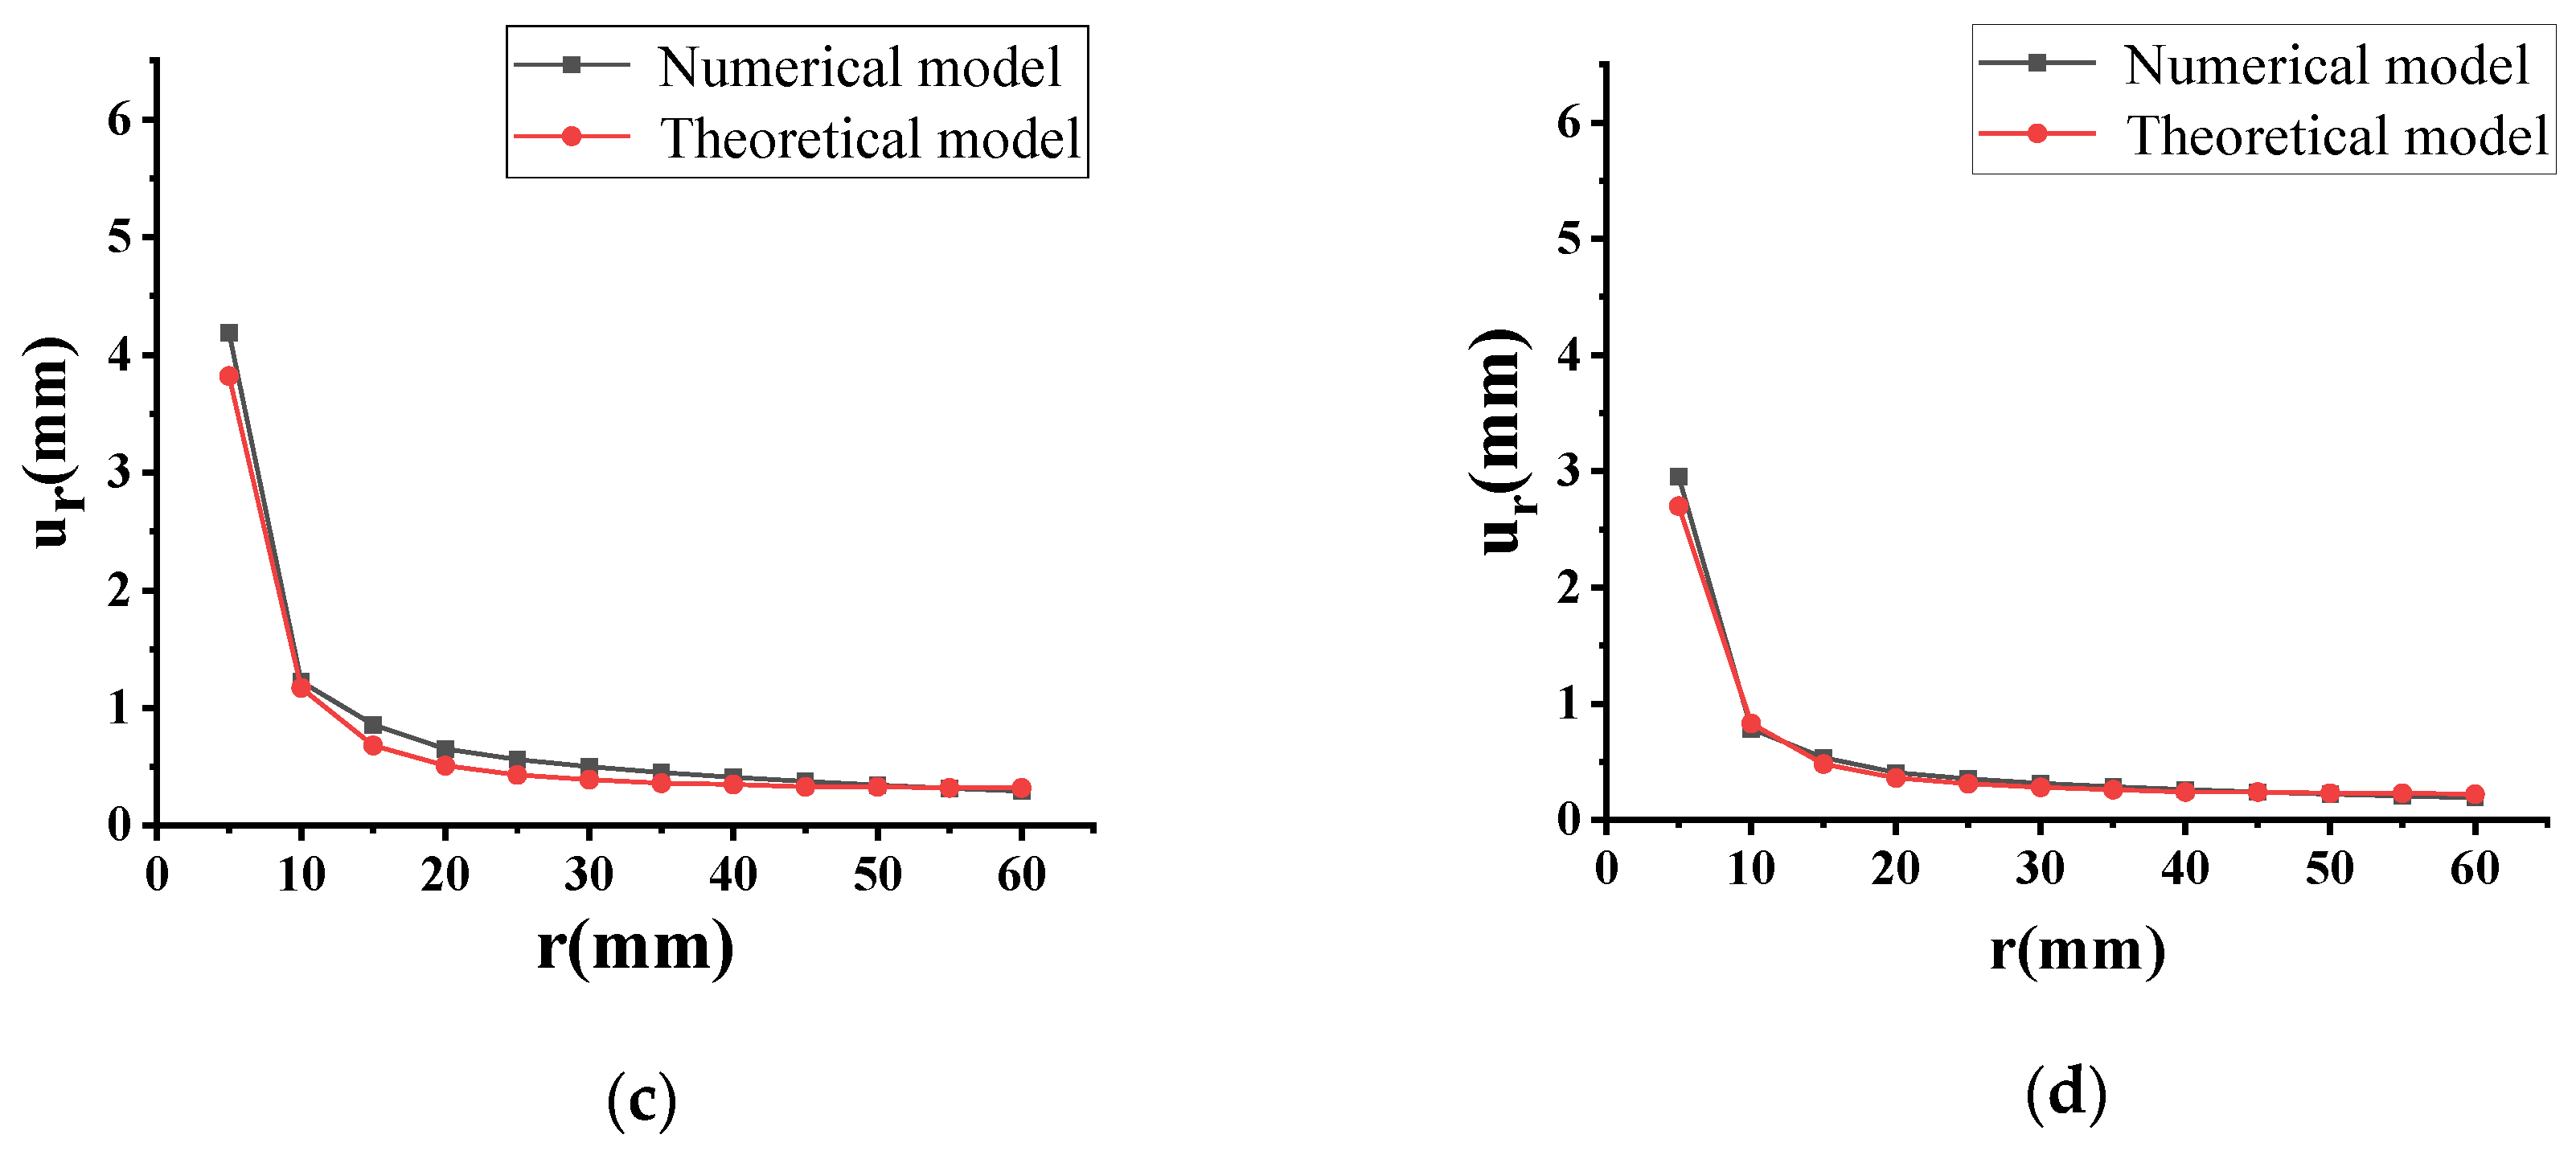
3. Numerical Simulation Verification

3.1. Numerical Calculation Model

In this study, a numerical calculation method in FLAC3D was adopted to verify the correctness of the model (Equation (24)). The numerical model could simulate the stress and deformation response of rock materials under external force, and the radial displacement of the bolted rock joint in the shear test could be directly observed to determine the influence range of the bolt on the rock joint. Considering that the preliminary modeling in FLAC3D was relatively complex, this study intended to combine the convenience of Rhino modeling to establish the meshed numerical model and then import it into FLAC3D for calculation [34], as shown in Figure 7. The size of the model is 150 mm × 300 mm × 0.5 mm, and a total of 3973 tetrahedral elements and 8052 nodes are included. The section area of the bolt only accounted for 0.08% of the entire area of the model, and normal velocity limitation was adopted as a boundary condition on both the bottom and right sides. The radius of the bolt was set to 5 mm, the point load P of 1.3 × 10⁵ N was applied to the bolt element, and the change of ur was observed by using the self-programmed FISH program. As this study aimed to solve the stress–strain elastic solution of the bolted rock joint at the compression-shear side, both rock mass and bolt adopt elastic. An interface contact unit in FLAC3D was applied to the contact between the rock mass and bolt, and cohesion c and the angle of internal friction ψ are equal to 0.3 MPa and 41.5°, respectively. The mechanical parameters of the rock block refer to the calculation examples in Section 2.3. That is, the elastic modulus Er, Poisson’s ratio u, and compressive strength σ are equal to 2 × 10⁴ MPa, 0.2, and 250 MPa, respectively. The mechanical parameters of the bolt [33] are shown in Table 1. It is assumed that the rock mass is in the elastic stage without plastic failure during the whole process.

3.2. Comparative Analysis between Theoretical and Numerical Models

The radial displacements of 12 points within r = 5 mm–60 mm at different angles were calculated by FLAC3D, referring to Figure 5a for the specific positions of these 12 points. The curves of ur and r were obtained, as shown in Figure 8. As seen in Figure 8, ur gradually decreased as r increased, and the decreasing rate was smaller. When r equals 6R, the radial displacement was 0.79 mm (taking the point in the direction of θ = 0°), accounting for 13.3% of the radial displacement at r = R, which was also close to 10.2% of the theoretical model in Equation (24), which proved the accuracy of the model in this study.
We can infer from Equation (24) that ur would be generated when the rock joint was constrained by the bolt under shear load. Points with the same value of ur were found and connected to a curve to obtain the influence range diagram of the bolts. In this section, we used FLAC3D to calculate the value of ur, and the point where the radial displacement ur was equal to 0.55mm was extracted (marked with a red dotted line in Figure 9a) and imported into Origin to draw the influence range diagram of the bolt at the compression-shear joints, as shown in Figure 9b. The bolt was located at the origin of coordinates. Compared with the influence range diagram (Figure 6) derived by the model established in this study, the shapes of the two were basically the same, both an ellipse, which also further verified the correctness of the model established in this study.
It should be pointed out that the elastic solution of the radial displacement distribution of the bolted joint was derived. However, the rock mass may be in a plastic state after an external disturbance and the stress state will be different in practical engineering. At the same time, this paper only considers the effect of a single bolt on the rock mass, and the bolt is perpendicular to the joint, which is special. However, the research results are indeed helpful for a preliminary understanding of the deformation characteristics of the bolted joint. Therefore, the authors will discuss the deformation characteristics of the bolted joint in the plastic state and explore the influence of different numbers and sizes of bolts on the bolted joint in future research.

4. Analysis and Discussion

4.1. Influence of Elastic Modulus of Rock Er on Radial Displacement ur of Joint

By keeping the radius R and elastic modulus Eb of the bolt unchanged, the relationship between the influence range of the bolt at the compression-shear rock joints and Er is explored. As shown in Figure 10, with the increase of Er, ur at the same point decreases continuously. In this study, the points where r equals 4R, 5R, 6R, 7R are extracted, corresponding to Figure 10a–d, respectively, showing significant nonlinear characteristics. Then, the exponential function, logarithmic function, and power function were used to fit the calculated results. We found that the exponential function fitted the calculated results well, and the correlation coefficients were 0.99955, 0.99952, 0.99946, and 0.99941, respectively. Therefore, the following exponential model was established to fit the calculated results:
u r = A e B E 0 + C ,
where A, B, and C are constants, and E0 (2 × 10⁴ MPa) is the initial elastic modulus of rock in this example.
As shown in Figure 10, ur changes greatly around 0.5E0–E0 and then gradually slows down. We believe that as Er increases, its ability to resist deformation increases, and greater stress is required for the joint to produce the same elastic deformation. However, the shear effect on the bolt is constant, and therefore, the larger the Er is, the smaller the value of ur. With the increase of Er, the influence range of the bolt at the compression-shear side rock joint is correspondingly reduced.

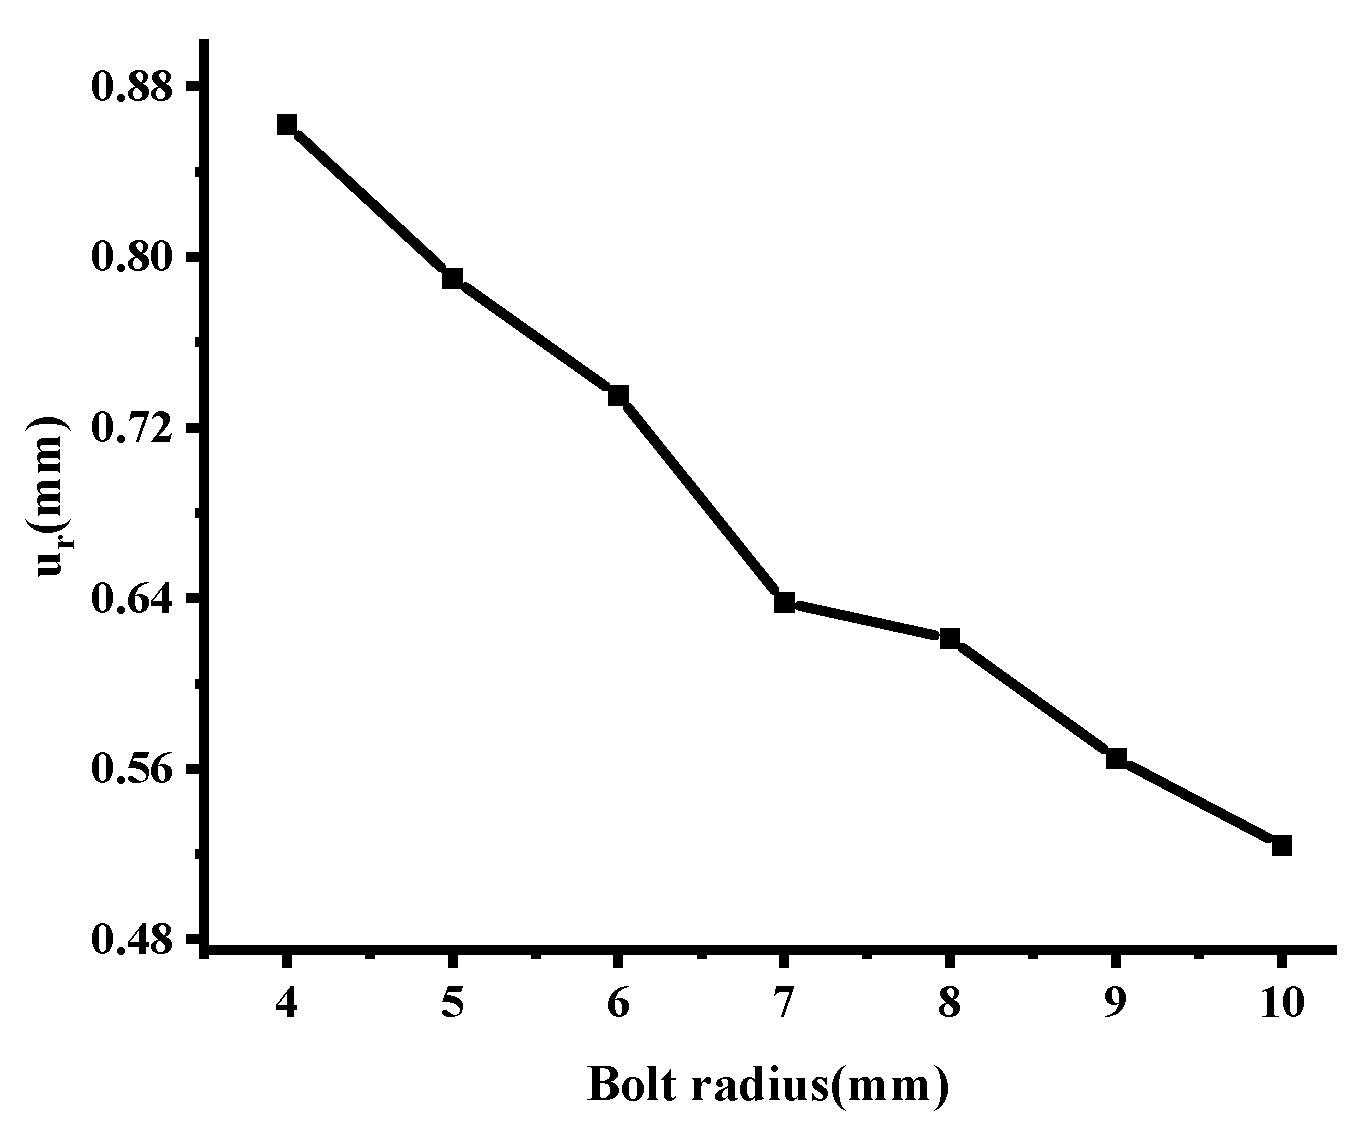
4.2. Influence of Bolt Radius Rb on Radial Displacement ur of Joint

To investigate the influence of the bolt radius Rb on the radial displacement ur of the rock joint at the compression-shear side, the value of Rb was set as 4, 5, 6, 7, 8, 9, and 10 mm, respectively, ensuring that Eb and Er did not change. Figure 11 shows the change of ur when Rb increases continuously. Overall, the curve showed a trend of decline, but when Rb increased from 6 mm to 7 mm, ur had a sudden drop, and then the decrease was roughly the same. This study argues that, in this example, the bolt radius Rb (7 mm) is the optimal bolt radius of this model. This test also indicates that in engineering practice, for a particular rock, the economic benefit does not always increase with the increase of bolt radius, so a bolt of appropriate size should be selected to reinforce the rock.

4.3. Influence of Elastic Modulus of Bolt Eb on Radial Displacement ur of Joint

To study the influence of the bolt elastic modulus Eb on the radial displacement ur of bolted joints, six groups of different numerical tests were conducted. The elastic modulus of each group of bolts is shown in Table 2, and Er and Rb remain unchanged. The variation law of ur with the change of Eb could be obtained from Figure 12. ur (r = 6R in this study) decreased first and then tended to be stable with the increase of Eb. According to Figure 12, when Eb was less than or approximately equal to the Er, which was 2 × 10⁴ MPa in this example, the curve showed an obvious downward trend. However, when Eb was greater than Er, the decline speed of the curve decreased. As Eb continued to increase, no significant change occurred in the value of ur. This test also suggested that appropriate bolts should be selected for reinforcement according to the specific mechanical properties of the reinforced rock when strengthening rock mass in engineering practice. Otherwise, the bolt will not be fully utilized, causing unnecessary economic losses.

5. Conclusions

The theoretical model derived in this study focuses on the analysis of the displacement and stress distribution of the bolted joint, which enriches the quantitative research of the joint. At the same time, the elastic modulus of the joint and the bolt and the influence of the radius of the bolt on the displacement and stress distribution of the joint at the compression-shear side were analyzed. The conclusions are as follows:
(1) The influence range of the bolt on the compression-shear side rock joint is approximately an ellipse, and the long axis of the ellipse is equal to the influence distance of the bolt at the compression-shear side rock joint, which is approximately six times the radius of the bolt in the example.
(2) The farther away from the bolt, the smaller the radial displacement of the rock joint at the compression-shear side due to the shearing action. With the continuous increase in the distance, the decreasing rate of the radial displacement becomes slower.
(3) As the elastic modulus of rock increases, the radial displacement of the rock joint at the compression-shear side decreases, that is, the influence range of the bolt decreases. In addition, when the elastic modulus of rock remains unchanged, the reinforcement performance of the bolt does not always increase with the increase in the elastic modulus and the bolt radius.

Author Contributions

Data curation, Y.C.; Formal analysis, B.L.; Investigation, B.L., H.L. and Y.C.; Methodology, H.L. All authors have read and agreed to the published version of the manuscript.

Funding

Project (2020JJ5715) supported by the Hunan Provincial Natural Science Foundation of China; Hunan provincial key research and development Program (2022SK2082); Projects (51774322, 52104110) supported by National Natural Science Foundation of China; Science and Technology Project of Hunan Natural Resources Department (2021-52); Hunan Civil Air Defense Research Project (HNRFKJ-2021-07).

Data Availability Statement

The data used to support the findings of this study are available from the corresponding author upon request.

Acknowledgments

This paper received its funding from Project (2020JJ5715) supported by the Hunan Provincial Natural Science Foundation of China; Hunan provincial key research and development Program(2022SK2082); Projects (51774322, 52104110) supported by National Natural Science Foundation of China; Science and Technology Project of Hunan Natural Resources Department (2021-52); Hunan Civil Air Defense Research Project (HNRFKJ-2021-07). The authors wish to acknowledge these supports.

Conflicts of Interest

The authors declare no conflict of interest.

References

  1. Rios-Bayona, F.; Johansson, F.; Mas-Ivars, D. Prediction of Peak Shear Strength of Natural, Unfilled Rock Joints Accounting for Matedness Based on Measured Aperture. Rock Mech. Rock Eng. 2021, 54, 1533–1550. [Google Scholar] [CrossRef]
  2. Lin, Q.B.; Cao, P.; Wen, G.P.; Meng, J.J.; Cao, R.H.; Zhao, Z.Y. Crack coalescence in rock-like specimens with two dissimilar layers and pre-existing double parallel joints under uniaxial compression. Int. J. Rock Mech. Min. Sci. 2021, 139, 104621. [Google Scholar] [CrossRef]
  3. Du, S.G.; Lin, H.; Yong, R.; Liu, G.J. Characterization of Joint Roughness Heterogeneity and Its Application in Representative Sample Investigations. Rock Mech. Rock Eng. 2022. [Google Scholar] [CrossRef]
  4. Chen, Y.F.; Lin, H.; Ding, X.R.; Xie, S.J. Scale effect of shear mechanical properties of non-penetrating horizontal rock-like joints. Environ. Earth Sci. 2021, 80, 192. [Google Scholar] [CrossRef]
  5. Zhao, Y.L.; Zhang, L.Y.; Asce, F.; Wang, W.J.; Cheng, G.M. Experimental Study on Shear Behavior and a Revised Shear Strength Model for Infilled Rock Joints. Int. J. Geomech. 2020, 20, 04020141. [Google Scholar] [CrossRef]
  6. Zhao, Y.L.; Zhang, C.S.; Wang, Y.X.; Lin, H. Shear-related roughness classification and strength model of natural rock joint based on fuzzy comprehensive evaluation. Int. J. Rock Mech. Min. Sci. 2021, 137, 104550. [Google Scholar] [CrossRef]
  7. Xie, S.; Lin, H.; Cheng, C.; Chen, Y.; Wang, Y.; Zhao, Y.; Yong, W. Shear strength model of joints based on Gaussian smoothing method and macro-micro roughness. Comput. Geotech. 2022, 143, 104605. [Google Scholar] [CrossRef]
  8. Wang, F.; Cao, P.; Cao, R.; Gao, Q.; Xiong, X.; Wang, Z. Influence of parallel joint interaction on mechanical behavior of jointed rock mass. J. Cent. South Univ. 2018, 49, 2498–2507. [Google Scholar]
  9. Srivastava, L.P.; Singh, M. Effect of Fully Grouted Passive Bolts on Joint Shear Strength Parameters in a Blocky Mass. Rock Mech. Rock Eng. 2015, 48, 1197–1206. [Google Scholar] [CrossRef]
  10. Thompson, A.G.; Villaescusa, E.; Windsor, C.R. Ground Support Terminology and Classification: An Update. Geotech. Geol. Eng. 2012, 30, 553–580. [Google Scholar] [CrossRef]
  11. Yu, C. Experimental study and stress analysis of rock bolt anchorage performance. Chin. J. Rock Mech. Eng. 2014, 6, 428–437. [Google Scholar]
  12. Li, X.W.; Yang, G.Y.; Nemcik, J.; Mirzaghorbanali, A.; Aziz, N. Numerical investigation of the shear behaviour of a cable bolt in single shear test. Tunn. Undergr. Space Technol. 2019, 84, 227–236. [Google Scholar] [CrossRef]
  13. Lin, H.; Sun, P.H.; Chen, Y.F.; Zhu, Y.Y.; Fan, X.; Zhao, Y.L. Analytical and experimental analysis of the shear strength of bolted saw-tooth joints. Eur. J. Environ. Civ. Eng. 2022, 26, 1639–1653. [Google Scholar] [CrossRef]
  14. Martín, L.B.; Tijani, M.; Hadj-Hassen, F.; Noiret, A. Assessment of the bolt-grout interface behaviourof fully grouted rockbolts from laboratory experiments under axial loads. Int. J. Rock Mech. Min. Sci. 2013, 63, 50–61. [Google Scholar] [CrossRef]
  15. Grasselli, G. 3D Behaviour of bolted rock joints: Experimental and numerical study. Int. J. Rock Mech. Min. Sci. 2005, 42, 13–24. [Google Scholar] [CrossRef]
  16. Jalalifar, H.; Aziz, N.; Hadi, M. The effect of surface profile, rock strength and pretension load on bending behaviour of fully grouted bolts. Geotech. Geol. Eng. 2006, 24, 1203–1227. [Google Scholar] [CrossRef]
  17. Li, X.; Aziz, N.; Mirzaghorbanali, A.; Nemcik, J. Behavior of Fiber Glass Bolts, Rock Bolts and Cable Bolts in Shear. Rock Mech. Rock Eng. 2016, 49, 2723–2735. [Google Scholar] [CrossRef]
  18. Chen, Y.; Li, C.C. Performance of fully encapsulated rebar bolts and D-Bolts under combined pull-and-shear loading. Tunn. Undergr. Space Technol. 2015, 45, 99–106. [Google Scholar] [CrossRef]
  19. Wu, X.Z.; Jiang, Y.J.; Gong, B.; Deng, T.; Guan, Z.C. Behaviour of rock joint reinforced by energy-absorbing rock bolt under cyclic shear loading condition. Int. J. Rock Mech. Min. Sci. 2018, 110, 88–96. [Google Scholar] [CrossRef]
  20. Wu, X.; Jiang, Y.; Gong, B.; Guan, Z.; Deng, T. Shear Performance of Rock Joint Reinforced by Fully Encapsulated Rock Bolt Under Cyclic Loading Condition. Rock Mech. Rock Eng. 2019, 52, 2681–2690. [Google Scholar] [CrossRef]
  21. Tistel, J.; Grimstad, G.; Eiksund, G. Testing and modeling of cyclically loaded rock anchors. J. Rock Mech. Geotech. Eng. 2017, 9, 1010–1030. [Google Scholar] [CrossRef]
  22. Li, C.C. Field Observations of Rock Bolts in High Stress Rock Masses. Rock Mech. Rock Eng. 2010, 43, 491–496. [Google Scholar] [CrossRef]
  23. Kang, H.; Wu, Y.; Gao, F.; Lin, J.; Jiang, P. Fracture characteristics in rock bolts in underground coal mine roadways. Int. J. Rock Mech. Min. Sci. 2013, 62, 105–112. [Google Scholar] [CrossRef]
  24. Xiao, S.J.; Chen, C.F. Mechanical mechanism analysis of tension type anchor based on shear displacement method. J. Cent. South Univ. Technol. 2008, 15, 106–111. [Google Scholar] [CrossRef]
  25. Ren, F.F.; Yang, Z.J.; Chen, J.F.; Chen, W.W. An analytical analysis of the full-range behaviour of grouted rockbolts based on a tri-linear bond-slip model. Constr. Build. Mater. 2010, 24, 361–370. [Google Scholar] [CrossRef]
  26. Martin, L.B.; Tijani, M.; Hadj-Hassen, F. A new analytical solution to the mechanical behaviour of fully grouted rockbolts subjected to pull-out tests. Constr. Build. Mater. 2011, 25, 749–755. [Google Scholar] [CrossRef] [Green Version]
  27. Chen, Y.; Wen, G.P.; Hu, J.H. Analysis of Deformation Characteristics of Fully Grouted Rock Bolts Under Pull-and-Shear Loading. Rock Mech. Rock Eng. 2020, 53, 2981–2993. [Google Scholar] [CrossRef]
  28. Ma, S.; Nemcik, J.; Aziz, N. An analytical model of fully grouted rock bolts subjected to tensile load. Constr. Build. Mater. 2013, 49, 519–526. [Google Scholar] [CrossRef]
  29. Cao, C.; Ren, T.; Cook, C.; Cao, Y. Analytical approach in optimising selection of rebar bolts in preventing rock bolting failure. Int. J. Rock Mech. Min. Sci. 2014, 72, 16–25. [Google Scholar] [CrossRef]
  30. Liu, C.H.; Li, Y.Z. Analytical Study of the Mechanical Behavior of Fully Grouted Bolts in Bedding Rock Slopes. Rock Mech. Rock Eng. 2017, 50, 2413–2423. [Google Scholar] [CrossRef]
  31. Veisi, H.; Kordkheili, S.A.H.; Toozandehjani, H. Progressive bearing failure modeling of composites with double-bolted joints at mesoscale level. Arch. Appl. Mech. 2014, 84, 657–669. [Google Scholar] [CrossRef]
  32. Xu, Z.L. A Concise Course in Elasticity; Higher Education Press: Beijing, China, 2013. [Google Scholar]
  33. Li, J.L. Rock Mechanics, 1st ed.; Chongqing University Press: Chongqing, China, 2014; p. 318. [Google Scholar]
  34. Tang, W.; Lin, H. Influence of dentate discontinuity height on shear properties of soft structure plane. J. Cent. South Univ. 2017, 48, 1300–1307. [Google Scholar]
Figure 1. Analysis process.
Applsci 12 05226 g001
Figure 2. Calculation model of bolted rock joints.
Applsci 12 05226 g002
Figure 3. Classic Ca.
Applsci 12 05226 g003
Figure 4. Microelement.
Applsci 12 05226 g004
Figure 5. Variation of ur in radial displacement. (a) Radial displacements at different distances. (b) Radial displacement decreases with radius.
Applsci 12 05226 g005
Figure 6. Action range diagram of bolt under theoretical deduction.
Applsci 12 05226 g006
Figure 7. FLAC3D model of bolted rock joints at compression-shear side.
Applsci 12 05226 g007
Figure 8. Relation diagram of ur of numerical and theoretical models with r under different θ. (a) θ = 0°, (b) θ = 30°, (c) θ = 45°, (d) θ = 60°.
Applsci 12 05226 g008aApplsci 12 05226 g008b
Figure 9. Action range diagram of numerical simulation bolt. (a) FLAC3D simulation diagram. (b) Contour map.
Applsci 12 05226 g009aApplsci 12 05226 g009b
Figure 10. Relationship between rock mass elastic modulus and radial displacement. (a) r = 4R, (b) r = 5R, (c) r = 6R, (d) r = 7R.
Applsci 12 05226 g010
Figure 11. Relationship between bolt radius and radial displacement ur of rock joints.
Applsci 12 05226 g011
Figure 12. Relationship between bolt elastic modulus and ur.
Applsci 12 05226 g012
Table 1. Mechanical parameters of bolt.
Elastic Modulus E/MpaPoisson’s Ratio μBolt Radius/mmThe Compressive Strength/MpaTensile Strength/Mpa
5 × 1080.15400570
Table 2. Bolt number and elastic model parameters.
Bolt NumberElastic Modulus of Bolt/MPaBolt Radius/mmElastic Modulus of Rock Mass/MPa
15 × 10352 × 104
25 × 104
35 × 105
45 × 106
55 × 107
65 × 108
Publisher’s Note: MDPI stays neutral with regard to jurisdictional claims in published maps and institutional affiliations.

