1. Introduction
The latest report of the Intergovernmental Panel on Climate Change [
1] has stressed the necessity of decreasing carbon emissions to prevent rapid global warming. One mechanism able to decrease carbon emissions in the transportation sector is the utilization of electric vehicles. Therefore, the market share of electric vehicles (EVs) is gradually increasing. However, the high penetration of electric vehicles brings challenges for the electrical power sector, one being the necessary infrastructure to charge them [
2,
3,
4,
5].
The energy consumption of the increasing number of EVs during their charging sessions can significantly affect the operation of the power system [
2]. This issue can decrease the positive decarbonization effect of EVs in the transportation sector since the fossil fuel power plants are still vastly used for covering and balancing the demand [
3]. Furthermore, recent events in Europe emphasize even more the necessity of decreasing dependency on imported fossil fuels and their replacement with local renewable energy sources. However, these types of sources and their implementation have already brought many challenges to the power systems [
4].
The vehicle-to-grid (V2G) concept [
5] is presented as a tool for better integrating green technologies into the power systems. The V2G concept is also used in other transportation areas, e.g., in electric traction [
6,
7]. However, this work focuses on applying this concept in the area of personal electric cars. In this case, this concept is assumed to help decrease the high consumption of electric vehicles during their charging sessions and support the utilization of more renewable energy sources by providing ancillary services within the smart grids. However, for this concept to be successful, it cannot be forgotten that this type of service should be efficient and beneficial for both system operators and electric vehicle (EV) drivers [
8].
The environmental and technical aspects of this concept are well-researched [
9,
10]. From the technological point of view, research studies usually focus on the possibility of providing auxiliary services for the grid, such as frequency [
11,
12,
13,
14] or voltage regulations [
15,
16,
17,
18] by some defined fleet of electric vehicles. However, there is a lack of studies related to the prevention of overloading power lines or power transformers by the EVs charging [
9] and thus neglecting the negative impact of newly built charging stations on existing grid infrastructure.
To fill this gap, our paper presents the V2G algorithm in which the charging station is assumed to represent a small microgrid connected to the main grid, and we aim to decrease its impact (power demand) on the main grid. Reducing its demand from the main grid prevents overloading of the main grid’s power lines or transformers, avoiding additional costs for improving main grid infrastructure. Moreover, the adverse effect of the increasing EV penetration, such as higher demand in the main grid or peak demand shifts [
2,
19], is also prevented.
Many studies (e.g., [
20,
21,
22,
23]) assume renewable energy sources for the EV charging supply to decrease the carbon footprint of EVs, even in the power sector. The algorithms presented in these studies can be divided into two main categories: offline and online algorithms. The offline algorithms [
22,
23] can be significantly affected by the accuracy of the weather prediction, meaning sub-optimal solutions are present there. The disadvantage of the online algorithms [
20,
21] is their high computational cost, yet short-time weather predictions within a small-time window can be very accurate. Therefore, the solutions are very close to, if not exactly, optimal.
To support the decarbonization of EVs charging, the charging station microgrid presented in this paper is assumed to cover its demand with its own photovoltaic power plant. To minimize the error of solar irradiation prediction, an online V2G algorithm is proposed. Since the V2G algorithm is implemented solely within the microgrid consisting of one charging station, computational requirements are not high. Moreover, it allows easy real-time implementation of optimal or near-optimal solutions.
The scheduling of the charging or discharging of individual EVs within the fleet is usually determined by optimization algorithms, which range from linear optimization methods to more advanced methods with the utilization of AI [
24]. Despite well-studied optimization methods in the literature, most of these algorithms assume just the technical aspect of the V2G concept and study it just from the grid or system operator point of view [
9,
10]. It contrasts with the V2G concept definition, where the benefit of EV drivers is equally important as the one of the grid or system operators.
A few studies (e.g., [
8,
25,
26]) focus on EV drivers’ cost minimization. However, the authors of those studies usually assume one hundred percent enrollment in V2G services. Furthermore, the cost function of EV drivers in most studies is determined based on the authors’ assumptions and is not based on real empirical data [
10].
This paper aims to optimize the cost of the charging system operator as well as EV drivers and so maximize the social welfare of the whole system. Unlike previous studies, the cost of EV drivers is based on the utility function estimated from the carried stated preferences (SP) survey in this paper [
27,
28].
In our study, the EV drivers can choose what they prefer, and they can even opt for only the charging of their EV. This means that EV drivers must share their preferences with the system operator (in this case, the operator of the charging station). However, the EV drivers’ private information is limited to their preferences for charging and discharging, as well as the charges associated with a specific connection session.
Our previous study in [
29] shows that there is a possibility to disrupt the social welfare concept of the system by reporting false preferences by any of the participants. Therefore, an incentive mechanism ensuring that truth-telling is the optimal strategy for each participant must be added to the system. The study in [
30] proposes such a mechanism, though the control policy is defined for a longer period. This means that the participants cannot change during this period. To prevent this unrealistic scenario and create more real operations, our manuscript assumes control policy and incentives definition at each time step.
So, this paper is focused on presenting algorithms able to control the charging and discharging of EVs at charging stations equipped with a local photovoltaic power plant while ensuring the maximization of social welfare and demonstrating its properties. The contributions of our manuscript are fourfold:
the proposed system maximizes utilization of the photovoltaic (PV) power plant for the EV charging, and at the same time decreases the impact of the charging and PV on the main grid;
the empirical data from our previous work [
27] are used to represent the cost of the EV drivers;
the EV drivers can define what they prefer at each connection session;
the proposed incentive mechanism ensures the truth-telling and assures that participants tell the truth, resulting in the overall system’s social welfare.
The rest of the paper is organized as follows.
Section 2 briefly mentions related works.
Section 3 describes the models of the parts of the defined system, such as a model of a photovoltaic power plant, EVs’ charging and discharging model, and the definition of the cost functions of the EV drivers and charging station operator. Then,
Section 4 presents the charging station control algorithm and the incentives mechanism defined so that the truthful report of preferences is an optimal strategy for each EV driver. Finally,
Section 5 describes the simulation results of three study cases and shows that the defined control and incentives mechanisms ensure optimal operation of the systems.
Section 6 discusses the presented results and contribution of the research work.
Section 7 briefly concludes the paper and defines possibilities for future research.
2. Related Work
There have been many studies on the V2G concept since its introduction [
5]. Most of them focus primarily on the technical aspects of this concept. A study in [
11] defined a controller that for generation-consumption balance in a system utilizes a fleet of EVs. The application of the V2G concept in this study is very simplified since there are only three discrete possible charging rates: charging or discharging at a constant rate and idle. Authors in [
12] focus on frequency regulation in more detail. They presented an algorithm for primary and secondary frequency control using one or a group of five EVs and verified simulation results with the experiment. The results demonstrated the effectiveness of V2G-based frequency control. Unlike previous studies, the authors in [
13] also incorporate the uncertainty of EV availabilities.
A few studies also utilize the V2G concept in voltage regulation. A study in [
17] presented a charging and discharging coordination strategy considering transformer loading and bus voltage profiles. The application of the proposed system on the test network showed a reduction in voltage fluctuations.
In addition to decreasing the impact of EV charging on the electric grid, many studies deal with power supply from RES for charging stations in order to reduce the EVs’ charging carbon footprint. Authors in [
20] formulated a stochastic optimization problem for EV charging supplied from the time-varying renewable energy source. The study considers EVs’ charging requests as well as the intermittent character of the source. Researchers in [
21] also incorporated a discharge strategy to support mismatching between load and renewable energy generation.
Previous studies dealt with the technical aspect of the V2G concept. In a few studies, the electric grid or charging station costs are also considered along with technical limits. A study in [
31] defined optimal charging of electric vehicles by considering the microgrid’s cost for purchasing energy from the external grid. Researchers in [
32] presented a scheduling scheme for EV charging that minimizes electricity cost at the utility company while maximizing the payoff of charging stations within the grid.
However, for this concept to be successful, it needs to be accepted by EV drivers [
10]. Factors influencing acceptance of this concept by EV drivers in the Netherland were presented in [
8]. The study [
8] showed some reservations and caution regarding this concept caused mainly by range anxiety, battery degradation, or discomfort experienced by participation in such service. So lately, there have been an increasing number of studies that consider not just the technical limits but the cost minimization of EV drivers as well. Authors in [
25] focus on charging coordination that deals with the tradeoff between total generation cost and accumulated battery degradation cost. Researchers in [
33] studied the electric vehicle-based system, where vehicle control charging led to higher revenues for their owner. Similarly, a study in [
34] presents a mechanism that computes optimal charging schedules that maximize the social welfare of all users with their given preferences. However, both studies consider automatic enrollment of all participants.
Therefore, the authors in [
30] proposed an incentive mechanism that ensures that participation, as well as truth-telling, is an optimal strategy for each EV driver. However, the charging control policy is defined for a specific charging horizon, so the participants cannot vary at the charging terminal or change their preferences during this time.
To the best of our knowledge, no previous works have defined an online V2G algorithm that takes into account technical limits as well as cost functions of EV drivers and charging station operators with an incentive mechanism ensuring social welfare maximization. Further, in contrast to the work presented so far, in this paper, we represent a cost function of the EV drivers based on empirical data.
3. System Model
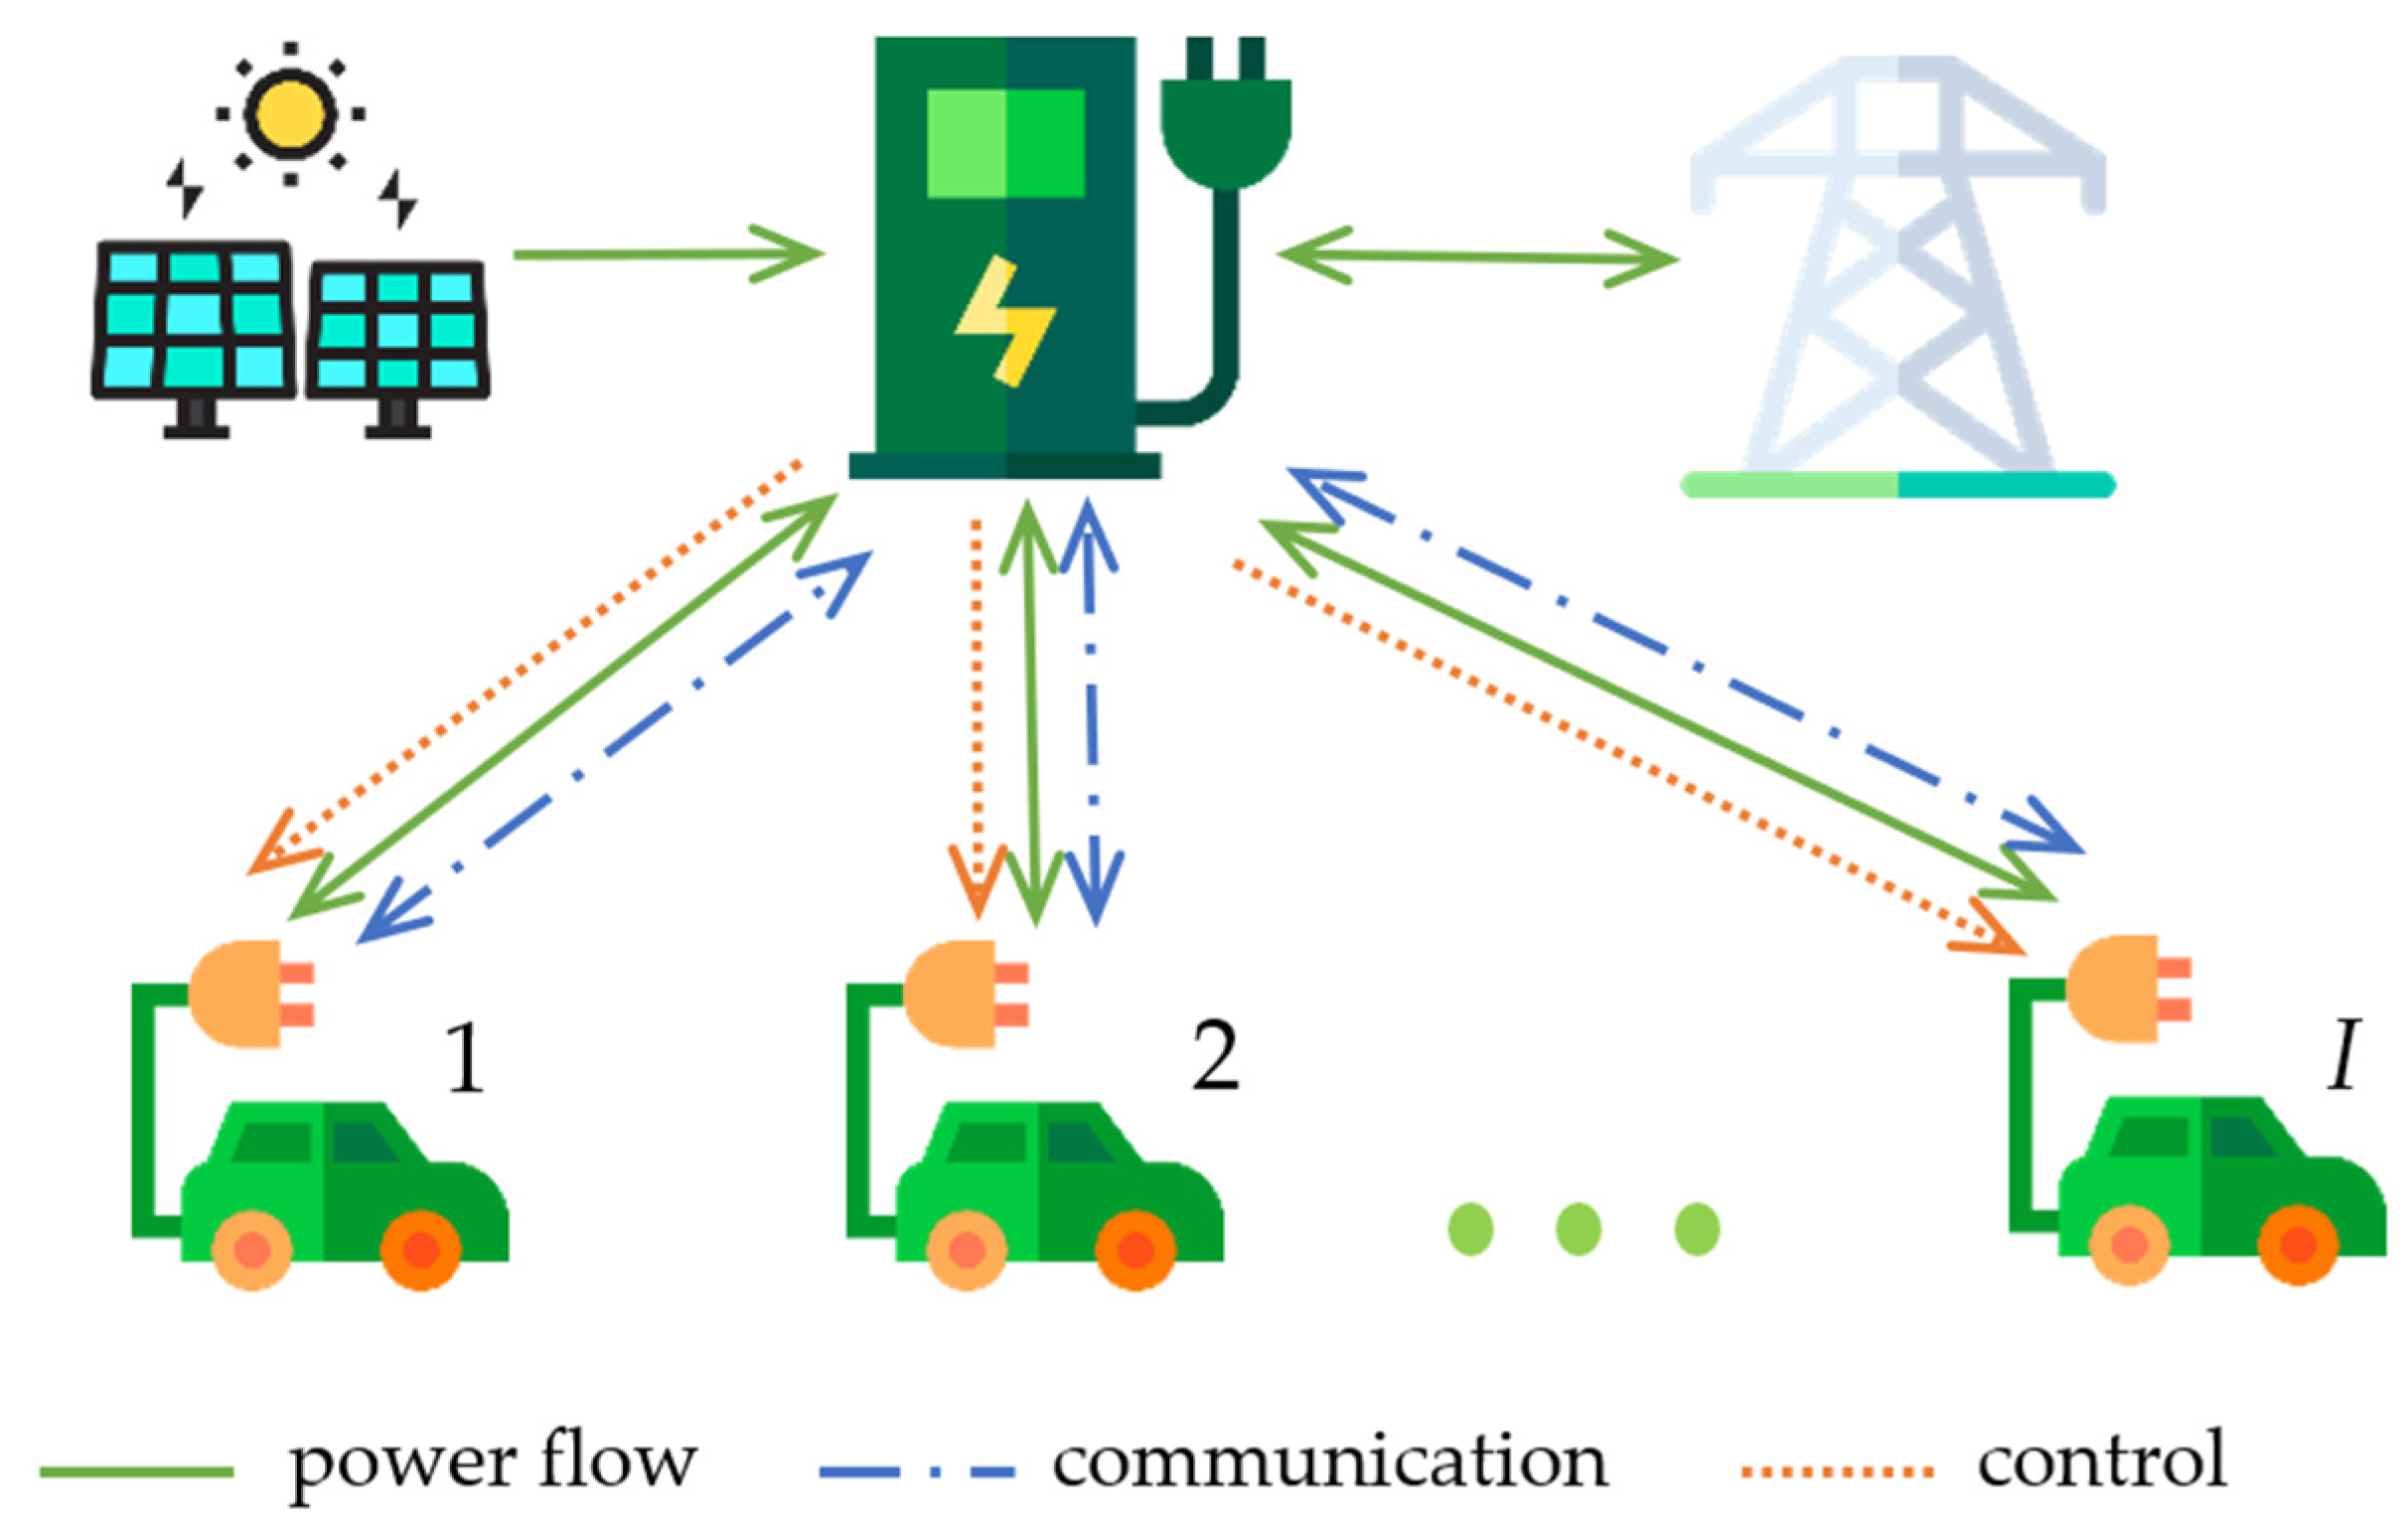
The defined control algorithm is designed for a system consisting of a general grid-connected charging station with a set
of charging terminals to which electric vehicles can be connected and a local renewable energy source represented by the photovoltaic power plant (
Figure 1) [
35].
Regarding the system, we assume that EVs connected to the charging station can charge as well as discharge their battery and that the charging station can control the operation mode (charging/discharging) as well as the amount of the power supplied to or drawn from the EVs.
We also consider that the discomfort of EV drivers can be quantized, and it is represented by the cost function of the EV drivers that is of common knowledge; however, their specific preferences are unknown. Furthermore, we assume that the EV drivers do not communicate with each other and that their preferences regarding charging and discharging are their private information.
The model of the system is assumed to be quasi-static time-varying. This means that the power flows at a constant rate at each step, though it may change throughout the different steps. The time steps for this model are also assumed to be of a unit length, which means that power and energy are interchangeable quantities within the model.
3.1. The Photovoltaic Power Plant Model
The charging station should have its own photovoltaic power plant for power supply. The output power of the power plant at time step
t is denoted as
and it is determined as [
35,
36]:
where
is a predicted output power of the power plant and
is a random forecast error. We assume that the mean value of the error
is known.
3.2. Model of Charging and Discharging of Electric Vehicles
For each EV connected to charging terminal
, we denote a charging and discharging rate at the time
t by
, respectively. Generally, the following applies for the charging and discharging rate at each time step
t [
30]:
where
is the maximum charging and discharging rate, respectively. In practice, the maximum charging and discharging rate are usually equal, i.e.,
.
The state of charge (SoC) trajectory for an EV connected to the
ith terminal denoted as
must at each time step
t satisfy [
29,
35]:
where
and
represent the minimal and maximal state of charge values, respectively. These values must be between 0 and 1 for each time step
t.
Then, simplified dynamics SoC trajectory can be represented as follows [
29]:
with
representing the battery capacity of a vehicle connected to the
ith terminal.
Assumption 1. EV connected to the ith terminal can be either charged or discharged at time step t [29]. The constraints for SoC in (4) can be then rewritten using (5) as constraints for charging and discharging rate at time t as follows [
29]:
Then, the set of charging feasible station actions for EV connected at the ith terminal (a set of feasible charging and discharging rates) at the time t can be defined as [
29]:
such that (2), (3), (6), (7) apply.
3.3. The Discomfort of EV Drivers
When determining the discomfort of EV drivers during charging or discharging sessions, it is necessary to define the attributes that affect the final discomfort experienced by the EV drivers during these operation modes. These attributes were determined from an SP survey in which the participants chose between charging and V2G services [
27,
28]. The statistically significant attributes influencing the decision of electric vehicle drivers between these alternatives were state of charge, measure of uncertainty, reward per 1 kWh of the sold energy, and the amount of required energy [
29].
In [
27], the price for charging was not statistically significant. However, it will be considered as a factor affecting the discomfort of EV drivers since the high
p-value of this parameter could be caused by the small sample in the survey. Despite the results in [
27,
28], the measure of uncertainty is not considered in the model since it is highly subjective, and sometimes EV drivers are unaware of or cannot quantify this measure. To simplify the cost function and decrease the amount of the required private information, the SoC and amount of energy required for discharging attributes are mixed and represented just by the change of the SoC during the charging or discharging session [
27,
28,
29].
Taking into account previous assumptions, the discomfort of the EV drivers connected to the
ith charging terminal at time
t is presented using the following cost function:
where
is the weight of the energy gain or drop in the battery of the vehicle connected to the
ith charging terminal,
is a parameter of the attribute price of charging (
and
is a weight of the reward for discharging (
) attribute. The signs in front of parameters are based on results in [
27,
28].
For shorter notation, the vector
is used to define the control policy of the charging station for EV connected to its
ith terminal and so:
where
is an integer variable defining the operation mode of the EV at the
ith charging station terminal (
charging,
discharging).
As mentioned above, it is assumed that the experienced discomfort of EV drivers represented by the cost function in (10) is known, but some parameters of this function representing preferences of EV drivers are privately held information of each EV driver. The preferences reported by the drivers are denoted as
, where:
Assumption 2. The cost function (10) of the electric vehicle drivers is common knowledge. However, the specific preferences are unknown.
Assumption 3. Electric vehicle drivers do not communicate with each other, and their preferences are privately held information.
3.4. Model of the Charging Station
The charging station is defined as a control system that determines the operation mode as well as charging or discharging rate for each vehicle connected to its terminals
within their set of feasible actions considering the preferences of all EV drivers and available power from the renewable energy source. The control mechanism is more described in the next section.
However, the charging station operator is also part of the system; it can be assumed that the operators want to maximize their monetary gain or minimize expenses as follows:
where
is a weighting parameter determined by the charging station operator at time
t.
Since we want to decrease the adverse effects of the charging station, it is assumed that the power consumed by the EVs cannot exceed the power produced by the photovoltaic power plant plus the power available from the discharging of other EVs. The paper does not deal with the case of the surplus of the produced power at the charging station. For simplification, we assume that the surplus of the power from the RES can be stored in some storage system or sold to the main grid in this paper; however, this issue will be addressed more in future work.
4. Proposed Control and Incentive Mechanism
The charging station computes a control policy to minimize its costs represented by its monetary expenses from selling and buying the energy to and from the EVs. The control policy also minimizes discomfort experienced by the EV drivers caused by the control of their charging and discharging rates at each time step t.
The control policy tries to minimize the discomfort of the EV drivers. However, their preferences are not known to the charging station. Thus, the charging station must ask for this privately held information of each EV driver connected to its terminals. Of course, EV drivers do not need to report their true preferences inevitably and can strategically misreport their preferences to reduce their discomfort at the expense of others. Therefore, it is necessary to design a mechanism to ensure that the EV drivers reveal their true preferences and that participating in such a mechanism will be advantageous for all.
4.1. Control System
At time
t, the charging station elicits the drivers’ preferences and then solves an optimal control problem. The preferences reported by the drivers are denoted as
. In general, we can assume that
, meaning that the reported preferences are within the set of drivers’ preferences. However, these reported preferences do not need to be truthful, meaning
[
35].
Assumption 4. The reported preferencesbelong to the set of the drivers’ preferences,.
When the preferences are reported, the control system will find the optimal mode for all connected EVs () and the amount of power supplied to and from EVs () concerning their state of charge () and battery capacity C and their drivers declared preferences .
So, the control system solves the following optimization problem:
This problem leads to mixed-integer linear programming. The results will represent a set of socially efficient control policies at the time
t for each EV connected to the charging station. Since the costs of all participants, as well as the charging station operator, are minimized, it can be noted that the social welfare of the system is ensured. Social welfare, or the optimal “cost” function, is a function that represents minimal discomfort across all participants:
such that constraints (15)–(19) apply. Solving the presented optimal control problem results in determining a socially efficient control policy
with:
4.2. Mechanism of the Incentives
As noted above, the presented optimal control problem is solved by the charging station. It determines the operation modes and corresponding charging or discharging rates for each connected EV socially based on the defined preferences of the EV drivers. However, the reported preferences need not be truthful and can be purposefully misreported by some EV drivers to gain monetary profits or lower discomfort, as shown in [
29,
35].
Thus, the proper incentive mechanism is of significant importance to meet the minimal discomfort and so the concept of social welfare maximization. Therefore, the charging station also computes an incentive for each EV driver connected to its terminals. This incentive is denoted by a payment policy
that is a function of the reported preferences of all EV drivers connected to the charging station [
35].
Since these incentives will be paid to the drivers, they will decrease the discomfort caused to the EV drivers by controlling their charging or even their discharging. So, the final cost for the EV driver is noted as follows [
35]:
We assume that each EV driver strategically chooses their preference report to minimize their discomfort and payment at each step t.
Assumption 5. EV drivers are strategic agents.
So, the optimal cost for the EV driver connected to the
ith terminal of the charging station can be denoted as [
35]:
The defined system also assumes that the EV drivers cannot communicate (Assumption 3), so they cannot cooperate strategically with their reports to increase their gains.
To define the incentives, a proper mechanism needs to be defined. This mechanism will design the set of rules for the payment of the incentives. The mechanism is represented by a set of charging station control and payment policies
[
37].
For the defined incentive mechanism, we focus on the direct mechanism that asks every agent (EV drivers) to report their preferences every time t and supports the truthful implementation of the socially efficient policy by defining the payment policies. The mechanism is defined with the following stated properties.
Definition 1. A mechanism:
is efficient, meaning thatis a socially efficient policy,
is incentive compatible, meaning thatis such that the truthful report of preferences is an optimal strategy for each agent at every time t regardless of the reports of the others,
is individually rational, meaning that the total discomfort experienced by agent i (22) is smaller than the cost experienced under the socially efficient control policy of the mechanism in their absence,
satisfies the efficient exit condition, meaning that if agents are irrelevant for the mechanism in time t then these agents do not receive payment at that time step [35].
As defined in the previous subsection, the socially efficient control policy
is obtained by minimizing the social cost function (20). Then the optimal social program is defined in (21). Similarly, the social externality of EV driver connected to the
ith terminal of the charging station (the optimal social program if agent
i is absent) can be defined as [
31,
37,
38]:
with the socially efficient policy
if
i is absent. Then the change in the social value due to the addition of agent
i can be defined by its marginal contribution at time
t [
31,
37,
38]:
So, the payment rule, such that the total discomfort experienced by the
ith agent (22) equals their marginal contribution, can be defined as follows [
31,
37,
38]:
By substituting (21) and (25) into the (26), we can express the payment policy for EV drivers connected to the
ith terminal of the charging station in terms of social welfare functions of agents as follows [
31,
37,
38]:
Proposition 1. The payment policy defined in (27) is incentive compatible and individually rational.
Proof of Proposition 1. By the unprovability principle, it suffices to prove that if agent
i receives their marginal contribution as a payment, then truth-telling is incentive compatible for agent
i in time
t, or that:
where
. By the definition of
in (22) and
in (27), the left-hand side of (28) represents the marginal contribution of agent
i:
Then, the payment
can be inserted based on the definition in (27) into (29) and rearranged to obtain:
for all
. Then, we can express (30) in terms of the social welfare (21), (24), and (25) as:
By adding
to both sides of the inequality (31), we get:
The above inequality holds for all by the social optimality of . □
Proposition 2. The defined mechanismsatisfies the efficient exit condition.
Proof of Proposition 2. By the efficient exit condition definition, the agents do not receive payments at the time steps in which they are irrelevant to the mechanism.
If an agent
i is irrelevant to the mechanism, it can be assumed that:
what results in:
Therefore, by the definition of the payment policy in (27), the payment for agent i is equal to zero. □
5. Results
To demonstrate the operation and properties of the defined control and incentives algorithms, three simulation scenarios were carried out. The first simulation scenario represents a situation with a truthful declaration of preferences of all participants, and so demonstrates social welfare maximization. The second simulation scenario presents a situation with one EV driver declaring false preferences to increase their utility (decrease the cost). This scenario demonstrates the functionality of the incentive mechanism and shows that the false report of preferences is not an optimal strategy. The third scenario presents a more real-life operation to show that the proposed mechanisms can work even in random connection and disconnection from the charging station.
In the simulation scenarios, the charging station with four charging terminals is assumed. The maximum charging rate at one terminal is 7 kW, and it is the same for the discharging rate. The price for charging equals 0.25 €/kWh, and the price for discharging is set to 0.30 €/kWh. In all simulation scenarios, we assume the same predicted output of the photovoltaic power plant with a mean value of the error in photovoltaic output prediction
to be 6 % of the predicted output [
39].
The weighting parameter for the charging station cost is assumed to be constant in simulation scenarios. The value of the weighting parameter was empirically estimated to be equal to 0.75.
5.1. Scenario 1—Truthful Declaration of Drivers Preferences
To simplify the demonstration of algorithm properties, four different EVs that can be connected to the charging station are assumed in the first two simulation scenarios. The parameters of the assumed EVs and the preferences of their drivers are presented in
Table 1. The presented preferences are assumed to be constant throughout the simulation, and their values were determined using results from [
27,
28] and in a way that drivers with diverse preferences are present. In this scenario, these EVs are connected to the charging station throughout the whole simulation time.
Scenario 1 assumes that all EV drivers declare their truthful preferences as listed in
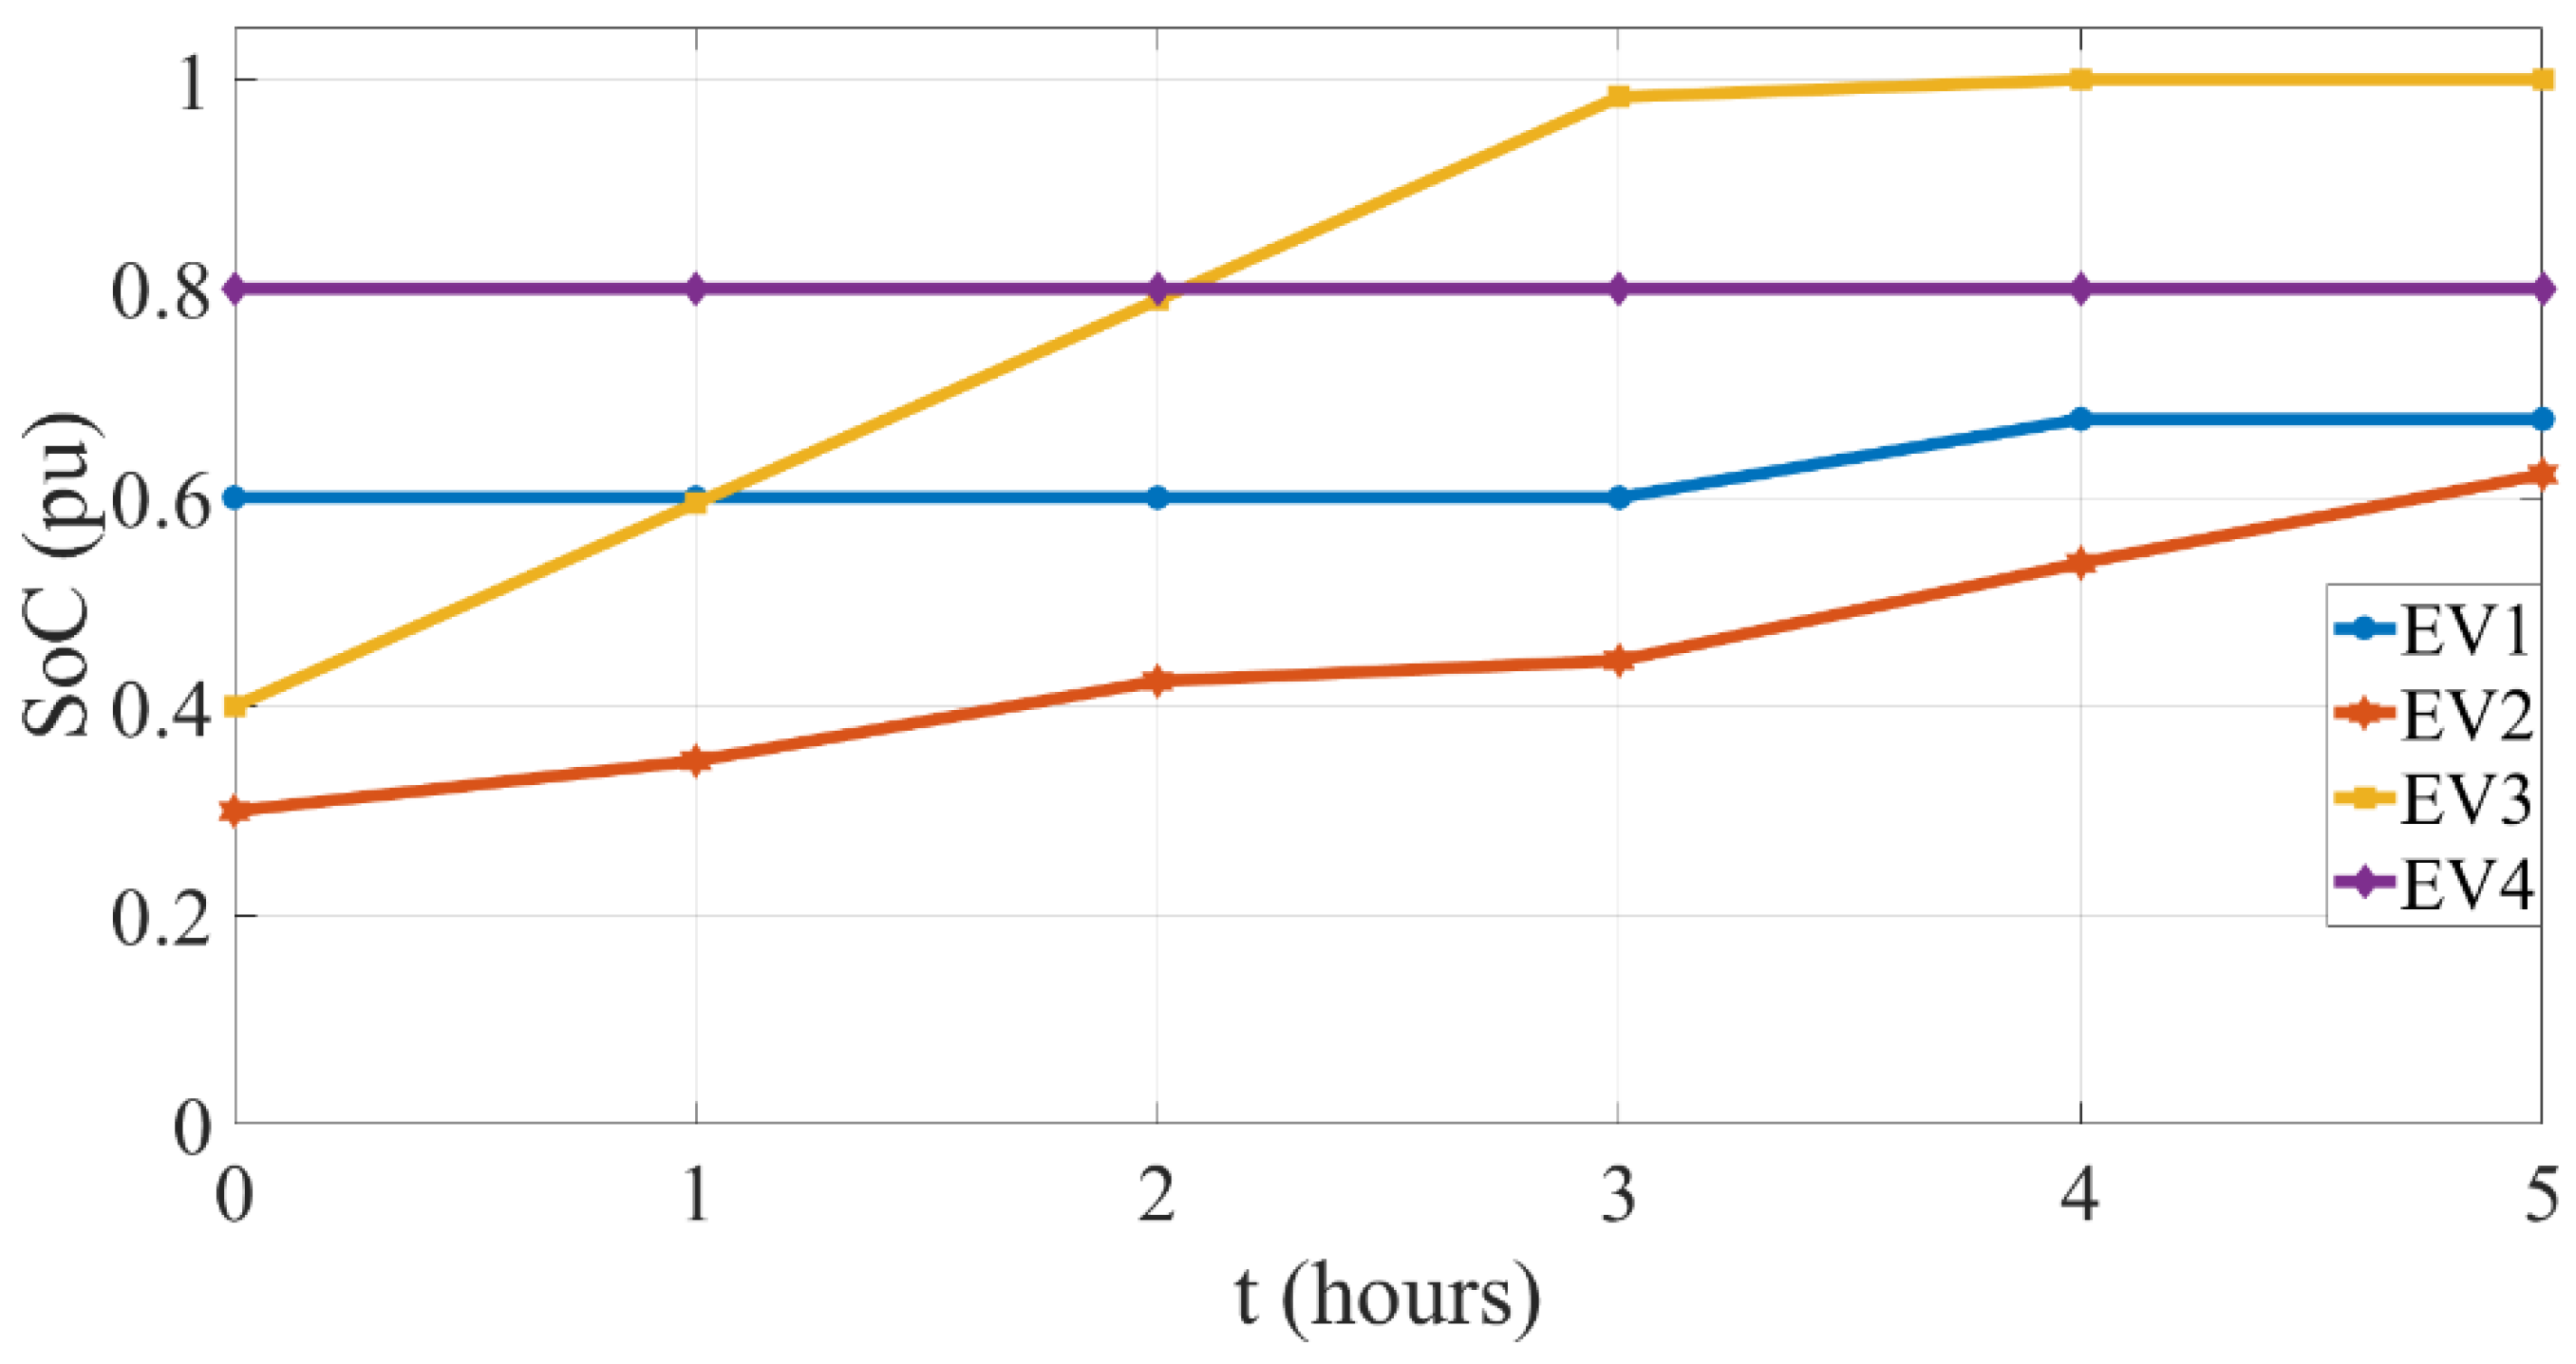
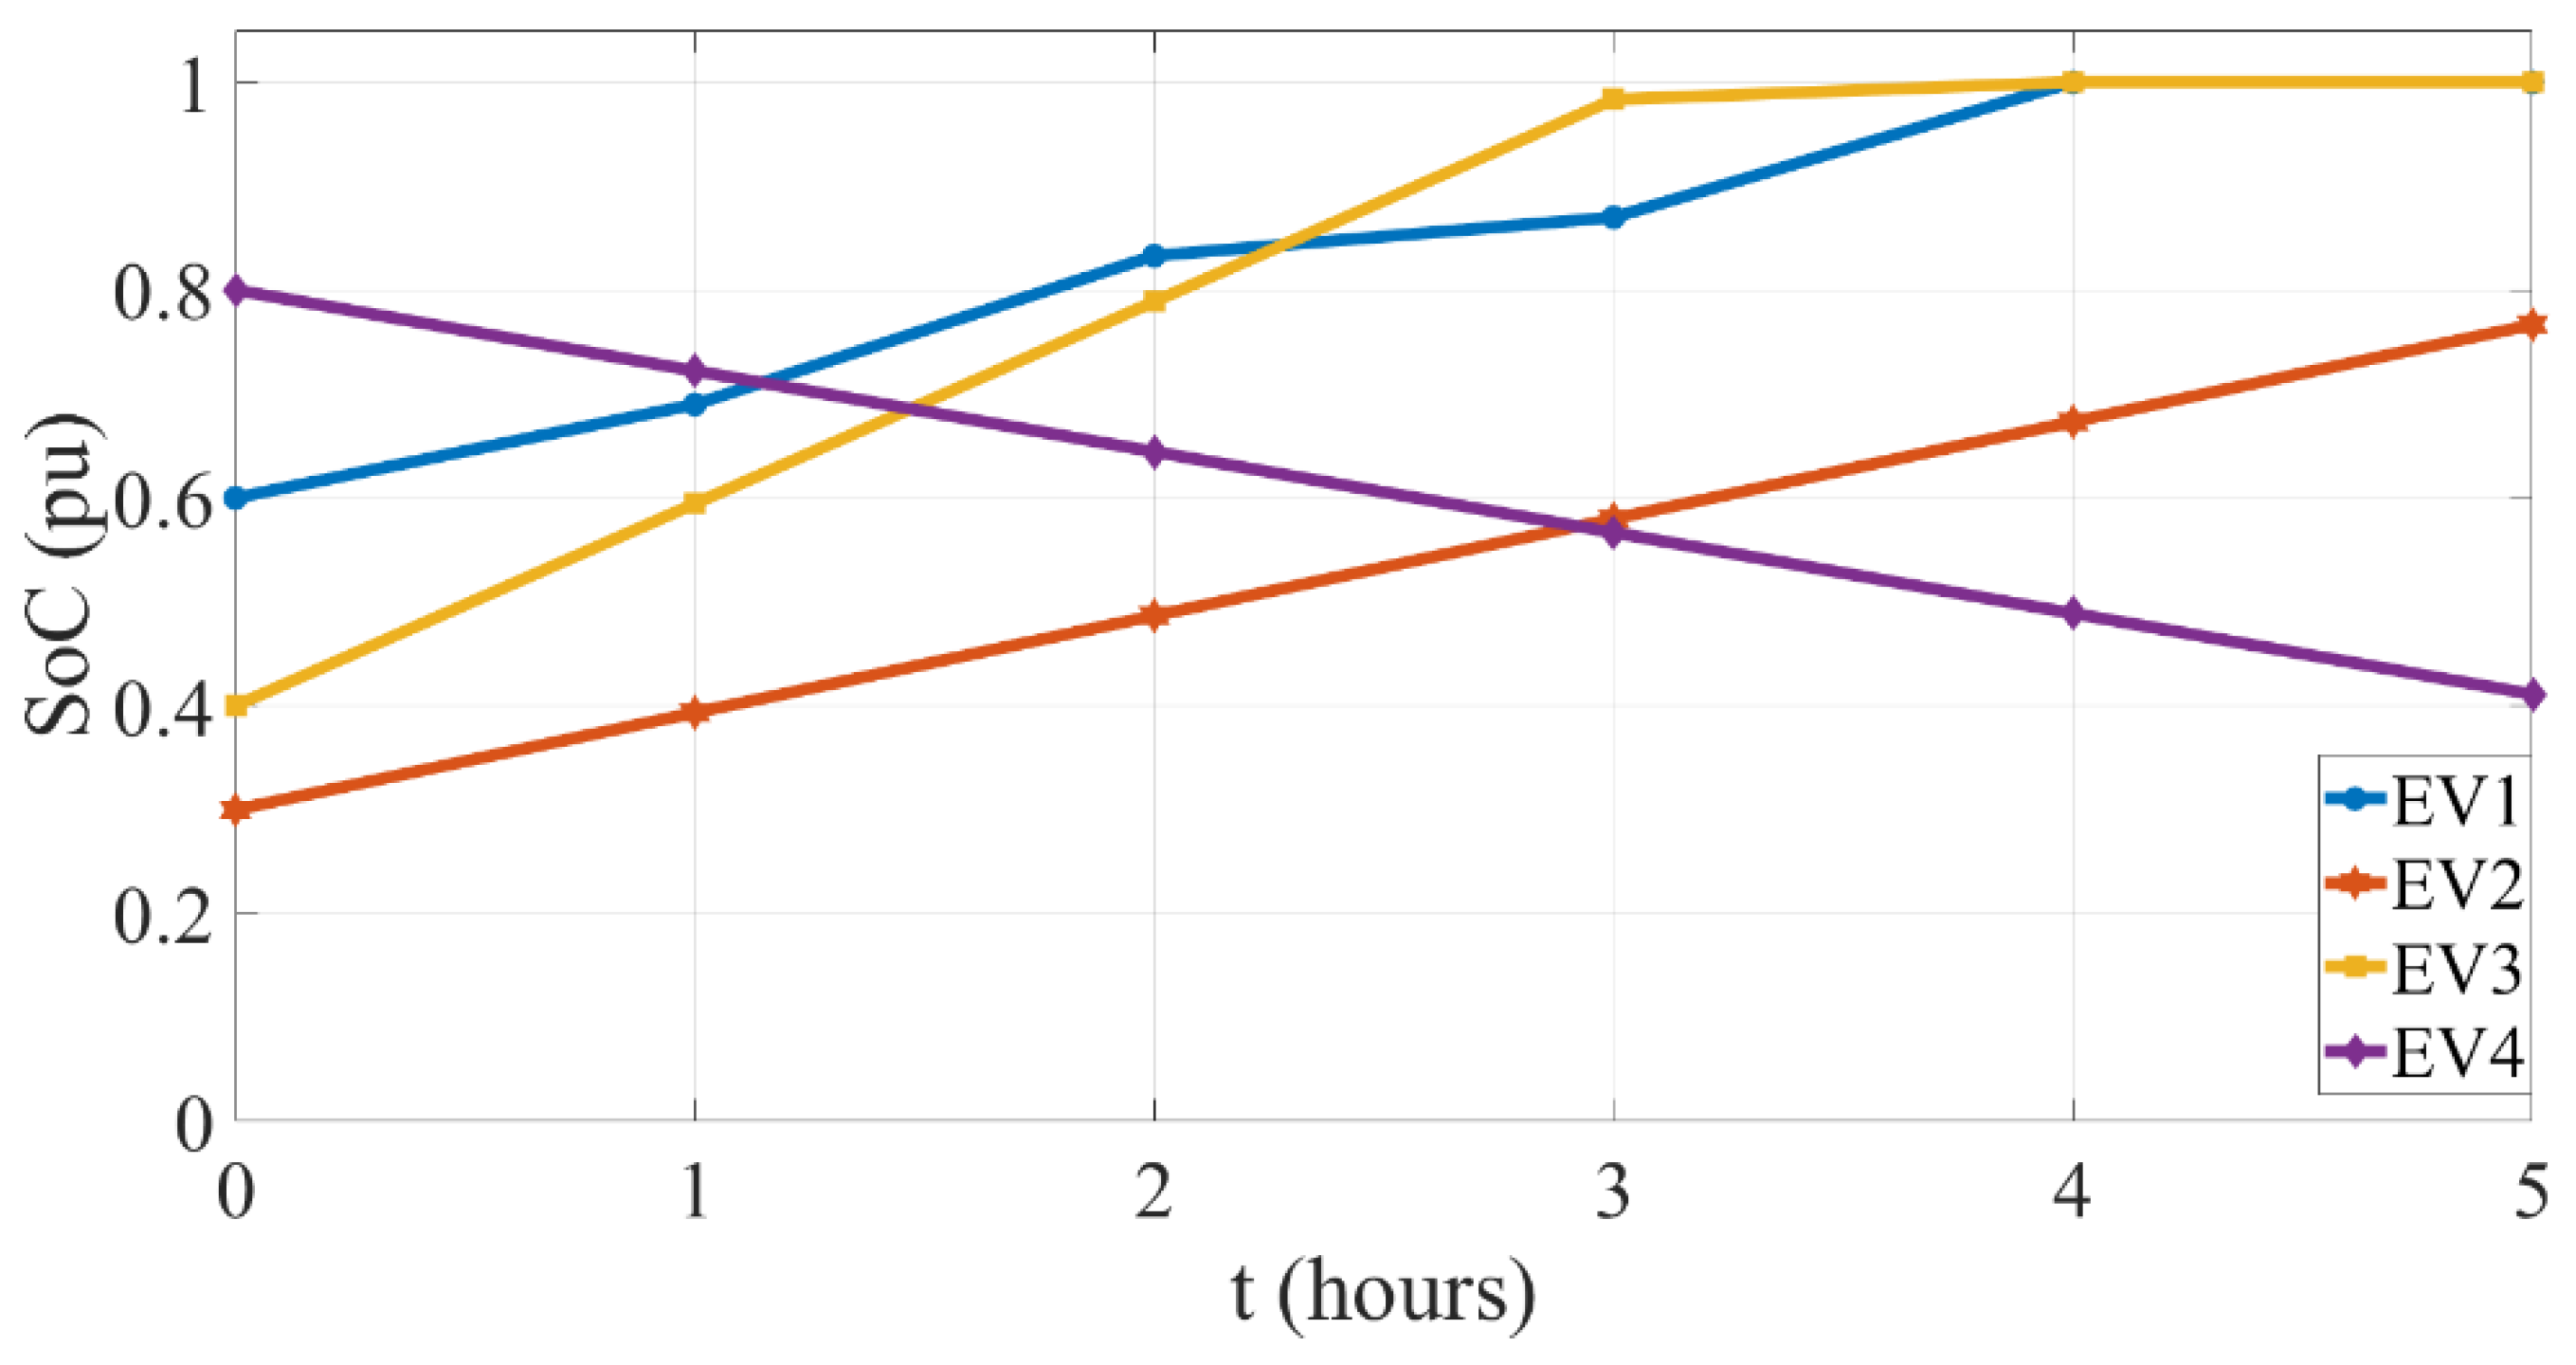
Table 1. The simulation time was set to five hours with the one-hour time step. So, the charging station elicits drivers’ preferences and consequently provides a socially efficient control policy for each connected EV in each hour. The results of Scenario 1 are shown in
Figure 2,
Figure 3 and
Figure 4.
Firstly,
Figure 2 presents the SoC development of each connected EV. As shown in the figure, EVs connected to terminals 1 to 3 are charging, but the SoC of the fourth EV is not changing during the whole simulation time. This is the result of combining their declared preferences in
Table 1.
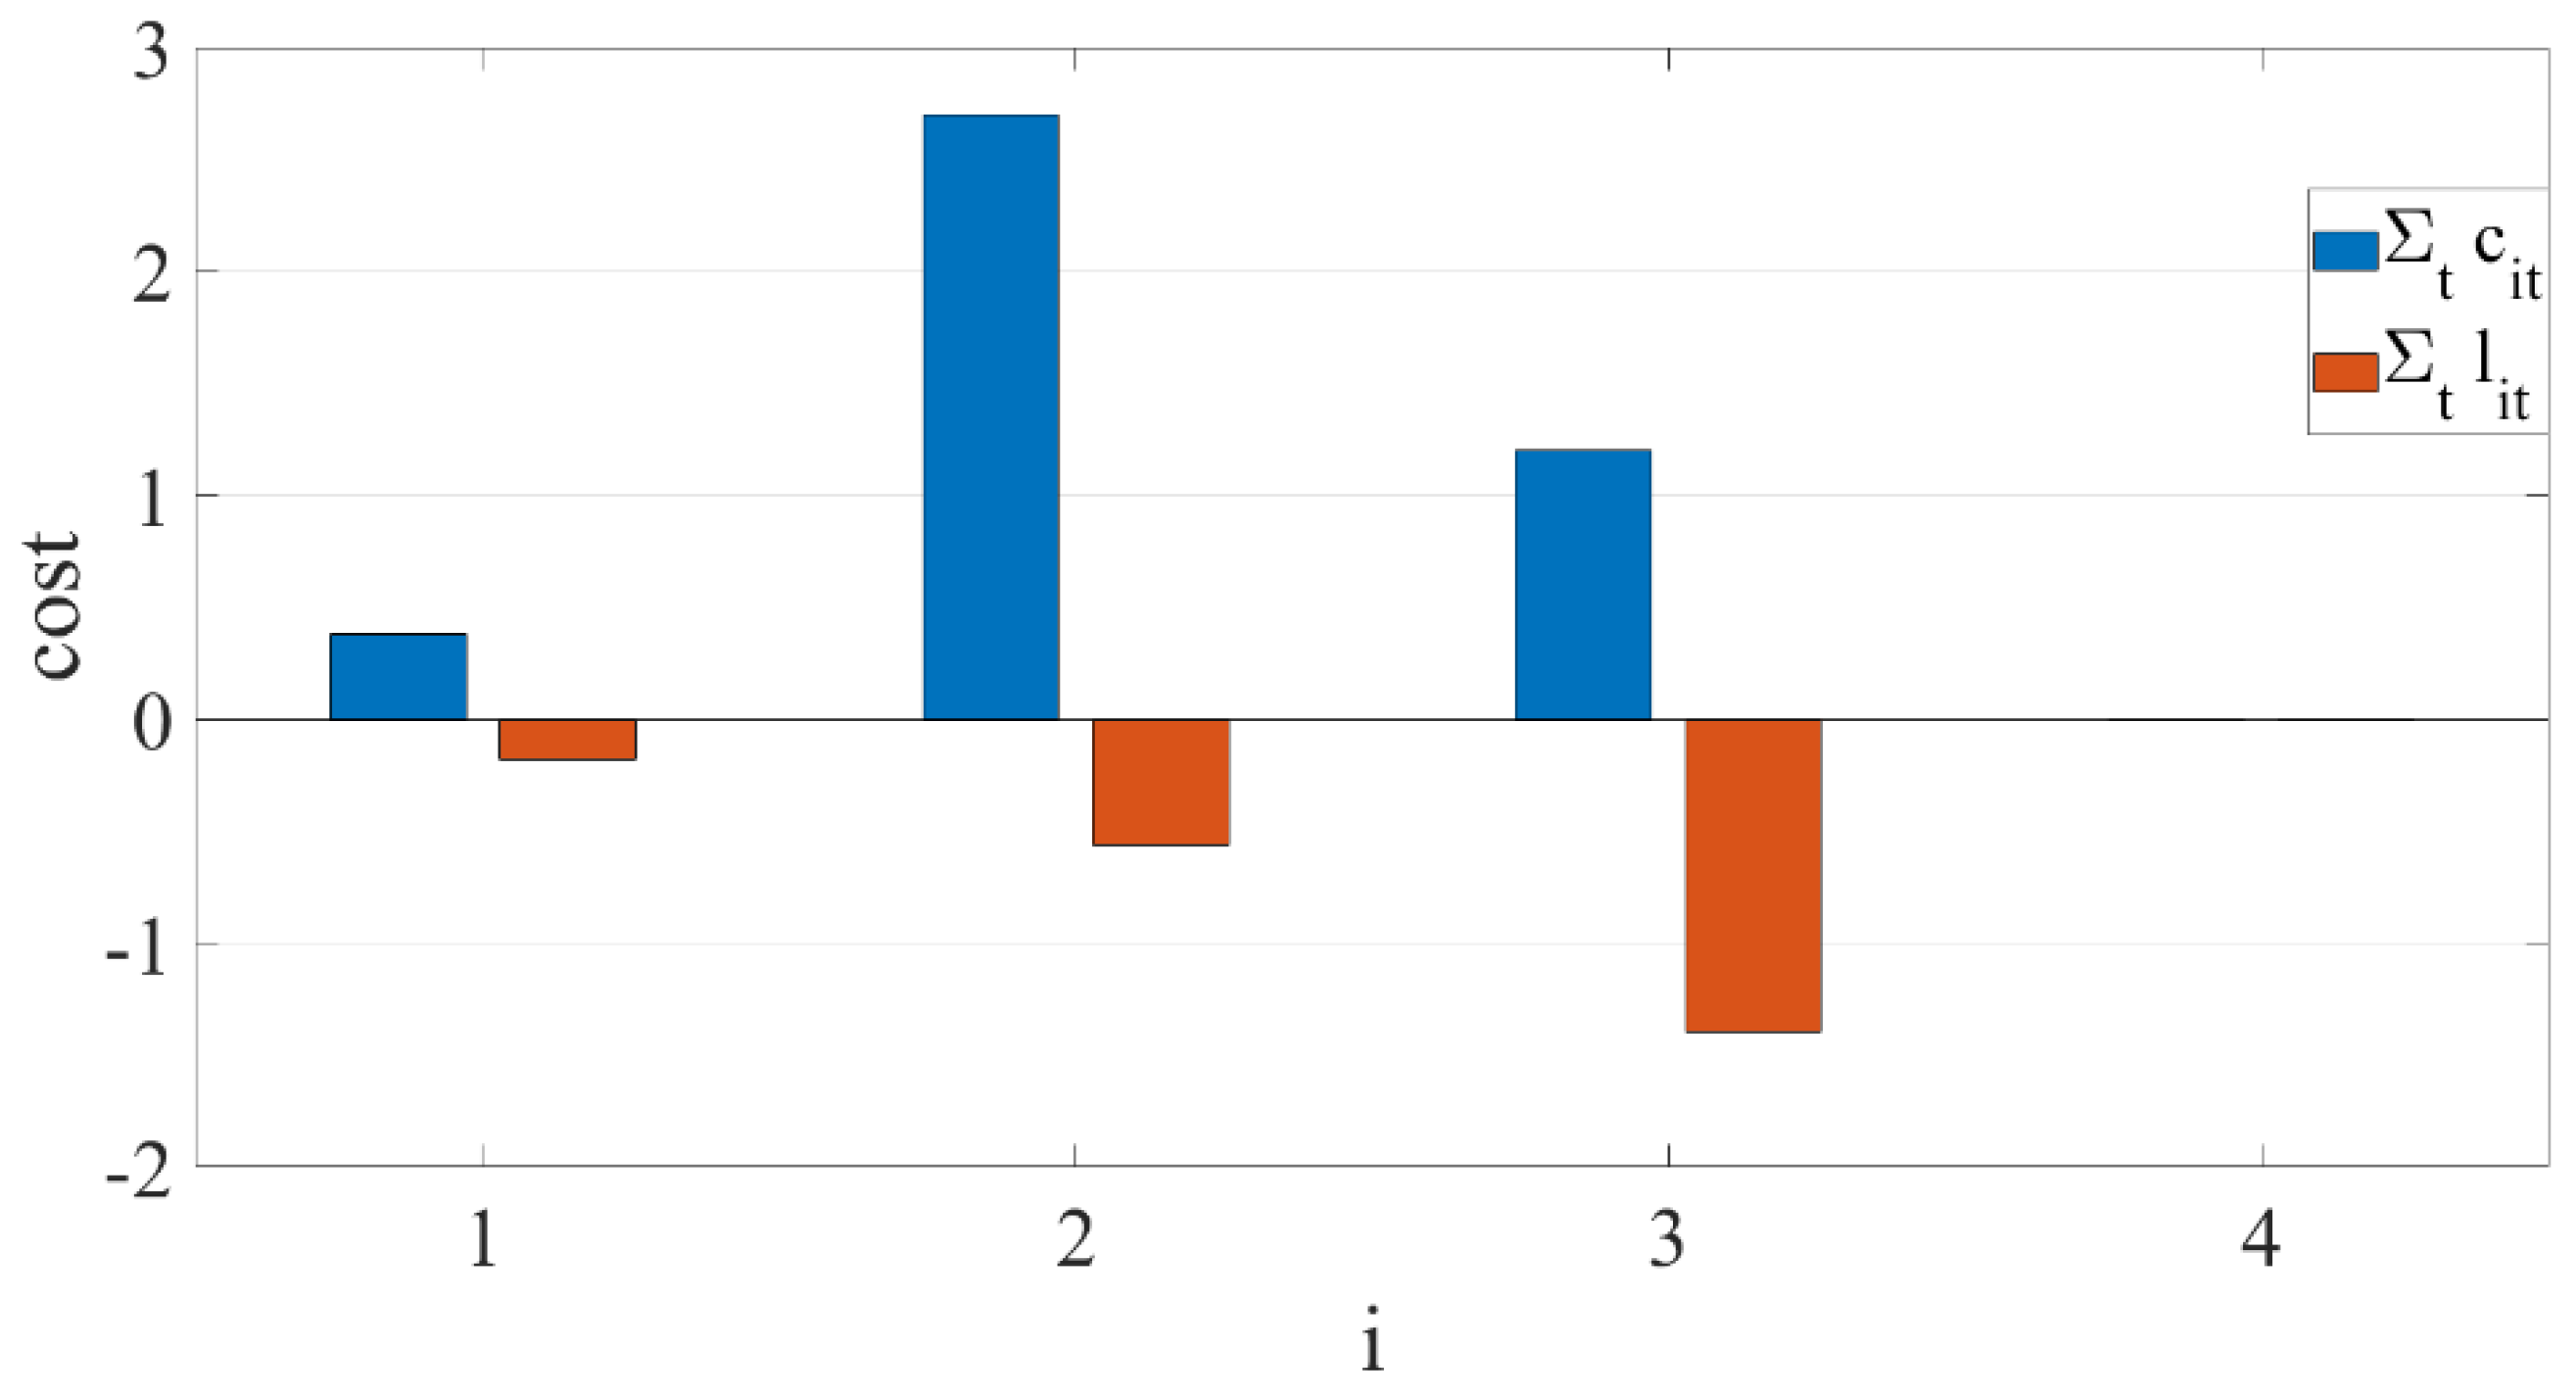
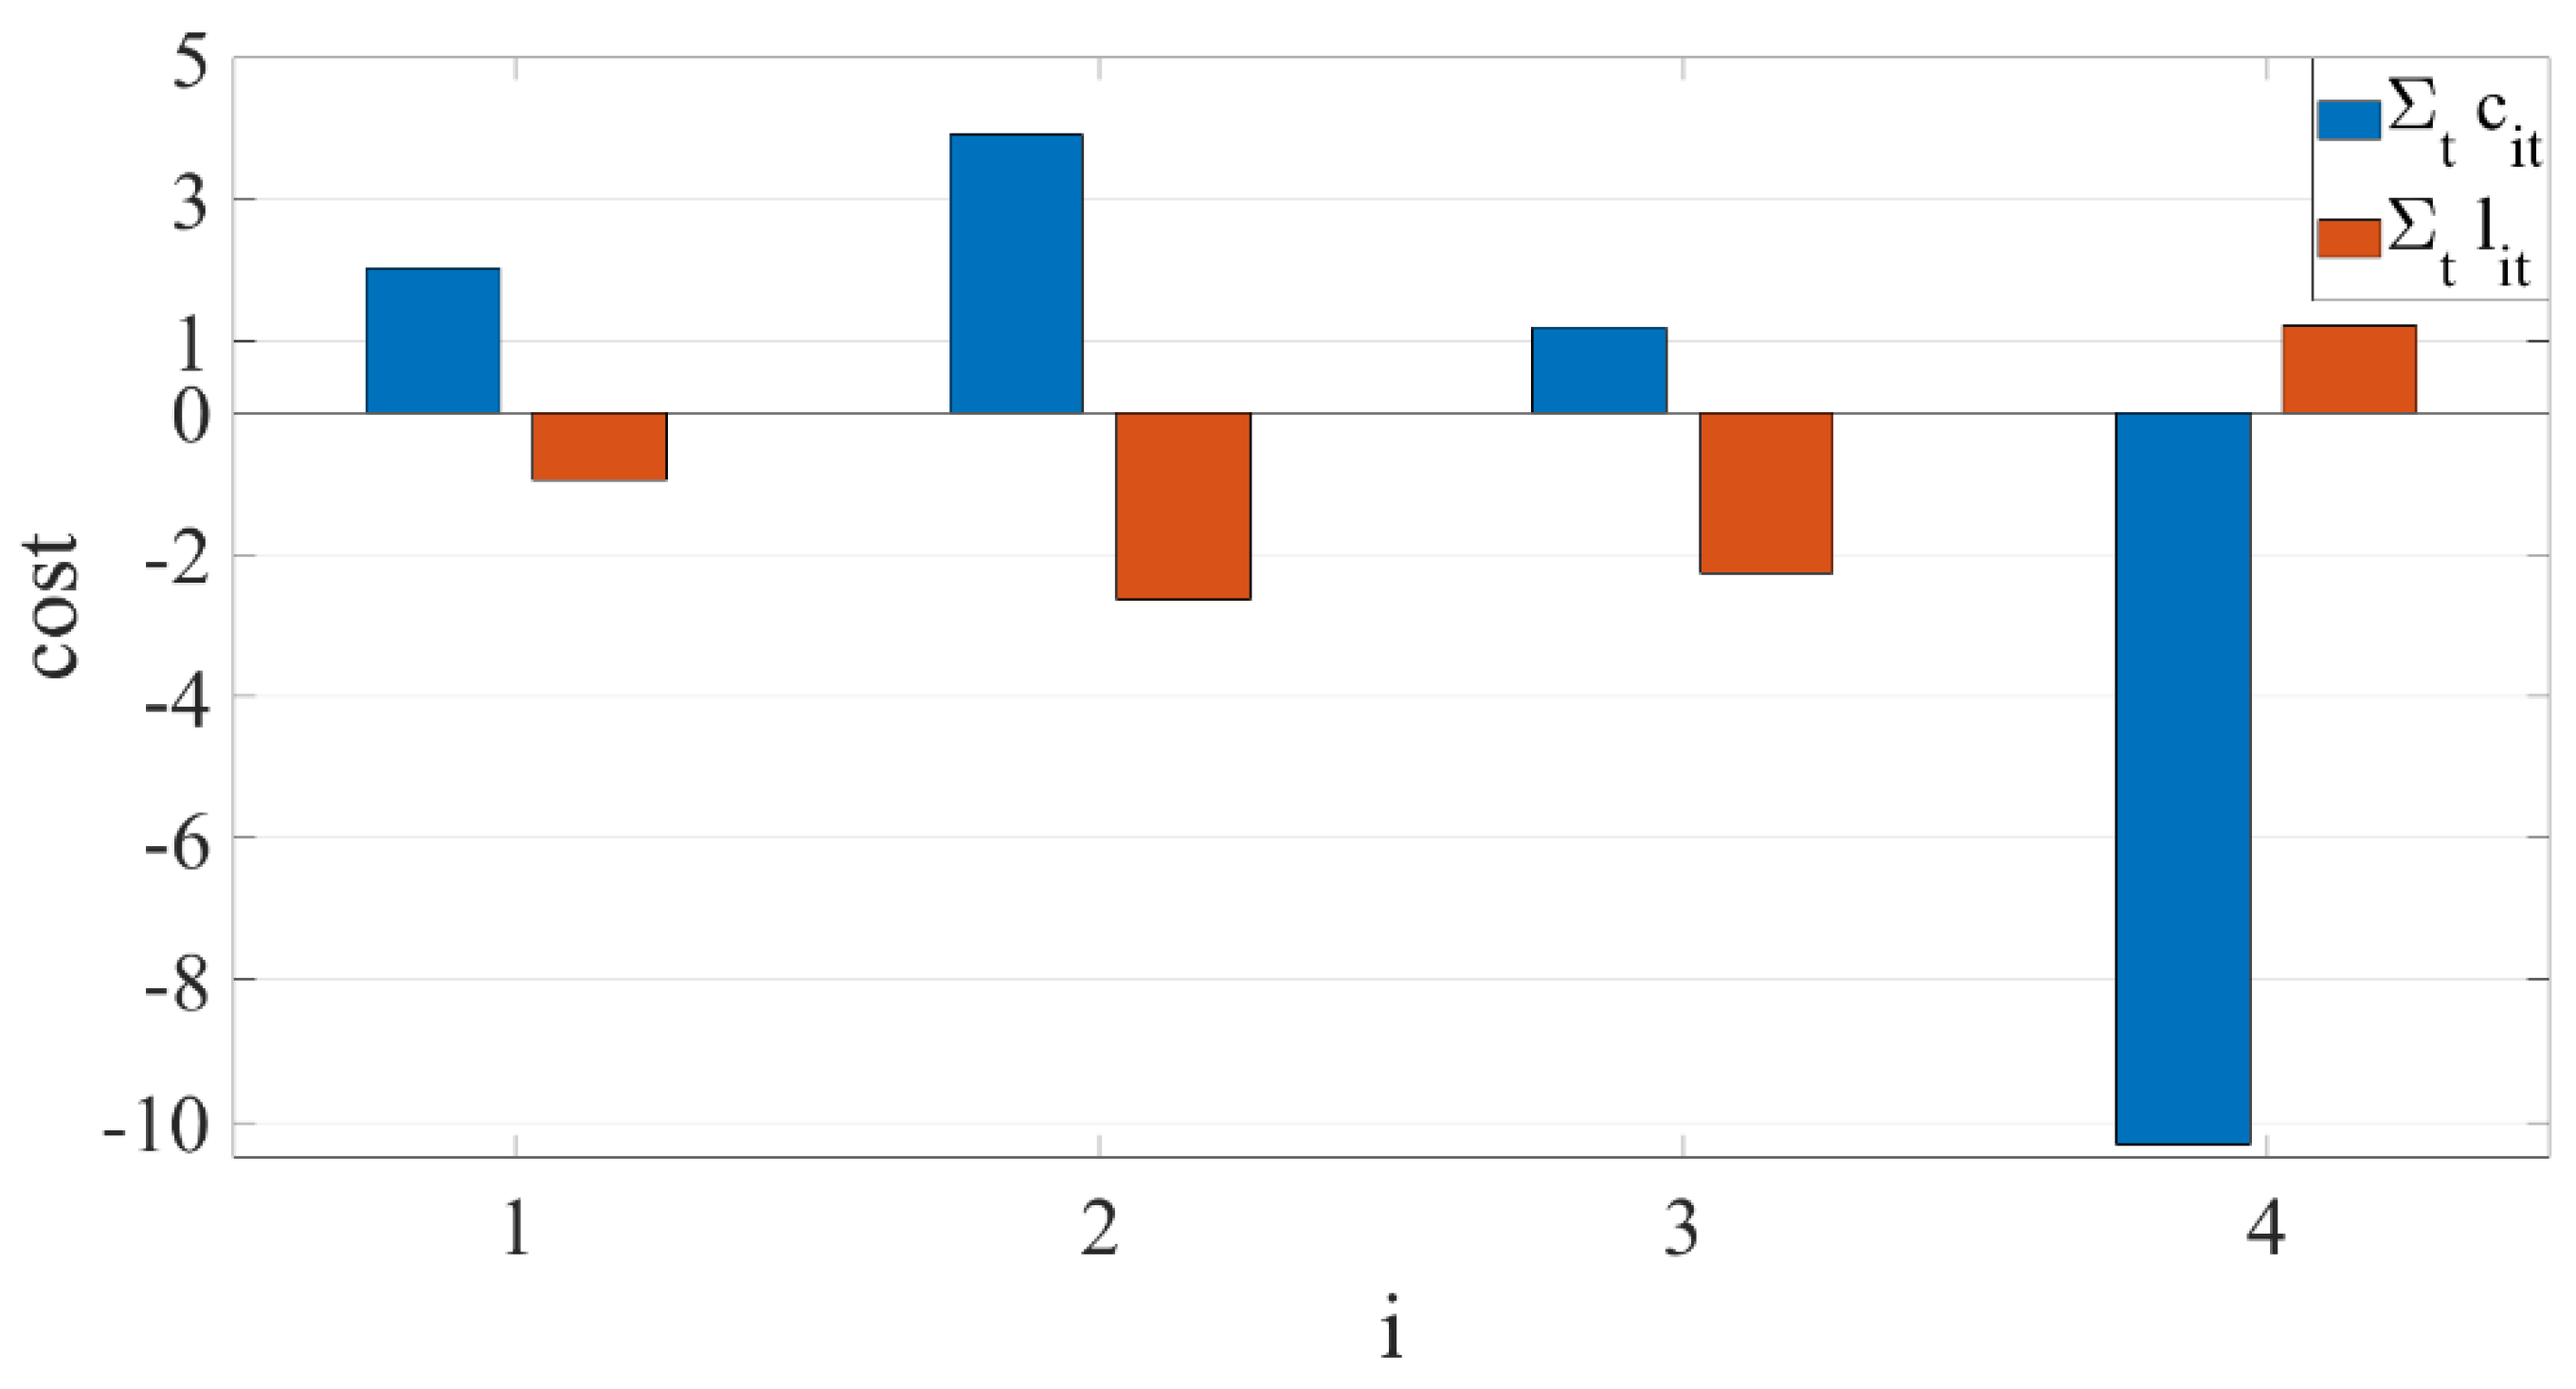
Figure 3 shows the sum results over the whole period for each EV driver’s cost function without incentives (blue bars) and the final cost function involving the incentives (orange bars). It can be noted from the figure that the final cost of drivers of EVs connected to first to third terminals of charging stations decreases due to the incentives (orange bars), while the cost function, as well as final cost function, of EV drivers connected with its vehicle to terminal four, are both zero. This is the result of the mechanism design feature since the EV driver connected to the fourth terminal is irrelevant to the system (Proposition 2).
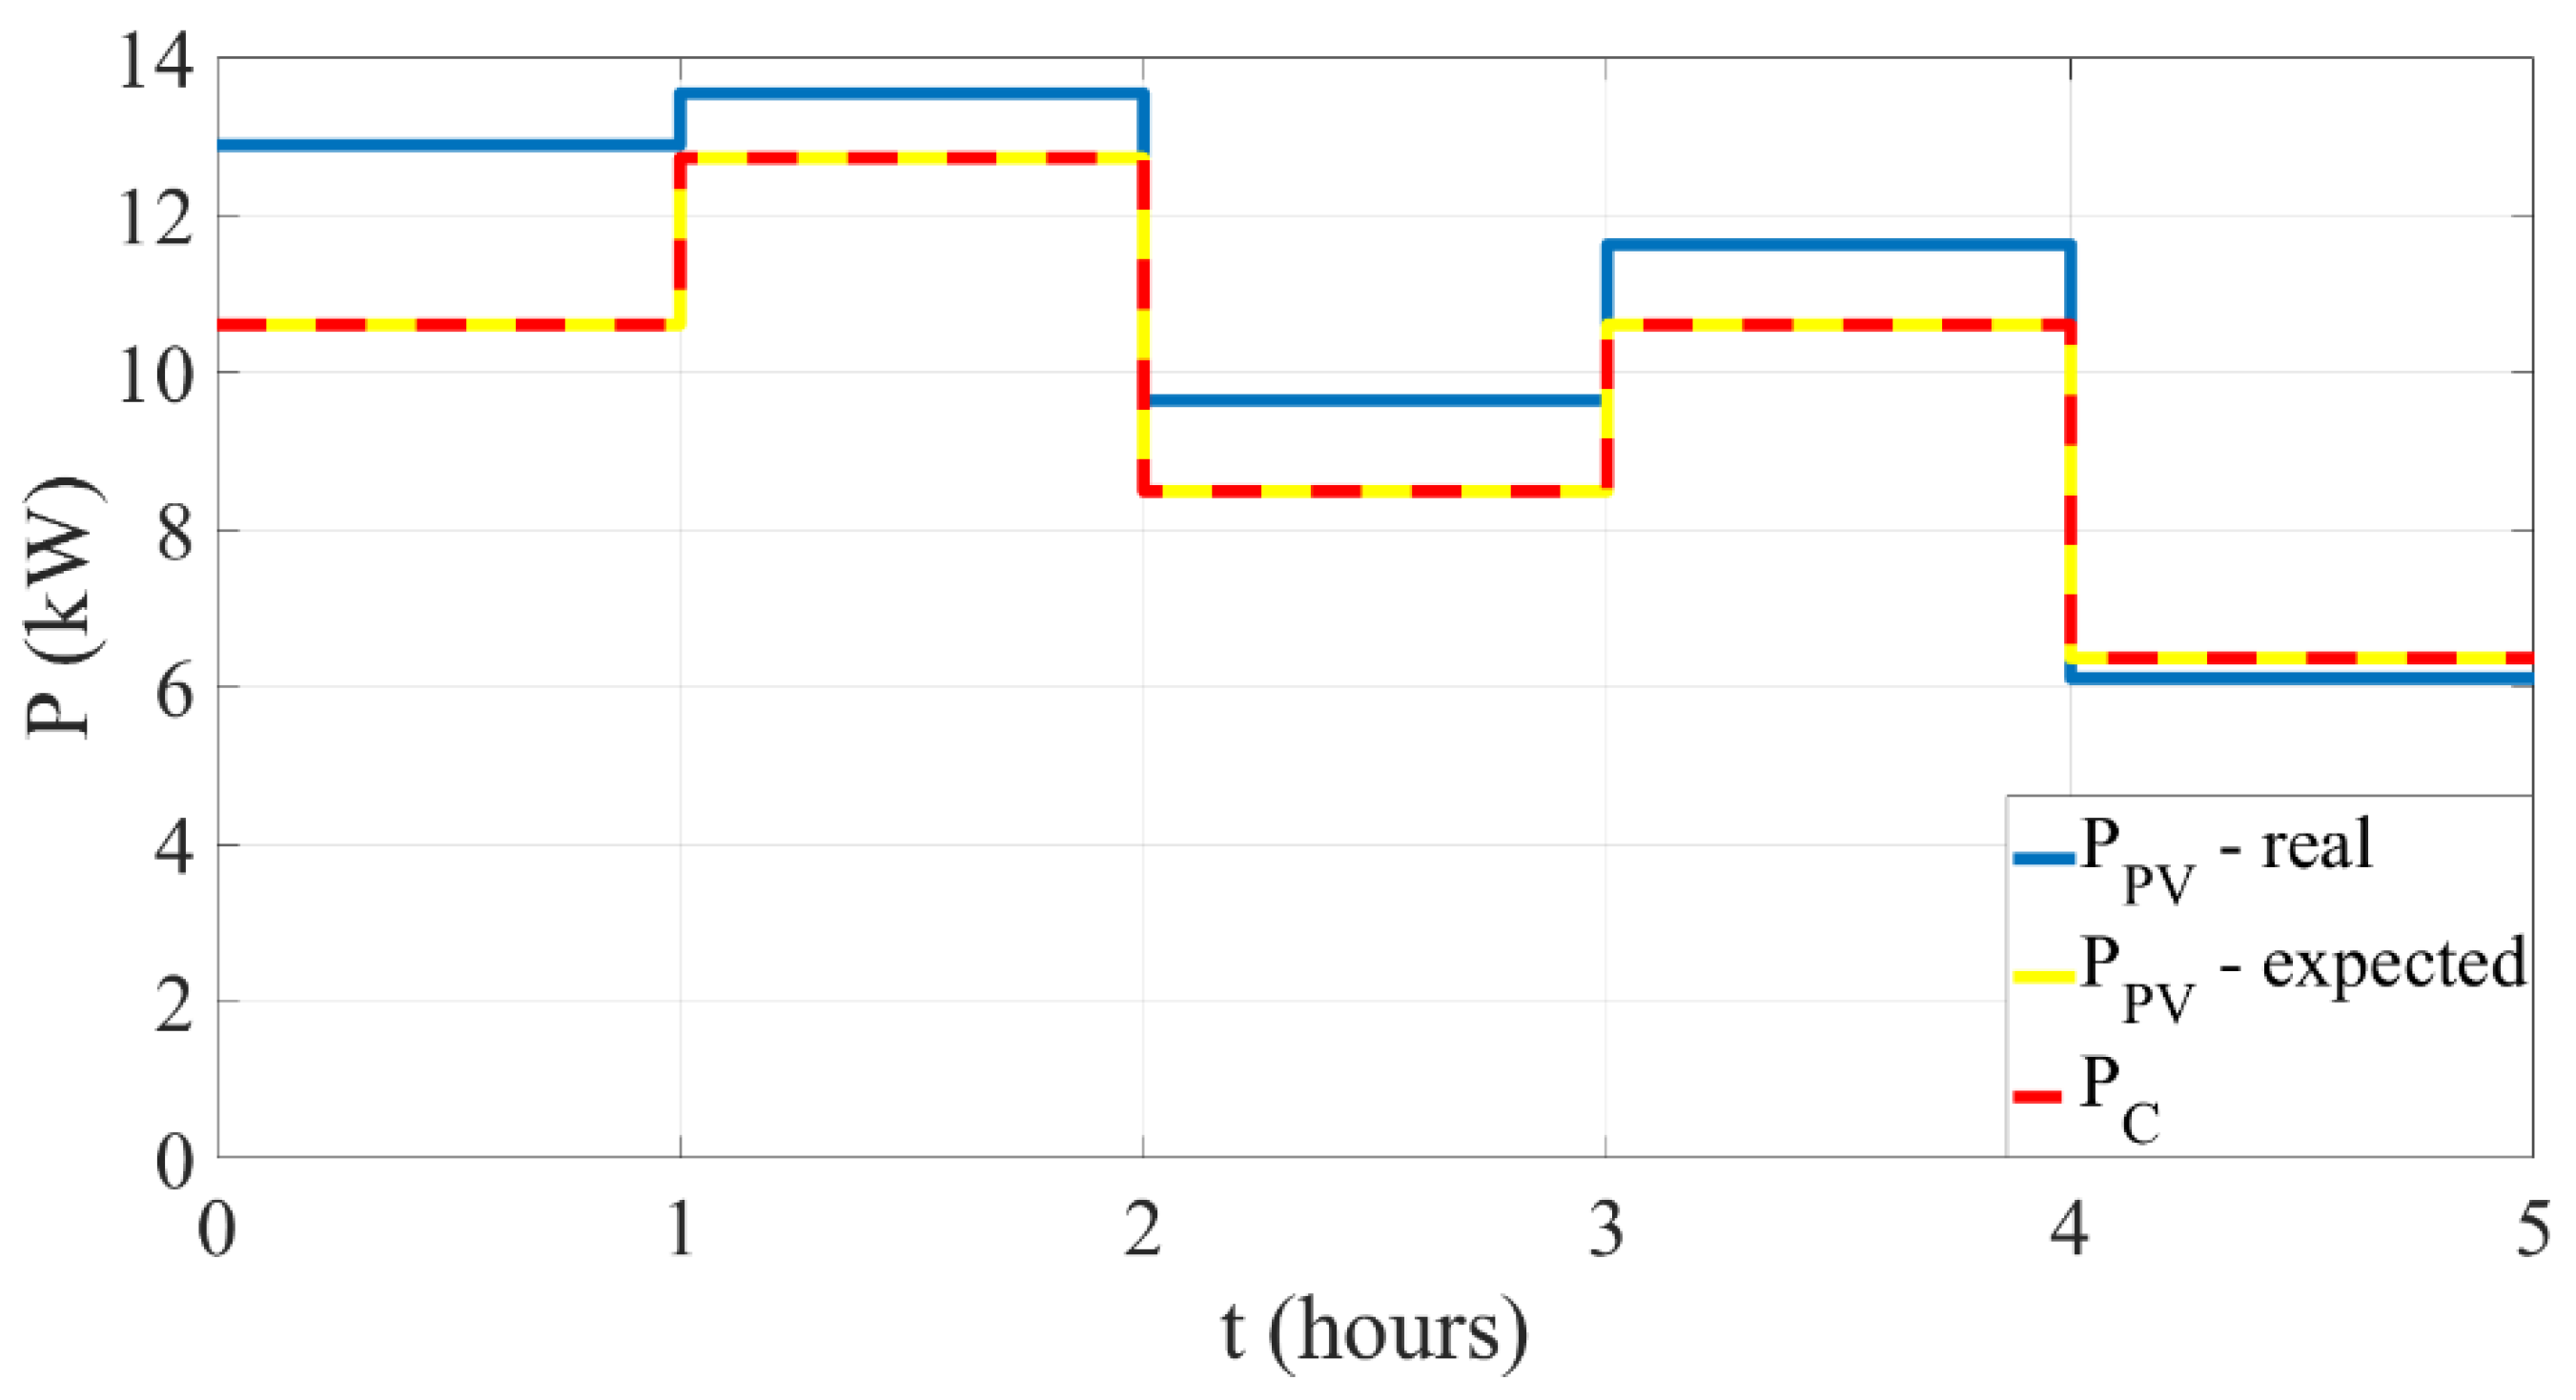
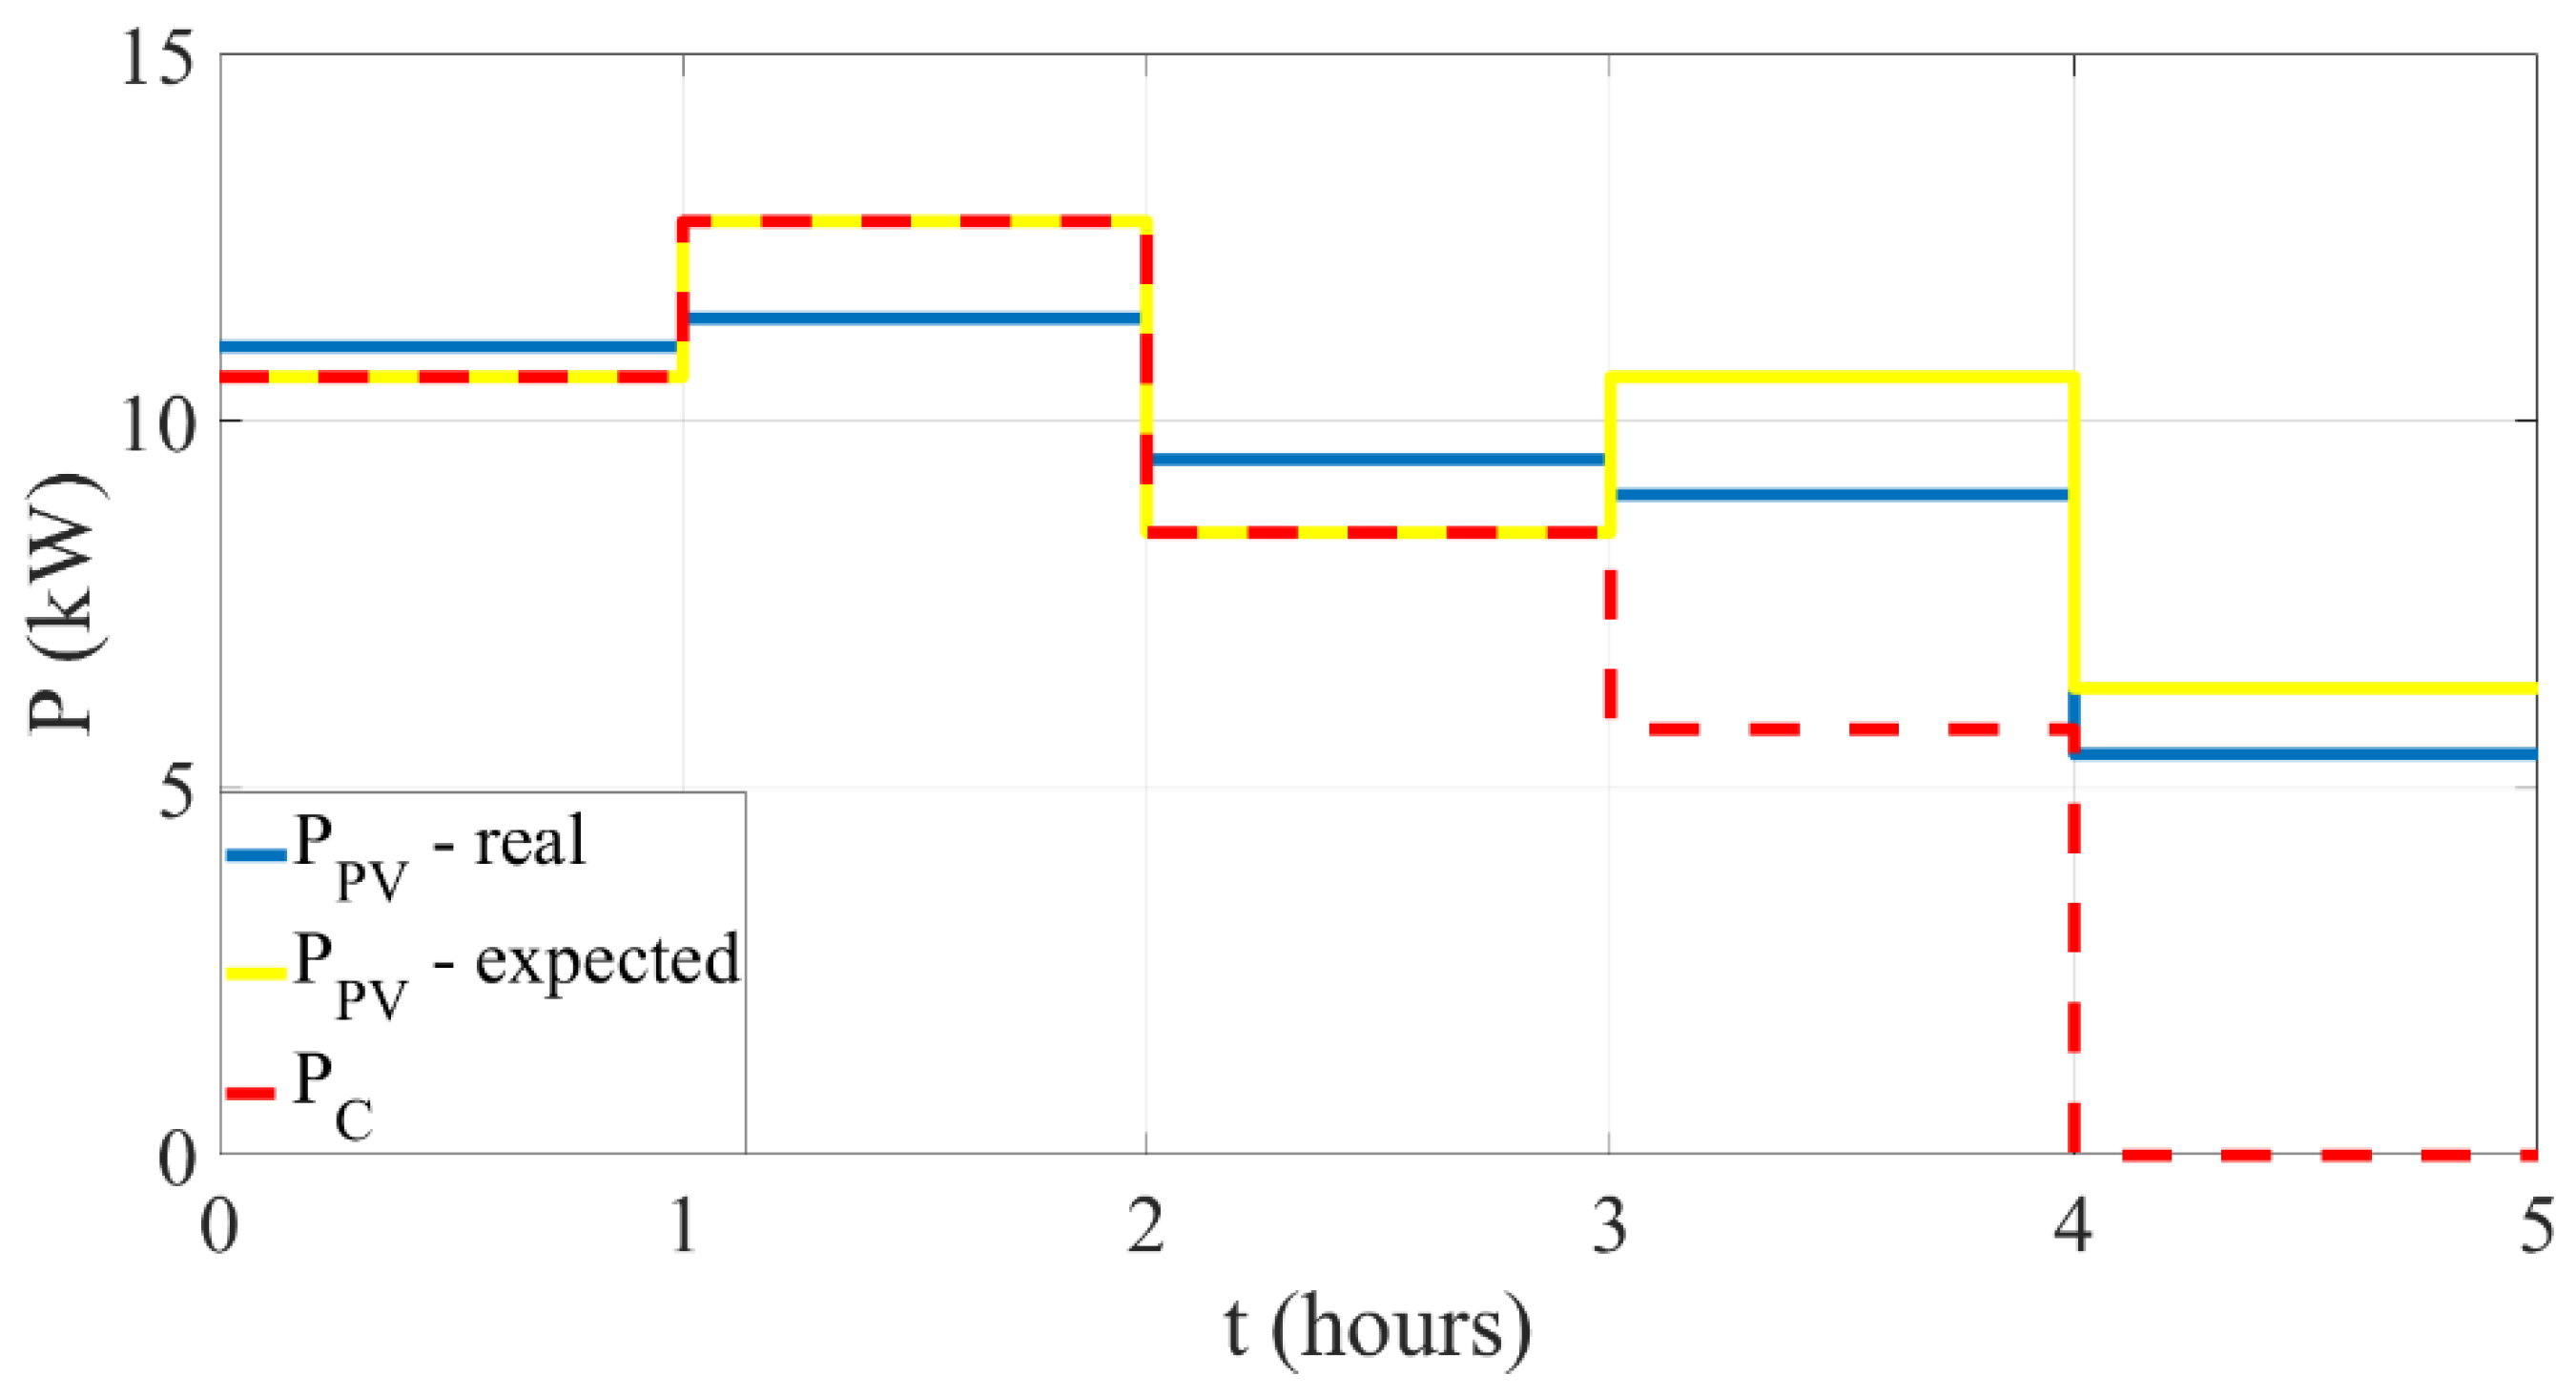
Figure 4 presents the generated and consumed power at the charging station. The curve of the consumed power (P
C) by EVs strictly follows the expected output of the photovoltaic power plant. However, there is a slight difference between the real generated and consumed power due to prediction accuracy. If the prediction error is small, the excess of the produced/consumed power from the main grid is also small, but a high prediction error can increase the supply or draw power from the main grid significantly. The excess power of the charging station can be minimized by improving the power prediction or implementation of the storage system at the charging station. This issue will be addressed in future work.
5.2. Scenario 2—False Preference Declaration by One of the Drivers
Scenario 2 is similar to the previous one. However, there is one difference. This is that the driver of the EV connected to the fourth terminal does not declare their preferences truthfully in this scenario, trying to increase their utility (decrease cost). The driver of this EV declares
to be equal to 1 instead of 0.5 (
Table 1). So, they report that the price per discharge is more important to them than it is. The results of this scenario are presented in
Figure 5,
Figure 6,
Figure 7 and
Figure 8.
Figure 5 presents the SoC curves of each connected EV. Since the EV driver connected to the fourth terminal declared that the price per discharge is more important to them, their EV discharges in this scenario. Due to the discharging of EVs connected to the fourth terminal, the EVs connected to the second and third terminals are charging more rapidly than in the previous case.
Figure 6 shows the sum results over the whole period for each EV driver’s cost function (10) and final cost function involving the incentives as well (23) in this scenario. As shown in the figure, the driver of an EV connected to the fourth terminal would decrease its cost over the simulation time (blue bar) with its untruthful report if there was no incentive mechanism. However, due to the defined mechanism, their final cost increases (orange), and it is even higher than in the case of reporting true preferences in Scenario 1, while the final cost of other participants (reporting true preferences) decreases in comparison to Scenario 1.
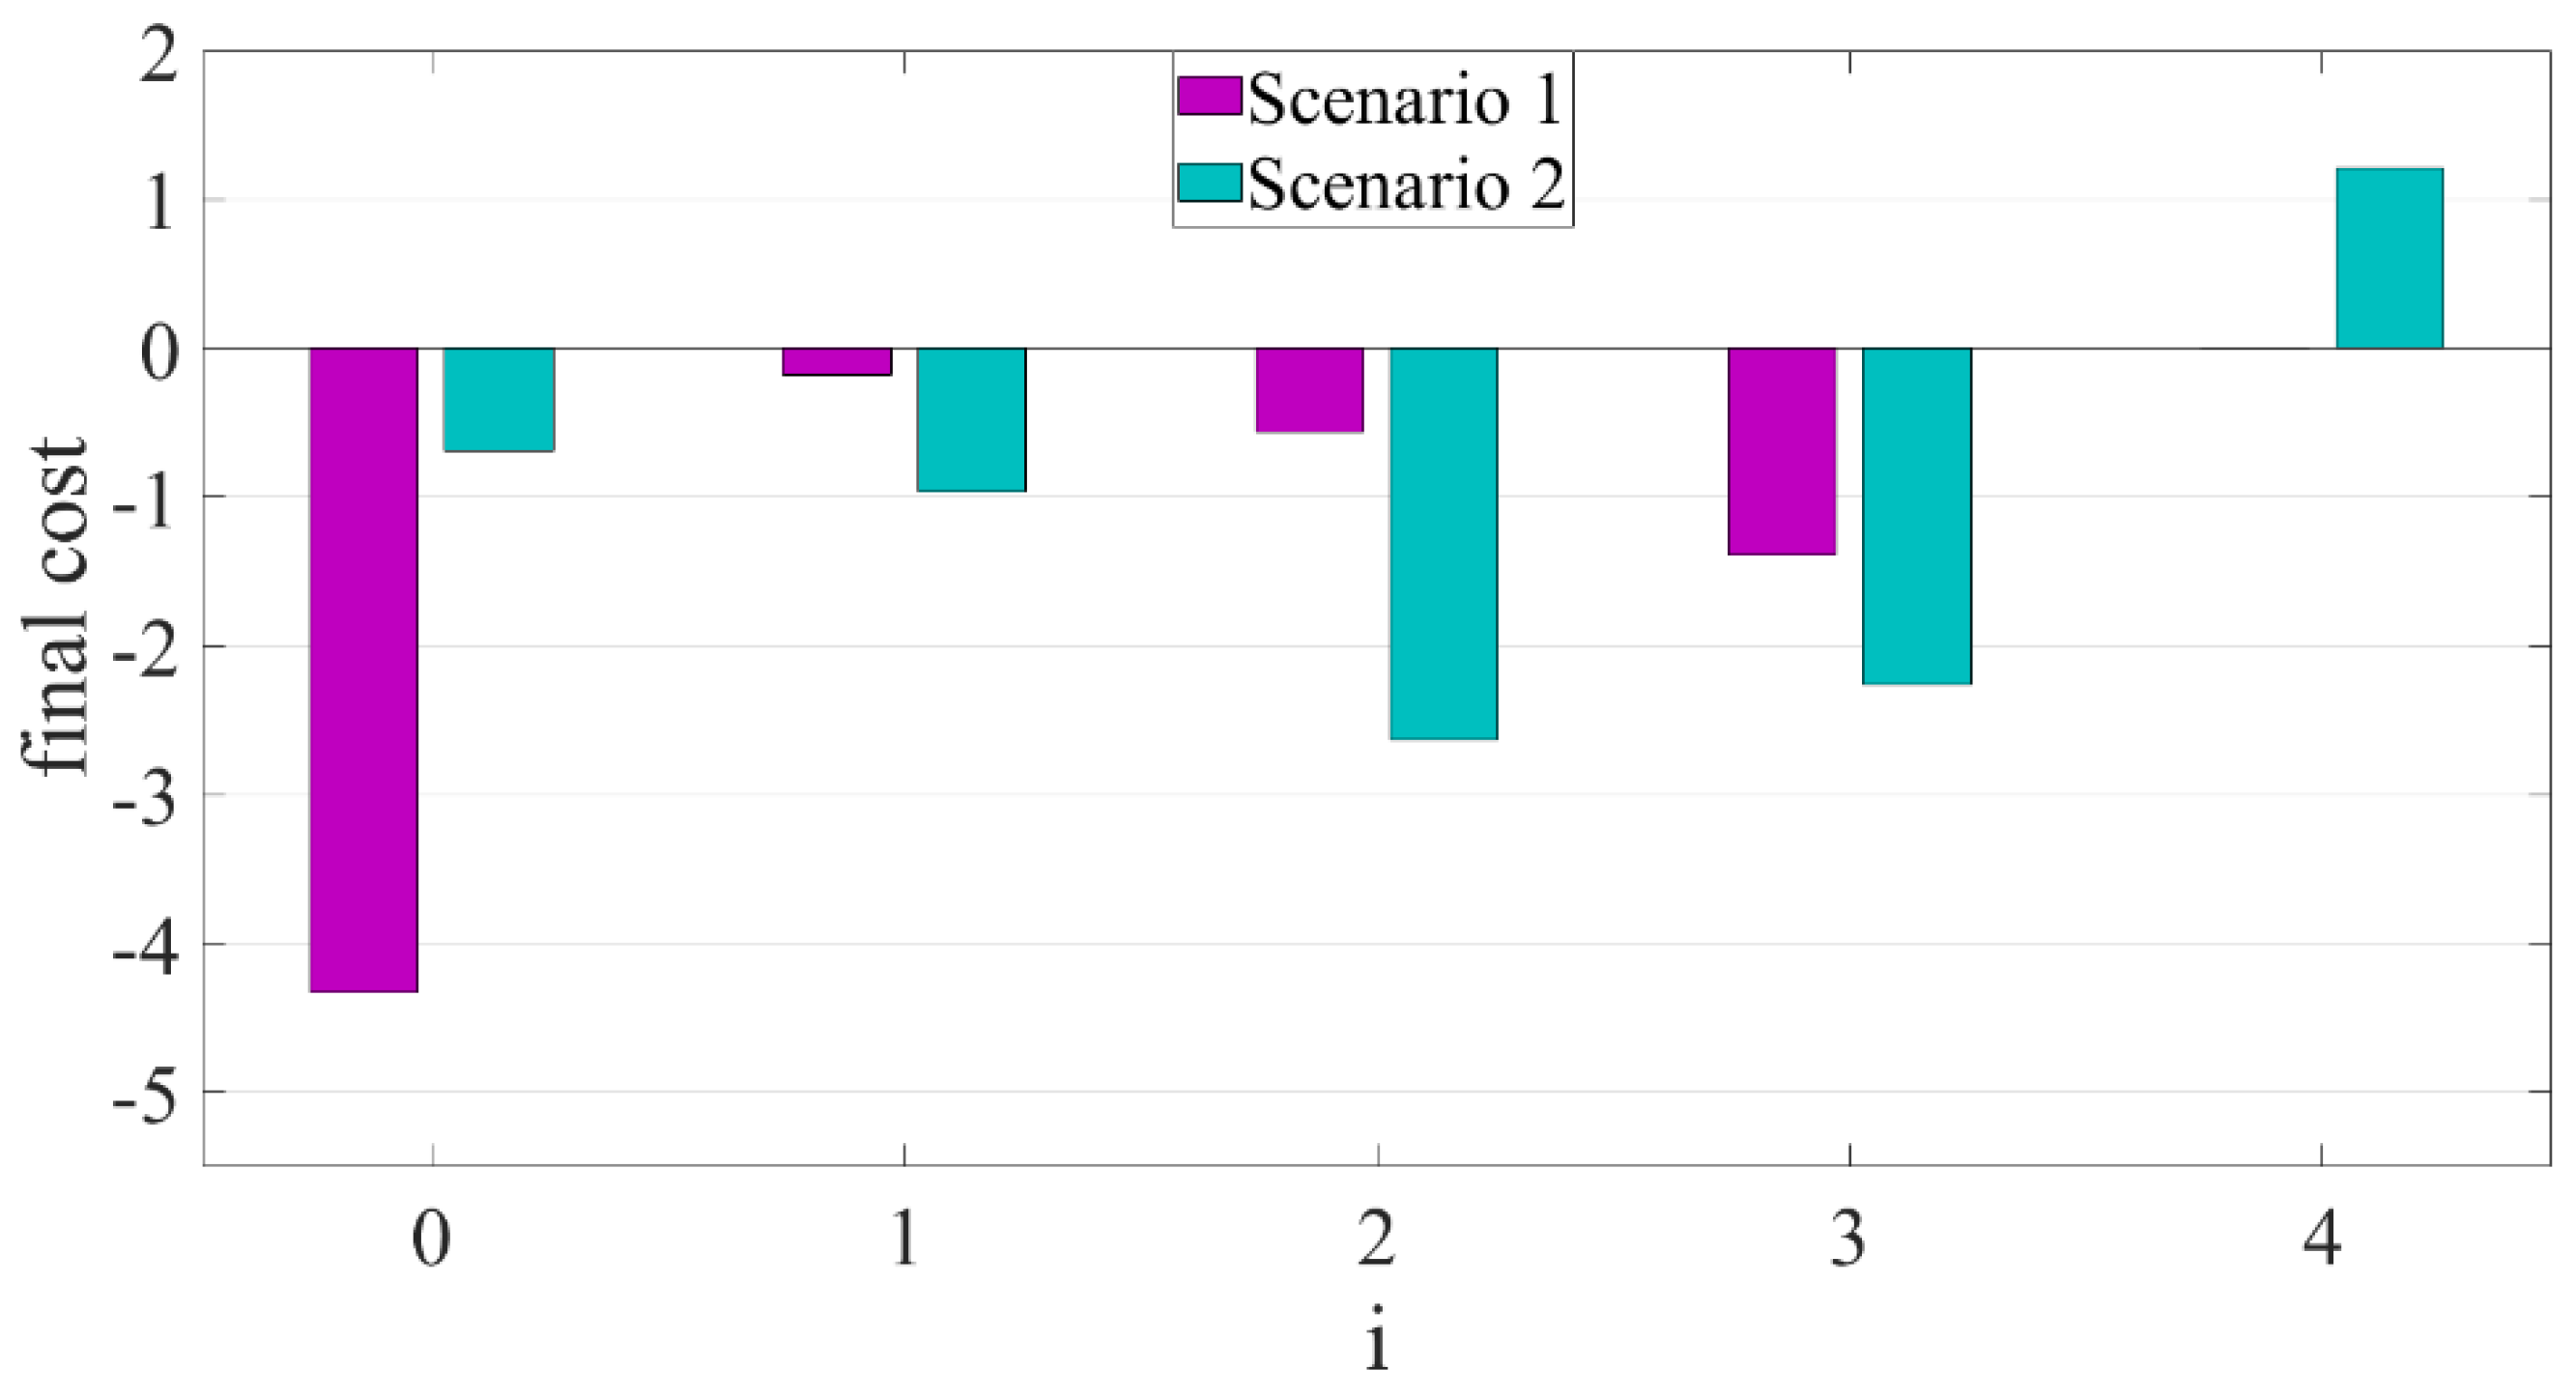
The comparison of the final costs of all participants (charging station—
i = 0) in Scenarios 1 and 2 is presented in
Figure 7. As noted above, the drivers that report their preferences truthfully in both cases increase their final cost in Scenario 2 in contrast with the EV driver connected to the fourth terminal. This is the result of the mechanism design feature that the truthful report of preferences is the optimal strategy for each agent at every time
t regardless of the reports of the others (Proposition 1).
Since no EV is discharging in Scenario 1, the charging station operator just earned money from selling the energy. The sum of its cost function over simulation is therefore negative and equal to −4.33. However, the charging station pays for discharging the EV connected to the fourth charging terminal instead of utilizing the power produced from its PV power plant in Scenario 2. Since not all power of the photovoltaic power plant is delivered and sold to the EVs and the charging station operator needs to pay the EV connected to the fourth terminal for discharging, the operator’s utility decreases or their cost increases to −0.69. This shows that truthful declaration of the preferences by EV drivers is also important for the charging station, and the presented incentive system is advantageous for the charging station operator as well. So, the defined incentive mechanism is important to meet the social welfare of all system participants, i. e. EV drivers and the charging station operator too.
Figure 8 presents the generated and consumed power at the charging station in Scenario 2. In contrast with Scenario 1, the curve of the consumed power (P
C) by EVs does not strictly follow the output of the photovoltaic power plant in this scenario. It is caused by the discharging of the EV connected to the fourth charging terminal based on its driver’s untruthful report of preferences. This issue is also reflected in the increase in the final cost of the charging station, as mentioned above.
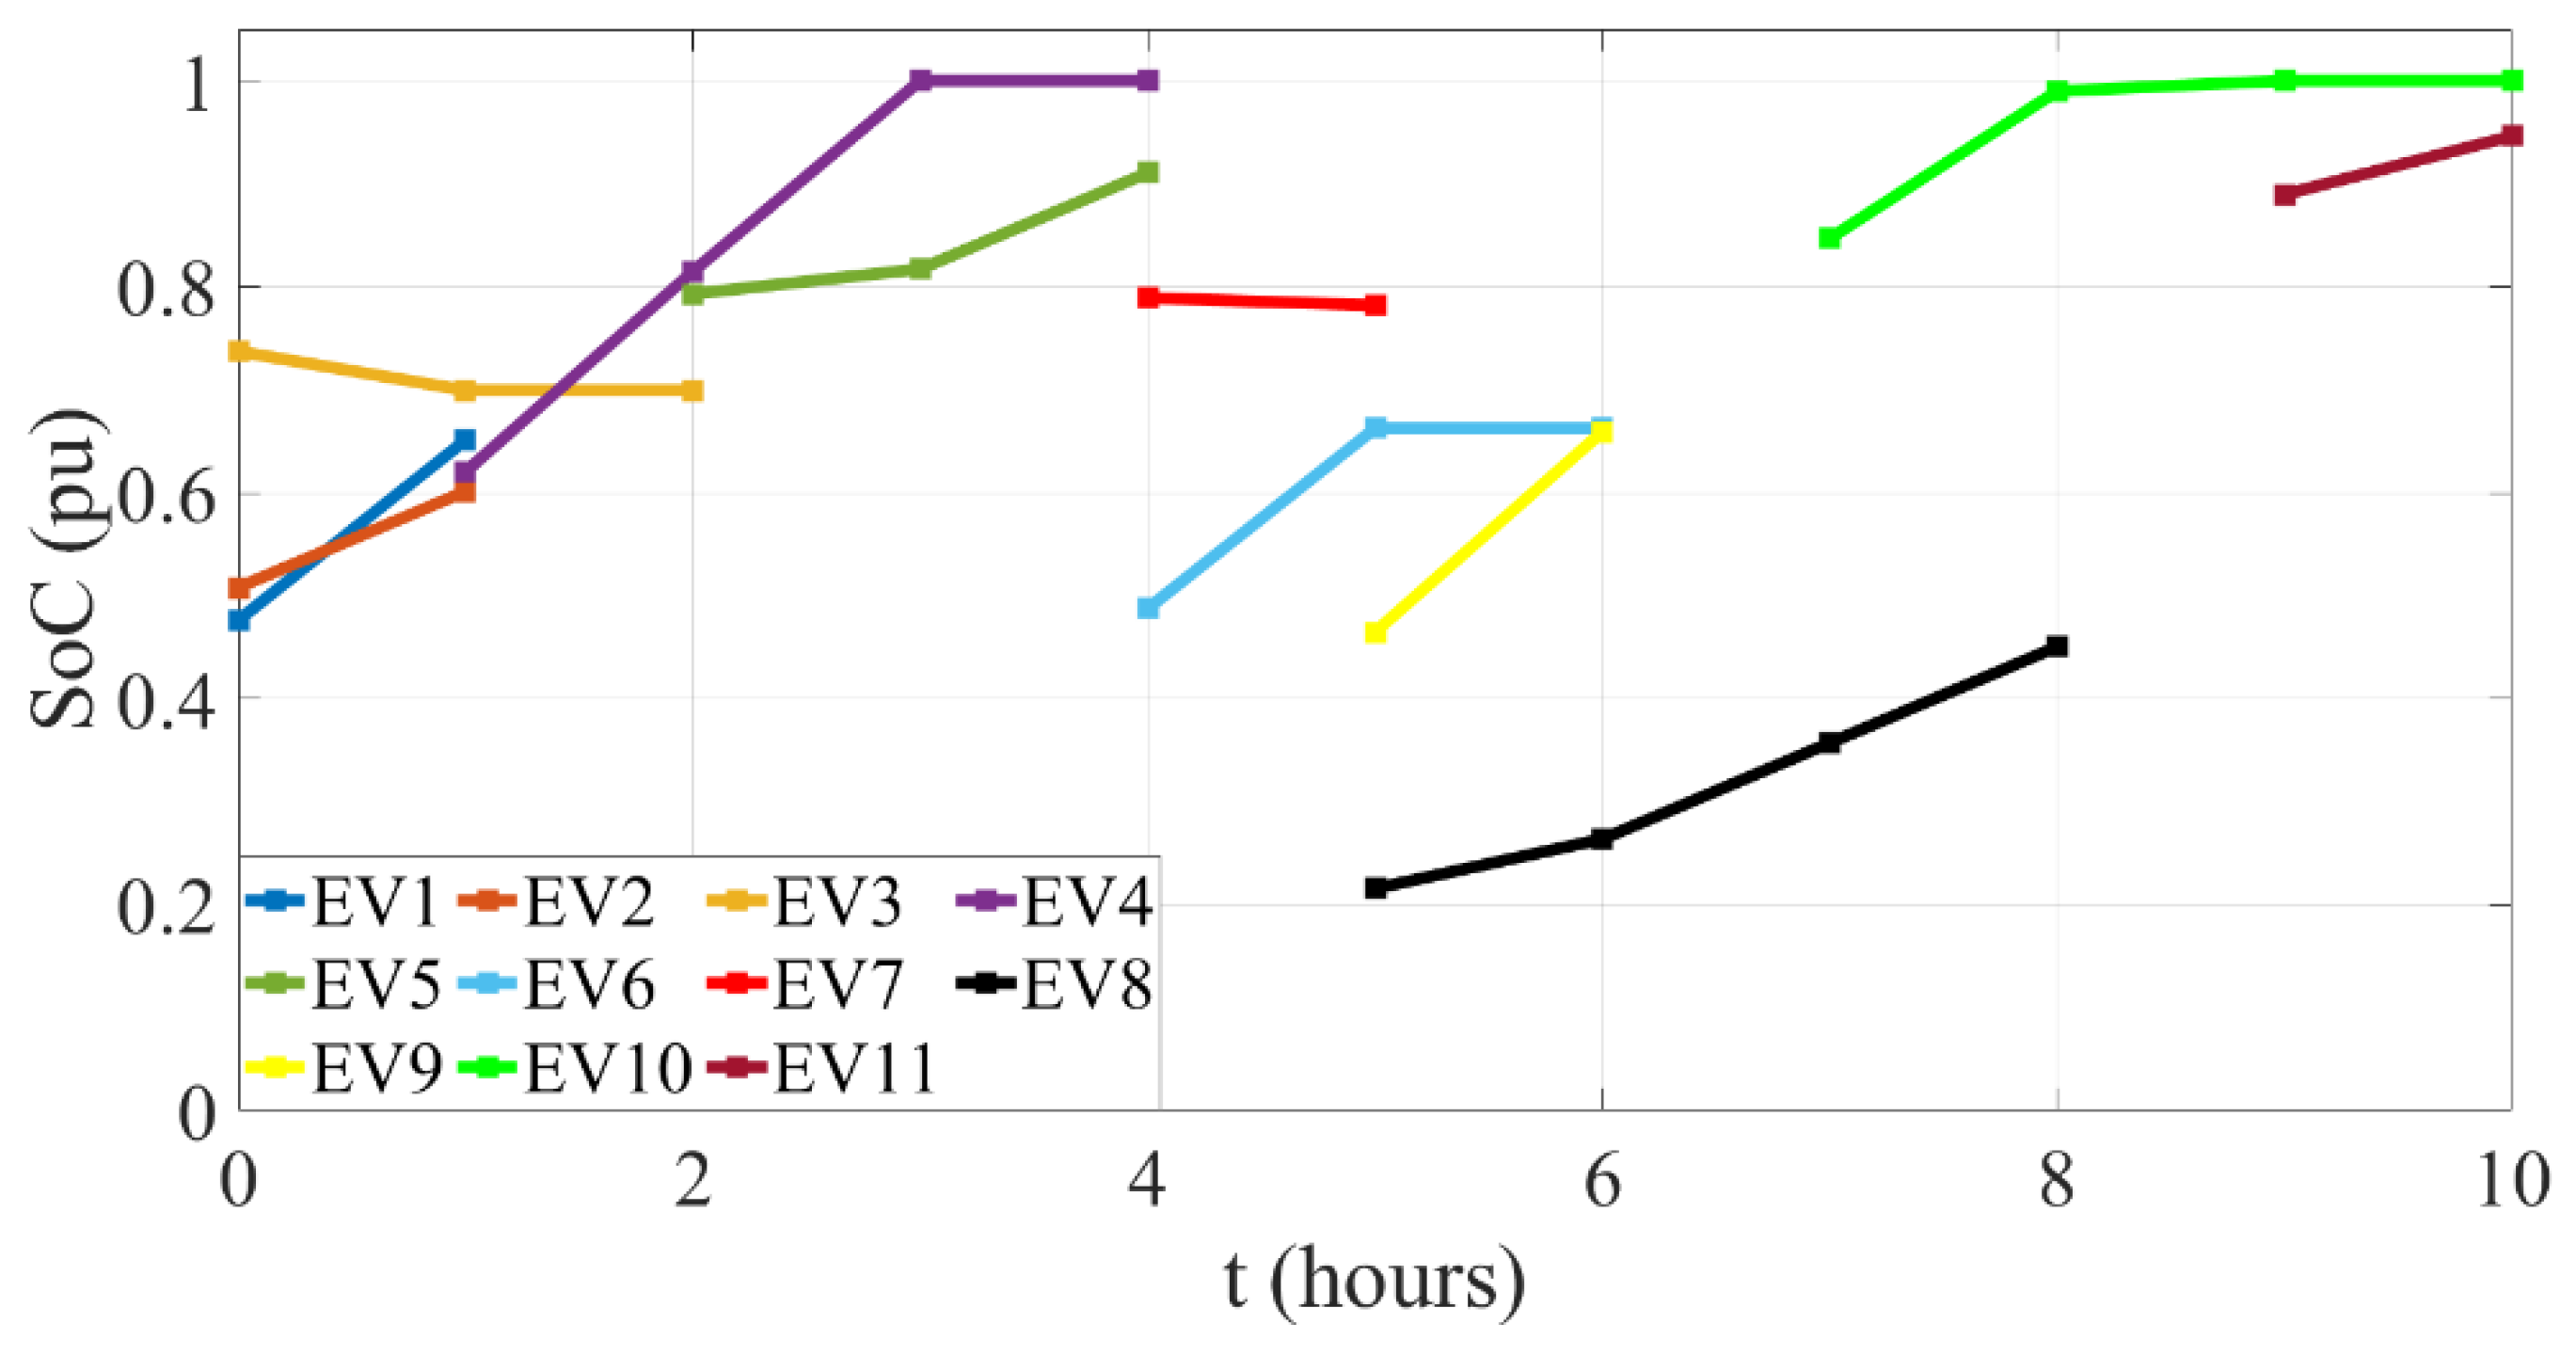
5.3. Scenario 3—Random Connection and Disconnection of EVs
In scenario 3, a more realistic operation is presented. EVs are randomly connected and disconnected to the charging terminals. Parameters and drivers’ preferences of the EVs connected to the charging station during simulation are randomly selected from
Table 1.
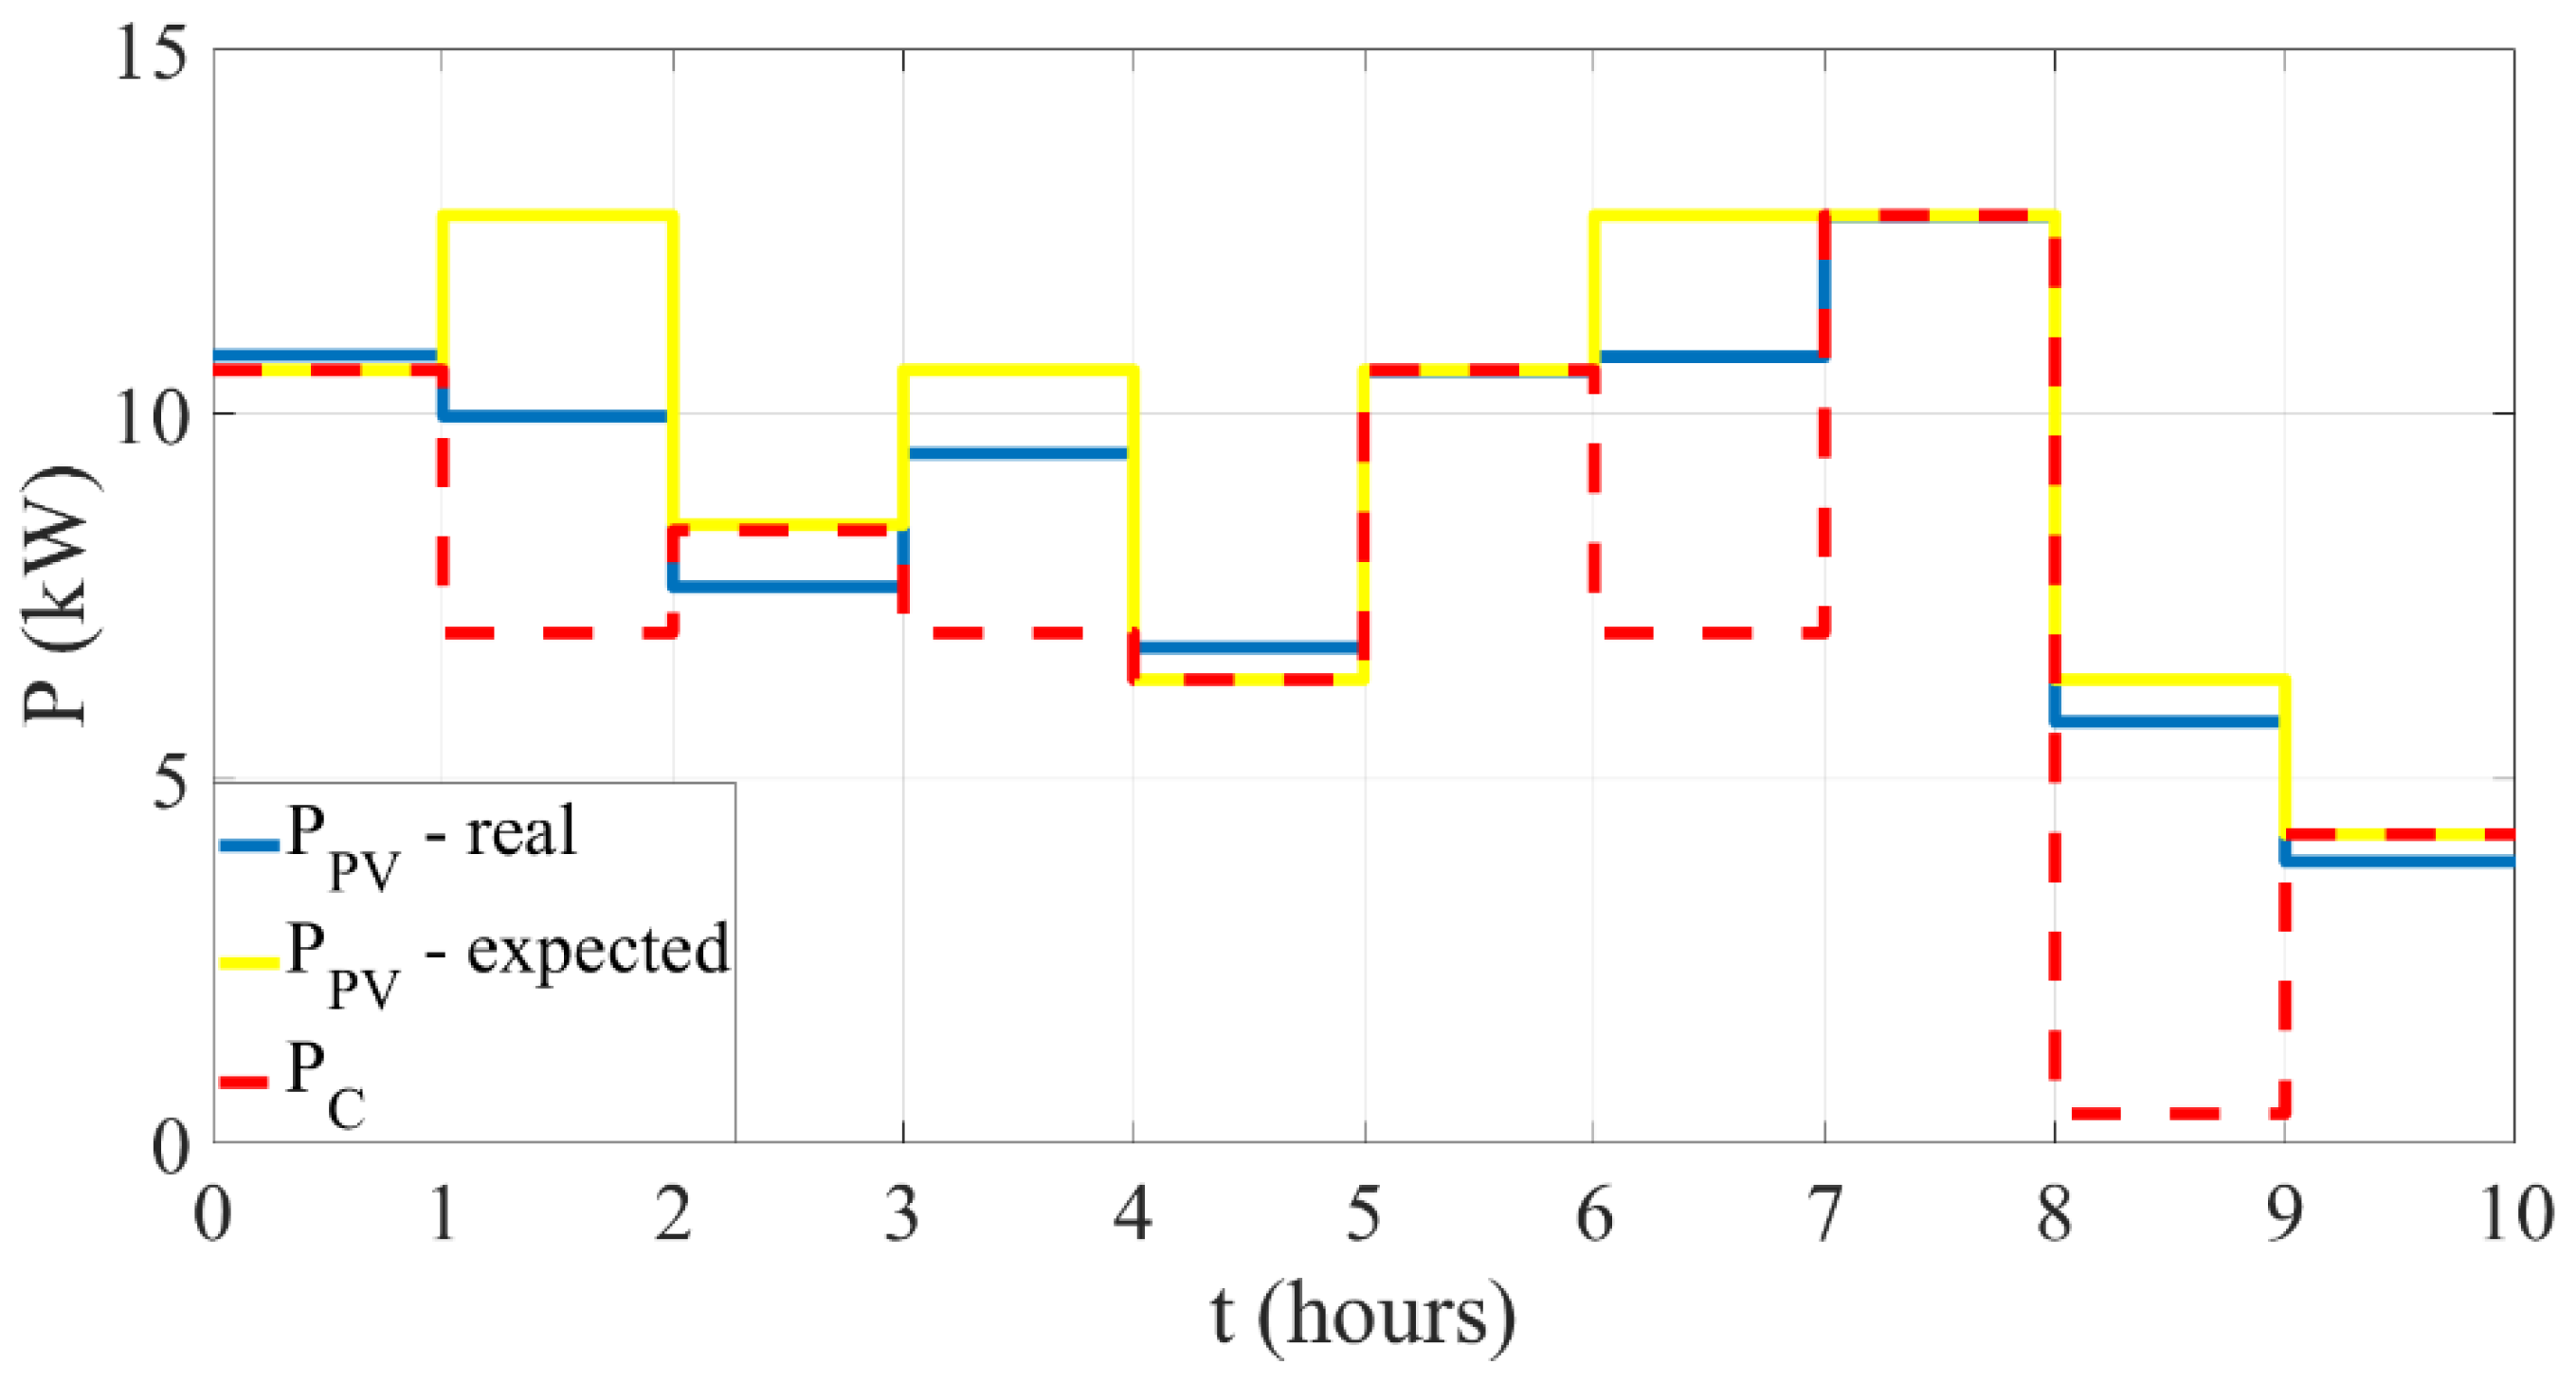
Figure 9 shows the SoC curves of the connected EVs. As can be seen in the figure, this situation is closer to the real operation of the charging station since there is no simultaneous occupancy of all its terminals. However, this can cause the problem of excess power issuing from the local renewable source, as shown in
Figure 10.
Figure 10 compares generated and consumed power at the charging station. As shown in
Figure 10, the consumed power is significantly lower than the produced power from the photovoltaic power plant in the 2nd hour of simulation time. This is the result of the situation at the charging terminal in which only two EVs are simultaneously connected (EV3 and EV4), and one of them is, in fact, discharging (EV3). A similar case is in the 4th hour. However, the problem is that one of the connected EVs is already charged, and there is not enough demand compared to PV generation even in full charging of the other connected vehicle (EV 5). In the 7th and 9th hours of the simulation, there is only one EV connected, and the one connected in the 9th hour is almost fully charged. Therefore, there is a significant excess of the produced power from the PV power plant. There is also a requirement for drawing power from the main grid in the 3rd hour since the expected PV output and thus consumed power was higher than a real value. This issue should be addressed from a technical and economic point of view in future research.
6. Discussion
To at least decrease our impact on the environment, the European Green Deal was established [
40] in the EU. The main aim of this deal is to decrease net greenhouse emissions with the climate, energy, and transport policies by 2030. These policies often lead to increasing the utilization of electric vehicles within the transportation sector and the support of higher utilization of renewable energy sources for power generation in the energy sector. Furthermore, recent events in Europe have emphasized the importance of this shift and have accelerated it. However, a hasty and haphazard installation of these two systems can pose numerous issues to the operation of power systems [
2,
3,
4,
5].
Therefore, the vehicle-to-grid concept was introduced as a tool for better integration of green technologies into transportation and power systems. There are many studies regarding this concept. However, most of them look at this as just a technical problem and forget that for this system to be successful, it should be efficient and beneficial for both system operators and electric vehicle (EV) drivers [
8], as mentioned above. Therefore, the authors of this paper, first of all, study the decision-making of EV drivers toward this concept and the attributes affecting their decision between control of charging and discharging their EVs [
27]. The results of this study were incorporated into the proposed control mechanism introduced in this manuscript. It fills the gap in the utilization of the assumed behavior and costs of the EV drivers and not real data in previous studies [
10].
The system model is based on commonly used models in the literature. There are, however, some specific assumptions applied to the model. To meet the technical limits of the charging point, only charging or discharging the same vehicle at the same time is enabled. As mentioned above, the mathematical representation of the cost function is based on our research presented in [
27]. We assume that this function is of common knowledge since the main attributes affecting the cost of EV drivers have been previously comprehensively studied in many works. The specific weights of attributes for each driver can, however, differ. This is represented in the model by preferences (
), which participants report. If any attribute does not affect the specific driver, it can be set by reporting
equal to zero. There is also the assumption that the EV drivers do not communicate with each other, which does not correspond with reality in all cases. In some cases, the drivers can communicate and create coalitions that could disrupt the proposed system. This possibility should be addressed in future research.
This paper then proposes a control mechanism for the modeled system. This mechanism tried to minimize the discomfort of all participants of the system consisting of the charging station with its renewable energy source and connected EVs with their drivers, and decrease the impact of the charging station on the power system. The introduced control mechanism minimizes the cost of all EV drivers and should therefore reflect a real attitude towards the V2G concept. In addition to the previous studies [
8,
25,
26], the defined mechanism also minimizes the cost function of the charging station operator aiming to decrease their monetary expenses and increase gains in a way that the output from the charging station’s photovoltaic power plant is used for charging EVs. So, the mechanism proposed this way meets exactly the definition of the V2G concept and its necessity to be beneficial for both system operators as well as EVs’ drivers.
Moreover, to prevent one of the drivers from trying to disrupt the social welfare concept in their favor by declaring false preferences, the incentives mechanism is proposed as well. The defined incentives mechanism is incentive compatible, meaning that the truthful report of preferences is the optimal strategy for each EV driver. For this mechanism to work, there is a strong assumption that the EV drivers behave as strategic agents. However, it is not always true, and people often tend to do irrational decisions from an analyst’s point of view. But many studies in behavioral economics assumed this is a result of not having full information [
34]. Therefore, we work with a hypothesis that by repeating action (charging at the station), EV drivers can learn their optimal strategy and so start to behave as strategic agents. However, it is also necessary to test this hypothesis in future work.
A similar mechanism was proposed in [
30]. However, the control policy in that study is defined for a longer period, so the participants cannot change (connect or disconnect from the charging station) or change their preferences during this period. To prevent this unrealistic scenario and create an algorithm more suitable for a real operation, our manuscript assumes an online control mechanism and so controls the charging and defines incentives at each time step.
The proposed mechanisms are tested in three simulation scenarios to demonstrate the presented properties of the system. The results from the first two simulation scenarios show that declaring true preferences is an optimal strategy for all participants. The incentive mechanism is even advantageous for the charging station operator. The first scenario also confirms that the mechanism satisfies the efficient exit condition, meaning that participants irrelevant to the mechanism do not receive any payment. The third scenario presents a more realistic operation and confirms the operation of the proposed mechanism in a more real-life situation at the charging stations.
The results from the simulation scenarios also show that the accuracy of the renewable energy source output prediction can affect the utilization of the renewable energy source for charging EVs. Therefore, one of the possible ways for future research is to improve PV power plant output predictions or find a balance between the accuracy of power prediction and the time steps of the control algorithm. Nevertheless, random behavior of EV drivers in regards to connecting to charging stations can also affect the utilization of the renewable energy source, and the overloading of power lines or unexpected peak demand can occur in the main grid. To prevent this effect on the main grid, the storage system could be designed for the charging station. So, the next focus of future research can be on the optimal storage sizing that can compensate for these unexpected events while meeting the technical and economical limits of the system.
7. Conclusions
The vehicle-to-grid concept was introduced as a tool for better integration of green technologies into transportation and power systems. But for this system to be successful, it should be efficient and beneficial for both system operators and electric vehicle drivers. Therefore, this paper proposes a control mechanism trying to minimize the discomfort of all participants of the system consisting of the charging station with its renewable energy source and connected EVs with their drivers.
The defined control mechanism minimizes the cost for all EV drivers. It is based on the results from the SP survey [
27] and the cost function of the charging station operator aiming to decrease their monetary expenses and thus increase gains in such a way that the output from the charging station’s photovoltaic power plant is used for charging EVs. To prevent one of the drivers from trying to disrupt the social welfare concept in their favor by declaring false preferences, the incentives mechanism is also proposed. The defined incentives mechanism is incentive compatible, meaning that the truthful report of preferences is the optimal strategy for each EV driver. The proposed mechanisms were tested in simulation scenarios that confirmed the expected behavior of the system.
The proposed mechanism, which maximizes the utilization of the photovoltaic power plant for EV charging and thereby reduces the impact of these systems on the main grid, is the main contribution. Furthermore, the proposed mechanisms can support EV drivers to participate in such systems and truthfully report their preferences since it minimizes their costs. This approach may also be advantageous to charging station operators because it takes into account their preferences, and so meets all of the V2G concept’s requirements.
To ensure the balance between the consumed and produced power at the charging station throughout the whole operation of the system, the storage system can be applied to the charging station in future work. Future research should also focus on issues of creating coalitions between the participants or on more complex prediction methods for photovoltaic power plants.


